
A New Index of Perceived Job Quality in 116 Countries: Associations with Working Hours and Other National Characteristics


Abstract
:1. Introduction
- (1)
- To develop a new index of perceived job quality at the national level using relevant items from the Gallup World Poll.
- (2)
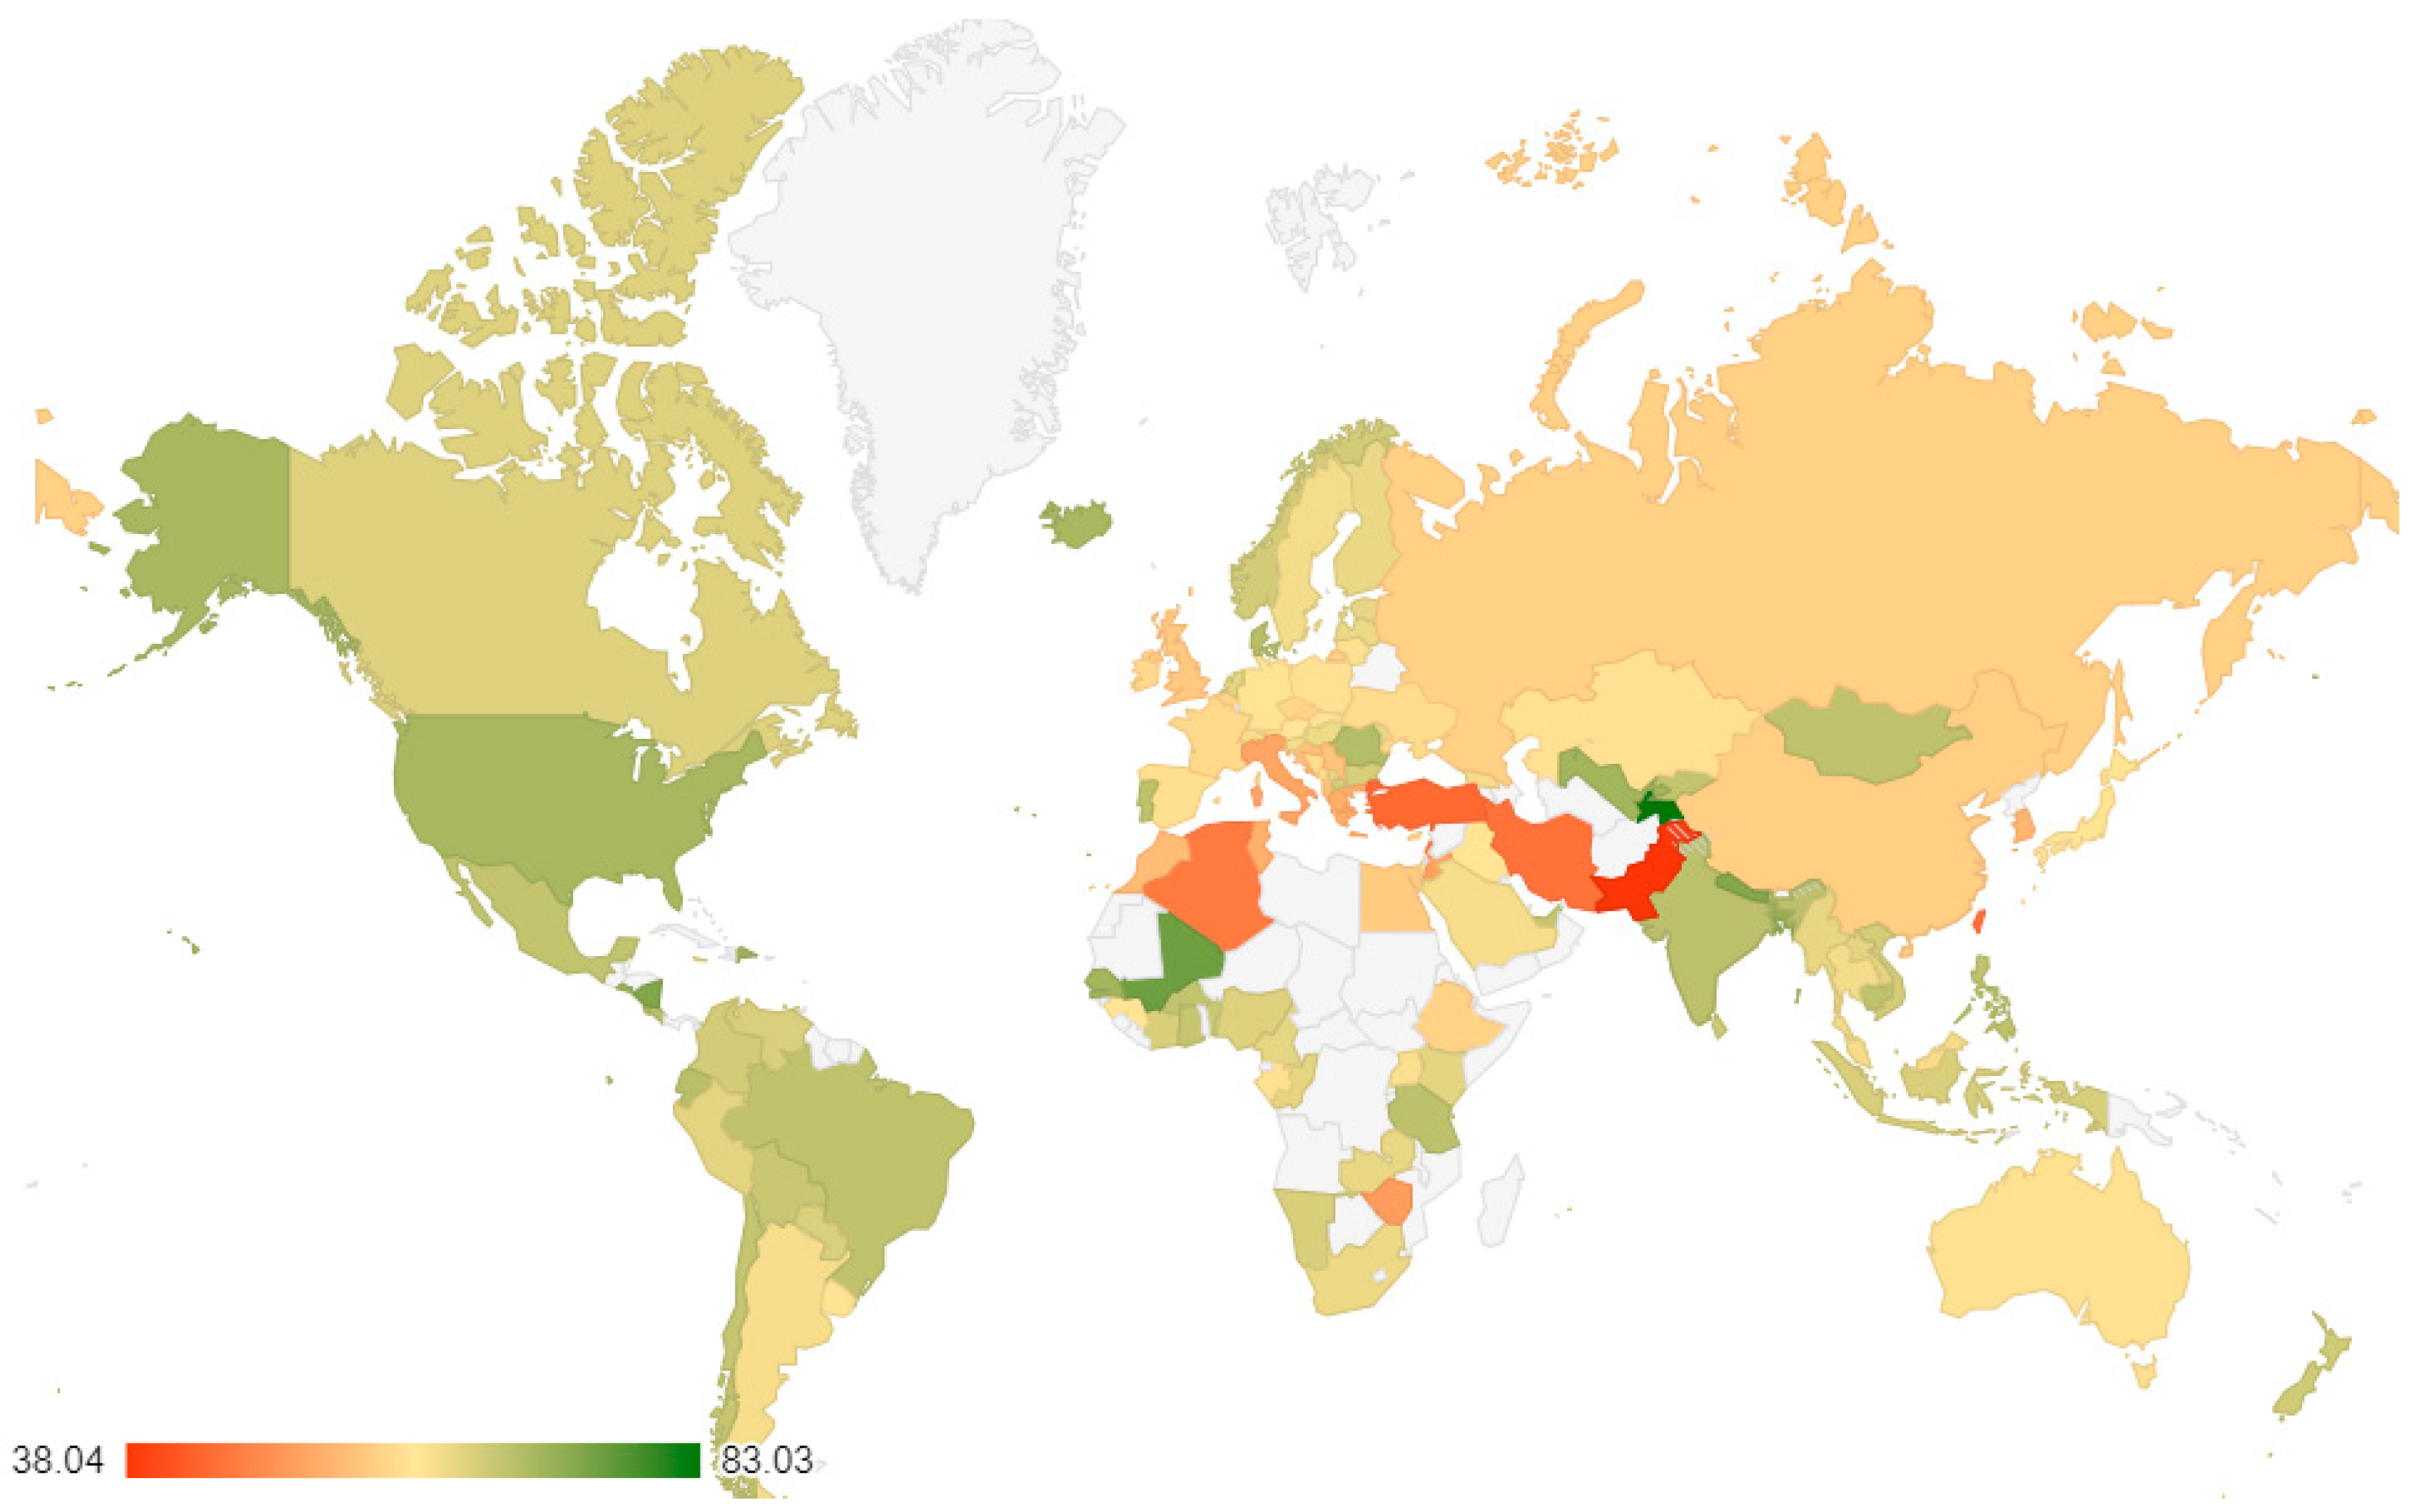
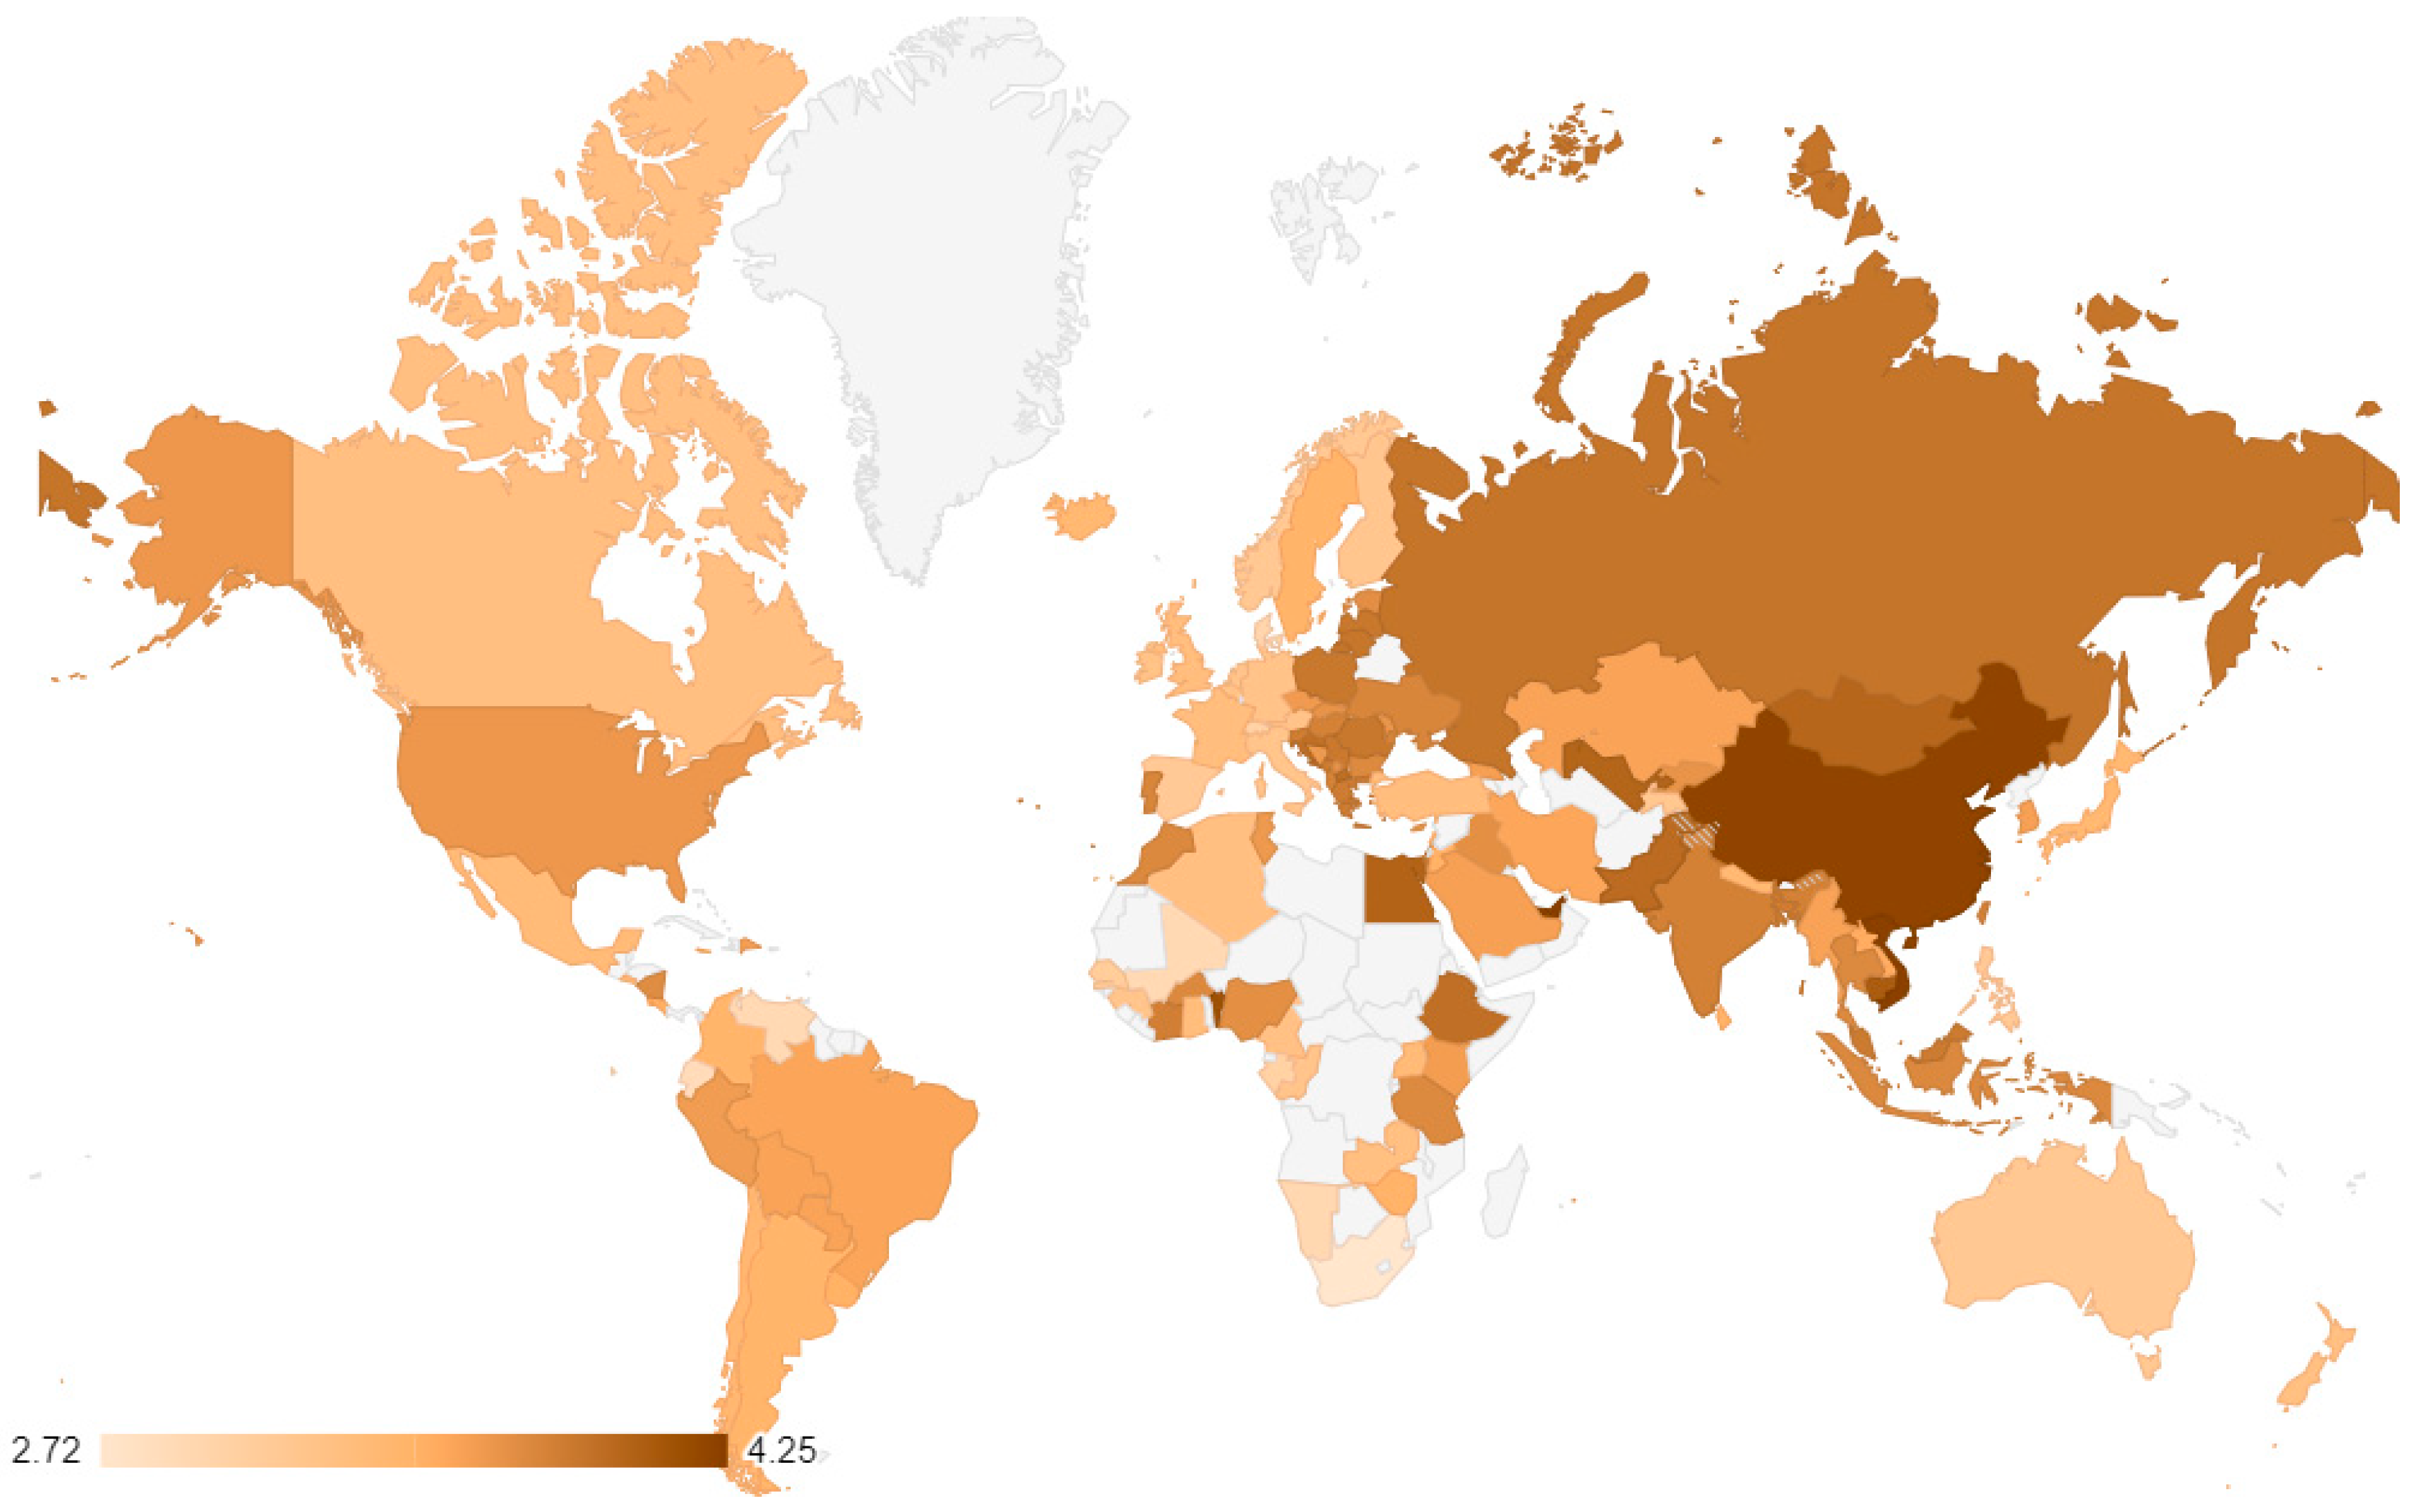
- To examine the global and regional status of perceived job quality.
- (3)
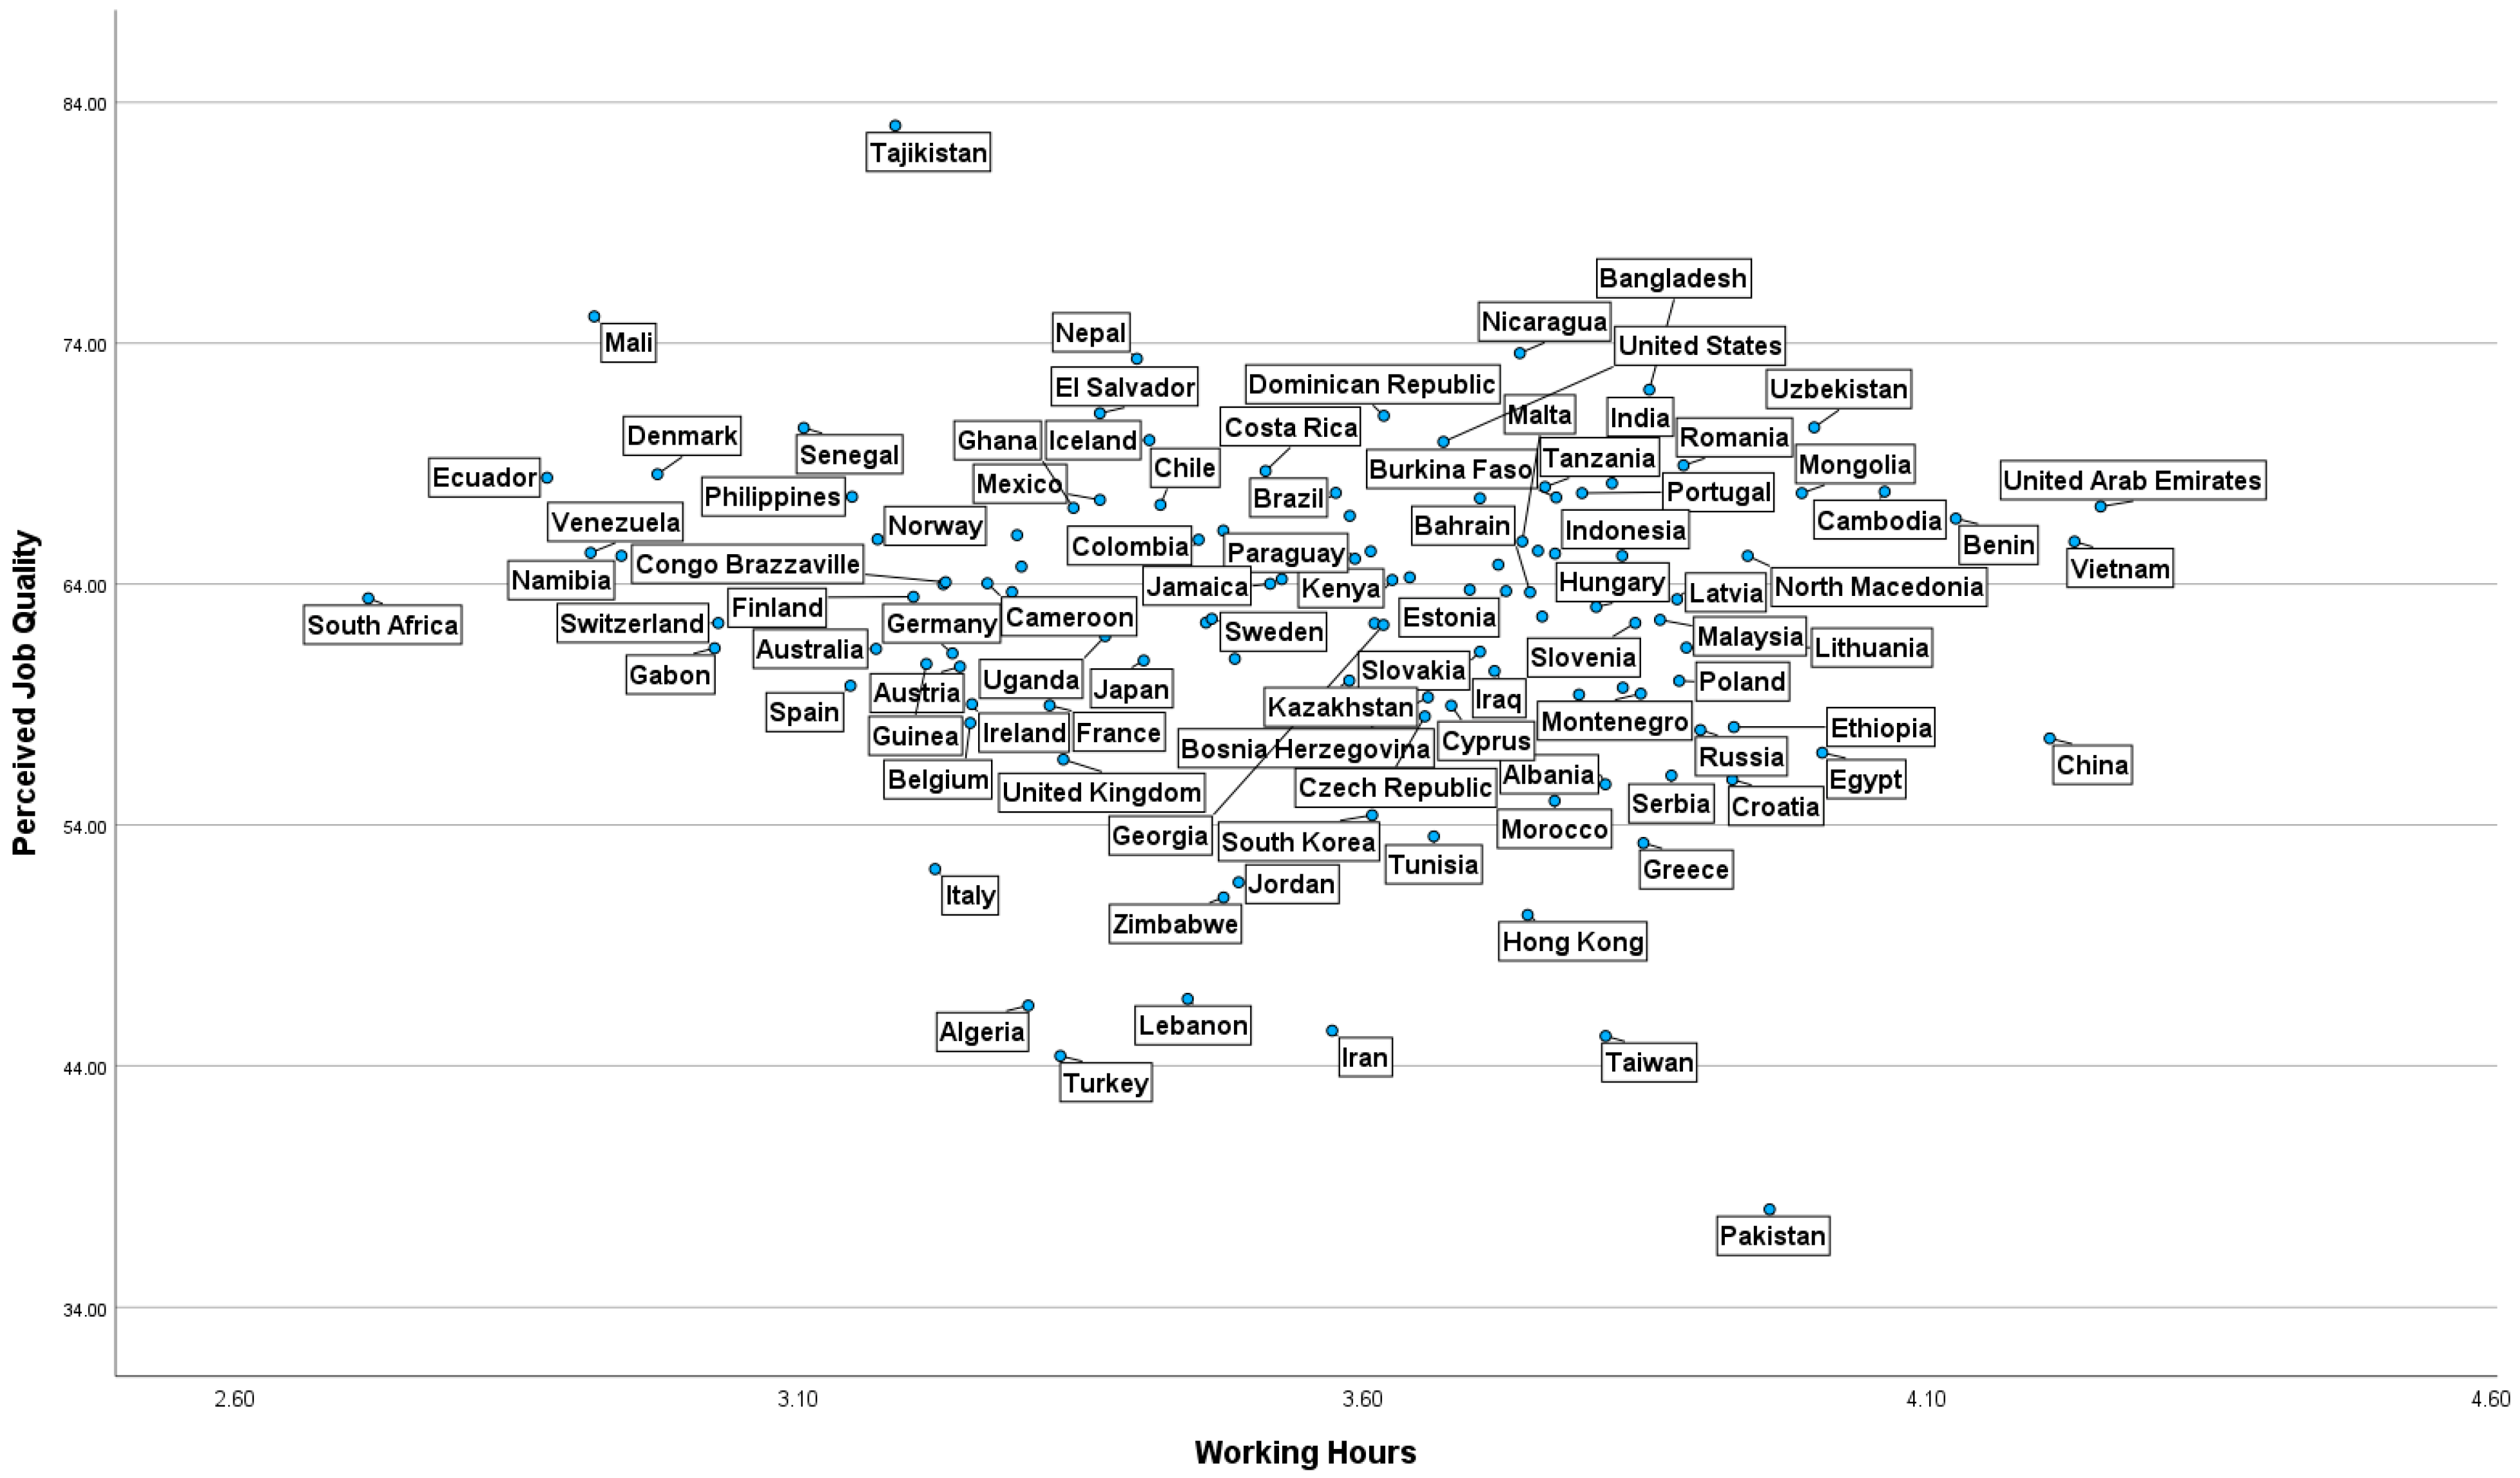
- To investigate the relationship between the new index of job quality and weekly working hours.
- (4)
- To examine the associations between perceived job quality and a wide range of social, economic, cultural, and well-being variables at the national level.
- (5)
- As a supplementary objective, to examine whether the construct of perceived job quality holds at the individual level as well, and to examine whether it is associated with a number of demographic variables.
2. Defining and Measuring Job Quality
3. Methods
3.1. Participants
3.2. Measures
3.2.1. Perceived Job Quality
3.2.2. Working Hours
3.2.3. Gallup World Poll-Based Measures of Well-Being
3.2.4. Other Gallup-Based Variables
3.2.5. Cultural Dimensions
3.2.6. Social and Economic Indicators
3.3. Statistical Software
4. Results
4.1. Constructing Perceived Job Quality Index
4.2. Correlations with Working Hours at National Level
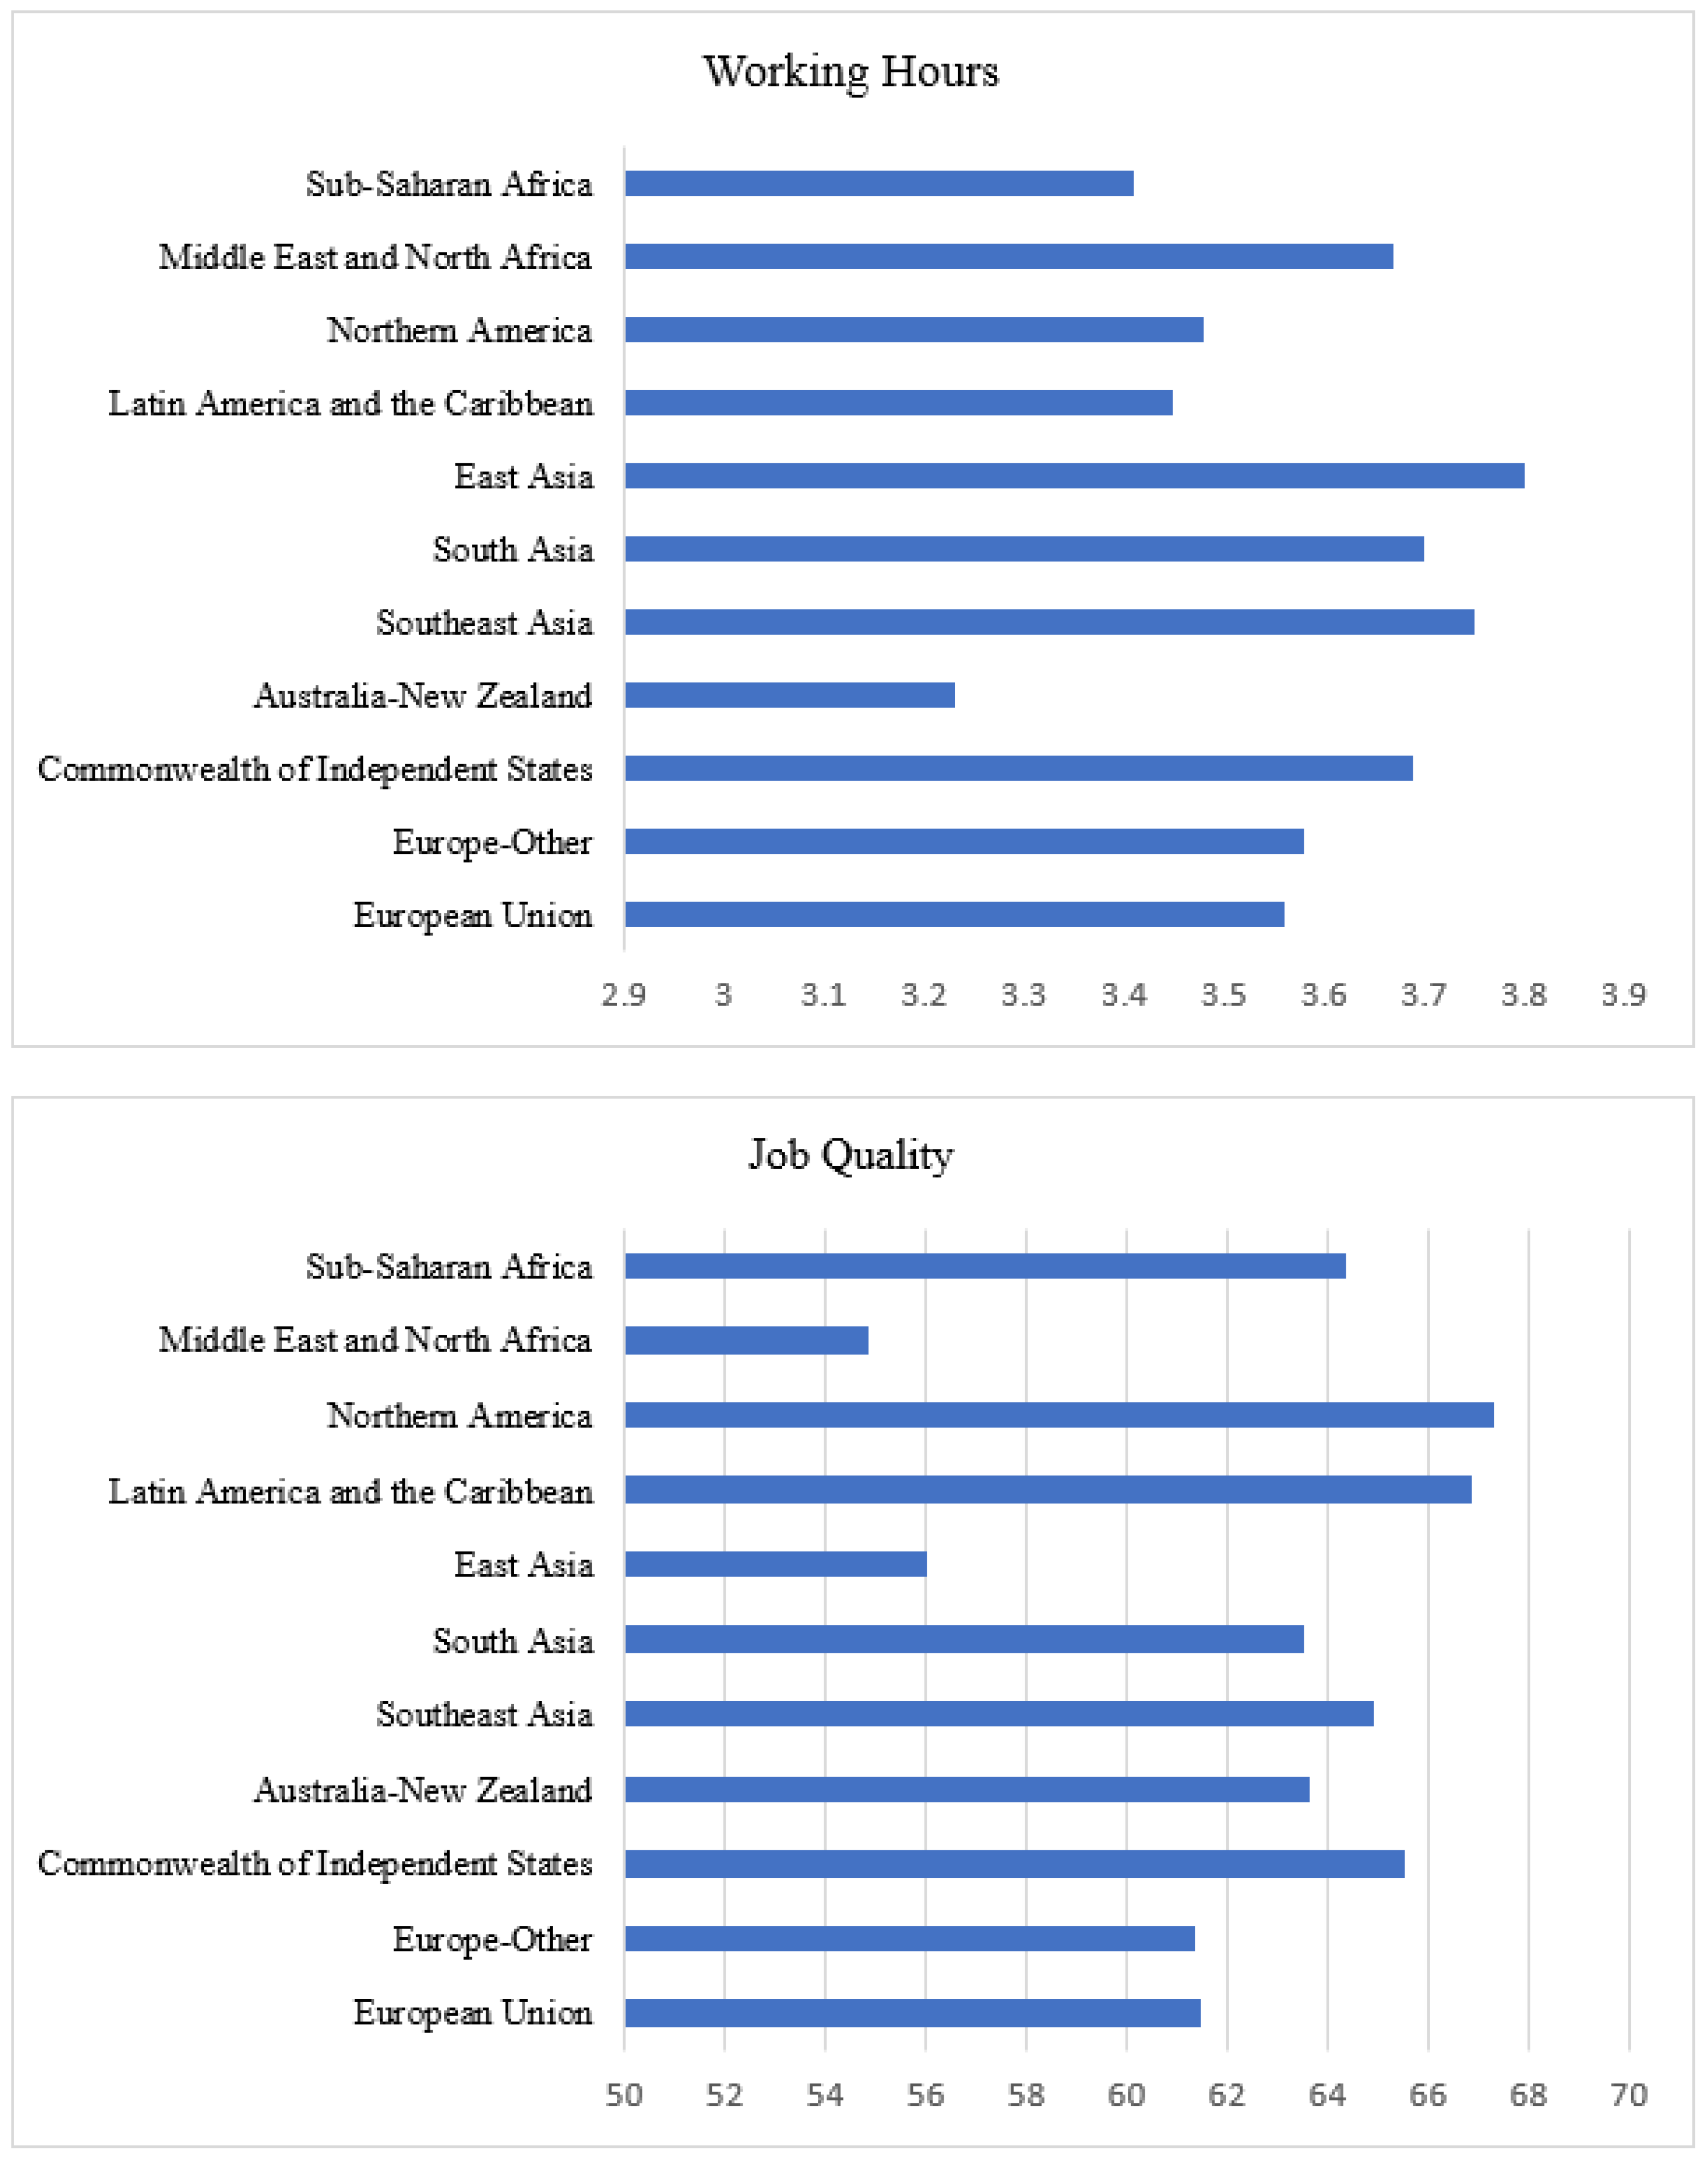
4.3. Regional Averages of Job Quality and Working Hours
4.4. Correlations with Country-Level Variables
4.5. Supplementary Individual-Level Analysis
5. Discussion
5.1. Perceived Job Quality
5.2. Working Hours
5.3. Supplementary Analysis at the Individual Level
6. Concluding Remarks and Direction for Future Research
Supplementary Materials
Funding
Institutional Review Board Statement
Informed Consent Statement
Data Availability Statement
Conflicts of Interest
| 1 | Mplus was used for Bayesian multilevel modeling. Two Markov chain Monte Carlo chains were used with the GIBBS (PX1) algorithm and 10,000 draws (the first half was used as burnin by default) and the default priors of Mplus (Muthén et al. 2017). Posterior distributions were recorded at every 10th iteration. Age and working hours were group-mean centered. Regression effects were set as fixed effects. The potential scale reduction factor of the model was 1.000, indicating convergence. Additionally, the Bayesian plots showed optimal chain mixing and autocorrelation. |
References
- Ariza-Montes, Antonio, Aleksandar Radic, Juan M. Arjona-Fuentes, Heesup Han, and Rob Law. 2021. Job quality and work engagement in the cruise industry. Asia Pacific Journal of Tourism Research 26: 469–87. [Google Scholar] [CrossRef]
- Blustein, David L. 2008. The role of work in psychological health and well-being: A conceptual, historical, and public policy perspective. American Psychologist 63: 228–40. [Google Scholar] [CrossRef]
- Brown, Timothy A. 2015. Confirmatory Factor Analysis for Applied Research. New York: Guilford Publications. [Google Scholar]
- Bryson, Alex, and George MacKerron. 2016. Are you happy while you work? The Economic Journal 127: 106–25. [Google Scholar] [CrossRef]
- Cazes, Sandrine, Alexander Hijzen, and Anne Saint-Martin. 2015. Measuring and Assessing Job Quality: The OECD Job Quality Framework. Paris: OECD. [Google Scholar] [CrossRef]
- Charlesworth, Sara, Jennifer Welsh, Lyndall Strazdins, Marian Baird, and Iain Campbell. 2014. Measuring poor job quality amongst employees: The VicWAL job quality index. Labour and Industry 24: 103–23. [Google Scholar] [CrossRef]
- Clark, Andrew E. 2005. Your money or your life: Changing Job quality in OECD countries. British Journal of Industrial Relations 43: 377–400. [Google Scholar] [CrossRef]
- De Neve, Jan Emmanuel, and George Ward Ward. 2017. Happiness at work. In World Happiness Report 2017. Edited by John Helliwell, Richard Layard and Jeffrey Sachs. New York: Sustainable Development Solutions Network, pp. 144–77. [Google Scholar]
- del Pozo-Antúnez, Jose Joaquin, Horacio Molina-Sánchez, Antonio Ariza-Montes, and Francisco Fernández-Navarro. 2021. Promoting work engagement in the accounting profession: A machine learning approach. Social Indicators Research 157: 653–70. [Google Scholar] [CrossRef]
- Esser, Ingrid, and Karen M. Olsen. 2011. Perceived job quality: Autonomy and job security within a multi-level framework. European Sociological Review 28: 443–54. [Google Scholar] [CrossRef]
- European Commission. 2001. Directorate-General for Employment, Social Affairs and Inclusion. In Employment in Europe 2001: Recent Trends and Prospects. Belgium: European Communities. [Google Scholar]
- EVS/WVS. 2020. European Values Study and World Values Survey: Joint EVS/WVS 2017–2021 Dataset (Joint EVS/WVS). Dataset Version 1.0.0. Madrid and Vienna: JD Systems Institute & WVSA Secretariat. [Google Scholar] [CrossRef]
- Ganster, Daniel C., Christopher C. Rosen, and Gwenith G. Fisher. 2016. Long working hours and well-being: What we know, what we do not know, and what we need to know. Journal of Business and Psychology 33: 25–39. [Google Scholar] [CrossRef]
- Goods, Caled, Alex Veen, and Tom Barratt. 2019. “Is your gig any good?” Analysing job quality in the Australian platform-based food-delivery sector. Journal of Industrial Relations 61: 502–27. [Google Scholar] [CrossRef]
- Green, Francis. 2006. Demanding Work: The Paradox of Job Quality in the Affluent Economy. Princeton: Princeton University Press. [Google Scholar]
- Helliwell, John F., Richard Layard, Jeffrey Sachs, and Jan-Emmanuel De Neve, eds. 2021. World Happiness Report 2021. New York: Sustainable Development Solutions Network. [Google Scholar]
- Hofstede, Geert, Gert Jan Hofstede, and Michael Minkov. 2005. Cultures and Organizations: Software of the Mind. New York: Mcgraw-Hill. [Google Scholar]
- Holman, David. 2012. Job types and job quality in Europe. Human Relations 66: 475–502. [Google Scholar] [CrossRef]
- Jones, Wendy, Roger Haslam, and Cheryl Haslam. 2014. Measuring job quality: A study with bus drivers. Applied Ergonomics 45: 1641–48. [Google Scholar] [CrossRef]
- Joshanloo, Mohsen. 2018. Optimal human functioning around the world: A new index of eudaimonic well-being in 166 nations. British Journal of Psychology 109: 637–55. [Google Scholar] [CrossRef]
- Joshanloo, Mohsen, Veljko Jovanović, and Tim Taylor. 2019. A multidimensional understanding of prosperity and well-being at country level: Data-driven explorations. PLoS ONE 14: e0223221. [Google Scholar] [CrossRef] [PubMed]
- Kamalanabhan, T. J., L. Prakash Sai, and Duggirala Mayuri. 2009. Employee Engagement and Job Satisfaction in the Information Technology Industry. Psychological Reports 105: 759–70. [Google Scholar] [CrossRef] [PubMed]
- Kline, Rex B. 2023. Principles and Practice of Structural Equation Modeling. New York: Guilford Publications. [Google Scholar]
- Leschke, Janine, and Andrew Watt. 2013. Challenges in Constructing a Multi-dimensional European Job Quality Index. Social Indicators Research 118: 1–31. [Google Scholar] [CrossRef]
- Miao, Yang, Lingui Li, and Ying Bian. 2017. Gender differences in job quality and job satisfaction among doctors in rural western China. BMC Health Services Research 17: 848. [Google Scholar] [CrossRef] [PubMed]
- Mira, María Cascales. 2021. New model for measuring job quality: Developing an European intrinsic job quality index (EIJQI). Social Indicators Research 155: 625–45. [Google Scholar] [CrossRef]
- Monnot, Matthew J. 2015. Marginal utility and economic development: Intrinsic versus extrinsic aspirations and subjective well-being among Chinese employees. Social Indicators Research 132: 155–85. [Google Scholar] [CrossRef]
- Muthén, Bengt O., Linda K. Muthén, and Tihomir Asparouhov. 2017. Regression and Mediation Analysis Using Mplus. Los Angeles: Muthén & Muthén. [Google Scholar]
- Schaufeli, Wilmar. 2021. Engaging leadership: How to promote work engagement? Frontiers in Psychology 12: 754556. [Google Scholar] [CrossRef]
- Silver, Laura, Patrick van Kessel, Christine Huang, Laura Clancy, and Sneha Gubbala. 2021. What Makes Life Meaningful? Views from 17 Advanced Economies. Washington, DC: Pew Research Center. Available online: https://www.pewresearch.org/global/2021/11/18/what-makes-life-meaningful-views-from-17-advanced-economies/ (accessed on 1 February 2022).
- Stefana, Elena, Filippo Marciano, Diana Rossi, Paola Cocca, and Giuseppe Tomasoni. 2021. Composite indicators to measure quality of working life in Europe: A systematic review. Social Indicators Research 157: 1047–78. [Google Scholar] [CrossRef]
- Taipale, Sakari, Kirsikka Selander, Timo Anttila, and Jouko Nätti. 2011. Work engagement in eight European countries. International Journal of Sociology and Social Policy 31: 486–504. [Google Scholar] [CrossRef]
- van der Meer, Peter H. 2012. Gender, unemployment and subjective well-being: Why being unemployed is worse for men than for women. Social Indicators Research 115: 23–44. [Google Scholar] [CrossRef]
- Wang, Chaohui , Jiahui Xu, Tingting Christina Zhang, and Qinglian Melo Li. 2020. Effects of professional identity on turnover intention in China’s hotel employees: The mediating role of employee engagement and job satisfaction. Journal of Hospitality and Tourism Management 45: 10–22. [Google Scholar] [CrossRef]


| M | SD | 1 | 2 | 3 | |
|---|---|---|---|---|---|
| 1- Enjoy work | 84.779 | 8.333 | - | ||
| 2- Improve life | 77.726 | 6.708 | 0.431 *** | - | |
| 3- Have choice | 66.635 | 11.309 | 0.285 ** | 0.502 *** | - |
| 4- Engaged | 20.071 | 7.936 | 0.370 *** | 0.344 *** | 0.261 ** |
| Spearmanr | N | |||
|---|---|---|---|---|
| Working Hours | Perceived Job Quality | |||
| Well-being | ||||
| Eudaimonic well-being | −0.234 * | 0.493 *** | 116 | |
| Negative affect | −0.046 | 0.074 | 115 | |
| Positive affect | −0.232 * | 0.414 *** | 116 | |
| Life satisfaction | −0.088 | 0.002 | 116 | |
| Future life satisfaction | −0.068 | 0.536 *** | 116 | |
| Gallup items | ||||
| Standard of life getting better | 0.155 | 0.484 *** | 116 | |
| Local job market is good | 0.033 | 0.410 *** | 116 | |
| Cultural dimensions | ||||
| Individualism | −0.331 ** | −0.097 | 63 | |
| Power distance | 0.403 ** | 0.052 | 63 | |
| Masculinity | −0.207 | −0.152 | 63 | |
| Uncertainty Avoidance | 0.145 | −0.106 | 63 | |
| Important in life: Leisure time | −0.353 ** | 0.182 | 73 | |
| Important in life: Work | 0.126 | −0.012 | 73 | |
| Important child qualities: hard work | 0.469 *** | −0.159 | 73 | |
| Socio-economic-work variables | ||||
| Income inequality | −0.132 | 0.241 * | 89 | |
| Gender inequality | 0.051 | 0.251 ** | 111 | |
| GDP growth | 0.128 | 0.088 | 113 | |
| Transparency | −0.149 | −0.160 | 116 | |
| Urbanization | −0.258 ** | −0.195 * | 114 | |
| Female labor force participation | −0.157 | 0.052 | 114 | |
| Unemployment rate | −0.189 * | −0.199 * | 114 | |
| Ease of doing business | 0.079 | −0.209 * | 116 | |
| Prosperity | ||||
| Economic quality | 0.035 | −0.082 | 115 | |
| Education | −0.071 | −0.283 ** | 115 | |
| Enterprise conditions | −0.076 | −0.181 | 115 | |
| Governance | −0.166 | −0.071 | 115 | |
| Health | −0.057 | −0.206 * | 115 | |
| Infrastructure and market access | −0.037 | −0.238 * | 115 | |
| Investment environment | −0.090 | −0.180 | 115 | |
| Living conditions | −0.088 | −0.301 ** | 115 | |
| Natural environment | −0.271 ** | 0.043 | 115 | |
| Personal freedom | −0.316 *** | 0.057 | 115 | |
| Safety and security | −0.063 | −0.144 | 115 | |
| Social capital | −0.191 * | 0.227 * | 115 | |
| Predictor | Unstandardized | Posterior SD | 95% Credible Interval | Standardized | ||
|---|---|---|---|---|---|---|
| Low | Up | Sig | ||||
| Working hours | 0.017 | 0.005 | 0.008 | 0.026 | * | 0.023 |
| Female | −0.033 | 0.007 | −0.047 | −0.020 | * | −0.018 |
| Age | 0.002 | 0.000 | 0.002 | 0.003 | * | 0.028 |
| Secondary education | 0.089 | 0.011 | 0.067 | 0.111 | * | 0.048 |
| Tertiary education | 0.214 | 0.012 | 0.191 | 0.238 | * | 0.111 |
| A rural area or on a farm | −0.020 | 0.011 | −0.040 | 0.001 | −0.008 | |
| A small town or village | −0.025 | 0.008 | −0.041 | −0.009 | * | −0.013 |
| A suburb of a large city | −0.015 | 0.011 | −0.037 | 0.007 | −0.005 | |
| Employed full-time for self | −0.138 | 0.009 | −0.155 | −0.120 | * | −0.061 |
| Employed part-time, do not want full time | −0.077 | 0.015 | −0.106 | −0.048 | * | −0.025 |
| Employed part-time, want full time | −0.135 | 0.015 | −0.165 | −0.106 | * | −0.051 |
Disclaimer/Publisher’s Note: The statements, opinions and data contained in all publications are solely those of the individual author(s) and contributor(s) and not of MDPI and/or the editor(s). MDPI and/or the editor(s) disclaim responsibility for any injury to people or property resulting from any ideas, methods, instructions or products referred to in the content. |
© 2023 by the author. Licensee MDPI, Basel, Switzerland. This article is an open access article distributed under the terms and conditions of the Creative Commons Attribution (CC BY) license (https://creativecommons.org/licenses/by/4.0/).
Share and Cite
Joshanloo, M. A New Index of Perceived Job Quality in 116 Countries: Associations with Working Hours and Other National Characteristics. Soc. Sci. 2023, 12, 492. https://doi.org/10.3390/socsci12090492
Joshanloo M. A New Index of Perceived Job Quality in 116 Countries: Associations with Working Hours and Other National Characteristics. Social Sciences. 2023; 12(9):492. https://doi.org/10.3390/socsci12090492
Chicago/Turabian StyleJoshanloo, Mohsen. 2023. "A New Index of Perceived Job Quality in 116 Countries: Associations with Working Hours and Other National Characteristics" Social Sciences 12, no. 9: 492. https://doi.org/10.3390/socsci12090492
APA StyleJoshanloo, M. (2023). A New Index of Perceived Job Quality in 116 Countries: Associations with Working Hours and Other National Characteristics. Social Sciences, 12(9), 492. https://doi.org/10.3390/socsci12090492