Article

Assessing the Effects of District-Level Segregation on Meritocratic Beliefs in Germany

1
Institute of Sociology, Technical University Berlin, 10587 Berlin, Germany
2
SOEP, DIW Berlin, 10108 Berlin, Germany
*
Author to whom correspondence should be addressed.
Funded by the Deutsche Forschungsgemeinschaft (DFG, German Research Foundation)—Project-ID 290045248—SFB 1265.
Soc. Sci. 2023, 12(7), 376; https://doi.org/10.3390/socsci12070376
Submission received: 24 March 2023 / Revised: 14 June 2023 / Accepted: 21 June 2023 / Published: 27 June 2023

Abstract

:
In recent years, researchers have grappled with the phenomenon that public demand for redistribution has not systematically increased in response to rising inequality. Meritocratic beliefs have been suggested as an explanation for this observation, because they can help legitimize inequalities. Past research has identified local-level inequality, segregation, or diversity as important factors for how these beliefs might be formed and maintained. Different theoretical approaches have been advanced and tested to determine the direction and extent of these effects, producing mixed results. We put these theories to the test by focusing on a country in which changes in the level of inequality have indeed been met with equal changes in justice perceptions: Germany. Furthermore, we broaden the scope by focusing on local segregation between different socioeconomic status groups, rather than income inequality. To do so, we utilize geocoded individual-level data from the German Socio-Economic Panel (SOEP), microm data, and relevant geospatial indicators from the INKAR database. We find some indication that residential segregation of status groups and isolation of high status groups is associated with less support of meritocratic beliefs, contradicting previous work. Additionally, we find evidence of urban–rural differences in the effects of segregation.

1. Introduction

The belief that hard work ought to lead to success is a central tenant of meritocracy, which is assumed to function as a way to lend legitimacy to existing inequalities (Heuer et al. 2020; Mijs 2019; Morris et al. 2022; Sandberger 1983; Savage and Silva 2013). Studies show that meritocratic beliefs tend to be more pronounced in countries with higher levels of income inequality (Mijs 2019). They may consequently provide an explanation for why citizens of countries with high levels of inequality fail to demand change, especially in light of the negative consequences associated with rising inequality (Wilkinson and Pickett 2011). Scholarly attention has been devoted to the assessment of how meritocratic beliefs might be developed and maintained (Bernardo 2021; Bottero 2020; García-Sánchez et al. 2020; Lamont and Pierson 2019; McCall et al. 2017; Newman et al. 2015; Solt et al. 2016). One key factor appears to be information about inequality, through the news media or personal experiences with inequality—either directly or by proxy through social networks and relationships (García-Castro et al. 2020; McCall et al. 2017; Mijs et al. 2022). Similarly, the local environment and the inequality individuals are able to observe is another important factor. Competing theories have been advanced to explain how local inequality influences meritocratic beliefs (Mijs 2018; Newman et al. 2015; Solt et al. 2016). While they all differ regarding the underlying mechanisms and assumed direction of the effect, they all agree on one point: they all stipulate that everyday experience of inequality, segregation, isolation, or polarization in an individual’s surroundings influences the extent to which they feel that meritocracy is actualized.
This has led researchers to assess whether the local space in which people spend their everyday lives shapes their beliefs about meritocracy. Evidence, however, is mixed, and most studies concerned with the connection between local inequality and meritocratic beliefs have been conducted in the United States (Newman et al. 2015; Solt et al. 2016). As there is some indication that the United States are somewhat exceptional when compared to other countries—with its citizens holding more pronounced meritocratic beliefs and being more tolerant towards inequality—the relationship might be specific to the US (Larsen 2016; Mijs 2019). While some studies have explored the impact of diverse social networks on inequality beliefs in other countries (Bernardo 2021; García-Castro et al. 2020), Morris et al. (2022) provide the only analysis of this relationship outside the United States. They do so by analyzing local authority districts in the United Kingdom. Furthermore, while research engaging more broadly with questions of redistribution and attitudes has considered the effects of segregation, diversity, or polarization, evidence regarding meritocratic beliefs specifically is lacking (Enos 2017; Franko and Livingston 2020; Minkoff and Lyons 2019).
We contribute to this discussion in two ways. First, we echo Morris et al. (2022) by probing the assumed connection between the local environment and meritocratic beliefs in another context by focusing on Germany. We believe that Germany provides a valuable addition to past work. After increases in income inequality between the 1980s and the early 2000s, income inequality in Germany remained rather stable, while polarization between the rich and the poor increased, especially in urban areas (Groh-Samberg et al. 2020; Tóth et al. 2021). Moreover, notable wealth inequalities exist as well (Grabka and Westermeier 2015). However, the reported increase in meritocratic beliefs following increases in national-level inequality does not necessarily appear to apply here (Mijs 2019; Sachweh and Sthamer 2019). In fact, macro-level increases in national-level inequality appear to have been matched by an equal change in injustice perceptions in Germany. This change is, at least in part, explained by changes in procedural justice perceptions (Sachweh and Sthamer 2019). Combined with strong support for a work-centered version of meritocracy (Heuer et al. 2020), Germany presents an interesting case for probing the relationship of local-level inequality and meritocratic beliefs. Second, we opt to focus on the district-level segregation of status groups, rather than income inequality. As past research has commonly employed measures of overall income inequality as a proxy for the assumed mechanism (that is, a change in exposure to inequality either through confrontation Newman et al. (2015) or segregation and isolation (Mijs 2018, 2019), we believe that focusing on the segregation of polarized groups is a more suitable approach.
We do so by combining data from the Socio-Economic Panel (SOEP) with microm data and relevant spatial indicators from the INKAR database. Our analysis reveals no support for any of the theoretical approaches mentioned above. For urban areas only, we find that higher segregation is associated with less pronounced meritocratic beliefs, a result that contradicts previous findings. Furthermore, our analysis reveals that meritocratic beliefs are less pronounced in districts where high-status households are isolated, while isolation of low-status households does not have any effect. Our results suggest two things. First, investigating the effects of segregation, isolation, and diversity on meritocratic beliefs is crucial when seeking to uncover the mechanisms underlying the supposed connection between inequality and meritocratic beliefs. Second, focusing on how spatial units might differ apart from levels of inequality, for instance with regard to the urban–rural divide and the composition of the district population is important for understanding the complexity of experiences in the local environment.

2. Literature Review

Beliefs in meritocracy have been identified as important factors in legitimizing and justifying social inequalities (Bottero 2020; Mijs and Savage 2020). As such, they help explain why citizens seem to accept inequality, despite the associated negative outcomes for society as a whole—including higher prevalence of health issues and crime rates, as well as less social cohesion (Wilkinson and Pickett 2011). Meritocracy promises that success is, in principle, achievable for anyone, and is based on a combination of hard work and intelligence (Mijs and Savage 2020; Young 1958). As modern welfare states have adopted this premise in the form of equality of opportunity, framed in contrast to the privilege of birth, the idea of meritocracy has turned into a promise. In this sense, the unequal distribution of resources is seemingly the result of an equitable and fair process. In other words, when individuals believe meritocratic processes to be at play, inequality as such is not necessarily perceived to be a problem—it is instead seen as the result of different abilities and efforts. Meritocratic beliefs also relate to how individuals perceive their own prospects of climbing the social ladder. Believing in the possibility of social mobility, or having witnessed it directly, might make individuals more likely to hold meritocratic beliefs (Mijs et al. 2022). However, these beliefs are often misguided, as there tends to be a mismatch between perceived social mobility and actual social mobility. In fact, higher levels of inequality are related to less social mobility (Brunori et al. 2013). It follows that the extent to which individuals believe that success and failure are the result of meritocratic processes explains if, and to what degree, inequality is perceived negatively (Ahrens 2019). If meritocratic beliefs are strong and processes are believed to be equitable, unequal outcomes will be seen as fair (Almås et al. 2022). Furthermore, if individuals believe procedural justice to be actualized and social mobility to be possible, they are more likely to indicate that they are happy and less likely to demand redistribution (Bjørnskov et al. 2013). Indeed, individuals who hold strong meritocratic beliefs are more likely to accept social inequality (Bernardo 2021; García-Sánchez et al. 2020; Kluegel and Smith 1986). Meritocratic beliefs then can be considered as an important factor in explaining why inequality is durable (Lamont and Pierson 2019). These beliefs have further been introduced to explain the “paradox of inequality”—the apparent disconnect between high inequality and public demand for change (Mijs 2019). While characteristics, such as gender, education and political attitudes have been found to influence support for meritocratic beliefs, research indicates that individuals question meritocratic principles when they are provided with information about economic inequality specifically (McCall et al. 2017) or witness unequal outcomes in general (García-Castro et al. 2020).

2.1. Perceiving Inequality: The Role of Locality

There is no conclusive evidence on how individuals form beliefs about meritocracy and how well they are able to assess the extent of inequality. While some studies show that a majority of Germans overestimate inequality in terms of income distribution or their own position within it (Bublitz 2022; Niehues 2016), others suggest that individuals are generally able to estimate inequality quite well (Bottero 2020). According to Irwin (2018), individuals show a slight tendency to ”middling”, but are generally able to reflect on the extent of inequality and their own position within social hierarchies in a sophisticated manner. Regarding the interplay of inequality, social position, and beliefs, she finds that some of those “[h]igher up the income scale […] were more likely to emphasise opportunity and contribution while those lower down were more likely to emphasise their personal experiences of struggle and constraint” (Irwin 2018, p. 8). Some of these differences might be explained by the fact that national-level inequality matters considerably less than subjective day-to-day experiences of inequality (McCall and Chin 2013). What appears to matter more is the information they receive, either through the media, their peers, or by encountering it directly. For instance, McCall et al. (2017) show that if people are provided with information about inequality, their meritocratic beliefs weaken.
The neighborhood can be an important source of information (Bailey et al. 2013). As demonstrated in the neighborhood effects literature (Galster and Sharkey 2017), residents’ neighborhoods impact their day-to-day encounters in addition to being important determinants of the opportunities and resources available to them. Similarly, neighborhoods can be reflective of social positions and serve to consolidate these (Cunningham and Savage 2015). The local context individuals find themselves in seems to influence the inequalities they are able to witness, the social networks they are able to form, and how they relate to each other. In the US context, research has shown that residents of strongly ethnically segregated neighborhoods are less likely to hold favorable views of the respective other ethnic group (Enos 2017). Furthermore, those living in a highly economically segregated area are less likely to favor redistribution, especially when they are affluent (Franko and Livingston 2020). Neighborhood-level income inequality has been associated with the size of the income gap individuals perceive and their attitudes towards inequality (Minkoff and Lyons 2019), while income-diverse social networks have been found to decrease tolerance towards inequality (García-Castro et al. 2020).

2.2. Beliefs and Local Inequality: Three Competing Theories

While past research has demonstrated the mediating effects of meritocratic beliefs for how individuals evaluate inequality and policies intended to remedy them (Almås et al. 2022; García-Sánchez et al. 2020; Lierse 2019; McCall et al. 2017), the impact of local-level inequality on these beliefs remains unclear. To date, three theories attempting to explain the possible relationship between local inequality and meritocratic beliefs have been advanced. They all attempt to explain the underlying mechanisms, but differ in terms of the direction and the effect they expect. For a brief overview of the propositions, please refer to Table 1.
  • Newman et al. (2015) put forward and test the “activated class conflict hypothesis”. Based on the assumption that social classes hold latent attitudes relating to their relative position within social hierarchies, they argue that when inequality rises, citizens become aware of this relative position and adjust their beliefs accordingly. Newman et al. (2015) find that when inequality is high, low-income individuals are more likely to reject meritocratic beliefs, in contrast to higher incomes groups who are more likely to embrace these beliefs.
  • Solt et al. (2016) do not only offer a methodological critique of Newman et al. (2015), but focus on the dimension of discourse. As social discourses are shaped through power relations, they propose that high inequality increases the ability of those in power to influence public discourse in a way that justifies the current system. In contrast to the findings of Newman et al. (2015), they find that low-income individuals are more likely to hold meritocratic beliefs when inequality is high. Their findings were recently, in part, corroborated by Morris et al. (2022).
  • Mijs (2018) offers a somewhat different theoretical approach. He proposes that individuals who encounter people from a diverse range of social backgrounds and social positions will become more critical of meritocratic principles than those whose social relations are more homogeneous. The more diverse the relationships of individuals are, the more likely they are to experience (by proxy) different facets of success and failure, leading them to call meritocratic principles into question (Mijs 2018, 2019). He argues that as inequality rises, so does segregation between social groups, making citizens less likely to meet those from different social backgrounds. More recent work supports these findings (García-Castro et al. 2020).
While past research indicates that there might be a connection between the level of inequality individuals are exposed to and meritocratic beliefs, the direction of this relationship, as well as its applicability to other contexts, remains unclear (see Table 2). Do individuals become more (or less) critical of meritocracy when local levels of inequality increase, as “activated class conflict theory” states, or do higher levels of inequality strengthen the position of the powerful, thus enabling them to establish a narrative which strengthens their position (Newman et al. 2015; Solt et al. 2016)? Do we find the same effects when focusing on the spatial dimension of inequality in terms of segregation instead? Do the effects differ based on individual income? Do findings from other contexts, including the United States, the United Kingdom, the Philippines, and Brazil, translate to the German context (Bernardo 2021; García-Castro et al. 2020; García-Sánchez et al. 2020; Morris et al. 2022; Newman et al. 2015; Solt et al. 2016)?

2.3. A Note on the Underlying Mechanisms

One possible explanation for the differences in results is the choice of concept these studies employ. Commonly, they focus on a measure of income inequality (Morris et al. 2022; Newman et al. 2015; Solt et al. 2016) (see Table 2 for an overview). However, the underlying mechanism is often assumed to be something else. Mijs (2019), for instance, relies on the Gini coefficient to measure inequality but assumes that beliefs are indeed influenced by segregation between groups, which he expects to increase with rising inequality. This is similar to the theoretical model advanced by Windsteiger (2022). She suggests that segregation of income groups can bias the perception of inequality, leading individuals to underestimate the extent of inequality. As groups become more segregated, the economic other becomes less visible as the perceived income gap shrinks, which is (in part) corroborated by Minkoff and Lyons (2019). In contrast, Solt et al. (2016) do not provide an explanation of how they expect changes in the relative power of the privileged to increase their ability to steer public discourse. They do, however, conduct additional analyses, accounting for income segregation, but do not report significant changes to their results. Newman et al. (2015) argue that increased inequality will make individuals aware of it. Arguably, they assume that some process makes inequality more tangible, such as polarization (Goebel et al. 2010).
Following contact theory, we focus on segregation. While inequality and segregation are distinct concepts (Franko and Livingston 2020; Reardon and Bischoff 2011), they are related. Indeed, rising income inequality is often associated with pronounced segregation between socioeconomic groups (Franko and Livingston 2020; Mijs 2019; Reardon and Bischoff 2011). The relationship between inequality and increased segregation does not apply to all groups uniformly. Interestingly, increases in segregation in the face of rising inequality is sometimes reported to be driven by the affluent moving elsewhere, while the residential patterns of the poor remain unchanged (Reardon and Bischoff 2011). Moreover, segregation can exacerbate and perpetuate existing inequalities (Helbig and Jähnen 2018). While the relationship between segregation and meritocratic beliefs has not been explored directly, research focusing on redistribution has found that higher levels of segregation are associated with decreased support for redistributive policies (Franko and Livingston 2020; Minkoff and Lyons 2019). As meritocratic beliefs are assumed to mediate these preferences, it seems sensible to expect a relationship between segregation and meritocratic beliefs (García-Sánchez et al. 2020; Mijs 2019).
Another related aspect is the question of visibility. Common measures of income inequality do not provide a way to discern between inequalities, resulting from the presence of diverse incomes or few very high incomes. An area might be identified as highly unequal due to a few rich individuals who may have little impact on the visibility of inequality in the neighborhood. Consequently, these measures fall short if we assume that beliefs are not simply influenced by the numerical magnitude of inequality. Minkoff and Lyons (2019) put forward a comparable argument, emphasizing the significance of income diversity instead of income inequality. Their study demonstrates that individuals who are exposed to a variety of income groups are more likely to recognize the income gap and support policies aimed at mitigating it. Minkoff and Lyons (2019) use the Herfindahl–Hirschmann Index, which is often used for market competition and measures how much a market is dominated by one group. Furthermore, their findings also suggest that the “neighborhood Gini coefficient does not affect perceptions of income inequality” (p. 353). Questions of visibility and distance are also central to the argument by Mijs (2019): rising inequality is assumed to lead to more segregation, which in turn limits contact between groups, making the fate of others less visible. This in turn can lead to less interaction and cooperation between groups (Duclos et al. 2004; Enos 2017). Consequently, an examination of whether segregation offers a more suitable approach to assessing how the everyday experience of inequality impacts beliefs seems to be necessary.

2.4. Segregation and Meritocratic Beliefs in Germany

To further investigate the theoretical approaches outlined above, we analyze the relationship between district-level segregation and meritocratic beliefs in Germany. Compared to other European Union countries, Germany has average levels of income inequality, yet exhibits a rather high wealth concentration and is home to a considerably large low-wage sector (Eurofound 2021; Eurostat 2023; Grabka and Schröder 2019). Furthermore, Germans tend to hold strong meritocratic beliefs and find, on average, that a society is fair when those who work harder earn more (Adriaans et al. 2020). More specifically, Heuer et al. (2020) report that Germans hold a “work-centred view of meritocracy [serving] as a clear moral guide” (p. 556), leading them to regard violations of this work-based meritocratic ideal critically. This work-centered view holds regardless of occupation, socioeconomic background, or political beliefs (Heuer et al. 2020). Interestingly, and contrary to the expectation of the theory advanced by Mijs (2019), Sachweh and Sthamer (2019) report that developments in the level of inequality in Germany have been matched by changes in justice perceptions, specifically with regard to equality of opportunity. The decreases in perceived justice in times of rising inequality, however, appear to be driven by the affluent (Sachweh and Sthamer 2019). With regard to redistribution, Germans tend to indicate strong preferences for more redistribution between the poor and the affluent, despite the fact that Germany already exhibits a high degree of income redistribution compared to other OECD countries (Niehues 2019). However, demand does not automatically translate into actual policy change. While redistribution might be viewed favorably in surveys, this does not necessarily provide enough salience for these issues for policy changes to occur (Fastenrath et al. 2022).
Following our discussion above regarding the effects of segregation (Franko and Livingston 2020; García-Castro et al. 2020; Mijs 2019), we expect that higher levels of district-level segregation will be associated with more pronounced meritocratic beliefs.
Hypothesis 1.
Individuals living in districts with higher levels of segregation will hold more pronounced meritocratic beliefs compared to districts with low levels of segregation.
Previous work has emphasized that there are individual-level differences in how local-level inequality impacts meritocratic beliefs. Individual income has been identified as a crucial mediator (Morris et al. 2022; Newman et al. 2015; Sands and de Kadt 2020). We assume that the same is true for segregation.
Hypothesis 2.
District-level segregation is mediated by individual-level income. In districts where segregation is low, high-income individuals will hold less pronounced meritocratic beliefs.
Rural and urban areas differ with regard to the extent of segregation between groups. Baba and Wilbert (2022) report a higher spatial concentration of unemployment benefit recipients in rural municipalities, but find that social segregation is more pronounced as the size of municipalities increases. Differences also exist in terms of polarization, with polarization between high- and low-income groups being more pronounced in urban settings (Groh-Samberg et al. 2020). Similarly, previous work has identified differences in political attitudes between rural and urban areas in the Netherlands (Huijsmans et al. 2021), as well as in Germany (Salomo 2019). This is due to specific demographic changes affecting rural areas rather than urban ones, as well as a general disconnect, often relating to a feeling of being “left behind” (Immel and Peichl 2020). With this in mind, it seems reasonable to assume that urban–rural differences exist with regard to how district-level segregation impacts beliefs. Segregation is typically considered in terms of urban areas. An assessment of rural segregation is much less common (Linke 2016). This is also due to data constraints, with more data being available for cities, especially in the German context. Generally, segregation appears to be more pronounced in cities, and increasingly so (Helbig and Jähnen 2018). Lastly, as rural districts tend to have lower population counts per square kilometer, the expected effect of segregation masking inequality might therefore be more pronounced in rural districts.
Hypothesis 3.
The effect of high levels of segregation on meritocratic beliefs will be more pronounced for residents of rural districts.
Previous work on the relationship between income segregation and income inequality suggests that income segregation is not evenly affected. Reardon and Bischoff (2011) report that rising inequality largely drives segregation as the affluent move away. The way individuals perceive inequality is influenced by their individual income and the social groups they belong to. Therefore, we anticipate that the impact of segregation at the district level on people’s beliefs will vary depending on the predominant group in that area.
Hypothesis 4.
The effect of district-level segregation differs based on the district’s composition in terms of poverty and affluence.
Furthermore, we expect other factors (namely gender, migration background, age, university education, religion and political attitudes, duration of residence, region, and whether the respondent has moved to a different district in the past year) to influence meritocratic beliefs.

3. Data and Method

3.1. Data

We utilize data from the Socio-Economic Panel Study (SOEP, doi:10.5684/soep.core.v37eu) for the year 2015 to test our hypotheses, the last year for which all our variables are available (Goebel et al. 2019). The SOEP is a well-established, nationally representative household panel in Germany that has been conducted annually since 1984. Its latest wave includes longitudinal data on more than 30,000 individuals living in approximately 20,000 households. What sets the SOEP apart is its unique ability to merge individual-level data with regional data. By doing so, we are able to combine individual-level data with regional-level indicators. This comprehensive approach allows us to gain a nuanced understanding of the relationship between meritocratic beliefs, segregation, and regional factors at a more granular level.
We measure segregation on the district level. Districts are the second-lowest government structure and part of the local government in Germany. There are 294 rural districts (Landkreise in German) and 107 urban districts (Kreisfreie Städte in German), totaling 401.1Assignment to districts is based on respondents’ current place of residence. In the German context, districts play a crucial role in everyday life. They handle public administration, healthcare, social services, education, transportation, infrastructure, and environmental protection. Districts issue important personal documents, manage public properties, and implement regional regulations. They organize and finance healthcare services, support individuals with disabilities, provide childcare and assistance to seniors, as well as social housing. Furthermore, they oversee schools, vocational training centers, and educational institutions to ensure quality education. They also plan transportation, construct roads, and facilitate public transportation. The district level ensures efficient governance and essential services that impact citizens’ daily lives: “it is estimated that 75–80 percent of all federal and Land laws are implemented by local governments. The most important units in this regard are the [districts]” (Gunlicks 2003, p. 94). However, it must be noted that the level of segregation experienced at the place of work may differ considerably, as this could be outside the district based on the residential address, which we do not include here. According to Dauth and Haller (2018), the average commuting distance in 2014 was 10.5 km; however, particularly in the periphery of metropolitan areas, the commuting distances are greater. While the districts vary considerably in size and population density, they offer the best approximation for Germany of the local areas used in previous work—namely, US counties and local authority districts in the UK (Morris et al. 2022; Newman et al. 2015; Solt et al. 2016). District-level indicators are drawn from microm, a micro-marketing company, and the INKAR database (Indikatoren und Karten zur Raum und Stadtentwicklung, engl. “indicators and maps for spatial and urban development”) provided by the German Federal Institute for Research on Building, Urban Affairs, and Spatial Development (BBSR 2023). The INKAR database contains a broad range of indicators across various administrative levels, including the district level.
Unfortunately, data comparable to the census data used in previous work are not available in Germany on the district level. Therefore, we are unable to employ measures of income inequality employed by other researchers, such as the Gini coefficient. While previous work has employed micro-census data to explore inequality across German districts (Immel and Peichl 2020), these data are not available for reuse.2 Consequently, we combine data from the SOEP and the INKAR database with data from the micro-marketing company microm, as described below.
After excluding all cases with missing values for our variables of interest, we retain a sample of 21,395 individuals from 400 of the 401 districts. An overview of the variables included in the analysis is provided in Table 3.

3.2. Dependent Variable

Arguably, meritocracy is a multilayered concept that is hard to capture using a single indicator. Merit, as Young (1958) defines in his seminal dystopian novel, is the result of intelligence and effort (p. 94). Effort, in the sense of working hard to succeed, is one of the central tenets of meritocratic ideology (Becker and Hadjar 2011). Therefore, we measure meritocratic beliefs based on the degree to which individuals attribute the achievement of success to hard work. In doing so, we grasp a central aspect of meritocracy and maintain consistency with previous work. We rely on an item that queries the agreement with the statement ”One has to work hard in order to succeed” on a 7-point scale. This item closely resembles previous operationalizations that are focused on the overall importance of hard work to get ahead in life in general (Mijs 2019; Newman et al. 2015; Solt et al. 2016). We diverge somewhat from previous measures, as the survey question directly refers to “success” as opposed to the phrasing of “getting ahead”.3 Similarly, Morris et al. (2022) measure meritocratic beliefs with an item focusing on hard work paying off in the long run for the individual themselves (“I have always believed my hard work will pay off in the end”).
To ease interpretation, we recoded the item to range from 0 to 100, as first suggested by Larsen (2016) and subsequently used by others (Mijs 2019; Morris et al. 2022).4 Our measure of meritocratic beliefs is strongly skewed left, with a mean score of 83.33 after transformation, which mirrors the distribution of the meritocratic beliefs variable used by Morris et al. (2022) (see Figure 1). This reflects the high degree of equal opportunity beliefs and the strong work-centered meritocratic ideal prevalent in Germany (Sachweh and Sthamer 2019).

3.3. Independent Variables

Our key independent variable is the level of segregation between high- and low-status households at the district level. As detailed statistics on district-level income inequality are not available in Germany, we draw instead on small-scale indicators and areal units provided by the micro-marketing company microm.5 Specifically, we use the “microm status” variable. Unfortunately, detailed documentation in the sense of scientific reproducibility is not available for this variable, as the provision of micro-level data is at the center of mircom’s business model. To the best of our knowledge, the variable captures a variety of aspects relating to the socioeconomic status of all households in Germany. These include academic titles, professional status, and occupational group, as well as other status-related measures, such as (luxury) car ownership, in addition to information on the residential environment (Goebel and Hoppe 2015; microm 2019). These factors might have an impact on the visibility of inequality, as previous studies have demonstrated a connection between being confronted with visible signifiers of inequality and policy preferences (Sands 2017; Sands and de Kadt 2020).
The status variable is calculated by microm using multivariate forecasting methods to disaggregate the socio–spatial properties of the various indicators at different spatial dimensions. The resulting metric variable is then classified into deciles to identify households with high (top decile) or low status (bottom decile). We exploit a unique version of the data, provided and calculated by microm for an expert report as part of the German Federal Government’s Poverty and Wealth Report, containing yearly demographic data and covering all postcode-8 areas in Germany between 2007 and 2015 with fixed borders (Goebel and Hoppe 2015). Although the most recent year of the microm status variable in the data used is 2015, it should be noted that not all data included refer to this year. In particular, there is a time lag in the official data; for example, the socio–spatial information from the microm data set for the year 2015 refers to official information from the year 2013.
To calculate the segregation indices, we use the smallest available spatial unit in the data (so called postcode-8 areas) and their district-level aggregates. Based on the official German postcodes (5 digits), which vary considerably in the number of included households, microm constructed fine-grained postcode-8 areas (8 digits) as subregions of the 5-digit postcodes. Around 80,000 postcode-8 areas have been constructed by microm using cluster analysis to contain, on average, 500 households, although their size varies across space depending on population density (e.g., postcode-8 areas are smaller within urban areas). The data at hand includes the number of households with a low or high status for each postcode-8 area, based on the distribution of the microm status variable across Germany. A threshold value, derived from the distribution of the first and the tenth decile of the status variable, is used to delineate households with a high or low status. We use the data available to us to calculate the segregation indices: the number of high-status households, the number of low-status households, and the total number of households within the postcode-8 areas. By relying on the microm status variable, we divert from previous work focusing on economic inequality in terms of income or income groups (Minkoff and Lyons 2019; Morris et al. 2022; Newman et al. 2015; Solt et al. 2016).

3.3.1. District-Level Segregation

We rely on two indices to construct three measures of district-level segregation, each capturing a different aspect of segregation. In doing so, we follow Massey and Denton’s (1988) recommendation that segregation is best measured using several indicators. To do so, we use the dissimilarity index to capture evenness and the isolation index to capture the extent to which low- and high-status households live in isolation. Thereby, we follow Goebel and Hoppe (2015), who have previously employed the microm status variable to capture segregation in Germany on the municipal level. We calculate the indices, based on the counts of households in the highest and lowest decile of the microm status variable, within the postcode-8 areas in the districts. The first measure is the dissimilarity index, which captures the concept of evenness (Duncan and Duncan 1955). Put differently, the dissimilarity index can be understood as the proportion of members of one group that would have to move to ensure an even distribution within an area. The dissimilarity index is calculated as:
D k 1 , k 2 = 1 2 j = 1 n x i k 1 X 1 k x i k 2 X 2 k ,
where x i k is the population of group k i in the postcode-8 area and X 1 k the population of group k i on the district level (Tivadar 2019). As we seek to capture the extent to which inequality becomes tangible for citizens, depending on the level of segregation, we determine the level of dissimilarity between low- and high-status households. Second, we include the isolation index, calculated for both high- and low-status households. The isolation index provides the probability that a member of a specific group will live in the same spatial unit with a member of the same group (Bell 1954; Tivadar 2019). The isolation index, calculated for the low- as well as the high-status group, is:
x P x k = n = 1 n x k X k · x i k t i ,
where x k is the population of low-status or high-status households in the postcode-8 area, X k is the population of low-status or high-status households on the district level, and t i the total population in the postcode-8 area (Tivadar 2019). These are calculated using the OASISR package (Tivadar 2019).
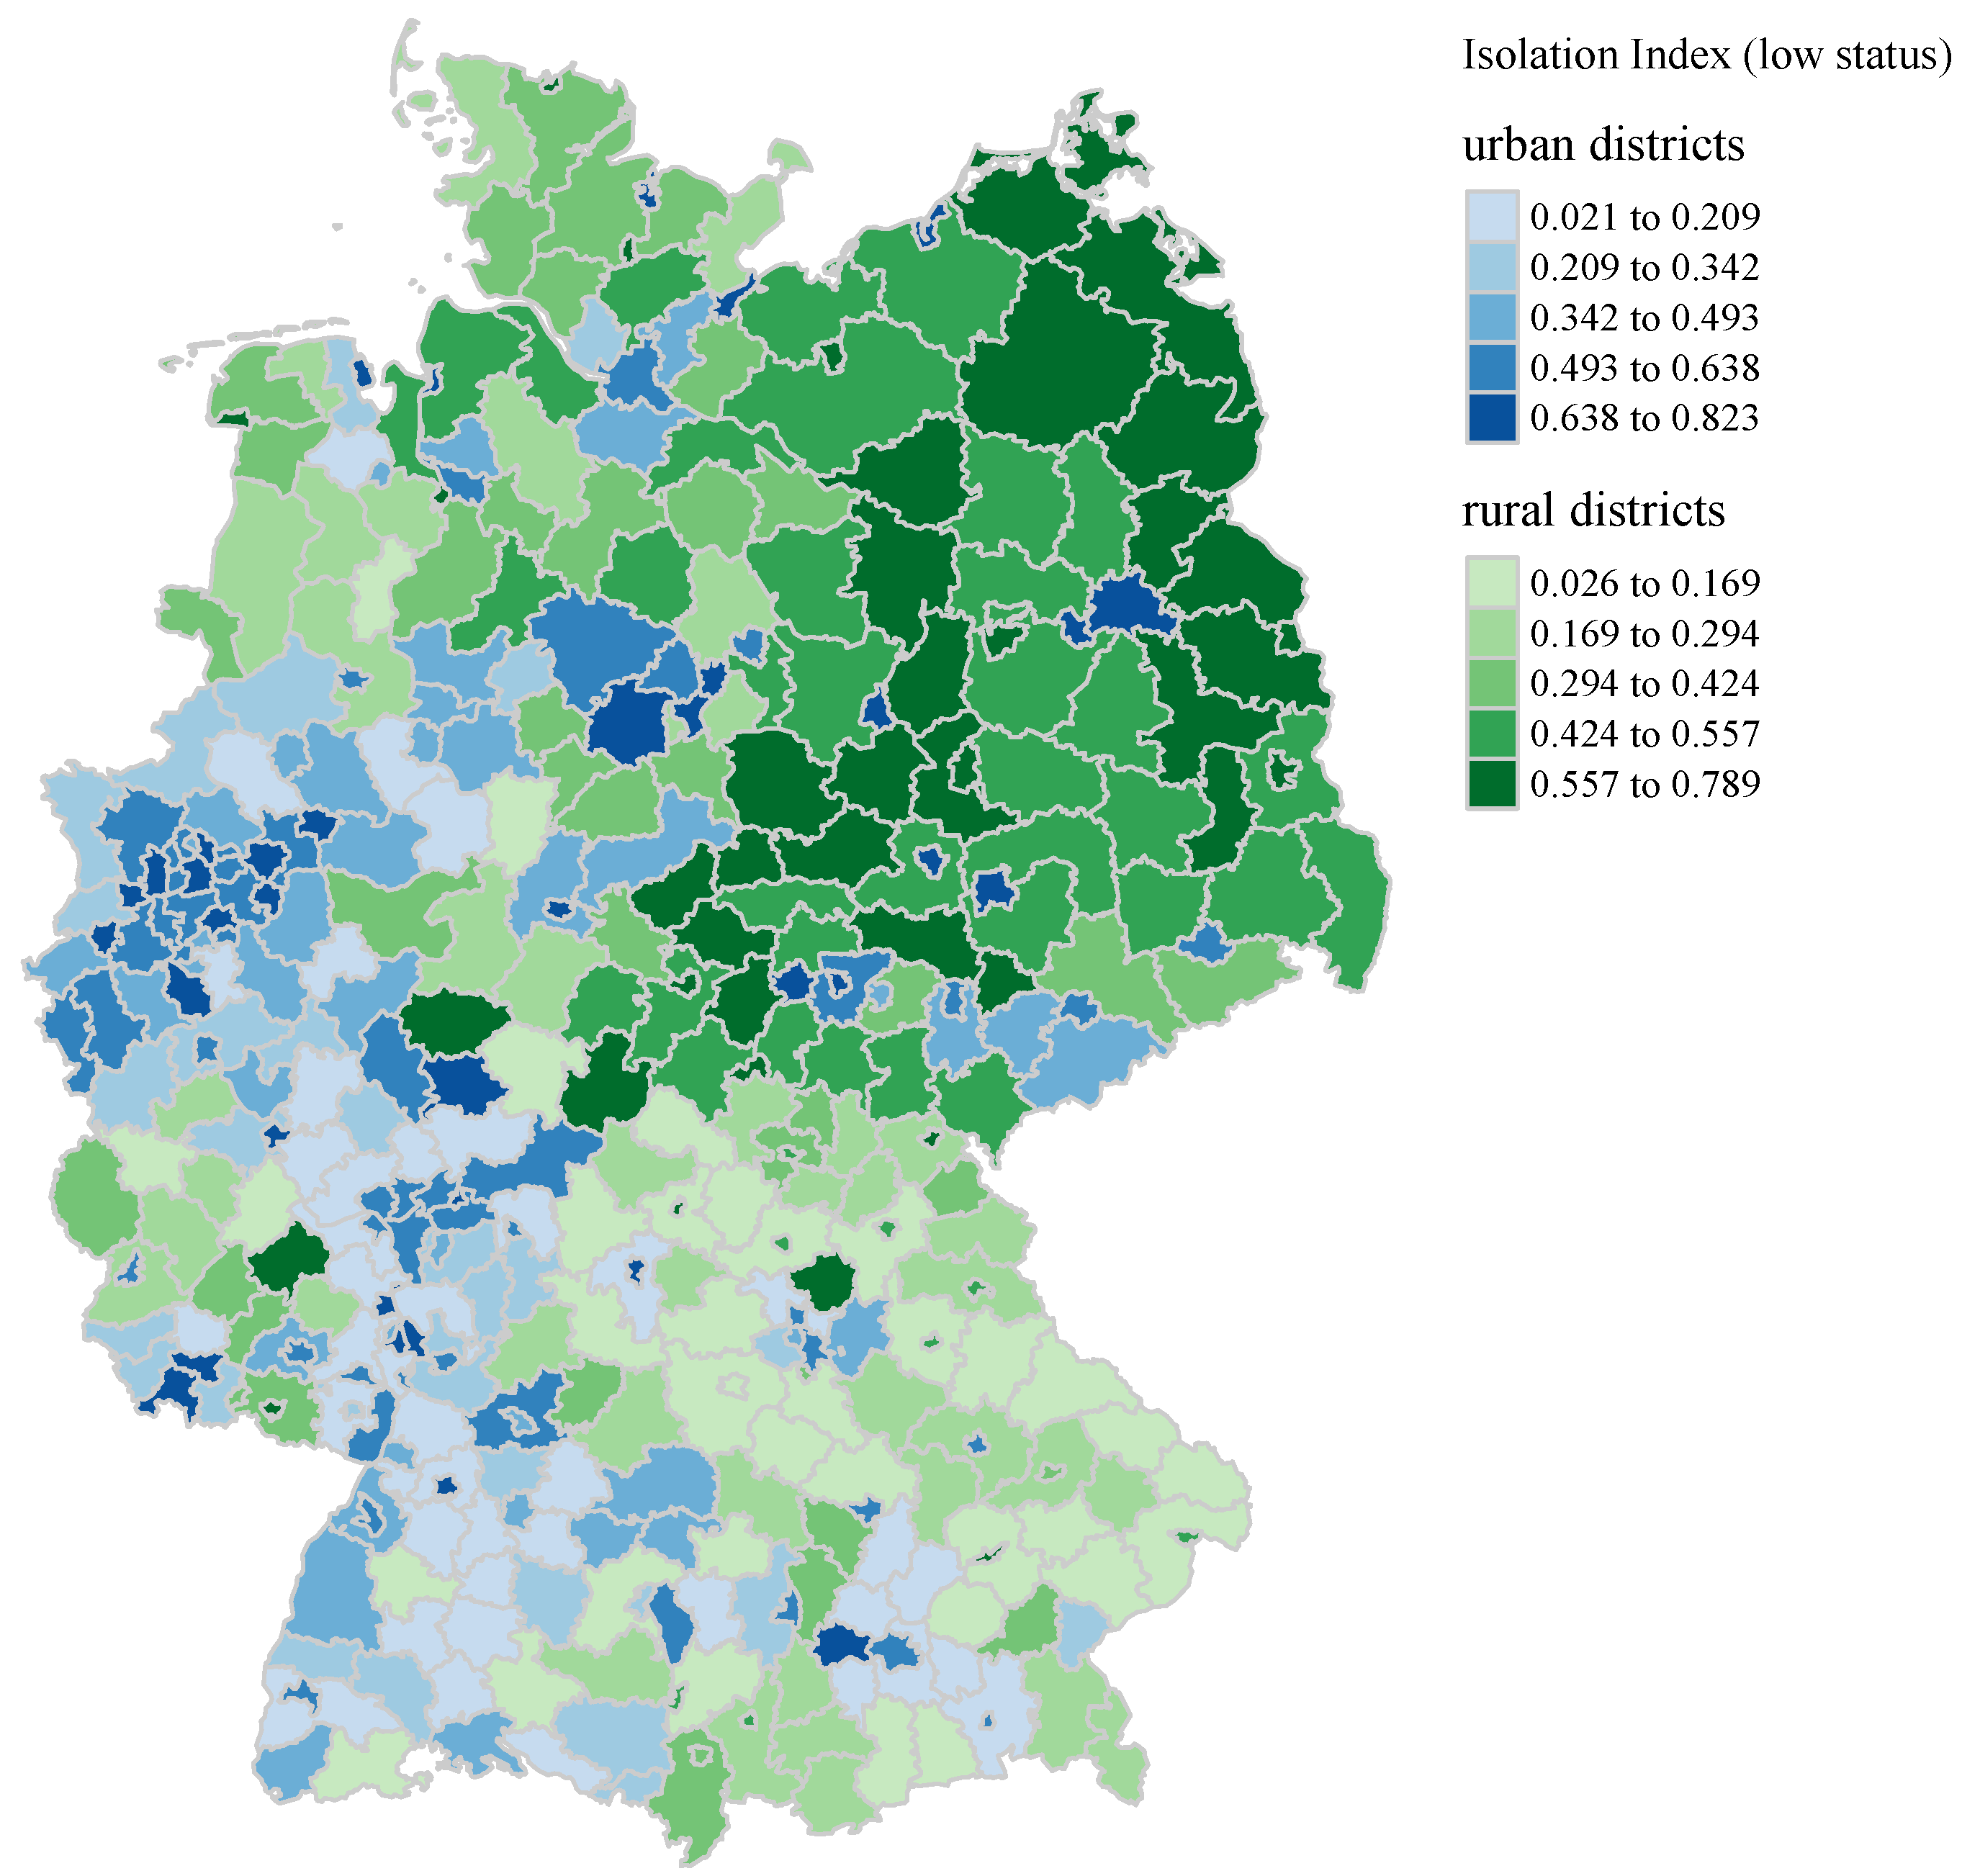
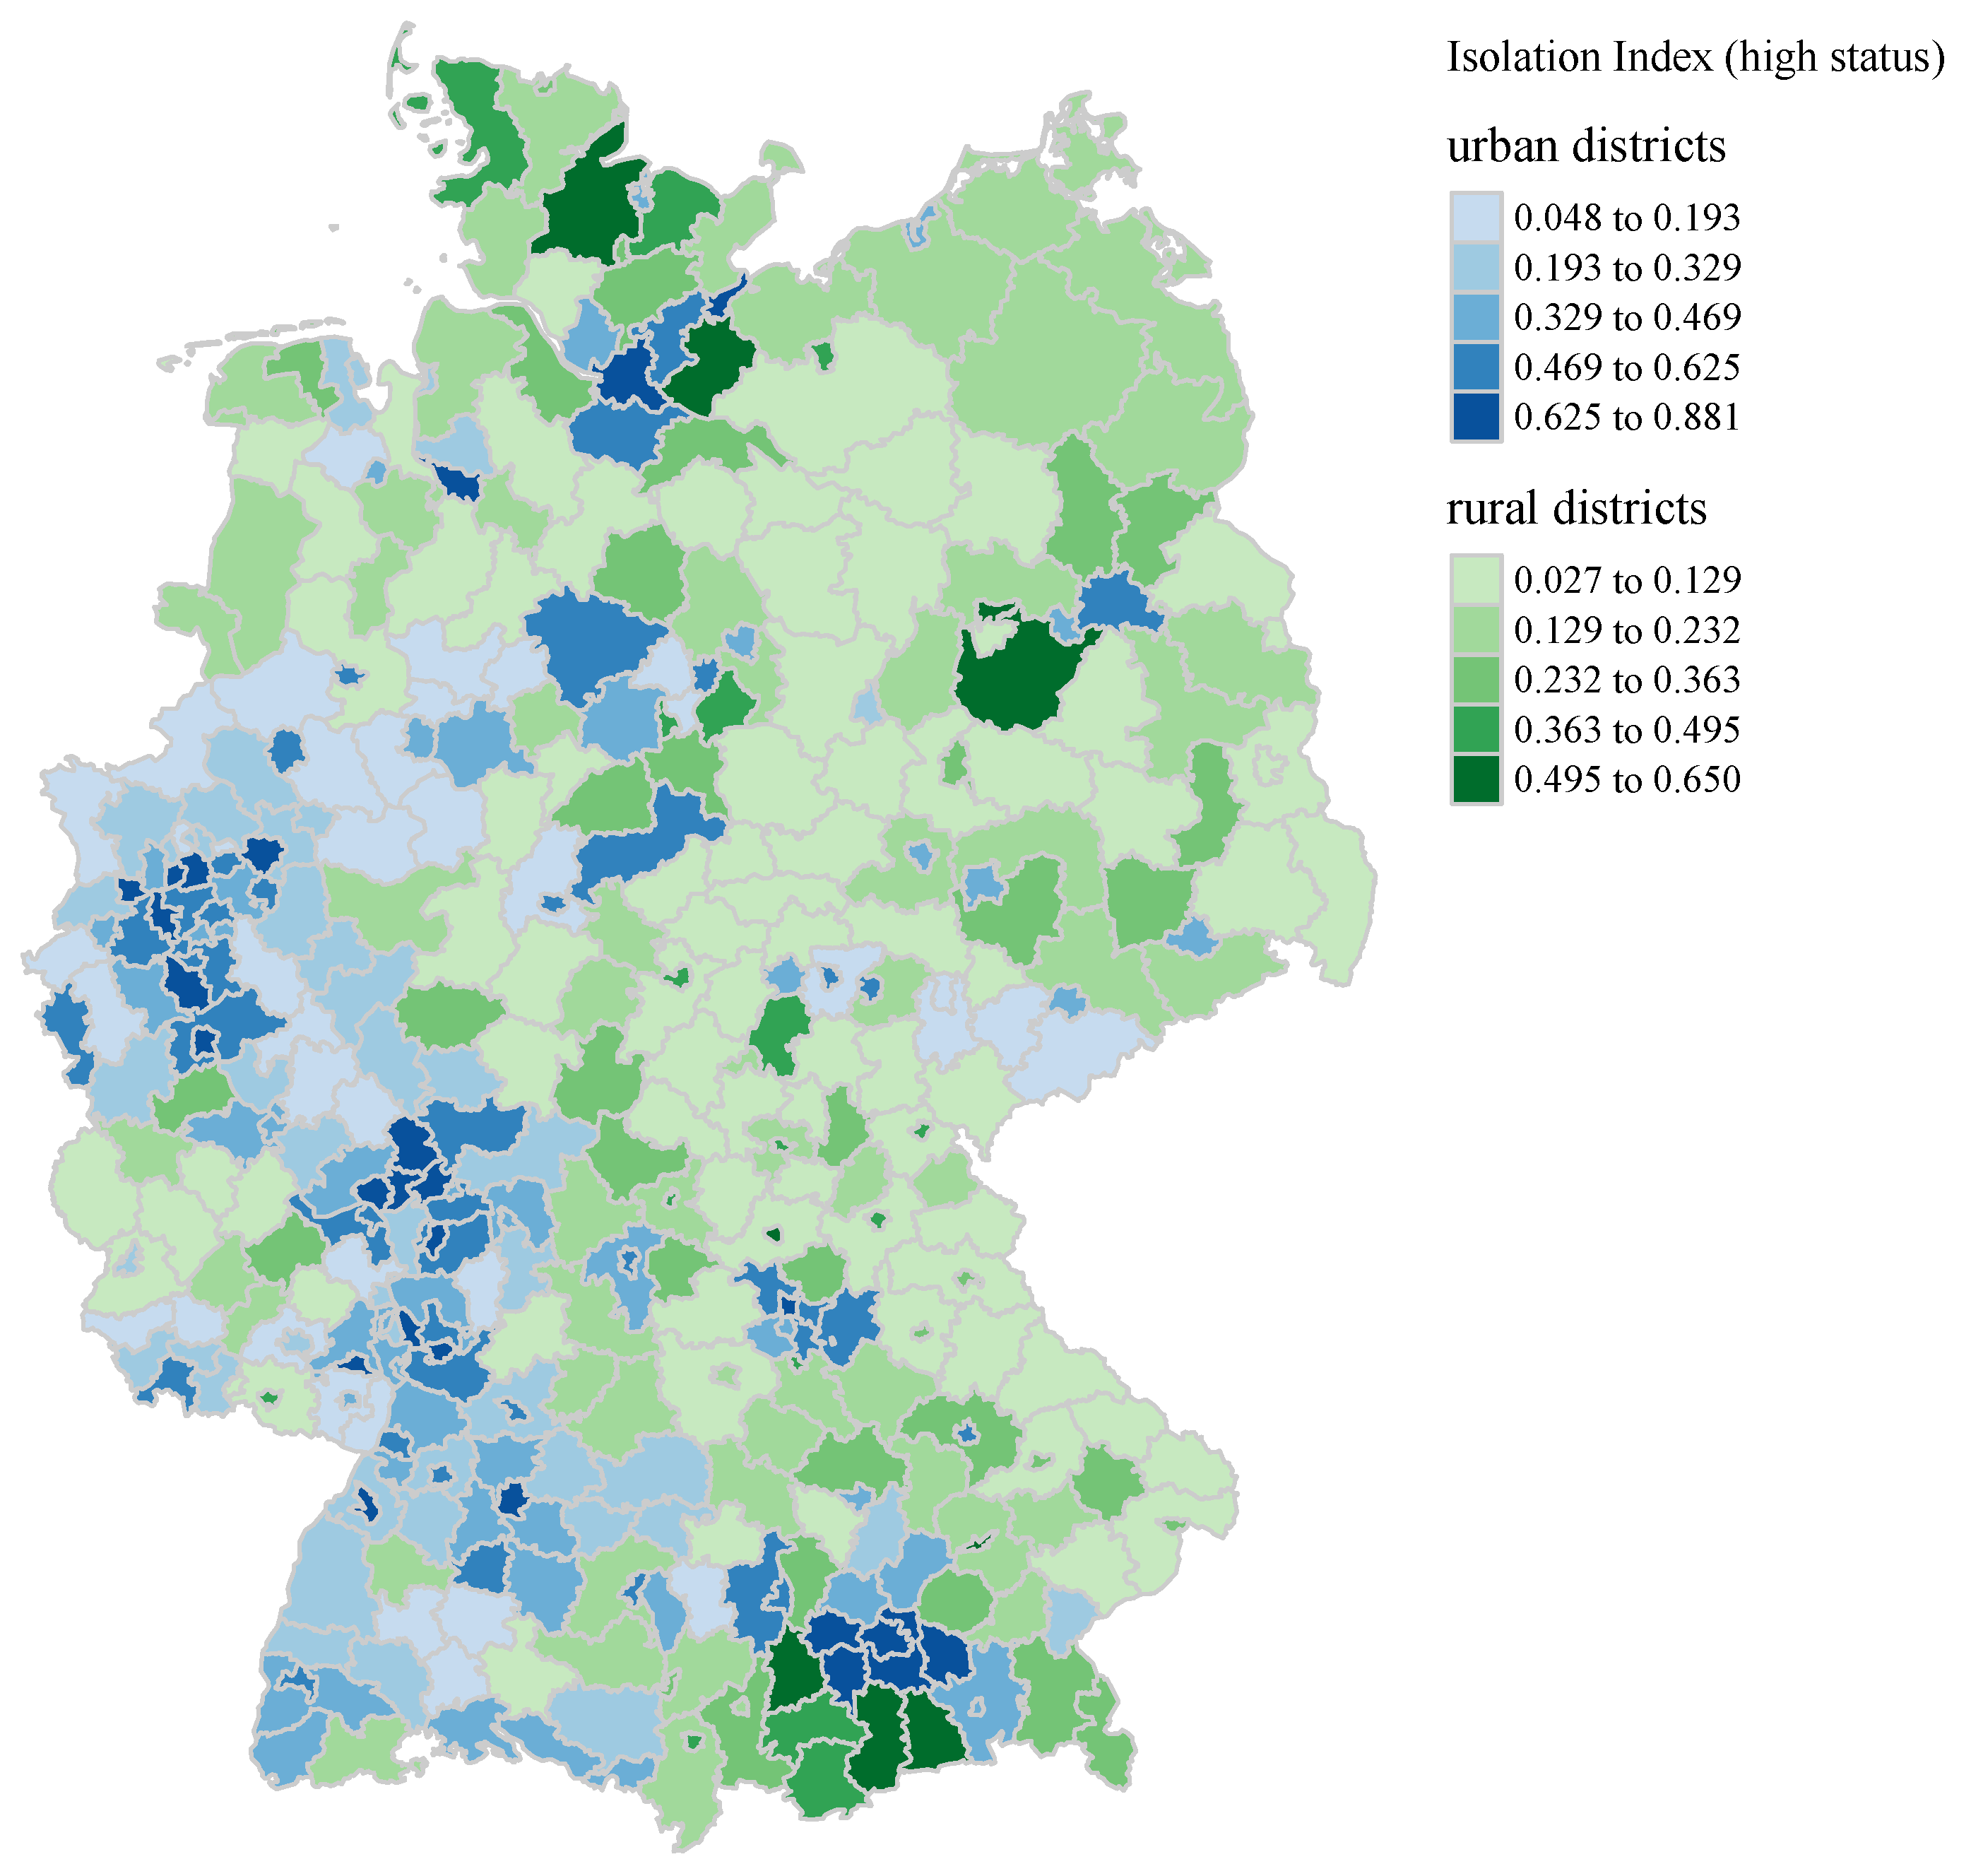
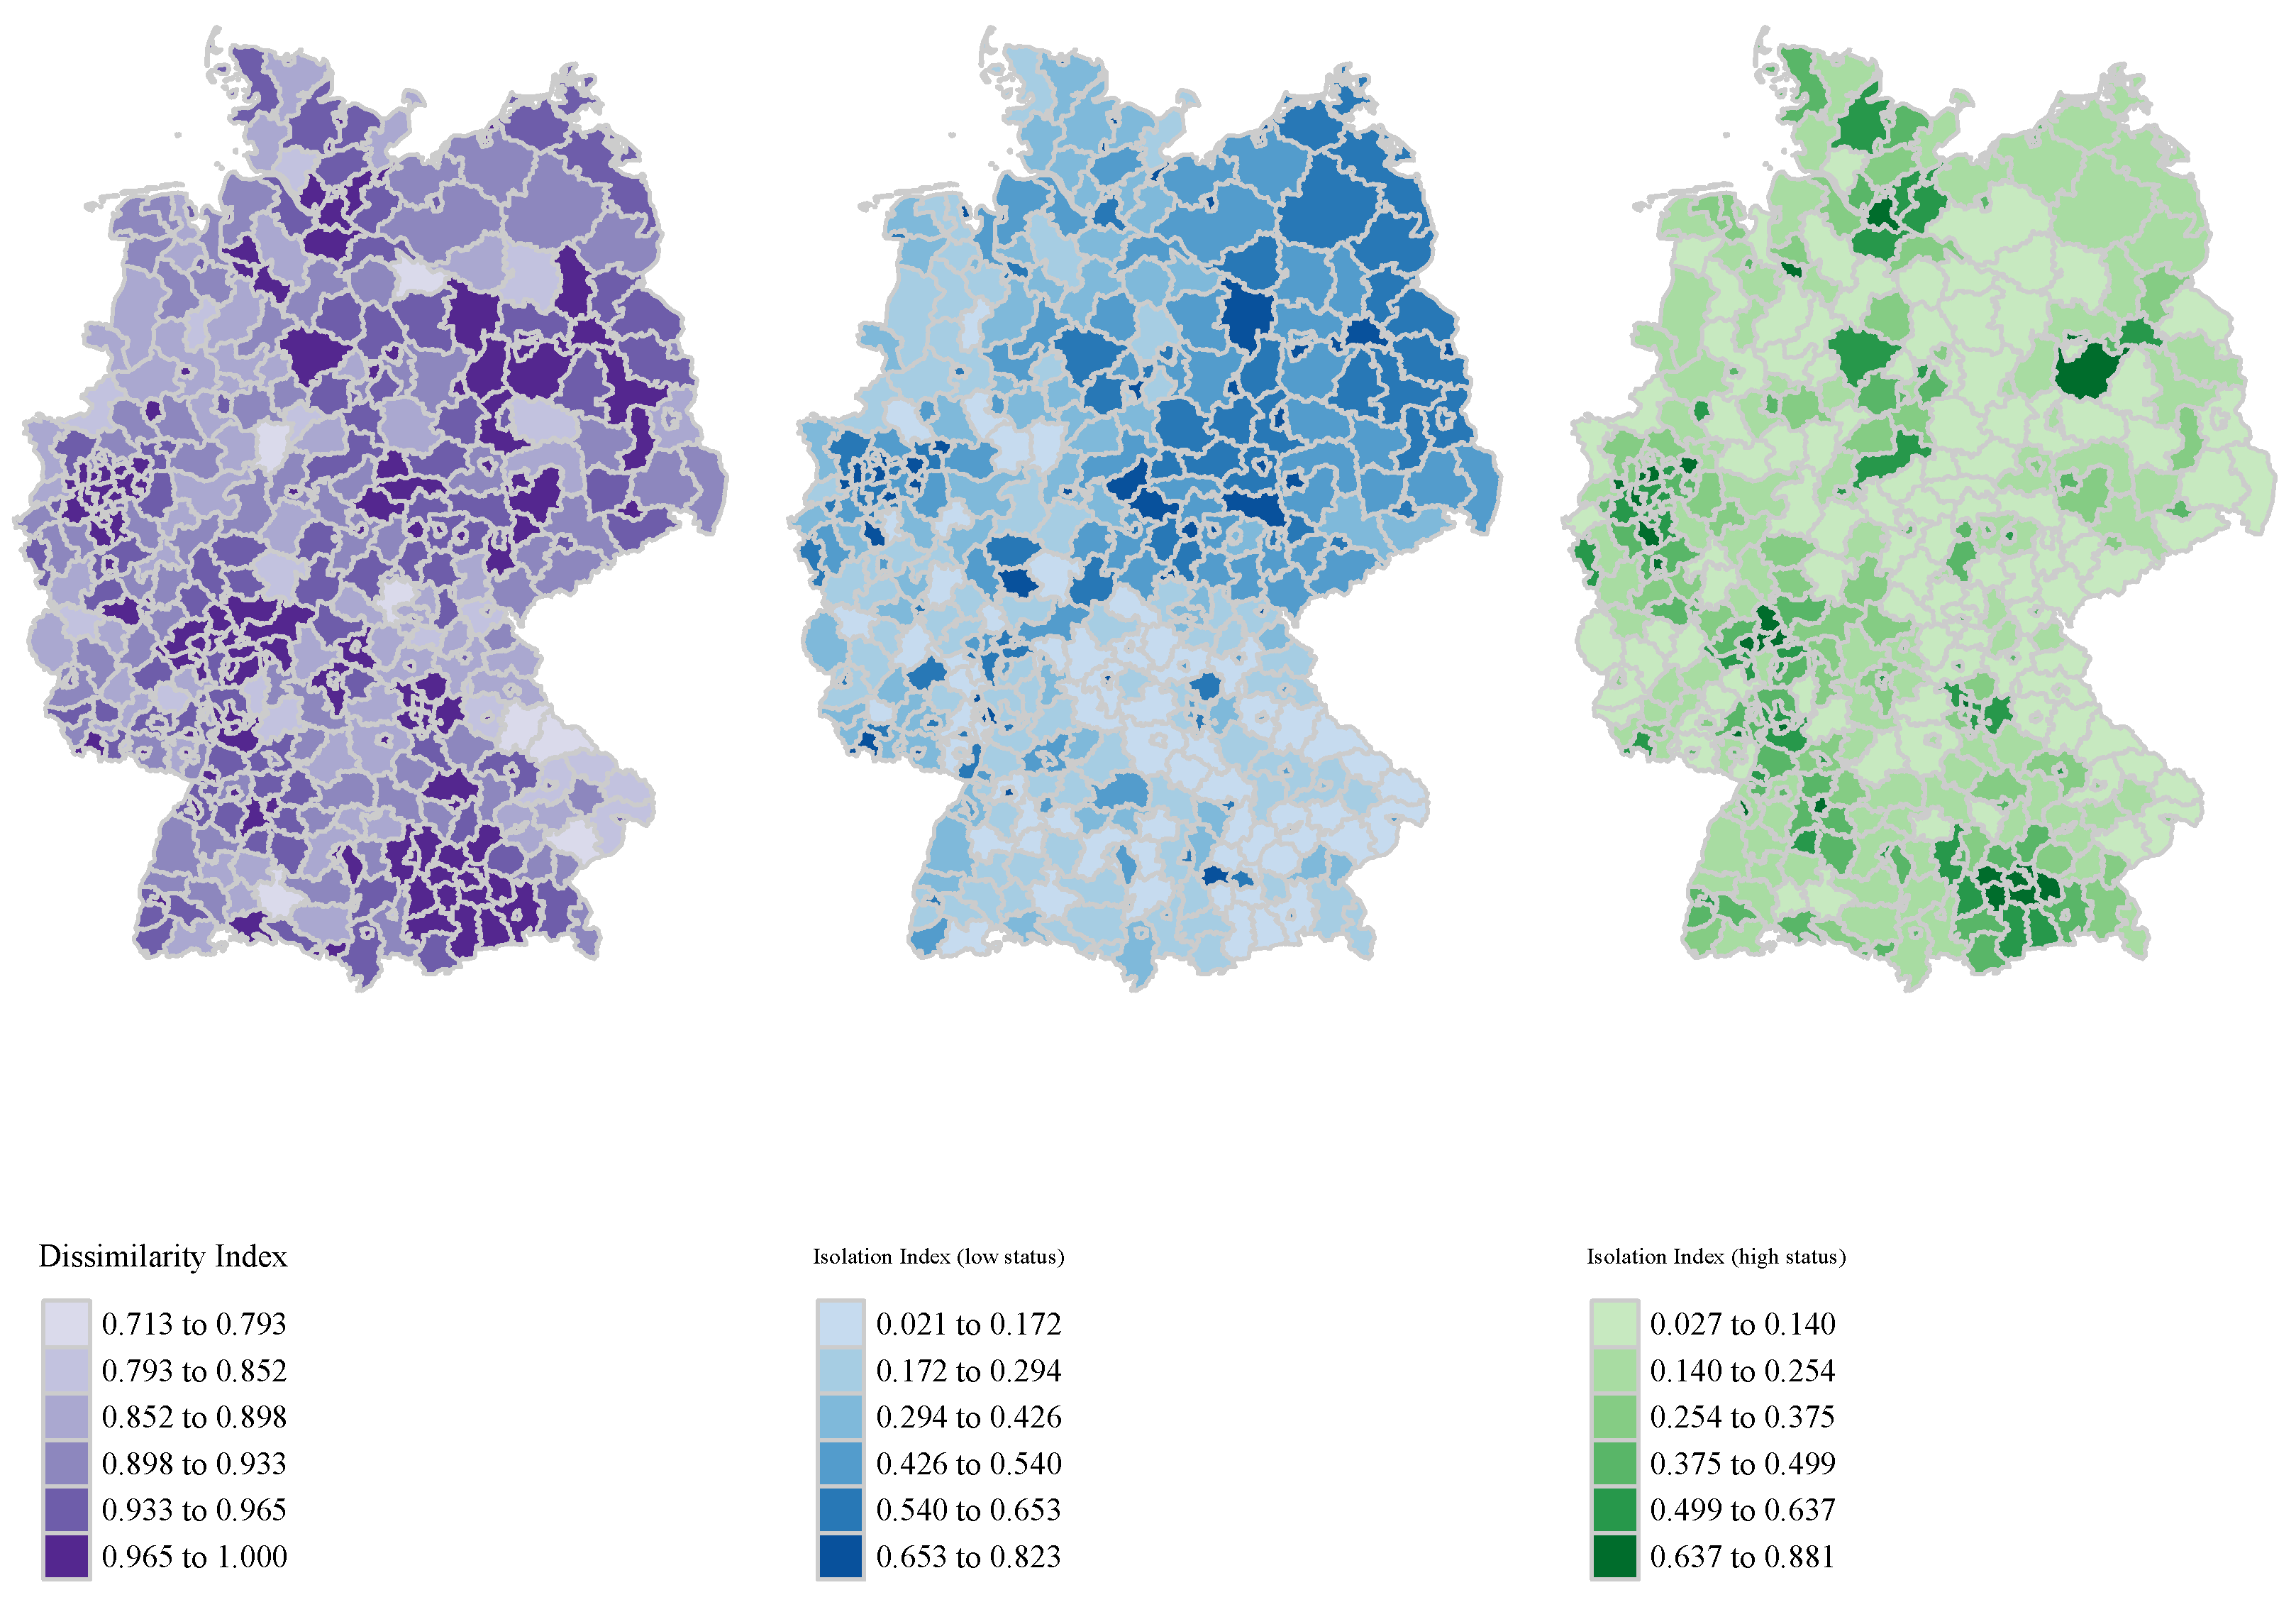
Both indices range from 0 to 1, with 1 indicating a high degree of dissimilarity (isolation). Figure 2 shows the level of segregation for all three indices across districts in Germany, while Figure A1, Figure A2 and Figure A3 in the Appendix A provide maps of all three indices by urban and rural districts. When using the microm status variable at the postcode-8 level, districts appear to be highly segregated, with values for the dissimilarity index ranging from 0.71 to 1.00 . As the dissimilarity index is sensitive to small geographical units and group sizes, this is partly a reflection of the data itself. Rural districts appear to exhibit slightly more variation in terms of the dissimilarity index than urban areas, with the index reaching levels below 0.80 only in rural districts (see Figure A1). Some differences between urban and rural districts were to be expected. There does not appear to be a notable geographic concentration of dissimilarity.
In contrast, the isolation indices for low- and high-status households in Germany reveal noticeable variations in their spatial distribution. The isolation index scores for low-status households appear to be higher in the eastern part of Germany, whereas the isolation index for high-status households tends to be higher in the western and southern regions. This is particularly evident in districts belonging to the federal states Mecklenburg-West Pomerania and Saxony-Anhalt. Conversely, the isolation of high-status households appears to be more pronounced in districts where wealth tends to be more prevalent: for example, in the districts surrounding Munich, including the district of Miesbach, one of the districts with the highest millionaire density in Germany (Mooser 2022). While notable differences between rural and urban areas do not appear to exist in terms of the isolation index for low-status households, isolation of high-status households appears to be higher in urban districts.

3.3.2. District-Level Controls

Following previous work (Morris et al. 2022; Newman et al. 2015; Solt et al. 2016), we also include the average monthly disposable household income, the population density, and the share of the foreign population of the total population to capture sociodemographic differences at the district level. As discussed above, these district-level indicators are derived from the INKAR database. Going beyond previous work, we include an East/West dummy indicating whether the respective respondent’s district is part of a federal state which historically belonged to the German Democratic Republic. Previous research has reported differences between East and West German individuals in terms of attitudes towards inequality. For instance, Noll and Schuster (1992) reported shortly after reunification, that East Germans were more likely to believe that structural and economic factors are more important in achieving success than individual effort. While differences between individuals living in East and West Germany are certainly not as pronounced anymore, some differences, especially with regard to socio-economic conditions, turnout, and attitudes, remain (Barth et al. 2020; Butterwege 2015; Elff and Roßteutscher 2016; Schäfer et al. 2016). Furthermore, we add a dummy variable indicating whether the respondent lives in an urban or rural district to test our hypothesis that segregation is perceived differently based on district type. In doing so, we also expand on what previous work attempted to do by solely relying on total population. Lastly, and to test whether the effect of segregation differs depending on whether the districts’ population can be considered affluent or not, we include two dummy variables for the proportion of those who receive basic security benefits (colloquially known as Hartz IV) and the proportion of households with an average net household income above EUR 3600 per month.

3.3.3. Individual-Level Controls

The equivalized monthly household income is included on the individual level as a central predictor of interest. Previous research has indicated income as a significant predictor of meritocratic beliefs in relation to local inequality (Morris et al. 2022; Newman et al. 2015; Solt et al. 2016). Furthermore, we add additional individual-level predictors that have previously been shown to be related to meritocratic beliefs. In addition to gender, age, and migration background, we include dummies for whether an individual holds a university degree, is unemployed, or belongs to a religion. We also include a variable capturing political attitudes. Additionally, we include the number of years individuals have lived in their district to control for increased awareness of district-level segregation among long-term residents. Lastly, we also account for whether the respondent has moved districts in the past year, enabling them to compare and contrast different districts. Table A1 in the Appendix A provides an overview of the data sources and transformations for all variables included in the model.

3.4. Method and Models

To test our hypotheses, we opt for a linear mixed-effect model with restricted maximum likelihood (REML) estimation, to account for the lack of independence between individuals from the same household and those living in the same district. We include random intercepts for households within districts, but no random slopes. The analysis is conducted using the lme4 package’s lmer function (Bates et al. 2015). To ease interpretation, the equivalized household income on the individual level, the average household income on the district level, population density, and the proportion of foreign residents on the district level are mean-centered.

4. Results

Results for the main analysis for all three indices are provided in Table 4. When assessing only main effects (models I, III, and V), we find that only the isolation index for high-status households returns an estimate that is significant by conventional standards. For the other two indices, we fail to detect an effect on meritocratic beliefs. As the effect of the isolation index for high-status households is small and negative ( b = 5.36 , S D = 1.52 , p < 0.001 ), we find no evidence in support of hypothesis 1. Contrary to our hypothesis—expecting individuals living in districts with higher levels of segregation to hold more pronounced meritocratic beliefs—we instead find that individuals living in districts in which high-status individuals are more isolated tend to hold less pronounced meritocratic beliefs. Further, we do not find evidence suggesting an effect of dissimilarity or the isolation of low-status individuals on the district level on beliefs. Notably, we do find significant, albeit small, main effects for most covariates included in the model—especially for residents with a migration background, those without a university degree, and those holding left-leaning political attitudes. The effects remain stable across model specifications. Additionally, we see a small age effect, with those older than 65 years tending to be slightly more supportive of the idea that “One has to work hard in order to succeed”. In terms of district-level covariates, the analysis reveals that those living in districts with a higher proportion of basic security benefit recipients as well as those in East German districts hold slightly stronger meritocratic beliefs, while those in rural areas hold slightly less pronounced meritocratic beliefs. The effects, however, are small.
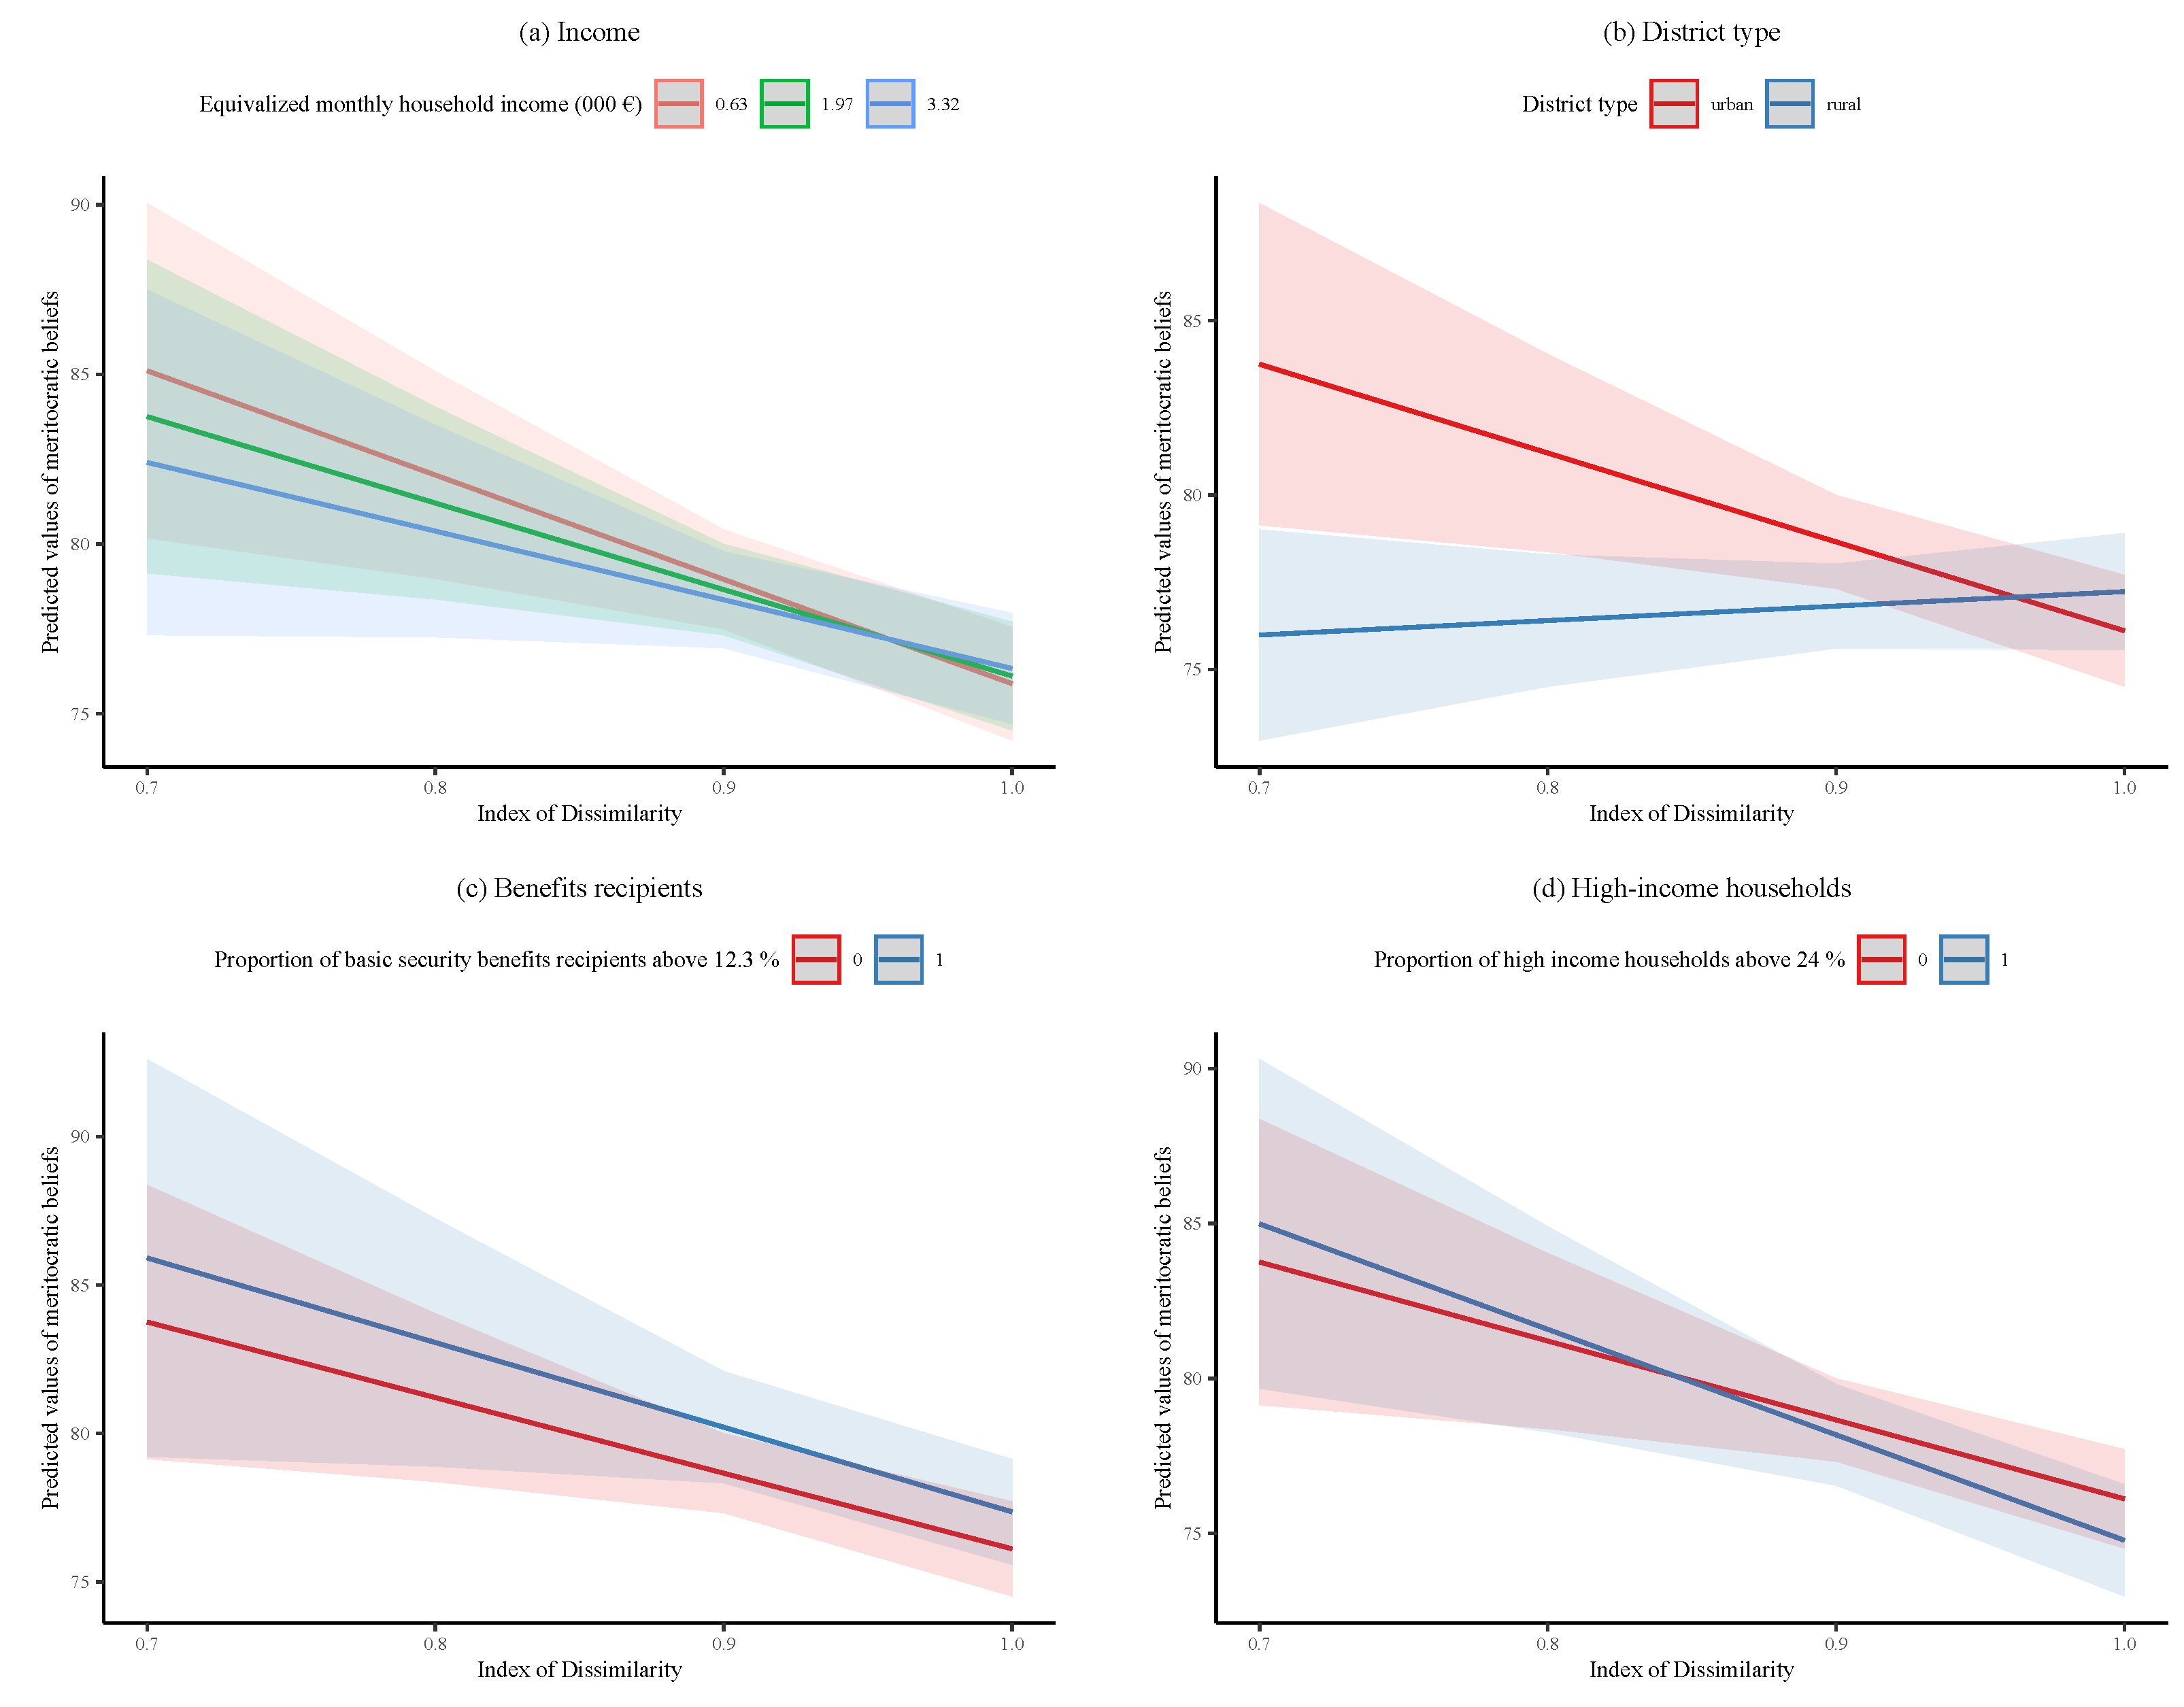
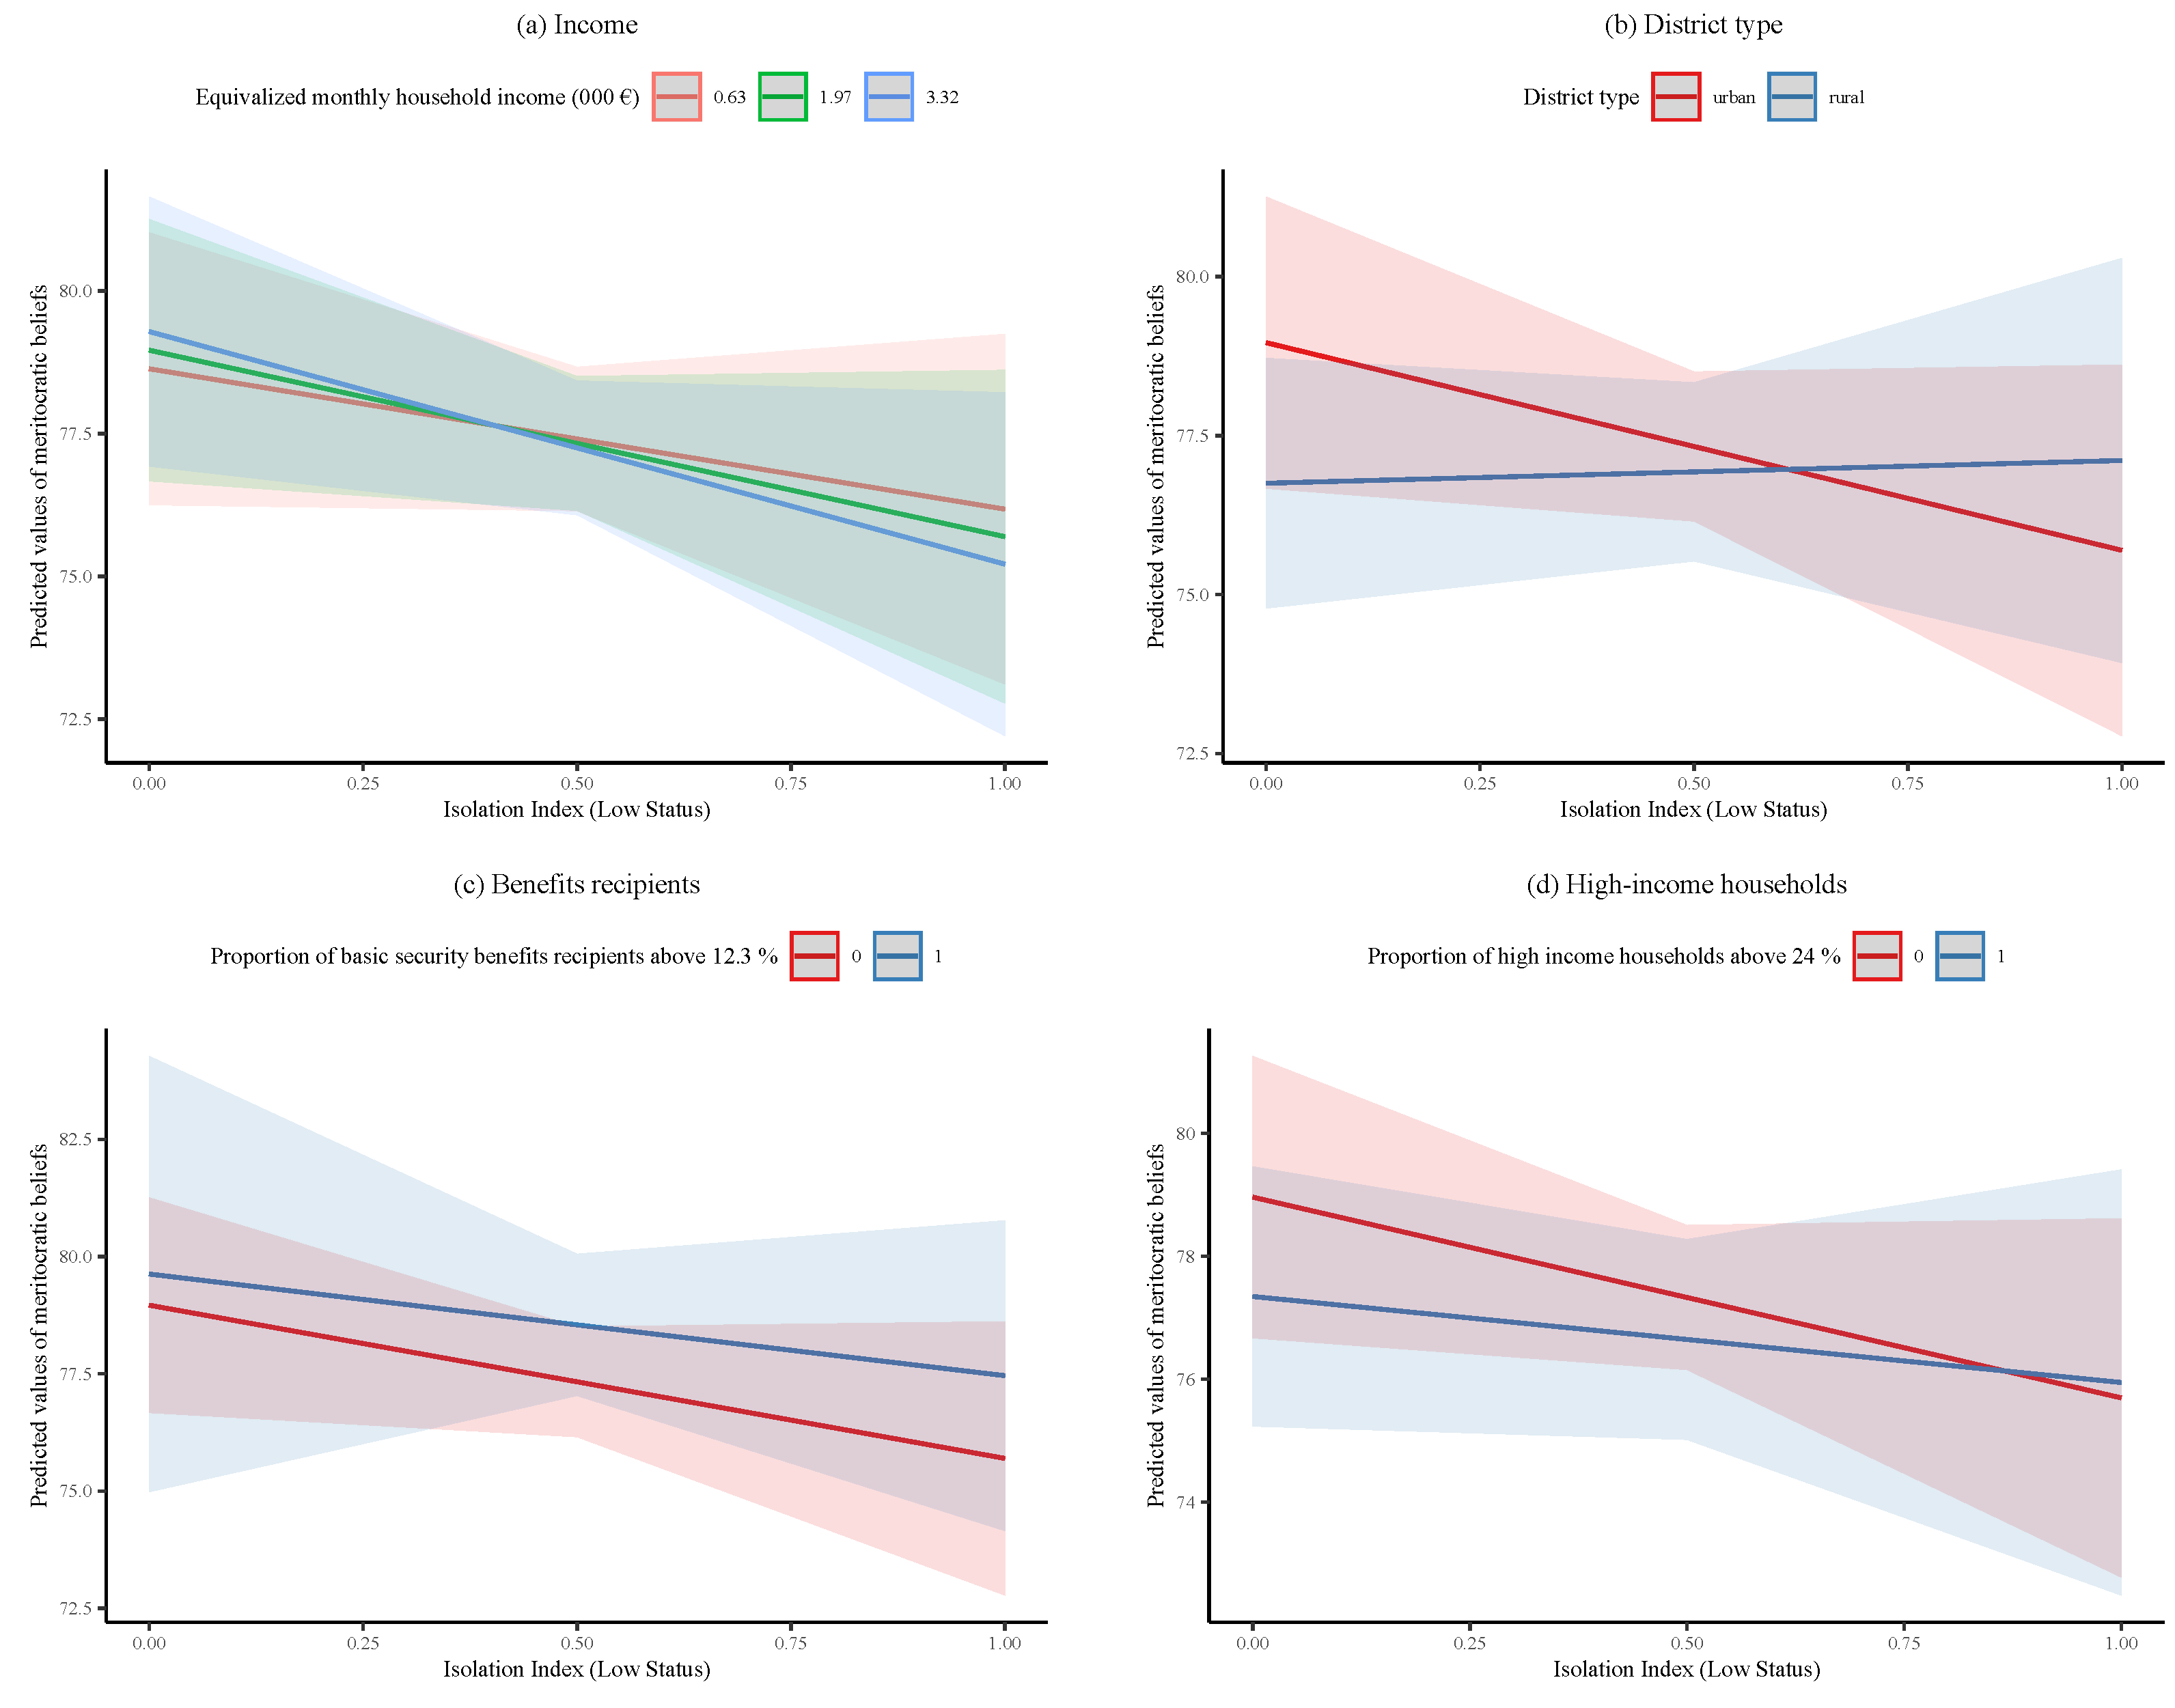
We observe a marked change in the dissimilarity index as compared to the main effects models when interaction terms are introduced to the model, while the isolation indices remain quite stable (see models II, IV, and VI in Table 4). The isolation index for high-status households, however, fails to reach conventional levels of significance once interaction terms are added. To test our second hypothesis, we introduce an interaction term for OECD equivalized household income and the segregation indices. The analysis reveals no statistically significant effects of this interaction term for any of the segregation indices. Therefore, we find no support for the hypothesis that household income mediates how district-level segregation impacts meritocratic beliefs (Hypothesis 2). We also do not detect a main effect of income on meritocratic beliefs. Estimates for the interaction effect are marginal, with large standard deviations. Plotting the interaction effects corroborates this finding and reveals no distinct interaction effect of segregation and individual income on meritocratic beliefs (see Figure A4, Figure A5 Figure A6 in the Appendix A). While there appear to be slight differences between different income groupings, they all follow the same direction: meritocratic beliefs decrease as segregation increases. However, as noted before, the effects are marginal at best and do not meet conventional levels of significance.
While we do detect a small effect of district type in most main-effects models (model I, III, V), we detect a pronounced interaction effect of the dissimilarity index and our rural dummy (model II). Urban residents appear to be more responsive to higher levels of segregation in terms of the dissimilarity index. Meritocratic beliefs among urbanites living in highly segregated districts tend to be lower. We note that urban residents who earn an average income and reside in districts that have neither a high proportion of benefit recipients nor a high proportion of high income households hold significantly lower meritocratic beliefs when segregation is high ( b = 25.49 , S D = 9.55 , p < 0.01 ). On average, residents of rural areas, to whom the same applies, appear to be significantly less affected. In fact, model II shows a small but positive effect of district-level segregation on meritocratic beliefs in rural areas. Figure A4b reveals that in the presence of high district-level segregation as measured in terms of dissimilarity, urban residents hold drastically less pronounced meritocratic beliefs. Interestingly, the dissimilarity index is the only segregation index whose influence on beliefs is significantly mediated by the district type. We, therefore, find some support for our third hypothesis, in that there seems to be some difference in effect in how segregation impacts beliefs between rural and urban districts.
With regard to our fourth and final hypothesis, our analysis reveals no significant mediating effect of a high proportion of benefits recipients or a high proportion of high-income households for any of the segregation indices. Intended to capture the overall status of individuals living in a district and to discern whether effects differ based on the districts’ composition in terms of affluence and poverty, we fail to find any evidence in support of our hypothesis. In other words, our analysis provides no evidence that segregation, when measured in terms of dissimilarity or isolation, is influenced by the overall level of poverty or affluence.

4.1. District-Level Segregation and Meritocratic Beliefs: An Urban Phenomenon?

To test whether segregation in terms of the dissimilarity index has a different impact depending on district type, we repeat the analysis with split samples. Our two samples are comprised of N = 7641 individuals living in rural areas across 202 districts, and N = 13,754 individuals living in 198 urban districts. The results are displayed in Table 5. Our results suggest that the regional effect is entirely driven by urban districts, with the effect of segregation becoming slightly more tangible (model X, with b = 30.39 , S D = 10.13 , p < 0.01 compared to model II, with b = 25.49 , S D = 9.55 , p < 0.01 from the model over all regions with interaction effects). The interaction effects, however, fail to meet conventional levels of statistical significance and return unstable estimates with large standard deviations.
While most covariates maintain both the nature and intensity of their impact on meritocratic beliefs, the effect of political attitudes appears to vary by district type. Right-leaning political attitudes only significantly influence meritocratic beliefs in urban areas, with b = 0.87 , S D = 0.44 , p < 0.05 compared to b = 0.56 , S D = 0.57 , p > 0.05 for rural districts. Conversely, the estimate for left-leaning political attitudes is nearly three times larger for urban dwellers ( b = 3.06 , S D = 0.38 , p < 0.001 ). With a relatively small standard deviation, the effect appears to be comparatively reliable, indicating that left-leaning political attitudes are associated with significantly less pronounced meritocratic beliefs, but only in urban districts.

4.2. Probing the Results: MAUP and Spatial Units

When dealing with spatial data, it is important to consider the implications of how the boundaries of the spatial units under consideration are defined. Issues relating to the modifiable areal unit problem (MAUP) are always present in these cases (Openshaw 1983). As the spatial units we are using to calculate the segregation indices on the district level are relatively small and homogeneous (postcode-8 areas), one might wonder how this might impact the results. The postcode-8 areas are based on a cluster analysis, including physical distances, housing types, businesses in the area, and human settlement structures. They are meant to present comparable and homogeneous spatial units, intended for the purpose of market research. Seeing that there is some inherent homogeneity in how these boundaries are drawn and that we are interested in learning more about the impacts of segregation, some caution regarding the choice of spatial unit is warranted. To further probe our findings, we recalculate the segregation indices based on the postcode areas. These are, of course, drawn up for the distribution of mail and do not necessarily capture the spatial environment as it is experienced by individuals. They do, however, allow us to investigate whether the effects that we find are driven or obscured by our choice of spatial unit.
After recalculating the indices based on the postcode areas, we repeat the analysis. The results for all three indices are presented in Table A2 in the Appendix A. As was to be expected with larger spatial units, the dissimilarity index in particular changes significantly. Compared to the index based on the smaller postcode-8 areas ( m i n = 0.71 and m a x = 1.00 , the dissimilarity index based on the postcode areas has a higher range ( m i n = 0.11 and m a x = 0.96 ). This, of course, is to be expected, as the dissimilarity index tends to be sensitive to smaller spatial units and group sizes and the homogenizing effect of larger spatial units. Importantly, while the effect of the extent of segregation on the distinct level changes notably in strength, the direction of the effect is maintained (model XII, b = 4.87 , S D = 2.28 , p < 0.05 ). The main effect for the isolation index for high-status households remains relatively stable ( b = 6.52 , S D = 2.13 , p < 0.01 for model XV and b = 5.36 , S D = 1.52 , p < 0.001 for model V). We do not find any interaction effects for the models based on the larger spatial units. It appears that while a difference between rural areas remains, it indeed only affects those living in urban areas, with the interaction effect for district type and the dissimilarity index not reaching conventional levels of significance.

5. Discussion

In order to assess the relationship between district-level segregation and meritocratic beliefs in Germany, we combined individual-level data from the German Socio-Economic Panel with district-level indicators derived from microm as well as the INKAR database (BBSR 2023; Goebel et al. 2019). Using linear mixed-effects models, we analyzed how meritocratic beliefs are affected by district-level segregation—measured both in terms of the dissimilarity index based on the number of high- and low-status households, as well as the extent to which these households live in isolation (Bell 1954; Duncan and Duncan 1955; Tivadar 2019). In doing so, we add to the existing findings on local inequality and meritocratic beliefs by probing the relationship in the German context using a different operationalization of local inequality, that is, arguably, closer to the mechanism assumed to underlie the relationship between inequality and meritocratic beliefs.
Our analysis provides somewhat surprising results in that our measure of segregation, based on the microm status variable, is indeed associated with a decrease in meritocratic beliefs, regardless of individual income, but depending on whether the district is urban or rural. Moreover, we find a small negative (but stable) effect of the isolation of high-status households on the district level regarding meritocratic beliefs. In other words, individuals living in districts in which high-status households have a high probability of living within the same spatial unit hold slightly weaker meritocratic beliefs.
Consequently, our results fail to provide support for any of the theories advanced by previous work (Morris et al. 2022; Newman et al. 2015; Solt et al. 2016). Instead, we find some indication that meritocratic beliefs are less pronounced in highly segregated urban areas. We also do not detect any differences based on individual income. In fact, we do not find a significant main effect or significant interaction effects of household income across our measures of district-level segregation. Consequently, and echoing Morris et al. (2022), we find no evidence to support the class conflict hypothesis advanced by Newman et al. (2015). However, we also fail to detect an effect for lower income individuals, as reported by Solt et al. (2016) and Morris et al. (2022). With regard to segregation and for the German context, individual-level income does not appear to mediate the effect of segregation on meritocratic beliefs. This, however, appears to be in line with previous work on meritocratic beliefs held by Germans, emphasizing a high prevalence of work-centered meritocratic ideals across socioeconomic groups (Heuer et al. 2020).
Furthermore, our analysis reveals that meritocratic beliefs are less pronounced in districts where high-status households are isolated. Interestingly, we fail to find a complementary effect of the isolation index for low-status households. There might be more to uncover regrading those areas where high-status households live in isolation. Correspondingly, Sachweh and Sthamer (2019) report that the affluent are most reactive to changes in the level of inequality. However, as we do not find any indication for differences between income groups, the explanation for this phenomenon might lie elsewhere. Possibly, the finding relates to the higher prevalence of high-status households in those districts, increasing their visibility based on numbers alone and making differences in status more tangible. This, in turn, might lead to residents being confronted with an extent of status differentials within districts that they deem to be in violation of the deeply entrenched meritocratic ideal centered on fair remuneration for hard work (Heuer et al. 2020).
In a similar vein, it might be that segregation—when measured in terms of status rather than income inequality—is more visible for all residents. The variable we employ here includes signifiers of status, such as luxury cars, that are easier to witness than stark differences in bank account balances. However, assuming that this might be the case, it seems to be even more surprising that we do not see any differences between status groups, as we would expect these signifiers to have a different impact across income groups (Sands 2017; Sands and de Kadt 2020). Again, as meritocratic beliefs, especially with regard to hard work, are prevalent in Germany (Heuer et al. 2020; Sachweh and Sthamer 2019), being confronted with the visible isolation of high-status groups on the district level and high levels of segregation in urban areas might lead Germans to question these beliefs.
The urban–rural divide in the effect of residential unevenness between groups further points to the potential visibility of differences between status groups. With segregation more prevalent in cities and postcode-8 areas being smaller in urban areas, urban dwellers might simply be more aware of stark differences within their cities. On a side note, our models reveal differences in the effect of political attitudes on meritocratic beliefs for rural and urban residents, echoing previous work (Salomo 2019). This further emphasizes the importance of accounting for differences between rural and urban areas when one is interested in the formation of meritocratic beliefs and political attitudes more generally.
As indicated above, some caution is warranted when interpreting our results. While we did conduct an additional analysis to account for the impact of spatial unit choice, some caution with regard to spatial boundaries is always advisable (Openshaw 1983, 1984). Moreover, the model exhibits some issues with heteroscedasticity and non-normality in the residuals. While Schielzeth et al. (2020) show that mixed-effects models provide robust estimates, even in cases where modeling assumptions are not met, our results should be interpreted with caution. Moreover, German districts vary considerably in size and population density. As discussed above, we nevertheless believe that districts provide a suitable unit for analysis in our case, as they significantly impact many areas of their residents’ lives, in terms of administration, public service, news media, and work. Moreover, German districts appear to be the most suitable spatial unit when one seeks to add to research focusing on US counties and English local authority districts. Moreover, we cannot directly speak to past work, due to differences in operationalization and lack of suitable data. Lastly, as we are relying on marketing data, a degree of uncertainty regarding the variables included in the measure remains.
In sum, our results suggest two things. First, investigating the effects of segregation, isolation, and diversity on meritocratic beliefs is crucial when seeking to uncover the mechanisms underlying the supposed connection between inequality and meritocratic beliefs. Second, focusing on how spatial units might differ apart from levels of inequality—for instance, regarding the urban–rural divide as well as the composition of the district population—is important to account for the complexity of experiences in the local environment.

6. Conclusions

Our results indicate that future research should focus on the relationship between district-level segregation and inequality by investigating whether what matters is interaction, visibility, or both. We find that combining different measures of related concepts might add valuable information. While we do measure status segregation, we are unable to make any predictions on how our results would differ if we analyzed the effect of income inequality or income segregation. Due to limitations in data availability, we were unable to run additional analyses including income inequality and income segregation to test this relationship. In their analysis of US counties, Solt et al. (2016) have previously actively controlled for the impact of segregation by repeating their analysis with a measure of income segregation, and do not report notable differences between measures. For the German context, we would appreciate it if the appropriate data become available to enable such analysis.
As rural areas in general and differences between rural and urban areas specifically tend to be considered less (Linke 2016), future research should focus on these possible differences, especially as sociodemographic changes affect rural and urban areas differently (Immel and Peichl 2020). Doing so might reveal important insights into how the local environment influences beliefs.
Additional factors, that we do not cover here, might influence how individuals interpret and consequently form beliefs about inequality. For instance, encounters with inequality might be interpreted differently, depending on who encounters what (Sands 2017; Sands and de Kadt 2020). Moreover, personal experiences with social mobility might also influence meritocratic beliefs. While a consideration of social mobility was beyond the scope of the present work, controlling for aspects relating to social mobility, specifically perceived social mobility, might be worthwhile (Mijs et al. 2022).
Lastly, our results indicate that a multidimensional conceptualization of local-level inequality or segregation might provide the necessary insights to potentially resolve ongoing theoretical debates. While there certainly is much to be criticized about our dependent variable—primarily the lack of transparency of data sources and methodology inherent in using marketing research data—it nevertheless shows that operationalizing inequality and segregation in a way that goes beyond income is worthwhile and might shed light on the complex relationship between inequality, segregation, and meritocratic beliefs.

Author Contributions

Conceptualization, N.O. and J.G.; methodology, N.O. and J.G.; validation, N.O.; formal analysis, N.O. and J.G.; resources, J.G.; data curation, N.O. and J.G.; writing—original draft, N.O., M.N. and J.G.; writing—review and editing, N.O., M.N. and J.G.; visualization, N.O.; funding acquisition, M.N. and J.G. All authors have read and agreed to the published version of the manuscript.

Funding

This research was funded by the Deutsche Forschungsgemeinschaft (DFG, German Research Foundation)—Project-ID 290045248—SFB 1265.

Institutional Review Board Statement

Not applicable.

Informed Consent Statement

Not applicable.

Data Availability Statement

The analyses rely on data from the German Socio-Economic Panel (SOEP), the Indicators and Maps for Spatial and Urban Development (INKAR), and microm data. The SOEP and the microm data can be accessed for scientific use only after signing data disclosure contracts. The version used is doi:10.5684/soep.core.v37eu. Requests to access these datasets should be directed to diw.de/soeprdc, accessed on 23 March 2023. The INKAR data is publicly available at www.inkar.de, accessed on 23 March 2023.

Conflicts of Interest

The authors declare no conflict of interest.

Appendix A

Table A1. Variable description.
VariableCodingDescription
Meritocratic beliefs0–100“One has to work hard in order to succeed”, agree at all) to 7 (completely agree), rescaled [SOEP data]
Dissimilarity index0–1microm status data, calculated following Duncan and Duncan (1955) [SOEP data]
Isolation index0–1microm status data, calculated following Bell (1954) for both high and low status [SOEP data]
Avg. monthly income per inhabitant (EUR) district-level household income [INKAR data]
Population density district-level total population divided by 10,000 [INKAR data]
Foreign population individuals without German citizenship of total population in % [INKAR data]
Proportion of basic benefits recipients (SGBII)0 = below1 = aboveindividuals without German citizenship of total population in %, dummy coded on 3rd quartile [INKAR data]
Proportion of high-income households0 = below1 = aboveProportion of household with net income above EUR 3600 per month of total population in %, dummy coded on 3rd quartile [INKAR data]
Equivalized monthly household income (EUR 000) OECD equivalized monthly income divided by 1000 [SOEP data]
Duration of residence (years) own calculation [SOEP data]
Region0 = West1 = EastNUTS region (East–West Version), recoded [SOEP data]
District type0 = urban1 = ruralspatial category by BBSR [SOEP data]
Moved in the past year0 = no1 = yesown calculation [SOEP data]
Gender0 = female1 = malefemale = 1, male = 2, recoded [SOEP data]
Migration background0 = none1 = first gen2 = second genmigration background, no migration background = 1, first generation = 2, second generation = 3, recoded [SOEP data]
Age group0 = under 651 = aged 65+Calculated based on year of birth, dummy coded [SOEP data]
University educated0 = degree1 = no degreeCASMIN, recoded, 3a/3b Tertiary Education = 0 [SOEP data]
Unemployed0 = no1 = yesLabor force status, recoded, 1 = registered unemployed [SOEP data]
Religion0 = no1 = yesReligion, non-denominational = 0 [SOEP data]
Political attitude0 = other1 = left-leaning2 = right-leaning“If you think about your own political views: Where would you place yours?”, 0 (left) to 10 (right), recoded to left (0–4), right (6–10), other (5) [SOEP data, 2014]
All data are from 2015 unless otherwise indicated.
Figure A1. Dissimilarity index by district type, 2015. Source: microm, GeoBasis-DE/BKG (2023).
Socsci 12 00376 g0a1
Figure A2. Isolation index (low status) by district type, 2015. Source: microm, GeoBasis-DE/BKG (2023).
Socsci 12 00376 g0a2
Figure A3. Isolation index (high status) by district type, 2015. Source: microm, GeoBasis-DE/BKG (2023).
Socsci 12 00376 g0a3
Figure A4. Interaction effects for dissimilarity index.
Socsci 12 00376 g0a4
Figure A5. Interaction effects for isolation index (low status).
Socsci 12 00376 g0a5
Figure A6. Interaction effects for isolation index (high status).
Socsci 12 00376 g0a6
Table A2. Linear mixed-effect models of meritocratic beliefs in Germany (alternative specification of segregation).
“Dissimilarity Index”“Isolation Index (Low Status)”“Isolation Index (High Status)”
(XI)(XII)(XIII)(XIV)(XV)(XVI)
District level
   (Intercept)78.60 (0.95) *** 80.41 ( 1.47 ) *** 77.43 ( 0.74 ) *** 77.40 ( 0.91 ) *** 78.63 ( 0.70 ) *** 78.52 ( 0.81 ) ***
   Index 1.79 ( 1.21 ) 4.87 ( 2.28 ) * 0.19 ( 2.85 ) 1.36 ( 4.68 ) 6.52 ( 2.13 ) ** 5.52 ( 3.62 )
   Avg. monthly income (EUR 000) 0.29 ( 1.48 ) 0.08 ( 1.52 ) 0.61 ( 1.61 ) 0.72 ( 1.63 ) 2.59 ( 1.80 ) 2.43 ( 1.87 )
   Population density 0.00 ( 0.00 ) 0.00 ( 0.00 ) 0.00 ( 0.00 ) 0.00 ( 0.00 ) 0.00 ( 0.00 ) 0.00 ( 0.00 )
   Foreign population 0.05 ( 0.07 ) 0.06 ( 0.07 ) 0.04 ( 0.07 ) 0.06 ( 0.08 ) 0.06 ( 0.07 ) 0.06 ( 0.07 )
   Basic security benefits (> 12.3%) 1.21 ( 0.57 ) * 0.52 ( 1.60 ) 1.22 ( 0.67 ) 2.40 ( 1.43 ) 1.57 ( 0.58 ) ** 1.67 ( 0.74 ) *
   High-income households (> 24%) 0.80 ( 0.58 ) 1.30 ( 1.90 ) 0.94 ( 0.58 ) 1.29 ( 0.92 ) 0.83 ( 0.58 ) 0.57 ( 0.81 )
   Region: East 1.77 ( 0.66 ) ** 1.89 ( 0.67 ) ** 1.75 ( 0.67 ) ** 1.41 ( 0.75 ) 1.96 ( 0.66 ) ** 1.88 ( 0.70 ) **
   Rural Areas 0.89 ( 0.49 ) 3.47 ( 1.45 ) * 0.84 ( 0.50 ) 1.18 ( 0.74 ) 1.05 ( 0.49 ) * 1.07 ( 0.63 )
Individual level
   Household income (EUR 000) 0.00 ( 0.11 ) 0.53 ( 0.44 ) 0.01 ( 0.11 ) 0.19 ( 0.16 ) 0.02 ( 0.11 ) 0.22 ( 0.19 )
   Moved in the past year 0.37 ( 1.09 ) 0.36 ( 1.09 ) 0.40 ( 1.11 ) 0.41 ( 1.11 ) 0.38 ( 1.11 ) 0.37 ( 1.11 )
   Duration of residence (years) 0.00 ( 0.01 ) 0.00 ( 0.01 ) 0.00 ( 0.01 ) 0.00 ( 0.01 ) 0.00 ( 0.01 ) 0.00 ( 0.01 )
   Male 0.84 ( 0.24 ) *** 0.85 ( 0.24 ) *** 0.85 ( 0.24 ) *** 0.85 ( 0.24 ) *** 0.84 ( 0.24 ) *** 0.85 ( 0.24 ) ***
   First-generation migrant 4.59 ( 0.40 ) *** 4.58 ( 0.40 ) *** 4.62 ( 0.40 ) *** 4.60 ( 0.40 ) *** 4.62 ( 0.40 ) *** 4.61 ( 0.40 ) ***
   Second-generation migrant 4.63 ( 0.58 ) *** 4.61 ( 0.58 ) *** 4.67 ( 0.59 ) *** 4.65 ( 0.59 ) *** 4.67 ( 0.59 ) *** 4.66 ( 0.59 ) ***
   Aged 65+ 2.21 ( 0.36 ) *** 2.20 ( 0.36 ) *** 2.22 ( 0.36 ) *** 2.21 ( 0.36 ) *** 2.23 ( 0.36 ) *** 2.20 ( 0.36 ) ***
   No university degree 3.42 ( 0.32 ) *** 3.40 ( 0.32 ) *** 3.44 ( 0.32 ) *** 3.41 ( 0.32 ) *** 3.39 ( 0.32 ) *** 3.35 ( 0.32 ) ***
   Unemployed 0.98 ( 0.63 ) 0.96 ( 0.63 ) 0.85 ( 0.63 ) 0.77 ( 0.63 ) 0.87 ( 0.63 ) 0.83 ( 0.63 )
   Religious 0.29 ( 0.32 ) 0.28 ( 0.32 ) 0.35 ( 0.32 ) 0.37 ( 0.32 ) 0.32 ( 0.32 ) 0.31 ( 0.32 )
   Left-leaning 2.40 ( 0.30 ) *** 2.40 ( 0.30 ) *** 2.48 ( 0.30 ) *** 2.48 ( 0.30 ) *** 2.46 ( 0.30 ) *** 2.45 ( 0.30 ) ***
   Right-leaning 0.79 ( 0.35 ) * 0.80 ( 0.35 ) * 0.75 ( 0.35 ) * 0.75 ( 0.35 ) * 0.76 ( 0.35 ) * 0.77 ( 0.35 ) *
Interaction terms
   Index × income 0.79 ( 0.64 ) 1.14 ( 0.72 ) 0.77 ( 0.49 )
   Index × rural area 4.61 ( 2.41 ) 2.61 ( 4.17 ) 0.15 ( 4.10 )
   Index × benefits 1.40 ( 2.56 ) 4.86 ( 5.58 ) 0.83 ( 3.24 )
   Index × high income 0.99 ( 3.00 ) 7.80 ( 8.81 ) 1.55 ( 3.77 )
Num. obs.21,26321,26321,05921,05921,05921,059
Num. groups: hid:kkz_rek13,32513,32513,19213,19213,19213,192
Num. groups: kkz_rek388388387387387387
Var: hid:kkz_rek (Intercept) 85.81 85.84 85.40 85.39 85.50 85.55
Var: kkz_rek (Intercept) 4.30 4.26 4.43 4.35 4.18 4.27
Var: Residual 267.45 267.43 267.44 267.46 267.32 267.27
*** p < 0.001 ; ** p < 0.01 ; * p < 0.05 . Source: SOEP.v37 and microm data. Table generated using the R texreg package by Leifeld (2013).

Notes

1
District boundaries based on the jurisdictional boundaries present on 31 December 2017, provided by the time-series data by INKAR.
2
The Research Data Center of the Federal Statistical Office is currently examining the possibility of further re-use of the data.
3
While there certainly is a case to be made for the inclusion of additional facets playing into how individuals think about inequality—as is demonstrated by Mijs (2019), who includes a measure of structural beliefs—we opt to focus thoroughly on work-based meritocratic beliefs.As beliefs about work-based and structural factors of inequality are complementary (Mijs 2018), we believe the choice is justified.
4
While there is some debate regarding treating scale items as continuous (Schröder and Yitzhaki 2017), it is considered to be feasible when there are more than five categories, as is the case here (Frijters et al. 2004).
5
For example, studies from Dittmann and Goebel (2010); Knies (2010); Sager (2012) already used the SOEP data in combination with microm data.

References

  1. Adriaans, Jule, Sandra Bohmann, Matteo Targa, Stefan Liebig, Thomas Hinz, Guillermina Jasso, Bernhard Kittel, and Clara Sabbagh. 2020. Justice and Fairness in Europe: Topline Results from Round 9 of the European Social Survey. Technical Report 10. London: European Social Survey. [Google Scholar]
  2. Ahrens, Leo. 2019. Theorizing the Impact of Fairness Perceptions on the Demand for Redistribution. Political Research Exchange 1: 1–17. [Google Scholar] [CrossRef] [Green Version]
  3. Almås, Ingvild, Alexander W. Cappelen, Erik Sørensen, and Bertil Tungodden. 2022. Attitudes to Inequality: Preferences and Beliefs. In IFS Deaton Review of Inequalities. London: The Institute for Fiscal Studies. [Google Scholar]
  4. Baba, Ludger, and Katrin Wilbert. 2022. Soziale Stadt- und Ortsentwicklung in ländlichen Räumen. Bonn: BBSR Online-Publikation, Bundesinstitut für Bau-, Stadt- und Raumforsschung. [Google Scholar]
  5. Bailey, Nick, Maria Gannon, Ade Kearns, Mark Livingston, and Alastair H. Leyland. 2013. Living Apart, Losing Sympathy? How Neighbourhood Context Affects Attitudes to Redistribution and to Welfare Recipients. Environment and Planning A: Economy and Space 45: 2154–75. [Google Scholar] [CrossRef] [Green Version]
  6. Barth, Denise, Jonas Jessen, Christa Katharina Spieß, and Katharina Wrohlich. 2020. Mütter in Ost und West: Angleichung bei Erwerbstätigenquoten und Einstellungen, nicht bei Vollzeiterwerbstätigkeit. DIW Wochenbericht 87: 699–706. [Google Scholar] [CrossRef]
  7. Bates, Douglas, Martin Mächler, Ben Bolker, and Steve Walker. 2015. Fitting Linear Mixed-Effects Models Using lme4. Journal of Statistical Software 67: 1–48. [Google Scholar] [CrossRef]
  8. BBSR. 2023. INKAR—Indikatoren und Karten zur Raum- und Stadtentwicklung. Available online: www.inkar.de (accessed on 23 March 2023).
  9. Becker, Rolf, and Andreas Hadjar. 2011. Meritokratie: Zur gesellschaftlichen Legitimation ungleicher Bildungs-, Erwerbs- und Einkommenschancen in modernen Gesellschaften. In Lehrbuch der Bildungssoziologie. Edited by Rolf Becker. Wiesbaden: VS Verlag für Sozialwissenschaften, pp. 37–62. [Google Scholar] [CrossRef]
  10. Bell, W. 1954. A Probability Model for the Measurement of Ecological Segregation. Social Forces 32: 357–64. [Google Scholar] [CrossRef]
  11. Bernardo, Allan B. I. 2021. Meritocracy Beliefs and Intolerance Towards Wealth Inequality among Higher Subjective Social Status Filipinos. International Journal of Social Psychology 36: 397–423. [Google Scholar] [CrossRef]
  12. Bjørnskov, Christian, Axel Dreher, Justina A.V. Fischer, Jan Schnellenbach, and Kai Gehring. 2013. Inequality and happiness: When perceived social mobility and economic reality do not match. Journal of Economic Behavior & Organization 91: 75–92. [Google Scholar] [CrossRef] [Green Version]
  13. Bottero, Wendy. 2020. A Sense of Inequality. Transforming Capitalism. London: Rowman & Littlefield International. [Google Scholar]
  14. Brunori, Paolo, Francisco H. G. Ferreira, and Vito Peragine. 2013. Inequality of Opportunity, Income Inequality, and Economic Mobility: Some International Comparisons. In Getting Development Right Structural Transformation, Inclusion, and Sustainability in the Post-Crisis Era. Edited by Eva Paus. New York: Palgrave Macmillan. [Google Scholar]
  15. Bublitz, Elisabeth. 2022. Misperceptions of Income Distributions: Cross-Country Evidence from a Randomized Survey Experiment. Socio-Economic Review 20: 435–62. [Google Scholar] [CrossRef]
  16. Butterwege, Christoph. 2015. Hartz IV und die Folgen. Gesundheits- und Sozialpolitik 69: 38–53. [Google Scholar] [CrossRef]
  17. Cunningham, Niall, and Mike Savage. 2015. The Secret Garden? Elite Metropolitan Geographies in the Contemporary UK. The Sociological Review 63: 321–48. [Google Scholar] [CrossRef] [Green Version]
  18. Dauth, Wolfgang, and Peter Haller. 2018. Berufliches Pendeln zwischen Wohn- und Arbeitsort: Klarer Trend zu längeren Pendeldistanzen. IAB Kurzbericht No. 10/2018. Nürnberg: Institut für Arbeitsmarkt- und Berufsforschung. [Google Scholar]
  19. Dittmann, Jörg, and Jan Goebel. 2010. Your House, Your Car, Your Education: The Socioeconomic Situation of the Neighborhood and its Impact on Life Satisfaction in Germany. Social Indicators Research 96: 497–513. [Google Scholar] [CrossRef]
  20. Duclos, Jean-Yves, Joan Esteban, and Debraj Ray. 2004. Polarization: Concepts, Measurement, Estimation. Econometrica 72: 1737–72. [Google Scholar] [CrossRef] [Green Version]
  21. Duncan, Otis Dudley, and Beverly Duncan. 1955. A Methodological Analysis of Segregation Indexes. American Sociological Review 20: 210–17. [Google Scholar] [CrossRef]
  22. Elff, Martin, and Sigrid Roßteutscher. 2016. Parteiwahl und Nichtwahl: Zur Rolle sozialer Konfliktlinien. In Wahlen und Wähler. Edited by Harald Schoen and Bernhard Weßels. Wiesbaden: Springer Fachmedien Wiesbaden, pp. 45–69. [Google Scholar]
  23. Enos, Ryan D. 2017. The Space between Us: Social Geography and Politics. Cambridge: Cambridge University Press. [Google Scholar]
  24. Eurofound. 2021. Wealth Distribution and Social Mobility. Technical Report. Luxembourg: Publications Office of the European Union. [Google Scholar]
  25. Eurostat. 2023. Living Conditions in Europe—Income Distribution and Income Inequality. Available online: https://ec.europa.eu/eurostat/statistics-explained/index.php?title=Living_conditions_in_Europe_-_income_distribution_and_income_inequality (accessed on 22 March 2023).
  26. Fastenrath, Florian, Paul Marx, Achim Truger, and Helena Vitt. 2022. Why Is It So Difficult to Tax the Rich? Evidence from German Policy-Makers. Journal of European Public Policy 29: 767–86. [Google Scholar] [CrossRef]
  27. Franko, William W., and Avery C. Livingston. 2020. Economic Segregation and Public Support for Redistribution. The Social Science Journal 59: 1–19. [Google Scholar] [CrossRef]
  28. Frijters, Paul, John P. Haisken-Denew, and Michael A. Shields. 2004. Money Does Matter! Evidence from Increasing Real Income and Life Satisfaction in East Germany Following Reunification. American Economic Review 94: 730–40. [Google Scholar] [CrossRef] [Green Version]
  29. Galster, George, and Patrick Sharkey. 2017. Spatial Foundations of Inequality: A Conceptual Model and Empirical Overview. RSF: The Russell Sage Foundation Journal of the Social Sciences 3: 1–33. [Google Scholar] [CrossRef]
  30. García-Castro, Juan Diego, Rosa Rodríguez-Bailón, and Guillermo B. Willis. 2020. Perceiving Economic Inequality in Everyday Life Decreases Tolerance to Inequality. Journal of Experimental Social Psychology 90: 104019. [Google Scholar] [CrossRef]
  31. García-Sánchez, Efraín, Danny Osborne, Guillermo B. Willis, and Rosa Rodríguez-Bailón. 2020. Attitudes Towards Redistribution and the Interplay between Perceptions and Beliefs about Inequality. British Journal of Social Psychology 59: 111–36. [Google Scholar] [CrossRef]
  32. Goebel, Jan, Markus M. Grabka, Stefan Liebig, Martin Kroh, David Richter, Carsten Schröder, and Jürgen Schupp. 2019. The German Socio-Economic Panel (SOEP). Jahrbücher für Nationalökonomie und Statistik 239: 345–60. [Google Scholar] [CrossRef] [Green Version]
  33. Goebel, Jan, Martin Gornig, and Hartmut Häußermann. 2010. Polarisierung der Einkommen: Die Mittelschicht verliert. DIW Wochenbericht 77: 2–8. [Google Scholar]
  34. Goebel, Jan, and Lukas Hoppe. 2015. Ausmaß und Trends sozialräumlicher Segregation in Deutschland: Abschlussbericht. Technical Report. Berlin: Bundesministerium für Arbeit und Soziales. [Google Scholar]
  35. Grabka, Markus M., and Carsten Schröder. 2019. The Low-Wage Sector in Germany Is Larger Than Previously Assumed. DIW Weekly Report 9: 117–24. [Google Scholar] [CrossRef]
  36. Grabka, Markus M., and Christian Westermeier. 2015. Persistently High Wealth Inequality in Germany. DIW Economic Bulletin 13: 459–86. [Google Scholar] [CrossRef] [Green Version]
  37. Groh-Samberg, Olaf, Theresa Büchler, and Jean-Yves Gerlitz. 2020. Soziale Lagen in Multidimensionaler Längsschnittbetrachtung. Technical Report. Berlin: Bundesministerium für Arbeit und Soziales. [Google Scholar]
  38. Gunlicks, Arthur B. 2003. Administrative Structures in Germany. In The Länder and German Federalism. Manchester: Manchester University Press, pp. 81–140. [Google Scholar]
  39. Helbig, Marcel, and Stefanie Jähnen. 2018. Wie brüchig ist die soziale Architektur unserer Städte? Trends und Analysen der Segregation in 74 deutschen Städten. Technical Report. Berlin: Wissenschaftszentrum Berlin für Sozialforschung. [Google Scholar]
  40. Heuer, Jan-Ocko, Thomas Lux, Steffen Mau, and Katharina Zimmermann. 2020. Legitimizing Inequality: The Moral Repertoires of Meritocracy in Four Countries. Comparative Sociology 19: 542–84. [Google Scholar] [CrossRef]
  41. Huijsmans, Twan, Eelco Harteveld, Wouter van der Brug, and Bram Lancee. 2021. Are Cities Ever More Cosmopolitan? Studying Trends in Urban-Rural Divergence of Cultural Attitudes. Political Geography 86: 102353. [Google Scholar] [CrossRef]
  42. Immel, Lea, and Andreas Peichl. 2020. Regionale Ungleichheit in Deutschland: Wo leben die Reichen und wo die Armen? ifo Schnelldienst 73: 43–47. [Google Scholar]
  43. Irwin, Sarah. 2018. Lay Perceptions of Inequality and Social Structure. Sociology 52: 211–27. [Google Scholar] [CrossRef] [Green Version]
  44. Kluegel, James R., and Eliot R. Smith. 1986. Beliefs about Inequality: Americans’ Views of What Is and What Ought to Be. Social Institutions and Social Change. New York: A. de Gruyter. [Google Scholar]
  45. Knies, Gundi. 2010. Income Comparisons among Neighbours and Life Satisfaction in East and West Germany. Social Indicators Research 106: 471–89. [Google Scholar] [CrossRef]
  46. Lamont, Michèle, and Paul Pierson. 2019. Inequality Generation & Persistence as Multidimensional Processes: An Interdisciplinary Agenda. Daedalus 148: 5–18. [Google Scholar] [CrossRef]
  47. Larsen, Christian Albrekt. 2016. How Three Narratives of Modernity Justify Economic Inequality. Acta Sociologica 59: 93–111. [Google Scholar] [CrossRef] [Green Version]
  48. Leifeld, Philip. 2013. texreg: Conversion of Statistical Model Output in to L A T E X and HTML Tables. Journal of Statistical Software 55: 1–24. [Google Scholar] [CrossRef] [Green Version]
  49. Lierse, Hanna. 2019. Why is There Not More Demand for Redistribution? Cross-National Evidence for the Role of Social Justice Beliefs. International Journal of Public Opinion Research 31: 121–41. [Google Scholar] [CrossRef]
  50. Linke, Simone. 2016. Sozialräumliche Segregation in ländlich bezeichneten Räumen. In Fraktale Metropolen. Edited by Florian Weber and Olaf Kühne. Wiesbaden: Springer Fachmedien Wiesbaden, pp. 245–70. [Google Scholar]
  51. Massey, Douglas S., and Nancy A. Denton. 1988. The Dimensions of Residential Segregation. Social Forces 67: 281. [Google Scholar] [CrossRef]
  52. McCall, Leslie, Derek Burk, Marie Laperrière, and Jennifer A. Richeson. 2017. Exposure to Rising Inequality Shapes Americans’ Opportunity Beliefs and Policy Support. Proceedings of the National Academy of Sciences of the United States of America 114: 9593–98. [Google Scholar] [CrossRef] [Green Version]
  53. McCall, Leslie, and Fiona Chin. 2013. Does Knowledge of Inequality Affect Beliefs about Inequality? In Proceedings of the Midwest Political Science Association Meeting, Chicago, IL, USA, April 13. [Google Scholar]
  54. microm. 2019. Das Datenhandbuch 2019. Technical Report. Neuss: Micromarketing-Systeme und Consult GmbH. [Google Scholar]
  55. Mijs, Jonathan. 2018. Inequality Is a Problem of Inference: How People Solve the Social Puzzle of Unequal Outcomes. Societies 8: 64. [Google Scholar] [CrossRef] [Green Version]
  56. Mijs, Jonathan. 2019. The Paradox of Inequality: Income Inequality and Belief in Meritocracy Go Hand in Hand. Socio-Economic Review 19: 7–35. [Google Scholar] [CrossRef] [Green Version]
  57. Mijs, Jonathan J.B., and Mike Savage. 2020. Meritocracy, Elitism and Inequality. The Political Quarterly 91: 397–404. [Google Scholar] [CrossRef] [Green Version]
  58. Mijs, Jonathan J.B., Stijn Daenekindt, Willem de Koster, and Jeroen van der Waal. 2022. Belief in Meritocracy Reexamined: Scrutinizing the Role of Subjective Social Mobility. Social Psychology Quarterly 85: 131–41. [Google Scholar] [CrossRef]
  59. Minkoff, Scott L., and Jeffrey Lyons. 2019. Living with Inequality: Neighborhood Income Diversity and Perceptions of the Income Gap. American Politics Research 47: 329–61. [Google Scholar] [CrossRef]
  60. Mooser, Barbara. 2022. 79 Einkommens-Millionäre im Landkreis Ebersberg. Süddeutsche Zeitung Online. Available online: https://www.sueddeutsche.de/muenchen/ebersberg/millionaere-landkreis-ebersberg-statistik-1.5640206 (accessed on 16 August 2022).
  61. Morris, Katy, Felix Bühlmann, Nicolas Sommet, and Leen Vandecasteele. 2022. The Paradox of Local Inequality: Meritocratic Beliefs in Unequal Localities. The British Journal of Sociology 73: 421–60. [Google Scholar] [CrossRef]
  62. Newman, Benjamin J., Christopher D. Johnston, and Patrick L. Lown. 2015. False Consciousness or Class Awareness? Local Income Inequality, Personal Economic Position, and Belief in American Meritocracy. American Journal of Political Science 59: 326–40. [Google Scholar] [CrossRef]
  63. Niehues, Judith. 2016. Ungleichheit: Wahrnehmung und Wirklichkeit – Ein internationaler Vergleich. Wirtschaftsdienst 96: 13–18. [Google Scholar] [CrossRef] [Green Version]
  64. Niehues, Judith. 2019. Wunsch und Wirklichkeit—Subjektive Umverteilungspräferenzen in Deutschland. IW Trends 46: 79–98. [Google Scholar] [CrossRef]
  65. Noll, Heinz-Herbert, and Friedrich Schuster. 1992. Soziale Schichtung: Niedrige Einstufung der Ostdeutschen: Wahrnehmung und Bewertung Sozialer Ungleichheit im Ost-West-Vergleich. Informationsdienst Soziale Indikatoren 7: 1–6. [Google Scholar] [CrossRef]
  66. Openshaw, Stan. 1983. The Modifiable Areal Unit Problem. Number 38 in Concepts and Techniques in Modern Geography. Norwich: Geo Books. [Google Scholar]
  67. Openshaw, Stan. 1984. Ecological Fallacies and the Analysis of Areal Census Data. Environment and Planning A: Economy and Space 16: 17–31. [Google Scholar] [CrossRef] [Green Version]
  68. Reardon, Sean F., and Kendra Bischoff. 2011. Income Inequality and Income Segregation. American Journal of Sociology 116: 1092–1153. [Google Scholar] [CrossRef] [Green Version]
  69. Sachweh, Patrick, and Evelyn Sthamer. 2019. Why Do the Affluent Find Inequality Increasingly Unjust? Changing Inequality and Justice Perceptions in Germany, 1994–2014. European Sociological Review 35: 651–68. [Google Scholar] [CrossRef]
  70. Sager, Lutz. 2012. Residential Segregation and Socioeconomic Neighbourhood Sorting: Evidence at the Micro-neighbourhood Level for Migrant Groups in Germany. Urban Studies 49: 2617–32. [Google Scholar] [CrossRef]
  71. Salomo, Katja. 2019. The Residential Context as Source of Deprivation: Impacts on the Local Political Culture. Evidence from the East German State Thuringia. Political Geography 69: 103–17. [Google Scholar] [CrossRef]
  72. Sandberger, Johann-Ulrich. 1983. Zwischen Legitimation und Kritik. Vorstellungen von Akademikern, Studenten und Bevölkerung zur sozialen Ungleichheit. Zeitschrift für Soziologie 12: 181–202. [Google Scholar] [CrossRef]
  73. Sands, Melissa L. 2017. Exposure to inequality affects support for redistribution. Proceedings of the National Academy of Sciences of the United States of America 114: 663–68. [Google Scholar] [CrossRef] [PubMed] [Green Version]
  74. Sands, Melissa L., and Daniel de Kadt. 2020. Local Exposure to Inequality Raises Support of People of Low Wealth for Taxing the Wealthy. Nature 586: 257–61. [Google Scholar] [CrossRef] [PubMed]
  75. Savage, Mike, and Elizabeth B. Silva. 2013. Field Analysis in Cultural Sociology. Cultural Sociology 7: 111–26. [Google Scholar] [CrossRef]
  76. Schielzeth, Holger, Niels J. Dingemanse, Shinichi Nakagawa, David F. Westneat, Hassen Allegue, Céline Teplitsky, Denis Réale, Ned A. Dochtermann, László Zsolt Garamszegi, and Yimen G. Araya-Ajoy. 2020. Robustness of Linear Mixed-Effects Models to Violations of Distributional Assumptions. Methods in Ecology and Evolution 11: 1141–52. [Google Scholar] [CrossRef]
  77. Schröder, Carsten, and Shlomo Yitzhaki. 2017. Revisiting the Evidence for Cardinal Treatment of Ordinal Variables. European Economic Review 92: 337–58. [Google Scholar] [CrossRef] [Green Version]
  78. Schäfer, Armin, Hanna Schwander, and Philip Manow. 2016. Die sozial “auffälligen” Nichtwähler: Determinanten der Wahlenthaltung bei der Bundestagswahl 2013. In Wähler und Wahlen. Edited by Harald Schoen and Bernhard Weßels. Wiesbaden: Springer Fachmedien Wiesbaden. [Google Scholar]
  79. Solt, Frederick, Yue Hu, Kevan Hudson, Jungmin Song, and Dong “Erico” Yu. 2016. Economic Inequality and Belief in Meritocracy in the United States. Research anf Politics 3: 1–7. [Google Scholar] [CrossRef] [Green Version]
  80. Tivadar, Mihai. 2019. OasisR: An RPackage to Bring Some Order to the World of Segregation Measurement. Journal of Statistical Software 89: 1–39. [Google Scholar] [CrossRef] [Green Version]
  81. Tóth, Gergő, Johannes Wachs, Riccardo Di Clemente, Ákos Jakobi, Bence Ságvári, János Kertész, and Balázs Lengyel. 2021. Inequality is rising where social network segregation interacts with urban topology. Nature Communications 12: 1143. [Google Scholar] [CrossRef]
  82. Wilkinson, Richard G., and Kate Pickett. 2011. The Spirit Level: Why Greater Equality Makes Societies Stronger, Paperback ed. New York, London, Oxford, New Delhi and Sydney: Bloomsbury Press. [Google Scholar]
  83. Windsteiger, Lisa. 2022. The Redistributive Consequences of Segregation and Misperceptions. European Economic Review 144: 104073. [Google Scholar] [CrossRef]
  84. Young, Michael. 1958. The Rise of the Meritocracy 1870–2033: An Essay on Education and Equality. Harmondsworth: Penguin Books Ltd. [Google Scholar]
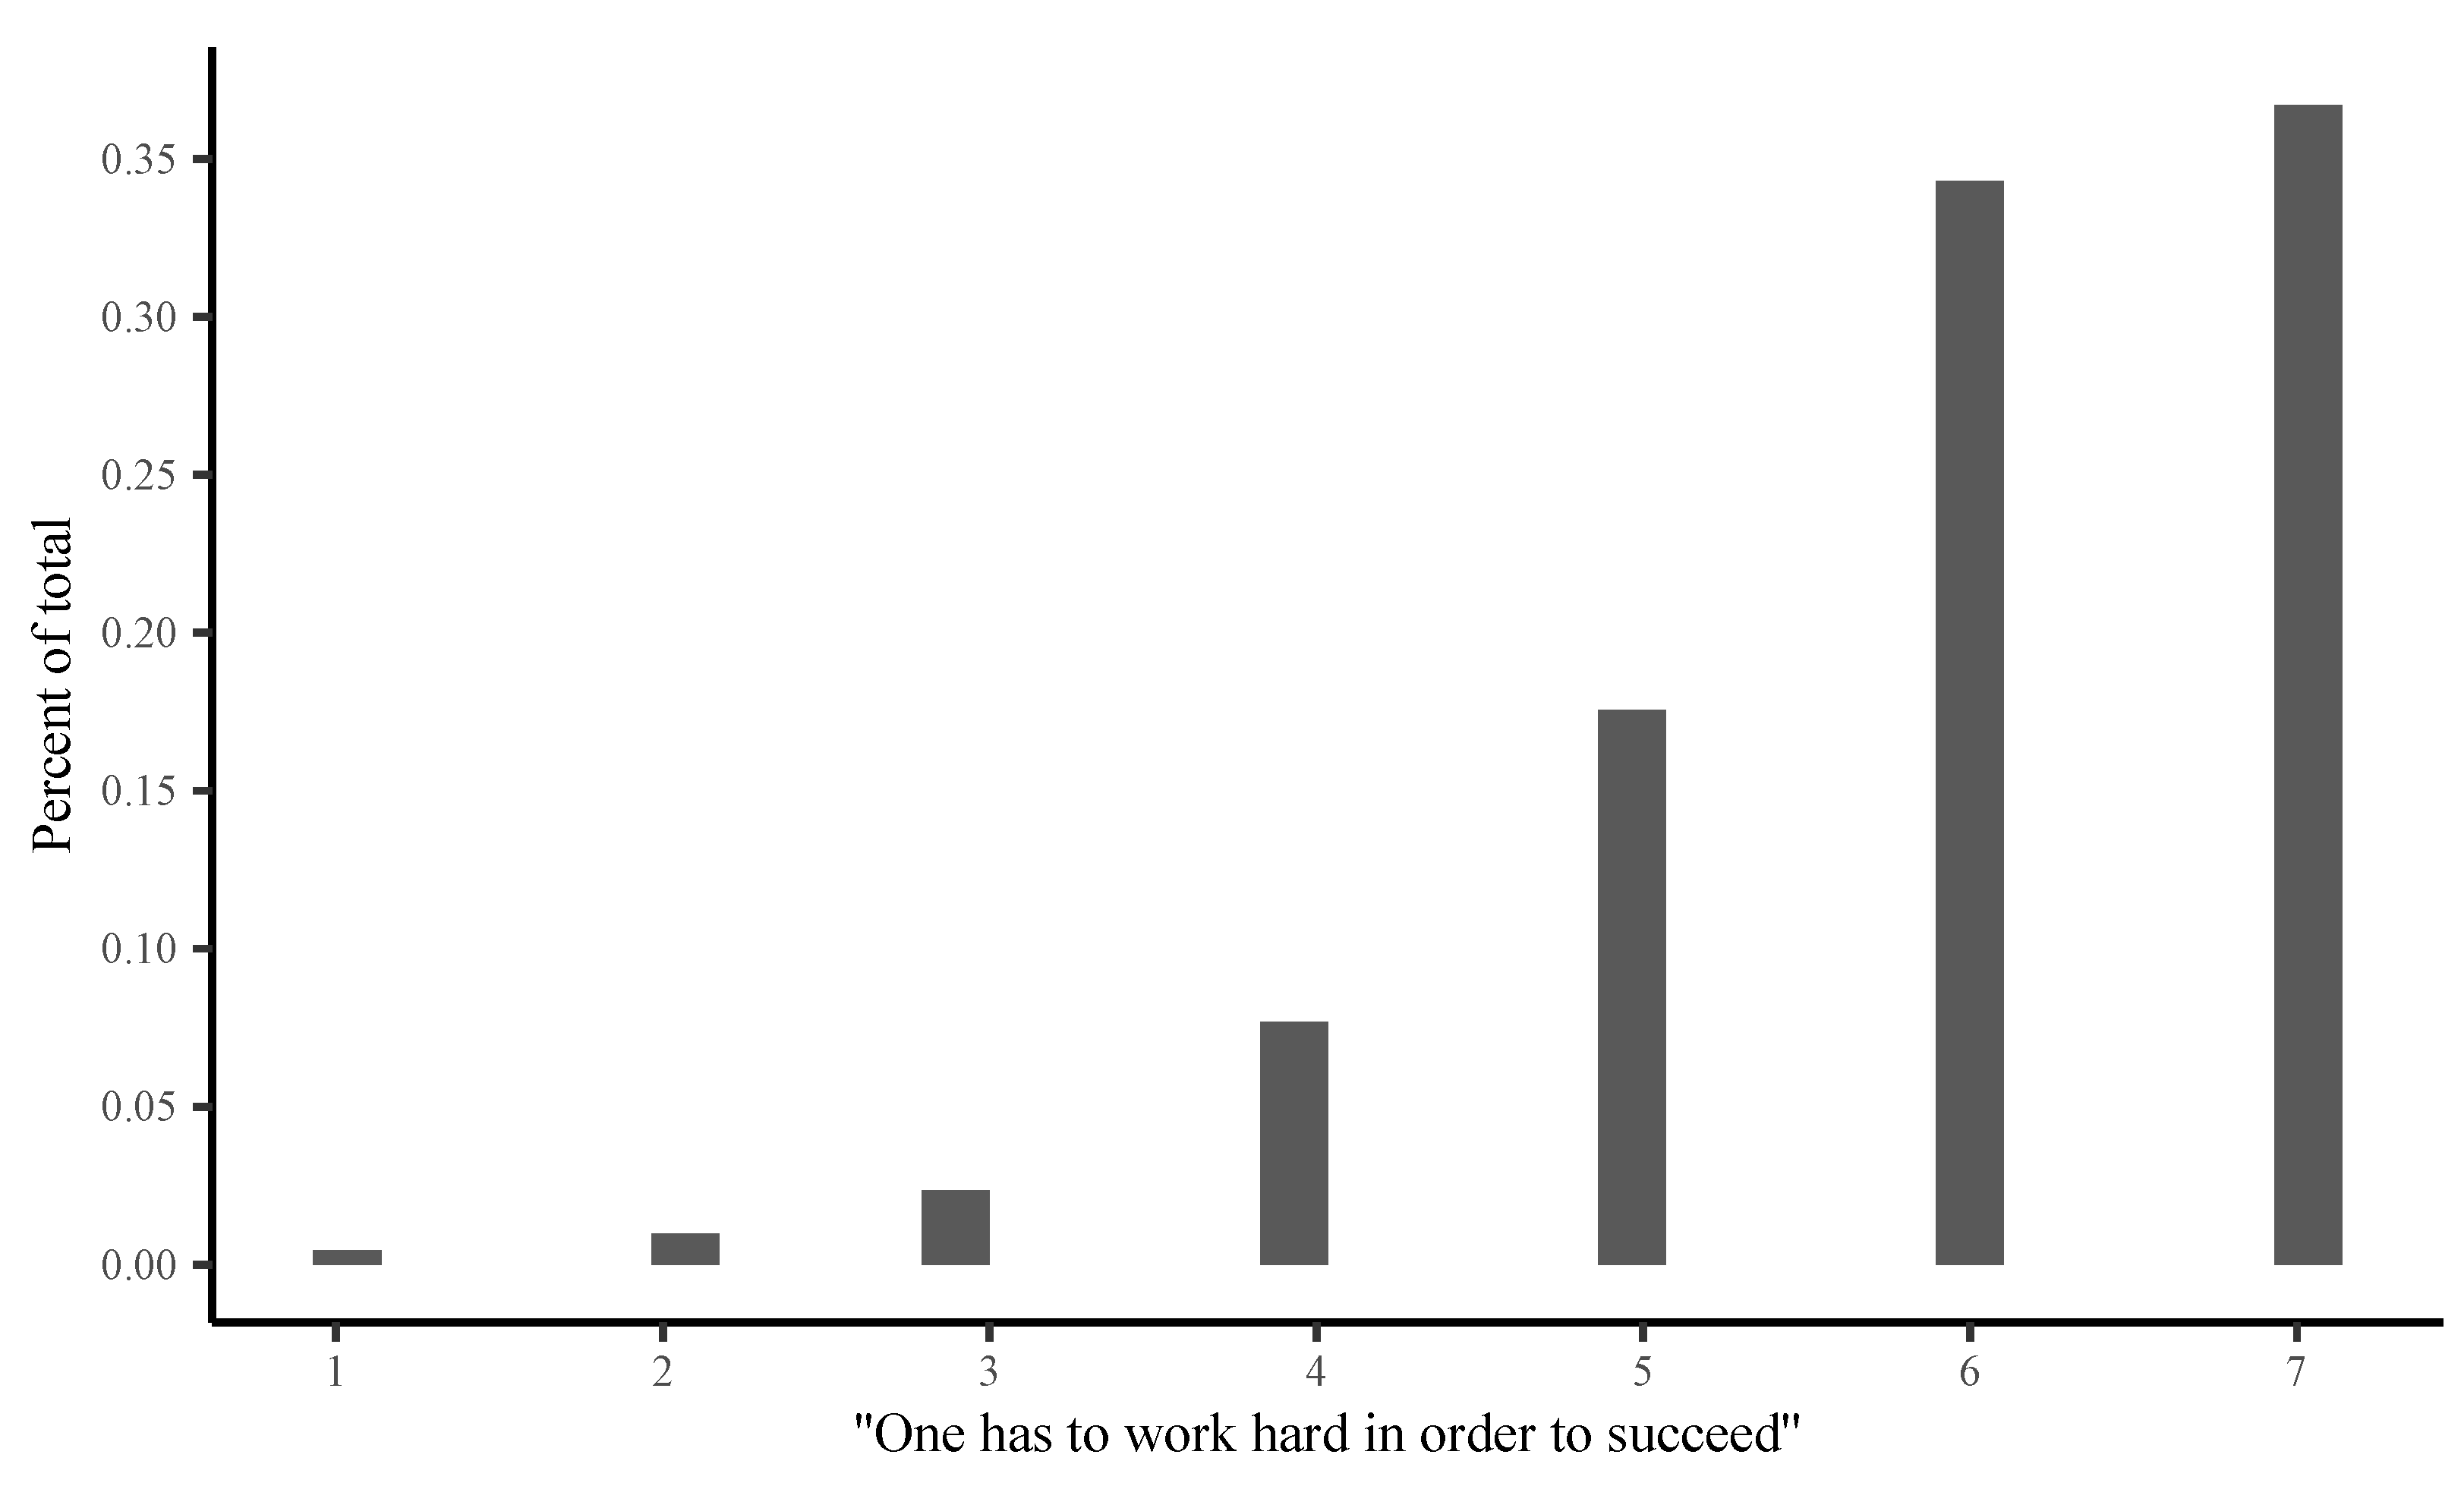
Figure 1. Histogram of meritocratic beliefs, 2015. Source: SOEP.v37.
Socsci 12 00376 g001
Figure 2. Segregation indices by districts, 2015. Source: microm, GeoBasis-DE/BKG (2023).
Socsci 12 00376 g002
Table 1. Comparison of theories.
TheoryMain AssumptionMechanismAnticipated Results
“Conflict Theory” (Newman et al. 2015)Individuals hold latent class attitudes that influence their meritocratic beliefs. They are activated when inequality increases.As inequality increases, it becomes more salient, heightening class consciousness, leading lower-/upper-class individuals to be critical/supportive of inequality.When inequality is high, meritocratic beliefs decrease among the poor and increase among the affluent.
“Relative Power Theory” Solt et al. (2016)Social discourses are influenced by power relations. When inequality increases, discourses change.As inequality increases, so does the influence of those in power on public discourse, leading to an increase in meritocratic beliefs.When inequality is high, meritocratic beliefs are high, especially among the poor.
“Contact Theory” Mijs (2018)Higher inequality leads to more segregation between social groups, limiting contact. Interactions within a heterogeneous social group foster skepticism toward meritocratic principles.Rising inequality leads to increased segregation which in turn limits intergroup contact and increases meritocratic beliefs.When groups are segregated, meritocratic beliefs increase.
Table 2. Meritocratic beliefs and local inequality.
AuthorsCountrySpatial UnitMeasureFindings
Newman et al. (2015)USACountiesGiniHigher levels of inequality are associated with stronger meritocratic beliefs among the affluent and weaker meritocratic beliefs among the poor.
Solt et al. (2016)USACountiesGiniHigh levels of inequality are associated with stronger meritocratic beliefs, but only for low-income individuals.
Morris et al. (2022)EnglandLSOASGini 80:20 ratioHigh levels of inequality are associated with stronger meritocratic beliefs, but only for low-income individuals
It should be noted that Solt et al. (2016) provide a critique and re-assessment of (Newman et al. 2015). For an overview of covariates of inequality beliefs, see (Mijs 2018).
Table 3. Descriptive statistics.
VariableNMeanStd. Dev.MinMedianMax
Meritocratic Beliefs21,39581.7619.170.0083.33100.00
District level
Dissimilarity index21,3950.940.0440.710.951.00
Isolation index (poor)21,3950.450.200.0210.480.82
Isolation index (rich)21,3950.350.220.0270.320.88
Avg. disposable monthly income p.p. (000 €)21,3951.730.211.271.722.99
Population density21,395898.461138.7236.27304.014668.11
Foreign population21,39510.105.671.909.0233.60
Proportion of SGBII recipients21,3959.194.851.098.4023.79
Proportion of high-income households21,39520.305.739.1919.8547.61
Region21,395
 West16,22776%
 East516824%
District type21,395
 urban13,75464%
 rural764136%
Individual level
OECD equivalized household income (EUR 000)21,3951.971.340.000941.7169.41
Moved in the past year21,395
 did not move21,04698%
 moved3492%
Duration of residence (years)21,39513.0612.7416100
Gender21,395
 female11,53354%
 male986246%
Migration background21,395
 none16,77178%
 first generation343116%
 second generation11936%
Age group21,395
 aged under 6416,49477%
 aged 65+490123%
University educated21,395
 university degree551226%
 no university degree15,88374%
Unemployed21,395
 not unemployed20,39995%
 unemployed9965%
Religion21,395
 not religious719834%
 religious14,19766%
Political attitude21,395
 other947344%
 left-leaning742235%
 right-leaning450021%
Source: SOEP.v37 and microm.
Table 4. Linear mixed-effect models of meritocratic beliefs.
“One Has to Work Hard in Order to Succeed”
“Dissimilarity Index”“Isolation Index (Low Status)”“Isolation Index (High Status)”
(I)(II)(III)(IV)(V)(VI)
District level
   (Intercept)86.78 (4.84) *** 101.61 ( 8.99 ) *** 77.89 ( 0.86 ) *** 78.98 ( 1.18 ) *** 79.42 ( 0.80 ) *** 79.20 ( 0.97 ) ***
   Index 9.97 ( 5.14 ) 25.49 ( 9.55 ) ** 0.99 ( 1.50 ) 3.27 ( 2.40 ) 5.36 ( 1.52 ) *** 4.37 ( 2.33 )
   Avg. monthly income (EUR 000) 0.31 ( 1.47 ) 0.48 ( 1.50 ) 1.11 ( 1.51 ) 1.40 ( 1.55 ) 1.62 ( 1.59 ) 1.79 ( 1.67 )
   Population density 0.00 ( 0.00 ) 0.00 ( 0.00 ) 0.00 ( 0.00 ) 0.00 ( 0.00 ) 0.00 ( 0.00 ) 0.00 ( 0.00 )
   Foreign population 0.03 ( 0.07 ) 0.03 ( 0.07 ) 0.03 ( 0.07 ) 0.04 ( 0.07 ) 0.03 ( 0.07 ) 0.03 ( 0.07 )
   Basic security benefits (>12.3%) 1.34 ( 0.57 ) * 4.29 ( 11.98 ) 1.26 ( 0.59 ) * 0.66 ( 2.45 ) 1.57 ( 0.57 ) ** 2.01 ( 0.90 ) *
   High-income households (>24%) 0.73 ( 0.58 ) 7.23 ( 11.53 ) 0.97 ( 0.58 ) 1.62 ( 1.16 ) 0.89 ( 0.57 ) 0.07 ( 1.03 )
   Region: East 2.08 ( 0.68 ) ** 2.03 ( 0.68 ) ** 1.85 ( 0.68 ) ** 1.52 ( 0.74 ) * 1.83 ( 0.65 ) ** 1.80 ( 0.69 ) **
   Rural Areas 0.99 ( 0.49 ) * 28.52 ( 9.42 ) ** 0.87 ( 0.49 ) 2.21 ( 1.02 ) * 1.21 ( 0.49 ) * 1.44 ( 0.82 )
Individual level
   Household income (EUR 000) 0.00 ( 0.11 ) 3.75 ( 2.71 ) 0.00 ( 0.11 ) 0.24 ( 0.23 ) 0.01 ( 0.11 ) 0.29 ( 0.26 )
   Moved in the past year 0.27 ( 1.08 ) 0.23 ( 1.08 ) 0.28 ( 1.08 ) 0.30 ( 1.08 ) 0.25 ( 1.08 ) 0.23 ( 1.08 )
   Duration of residence (years) 0.00 ( 0.01 ) 0.00 ( 0.01 ) 0.00 ( 0.01 ) 0.00 ( 0.01 ) 0.00 ( 0.01 ) 0.00 ( 0.01 )
   Male 0.85 ( 0.24 ) *** 0.85 ( 0.24 ) *** 0.86 ( 0.24 ) *** 0.86 ( 0.24 ) *** 0.85 ( 0.24 ) *** 0.86 ( 0.24 ) ***
   First generation migrant 4.64 ( 0.40 ) *** 4.60 ( 0.40 ) *** 4.63 ( 0.40 ) *** 4.60 ( 0.40 ) *** 4.62 ( 0.40 ) *** 4.61 ( 0.40 ) ***
   Second generation migrant 4.56 ( 0.58 ) *** 4.54 ( 0.58 ) *** 4.56 ( 0.58 ) *** 4.53 ( 0.58 ) *** 4.56 ( 0.58 ) *** 4.55 ( 0.58 ) ***
   Aged 65+ 2.21 ( 0.35 ) *** 2.20 ( 0.35 ) *** 2.21 ( 0.35 ) *** 2.20 ( 0.35 ) *** 2.21 ( 0.35 ) *** 2.19 ( 0.35 ) ***
   No university degree 3.42 ( 0.32 ) *** 3.38 ( 0.32 ) *** 3.44 ( 0.32 ) *** 3.41 ( 0.32 ) *** 3.38 ( 0.32 ) *** 3.35 ( 0.32 ) ***
   Unemployed 0.99 ( 0.62 ) 0.96 ( 0.62 ) 0.98 ( 0.62 ) 0.92 ( 0.63 ) 1.00 ( 0.62 ) 0.96 ( 0.63 )
   Religious 0.29 ( 0.32 ) 0.26 ( 0.32 ) 0.31 ( 0.32 ) 0.32 ( 0.32 ) 0.27 ( 0.32 ) 0.26 ( 0.32 )
   Left-leaning 2.37 ( 0.30 ) *** 2.37 ( 0.30 ) *** 2.38 ( 0.30 ) *** 2.38 ( 0.30 ) *** 2.36 ( 0.30 ) *** 2.36 ( 0.30 ) ***
   Right-leaning 0.76 ( 0.35 ) * 0.79 ( 0.35 ) * 0.77 ( 0.35 ) * 0.77 ( 0.35 ) * 0.77 ( 0.35 ) * 0.78 ( 0.35 ) *
Interaction terms
   Index × income 3.92 ( 2.82 ) 0.60 ( 0.50 ) 0.59 ( 0.46 )
   Index × rural area 29.64 ( 10.13 ) ** 3.63 ( 2.40 ) 0.76 ( 2.79 )
   Index × benefits 3.05 ( 12.65 ) 1.10 ( 4.22 ) 1.36 ( 2.25 )
   Index × high income 8.57 ( 12.30 ) 1.87 ( 3.03 ) 2.70 ( 2.80 )
Num. obs.21,39521,39521,39521,39521,39521,395
Num. groups: hid:kkz_rek13,41213,41213,41213,41213,41213,412
Num. groups: kkz_rek400400400400400400
Var: hid:kkz_rek (Intercept) 85.37 85.42 85.33 85.40 85.43 85.49
Var: kkz_rek (Intercept) 4.17 3.94 4.28 4.23 3.94 4.00
Var: Residual 267.93 267.84 267.96 267.93 267.85 267.79
*** p < 0.001 ; ** p < 0.01 ; * p < 0.05 . Source: SOEP.v37 and microm data. Table generated using the R texreg package by Leifeld (2013).
Table 5. Mixed-effects models for rural and urban districts in Germany (Dissimilarity index only).
“One Has to Work Hard in Order to Succeed”
‘Rural’‘Urban’
(VII)(VIII)(IX)(X)
District level
   (Intercept)73.25 (6.73) *** 69.52 ( 7.84 ) *** 103.10 ( 7.14 ) *** 106.60 ( 9.54 ) ***
   Index 1.73 ( 7.03 ) 5.73 ( 8.30 ) 26.66 ( 7.57 ) *** 30.39 ( 10.13 ) **
   Avg. monthly income (EUR 000) 1.31 ( 3.96 ) 0.86 ( 4.02 ) 0.03 ( 1.54 ) 0.27 ( 1.58 )
   Population density 0.00 ( 0.00 ) 0.00 ( 0.00 ) 0.00 ( 0.00 ) 0.00 ( 0.00 )
   Foreign population 0.16 ( 0.18 ) 0.20 ( 0.18 ) 0.01 ( 0.08 ) 0.01 ( 0.08 )
   Basic security benefits (>12.3 %) 2.02 ( 0.94 ) * 3.56 ( 17.78 ) 0.63 ( 0.70 ) 5.76 ( 18.87 )
   High-income households (>24%) 0.56 ( 1.10 ) 28.79 ( 19.44 ) 1.42 ( 0.66 ) * 9.52 ( 14.35 )
   Region: East 1.00 ( 1.25 ) 0.81 ( 1.27 ) 1.40 ( 0.97 ) 1.39 ( 0.98 )
Individual level
   Household income (EUR 000) 0.36 ( 0.28 ) 5.50 ( 5.28 ) 0.07 ( 0.12 ) 2.50 ( 3.69 )
   Moved in the past year 1.39 ( 1.84 ) 1.37 ( 1.85 ) 1.08 ( 1.34 ) 1.07 ( 1.34 )
   Duration of residence (years) 0.01 ( 0.02 ) 0.01 ( 0.02 ) 0.00 ( 0.02 ) 0.00 ( 0.02 )
   Male 0.82 ( 0.39 ) * 0.83 ( 0.39 ) * 0.88 ( 0.30 ) ** 0.88 ( 0.30 ) **
   First-generation migrant 4.13 ( 0.76 ) *** 4.15 ( 0.76 ) *** 4.80 ( 0.47 ) *** 4.79 ( 0.47 ) ***
   Second-generation migrant 3.97 ( 1.29 ) ** 3.94 ( 1.29 ) ** 4.74 ( 0.66 ) *** 4.74 ( 0.66 ) ***
   Aged 65+ 1.70 ( 0.57 ) ** 1.71 ( 0.57 ) ** 2.44 ( 0.46 ) *** 2.43 ( 0.46 ) ***
   No university degree 3.22 ( 0.57 ) *** 3.21 ( 0.57 ) *** 3.38 ( 0.39 ) *** 3.37 ( 0.39 ) ***
   Unemployed 0.04 ( 1.02 ) 0.03 ( 1.02 ) 1.46 ( 0.79 ) 1.44 ( 0.79 )
   Religious 0.08 ( 0.55 ) 0.09 ( 0.55 ) 0.47 ( 0.39 ) 0.47 ( 0.39 )
   Left-leaning 1.09 ( 0.50 ) * 1.10 ( 0.50 ) * 3.07 ( 0.38 ) *** 3.06 ( 0.38 ) ***
   Right-leaning 0.56 ( 0.57 ) 0.57 ( 0.58 ) 0.87 ( 0.44 ) * 0.88 ( 0.44 ) *
Interaction terms
   Index × income 5.59 ( 5.72 ) 2.65 ( 3.81 )
   Index × benefits 6.05 ( 19.12 ) 6.65 ( 19.61 )
   Index × high income 30.37 ( 20.87 ) 8.62 ( 15.23 )
Num. obs.7641764113,75413754
Num. groups: hid:kkz_rek4724472486888688
Num. groups: kkz_rek202202198198
Var: hid:kkz_rek (Intercept) 80.91 80.84 87.51 87.57
Var: kkz_rek (Intercept) 5.34 5.45 2.63 2.72
Var: Residual 260.17 260.18 272.22 272.18
*** p < 0.001 ; ** p < 0.01 ; * p < 0.05 . Source: SOEP.v37 and microm data. Table generated using the R texreg package by Leifeld (2013).
Disclaimer/Publisher’s Note: The statements, opinions and data contained in all publications are solely those of the individual author(s) and contributor(s) and not of MDPI and/or the editor(s). MDPI and/or the editor(s) disclaim responsibility for any injury to people or property resulting from any ideas, methods, instructions or products referred to in the content.