Abstract
The structure of land ownership and land use changed significantly after the fall of the communist regime in most CEE countries. The goal of this paper is to present a unique analysis of the highly concentrated Hungarian land system and model spatial differences. Using settlements as observation units, this research proposes a methodology to include data on land of all individual and corporate farms. First, according to the dominant farm size, we classified the farms into six types of land use structures, applying latent profile analysis. Then, we studied the distribution of their geographical location. We examined the statistical relationship between land ownership structure and the economic, social, and infrastructural characteristics and development level of settlements. One of the unexpected results of the research is that the dominance of large farms is mostly related to the higher values of the development indicators of the settlements.
1. Introduction
The land reform and the privatization of collective land were prominent parts of the dismantling of socialist systems and the socialist reforms in all Central and Eastern European countries. These initiated a series of changes still affecting all segments of rural societies (Swinnen and Mathijs 2018). At the turn of the millennium, a decade after the regime change, already family farms and private and corporate enterprises cultivated the land. The change in land ownership was so important that it was rightly compared to the British capitalist land enclosure lasting for decades, whereas postsocialist reprivatization took only one decade (Szelényi 1998). The land ownership reform was carried out with different techniques in each country (Kovách 1994; Swinnen and Mathijs 2018), but in terms of social changes, the researchers found many similarities (Turnock 1996). Among the root causes of rural depopulation are land grabbing, which intensified in the 21st century, and the massive loss of agricultural jobs (Brown and Schafft 2002; Brown et al. 2005; Czibere et al. 2021). The increase in poverty almost immediately became a side effect of institutional reforms (Meurs and Ranasinghe 2003; Tisenkopfs et al. 2011) and concentration of land ownership (Harcsa et al. 1998; Žakevičiūtė 2016; Hartvigsen 2014). The losers of the urban industrial restructuring partly tried to survive in the small settlements. The better-off social strata of the cities also discovered the appeal of village life and the lifestyle effects of food production for own consumption, and they moved to rural settlements in changing cycles, but in noticeable proportions (Csurgó et al. 2018; Vávra et al. 2018). New elite groups (landowners, administrative leaders, businessmen) replaced the local stakeholders of the socialist era (Oberschall 2000; Swain 2013). The number of agricultural producers is constantly decreasing, although; for example, in Romania and Poland, the status of small farmers is also being reproduced (Ingham et al. 1998; Cartwright 2017; Halamska 2011; Verdery 2018).
The purpose of our paper is to examine an aspect of the land use structure that has received little attention in the international literature, even though it is one of the essential consequences of the postsocialist land reform. The relationship between the structure of land ownership and land use and the economic–social–infrastructural development of settlements have mostly been researched only at the regional level (disadvantaged and backward places, villages of urban agglomerations, for example, Keim-Klärner et al. 2021), but there is a lack of comprehensive analyses on this topic. The approach and method of this paper, to our knowledge, is a novelty in the international literature.
In this paper, we investigate land use structure of the Hungarian settlements, the distribution of the land area of the land-using holdings, and the typical groups of the different combinations of the land area used. We are looking for correlations between settlement development and typical farm size combinations in agriculture. Our approach differs significantly from how the data have been used in the literature so far.
For understandable reasons, agricultural transformation and one of its privileged areas, the distribution of land ownership and land cultivation according to size and ownership nature (e.g., family farm, partnerships) of holdings, came into the focus of rural social science research. Highlighting only a few examples, mainly from the sociological literature, the analysis of the process and complex effects of land privatization took place quickly (Harcsa et al. 1994, 1998; Varga 2004; Brown et al. 2005), and then the motives of new land use followed political considerations rather than their economic or social benefits (Csite and Kovách 1997; Juhász 2006). Descriptions of the characteristics of the new land tenure and land lease system (Burgerné 1996) and the failure of the original goals of compensation (Kovács 1994) also appeared in parallel with the actual events. The disintegration of co-operatives and the fate of their previously cultivated lands (Kovács and Bihari 2000; Csite et al. 2002) and the rapid differentiation of land use in family holdings can also be traced (Harcsa et al. 1994; Harcsa 1995; Harcsa and Kovách 1996; Kovács and Bihari 2000). Katalin Kovács (2007) showed, in an international comparison, the significant centralization of land use, which—as later studies pointed out—has persisted to the present day despite the announced political intentions (Kovách 2012a, 2012b, 2018). A volume of studies (Kovács 2016) provided a rich overview of the structure and elements of land use (e.g., labor force, seasonal labor use, new types of cooperatives) and land ownership relations in nine microdistricts and settlements. The fate of the land remained a constant topic in village sociology (Váradi 2007). Previously, it was mainly thematized as a source of new inequalities and poverty. Then, the network (Megyesi 2012), the structure of the authoritarian regime (Gonda 2019) and populism (Czibere and Kovách 2022), and the emergence of large tenures (Mikle 2020; Mikle and Randelli 2020) also became the subject of land-related research.
The regional, national, or European analyses of land use and land ownership structure, distribution of small and large-scale holdings, and social characteristics of land users are almost always based on individual data, i.e., their unit of observation is the economy. Our paper changes that because we consider the settlement to be the observation unit.
Our paper is structured as follows: It will first present the data and methodology (Section 2). The following section (Section 3) shows the homogeneous groups of Hungarian settlements based on the use structure of agricultural areas, interpreted by settlement. Next, we look for relationships between the settlement clusters identified by the land use structure and the development indicators of the settlements, measured along different dimensions. The specific objectives are to examine: (1) Which are the typologies of municipalities in terms of land use structure in Hungary? (2) Is the highly concentrated land use related to the economic, social, and infrastructural development of the settlements? (3) If so, which indicators play a prominent role in the explanations? Finally, the fourth section summarizes findings and conclusions as well as the relevance of findings and suggest directions for further research in this field.
2. Materials and Methods
With regard to the concepts of land use and land ownership, it is important to emphasize that the owner and the actual user of the land were not necessarily the same legal or private person in any era. On the basis of the available statistics, this duality cannot be fully clarified today due to the extensive system of land lease and the partial disarray of ownership (for example, in the case of undivided co-ownership). In this paper, we use the term land use structure, as allowed by the nature of the data source used. At the same time, it is also necessary to emphasize that, in the literature, the term “földhasználat”, and even more so, its English equivalent, “land-use”, includes diverse contents. It can relate to, among other things, ownership structure, farm structure, branches of cultivation, indication of the crops produced, monitoring the spread of organic production, and the analysis of urban agriculture. The farm structures of agricultural production, the farming sector, topographic and climatic conditions, established production co-operatives, production verticals, and market relations can all affect how much land a farm can/needs to use.
Data used by us came from two sources. On the one hand, we used the data of the EU 2014 Single Area Payment Scheme (SAPS), on the basis of which we created an individual land user-level database. Then, we transformed it into a settlement-level database and finally linked it to demographic–socio-economic background variables from the Hungarian Central Statistical Office (HCSO) and other data sources.
First, we made the data of the SAPS aid list suitable for analysis. The created database is based on the latest publicly available list of individual agricultural holdings and organizations receiving area payments in 2014. This contains the name and registered address of 166,581 farmers who received aid. Moreover, the database covers the amount of SAPS aid received after the tenure reconstruction procedure, i.e., after the consolidation of the lands registered for a single address, thus belonging to the same family, in the same holding. All farmers received a grant in Hungary (around HUF seventy thousand per hectare per year) upon appropriate application (Decree 16/2014 X. 15. FM of the Ministry for Land Cultivation on the establishment of the amount of the single area payment for 2014 and the special dairy premium). Since the grant comes from an EU source, the amount of the subsidy is public, so lists of the names and registered addresses of subsidized farmers were available on the website of the Office for Agriculture and Rural Development until 2014 (for the subsequent years, complete lists can no longer be downloaded; they can only be searched on an EU website, individually). Because aid of HUF 70,702 per hectare could be claimed in the year under review, the size of the agricultural area cultivated by each farmer can be deduced from the amount of area aid received (by a simple division) (see Table 1). As the names and addresses of the farmers were included in a publicly accessible internet database, in legal and technical terms, it was possible to check the size of the land use per household through interviews. In the 30 randomly selected cases, there was no significant difference between the data in the database and the data reported by the farmer. Due to changes in the registration system and the SAPS aid principles, this database cannot be used, from 2015 on, to create a database of the full range of beneficiaries. The 2014 statement is no longer available either, so the database of our paper is the only one of its kind. The land use structure shown from the data used in our paper has changed to only a small extent after 2015, and the basic trends are the same as those indicated by the HCSO; however, the SAPS data show a stronger concentration (Kovách 2018).

Table 1.
Number and distribution of subsidized holdings by the size category of land use.
In the next step, the mutually exclusive land size categories presented above were aggregated into dichotomous variables at the settlement level in order to examine the holdings belonging to each category by settlement. A particularly important feature of the Hungarian settlement system is that each settlement, from the smallest to the capital, has the legal status of a local municipality; therefore, when we use the term settlement in the text of the paper, it always means a legally separate local municipality according to the international usage of the term.1 The aggregated database contains data for 3105 settlements, which is 98.5 percent of the total Hungarian settlements. We looked at (1) how many holdings belong to the given land size category in a settlement, and (2) the total amount of land cultivated by the farmers belonging to each category and, finally, (3) we calculated the ratio of the total agricultural land belonging to the given size category in the settlement’s total area of land.
As a matter of interest, in one-eighth of the settlements (12.4%, N = 384), only holdings of less than 25 hectares operate, and there are 22 settlements in the country where there are no smaller holdings at all. Within the latter group, we registered a total of 4 settlements where holdings larger than 200 hectares cultivate the entire area.
As the central issue of this paper is to examine the relationship between the land use structure of settlements and settlement characteristics, we linked our database with settlement-level socio-economic–infrastructural and other background variables from other data sources. Settlement indicators were retrieved from the National Regional Development and Spatial Planning Information System (in Hungarian: “TeIR”), the Statistical Database System of Settlements (in Hungarian: “T-STAR”), and the National Tax and Customs Administration (in Hungarian: “NAV”) databases.
3. Results
3.1. Groups of Settlements Based on Their Land Use Structure
The types of settlements based on the land use structure were explored with the help of model-based clustering. We were curious to see what well-defined types of settlements can be identified based on land use. To answer this question, we formed four groups—based on the Hungarian Agricultural Census, the operational farms are classified in size classes (using variables measuring the ratio of land within the total agricultural area of a given municipality cultivated by holdings of less than 25 hectares, between 25.1 and 50 hectares, between 50.1 and 200 hectares, and more than 200 hectares). So, our clustering variables are as follows: (1) the proportion of the total land area of holdings of less than 25 hectares within the total agricultural land of the municipality (%); (2) the proportion of the total land area of the holdings between 25.1 and 50 hectares within the total agricultural land of the municipality (%); (3) the proportion of the total land area of holdings between 50.1 and 200 hectares within the total agricultural land of the municipality (%); and (4) the proportion (%) of the total land area of holdings with more than 200 hectares in the total agricultural land of the municipality.
Each of our grouping variables are continuous scales, so we used the “latent profile analysis” (LPA) approach (Collins and Lanza 2010) to create settlement groups (using the Mclust package in the R programming language). LPA is a model-based analysis that uses continuous manifest indicators and assumes discrete latent variables (latent clusters), similar to cluster analysis. (Collins and Lanza 2010). After considering the various aspects (fit indicators: the Bayesian information criterion (BIC) and the Akaike information criterion (AIC), the minimum of cross-classification, and the dynamics of the decrease in the BIC value; we took the size and interpretability of the formed groups into account), we adopted the 6-cluster solution. During the analysis, we estimated 2- to 7-cluster solutions. The AIC and BIC ratios decreased steadily as the number of groups increased, but the rate of decline already moderated after the 6-cluster solution. The Lo–Mendell–Rubin-adjusted likelihood ratio (LMR) test is no longer significant for the 7-cluster solution (p < 0.05), indicating that the 7-cluster structure is no better than the 6-cluster solution. The size of each cluster is shown on Figure 1.
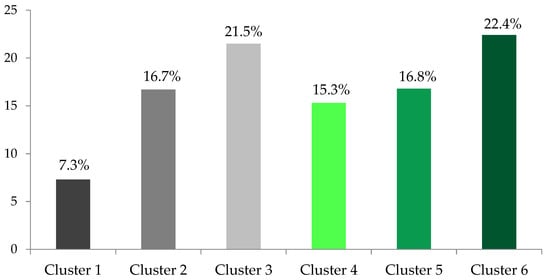
Figure 1.
Grouping of Hungarian settlements on the basis of land use indicators (%).
The proportion of the six clusters within the settlement population is between 7.3% and 22.4%, i.e., the difference between the largest and the smallest subcluster is roughly three times, which can be considered as a statistically well-balanced grouping.
The two largest clusters, clusters 3 and 6, with an almost identical number of elements, include slightly more than a fifth (21.5% and 22.4%) of the settlements (N3 = 667, N6 = 696) and the two middle clusters (cluster 2 and cluster 5) with a similar size (N2 = 519, N5 = 523); cluster 4 includes somewhat more than one seventh of settlements (N4 = 474); and finally, the smallest group, cluster 1, is formed, in which 7.3 percent of the settlements are included (N1 = 227). The features of each cluster are described in Table 2.
Table 2.
Distribution of settlement groups of land use structure and averages of clustering indicators.
The first, the smallest settlement cluster is characterized by the fact that the largest part of the land area of the settlements belonging to it is used by holdings of between 25 and 50 hectares; another feature, although to a much lesser extent, is the presence of holdings under 25 hectares, while the other holdings are not present. We named this cluster, based on the dominant land category, the “small tenure” profile group.
In cluster 2, the dominance of “middle tenures” is obvious, since, in settlements in this cluster, agricultural land is typically cultivated by holdings of between 50 and 200 hectares (72%) and the rest by small holdings of less than 25 hectares (18.4%) and peasant holdings of 25 to 50 hectares (8.7%).
The largest part of the agricultural land in the settlements belonging to the 3rd cluster, with one of the largest number of elements, is used by holdings with more than 200 hectares, while the proportion of the land used by holdings belonging to the other holding size categories is only a few percent (4 to 9%). Therefore, this group of settlements may be described by the dominance of “large tenure”. The history of land use in Gyermely and its surroundings shows one of the ways in which large tenures were formed. The large holdings, which now operate over more than 10,000 hectares, have started further expansion on the basis of their food industry complex operating in the form of a cooperative. In the first period, they acquired much of the former cooperative land used in the vicinities of the four villages. In the second phase, companies were acquired, which obtained long-term leases of public land, and then they financed the land purchases of their employees, for which they immediately entered into long-term leases. The available money, knowledge, and relational capital allowed for intensive land accumulation (Hamar 2016a, 2016b, 2016c). According to the example of the Böhönye microdistrict, the transformation of socialist-era large holdings (state holding village cooperatives) into private property was the soundest background for the establishment of large tenures, to which came the gradually acquired holdings and ending as holdings larger than 1000 hectares.
In contrast, cluster 4, unlike the previous cluster, is characterized by the “dominance of dwarf tenures”: the majority of the land area of the settlements belonging to it (95%) is cultivated by small holdings (holdings smaller than 25 hectares), and the proportion of land used by holdings of between 25 and 50 hectares is minimal, and the other farm size categories are almost nonexistent. We have the least knowledge about this type of land use structure. It is clear that one of the land use structures of small villages is characterized by a multitude of small plots of land. However, the cumulative disadvantages of a settlement may also have led to the concentrated use of land (Kovai 2016; Németh 2016), and it is not clear why, but despite the intensive land demand, the dominance of dwarf tenures continued in 15 percent of the settlements.
The land use structure of settlements in cluster 5 is “mixed”. Its lands are typically cultivated by holdings smaller than 200 hectares. There has also been a concentration of land use within the boundaries of mixed land use settlements, but there are no holdings larger than a few hundred hectares. Based on the case studies, it is probable that mixed land use appeared in regions where the presence of dynamic peasant holdings was dominant before collectivization, as a kind of continuation of which intensive small-scale production continued in the last three decades of the socialist era. In the land use between the Danube and the Tisza, Nyársapát (Hamar et al. 2016), Kiskőrös (Csurgó 2016), or Fehér-gyarmat in the Tiszahát (Rácz 2016), the small-scale production of goods that can respond quickly to market demand is clearly a determining factor.
The land use structure of settlements belonging to cluster 6, with the largest number of cases, is “polarized”: the vast majority of land is cultivated by large holdings with more than 200 hectares and holdings of between 50 and 200 hectares, and a further sixth of land is used by small holdings. According to case studies, in this land use group, the privatization of pre-1990 socialist, large agricultural holdings created today’s large holdings, which, however, did not monopolize the use of arable land belonging to a given settlement (Nagykőrös, Kocsér (Hamar et al. 2016), and Zalaszentgrót (Megyesi 2016)). In settlements with larger surroundings, the outsourcing of a larger, former agricultural cooperative or state holding to a single private successor organization did not necessarily lead to the dominance of large holdings in the land use structure. In Hajdúnánás, for example, in addition to a large holding of several thousand hectares (a former state holding), there are holdings of more than a thousand hectares or hundreds of hectares, 25–30 agricultural holdings between 50 and 200 hectares, and a few hundred smaller holdings (Kovách 2018).
When studying the characteristics of the geographical location of each cluster (see Figure 2), we can see that cluster 1, with the smallest number of elements (N = 227), can be characterized by the dominance of small tenures and consists of nearly a tenth of the country’s villages (defined according to administrative status) (see Table 3), which mainly can be found in Western and Southern Transdanubia and Northern Hungary. The average population of the settlements belonging to the cluster is 829 people.
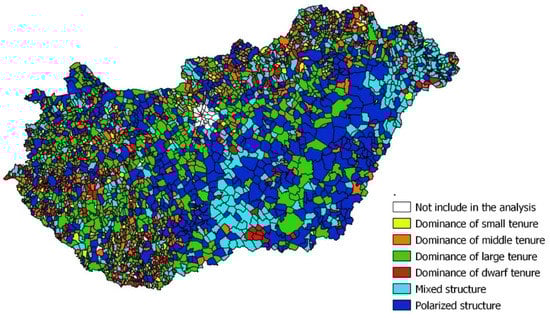
Figure 2.
Settlements in Hungary based on the land use structure (result of latent profile analysis).
Table 3.
Composition of the settlement groups in the land use structure according to legal status.
Settlements in cluster 2 (N = 519), dominated by middle tenure, are villages (96%), similarly to cluster 1, which are located in Northern Hungary (mainly in Borsod and Nógrád) and Transdanubia (typically small villages in Veszprém, Vas, Zala, and Baranya counties). This cluster includes slightly more settlements with urban status (14 in total) and large villages, with an average population of 1154.
Most of the towns with county status, i.e., a quarter of the towns, and a fifth of large villages, villages, and one-fifth of the municipalities are located in cluster 3, the second largest group (N = 667), which is dominated by large tenures. In addition, a county seat (Kaposvár) was included here. In terms of geographical location, this cluster is typically composed of the settlements of Central, Western, and Southern Transdanubia, as well as the larger settlements of the Great Plain on the line of Tisza river. Their average population is 2529 persons.
In cluster 4, in which areas dominated with dwarf tenures (N = 473) are located in villages with low population numbers (more than one-sixth of our villages), there are slightly more large villages compared to clusters 1 and 2. Mainly villages from Southern and Western Transdanubia and Northern Hungary come here, mainly from Baranya, Zala, Heves, and Borsod-Abaúj-Zemplén counties. Their population is, on average 774 people, but the modal settlement’s population of those belonging to it is only 274 people; in other words, the population of most of these settlements is extremely low.
In cluster 5, with a mixed land use structure, there are 523 settlements: more than one-fifth of the towns (72 towns in total) and more large villages compared to the previous (fourth) cluster, as well as one-sixth of the villages and one town with county status, the average population of which is 2442 (compared with clusters 1, 2, and 4, it basically includes more-populated villages). They are typically located in the Northern Great Plain and Southern Great Plain Regions: mostly in the central north–south strip of Bács-Kiskun, in the north-eastern areas of Hajdú-Bihar in Csongrád and Szabolcs-Szatmár-Bereg counties.
County capitals (17 in total), almost half of our towns (44.1%), and two-fifths of large villages and one-fifth of villages are in cluster 6, which is the largest in size (N = 695), with a polarized land use structure. Typically, the settlements of the Southern and Northern Great Plain (mainly Békés, Bács-Kiskun, Hajdú-Bihar, Jász-Nagykun-Szolnok counties) belong here, but the small villages of Tolna county are also over-represented. This is the cluster with the highest average population: the settlements belonging to it had an average population of 5915 in the year under review (2014).2
3.2. Land Use Structure and Development Level of Settlements
In the second part of the analysis, we sought to answer whether, on the basis of land use structure, settlement profiles differ in their economic, social, infrastructural, and other settlement characteristics. We were used one-way ANOVA test to compare the means across the six groups. For our analysis, we linked our database created on the basis of the SAPS aid list with settlement indicators from the TeIR, T-STAR, and NAV databases, and we derived improved indicators from them. The indicators we use are mainly 2013–2014 data, i.e., covering the same period as the SAPS aid list. The essential elements of the land use structure have not changed since 2014, nor have the development indicators of the settlements; therefore, we consider our findings to be valid for the past seven years as well (Kovách 2018). In cases where 2014 data were not available, we used data from the 2011 census.
We examined the characteristics of the settlement clusters according to (1) socio-demographic indicators, (2) social indicators, (3) housing and living conditions, (4) the economic and labor market, (5) the infrastructural and environmental indicators (see Table 4). The examined variables for the settlements’ demographic situation are as follows: (1) morbidity rate; (2) migration difference; (3) dependence rate of the young population; (4) dependence rate of the elderly population.
Table 4.
List of the variables of settlement characteristics.
We measured the social dimension using four variables: (1) incidence of minor children taken in state protection; (2) the proportion of regular social recipients; (3) proportion of recipients of temporary assistance provided by the municipality; (4) the proportion of at least high school graduates.
Five variables show the housing and living conditions: (1) average price of second-hand flats; (2) the proportion of constructed apartments; (3) proportion of substandard inhabited dwellings; (4) income per permanent resident counting toward the PIT base; (5) the number of cars operated by natural persons per thousand inhabitants.
Five variables describe the local economic and labor market situation: (1) employment rate; (2) the proportion of registered jobseekers; (3) the proportion of permanently registered jobseekers in the working age permanent population; (4) the proportion of registered jobseekers with primary school as highest completed studies; (5) number of operating businesses per thousand inhabitants; (6) the proportion of the local government’s local tax revenues.
Finally, the following variables target the municipal infrastructure and the environment: (1) the proportion of dwellings connected to the public sewerage network; (2) the number of broadband Internet subscribers per thousand inhabitants; (3) the proportion of paved roads within all roads maintained by the local government; (4) indicator of accessing the county seat (in minutes); (5) access rate of high-speed junctions (in minutes); (6) the level of institutional supply. The institutional supply indicator developed by us measures the existence of services and institutions available within the settlement, the value may of which vary between 0 and 24, depending on how many of the institutions examined are available in the settlement, i.e., whether there is a nursery, kindergarten, primary school, secondary school, family day care, outpatient specialist care, hospital, pharmacy, adult general medical service, children’s general medical service, library, public cultural institution, swimming pool or spa, market, clothing store, miscellaneous goods store, gas station, bank branch, intercity bus stop, post office, police/police station, fire station, sewage collection network, and wastewater treatment plant.
It should be noted that, in addition to the above variables, we also examined other indicators in the course of the detailed analysis: the rate of natural loss/reproduction, proportion of the unemployed in blue collar/white collar jobs, the proportion of waste removed in selective waste collection (within the total solid waste of the settlement), the proportion of different types of businesses, and the availability of basic amenities (such as a school, GP, or general store) within the settlement.
Using these 25 variables describing settlements along different dimensions, after translating indicators with opposite values into one direction and after their transformation into a scale with the same range, we generated indicators using a statistical data compression procedure (with principal component analysis) that measure the inequality of settlements in terms of dimensions of demographic, social, housing, and living conditions, economic and labor market, and infrastructure, where the higher the value, the better the situation within the given dimension. That is, the negative, “low” values of the new aggregate variables reflect a more unfavorable situation, and the positive values reflect a better situation compared to the national one. All of our new aggregated variables (principal components) retain more than 80 percent of the information content of the original indicators, so the loss of information is reassuringly low in all cases. To test the internal consistency of the variables used to construct the aggregates, we used the Cronbach α index, based on the minimum value of 0.7 set by Nunnally (1978): values above 0.8 for our five aggregates/principal components are considered good (Cronbach’s α coefficient is 0.91 in the social dimension, 0.89 in the demographic dimension, 0.87 in the dimension of housing and living conditions, 0.86 in the dimension of economic and labor market, and 0.83 in the dimension of infrastructure and environment).
Examining the differences between the settlement clusters with different land use structure profiles according to the indicators formed for each indicator group (Figure 3 and Appendix A, Table A1), we see that the best-performing cluster, with the exception of the demographic dimension, is cluster 6, with polarized land use structure, followed by cluster 3, dominated by large tenures, while for each dimension (also excluding the demographic component), the dwarf tenure cluster has the lowest values.
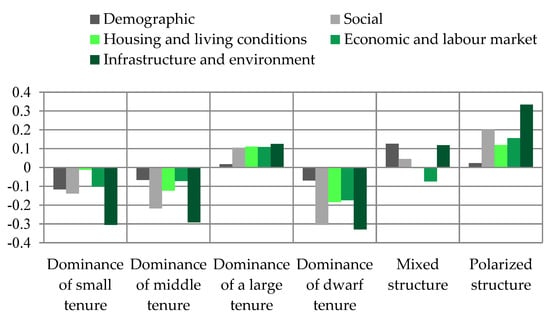
Figure 3.
Changes in the difference of settlement clusters in each dimension (average values).
If we examine the clusters separately on the basis of the items of each dimension, more detailed differences emerge between the settlement profiles (for detailed results ac-cording to each indicator, mean values, and standard deviations of the clusters, see Table A2, Table A3, Table A4 and Table A5 in the Appendix A). Not surprisingly, cluster 6, with polarized land structure, which includes the majority of county capitals and settlements with town status, has exceptionally high infrastructural indicators compared to other clusters in terms of institutional supply, dwellings connected to the public sewerage network, broadband Internet subscribers, waste removed by selective collection, and even paved roads. However, neither the transport-access indicators nor the value of county seat access are the most favorable in this cluster. The same favorable situation is true for most of the examined variables describing economic–labor market and social, housing, and living conditions: here, the employment rate is the highest, the proportion of social assistance recipients and the unemployed is the lowest, incomes are the most favorable, and the proportion of all-amenity dwellings connected to the public sewerage network is the highest. At the same time, in addition to the high population, it is characterized by minimal, below average natural loss, and its demographic vitality is below average.
Indicators of cluster 3 with the dominance of large tenures are above average in many cases, but, for almost all examined variables, they are lower than the values of the previous cluster with a polarized structure (cluster 6). The specificity of this cluster is the favorable housing and living conditions (the average housing price and the number of cars are the highest here), as well as the incidence of partnerships, i.e., companies with limited responsibility, incorporated companies, and agroeconomic cooperatives, within the enterprises. It is characterized by an around-average aging index and a migration balance.
In the case of cluster 5 with a mixed land structure, the values of the group indica-tors are lower than in clusters 6 and 3, except for the demographic component. In essence, this group of settlements can be considered “average”, as its values are roughly around the averages. The exception to this is the favorable socio-demographic indicators: com-pared to the other clusters, the dependence rates for children and the elderly and the value of the migration balance are the most favorable here.
Settlements in a below-average position were included in clusters with the dominance of middle, small, and dwarf tenures (in settlement groups 2, 1, and 4). The middle-tenure-dominated cluster 2 has more favorable values in the dimension of economy and infrastructure compared to clusters dominated by small (second) and dwarf tenures (second); on the other hand, the values of housing and living conditions as well as the social dimension are less favorable than for the cluster dominated by small tenures.
In terms of its characteristics, cluster 1, characterized by the dominance of small tenures, is the worst-off settlement group in the demographic dimension, with dependence and morbidity indices well below the average and other clusters. Although it has slightly better values in the housing and social dimensions than cluster 2, some indicators are well below average: for example, the proportion of dwellings and paved roads built in the last five years is the lowest here.
All in all, the worst-off settlement group is cluster 4, with the dominance of dwarf tenures, apart from demographic indicators that are slightly better than the cluster with small tenure structure. What sets it apart from the other clusters is the unfavorable values of the indicators on the labor market, and social, housing, and living conditions: the settlements in this cluster have the lowest employment rates; the highest rates of unemployment (both long-term and manual jobseekers), incidence of children in state protection, and proportion of those receiving regular and temporary assistance; the lowest average income, house prices, and proportion of substandard houses and those connected to the public sewerage network. In addition, this group is also in the worst position in terms of institutional supply: the supply indicator is 69% lower than the average, and the majority of small settlements without basic functions (general practitioner, primary school, general store) are also here (29%), although it is not the most segregated cluster in terms of transport.
According to the connection of the development indicators of the settlements with the land use structure, the dominant presence of larger tenures is mostly linked with higher values of development indicators. Showing this is one of the innovations of our paper, the understanding of which requires further research. In the larger settlements, the development indicators are inherently better due to the conditions in Hungary, the agricultural areas are also larger, and there was a better chance of establishing a larger holding size. However, this in itself does not explain the observed coincidence of development/land use structure trends, as more than half of the villages belong to the polarized land use type that is dominated by large holdings and includes the presence of large holdings and, in a third of towns, large holdings do not play a dominant role. However, case studies using qualitative methods warn that elements of local economic traditions that survived both the socialist and postsocialist eras may have had an impact on the current land use structure in most of the settlements, as research has suggested so far.
4. Discussion and Conclusions
The two main objectives of this paper were to find the most characteristic clusters of the settlements’ land use structure and to reveal statistically detectable relationships be-tween the development indicators of settlements and their grouping according to land use. We found six typical land use structure groups of settlements, which proved to be properly verifiable from the information of the available qualitative, descriptive publications (see, for example, the volume edited by Katalin Kovács 2016). We referred to these in the text of our study in all cases. The geographical location of the land use types is rather mixed; however, we could also describe some well-recognizable spatial distributions. The dominance of large tenures is typical in Transdanubia and in part of small- and medium-sized towns in the Great Plain. The polarized land use structure, in which large tenures also play an important role, is most present in the small- and medium-sized towns of the Great Plain. The mixed structure is dominant in the north-eastern part of the area between the Danube and the Tisza. Small, medium, and dwarf tenures are the predominant land use method in the small villages of Transdanubia and the Northern Central Mountains.
The correlation between the settlement groups and the development indicators of the settlements brought the less expected result that the presence of large tenures and the higher values of the development indicators were associated. The mixed, polarized, and large land dominance structure is characteristic of settlements where the development indicators exceed the indicators of settlements with a fragmented land use structure. Further studies are needed to interpret this phenomenon; however, it can already be stated that a new, hitherto little-used dimension of understanding municipal inequalities and demonstrating the land use structure can and should be specified.
The result of our research came to the conclusion that the municipal structure of land use is an essential dimension of social and economic inequalities. It would be premature to infer a causal relationship between the development level and the municipal land use structure clusters, but we believe that our results allow us to propose new approaches, questions, and additions to the research of social, economic, and geographical inequalities for discussion.
The municipal level is a disregarded aspect in the analysis and planning of agricultural systems (Potori et al. 2014; Hartvigsen 2014). National and regional data are included, which summarize the individual data of the farms. In addition to individual farms and higher territorial levels, it is recommended to introduce acquittance with municipal/urban land use structures. Access to land by management units (farms, cooperatives, enterprises) and the structure of local land use depend to a large extent on local power, capital, and natural resources (Swain 2013), the neglect of which can lead to methodological pitfalls. The development and implementation of the support principles of effective (agricultural) structural policies can be called into question by the partial knowledge of local specificities.
In fact, qualitative, ethnographic, and anthropological case studies have accumulated versatile knowledge about the social consequences of land use (Kovács 2016). The value and relevance of this could be further increased if the conditions of the fieldwork sites, including the structure of land use, are accurately compared to the indicators of both similar and different locations.
The dominant presence of large estates in mixed, polarized, and large tenure-dominance municipal land use clusters is associated with more favorable values of demographic and social indicators (Figure 3). The values of the three clusters out of the fifteen dimensions are lower than the average only in the economic and labor market dimension of the mixed structure cluster. All of this can lead to new questions and can modify what has been treated as evidence so far.
Leading analyses focused little on the relationship between changes in land ownership, concentration, and migration (Brown and Schafft 2002; Brown et al. 2005), which in turn already indicated that the emigration of the urban poor to backward areas slowed down at the turn of the millennium, and that impoverishment, which can also be explained by the unequal distribution of land ownership (Ladányi and Szelényi 1998), was replaced by deconcentration of the urban population. The actors, direction and extent of migration between settlements changed in waves after the turn of the millennium, and it is not clear what the primary motivators of emigration and immigration were in certain eras of population movement (Balogh and Kovách 2022). The concentration of land use and the radical narrowing of the agricultural labor market gave rise to contrasting explanations. Poverty and emigration were directly attributed to the increase in large estates (Oberschall 2000; Swain 2013; Gonda 2019; Mikle 2020), and the fragmented land structure was also interpreted as a sign of backwardness (Kovács 2007). According to the migration data of Appendix A, Table A3, the migration balance of municipium dominated by large estates is more favorable than in the settlements of small estates. The land use system is obviously not the only influencer of the migration processes, but our findings may encourage a rethinking of the demographic, migratory, and geographical effects of land grabbing and land poverty. We may have similar considerations and questions in relation to the social and labor market data of the municipal land use structure clusters, according to which the municipium dominated by large estates have more advantageous indicators. The questions and answers are open for the time being.
It is necessary to continue our work, but we can also state that the examination of the structure of land use by settlement clearly pointed out that this inequality should also be taken into account when we analyze the social conditions of Central and Eastern European or other societies with larger rural populations.
Author Contributions
Conceptualization, Á.G. and I.K.; methodology, Á.G. and I.K.; software, Á.G. and I.K.; validation Á.G. and I.K.; formal analysis Á.G. and I.K.; investigation, Á.G. and I.K.; resources, Á.G. and I.K.; data curation, Á.G. and I.K.; writing—original draft preparation, Á.G. and I.K.; writing—review and editing Á.G. and I.K.; visualization Á.G.; supervision, Á.G. and I.K.; project administration I.K.; funding acquisition, I.K. All authors have read and agreed to the published version of the manuscript.
Funding
This research was funded by the National Research Development and Innovation Office, grant number K128965 and by the Hungarian Academy of Sciences, grant number PC2022 II-3/2022.
Institutional Review Board Statement
Not applicable.
Data Availability Statement
Data presented in the paper are available on request from the corresponding author.
Conflicts of Interest
The authors declare no conflict of interest. The funders had no role in the design of the study; in the collection, analyses, or interpretation of data; in the writing of the manuscript; or in the decision to publish the results.
Abbreviations
| SAPS | Single Area Payment Scheme |
| HCSO | Hungarian Central Statistical Office |
| TeIR | National Regional Development and Spatial Planning Information System |
| T-STAR | Statistical Database System of Settlements |
| NAV | National Tax and Customs Administration |
| LPA | Latent Profile Analysis |
Appendix A
Table A1.
Mean values of the six separate settlement clusters and settlement development components (standard deviations in brackets).
Table A1.
Mean values of the six separate settlement clusters and settlement development components (standard deviations in brackets).
| Clusters Separated by the Land Use Structure of the Settlements | |||||||
|---|---|---|---|---|---|---|---|
| 1 | 2 | 3 | 4 | 5 | 6 | ||
| Dominance of Small Tenure | Dominance of Middle Tenure | Dominance of Large Tenure | Dominance of Dwarf Tenure | Mixed Structure | Polarized Structure | Level of Significance * p-Value | |
| Indicators According to the 5 Dimensions of a Settlement’s Development Level | |||||||
| Demographic component | −0.117 (1.257) | −0.066 (1.15) | 0.017 (0.84) | −0.069 (1.29) | 0.126 (0.80) | 0.023 (0.79) | Sig = 0.001 |
| Social component | −0.139 (1.09) | −0.218 (0.11) | 0.105 (0.86) | −0.305 (1.24) | 0.045 (0.95) | 0.201 (0.81) | Sig = 0.000 |
| Housing and living conditions component | −0.013 (1.17) | −0.123 (1.00) | 0.111 (0.96) | −0.184 (1.04) | −0.004 (1.03) | 0.119 (0.87) | Sig = 0.000 |
| Economic and labor market component | −0.101 (1.06) | −0.072 (0.97) | 0.109 (0.90) | −0.174 (1.16) | −0.074 (1.06) | 0.156 (0.88) | Sig = 0.000 |
| Infrastructure component | −0.305 (0.92) | −0.292 (0.95) | 0.125 (0.98) | −0.329 (0.90) | 0.118 (0.97) | 0.334 (1.00) | Sig = 0.000 |
*: One-way ANOVA tests.
Table A2.
Deviation of the six settlement clusters according to socio-demographic and social indicators, average values (corresponding standard deviations in brackets).
Table A2.
Deviation of the six settlement clusters according to socio-demographic and social indicators, average values (corresponding standard deviations in brackets).
| Clusters Separated by the Land Use Structure of the Settlements | ||||||||
|---|---|---|---|---|---|---|---|---|
| 1 | 2 | 3 | 4 | 5 | 6 | |||
| Dominance of Small Tenure | Dominance of Middle Tenure | Dominance of Large Tenure | Dominance of Dwarf Tenure | Mixed Structure | Polarized Structure | Total | Level of Significance * p-Value | |
| Socio-Demographic Indicators | ||||||||
| Morbidity rate (number of deaths per thousand inhabitants) | 16.09 (6.67) | 15.91 (7.01) | 15.06 (5.05) | 16.42 (10.12) | 14.59 (4.52) | 14.84 (5.76) | 15.36 (6.62) | Sig = 0.000 |
| Migration difference (number per thousand inhabitants) | −4.27 (15.83) | −5.47 (14.70) | −4.08 (11.15) | −4.20 (21.51) | −3.14 (10.12) | −3.70 (9.86) | −4.10 (13.83) | Sig = 0.014 |
| Dependence rate of young population (%) | 20.94 (8.50) | 21.50 (8.47) | 21.42 (6.00) | 21.60 (9.55) | 22.00 (6.31) | 21.20 (4.83) | 21.47 (7.13) | Sig = 0.029 |
| Dependence rate of elderly population (%) | 29.28 (15.15) | 29.02 (11.90) | 28.51 (8.54) | 29.09 (12.59) | 27.57 (7.84) | 28.43 (6.75) | 28.56 (10.04) | Sig = 0.019 |
| Social Indicators | ||||||||
| Incidence of minor children taken into state protection (%) | 2.18 (4.08) | 2.63 (5.06) | 1.92 (3.05) | 2.85 (5.44) | 2.23 (3.06) | 1.98 (2.30) | 2.26 (3.85) | Sig = 0.000 |
| Proportion of regular social assistance recipients (%) | 42.16 (40.22) | 40.54 (37.35) | 34.05 (30.31) | 43.22 (39.02) | 40.23 (35.08) | 32.06 (28.01) | 37.73 (34.36) | Sig = 0.000 |
| Proportion of recipients of temporary assistance provided by the local government (%) | 9.21 (17.02) | 8.53 (16.66) | 6.95 (11.28) | 8.95 (15.82) | 7.32 (14.94) | 6.23 (10.75) | 7.55 (13.98) | Sig = 0.005 |
| Proportion of at least high-school graduates (%) | 29.34 (13.13) | 27.98 (11.38) | 31.29 (10.64) | 27.48 (12.44) | 31.38 (11.31) | 32.88 (10.58) | 30.38 (11.52) | Sig = 0.000 |
*: One-way ANOVA tests.
Table A3.
Deviation of the six settlement clusters according to the indicators of housing and living conditions, average values (standard deviations in brackets).
Table A3.
Deviation of the six settlement clusters according to the indicators of housing and living conditions, average values (standard deviations in brackets).
| Clusters Separated by the Land Use Structure of the Settlements | ||||||||
|---|---|---|---|---|---|---|---|---|
| 1 | 2 | 3 | 4 | 5 | 6 | |||
| Dominance of Small Tenure | Dominance of Middle Tenure | Dominance of Large Tenure | Dominance of Dwarf Tenure | Mixed Structure | Polarized Structure | Total | Level of Significance * p-Value | |
| Indicators of Housing and Living Conditions | ||||||||
| Average price of second-hand flats (in Hungarian forint) | 5,002,980.78 (5,752,078.58) | 4,454,093.23 (3,869,937.67) | 5,160,018.09 (3,908,255.12) | 437,743.40 (4,031,558.72) | 4,862,470.76 (4,544,003.18) | 5,033,387.09 (3,635,290.26) | 4,832,477.20 (4,144,723.55) | Sig = 0.006 |
| Proportion of constructed apartments (%) | 1.21 (2.14) | 1.08 (1.72) | 1.12 (1.91) | 1.07 (1.88) | 1.13 (1.92) | 1.05 (1.43) | 1.10 (1.80) | Sig = 0.099 |
| Proportion of substandard housing in relation to all inhabited dwellings (%) | 21.63 (16.56) | 22.20 (23.43) | 15.79 (14.15) | 24.13 (22.00) | 16.74 (12.37) | 13.71 (10.85) | 18.26 (17.19) | Sig = 0.000 |
| Income counting toward the basis of the personal income tax per permanent resident (in Hungarian forint) | 636.68 (226.12) | 616.56 (211.96) | 673.41 (206.53) | 599.45 (218.76) | 625.01 (208.82) | 681.20 (204.99) | 643.52 (213.03) | Sig = 0.000 |
| Number of cars operated by natural persons per thousand inhabitants | 76.54 (28.73) | 74.43 (28.82) | 77.05 (24.84) | 73.64 (31.30) | 74.99 (24.87) | 76.07 (22.32) | 75.49 (26.41) | Sig = 0.027 |
*: One-way ANOVA tests.
Table A4.
Deviation of the six settlement clusters according to economic–labor market indicators, average values (standard deviations in brackets).
Table A4.
Deviation of the six settlement clusters according to economic–labor market indicators, average values (standard deviations in brackets).
| Clusters Separated by the Land Use Structure of the Settlements | ||||||||
|---|---|---|---|---|---|---|---|---|
| 1 | 2 | 3 | 4 | 5 | 6 | |||
| Dominance of Small Tenure | Dominance of Middle Tenure | Dominance of Large Tenure | Dominance of Dwarf Tenure | Mixed Structure | Polarized Structure | Total | Level of Significance * p-Value | |
| Indicators of Economic and Labor Market Situation | ||||||||
| Employment rate (%) | 53.39 (11.94) | 52.61 (12.13) | 55.70 (9.84) | 51.71 (14.30) | 52.81 (10.85) | 55.94 (9.15) | 53.98 (11.31) | Sig = 0.000 |
| Proportion of registered jobseekers within the permanent working age population (%) | 9.03 (5.71) | 8.95 (5.58) | 8.16 (5.20) | 9.87 (6.33) | 9.22 (5.75) | 7.91 (4.63) | 8.74 (5.50) | Sig = 0.000 |
| Proportion of permanently registered jobseekers in the working age permanent population (%) | 4.28 (3.52) | 4.12 (3.15) | 3.72 (2.78) | 4.57 (3.84) | 4.49 (3.66) | 3.74 (2.84) | 4.09 (3.26) | Sig = 0.000 |
| Proportion of registered jobseekers with primary school as highest completed studies (%) | 41.56 (20.86) | 42.50 (20.40) | 41.10 (17.19) | 41.95 (22.92) | 41.39 (17.17) | 39.75 (15.21) | 41.24 (18.62) | Sig = 0.076 |
| Number of operating businesses per thousand inhabitants | 39.84 (28.70) | 38.88 (28.99) | 41.27 (23.54) | 40.18 (44.32) | 40.76 (26.48) | 41.89 (23.62) | 40.65 (29.36) | Sig = 0.059 |
| Proportion of local government’s local tax revenues within the revenues of the current year (%) | 13.13 (10.65) | 14.77 (12.11) | 18.11 (12.36) | 13.63 (12.54) | 16.02 (11.16) | 18.67 (11.80) | 16.28 (12.07) | Sig = 0.000 |
*: One-way ANOVA tests.
Table A5.
Deviation of the six settlement clusters according to the indicators of infrastructure and environment, average values (corresponding standard deviations in brackets).
Table A5.
Deviation of the six settlement clusters according to the indicators of infrastructure and environment, average values (corresponding standard deviations in brackets).
| Clusters Separated by the Land Use Structure of the Settlements | ||||||||
|---|---|---|---|---|---|---|---|---|
| 1 | 2 | 3 | 4 | 5 | 6 | |||
| Dominance of Small Tenure | Dominance of Middle Tenures | Dominance of Large Tenure | Dominance of Dwarf Tenure | Mixed Structure | Polarized Structure | Total | Level of Significance * p-Value | |
| Infrastructure and Environment Indicators | ||||||||
| Proportion of dwellings connected to the public sewerage network (%) | 41.24 (39.57) | 40.92 (39.98) | 48.36 (40.18) | 38.77 (40.42) | 44.92 (39.87) | 50.37 (39.09) | 45.00 (40.04) | Sig = 0.000 |
| Number of broadband Internet subscribers per thousand inhabitants | 92.44 (82.11) | 85.85 (76.96) | 103.40 (75.16) | 90.39 (81.69) | 100.85 (73.16) | 104, 38 (76.73) | 97.47 (77.31) | Sig = 0.000 |
| Proportion of paved roads within all roads maintained by the local government (%) | 24.65 (21.90) | 25.62 (22.39) | 26.93 (21.37) | 25.44 (24.03) | 28.45 (23.17) | 28.69 (22.00) | 26.97 (22.48) | Sig = 0.025 |
| Indicator of accessing the county seat (in minutes) | 44.70 (21.03) | 46.78 (21.48) | 45.94 (21.36) | 45.31 (20.50) | 48.71 (22.98) | 45.89 (22.73) | 46.35 (21.83) | Sig = 0.010 |
| Express node access indicator (in minutes) | 43.12 (21.21) | 44.11 (23.26) | 38.99 (25.12) | 42.45 (22.56) | 37.31 (22.00) | 37.27 (24.30) | 40.01 (23.60) | Sig = 0.000 |
| Degree of institutional supply | 6.72 (3.34) | 7.55 (3.71) | 10.32 (4.46) | 6.66 (3.54) | 10.65 (4.28) | 12.31 (4.69) | 9.54 (4.67) | Sig = 0.000 |
*: One-way ANOVA tests.
Notes
| 1 | The districts of the capital, Budapest, are also all independent municipalities, but since we did not include Budapest in our research, this fact has no significance from the point of view of our study. |
| 2 | Budapest, the capital city, is not included. |
References
- Balogh, Karolina, and Imre Kovách. 2022. Population Dynamics of the Hungarian Villages 1995–2016. European Countryside 14: 790–809. [Google Scholar]
- Brown, David L., and Kai A. Schafft. 2002. Population deconcentration in Hungary during the post-socialist transformation. Journal of Rural Studies 18: 233–44. [Google Scholar] [CrossRef]
- Brown, David L., László J. Kulcsár, László Kulcsár, and Csilla Obádovics. 2005. Post-socialist restructuring and population redistribution in Hungary. Rural Sociology 70: 336–59. [Google Scholar] [CrossRef]
- Burgerné, Gimes Anna. 1996. A magyarországi földpiac. Statisztikai Szemle 5–6: 411–20. [Google Scholar]
- Cartwright, Andrew L. 2017. The Return of the Peasant: Land Reform in Post-Communist Romania. London: Routledge. [Google Scholar]
- Collins, Linda M., and Stephanie T. Lanza. 2010. Latent Class and Latent Transition Analysis for the Social, Behavioral, and Health Sciences. New York: Wiley. [Google Scholar]
- Czibere, Ibolya, and Imre Kovách. 2022. State Populism in Rural Hungary. Rural Sociology 87: 733–57. [Google Scholar] [CrossRef]
- Czibere, Ibolya, Imre Kovách, Piotr Szukalski, and Pavel Starosta. 2021. Depopulation and Public Policies in Rural Central Europe. The Hungarian and Polish Cases. Ager: Revista de estudios sobre despoblación y desarrollo rural. Journal of Depopulation and Rural Development Studies 33: 57–82. [Google Scholar]
- Csite, András, and Imre Kovách. 1997. Falusi szegénység. A falu 1: 49–54. [Google Scholar]
- Csite, András, Bernadett Csurgó, Zsuzsa Himesi, and Imre Kovách. 2002. Agrárpolitikai hatásvizsgálat: Földhasználat, foglalkoztatottság, üzemszerkezet. In Hatalom és társadalmi változás: A posztszocializmus vége. Edited by Imre Kovách. Budapest: Napvilág, pp. 309–61. [Google Scholar]
- Csurgó, Bernadett. 2016. Szőlészek és borászok a Kiskőrösi kistérségben. In Földből élők: Polarizáció a magyar vidéken. Edited by Katalin Kovács. Budapest: Argumentum, pp. 394–420. [Google Scholar]
- Csurgó, Bernadett, Imre Kovách, and Boldizsár Megyesi. 2018. After a long march: The results of two decades of rural restructuring in Hungary. Eastern European Countryside 24: 81–109. [Google Scholar] [CrossRef]
- Gonda, Noémi. 2019. Land Grabbing and the Making of An Authoritarian Populist. Journal of Peasant Studies 3: 606–25. [Google Scholar] [CrossRef]
- Halamska, Maria. 2011. The Polish Countryside in the Process of Transformation 1989–2009. Polish Sociological Review 173: 35–54. [Google Scholar]
- Hamar, Anna. 2016a. Idénymunka a zöldség-gyümölcs ágazatban. In Földből élők: Polarizáció a magyar vidéken. Edited by Katalin Kovács. Budapest: Argumentum, pp. 97–116. [Google Scholar]
- Hamar, Anna. 2016b. A TÉSZ-ek és a be nem teljesült várakozások. In Földből élők: Polarizáció a magyar vidéken. Edited by Katalin Kovács. Budapest: Argumentum, pp. 117–33. [Google Scholar]
- Hamar, Anna. 2016c. Birtokszerkezet és agrárszereplők egy nem agrárjellegű térségben. In Földből élők: Polarizáció a magyar vidéken. Edited by Katalin Kovács. Budapest: Argumentum, pp. 345–69. [Google Scholar]
- Hamar, Anna, Katalin Kovács, and Monika Váradi. 2016. Azért kell a föld, hogy ha a fiam mezőgazdaságból akar élni, ne csak tehenész lehessen más telepén. In Földből élők: Polarizáció a magyar vidéken. Edited by Katalin Kovács. Budapest: Argumentum, pp. 370–93. [Google Scholar]
- Harcsa, István. 1995. Farmerek, mezőgazdasági vállalkozók. Budapest: KSH. [Google Scholar]
- Harcsa, István, and Imre Kovách. 1996. Farmerek és mezőgazdasági vállalkozók. In Társadalmi Riport 1996. Edited by Rudolf Andorka, Tamás Kolosi and Gabriella Vukovich. Budapest: Tárki, Századvég, pp. 104–34. [Google Scholar]
- Harcsa, István, Imre Kovách, and Iván Szelényi. 1994. A posztszocialista átalakulási válság a mezőgazdaságban és a falusi társadalomban. Szociológiai Szemle 3: 15–44. [Google Scholar]
- Harcsa, István, Imre Kovách, and Iván Szelényi. 1998. The Crisis of Post-Communist Transformation in the Hungarian Countryside and Agriculture. In Privatising the Land. Rural Political Economy in Post-Socialist Societies. Edited by Iván Szelényi. London: Routledge, pp. 214–45. [Google Scholar]
- Hartvigsen, Morten. 2014. Land reform and land fragmentation in Central and Eastern Europe. Land Use Policy 36: 330–41. [Google Scholar] [CrossRef]
- Ingham, Hilary, Mike Ingham, and Grzegorz Weclawowicz. 1998. Agricultural Reform in Post-Transition Poland. Tijdschrift voor Economische en Sociale Geografie 89: 150–60. [Google Scholar] [CrossRef]
- Juhász, Pál. 2006. Emberek és intézmények. Budapest: Új Mandátum. [Google Scholar]
- Keim-Klärner, Sylvia, Josef Bernard, Susann Bischof, Christoph van Dülmen, Andreas Klärner, and Annett Steinführer. 2021. Analyzing Social Disadvantage in Rural Peripheries in Czechia and Eastern Germany: Conceptual Model and Study Design. Thünen Working Paper 170. Braunschweig: Johann Heinrich von Thünen Institute. [Google Scholar]
- Kovách, Imre. 1994. Privatization and family farms in Central and Eastern Europe. Sociologia Ruralis 34: 369–82. [Google Scholar]
- Kovách, Imre. 2012a. A földből élők és földhasználati módok Hajdúnánáson. In Földből élők: Polarizáció a magyar vidéken. Edited by Katalin Kovács. Budapest: Argumentum, pp. 472–93. [Google Scholar]
- Kovách, Imre. 2012b. A vidék az ezredfordulón: A jelenkori magyar vidéki társadalom szerkezeti és hatalmi változásai. Budapest: Argumentum Kiadó, MTA Társadalomtudományi Kutatóközpont. [Google Scholar]
- Kovách, Imre. 2018. Földhasználat és földtulajdon-szerkezet. In Társadalmi Riport 2018. Edited by Tamás Kolosi and István György Tóth. Budapest: Tárki, pp. 248–63. [Google Scholar]
- Kovács, Katalin. 2007. Structures of Agricultural Land Use in Central Europe. In Redecting Transformation in Post-Socialist Rural Areas. Edited by Maarit Heinonen, Jouko Nikula, Inna Kopoteva and Leo Granberg. Newcastle: Cambridge Scholars Publishing, pp. 87–114. [Google Scholar]
- Kovács, Katalin. 2016. Földből élők: Polarizáció a magyar vidéken. Budapest: Argumentum, pp. 1–532. [Google Scholar]
- Kovács, Katalin, and Zsuzsanna Bihari. 2000. Változó agrárgazdaság a térben. In Magyarország területi szerkezete és folyamatai az ezredfordulón. Edited by Gyula Horváth and János Rechnitzer. Pécs: MTA Regionális Kutatások Központja, pp. 282–97. [Google Scholar]
- Kovács, Teréz. 1994. Térségi sajátosságok a földkárpótlásnál. Agrártörténeti Szemle 1–4: 77–87. [Google Scholar]
- Kovai, Cecília. 2016. Önellátó függőség. In Földből élők: Polarizáció a magyar vidéken. Edited by Katalin Kovács. Budapest: Argumentum, pp. 130–53. [Google Scholar]
- Ladányi, János, and Iván Szelényi. 1998. Class, Ethnicity, and Urban Restructuring in PostCommunist Hungary. In Social Change and UrbanRestructuring in Central Europe. Edited by György Enyedi. Budapest: Akadémiai Kiadó, pp. 67–86. [Google Scholar]
- Megyesi, Gergely Boldizsár. 2012. Institutions and Networks in Rural Development: Two Case tudies from Hungary. In Sustainability and Short-Term Policies: Improving Governance in Spatial Policy. Edited by Stefan Sjöblom, Kjell Andersson, Terry Marsden and Sarah Skerratt. Farnham: Ashgate, pp. 217–44. [Google Scholar]
- Megyesi, Gergely Boldizsár. 2016. A Zalaszentgróti kistérség agrárszereplői. In Földből élők: Polarizáció a magyar vidéken. Edited by Katalin Kovács. Budapest: Argumentum, pp. 268–91. [Google Scholar]
- Meurs, Mieke, and Rasika Ranasinghe. 2003. De-development in post-socialism: Conceptual and measurement issues. Politics & Society 31: 31–53. [Google Scholar]
- Mikle, György. 2020. Long-term transformation of Hungarian manors: The relevance of the rural restructuring approach and the concept of the precariat. Journal of Rural Studies 77: 105–12. [Google Scholar] [CrossRef]
- Mikle, György, and Filippo Randelli. 2020. The evolution of rural areas influenced by large-scale farming: Four case studies from Hungary. GeoJournal 87: 99–110. [Google Scholar] [CrossRef]
- Németh, Krisztina. 2016. Mobilitási utak egy mezőgazdasági nagyüzem dicsfényében és árnyékában. In Földből élők: Polarizáció a magyar vidéken. Edited by Katalin Kovács. Budapest: Argumentum, pp. 154–79. [Google Scholar]
- Nunnally, Jum C. 1978. Psychometric Theory, 2nd ed. New York: McGraw-Hill. [Google Scholar]
- Oberschall, Anthony. 2000. Privatizing Socialist Farming in Hungary: Interest, Efficiency and Equity. Rationality and Society 12: 5–24. [Google Scholar] [CrossRef]
- Potori, Norbert, Pawel Chmieilnski, and Bozena Karwat-Wozniak. 2014. A comparison of the agro-food sectors in Poland and Hungary from a macro perspective. In Structural Changes in Polish and Hungarian Agriculture Since EU Accession: Lessons Learned and Implications for the Design of Future Agricultural Policies. Edited by Norbert Potori, Pawel Chmieliński and Andrew Fieldsend. Budapest: Research Institute of Agricultural Economics, pp. 9–32. [Google Scholar]
- Rácz, Katalin. 2016. “Mi itt a földhöz vagyunk kötve…”: Agrárgazdasági folyamatok a Fehérgyarmati térségben. In Földből élők: Polarizáció a magyar vidéken. Edited by Katalin Kovács. Budapest: Argumentum, pp. 444–71. [Google Scholar]
- Swain, Nigel. 2013. Green Barons, Force-of-Circumstance Entrepreneurs, Impotent Mayors: Rural Change in the Early Years of Post-Socialist Capitalist Democracy. Budapest: Central European University Press. [Google Scholar]
- Swinnen, Johan, and Erik Mathijs. 2018. Agricultural privatisation, land reform and farm restructuring in Central and Eastern Europe: A comparative analysis. In Agricultural Privatisation, Land Reform and Farm Restructuring in Central and Eastern Europe. Edited by Allan Buckwell, Erik Mathijs and Johan Swinnen. London: Routledge, pp. 333–71. [Google Scholar]
- Szelényi, Iván. 1998. Privatising the Land. Rural Political Economy in Post-Socialist Societies. London: Routledge. [Google Scholar]
- Tisenkopfs, Talis, Imre Kovách, Michal Lošťák, and Sandra Šūmanea. 2011. Rebuilding and failing collectivity: Specific challenges for collective farmers marketing initiatives in post-socialist countries. The International Journal of Sociology of Agriculture and Food 18: 70–88. [Google Scholar]
- Turnock, David. 1996. Agriculture in Eastern Europe: Communism, the transition and the future. GeoJournal 38: 137–49. [Google Scholar] [CrossRef]
- Váradi, Monika. 2007. Utak, elágazások—A közelmúlt falukutatásai. In Közösségtanulmány. Edited by Éva Kovács. Budapest: Néprajzi Múzeum—PTE-BTK Kommunikáció-és Médiatudományi Tanszék, pp. 43–68. [Google Scholar]
- Varga, Gyula. 2004. A magyar mezőgazdaság az idők sodrában. Budapest: Miniszterelnöki Hivatal, Stratégiai Elemző Központ. [Google Scholar]
- Vávra, Jan, Boldizsár Megyesi, Barbora Duží, Tony Craig, Renata Klufová, Miloslav Lapka, and Eva Cudlínová. 2018. Food self-provisioning in Europe: An exploration of sociodemographic factors in five regions. Rural Sociology 83: 431–61. [Google Scholar] [CrossRef]
- Verdery, Katherine. 2018. The Vanishing Hectare. Property and Value in Postsocialist Transylvania. New York: Cornell University Press. [Google Scholar]
- Žakevičiūtė, Rasa. 2016. Socio-economic differentiation in the post-communist rural Baltics: The case of three kolkhozes. Journal of Baltic Studies 47: 349–68. [Google Scholar]
Disclaimer/Publisher’s Note: The statements, opinions and data contained in all publications are solely those of the individual author(s) and contributor(s) and not of MDPI and/or the editor(s). MDPI and/or the editor(s) disclaim responsibility for any injury to people or property resulting from any ideas, methods, instructions or products referred to in the content. |
© 2023 by the authors. Licensee MDPI, Basel, Switzerland. This article is an open access article distributed under the terms and conditions of the Creative Commons Attribution (CC BY) license (https://creativecommons.org/licenses/by/4.0/).