Abstract
This paper investigates whether perceptions of neighborhood physical disorder—measured by vacant lots, vacant buildings, and overgrown vegetation—influence perceptions of crime and perceptions of the frequency or magnitude of crime events. We use ordinal logistic regression to analyze individual-level and contextual-level variables derived from a survey of 401 randomly selected residents in seven New Orleans neighborhoods. Findings show that as perceptions of physical disorder increase, so does the likelihood of perceiving violent crime as more of a neighborhood problem than property crime. As residents perceive greater physical disorder, their perception of crime level decreases. Finally, residents who perceive greater physical disorder are more likely to perceive crime levels to be stable to increasing over the previous five years. The category of “physical disorder” is inherently subjective, and future research should distinguish between social disorder and physical disorder in the evaluation of perceptions of crime. Our major contribution is to empirically demonstrate that the influence of physical disorder on crime perceptions depends upon the crime type and temporal scale under investigation.
1. Introduction
In this paper, we investigate whether resident perceptions of physical disorder—often measured by presence of vacant properties, vacant buildings, and overgrown vegetation—affect perceptions of crime. Much research has investigated the relationship between physical disorder and reported crime events, and scholars have become increasingly interested in investigating the precise ways in which disorder may influence perceptions of crime (Spelman 1993; Brown et al. 2004; Scarborough et al. 2010; De Biasi 2017; Foster et al. 2013; Hipp and Steenbeek 2016; Houser et al. 2019). The relationship between crime and disorder has concerned criminologists and social scientists for decades. Over the decades, criminologists have debated whether disorder leads to crime. Other researchers have found little evidence of a statistical relationship between measures of disorder and crime (Boggess and Maskaly 2014; Brown et al. 2004; Doran and Lees 2005; Gault and Silver 2008; Markowitz et al. 2001; Perkins et al. 1992; Sampson and Raudenbush 1999; Skogan 1990; Taylor 2001; Yang 2010). More recently, researchers have embraced social constructionist views of disorder and crime and examined how and under what conditions people perceive crime and disorder similarly or differently depending on experiences and contextual information (Alper and Chappell 2012; Barton et al. 2017; Yang and Pao 2015; Yang et al. 2018).
We advance scholarly understanding of the determinants of perceptions of crime and their linkages to perceptions of neighborhood physical disorder using multidimensional measures of both physical disorder perception and crime perception. We present our results in three phases. First, we assess whether residents’ perceptions of neighborhood physical disorder affects their perceptions of crime, controlling for several individual-level factors (i.e., income). Here, we evaluate whether perceptions of physical disorder affect resident perceptions of the type of crime (i.e., violent crime or property crime) as a neighborhood problem. Next, we assess perceptions of physical disorder on resident perceptions of crime in general. Finally, we assess perceptions of physical disorder on resident perceptions of the changing magnitude of crime over time (e.g., whether respondents believe the level of crime has increased, stayed the same, or decreased over the past five years, as of 2017, the date of our survey). Rather than viewing vacant housing, vacant lots, or overgrown vegetation as static and objective conditions that are spatially fixed in the built environment, we evaluate how these factors are differentially perceived by residents and shape and influence their perception of crime.
2. Theorizing the Crime–Disorder Connection
Criminologists and other social scientists have devoted much attention to the impact of neighborhood conditions and objective measures of disorder on individual perceptions of crime, but scholars disagree as to whether physical and social disorder indicate one underlying concept or if they are conceptually separate and analytically distinct (Chappell et al. 2011; Hinkle and Yang 2014; Hoeben et al. 2018; Murphy 2012; Sampson and Raudenbush 2001; Janssen et al. 2019). Researchers have drawn attention to unresolved conceptual and measurement issues in research on neighborhood disorder, and much debate surrounds issues of conceptualization (e.g., distinction between physical and social disorder; the subjectivity of disorder perceptions and their context-dependent nature; conceptual overlap with crime and other indicators; and measurement, such as a lack of agreement between subjective and objective assessments of disorder) (Ward et al. 2017; Gau and Pratt 2008; Kubrin 2008; Taylor 1999, 2001). In short, much debate concerns the appropriate conceptualization and operationalization of physical disorder, levels of analysis suitable for assessing findings, and the generalizability of findings to other spatial units and places (Buil-Gil et al. 2019).
Most studies that have addressed the disorder–crime nexus have embraced a dual measure of neighborhood disorder comprised of indicators of social disorder and physical disorder. Indicators of social disorder have typically included disruptive actions caused by deviant behavior of individuals such as loitering, unruly and rowdy youth, gang activities, begging, public drunkenness, prostitution and public drug use or dealing (Janssen et al. 2019; Ferraro 1995; LaGrange et al. 1992). Indicators of physical disorder include vacant property, vacant houses, blighted and dilapidated homes, abandoned cars, vandalized property, litter, and graffiti (Liska et al. 1982). “Physical disorder,” according to Ross and Mirowsky (1999, p. 413), “indicates that social control has broken down,” which is a condition that can lead to serious crime and a deterioration of a neighborhood. These ideas have long fueled debates on the efficacy of the “broken windows” theory of urban decline (Wilson and Kelling 1982) which contends that minor forms of public disorder generate serious crime and speed urban decay (Kelling and Coles 1996).
The presumed reason that disorder causes crime is that visual cues—e.g., vacant property, graffiti, garbage, and abandoned cars—are thought to attract criminal offenders, who assume from these cues that residents do not care about their neighborhood (Sampson and Raudenbush 2004, p. 319). Brunton-Smith and Sturgis’ (2011) oft-cited study using the British Crime Survey (BCS) data from 2002 to 2005 found that visual signs of disorder exert a direct and independent effect on individual-level fear of crime. In their study, they operationalize visual signs of disorder as common litter, vandalism (including graffiti), and run-down property. Other researchers have combined measures of physical and social disorder (Sampson and Raudenbush 2004) and operationalized disorder using eight-item (Skogan 1990), nine-item (Perkins and Taylor 1996), and fifteen-item scales to analyze different dimensions of disorder (Ross and Mirowsky 1999). These variations reflect scholarly differences over the conceptualization and operationalization of neighborhood disorder, measures and indictors of crime perception, and the hypothesized linkages among social disorder and physical disorder.
Visual cues of disorder are not static and unambiguous but can contain a multiplicity of meanings (Sampson and Raudenbush 2004) that different groups of people socially construct, contest, and deploy in debates over neighborhood fate. Criminologists have long known that places that people perceive as dangerous often do not match up with the geographic distribution of crime incidents or rates (Merry 1981). Prickett’s (2014) ethnographic work shows that people develop distinct patterns of meaning making and decision making about physical disorder which are tied to constructions of neighborhood history and perceptions of community identity. Not surprisingly, researchers debate how exactly residents perceive physical disorder and how these perceptions inform how they interpret crime and neighborhood reality (O’Brien et al. 2019; Lanfear et al. 2020). In a comprehensive meta-analysis of research on the effects of community-oriented policing on perceptions of crime and disorder, Gill and colleagues (2014) found that community-oriented policing strategies have positive effects on citizen perceptions of disorder but limited effects on crime and fear of crime.
In a study of data from the 2000 British Crime Survey and the 1991 United Kingdom Census, Tseloni (2007) found that the effects of area characteristics and region on fear of crime, disorder, and property crime rates were not uniform. Drawing on interviews with 394 residents in Winnipeg, Manitoba, Kohm (2009) found that despite high levels of criminal victimization and worry about crime, neighborhood residents cited concerns with disorder rather than crime.
Theoretical and empirical research on the crime–disorder nexus is premised on the idea that perceptions of crime are, in part, a product of individual-level factors and the wider social environment or neighborhood context in which people live. Scholarship has shown that individual-level factors including age, gender, race/ethnicity, level of education, and socioeconomic status influence perceptions of crime (Wilcox et al. 2003; Scarborough et al. 2010). Some research has found that females tend to have higher perceptions of crime and disorder than males (Hipp 2010; Ferraro 1995; Schafer et al. 2006; Skogan 1990); other research has found no relationship between gender and perceptions of crime (Sampson et al. 1997); and other research has found that “men’s fear of crime actually surpasses women’s fear at high levels of perceived risk for those crimes in which men are more likely to be victimized” (Reid and Konrad 2004, p. 399). Research has yielded mixed results concerning the significance of socioeconomic status and education level on perceptions of crime (e.g., see Baba and Austin 1989; Tseloni and Zarafonitou 2008). Research has also found mixed support that homeowners, residents with children living at home, and long-term residents have higher perceptions of crime and neighborhood disorder than renters and residents without children (Hipp 2010; Sampson et al. 1997; Sampson and Raudenbush 2004; Lindblad et al. 2013).
Notwithstanding disagreements over theorizations and empirical analyses of neighborhood social disorder, research has produced contrasting findings related to the impact of neighborhood socio-spatial organization and neighborhood physical disorder (i.e., vacant lots and buildings) on perceptions of crime. On the one hand, social scientists have noted that vacant lots and buildings can create opportunities for criminal behavior and can raise resident perceptions of crime (Bowman and Pagano 2000; Burkholder 2012; Spelman 1993; De Biasi 2017; Sampson et al. 1997; Ellen et al. 2013). On the other hand, some criminologists and social scientists have theorized that perceptions of physical disorder—vacant buildings and vacant properties—may be negatively associated with perceptions of crime (Wood et al. 2010; Foster et al. 2013; Greenberg et al. 1982; Ellen et al. 2013).
We address three major research questions: (1) Do perceptions of physical disorder influence resident perceptions of type of crime (violent crime or property crime) as a neighborhood problem? (2) Do perceptions of physical disorder influence resident perceptions of the level of crime in the neighborhood? (3) Do perceptions of physical disorder influence resident perceptions of the changing magnitude of crime over time? Concerning perceptions of disorder, we assess the influence of vacant lots, vacant buildings, and overgrown vegetation on individual perceptions of crime, controlling for those individual characteristics (i.e., income) that past criminological research has connected to such perceptions.
Our survey uses a multidimensional measure of crime perception, and we distinguish between violent crime and property crime, level of crime in the neighborhood, and perception of changing magnitude of crime over the previous five years. Our crime measures address whether perceptions of physical disorder may impact different perceptions of crime when considering questions of time and socio-spatial change (Hipp and Williams 2020; Hipp and Steenbeek 2016). Specifically, we examine whether perceptions of crime and temporal changes in the perception of crime are influenced by perceptions of physical disorder controlling for individual-level socio-demographic variables. Our multidimensional variable can help evaluate whether perceptions of physical disorder influence perceptions of types of crime and residents’ attitudes about changes in crime over time.
3. Methods and Data Sources
The data for this study come from an anonymous self-report survey delivered to 1944 randomly chosen households living in seven New Orleans neighborhoods. This research was approved by Tulane University’s Socio/Behavioral Institutional Review Board. The intent of the project was to solicit resident feedback on perceptions of different hazards and risks affecting the city. The survey was distributed from March to May 2017 and consisted of a four-page questionnaire of scaled questions. The structured questionnaire contained 18 close-ended questions that asked residents about their perceptions of crime and disorder and included questions that asked the respondent’s race/ethnicity, gender, age, education, employment, income, children living at home, homeownership, and current years living in their current home and in New Orleans.
The study authors delivered surveys door-to-door to households located in the neighborhoods of Bywater, Gentilly, Lakeshore, Lakeview, Lower Ninth Ward, Upper Ninth Ward, and Uptown (see Figure 1). These neighborhoods are not administrative units and do not have specific geographical boundaries. We understand that no consensus exists over how researchers should operationally define “neighborhood.” We distributed 278 surveys to randomly selected addresses in each of the seven neighborhoods. Recruitment materials and survey questions were printed in English. The adult in the household with the most recent birthday was asked to participate in the study. Respondents were asked to complete the survey and return it to researchers in an enclosed, stamped envelope.
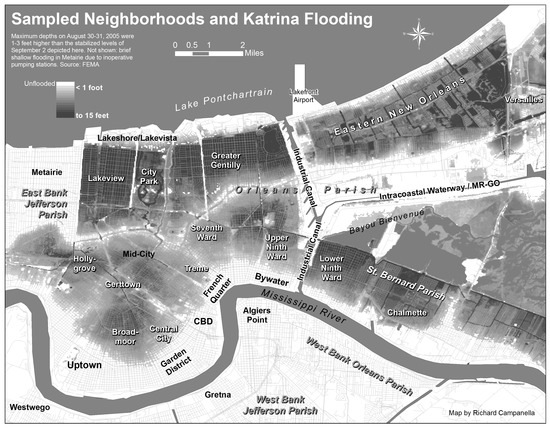
Figure 1.
Sampled Neighborhoods in New Orleans, Louisiana. Figure created by Richard Campanella, Tulane University.
Through June 2017, we received 401 returned surveys for a response rate of 20.1%. This response rate is consistent with other household paper surveys (Dillman et al. 2009). Response rates varied by neighborhood, accordingly: Bywater (20.5%), Gentilly (11.8%), Lakeshore (28.4%), Lakeview (27.7%), Lower Ninth Ward (9.4%), Upper Ninth Ward (12.9%), and Uptown (33.5%). Descriptive statistics of the sample are presented in Table 1.

Table 1.
Characteristics of Survey Respondents.
4. Variables
Our survey uses a multidimensional measure of crime perception, and we distinguish between violent crime and property crime, level of crime in the neighborhood, and respondent perception of changing magnitude of crime over the previous five years. Specifically, we asked three survey questions related to indicators for perceptions of crime: (1) What type of crime do you feel is more of a problem in your neighborhood: property crimes such as vandalism and theft, violent crimes such as assault and armed robbery, or are they about the same? (2) Please rate how high or low the level of crime is in your neighborhood? (3) In the past five years or so, would you say the level of crime in your neighborhood has increased, stayed about the same, or decreased? This question assesses respondent perceptions regarding the temporal nature of crime events in the neighborhood and whether respondents perceive crime events on an upward or downward trajectory of change.
To create a measure of physical disorder, we performed factor analysis with varimax rotation to identify the number of factors measured by questions related to surveyed residents’ perception of disorder (Scarborough et al. 2010). The analysis yielded one factor with five questions from the questionnaire pertaining to the level of vacant buildings and lots in respondents’ neighborhood, the level of overgrown vegetation, and the degree to which respondents viewed vacant lots and buildings and overgrown vegetation as a problem in the neighborhood. We used these questions to create a five-item scale with high inter-reliability (Cronbach’s alpha = 0.89). The Likert distributions of the questions that went into the index have no outliers; no multicollinearity as indicated by VIF values well below 10, the accepted standard threshold and tolerance values below 0.01; with moderately skewed distributions of common factors and inputted data consistent with the use of Likert scales. The multiple items were averaged together to create an index of perceptions of neighborhood disorder measured according to no disorder, low disorder, medium disorder, and high disorder.
Our independent variables included the physical disorder index, gender, education level, household income, employment status, housing status (e.g., renter or homeowner), experience of flooding in home, age of respondent, race, marital status, number of children in household, number of residents in household, number of years in current residence, number of years in New Orleans, and neighborhood.
For the neighborhood variable, we coded Lakeshore as the referent for a number of reasons. This neighborhood is the most socio-economically affluent neighborhood out of the seven neighborhoods and is the most recently built compared to the other urban neighborhoods. The majority of the Lakeshore neighborhood escaped the disastrous Hurricane Katrina deluge that flooded 80 percent of New Orleans (see Figure 1). Finally, the Lakeshore neighborhood is the most suburban of the urban neighborhoods with clear spatial separation of land-uses, large lots, abundance of residential housing, few commercial land-uses, and curvilinear street layouts and cul-de-sacs. Lakeshore is distinguished by its superblock design, an absence of thru-streets, and the presence of separate, non-intersecting vehicular networks. All the other neighborhoods have a mix of residential and commercial land-uses and are organized according to an urban-oriented grid street layout.
We did not include a question about social disorder in our survey because over the last two decades or so, research has challenged the idea that physical and social disorder are conceptually separate and analytically distinct. In the 1980s and 1990s, researchers following “social disorganization” and “broken windows” theories posited that social disorder could be an important indicator of neighborhood quality of life. Later, Sampson and Raudenbush (2004, p. 319) suggested that observed disorder may predict perceived disorder and “the concept of social disorder is imbued with social meanings that go well beyond what the theories imply.” In short, the concept of physical disorder has a more stable, enduring, and spatially visible quality than the concept of social disorder. Blighted and vacant housing, buildings in disrepair, overgrown lots, graffiti, and other visible manifestations of physical disorder can be signs to residents and others about the generalized nature of disorder in a neighborhood (Prickett 2014, p. 216).
5. Regression Model
We use ordinal logistic regression to assess the impact of perceptions of neighborhood disorder on perceptions of crime controlling for individual-level variables and contextual-level variables. We estimate a multiple linear regression function as:
In this equation, logit is the log odds of P, the probability of Y, an ordinal outcome, with j categories occurring. The odds of being less than or equal to a particular category is defined as:
The ordinal regression model is parameterized as:
In this equation, is the interception at the y-axis, is the regression coefficient of , and represents the predictor variables. The assumption of linearity and individual of residuals, as assessed by a Durbin–Watson statistic of 1.78, was met. We ran a series of regression models to assess collinearity diagnostics, and results showed no issues with multicollinearity (VIF values well below 10, the accepted standard threshold and tolerance values below 0.01). The assumption of proportional odds was met as assessed by a full likelihood ratio test for comparing the residual of the fitted location model to a model with varying location parameters, for model 1, χ2 (16) = 129.241, p < 0.001, model 2, χ2 (16) = 48.99, p < 0.001, and model 3, χ2 (16) = 49.2, p < 0.001. The odds ratio is based on the change in the cumulative likelihood of having risk levels for each one-unit change in each independent variable (Menard 1995). The probability of interest, then, is the cumulative probability rather than probabilities of discrete categories (Winship and Mare 1984; Fullerton 2009).
We include in our analyses alpha levels with p-values less than 0.1 given scholarship on the arbitrariness of the α = 0.05 level and the corresponding increase in the chance to commit type II errors with the attempt to reduce type I errors (see for instance, Cohen 2016; Sinclair et al. 2013; Rubin 2021). We denote this expanded alpha level in the interpretation of our findings so that these relationships may be interpreted cautiously. Potentially more important than the α level are the increasingly adopted effect sizes by social science researchers to better quantify the magnitude of the phenomenon of interest (see, Ferguson 2009). Specifically, one advantage of using logistic regression is that odds ratios are themselves unstandardized effect size statistics. Each odds ratio then is controlling for the magnitude of the variable in comparing that variable to other variables within the model. Doing so means that we find more significant relationships than we would otherwise, and thus, this is an important consideration in testing the research hypotheses.
6. Results
The ordinal logistic regression models relate to perceptions of physical disorder, individual level socio-demographic characteristics, and perceptions of crime. The first model, presented in Table 2, assesses perceptions of physical disorder on resident perceptions of the type of crime (i.e., violent crime or property crime) as a neighborhood problem. The second model, reported in Table 3, assesses perceptions of physical disorder on resident perceptions of crime in general. The third model, presented in Table 4, assesses perceptions of physical disorder on resident perceptions of the changing magnitude of crime over time. The deviance goodness-of-fit test and the Pearson goodness-of-fit test indicated that each model was a good fit to the observed data.
Table 2.
Parameter Estimates of Ordinal Logistic Regression Model Predicting Socio-Demographic Characteristics, and Neighborhood on Residents’ Perceptions of Crime Type.
Table 3.
Parameter Estimates of Ordinal Logistic Regression Model Predicting Perceptions of Physical Disorder and Socio-Demographic Characteristics on Perceptions of Crime Level.
Table 4.
Parameter Estimates of Ordinal Logistic Regression Model Predicting Perceptions of Neighborhood Disorder, Socio-Demographic Characteristics, and Neighborhood on Perceptions of Change in Crime.
In the first model, Table 2 shows that as perceptions of physical disorder increase, so does the likelihood of perceiving violent crime as more of a problem than property crime. As income increases, residents are more likely to perceive property crime as more of a problem than violent crime. Residents in the Bywater/Marigny are 7.69 times more likely than Lakeshore residents to perceive violent crime as more of a problem than property crime. Residents in Lakeview are less likely than residents in Lakeshore to perceive violent crime as more of a problem than property crime.
In our second model, we ran an ordinal logistic regression model to evaluate physical disorder perception and individual-level variables on perceived crime in general without distinguishing between violent crime or property crime. Table 3 shows that as residents perceive greater physical disorder, their perception of crime level decreases. Older residents are more likely to perceive higher levels of crime. Residents in the Bywater/Marigny are less likely than Lakeshore residents to perceive higher levels of crime.
In our third model, we ran an ordinal logistic regression model to assess physical disorder perception and individual-level variables on perceived escalation of crime over the past five years. In our survey question, we asked, “In the past five years or so, would you say the level of crime in your neighborhood has increased, stayed about the same, or decreased?” Table 4 shows the parameter estimates and overall results of this ordinal logistic regression model.
Table 4 shows that residents who perceive greater physical disorder are 1.75 times more likely to perceive crime levels as having stayed the same or increased over the previous five years. Residents who identified as Asian or Pacific Islander were less likely than those who identified with other racial categories to perceive an increase in crime. Residents who reported living in their current residences for 6–12 years were less likely than residents who had lived in their residences for more than 12 years to perceive an increase in crime. For the neighborhoods, residents of Lakeview were 2.27 times more likely than Lakeshore residents to perceive an increase in crime. Residents of the Lower 9th were less likely than Lakeshore residents to perceive an increase in crime. Residents of the Upper 9th were also less likely than Lakeshore residents to perceive an increase in crime.
7. Implications
Overall, our findings show that the influence of physical disorder on crime perceptions depends upon the crime type and temporal scale under investigation. In the models, neighborhood residence comes out consistently as a statistically significant predictor of respondent perceptions of crime in some neighborhoods rather than others, but the results are difficult to meaningfully interpret. By coding Lakeshore as the referent neighborhood, we theorized that residents living in this highly affluent, suburban-style neighborhood (i.e., abundance of residential land-use and dearth of commercial land-uses, curvilinear street layouts) would have lower perceptions of crime than those residents living in more urban neighborhood. Lakeshore is characterized by high incomes, predominantly homeowners, low-density residential housing, large lot zoning, and cul-de-sacs. All the other urban neighborhoods we surveyed have an urban configuration—grid street layout and high-density mixed land-uses with a diversity of residential and commercial land-uses.
Scholars currently debate how and under what conditions the organization and design of the built environment impacts residents’ perceptions of crime and disorder. Some examining the association between access to retail or commercial land-uses and feelings of safety have produced mixed results (Foster et al. 2010; McCord et al. 2007; McCrea et al. 2005; Schweitzer et al. 1999; Wood et al. 2008). Wood and colleagues (2008) found that residents in a conventionally designed suburb (i.e., curvilinear street layouts) felt safer than those in a traditionally planned (i.e., grid street layout) or hybrid suburb (i.e., a mix of grid and cul-de-sacs). There is also evidence, however, that residents living in retail-rich neighborhoods tend to be less fearful of crime (Foster et al. 2010). Commercial land-uses and retail land may have a different association with residents’ fear of crime depending on whether the “outcome focuses on the emotional (i.e., fear or anxiety about crime) or cognitive dimension (i.e., perceived risk of victimization) of fear of crime” (Foster et al. 2013, p. 88).
Our research does not provide an unequivocal finding that residents living in a suburban-style neighborhood with residential land-uses have decreased perceptions of crime risk compared to residents living in more urban neighborhoods. It could be that the demographic or socio-economic status of residents are confounding factors. Moreover, researchers have not been able to identify which attributes of the built environment may influence residents’ perceptions of crime and disorder given that both concepts are multidimensional and can have a variety of different meanings to respondents.
According to our findings from Table 3, the perceived level of crime is negatively associated with physical disorder, which is a finding that is at odds with longstanding research on the purported close connection of crime and disorder. Decades of research have shown individual-level differences in perceptions of crime tend to be “positively associated with the degree of independently collected visual signs of disorder in a neighborhood” (Brunton-Smith and Sturgis 2011, p. 340). However, our finding suggests that this crime–disorder relationship is not so clear cut and may be a reflection of the “subjectivity of disorder perceptions” (Janssen et al. 2019, p. 1) and the inherent socially constructed nature of both crime and physical disorder. Our research buttresses this insight. Residents’ subjective perceptions of both crime and physical disorder are “a meaningful aspect of the neighborhood environment” (Sampson 2009, p. 24) and may not be based on seemingly unambiguous “objective level of cues in the environment” (Sampson and Raudenbush 2004, p. 319).
In other analyses, we examined whether individual socio-demographic variables (race/ethnicity, gender, age, education), length of residence, homeownership/renter status, employment status, and presence of children at home predicted perceptions of crime. Research has found mixed support concerning relationships among crime perceptions and female gender, elderly, poor, and non-white residents (Russo et al. 2013; Hipp 2010). Extant scholarship has found mixed support for the hypotheses that residents with children and those with longer residence in a neighborhood perceive more crime or disorder than their neighbors (e.g., see Hipp 2010; Ross and Jang 2000; Ross and Mirowsky 1999).
We did not find that the age, gender status, socio-economic status, or socio-demographic characteristics of respondents were strong predictors of crime perceptions. We found that years in current home was not statistically significant except for in model 3 predicting perceptions of increased crime over time. We found that the presence of children at home was not statistically significant in any of the models. In addition, we did not find employment status or homeownership/renter status to be predictors of perceptions of crime.
For the final model that evaluated respondent perceptions of increasing or decreasing crime levels (see Table 4), results indicate that residents who have lived in their homes 6–12 years are less likely to perceive increased levels of crime in the past five years compared to residents who have lived there 12 years or longer. Some research suggests that length of residence may influence perceptions of crime. Hipp’s (2010) analysis suggested that although residents who have lived in a neighborhood longer might be more aware of neighborhood problems, residents who have just moved into a neighborhood may not be aware of possible crime and social problems. Additionally, Hipp (2010, p. 478) suggests “they also might be inclined toward a particularly rosy view of the neighborhood because they have just chosen to move there.” While Sampson et al. (1997) found a positive relationship between length of residence and perception of crime, Taylor et al. (1984) found no relationship. Only our final model showed length of residence to be a statistically significant predictor, which is a finding that suggests that the relationship between crime perceptions and length of residence is not straightforward and could be more nuanced than what extant criminological research implies.
8. Limitations
We acknowledge several limitations of our research design and analyses. First, we recognize that our sample characteristics do not align with the city’s demographics. That said, we do not attempt to make any statistical generalizations from the sample to the larger urban population. Second, while our response rate (20%) was not particularly low compared to other surveys (e.g., Van Duinen et al. 2015; Terpstra and Lindell 2013), nonresponse and selection effect issues could be a concern. Another limitation of the current study is the cross-sectional research design which confines our data to a specific time, which makes us unable to examine patterns of within-individual or within-cluster change in perceptions over time. Because our study focused only on seven neighborhoods in New Orleans, our ability to generalize these findings to other places is limited. Since we did not include any survey questions on direct and indirect victimization experience, we are unable to evaluate the relevance of past victimization on perceptions of crime or neighborhood disorder. Researchers have found the relationship between victimization and perceptions of crime to be less clear, and scholars have struggled to understand the precise linkages between an individual’s victimization history and his or her level of crime perception (De Biasi 2017). Future studies should consider the influence of prior victimization on perceptions of crime and perceptions of neighborhood disorder controlling for different individual-level and contextual-level variables. While each of the three models suggests a relationship between neighborhood residence and crime perceptions, the results are statistically significant for only a limited number of neighborhoods. Since we do not have neighborhood-level data on the number of vacant homes, vacant lots, and lots with overgrown vegetation, we cannot control for physical disorder on crime perceptions at the neighborhood scale. In addition, the measures we have used for disorder perceptions and crime perceptions are plural and heterogeneous, which may make results of different models difficult to compare.
9. Conclusions
Our major concern in this paper has been to assess whether the influence of physical disorder on crime perceptions depends upon the crime type and temporal scale under investigation. As our analyses demonstrate, perceptions of physical disorder influence resident perceptions of type of crime (violent crime or property crime) as a neighborhood problem; perceptions of physical disorder influence resident perceptions of the level of crime in the neighborhood; and perceptions of physical disorder influence resident perceptions of the changing magnitude of crime over time.
Overall, the findings of our empirial analysis suggest that individual differences in perceptions of crime are influenced and shaped by resident’s socially constructed interpretations of physical disorder—e.g., vacant lots, vacant buildings, and overgrown vegetation. The takeaway is that perceptions of physical disorder appear to play a substantive role in shaping individual perceptions of crime. Perceptions of crime and perceptions of physical disorder operate reflexively and interactively such that each feeds back on the other in a highly complex and contingent manner over time (Brunton-Smith and Sturgis 2011; Markowitz et al. 2001).
Our findings support studies that advocate for multidimensional indicators of disorder and crime to examine how some types of crime may affect residents’ attitudes and behaviors rather than other types of crime (Hipp and Steenbeek 2016). In addition to distinguishing between types of crime, we have also stressed the importance of examining the temporal dynamics of crime (Hipp and Williams 2020) in assessing resident perceptions of crime. Perceptions of crime are influenced by a variety of individual, contextual, and macro-level structures and processes of change (Foster et al. 2013).
Following broken windows theory, criminologists have long hypothesized that visual cues of physical disorder such as graffiti, garbage, and abandoned houses can signify to potential criminals that residents are apathetic to the neighborhood or lack the social cohesion to discourage criminality (Sampson and Raudenbush 2004). Recent research has drawn attention to the inherent subjectivity of those aspects of the built environment that researchers have long considered objective, spatially fixed, and ongoing conditions—e.g., physical disorder (Maguire et al. 2017; Yang and Pao 2015). On the one hand, resident perceptions of physical disorder (as opposed to objective measures such as the number of vacant homes, etc.) may impact individual attitudes of neighborhood quality, identity, and characteristics. On the other hand, “disorder” may not be analogous to crime, a cause of crime, or a reflection or reinforcer of neighborhood disinvestment. An implication of our study is that future research should distinguish between social disorder and physical disorder in the evaluation of perceptions of crime and other perceptions of neighborhood characteristics.
Author Contributions
Methodology, software, validation, formal analysis, data curation, writing—original draft preparation, writing—review and editing, visualization, C.E.B.C.; Conceptualization, supervision, project administration, funding acquisition, writing—original draft preparation, writing—review and editing—K.F.G.; data curation, K.L.-M. and B.P. All authors have read and agreed to the published version of the manuscript.
Funding
This research was funded by the National Science Foundation grant #1313703.
Institutional Review Board Statement
The study was conducted in accordance with the Declaration of Helsinki, and approved by the Institutional Review Board of Tulane University.
Informed Consent Statement
Informed consent was obtained from all subjects involved in the study.
Data Availability Statement
Data are available upon request.
Conflicts of Interest
The authors declare no conflict of interest.
References
- Alper, Mariel, and Allison T. Chappell. 2012. Untangling fear of crime: A Multi-Theoretical Approach to Examining the Causes of Crime-Specific Fear. Sociological Spectrum 32: 346–63. [Google Scholar] [CrossRef]
- Baba, Yoko, and D. Mark Austin. 1989. Neighborhood environmental satisfaction, victimization, and social participation as determinants of perceived neighborhood safety. Environment and Behavior 21: 763–80. [Google Scholar] [CrossRef]
- Barton, Michael S., Frederick Weil, Melinda Jackson, and Darien A. Hickey. 2017. An Investigation of the Influence of the Spatial Distribution of Neighborhood Violent Crime on Fear of Crime. Crime & Delinquency 63: 1757–76. [Google Scholar]
- Boggess, Lyndsay N., and Jon Maskaly. 2014. The spatial context of the disorder–crime relationship in a study of Reno neighborhoods. Social Science Research 43: 168–83. [Google Scholar] [CrossRef]
- Bowman, Ann O’M., and Michael A. Pagano. 2000. Transforming America’s cities: Policies and conditions of vacant land. Urban Affairs Review 35: 559–81. [Google Scholar] [CrossRef]
- Brown, Barbara B., Douglas D. Perkins, and Graham Brown. 2004. Incivilities, place attachment and crime: Block and individual effects. Journal of Environmental Psychology 24: 359–71. [Google Scholar] [CrossRef]
- Brunton-Smith, Ian, and Patrick Sturgis. 2011. Do neighborhoods generate fear of crime? An empirical test using the British Crime Survey. Criminology 49: 331–69. [Google Scholar] [CrossRef]
- Buil-Gil, David, Juanjo Medina, and Natalie Shlomo. 2019. The Geographies of Perceived Neighbourhood Disorder. A Small Area Estimation Approach. Applied Geography 109: 102037. [Google Scholar] [CrossRef]
- Burkholder, Sean. 2012. The new ecology of vacancy: Rethinking land use in shrinking cities. Sustainability 4: 1154–72. [Google Scholar] [CrossRef]
- Chappell, Allison T., Elizabeth Monk-Turner, and Brian K. Payne. 2011. Broken windows or window breakers: The influence of physical and social disorder on quality of life. Justice Quarterly 28: 522–40. [Google Scholar] [CrossRef]
- Cohen, J. 2016. The earth is round (p < 0.05). American Psychologist 49: 997–1003. [Google Scholar]
- De Biasi, Alaina. 2017. Transforming vacant lots: Investigating an alternative approach to reducing fear of crime. Journal of Environmental Psychology 50: 125–37. [Google Scholar] [CrossRef]
- Dillman, Don A., Jolene D. Smyth, and Leah Melani Christian. 2009. Internet, Mail, and Mixed Mode Surveys: The Tailored Design Method. Hoboke: John Wiley and Sons. [Google Scholar]
- Doran, Bruce J., and Brian G. Lees. 2005. Investigating the spatiotemporal links between disorder, crime, and the fear of crime. The Professional Geographer 57: 1–12. [Google Scholar] [CrossRef]
- Ellen, Ingrid Gould, Johanna Lacoe, and Claudia Ayanna Sharygin. 2013. Do foreclosures cause crime? Journal of Urban Economics 74: 59–70. [Google Scholar] [CrossRef]
- Ferguson, Christopher J. 2009. Is psychological research really as good as medical research? Effect size comparisons between psychology and medicine. Review of General Psychology 13: 130–36. [Google Scholar] [CrossRef]
- Ferraro, Kenneth F. 1995. Fear of Crime: Interpreting Victimization Risk. Albany: SUNY Press. [Google Scholar]
- Foster, Sarah, Billie Giles-Corti, and Matthew Knuiman. 2010. Neighbourhood design and fear of crime: A social-ecological examination of the correlates of residents’ fear in new suburban housing developments. Health and Place 16: 1156–65. [Google Scholar] [CrossRef] [PubMed]
- Foster, Sarah, Lisa Wood, Hayley Christian, Matthew Knuiman, and Billie Giles-Corti. 2013. Planning safer suburbs: Do changes in the built environment influence reside’ts’ perceptions of crime risk? Social Science and Medicine 97: 87–94. [Google Scholar] [CrossRef] [PubMed]
- Fullerton, Andrew S. 2009. A conceptual framework for ordered logistic regression models. Sociological Methods and Research 38: 306–47. [Google Scholar] [CrossRef]
- Gau, Jacinta M., and Travis C. Pratt. 2008. Broken windows or window dressing? Citiz’ns’ (in)ability to tell the difference between disorder and crime. Criminology and Public Policy 7: 163–94. [Google Scholar] [CrossRef]
- Gault, M., and E. Silver. 2008. Spuriousness or mediation? Broken windows according to Sampson and Raudenbush (1999). Journal of Criminal Justice 36: 240–43. [Google Scholar] [CrossRef]
- Greenberg, Stephanie W., William M. Rohe, and Jay R. Williams. 1982. Safety in urban neighborhoods: A comparison of physical characteristics and informal territorial control in high and low crime neighborhoods. Population and Environment 5: 141–65. [Google Scholar] [CrossRef]
- Hinkle, Joshua C., and Sue-Ming Yang. 2014. A new look into broken windows: What shapes individuals’ perceptions of social disorder? Journal of Criminal Justice 42: 26–35. [Google Scholar] [CrossRef]
- Hipp, John R. 2010. Resident perceptions of crime: How much is “bias” and how much is micro-neighborhood effects? Criminology 48: 475–508. [Google Scholar] [CrossRef]
- Hipp, John R., and Seth A. Williams. 2020. Advances in Spatial Criminology: The Spatial Scale of Crime. Annual Review of Criminology 3: 75–95. [Google Scholar] [CrossRef]
- Hipp, John R., and Wouter Steenbeek. 2016. Types of crime and types of mechanisms: What are the consequences for neighborhoods over time? Crime and Delinquency 62: 1203–34. [Google Scholar] [CrossRef]
- Hoeben, Evelien M., Wouter Steenbeek, and Lieven J. R. Pauwels. 2018. Measuring disorder: Observer bias in systematic social observations at streets and neighborhoods. Journal of Quantitative Criminology 34: 221–49. [Google Scholar] [CrossRef]
- Houser, Kimberly A., Eric S. McCord, and Evan T. Sorg. 2019. The multilevel impacts of proximate crime generators and attractors on individual-level perceptions of crime risk. Crime and Delinquency 65: 1798–1822. [Google Scholar] [CrossRef]
- Janssen, Heleen J., Dietrich Oberwittler, and Dominik Gerstner. 2019. Dissecting Disorder Perceptions: Neighborhood Structure and the Moderating Role of Interethnic Contact and Xenophobic Attitudes. International Criminal Justice Review, 1057567719896020. [Google Scholar] [CrossRef]
- Kelling, George L., and Catherine M. Coles. 1996. Fixing broken windows: Restoring order and reducing crime in our communities. Simon and Schuster. [Google Scholar]
- Kelling, George L., and James Q. Wilson. 1982. Broken windows. Atlantic Monthly 249: 29–38. [Google Scholar]
- Kohm, Steven A. 2009. Spatial Dimensions of Fear in a High-Crime Community: Fear of Crime or Fear of Disorder? Canadian Journal of Criminology and Criminal Justice 51: 1–30. [Google Scholar] [CrossRef]
- Kubrin, Charis E. 2008. Making order of disorder: A call for conceptual clarity. Criminology and Public Policy 7: 203–14. [Google Scholar] [CrossRef]
- LaGrange, Randy L., Kenneth F. Ferraro, and Michael Supancic. 1992. Perceived risk and fear of crime: Role of social and physical incivilities. Journal of Research in Crime and Delinquency 29: 311–34. [Google Scholar] [CrossRef]
- Lanfear, Charles C., Ross L. Matsueda, and Lindsey R. Beach. 2020. Broken windows, informal social control, and crime: Assessing causality in empirical studies. Annual Review of Criminology 3: 97–120. [Google Scholar] [CrossRef] [PubMed]
- Lindblad, Mark R., Kim R. Manturuk, and Roberto G. Quercia. 2013. Sense of community and informal social control among lower income households: The role of homeownership and collective efficacy in reducing subjective neighborhood crime and disorder. American Journal of Community Psychology 51: 123–39. [Google Scholar] [CrossRef] [PubMed]
- Liska, Allen E., Joseph J. Lawrence, and Andrew Sanchirico. 1982. Fear of crime as a social fact. Social Forces 60: 760–70. [Google Scholar] [CrossRef]
- Maguire, Edward R., Todd Armstrong, and Devon Johnson. 2017. The structure of citizen perceptions of crime and disorder: New insights from a Caribbean community. Journal of Quantitative Criminology 33: 675–99. [Google Scholar] [CrossRef]
- Markowitz, Fred E., Paul E. Bellair, Allen E. Liska, and Jianhong Liu. 2001. Extending social disorganization theory: Modeling the relationships between cohesion, disorder, and fear. Criminology 39: 293–321. [Google Scholar] [CrossRef]
- McCord, Eric S., Jerry H. Ratcliffe, R. Marie Garcia, and Ralph B. Taylor. 2007. Nonresidential crime attractors and generators elevate perceived neighborhood crime and incivilities. Journal of Research in Crime and Delinquency 44: 295–320. [Google Scholar] [CrossRef]
- McCrea, Rod, Tung-Kai Shyy, John Western, and Robert J. Stimson. 2005. Fear of crime in Brisbane: Individual, social and neighbourhood factors in perspective. Journal of Sociology 41: 7–27. [Google Scholar] [CrossRef]
- Menard, Scott. 1995. Applied Logistic Regression Analysis. Thousand Oaks: Sage. [Google Scholar]
- Merry, Sally Engle. 1981. Urban danger: Life in a neighborhood of strangers. Philadelphia: Temple University Press. [Google Scholar]
- Murphy, Alexandra K. 2012. “Litterers” How Objects of Physical Disorder Are Used to Construct Subjects of Social Disorder in a Suburb. The ANNALS of the American Academy of Political and Social Science 642: 210–27. [Google Scholar] [CrossRef]
- O’Brien, Daniel T., Chelsea Farrell, and Brandon C. Welsh. 2019. Looking through broken windows: The impact of neighborhood disorder on aggression and fear of crime is an artifact of research design. Annual Review of Criminology 2: 53–71. [Google Scholar] [CrossRef]
- Perkins, Douglas D., and Ralph B. Taylor. 1996. Ecological assessments of community disorder: Their relationship to fear of crime and theoretical implications. American Journal of Community Psychology 24: 63–107. [Google Scholar] [CrossRef] [PubMed]
- Perkins, Douglas D., John W. Meeks, and Ralph B. Taylor. 1992. The physical environment of street blocks and resident perceptions of crime and disorder: Implications for theory and measurement. Journal of Environmental Psychology 12: 21–34. [Google Scholar] [CrossRef]
- Prickett, Pamela J. 2014. Contextualizing from Within: Perceptions of Physical Disorder in a South Central L.A. African American Mosque. City & Community 13: 214–32. [Google Scholar]
- Reid, Lesley Williams, and Miriam Konrad. 2004. The gender gap in fear: Assessing the interactive effects of gender and perceived risk on fear of crime. Sociological Spectrum 24: 399–425. [Google Scholar] [CrossRef]
- Ross, Catherine E., and John Mirowsky. 1999. Disorder and decay: The concept and measurement of perceived neighborhood disorder. Urban Affairs Review 34: 412–32. [Google Scholar] [CrossRef]
- Ross, Catherine E., and Sung Joon Jang. 2000. Neighborhood disorder, fear, and mistrust: The buffering role of social ties with neighbors. American Journal of Community Psychology 28: 401–20. [Google Scholar] [CrossRef]
- Rubin, Mark. 2021. When to adjust alpha during multiple testing: A consideration of disjunction, conjunction, and individual testing. Synthese 199: 10969–11000. [Google Scholar] [CrossRef]
- Russo, Silvia, Michele Roccato, and Alessio Vieno. 2013. Criminal victimization and crime risk perception: A multilevel longitudinal study. Social Indicators Research 112: 535–48. [Google Scholar] [CrossRef]
- Sampson, Robert J. 2009. Disparity and diversity in the contemporary city: Social (dis) order revisited. The British Journal of Sociology 60: 1. [Google Scholar] [CrossRef] [PubMed]
- Sampson, Robert J., and Stephen W. Raudenbush. 2001. Disorder in Urban Neighborhoods: Does it Lead to Crime; Washington, DC: US Department of Justice, Office of Justice Programs, National Institute of Justice.
- Sampson, Robert J., and Stephen W. Raudenbush. 1999. Systematic social observation of public spaces: A new look at disorder in urban neighborhoods. American Journal of Sociology 105: 603–51. [Google Scholar] [CrossRef]
- Sampson, Robert J., and Stephen W. Raudenbush. 2004. Seeing disorder: Neighborhood stigma and the social construction of “broken windows”. Social Psychology Quarterly 67: 319–42. [Google Scholar] [CrossRef]
- Sampson, Robert J., Stephen W. Raudenbush, and Felton Earls. 1997. Neighborhoods and violent crime: A multilevel study of collective efficacy. Science 277: 918–24. [Google Scholar] [CrossRef]
- Scarborough, Brittney K., Toya Z. Like-Haislip, Kenneth J. Novak, Wayne L. Lucas, and Leanne F. Alarid. 2010. Assessing the relationship between individual characteristics, neighborhood context, and fear of crime. Journal of Criminal Justice 38: 819–26. [Google Scholar] [CrossRef]
- Schafer, Joseph A., Beth M. Huebner, and Timothy S. Bynum. 2006. Fear of crime and criminal victimization: Gender-based contrasts. Journal of Criminal Justice 34: 285–301. [Google Scholar] [CrossRef]
- Schweitzer, John H., June Woo Kim, and Juliette R. Mackin. 1999. The impact of the built environment of crime and fear of crime in urban neighborhoods. Journal of Urban Technology 6: 59–73. [Google Scholar] [CrossRef]
- Sinclair, J., P. J. Taylor, and S. J. Hobbs. 2013. Alpha level adjustments for multiple dependent variable analyses and their applicability—A review. International Journal of Sports Science and Engineering 7: 17–20. [Google Scholar]
- Skogan, Wesley. 1990. Disorder and Decline: Crime and the Spiral of Decay in American Cities. Berkeley: University of California Press. [Google Scholar]
- Spelman, William. 1993. Abandoned buildings: Magnets for crime? Journal of Criminal Justice 21: 481–95. [Google Scholar] [CrossRef]
- Taylor, Ralph B. 1999. The incivilities thesis: Theory, measurement, and policy. In Measuring What Matters: Proceedings from the Policing Research Institute Meetings; Edited by Robert H. Langworthy. Washington, DC: National Institute of Justice. [Google Scholar]
- Taylor, Ralph B. 2001. Breaking Away From Broken Windows: Baltimore Neighborhoods and the Nationwide Fight Against Crime, Grime, Fear, and Decline. Boulder: Westview. [Google Scholar]
- Taylor, Ralph B., Stephen D. Gottfredson, and Sidney Brower. 1984. Block crime and fear: Defensible space, local social ties, and territorial functioning. Journal of Research in Crime and Delinquency 21: 303–31. [Google Scholar] [CrossRef]
- Terpstra, T., and M. Lindell. 2013. Citizens’ perceptions of flood hazard adjustments an application of the protective action decision model. Environment and Behavior 45: 993–1018. [Google Scholar] [CrossRef]
- Tseloni, Andromachi. 2007. Fear of Crime, Perceived Disorders and Property Crime: A Multivariate Analysis at the Area Level. In Imagination for Crime Prevention: Essays in Honor of Ken Pease. Crime Prevention Studies. Edited by G. Farrell, K. Bowers, S. D. Johnson and M. Townsley. New York: Criminal Justice Press, vol. 21, pp. 163–85. [Google Scholar]
- Tseloni, Andromachi, and Christina Zarafonitou. 2008. Fear of Crime and Victimization: A Multivariate Multilevel Analysis of Competing Measurements. European Journal of Criminology 5: 387–409. [Google Scholar] [CrossRef]
- Van Duinen, R., T. Filatova, P. Geurts, and A. van der Veen. 2015. Coping with drought risk: Empirical analysis of farmers’ drought adaptation in the south-west Netherlands. Regional Environmental Change 15: 1081–93. [Google Scholar] [CrossRef]
- Ward, Jeffrey T., Nathan W. Link, and Ralph B. Taylor. 2017. New windows into a broken construct: A multilevel factor analysis and DIF assessment of perceived incivilities. Journal of Criminal Justice 51: 74–88. [Google Scholar] [CrossRef]
- Wilcox, Pamela, Neil Quisenberry, and Shayne Jones. 2003. The built environment and community crime risk interpretation. Journal of Research in Crime and Delinquency 40: 322–45. [Google Scholar] [CrossRef]
- Winship, Christopher, and Robert D. Mare. 1984. Regression models with ordinal variables. American Sociological Review 49: 512–25. [Google Scholar] [CrossRef]
- Wood, Lisa, Lawrence D. Frank, and Billie Giles-Corti. 2010. Sense of community and its relationship with walking and neighborhood design. Social Science and Medicine 70: 1381–90. [Google Scholar] [CrossRef]
- Wood, Lisa, Tya Shannon, Max Bulsara, Terri Pikora, Gavin McCormack, and Billie Giles-Corti. 2008. The anatomy of the safe and social suburb: An exploratory study of the built environment, social capital and residents’ perceptions of safety. Health and Place 14: 15–31. [Google Scholar] [CrossRef]
- Yang, Sue-Ming. 2010. Assessing the spatial–temporal relationship between disorder and violence. Journal of Quantitative Criminology 26: 139–63. [Google Scholar] [CrossRef]
- Yang, Sue-Ming, and Chih-Chao Pao. 2015. Do we “see” the same thing? An experimental look into the black box of disorder perception. Journal of Research in Crime and Delinquency 52: 534–66. [Google Scholar] [CrossRef]
- Yang, Sue-Ming, Joshua C. Hinkle, and Laura A. Wyckoff. 2018. Using multitrait-multimethod (MTMM) techniques to examine the convergent and discriminant validity of social disorder. Journal of Research in Crime and Delinquency 55: 571–608. [Google Scholar] [CrossRef]

Disclaimer/Publisher’s Note: The statements, opinions and data contained in all publications are solely those of the individual author(s) and contributor(s) and not of MDPI and/or the editor(s). MDPI and/or the editor(s) disclaim responsibility for any injury to people or property resulting from any ideas, methods, instructions or products referred to in the content. |
© 2023 by the authors. Licensee MDPI, Basel, Switzerland. This article is an open access article distributed under the terms and conditions of the Creative Commons Attribution (CC BY) license (https://creativecommons.org/licenses/by/4.0/).