Abstract
The COVID-19 pandemic has deeply influenced the economy of all nations, and Mexico is no exception. This effect is distinct for different groups of the population, with variable socio-economic and demographic characteristics, that live in regions of contrasting features. An efficient apparatus for measuring expenditure variations and tendency is the National Household Income and Expenditure Survey performed by the National Institute of Statistics and Geography in accordance with the international standardization established at the Canberra Conference; the latter permits, every two years, for different surveys to be comparable in time and space. Hence, in Mexico, there are three surveys for 2018, 2020, and 2022. The results of the comparison indicate that different groups of the Mexican population have experienced the pandemic with multiple impacts, apparently without large proportional variation regarding expenditure but with greater variation in time-use conditions. Moreover, it became apparent that even though the lower strata of Mexico’s population have fewer proportional variations concerning income after the COVID-19 outburst, they must incorporate more family members into working activities to achieve a survival line; the latter results in the abandonment of school from various young household members that will negatively impact the quality of their lives in the long term.
1. Introduction
COVID-19 outbreak is an ongoing pandemic caused by the coronavirus SARS-CoV-2 that has quickly spread worldwide through human-to-human transmission (Kruse 2020). Nevertheless, what is worth mentioning is that aside from being a worldwide health crisis responsible for millions of deaths, COVID-19 is also having critical impacts on the world economy, and experts have anticipated that COVID-19 is going to decrease global gross domestic product growth at a percentage between 2.9% and 2.4% for 2020 (Gupta et al. 2020). Due to the globalization phenomenon, the whole world can be considered a unified global community, where any significant change in one part of the world is capable of coursing important consequences in the rest of the world. Since the World Health Organization declared the above-mentioned outbreak a pandemic, many countries have closed borders and established confinement practices to avoid contagion (Kyriakidis et al. 2023). As a result, the flow of goods and services has been reduced, and most businesses and companies were closed temporarily; hence, the economic impact has begun to be felt around the world (Chiatchoua et al. 2020).
A good starting point to understand the effects of the pandemic on the global economy can be offered by Deloitte´s remark that “COVID-19 has a threefold impact on the global economy (Maital and Barzani 2020): (a) The direct influence on production, (b) the generation of supply chain disruption and therefore market disturbance and (c) the severe financial impact on market and businesses. The primary effect of COVID-19 is related to the supply side of the economy, as factory closures worldwide can lead to a shrinking in the macroeconomic supply of services, materials, and goods, moving the world´s economy to a looming panorama that embraces higher prices and reduced output. In parallel, COVID-19 has the capacity to generate a significant reduction in demand levels because of factories´ closure and the loss of jobs that will make customers spend less. The aforementioned decrease in spending can be aggravated by the constant raising of prices and the phenomenon of inflation. Some of this contraction, in terms of demand, may be short-lived as the retreat of the pandemic crisis and the relaxation of physical confinement measures will make the people feel “free” again and raise their spending on special occasions (e.g., vacations, entertainment). However, some of the demand will be forever lost, decreasing worldwide economic growth on a long-term basis (Maital and Barzani 2020).
The short-term expectation for the world economy show negative effects regarding the markets, as well as the world stock indices (Baldwin and Di Mauro 2020). By way of illustration, during February and March, Italy reported its biggest fall in the stock market with 41%, China 13%, while the Dow Jones and the Mexican Stock Market presented falls of 33% and 22%, respectively. At the global level, annual falls in GDP of 3.8% are indicated in the United States, 9% in the Euro area, 2.1% in Japan, and a slowdown in China that would lead to a growth equal to only 3%. This is a world recession scenario, forcing global economies to face a contraction in the medium term without a rapid recovery (CEPAL 2020). Latin America and the Caribbean face the COVID-19 health crisis as an enormous social challenge whose economic effects could lead the region to a new lost decade (Chiatchoua et al. 2020).
The pandemic has been particularly harmful to economic activity in Mexico, where GDP initially declined by 8.5% and formal employment by 5% (Flores 2020; IMSS 2020). Despite the severity of the recession, the Mexican government has offered no new public policies to aid affected groups, unlike counterparts in high-income countries (von Gaudecker et al. 2020) and similar Latin American countries (Hale et al. 2021). Moreover, compared to high-income countries, Mexico has fewer remote work opportunities and weaker public support systems (Peluffo and Viollaz 2021; Hoehn-Velasco et al. 2022). In Mexico, the pandemic also affected various sectors of the economy. For example, between March and April, more than half a million jobs were lost (Flores 2020; Banco de México 2020) over the last four months. The quarantine measures adopted by the Mexican government to deal with the pandemic have drastically reduced national production. In addition to that, the fall in exports and imports has made products more expensive in the markets, leading to an increase in inflation. The tourism sector was also strongly affected, not to mention a decrease in remittances and an increase in violence, both in homes and in organized crime (Chiatchoua et al. 2020).
However, evidence has shown that the economic effect of COVID-19 is distinct for different groups of the population, with variable socio-economic status, age, and gender, that live in regions of contrasting features. Nowadays, it cannot be specified with certainty if the full extent of changes that have occurred in the income and expenditure of families after the onset of the pandemic is the result of the latter. Nevertheless, COVID-19 is certainly a facilitator of the aforementioned changes. Thus, the estimation of the above variations is shown as an approximation to the problem.
Before this new situation imposed by the current health crisis, the ideas and concepts found in the literature related to the effect of the pandemics on the economy were presented from a historical perspective so as to make use of history as a point of reference and understand the importance of several pandemic events. This vision is also important to distinguish a pandemic that changes demographic structure from a pandemic like COVID-19, which, despite its fatality, does not reach that level. After the historical outline focused on the economic effects of COVID-19, the estimation of variation for four socio-economic groups is presented so as to note differences in how the post-pandemic groups have experienced COVID-19 and how their economic activity has been modified due to the pandemic. The objective of this study is to realize how the income of families has been affected according to their socio-economic group after the pandemic and to observe possible economic facts around this event. We seek to understand whether there has been a change in household income and expenditure and whether this has been similar among the different groups or if it has been inequitable. Moreover, we shed light on the discussion concerning the economic shares of each group versus variation.
The remainder of this paper is organized as follows. Section 2 establishes the theoretical background of the paper; in this section, the effects of the pandemics on history are presented, along with the effect of the pandemics on the economy. The discussion of the COVID-19 pandemic constitutes a leveler and the relation of the pandemic with inequity under the syndetic concept; finally, in this section, the inequity pattern and changes in Mexican pandemics can be appreciated. Section 3 discusses the methodology followed. Section 4 presents the main results of the present study, while Section 5 contains the discussion of the paper. Finally, in Section 6, the conclusions of the manuscript are presented.
2. Theoretical Background
2.1. Effect of Pandemics on History
It is widely recognized that great pandemics are capable of decisively contributing to the change of the course of history in many possible ways: By tilting the balance in favor of one army or another, by ending entire native populations, and in some cases, by accelerating the evolution from one mode of production to another. The pandemics can also expand beyond social evolution and can influence the genetic evolution of the human species, which, due to exposure to viruses, can become more resistant to certain organisms (Van Blerkom 2003). Hence, pandemic phenomena have an impact on the social, physical, demographic, medical, political, and economic sectors of society as a whole (Hernández-Mesa et al. 2020), leaving traces almost always not only to the medical sector but to the social one as well (Tuesca Molina et al. 2021). Thus, on the one hand, there is the very nature of the pandemic effect concerning human health, and on the other hand, there is the effect on the economy, population, and society.
Observing how these events have affected social and economic relations in history can help us understand the impact we can expect from the ongoing pandemic and, hence, review the actions of nations to mitigate its effects. In this study, we are particularly interested in the income variations due to unemployment and the configuration of health systems that may be more convenient based on previous experiences (Ceylan et al. 2020). For this reason, González (2021), who studies the diseases of the black plague and Spanish fever, highlights the need to review the current health crisis via the lens of historical epidemiology to learn about the implications of COVID-19 and through them to take “collective, reflective and transformative” actions. Nevertheless, the need to study pandemics from a historical point of view became evident until the 60s, as before that year was not considered of interest.
Historical epidemiology uses the literature of writers such as Boccaccio, Manzoni, and Mann or historical treaties of Roman and Greek historians such as Amiano, Marcellin, Eutropius, and Thucydides, who by accurately narrating pandemics, allow modern doctors to approach valid diagnoses. Moreover, viral paleontology applied to human remains such as mummies or bones, upon which genetic techniques draw information, is also useful (Kilbourne 2004). Thus, history is a reliable source, which reveals to us how pandemics are important in terms of historical evolution, as confirmed by the following brief historical review.
2.1.1. Classical Era
During the so-called classical era of history, the course of Athenian protagonism changed to Spartan (MacKay 2021), when the first known pandemic called “the plague of Athens” (430 to 426 BC) affected the city-state of Athens and brought as a consequence the fall of the Athenian dominance, through the reduction of the population to one third, including the death of Pericles, which was synchronized with the Peloponnese War, and unlike other Greek wars it was of such long duration and effect, that it completely changed the configuration of the cities political systems (Ludueña Romandini 2015). With this turn of events, Spartan rule began, shifting the world towards a more military vision. Centuries later, Rome was paralyzed by the Antonine Plague (165–180 AD), with which the decline of the Roman empire began via the reduction of labor, with dozens of emperors’ changes and anarchy. According to MacKay, “The map of Europe is born through the demise of Roman Empire”. Later follows the plague of Cyprian (240 and 262 AD), which served as a signal of divine punishment, contributing ideologically to the expansion of Christianity and the transition to the Christian era. Finally, the plague of Justinian (541 AD) had a drastic and permanent effect on the social fabric of Western civilization for its contribution to the hunger and fall of the Justinian kingdom, laying some bases for the transition to the feudal system and the birth of nations (Sabbatani and Fiorino 2009; Tuesca Molina et al. 2021).
2.1.2. Medieval Era
Bubonic plague existed in African countries before 500. However, it is in 542 when it appears in Europe (Wyman 1897), that is, almost with the entry of the medieval age. Therefore, Pandemics were a decisive factor in the transition from ancient to medieval times (Little 2007), as they affected multiple places differently; Florence, for instance, due to its rise, was affected severely, as in three months of the pandemic had lost 20% of its population; In the book of Decameron, the aforementioned situation is described very well. In the face of this desperate situation, the church began to lose its faithful when prayers bore no fruit; the disease attacked equally the rich and the poor, but the latter were more vulnerable because of the poor hygiene conditions in which they lived. The effect marked a major recession characterized by rising prices, agricultural crisis, and social tensions, ending the agrarian era and highlighting the transition to the city. In the latter part of the medieval era, black plague (1346–1351) killed approximately 24 million Europeans (Watts 2000).
2.1.3. Renaissance
The plague was still present at the age of the Renaissance. However, a widespread disease at this time was syphilis, which also had the names “French disease” and “Naples disease”, among others. The name syphilis comes from the name of a pastor for whom it was said that he acquired the disease for living an immoral life. Unlike other pandemics, despite being so severe, syphilis did not end whole populations but radically changed the habits of people at the time, and although for several centuries no cure was found, some evidence suggests that the symptoms were lessened (Tognotti 2009), because of the birth of scientific medicine via the splendor of anatomy.
2.1.4. Industrial Age
No era is saved from pandemics, and the industrial age is no exception in that rule. Since 1817, cholera, the most characteristic disease of the era, strongly attacked different cities during the industrial era. Johnson (2008) reveals how a change in urban and scientific vision, through a geographic method, allowed the understanding of the problem in London by identifying the agents (rats) responsible for the propagation of the disease.
2.1.5. 20th Century
Despite the fact that in the twentieth century, science had developed greatly, and as a consequence, humanity already knew about viruses and bacteria, there were important pandemics. The pandemic of the Spanish flu, less than 100 years ago, was the event that produced the greatest economic shock in the world, behind World War II, World War I, and the great depression, greatly contributing to the reform of health systems (González 2021). Ceylan et al. (2020) also analyze the case of Spanish fever, with more than a quarter of a million deaths, which is three times more than the deaths provoked by COVID-19 in Mexico now.
2.2. Pandemics Effect on the Economy
The demographic and social changes caused by pandemics lead to economic changes, proving that society as a whole, in these situations, is also ill and that within the sum of individual diseases, not all people are experiencing pandemics in the same way. There are groups, such as poor people, that are more vulnerable, even though they are adjusting more due to the disease within a selection process (Webber 2015), and have tended to suffer and die more at these catastrophic events. Some people believe that COVID-19 will have the greatest economic effects since the Great Recession, and some think it will be an accelerator for changes that have already been taking place slowly, as well as environmental actions in an economy that necessarily needs to be restructured (Beker 2020). Almost all of the literature agrees that COVID-19 will have several negative effects on specific sectors of nations, especially if no action is taken by governments. Globally, markets have reacted with volatility for not being able to predict future stocks. Furthermore, several investment decisions are being postponed, and workers who had previously been suspended are being fired. Also, there are also bankruptcy declarations, all of which are compounded by the decrease in oil prices (during the lockdown periods). In the United States of America, the worst unemployment has been observed since the Great Recession (Weiss et al. 2020), while in Uruguay, there is evidence that government measures designed to contain the effect of increasing poverty by the pandemic are insufficient (Brum and De Rosa 2020).
2.3. Uneven Effect during Pandemic Events and Global Leveling Impact
In addition to economic problems caused by a pandemic, the latter can also generate and intensify inequity issues among different social groups. In pandemics, the most vulnerable groups of the population, such as children, the elderly, and people of lower income, are often affected, as demonstrated by the development of H1N1 or Spanish flu (Bambra et al. 2020), and revealed by Sydenstricker’s seminal work. This type of pandemic situation leads us to the definition of a syndemic, that is, a pandemic combined with social determinants. A syndemic is a pandemic phenomenon that is affected and aggravated by inequity, exclusion, and other social problems (Lores-Murguía 2021).
Within the framework of a syndemic, there are two very important moments to observe. Firstly, during the course of the event, the general rule, almost without exception, is that the poorest or socially segregated sectors are more vulnerable. Secondly, there is the phase after the pandemic, where the most vulnerable sectors are likely to regain value in their wages because of the reduction in labor supply. Scheidel calls the latter phase a leveling effect that may occur, according to his conclusions, as a result of wars, revolutions, or government falls: “In pre-modern agrarian societies, pests contributed to that by altering the proportion of land and labour, reducing the value of the former (as documented by land prices, leases and prices of agricultural products) and increasing the latter (in the form of higher real wages and lower leases). This served to make landlords and entrepreneurs less wealthy, and workers to improve their conditions, by reducing income and wealth inequality.” (Scheidel 2018). However, this improvement in equity is relative, as it comes through the reduction of the wealth of the same population (rich people), which throughout history has caused great suffering to the group (poor people) that would benefit economically due to the circumstances. Scheidel, who coined the term leveling effect, has studied the black death and other pandemics. The latter reduced the price of land and food but simultaneously increased the demand for labor, giving millions of poor people access to both. In parallel, the nobility contracted, and many rental houses disappeared, leaving the houses to their tenants. Nevertheless, as the author himself argues, the second plague did not have the same effect because the well-to-do classes developed strategies so that catastrophic events of this nature did not affect their wealth. However, according to the author’s new considerations (Scheidel 2020), current pandemics do not reduce the population substantially, such as the black plague that reduced the population by 45 to 60%, or various pandemics that struck Mexico (in the age of colonization and Mexican revolution) and had similar behavior and effects. His recent view is that any COVID-19 outcome can be expected to severely affect unemployment but not to generate extremely high mortality rates so as to affect labor prices.
2.4. Is COVID-19 a Leveler?
Bernardi (2020) points out, through the earliest available data, that COVID-19 is certainly not a leveler factor; on the contrary, some minority ethnic communities are at higher risk of mortality in countries such as England, the United States of America, and France, where there is the risk that this situation will remain according to the duration of the pandemic due to increasing unemployment and underemployment rates. For their part, Adams-Prassl et al. (2020) confirm through their study, which is based on real-time surveys from the United States and the United Kingdom, that those who are most likely to lose their jobs are women, less qualified people and those who have non-permanent employment contracts. In general, people with lower qualifications can lose their jobs more easily, and younger people are at high risk of seeing their income diminished, giving a generalized feeling among workers that they will lose their jobs with a perceived probability of 30%; this is also observed in Germany although to a lesser degree; Adams-Prassl et al. (2020), assure that the worst of the pandemic is not its terrible effects on the economy, but rather than they are extremely inequitable. Blundell et al. (2020) show, via different data coming from various sources in the United Kingdom, how the pandemic will have long-term effects on inequity in employment, family life, and health by aggravating existing inequalities in the dimensions of gender, age, education, ethnicity, and geography, where the most vulnerable groups (those who work independently, the youngest, those who have less education) will experience a greater probability of losing their job or seeing their salary reduced, in contrast to those who live in better conditions, with sufficient space at home so that to educate their children and work there (teleworking) at the same time (Blundell et al. 2020).
There are also studies that analyze the impact of COVID-19 in India, a country with great social differences, where the most affected castes have been the poorest (Deshpande and Ramachandran 2020). Another study carried out on 2040 Israelis during the pandemic shows that the pandemic not only has no leveling effect on the income of women versus men but, on the contrary, affects women more. A supplementary study (Kristal and Yaish 2020) that moves in the same direction confirms the particular vulnerability of African-Americans, Latin-Americans, and generally migrant communities in the urban centers of the United States, partly because they are essential workers (Van Dorn et al. 2020).
The same situation has been appreciated (at a lower rate) in countries such as Denmark, where inequality was found in the form of disadvantaged learning opportunities for lower-income families, as measured by the ease of use of library books at home (Jæger and Blaabæk 2020).
In addition to seeing the dangers of COVID-19, researchers also appreciate opportunities generated by it in a variety of spaces like hospitals, offices, and homes. An example of this is the development of tele-medicine, which includes remote consultation and teamwork, requiring skills that a large number of medical staff have just acquired due to the ongoing health crisis (Iyengar et al. 2020). This reality has also been an opportunity to develop teleworking, which has led to higher productivity in some professions, such as software developers (Oliveira et al. 2020). Nevertheless, the fact that COVID-19 offers opportunities for both development and prevention does not mean that it cannot negatively deteriorate the lives of millions of people.
Bernardi (2020), who points to the already-known fact that COVID has had the greatest effect on low-income and ill-educated people, has also wondered whether the ongoing pandemic has had that leveling effect. In reality, the theory of leveling effect and the evidence that pandemics mainly bind the poorest people are not in contradiction. Although the evidence speaks of the strongest effect against disadvantaged people, the leveling effect speaks of the post-pandemic outcome and does not consider the distribution of effects during the pandemic. Nowadays, the new Coronavirus faced a much more developed science that was able to cope with it in real-time, so mortality rates did not reach a critical level and did not significantly decrease population, as with previous pandemics, but did manage to reduce economic activity. Kalabikhina (2020) considers that the effect of COVID will not be on a demographic level. Unlike other pandemics of the past, COVID-19 failed to modify the structure of the population because of the number of human losses that did not reach past rates. Hence, the present situation can be seen as a window of opportunity for development and gender equity.
2.5. Inequity and Changes in Mexican Pandemics
In Mexico, the phenomenon of inequity is very characteristic. Since the age of Humboldt back in 1827, it was described how the most varied epidemics struck the territory of New Spain, severely affecting the poorest population, which, according to Torquemada, had killed eighty thousand Indians in 1545 and two million in 1576. Furthermore, during the 16th and 17th centuries, the morbid variety continued to impact, mainly, the indigenous population due to the fact that the latter was not immune to the new diseases such as yellow fever, malaria, measles, typhus, colds and smallpox brought by the Spanish conquerors, which all together reduced the indigenous population to 80%. In Mexico City, before the Spanish arrival, there were between 250,000 and 400,000 inhabitants, and almost two centuries later, this number has been reduced to 104,750 inhabitants, as indicated by the first census of population (Rodríguez and Rodríguez de Romo 1999). During the 19th century, smallpox continued (1813), as well as measles (1825) and cholera, which mainly affected indigenous people (Velasco 1992). However, pandemics did not stop; for instance, typhus had outbreaks in 1813, 1848, 1877, and 1878. Guillermo Prieto, via his chronicles, describes how typhus is more likely to affect the poorest neighbourhoods because the lack of ventilation in their houses favors the development of diseases (Rangel 2011). The observation that the most recurrent victims of epidemics are those of lower socio-economic status can be confirmed by researchers based on epidemiological data (Serrano-Cumplido et al. 2020; Márquez 1991). The Mexican Revolution did not stop the epidemic selectivity that continued to attack families with insufficient ventilation. In Mexico City, the disease of Spanish fever attacked more severely, where there were large numbers of poor people that are much more vulnerable because of malnutrition and overcrowding (Márquez Morfín and Molina del Villar 2010).
In the case of Mexico, selective differences related to the risk of suffering from COVID-19 and the severity of its symptoms have been noticed among different social groups. Once again, the most vulnerable ones are the people coming from lower socio-economic groups. Ortiz-Hernández and Pérez-Sastré (2020) classified the registered cases into four levels of severe forms of COVID-19 (hospitalization, pneumonia, intubation, and death), the inhabitants of more marginalized areas, as well as those of Indian origin, present a greater risk of pneumonia, hospitalization, and death. Moreover, it should be noted that while in private hospitals the risk of death is lower, the use of intubation or the admission to the intensive care unit is greater”. According to this information, it is necessary to pay attention to the social risk factors of COVID-19. Suárez and Martínez (2020) observe the inequality produced by COVID in the educational sphere, highlighting the effect of Internet access and the usage of digital tools for education, both for students and teachers, as well as the knowledge to use them, whose lack constitutes a digital barrier between groups. In addition, industrial and commercial jobs are more easily exposed to the effects of the pandemic, while people who work in the tertiary sector of the economy, especially in offices, can benefit from the pandemic, thanks to work schemes that permit working at home, which allows them to reduce the consumption of resources. In this way, the most vulnerable lose, and the least vulnerable win.
The very nature of the pandemic does not cause inequity but rather reveals the inequity that has been brewing for decades (Ben Yahmed et al. 2020). The study of Neidhöfer projects the consequences of confinement, which, although favoring the reduction of mortality, may also have long-term intergenerational consequences on social mobility among the most vulnerable groups due to the closure of schools. These risks can be mitigated via inclusive plans with their derived strategies and public policies (Neidhöfer et al. 2021).
School closure was one of the main measures for securing social distance and was indeed a very effective one (Neidhöfer and Neidhöfer 2020). Nevertheless, the negative consequences of such a measure can be appreciated in the long term. A study based on the short-term consequences of schools’ closure in Argentina, Brazil, Colombia, and Mexico reveals that the impact in terms of inequity will be great as compensation for additional expenditure on school assistance will result in a large amount of compensation in Brazil, moderate in Colombia and Argentina, and zero in Mexico, where there has been no such consideration. Thus, in all four previously mentioned countries, the effects are very unequal for different social groups, and policies will not be able to contain the impact of the pandemic on education (Lustig et al. 2020). In that way, it can be appreciated that in different places, the pandemic has had strong effects, from which some groups have suffered greatly, but others have benefited. However, what is common in many parts of the world, and also in Mexico, has been the fact that vulnerable groups are the most affected factor by the pandemic.
3. Materials and Methods
In this paper, the income and expenditure of families, according to their socio-economic status in the post-COVID-19 era, are compared with respect to a defined baseline. Our baseline is the scenario that allows us to measure family income and expenditure before the pandemic, which represents the information contained in the National Survey of Household Income and Expenses 2018 (ENIGH 2018 in Spanish), while our point of comparison is the one contained in ENIGH 2020 and ENIGH 2022. In this way, by comparing three time periods that coincide with important moments regarding the pandemic (pre-COVID-19, during COVID-19, and post-COVID-19, it is feasible to perform an ex-ante evaluation concerning households’ income and expenditure due to the coronavirus crisis. However, it would not be fair to give all the credit for these changes to COVID-19 because, within the three examined periods of time (2018, 2020, and 2022), other events happened that could also impact the economy of households such as governmental changes, climate crisis, catastrophic natural phenomena and the economic importance of oil. Nevertheless, COVID-19 is a crucial variable that has modified humanity´s everyday activities and, therefore, should not be forgotten from time comparison economic analyses.
The sample size of ENIGH 2018 was equal to 87,826 households visited from 21 August to 28 November 2018. The sample size of ENIGH 2020 was 105,483 households visited from 21 August to 28 November 2020, while the sample size of ENIGH 2022 was 105,525 visited from 21 August to 28 November 2022. In total, there were 100 days of data collecting, and prices were updated from the first period to the second. In other words, prices were held as of August 2020 by means of the National Institute of Statistics and Geography (INEGI in Spanish) inflation calculator, which estimates an inflation rate of 7.34, which is equivalent to a factor of 1.0734 which was used to convert the prices of ENIGH 2018 to August 2020 prices. Moreover, the prices of 2022 were adjusted to the second time period, and the inflation factor is equal to 0.8709. It was decided to do so and keep the prices constant within the three time periods, as in our study, the focal point is not the inflation factor but rather the price update factor. For all of the three surveys, the micro-data contained in the INEGI servers of 2018, 2020, and 2022 were used. The main variables per household (concentradohogar) and household expenditure (gastoshogar) files were used. The first file contains a summary of income-expenditure variables as well as a general composition of each household, while the second file provides details associated with the type of economic sector in which each household spent.
3.1. Data about Different Geographic Regions (States)
The three aforementioned surveys (ENIGH 2018, ENIGH 2020, and ENIGH 2022), through the considered samples, are capable of providing data at a state level. Hence, variables were estimated at this level, which could be used in regard to the inequity index calculated for each of the three time periods.
3.2. Data about Distinct Socio-Economic Status
For the comparison of socio-economic groups, the technique established by INEGI has been used. INEGI ranks the socio-economic strata into four categories. These have been established through a multivariate socio-economic analysis. The category characterized as “High” is approximately equal to decile X. The category characterized as “Medium-high” is equal to IX and VIII, the category established as “Medium-low” is equal to VII, VI, V, and IV, while the last category (Low) is equal to III, II, I. In the following table (Table 1), the participation of different socio-economic status categories can be appreciated.

Table 1.
Participation of the socio-economic status INEGI 2018, 2020, and 2022.
4. Results
4.1. Inequity Related to Different Geographic Regions
An important issue within the discussion of the paper is whether the pandemic increases inequity. The literature and the narrative of the argument allow us to perceive that there is inequity in the effects of the pandemic within different socio-economic groups. However, in the post-COVID-19 period, which represents the second and third periods studied (2020 and 2022), this cannot yet be seen in the indicators of inequity.
The Hoover Index, also known as the Robin Hood Index, was calculated in order to measure inequity. Other indexes, such as Theil’s or entropy-based indexes, have similar performance. The aforementioned index establishes in a hypothetical situation how much money should be taken away from half of the richest population so that the latter have the same income as the other half of the poorest people. Obviously, a scenario in which half of the richest people need to be “stripped” of their income so that an economic equilibrium among different socio-economic groups tells us that we live in an era of deep inequity. Hoover Index can be calculated via formula 1.
Formula 1. Inequity Index of Hoover
where the index of Hoover, of state e in year a is equal to the half sum of the absolute value of the difference quotient of income for each household i(a), divided by the total income of the state, and the quotient of the number of households that perceive the corresponding income and the total of families within the state under study, data can be expanded through the expansion factor of each household. However, the same factor is equal to zero for being on both sides of the division.
The result of the Hoover Index can be seen in Table 2. In general, there is no clear change in inequity. In some states, the rate of change between data from 2022 and 2018 is greater than 1, which means that inequality has increased, and in other states, the opposite situation (decreased inequality) is also true. Mexican states that have a pronounced upward variation of more than 10% are Mexico City and Jalisco. Outside of these, the highest upward variations are equal to 7–8%, as is the case in the states of Guerrero, Hidalgo, Nayarit, and Tamaulipas. Nevertheless, there are also opposite cases, such as the State of Mexico, which presents a downward inequity equal to 10%, and Tlaxcala, Puebla, Nuevo Leon, and Durango show variations of more than 5%. All of the rest of the Mexican states are within a range of 5% up or down in 2022 from what they recorded in 2018. This information can be visualized through the map in Figure 1. Generally, the observed regional pattern is that the Northern States highlights a greater inequity but a smaller variation, whereas the states of the South-East show a great inequity with a greater variation.
Table 2.
Result of Hoover´s Index of inequity per state for each of the three time periods.
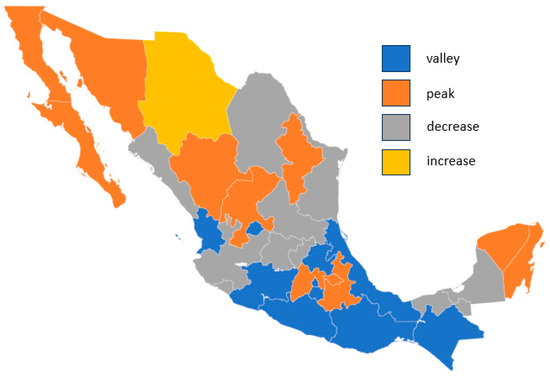
Figure 1.
Evolution of Hoover Index from 2018 to 2022.
Mexico City is the only entity of the Mexican Republic that offers open data related to the location of COVID-19 cases within its colonies. Considering this information, Figure 2 presents the comparison of means (ANOVA) with the number of registered COVID cases within colonies classified, in terms of marketing opportunities, as low, according to the AMAI classification. Moreover, in Figure 2, it is noted that low and low to middle-level colonies have reported multiple cases of infection. In this sense, it can be appreciated in Mexico City, both from a regional scale and from a smaller one, that the pandemic does not affect all areas equally, and at the same time, there has been an increase in income distribution.
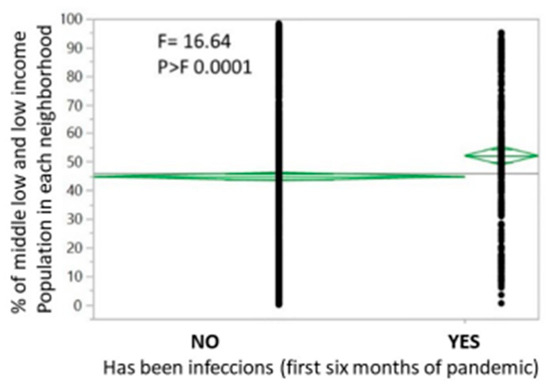
Figure 2.
Situation related to the presence (or no) of COVID-19 infections in the low-level colonies in Mexico City during the first year of the pandemic.
The levels have been estimated by geoestrategias, a Mexican company dedicated to the development of multivariate analysis for territorial growth, via a multivariate model. As for the income, expenditure, and savings variables, aggregated by state, which are going to be seen in the next section, a spatial distribution by state has been performed. In this Figure, we do appreciate a clear spatial trend. Northern states have higher income, present higher spending, and higher savings. However, rates of variation do not show a spatial trend (Figure 3).
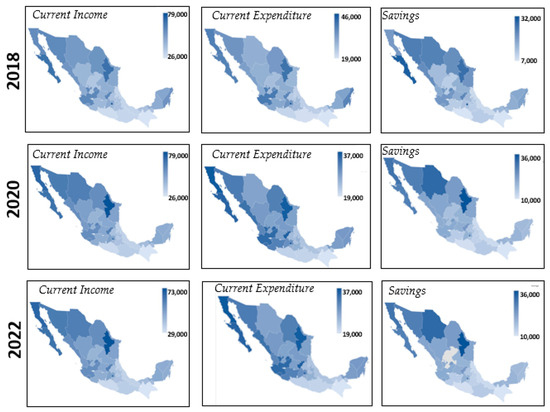
Figure 3.
Income, Expenditure, and Average Savings per State according to 2018, 2020, and 2022.
4.2. Inequity Related to Different Socio-Economic Strata Income, Expenditure and Savings
The following data show us situations that might seem paradoxical at first. Table 3 represents the behavior of average current income, average monetary current expenditure, and average savings, as well as the rate of variation between the most recent year with respect to 2018. In Table 3, it can be observed that during COVID-19, the income decreased only at the high socio-economic level of the population. Moreover, at the same time period, the detected increase in income was only considerable for the low socio-economic level. However, spending is also only increased in the low tier, while average savings are raised for all the socio-economic groups, but more at a low level. If this data is examined in an isolated manner, the results may be anti-intuitive. In 2022, the values returned to reality, with high socio-economic strata having the highest income and savings among all considered groups.
Table 3.
Current Income and Expenditure along with Average Savings per Household according to 2018, 2020 and 2022.
The expenditure of each household does not share the same composition in the households of different socio-economic strata. Figure 4 shows how the highest socio-economic stratum had considerable savings during the period 2018–2020–2022, in various areas that involve activity but not in housing.
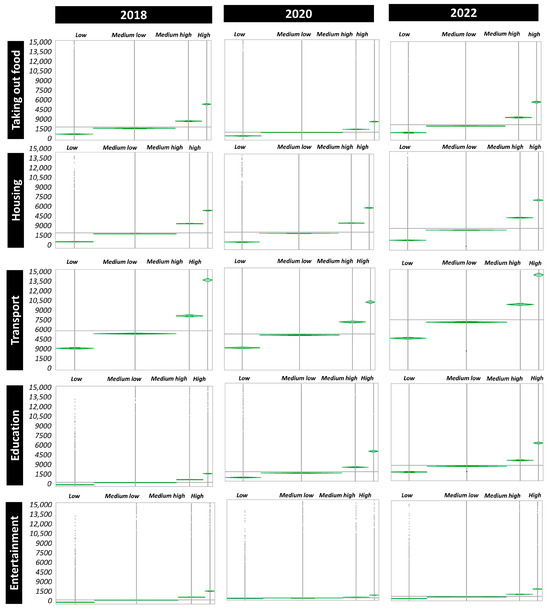
Figure 4.
Composition of expenditure per socio-economic stratum before, during, and after COVID-19.
In Table 4, it is noted that as soon as the socio-economic level of strata is higher, there is a smaller increase in the number of household members and that even at a low level, the number of members in the household decreases. Nevertheless, in all cases of socio-economic strata, the number of employed income percipients remains almost constant, only decreasing by 1 or 2 percent from 2018 to 2022. Furthermore, the low-tier stratum presents an increase related to the number of employed people. However, the latter fact can be attributed to jobs without a salary. This allows us to assume that in several family businesses, it may probably be a common phenomenon to incorporate people without a salary.
Table 4.
Household members, employed percipients, and employed per household according to years 2018, 2020, and 2022.
In this last category are included professions such as construction workers or carpenters, which would be congruent under a scenario where there is little school activity and a lot of economic pressure.
Also, in Table 5, variations can be seen within the same year. At a low socio-economic level, the proportion of employed persons grows with respect to household members. In other words, a good proportion of the population comes to work but not to charge. This may be consistent with the scenario where household productivity needs to be increased without affecting cash flow.
Table 5.
Proportion of percipients vs. employed people in 2018, 2020, and 2022.
Finally, in Table 6, it can be seen how the weekly income of households in the low socio-economic tier rises but is much lower in comparison to the other strata. However, the hours of study decreased significantly, while working hours remained constant between fewer percipients and more employed (without a salary) people.
Table 6.
Comparison of parameters related to income and job before and after the pandemic.
The type of households’ economic work is also an important factor to take into consideration, as low-tier households have the capacity to adapt to certain circumstances because they are often engaged in commercial activities that require low training so that their members can continue working. The following figure (Figure 5) indicates the relationship between socio-economic status and educational grade.
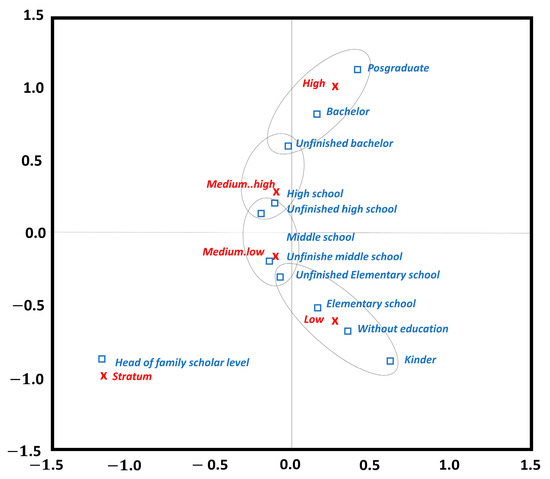
Figure 5.
Relation between socio-economic level and academic education.
In Figure 6, It can be appreciated that households dedicated to services are better paid, followed by businesses, industries, and agriculture. In the following figure, it can be seen how the businesses of households dedicated to services were the only ones that actually decreased their average income. Nevertheless, even with the aforementioned decline, they are still much more profitable than the other categories.
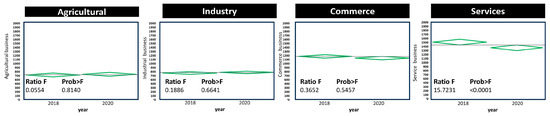
Figure 6.
Household income per month in Mexican Pesos for different types of activity before and after COVID-19.
5. Discussion
A congruent scenario with the previously shown data would be that of a society where the lowest stratum must obtain, at all costs, more resources to cover its basic needs. However, the economy is restricted, so it incorporates the households’ elements into work, but without a salary. This is not, of course, a leveling situation, but that additional effort shown in the lowest stratum allows inequity not to increase disproportionately. Nevertheless, inequity still exists, as students of families belonging to low-tier households are forced to study less than before in order to get a job (sometimes without a salary). In this sense, we would be seeing an increase in inequality at work, although it is not substantially reflected in such a short period of time (2018–2022). However, this situation can be very harmful, in societal terms, as young people will not have the opportunity to receive a medium and superior education, which is of paramount importance for the development of their aptitudes. The Mexican government has created several programs in Chiapas state to support tele-education, such as “Aprende en Casa” and “Escuela en Casas”, but if families do not have an internet connection, or if there are several children and only one personal computer per family, everything becomes much more complicated. Hence, children can only access television or radio programs that offer fewer academic resources (Martínez Martínez 2020). A typical story of a middle-class household would have the people working at home or leaving their work so as to find something better while making use of their savings. During the pandemic, the members of such a family spend less due to gasoline savings and food savings because of not eating out. Also, we should not forget the benefits of avoiding congestion and the associated time spent traveling, which means that even by reducing their income, the members of a typical middle-class family will continue to have some profit. However, in a lower-class family, not only are its members forced to work more, in more expensive conditions, as transportation becomes less efficient, but also, more members of the household must work in order to survive. In other words, the pandemic could potentially benefit people with more resources, even in the glooming scenario where their income would be further reduced.
6. Conclusions
The general conclusion of this paper is that after the pandemic, there is a scenario of greater social inequity, even though this in the short term (2018–2022 time periods) could not be reflected in the used inequity index. The diagram in Figure 7 seeks to explain the behavior of inequity in the times of COVID-19, while in Table 7 can be appreciated the income, expenditure and savings per state for the three time periods. The pandemic requires more resources, but the lower stratum only has its workforce to complement the ravages of it; hence, in the absence of liquid assets, families are forced to incorporate more members into working activities. In this way, it is managed to gain more resources and stay above the survival line but at the cost of reducing the education time of the people who join the working activity. At the same time, the other strata do not have to carry out this manoeuvre, so even though their income is reduced, they do not have to separate their household members from the school, and even so, they keep remaining above the line of survival. Obviously, this represents an inequity, which is not reflected in the Hoover indices at the moment and is probable to manifest in the years to come. Hence, for future research, the proposed Hoover Index can be enriched via the calculation of inequality at school and work times.
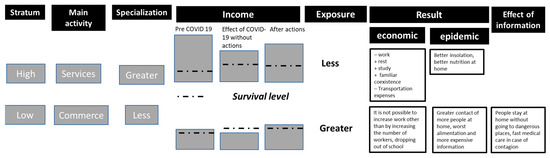
Figure 7.
Diagrammatic explanation of the improvement of socio-economic level of high-tier households due to the pandemic condition.
Table 7.
Income, expenditure, and savings per state in 2018–2020–2022.
Author Contributions
Conceptualization, T.S.-M. and I.C.; methodology, T.S.-M.; investigation, T.S.-M. and I.C.; data curation, H.D.R.L.; writing—original draft preparation, T.S.-M. and I.C.; writing—review and editing, T.S.-M., I.C., H.D.R.L., E.B. and L.C.-B.; supervision, E.B. and L.C.-B. All authors have read and agreed to the published version of the manuscript.
Funding
This research received no external funding.
Institutional Review Board Statement
Not applicable.
Informed Consent Statement
Not applicable.
Data Availability Statement
Not applicable.
Conflicts of Interest
The authors declare no conflict of interest.
References
- Adams-Prassl, Abi, Teodora Boneva, Martha Golin, and Christopher Rauh. 2020. Inequality in the impact of the coronavirus shock: Evidence from real time surveys. Journal of Public Economics 189: 104245. [Google Scholar] [CrossRef]
- Baldwin, Richard, and Beatrice Weder Di Mauro. 2020. Economics in the Time of COVID-19. London: A VoxEU.org Book Centre for Economic Policy Research. Available online: https://voxeu.org/system/files/epublication/COVID-19.pdf (accessed on 4 June 2022).
- Bambra, Clare, Ryan Riordan, John Ford, and Fiona Matthews. 2020. The COVID-19 pandemic and health inequalities. Journal of Epidemiology and Community Health 74: 964–68. [Google Scholar]
- Banco de México. 2020. Forecasted Gross Domestic Product (GDP) Growth in Mexico in 2020, by Month of Forecast [Graph]. Statista. Available online: https://s443-www-statista-com.lasalle.lsproxy.net/statistics/1108139/expected-gdpgrowth-mexico/ (accessed on 3 June 2020).
- Beker, Victor. 2020. El impacto del COVID-19 en la economía global. Zabala: Boletín del Centro de Estudios de la Nueva Economía de la Universidad de Belgrano, No. 191. [Google Scholar]
- Ben Yahmed, Sarra, Lorenzo Cappellari, Daniele Checchi, Miles Corak, Stephen Jenkins, Guido Neidhöfer, Michèle Tertilt, and Mariano Tommasi. 2020. COVID-19 and Inequality. ZEW Policy Brief. Mannheim: ZEW. [Google Scholar]
- Bernardi, Fabrizio. 2020. Pandemics … the Great Leveler? Available online: https://euideas.eui.eu/2020/04/28/pandemics-the-great-leveler/ (accessed on 24 August 2021).
- Blundell, Richard, Monica Costa Dias, Robert Joyce, and Xiaowei Xu. 2020. COVID-19 and Inequalities. Fiscal Studies 41: 291–319. [Google Scholar] [CrossRef]
- Brum, Matías, and Mauricio De Rosa. 2020. Estimación del efecto de corto plazo de la Covid-19 en la pobreza en Uruguay. Montevideo: Instituto de Economía, FCEA, Universidad de la República. [Google Scholar]
- CEPAL. 2020. América Latina y el Caribe ante la pandemia del COVID-19 Efectos económicos y sociales. Santiago de Chile: CEPAL, Informe Especial COVID-19; nº 1. [Google Scholar]
- Ceylan, Rahmiye Figen, Burhan Ozkan, and Esra Mulazimogullari. 2020. Historical evidence for economic effects of COVID-19. The European Journal of Health Economics 21: 817–23. [Google Scholar]
- Chiatchoua, Cesaire, Carmen Lozano, and Jesús Macias Durán. 2020. Análisis de Los Efectos Del COVID-19 En la economía Mexicana. Revista Del Centro de Investigación de La Universidad La Salle 14: 265–90. [Google Scholar] [CrossRef]
- Deshpande, Ashwini, and Rajesh Ramachandran. 2020. Is COVID-19 “The Great Leveler”? The Critical Role of Social Identity in Lockdown-induced Job Losses. In Ashoka University Discussion Paper Series DP. Sonipat: Ashoka University, No. 34. [Google Scholar]
- Flores, Zenyazen. 2020. Se perdieron 753 mil empleos en mes y medio. El Financiero. Available online: https://www.elfinanciero.com.mx/economia/se-pierden-555-mil-empleos-formalesen-abril-suman-mas-de-685-mil-contando-marzo (accessed on 17 January 2022).
- González, Hugo. 2021. Pandemias en la historia: La peste negra y la gripe española, covid-19 y crisis capitalista. Revista Chakiñan de Ciencias Sociales y Humanidades 14: 130–45. [Google Scholar]
- Gupta, Mrinal, Ayman Abdelmaksoud, Mohammad Jafferany, Torello Lotti, Roxanna Sadoughifar, and Mohamad Goldust. 2020. COVID-19 and economy. Dermatologic Therapy 33: e13329. [Google Scholar]
- Hale, Thomas, Noam Angrist, Rafael Goldszmidt, Beatriz Kira, Anna Petherick, Toby Phillips, Samuel Webster, Emily Cameron-Blake, Laura Hallas, Saptarshi Majumdar, and et al. 2021. A global panel database of pandemic policies (Oxford COVID-19 Government Response Tracker). Nature Human Behaviour 5: 529–38. [Google Scholar] [CrossRef]
- Hernández-Mesa, Nibaldo, Jeannete Hernández Llanes, and Caridad Llanes Betancourt. 2020. Las grandes epidemias de la Historia. De la peste de Atenas a la COVID 19. Revista Habanera de Ciencias Médicas 19: 1–13. [Google Scholar]
- Hoehn-Velasco, Lauren, Adan Silverio-Murillo, José Roberto Balmori de la Miyar, and Jacob Penglase. 2022. The impact of the COVID-19 recession on Mexican households: Evidence from employment and time use for men, women, and children. Review of Economics of the Household 20: 763–97. [Google Scholar] [CrossRef]
- IMSS. 2020. Puestos de Trabajo Afiliados al Instituto Mexicano del Seguro Social. Torreón: IMSS. [Google Scholar]
- Iyengar, Karthikeyan, Ahmed Mabrouk, Vijay Kumar Jain, Aakaash Venkatesan, and Raju Vaishya. 2020. Learning opportunities from COVID-19 and future effects on health care system. Diabetes & Metabolic Syndrome: Clinical Research & Reviews 14: 943–46. [Google Scholar]
- Jæger, Mads Meier, and Ea Hoppe Blaabæk. 2020. Inequality in learning opportunities during COVID-19: Evidence from library takeout. Research in Social Stratification and Mobility 68: 100524. [Google Scholar]
- Johnson, Steven. 2008. The Ghost Map: A Street, an Epidemic and the Hidden Power of Urban Networks. London: Penguin. [Google Scholar]
- Kalabikhina, Irina. 2020. Demographic and social issues of the pandemic. Population and Economics 4: 103. [Google Scholar]
- Kilbourne, Edwin. 2004. Virus Paleontology, Disease, and Evolution: An Introduction. Proceedings of the American Philosophical Society 148: 261–63. [Google Scholar]
- Kristal, Tali, and Meri Yaish. 2020. Does the coronavirus pandemic level the gender inequality curve?(It doesn’t). Research in Social Stratification and Mobility 68: 100520. [Google Scholar] [CrossRef]
- Kruse, Robert. 2020. Therapeutic strategies in an outbreak scenario to treat the novel coronavirus originating in Wuhan, China. F1000Research 9: 72. [Google Scholar]
- Kyriakidis, Charalampos, Ioannis Chatziioannou, Filippos Iliadis, Alexandros Nikitas, and Efthimios Bakogiannis. 2023. Evaluating the public acceptance of sustainable mobility interventions responding to COVID-19: The case of the Great Walk of Athens and the importance of citizen engagement. Cities 132: 103966. [Google Scholar]
- Little, Lester K. 2007. Plague and the End of Antiquity: The Pandemic of 541–750. Cambridge: Cambridge University Press. ISBN 13 978-0-521-84639-4. [Google Scholar]
- Lores-Murguía, Adriana. 2021. Epidemiología, Ciencias Sociales y Sindemia. Espacio Abierto 30: 10–23. [Google Scholar]
- Ludueña Romandini, Fabián. 2015. La peste de Atenas: La guerra y la polis entre la política antigua y moderna. Un comentario sobre la “stasiología” de Giorgio Agamben. Anacronismo e irrupción. Revista de Teoría y Filosofía Política Clásica y Moderno 5: 30–53. [Google Scholar]
- Lustig, Nora, Guido Neidhöfer, and Mariano Tommasi. 2020. Short and Long-Run Distributional Impacts of COVID-19 in Latin America (No. 2013). New Orleans: Tulane University, Department of Economics. [Google Scholar]
- MacKay, Martin. 2021. Pandemia: Compañera de la humanidad. Pie de Página 5: 8–12. [Google Scholar]
- Maital, Shlomo, and Ella Barzani. 2020. The Global Economic Impact of COVID-19: A Summary of Research. Samuel Neaman Institute for National Policy Research. Available online: https://www.neaman.org.il/Files/Global%20Economic%20Impact%20of%20COVID-19.pdf (accessed on 21 January 2023).
- Martínez Martínez, Francisco José. 2020. Mesura ante la pandemia. In Pandemia, globalización, ecología:¿ Qué piensa la hermenéutica crítica? 34 filósofas y filósofos responden a estas cuestiones. Madrid: UNED, Universidad Nacional de Educación a Distancia, pp. 205–14. [Google Scholar]
- Márquez Morfín, Lourdes, and América Molina del Villar. 2010. El otoño de 1918: Las repercusiones de la pandemia de gripe en la ciudad de México. Desacatos 32: 121–44. [Google Scholar]
- Márquez, Lourdes. 1991. La desigualdad ante la muerte 1800–1850. Tesis de doctorado. El Colegio de México. Available online: https://repositorio.colmex.mx/concern/theses/0r967394c?locale=es (accessed on 15 January 2022).
- Neidhöfer, Guido, and Claudio Neidhöfer. 2020. The Effectiveness of School Closures and Other Pre-Lockdown COVID-19 Mitigation Strategies in Argentina, Italy, and South Korea. ZEW-Centre for European Economic Research Discussion Paper 20-034. Mannheim: ZEW. [Google Scholar] [CrossRef]
- Neidhöfer, Guido, Nora Lustig, and Mariano Tommasi. 2021. Intergenerational transmission of lockdown consequences: Prognosis of the longer-run persistence of COVID-19 in Latin America. The Journal of Economic Inequality 19: 571–598. [Google Scholar] [CrossRef] [PubMed]
- Oliveira, Edson, Gislaine Leal, Marco Tulio Valente, Marcelo Morandini, Rafael Prikladnicki, Leandro Pompermaier, Rafael Chanin, Clara Caldeira, Letícia Machado, and Cleidson De Souza. 2020. Surveying the impacts of COVID-19 on the perceived productivity of Brazilian software developers. Paper presented at Brazilian Symposium on Software Engineering, Natal, Brazil, October 19–23; pp. 586–95. [Google Scholar]
- Ortiz-Hernández, Luis, and Miguel A. Pérez-Sastré. 2020. Social inequalities in the progression of COVID-19 in the Mexican population. Pan American Journal of Public Health 44: e106. [Google Scholar] [CrossRef] [PubMed]
- Peluffo, Cecilia, and Mariana Viollaz. 2021. Intra-household exposure to labor market risk in the time of COVID-19: Lessons from Mexico. Review of Economics of the Household 19: 327–351. [Google Scholar] [CrossRef] [PubMed]
- Rangel, Daniel H. 2011. Las pintas de la sirvienta. El tifo y el temor a los pobres en la ciudad de México, 1874–1877. Estudios de Historia Moderna y Contemporánea de México 41: 53–77. [Google Scholar]
- Rodríguez, Martha Eugenia, and Ana Cecilia Rodríguez de Romo. 1999. Asistencia médica e higiene ambiental en la ciudad de México. Siglos xvi–xvii. Gaceta Médica de México 135: 189–98. [Google Scholar]
- Sabbatani, Sergio, and Sirio Fiorino. 2009. The Antonine Plague and the decline of the Roman Empire. Le Infezioni in medicina 17: 261–75. [Google Scholar]
- Scheidel, Walter. 2018. The Great Leveler. Violence and the History of Inequality from the Stone Age to the Twenty-First Century. Princeton: Princeton University Press. [Google Scholar]
- Scheidel, Walter. 2020. The Coronavirus Pandemic and the Future of Economic Inequality. Social Research: An International Quarterly 87: 293–95. [Google Scholar] [CrossRef]
- Serrano-Cumplido, Adalberto, Antón-Eguía Ortega, Antonio Ruiz García, Vicente Olmo Quintana, Antonio Segura Fragoso, Alfonso Barquilla García, and Álvaro Morán Bayón. 2020. COVID-19. La historia se repite y seguimos tropezando con la misma piedra. Medicina de Familia. SEMERGEN 46: 48–54. [Google Scholar]
- Suárez, Maria, and Jorge Martínez. 2020. COVID-19: Efectos de la desigualdad social y la inequidad en la educación superior en México. Notas de Coyuntura del CRIM, 1–8. [Google Scholar] [CrossRef]
- Tognotti, Eugenia. 2009. The rise and fall of syphilis in Renaissance Europe. Journal of Medical Humanities 30: 99–113. [Google Scholar] [PubMed]
- Tuesca Molina, Rafael, Nuria Rodríguez Ávila, and Carolina Moreno-Castro. 2021. Una mirada histórico-geográfica de las pandemias: Para entender de manera compleja la COVID-19. Salud Uninorte 1: 189–204. [Google Scholar] [CrossRef]
- Van Blerkom, Linda M. 2003. Role of viruses in human evolution. American Journal of Physical Anthropology: The Official Publication of the American Association of Physical Anthropologists 122: 14–46. [Google Scholar]
- Van Dorn, Aaron, Rebecca Cooney, and Miriam Sabin. 2020. COVID-19 exacerbating inequalities in the US. Lancet 395: 1243. [Google Scholar] [CrossRef]
- Velasco, Maria. 1992. La epidemia de cólera de 1833 y la mortalidad en la Ciudad de México. Estudios Demográficos y urbanos, 95–135. [Google Scholar] [CrossRef]
- von Gaudecker, Hans-Martin, Radost Holler, Lena Janys, Betinna M. Siflinger, and Christian Zimpelmann. 2020. Labour Supply During Lockdown and a ”New Normal”: The Case of the Netherlands. Working Paper 13623. Bonn: IZA. [Google Scholar]
- Watts, Sheldon. 2000. Epidemias y poder. Santiago: Andres Bello. [Google Scholar]
- Webber, Roger. 2015. Disease Selection: The Way Disease Changed the World. Boston: CABI. ISBN 13: 978-1780646824. [Google Scholar]
- Weiss, Martin, James Jackson, Andres Schwarzenberg, and Rebecca Nelson. 2020. Global Economic Effects of COVID-19. Washington, DC: Congressional Research Service. [Google Scholar]
- Wyman, Walter. 1897. The Black Plague. The North American Review 164: 441–52. [Google Scholar]
Disclaimer/Publisher’s Note: The statements, opinions and data contained in all publications are solely those of the individual author(s) and contributor(s) and not of MDPI and/or the editor(s). MDPI and/or the editor(s) disclaim responsibility for any injury to people or property resulting from any ideas, methods, instructions or products referred to in the content. |
© 2023 by the authors. Licensee MDPI, Basel, Switzerland. This article is an open access article distributed under the terms and conditions of the Creative Commons Attribution (CC BY) license (https://creativecommons.org/licenses/by/4.0/).