1. Introduction
Homo Economicus—Rational Economic Man (REM)—forms the foundation of orthodox economic analysis. This has been contested by theories of bounded rationality (
Simon 1990) which developed into a more thoroughgoing critique by behavioral economics (
Kahneman 2003), proposing an alternative theoretical construct. However, rationality is not jettisoned. REM remains in use as a point of reference, perhaps as a characteristic of behavior at a limit point, while still providing the dominant focus in normative economics. Thus, non-orthodox approaches do not present themselves as fully fledged alternatives, but purport to offer more realistic descriptions of actual decision making. REM is not replaced but remains as a reference, or an ideal. This ideal can be approached in certain conditions or is one that, with practice, could be emulated or encouraged using suitable “nudges” (
Sunstein 2014). In consequence, the behavior of a rational economic man is not treated as an ontological, essentialist, issue but simply as a matter for empirical hypothesis. Individuals may approach—to a greater or a lesser degree—how a rational economic man could behave; they may also approach such behavior depending on the issue at hand or even the prevailing market conditions (
Fama 1998). Another way of putting it is that rational behavior is encouraged by contexts, most notably that of scarcity; indeed, experiments have shown that animals, when placed in situations of scarcity, exhibit behavior consistent with mainstream economics.
Coyle (
2021, p. 118) interprets such findings to imply that environmental and social contexts affect learning, cautioning against placing all emphasis on cognition.
In other words, it is not the case that an individual is or is not “really” a rational economic man. REM is a situation that can be learned; it is a cognitive issue, not innate but acquired (
Bikhchandani et al. 1998). Implicit in this view is that closeness to REM is a matter of degree, amenable to measurement; that individuals could be closer to REM in some areas and less so in others; and that these matters are likely to be subject to cognitive concerns related to learning.
Behavioral economics contends that matters taken as given—such as REM—can instead be objects of empirical investigation, most often through conducting a series of experiments. Most of these have, with time, become well established with an accepted series of well-understood tests and measures. Thus, there exists a set of questions testing how far individuals are from the ideal of REM through questions probing the understanding of uncertainty, time or consistency of decisions. This in some sense shadows tests designed to benchmark learning or cognition. Some measure numeracy (the Berlin numeracy test) and financial literacy, while decision-making processes are probed by tests of cognitive reflection (CRT). These tests have been conducted in a wide variety of contexts and populations, and a corpus of findings is emerging on how these processes are related to co-factors such as gender. Several studies report the effect of education on rational choices—
Ates et al. (
2016) found that individuals with higher education are less liable to exhibit biases;
Seru et al. (
2010), examining the learning process, made a distinction between experience and abilities, emphasizing the importance of the latter.
With this paper, we build on this empirical approach by attempting four tasks. First, we conduct a barrage of different tests in a range of behavioral areas for the same subjects: economic literacy questions examine how closely individuals correspond to REM; this coexists with tests of financial literacy and numeracy, as well as cognitive reflection. Second, the fact that all tests are conducted for the same individuals allows us to probe relationships between the various kinds of biases. Moreover, by positing that there exists a hierarchy of effects, where higher level departures from rationality are caused by more fundamental cognitive features, we approach the issue of how far causal mechanisms can be inferred. An individual thus would start from the bedrock of cognitive reflection and would extend through numeracy and financial literacy before “becoming” REM. That is, we treat the status of REM as a stance that is the product of learning whose origin is cognitive reflection. Third, our paper probes with greater detail how gender enters such processes—the vexed question of whether and to what extent women are further away from Homo economicus than men. Fourth, it does so for a sample of Greek undergraduate students, who, by virtue of following a course heavy on probability and statistics, can be expected not to be subject to numeracy problems, and hence better disposed to be closer to REM. In this purposely biased sample, the probability of individuals conforming to the model of rationality and of REM ought to be magnified; hence, findings of systematic cognitive biases should be accorded greater weight.
The paper is structured as follows. A section surveying theory and concepts is followed by an exposition of the experimental design. A short description of the key findings for each departure motivates the definition of numerical scores summarizing essentially how close each individual is to the ideal of fully rational, numerate REM. These scores can be related to each other and can form the basis of an econometric analysis which attempts to explain being REM as a learned behavior, where the most basic influence is that of cognitive reflection. The paper concludes by discussing the findings, benchmarking against previous studies.
2. Theory and Concepts
An accumulation of theoretical literature has highlighted the importance of a link between cognitive abilities and behavior—with a special focus on how individuals react to risk: would they behave as expected utility maximisers or are they closer to prospect theory? At the heart of the discussion is the distinction between system 1 decision making, which lies behind automatic decisions, and system 2, which is characterized by slow, controlled, high-effort and low-capacity processes (
Morewedge and Kahneman 2010). The mechanism of dual system theory (intuitively thinking vs. analytical) and the incorrect intuitions of system 1 can explain the occurrence of irrational choices. In this way, people who learn how to control their intuitions should appear as less biased decision makers. This learning process has been well documented.
Sutton and Barto (
1998) show that shifts between choices can be explained by theories of learning and valuation that incorporate prediction error mechanisms.
Friedman (
1998) showed that individuals can learn the decision-making process and how the task interacts with their basic underlying values; once this learning has taken place, choices converge on expected utility maximization.
The classical approach proceeds from the maximization of expected utility on the part of a fully informed, rational individual with unlimited knowledge, who only faces a budget constraint.
Kahneman and Tversky (
1979) proposed a fully specified alternative to the utility model prospect theory. Their critique is particularly relevant in the presence of risk and uncertainty. They suggest that individuals’ decisions are evaluated using a reference point—setting the scene to define risk attitudes, focusing on gains and losses rather than on absolute amounts of resources. Additionally, the authors proposed an S-shaped probability function to weigh probabilities. This reflected the finding that decision makers either ignore or overestimate small probabilities.
Zhang and Maloney (
2012) used prospect theory to find that experience and problem solving affect the perception of probabilities, including notably better estimation of probabilities.
This learning behavior, apart from cognition, can, as behavioral economics suggests, be significantly affected by cognitive and psychological factors (
Camerer 1998). Unlike consumer theory, which proceeds from an environment of certainty, behavioral economics lays emphasis on risk and uncertainty. For example,
Nguyen et al. (
2019) state that a key element in decision making is the perception of risk on the basis of the consequences, expressed as the balancing of expected pay-offs (the sum of benefits and loss). Factors such as past experiences, social or demographic characteristics operate as predictors of risk perception, to the extent that they help individuals familiarize themselves with the recognition, categorization and alleviation of risk. Psychological factors can drive individuals to irrational decisions through the occurrence of cognitive biases in an environment of uncertainty (
Kahneman and Tversky 2013).
An association between cognitive abilities and behavior can be explained in three different, but not mutually exclusive, ways. First, dual process theory suggests that decision makers with lower cognitive abilities are heavily influenced by past experiences, and are more liable to use system 1 thinking. In contrast, high cognitive ability individuals employ system 2 and, so, are more likely to arrive at rational choices through an intellectual process (
Shulman et al. 2016;
De Neys 2021).
Rabin and Thaler (
2001) state that high cognitive capacity—an attribute of high cognitive capacity individuals—enables people to recognize the irrationality of risk aversion over small stakes. Furthermore, people who summon system 2 for analyzing data and decision taking can distinguish with ease any intuitively (wrong) answer from the correct ones, and hence exhibit fewer behavioral biases.
A second plausible suggested explanation for a link to cognitive capacity reverses causality, positing that risk preferences affect, directly and indirectly, cognitive ability. A low cognitive capacity individual would prefer safer environments with fewer risky choices (
Deck and Jahedi 2015). In a similar fashion, the risk attitude profile may affect choices in education which, in turn, has been shown to increase cognitive abilities. In this way, risk attitude would be related to cognitive abilities by way of the intermediary mechanism of education. A final, third possibility is based on people’s facility to place decisions in an appropriate frame. When facing a decision problem, individuals with high cognitive abilities can pay more attention to the features of the particular choices available and thus exhibit a smaller framing effect. This allows them to reframe the options and hence to narrow them down (
Simon et al. 2004), moving closer towards REM.
These theoretical expectations have been subjected to empirical testing by way of measuring the cognitive abilities and testing their predictive power in uncertain situations where individuals are forced to decide—i.e., treating cognitive abilities as a causal mechanism leading to different behavior. Some authors have used experimental tools to measure the association of cognitive performance with different cognitive biases and heuristics in consumer goods markets (
Lukas and Nöth 2019), or in strategic behavior (
Brañas-Garza et al. 2012).
3. Literature Review
Many empirical studies probe the link between cognitive abilities and behavioral biases. Specifically,
Oechssler et al. (
2009) examined five biases and found a significant influence of cognitive abilities on behavioral biases, especially in the case of the conjunction fallacy, conservatism, time preference and risk preferences.
Noori (
2016), building on previous studies, increased the number of examined biases to nine using a sample of university students. His results underline that cognitive reflection can predict the occurrence of behavioral anomalies.
Skagerlund et al. (
2018) focus their research on the effect of cognitive factors, alongside emotional and demographic cofactors, as well as on financial literacy. Using a representative sample of Swedish adults, they conclude that cognitive factors have significantly predictive power on financial literacy, while the most noteworthy contribution was that of numeracy. Our work applies a similar empirical strategy to a Greek sample; however, we focus on a purposely biased sample of young numerate undergraduates. This group is homogeneous and familiar with mathematical techniques, a feature which allows us to concentrate on the relationship between the various kinds of departure, rather than the influence of cofactors.
Our experimental design and empirical strategy thus share much with the approach of
Skagerlund et al. (
2018), who conducted a similar series of tests on a random sample of the population in Sweden and then proceeded to estimate a series of econometric models relating departures from rationality to each other as well as to socio-economic cofactors. Our approach roughly reproduces theirs but uses a focused, purposely biased sample of young undergraduates of both genders; concentrating on a more homogeneous group allows us to clarify the relationships between the various kinds of departure.
An issue that has received considerable attention in the literature is how gender relates to these matters, and, in particular, the extent to which the very concept of REM is gendered (
Eckel and Grossman 2008). Gender differences have been studied in experimental settings, where a common finding is that males consistently perform better on CRT tasks than females (
Holt et al. 2017), among other differences. While gender difference is a common finding, the literature has not extensively studied the causes of this difference (
Ring et al. 2016). For example,
Croson and Gneezy (
2009) found that males are more confident and competitive than females, while
Camerer and Lovallo (
1999) attribute these differences to beliefs about one’s self and others.
Apart from the existence or origin of gender differences, an extended literature has developed examining the salience of gender differences in preferences and behavior; that is, their practical importance. The central tenet of this paper—that economic rationality is learned—is consistent with the view that differences are socially shaped. However, even if differences were “fundamental or categorical”, according to
Nelson (
2012), these statements appear to be rooted more in confirmation bias than reality. In practical terms,
Hyde (
2005) points out that the differences in an average score between men and women are considerably smaller than the differences among women and among men.
This turns the spotlight beyond measures of central tendency, such as mean scores, towards dispersion. It is dispersion which determines the degree of overlap of statistical distributions. If there is extensive overlap, as is often the case, then the simple presence of gender differences, even if statistically significant, is of limited economic importance. The reason is plain: out of all pairwise comparisons between men and women, there will a large number where the aggregate relationship would be reversed. If that is so, statements based on average differences would not generalize to individuals—stereotypes will mislead.
Nelson (
2015) makes this point forcefully in a meta-analysis of attitudes to risk. She suggests using “Cohen’s d”, average difference, as a percentage of dispersion. Small values of Cohen’s d indicate large overlap and make using stereotypes that much more unwarranted.
Finally, behavioral economics in Greece is still in its infancy. Behavioral insights have been used to study discrimination, notably in the labor and rental housing markets (
Drydakis 2009). The importance of economic literacy is stressed by
Philippas and Avdoulas (
2020), among others. Despite the dearth of research, the importance of designing incentives appropriately is stressed in the literature advocating structural economic reforms during the decade-long financial crisis. For example,
Panageas and Tinios (
2017) stress that for pension reform to succeed, it should be preceded by “a major investment in financial literacy, so that… individuals are in a position to take advantage of (new) freedoms” (p. 483).
4. Materials and Methods
A total of 222 third- and fourth-year undergraduate students (mean age = 23; SD = 6.75; 116 male and 104 female) took part in the study (
Table 1). The students are following a university course heavy on probability theory and statistical methods and can hence be expected to be above the mean regarding arithmetic and financial numeracy.
The participants are Greek speakers who had not been exposed to the particular tests before. They were recruited at the university. They completed all the tasks in a single 30-min session. The tasks were presented on a computer using Google Forms and were divided into five main categories including Cognitive Reflection Test, behavioral biases, numeracy tests, economic literacy assessment and demographics. Each test result was summarized by means of a score, which was then normalized to 100; higher values signify closer conformity to “ideal rationality” or REM. This allows us to relate performance on cognition to evidence of departures from rationality, as well as to check for possible independent impacts of gender.
The study protocol received ethical approval from the scientific board of the Department of Statistics and Insurance Science of Piraeus University. At the onset of the electronic form, we included information for the participant and an option to proceed to the questionnaire after checking an online consent form. The questionnaire was anonymous and did not elicit sensitive personal information, such as grades, social background or other cofactors.
The tests were examined starting from what orthodox economics usually assumes—REM—going towards more basic cognitive functions, i.e., financial literacy, numeracy and CRT.
4.1. Economic Rationality—REM
In order to tackle our questions, we used 10 well-known questions designed to test behavioral biases and heuristics (
Table A1). These tasks can be categorized in three main groups with respect to the different aspect of economic rationality they examine. The first group measures the perception of uncertainty and risk including three questions (risk attitude, status quo) related to risky choices and loss aversion (prospect theory). The second group examines people’s tendency to evaluate rewards, ignoring general information and focusing on information only pertaining to a specific case, specified by
Kahneman (
2000) as
extension neglect. This group includes four questions (time preference, hyperbolic discounting, conjunction fallacy, base rate fallacy). The last group of three questions (illusion of control, overconfidence, conservatism) evaluates individuals’ tendency to rely too heavily on one’s own perspective, having a higher opinion of oneself than reality (
Ross and Sicoly 1979). This categorization essentially applies prospect theory and is in line with
Benson (
2016).
An alternative categorization would link departures to the type or content of the decisions involved: uncertainty (risk preference, conservatism, overconfidence), time (time preference, hyperbolic discounting) or consistency under certainty (status quo, conjunction fallacy, base rate fallacy, illusion of control). Implicitly, such an approach would accord greater importance to context than to innate qualities (
Coyle 2021).
Each task has a correct answer. We score the number of correct answers out of the maximum number of correct answers (10 in REM, smaller in other tests) before normalizing them to 100. Thus, we compute the distance between the REM (=100) and individual stance. Cronbach’s alpha, which measures the internal consistency and the extent to which all the items in a test measure the same concept, in the case of REM was calculated as showing a reliability coefficient equal to 0.59, indicating that it is quite reliable (
Hair et al. 2019).
4.2. Financial Literacy Score
According to
Huston (
2010), financial literacy is the ability to use knowledge and skills to manage resources effectively for a lifetime of financial well-being.
Lusardi and Mitchell (
2011) devised a tool on financial literacy. Their 5-question tool aims to identify the economic concepts that people should understand and be able to use to handle financial decisions. These questions cover topics such as interest rates, bond pricing, inflation and risk diversification (
Table A2). The total score of these questions is related to financial engagement and planning. Empirical evidence is that more financially literate people are more likely to save, plan for retirement and use more complicated methods in allocating their assets (
Anderson et al. 2015). Cronbach’s alpha was calculated at 0.59.
4.3. Numeracy
The Berlin numeracy test is a psychometric tool that quickly assesses individuals’ level of statistical numeracy and risk literacy, in the sense that it measures the ability to interpret risks and rewards and hence to act on the information gained using statistical and probabilistic computations. According to
Cokely et al. (
2012), the Berlin numeracy test is the strongest predictor of comprehension of everyday risks, doubling the predictive power of other numeracy instruments and accounting for unique variance beyond other cognitive tests. Furthermore, it is concise, flexible and easily applicable to diverse samples, and it is readily translatable into different languages without affecting its high construct validity (
Lindskog et al. 2015). This instrument is based on four questions using a 3-level categorization tree (
Table A3). Cronbach’s alpha was calculated at 0.51.
4.4. Measure of Cognitive Reflection
To measure cognitive ability, we used the three-item Cognitive Reflection Test introduced by
Frederick (
2005). All questions are designed such that the wrong answer comes to mind immediately, while the correct answer is easily understandable when explained, after reflection. In that sense, the test aims to measure a person’s ability to force his cognitive abilities to resist the intuitive answer by choosing the correct alternative (see
Table A4). The three questions are well-known, though not so among Greek speakers. The number of correct answers was used as an index of cognitive abilities. Cronbach’s alpha was calculated at 0.60.
5. Results
One of the main questions of our study is whether individuals with high cognitive capacity are less likely to make irrational choices in economic decisions—that is, how close they appear to REM. If REM is learned, it is likely to be related to cognitive capacity and numeracy and financial literacy.
Our interest also focuses on gender differences (
Table A5 and
Table A6). First, we report participants’ performance on each question, reporting differences among gender and CRT groups. Second, we examine which of the biases and heuristics are correlated with cognitive capacity. Finally, we compute an index for the overall performance of the respondents based on their answers and the deviation from the classical economic behavior. Assuming that Homo economicus operates within the framework of rational choice theory, it is able to measure respondents’ deviation from the “ideal” economic man. Individuals exhibit rational behavior acting inconsistently with utility function. Thus, all the tasks have the same ground for comparison.
For each bias, we present the percent of correct answers, both for the total but also with respect to CRT group (
Table 2,
Table A7 and
Figure A1). The mean total score is 46.5 while the mean performance in each of the three components varies from 33.1 in perception of uncertainty and risk to 43.6 to evaluate rewards. Subjects depending on their CRT score were divided into two groups; the “low” group consists of individuals who correctly answered one question or did not manage to correctly answer any of the three tasks (107 subjects), while the “high” group consists of whose who gave the correct answer to at least in two questions (115 subjects). The “low” group is characterized by impulsiveness and intuitive answers while the “high” group can be described as more analytical decision takers. The table also reports how total scores are related to gender and CRT.
Participants with lower CRT are more likely to be susceptible to behavioral biases. Examined biases are statistically significant in six of the ten cases. Of the remaining tests three were of the right sign but due to high dispersion were not significant. The exception is risk preference ii, which is the risk preference in the domain of losses where respondents response were exceptionally low and the results heavily insignificant. Moreover, males tend to have a better performance in all test except risk preference ii. For example, females are more likely to believe they can control or influence outcomes (illusion of control) or tend to evaluate rewards in accordance with their immediacy and not only in absolute rates and amounts (hyperbolic discount). The biggest difference between males and females can be noticed in time questions while the smallest in questions related to consistency under certainty. Using the decomposition technique analyzed by
Huettner and Sunder (
2012), we quantify the effect of each category on the total score. For the first categorization, the “evaluate reward” counts for 44.2%, the “own perspective” for 37.8% and the remaining 18.0% for “perception of risk”. Using the alternative categorization, the consistency under certainty counts for 35.9%, the uncertainty for 35.7% and the time for the remaining 28.4%.
The examination of behavioral biases, under the scope of rational economic man, sheds light on the existing difference between high and low cognitive capacity and among genders. Participants with low cognitive score are more susceptive to act irrationally; the same pattern can be noticed comparing females with males. Nonetheless, the effect of gender and cognitive score are examined separately without accounting for the joint effect on REM.
Table 3 illustrates the joint effect of gender and cognitive score. Males with high CRT have significantly better performance in “perception of risk” and “own perspective” task compared to males with low cognitive performance (
p-value < 0.05). The two distributions overlap: high cognitive females perform better in “own perspective” and “evaluate rewards” tasks (
p-value < 0.05). Overall, the recorded differences are statistically different. Following
Nelson (
2015), we compute Cohen’s d, the average difference as a percentage of dispersion, equal to 0.285. This small value indicates large overlap and makes using stereotypes that much more unwarranted.
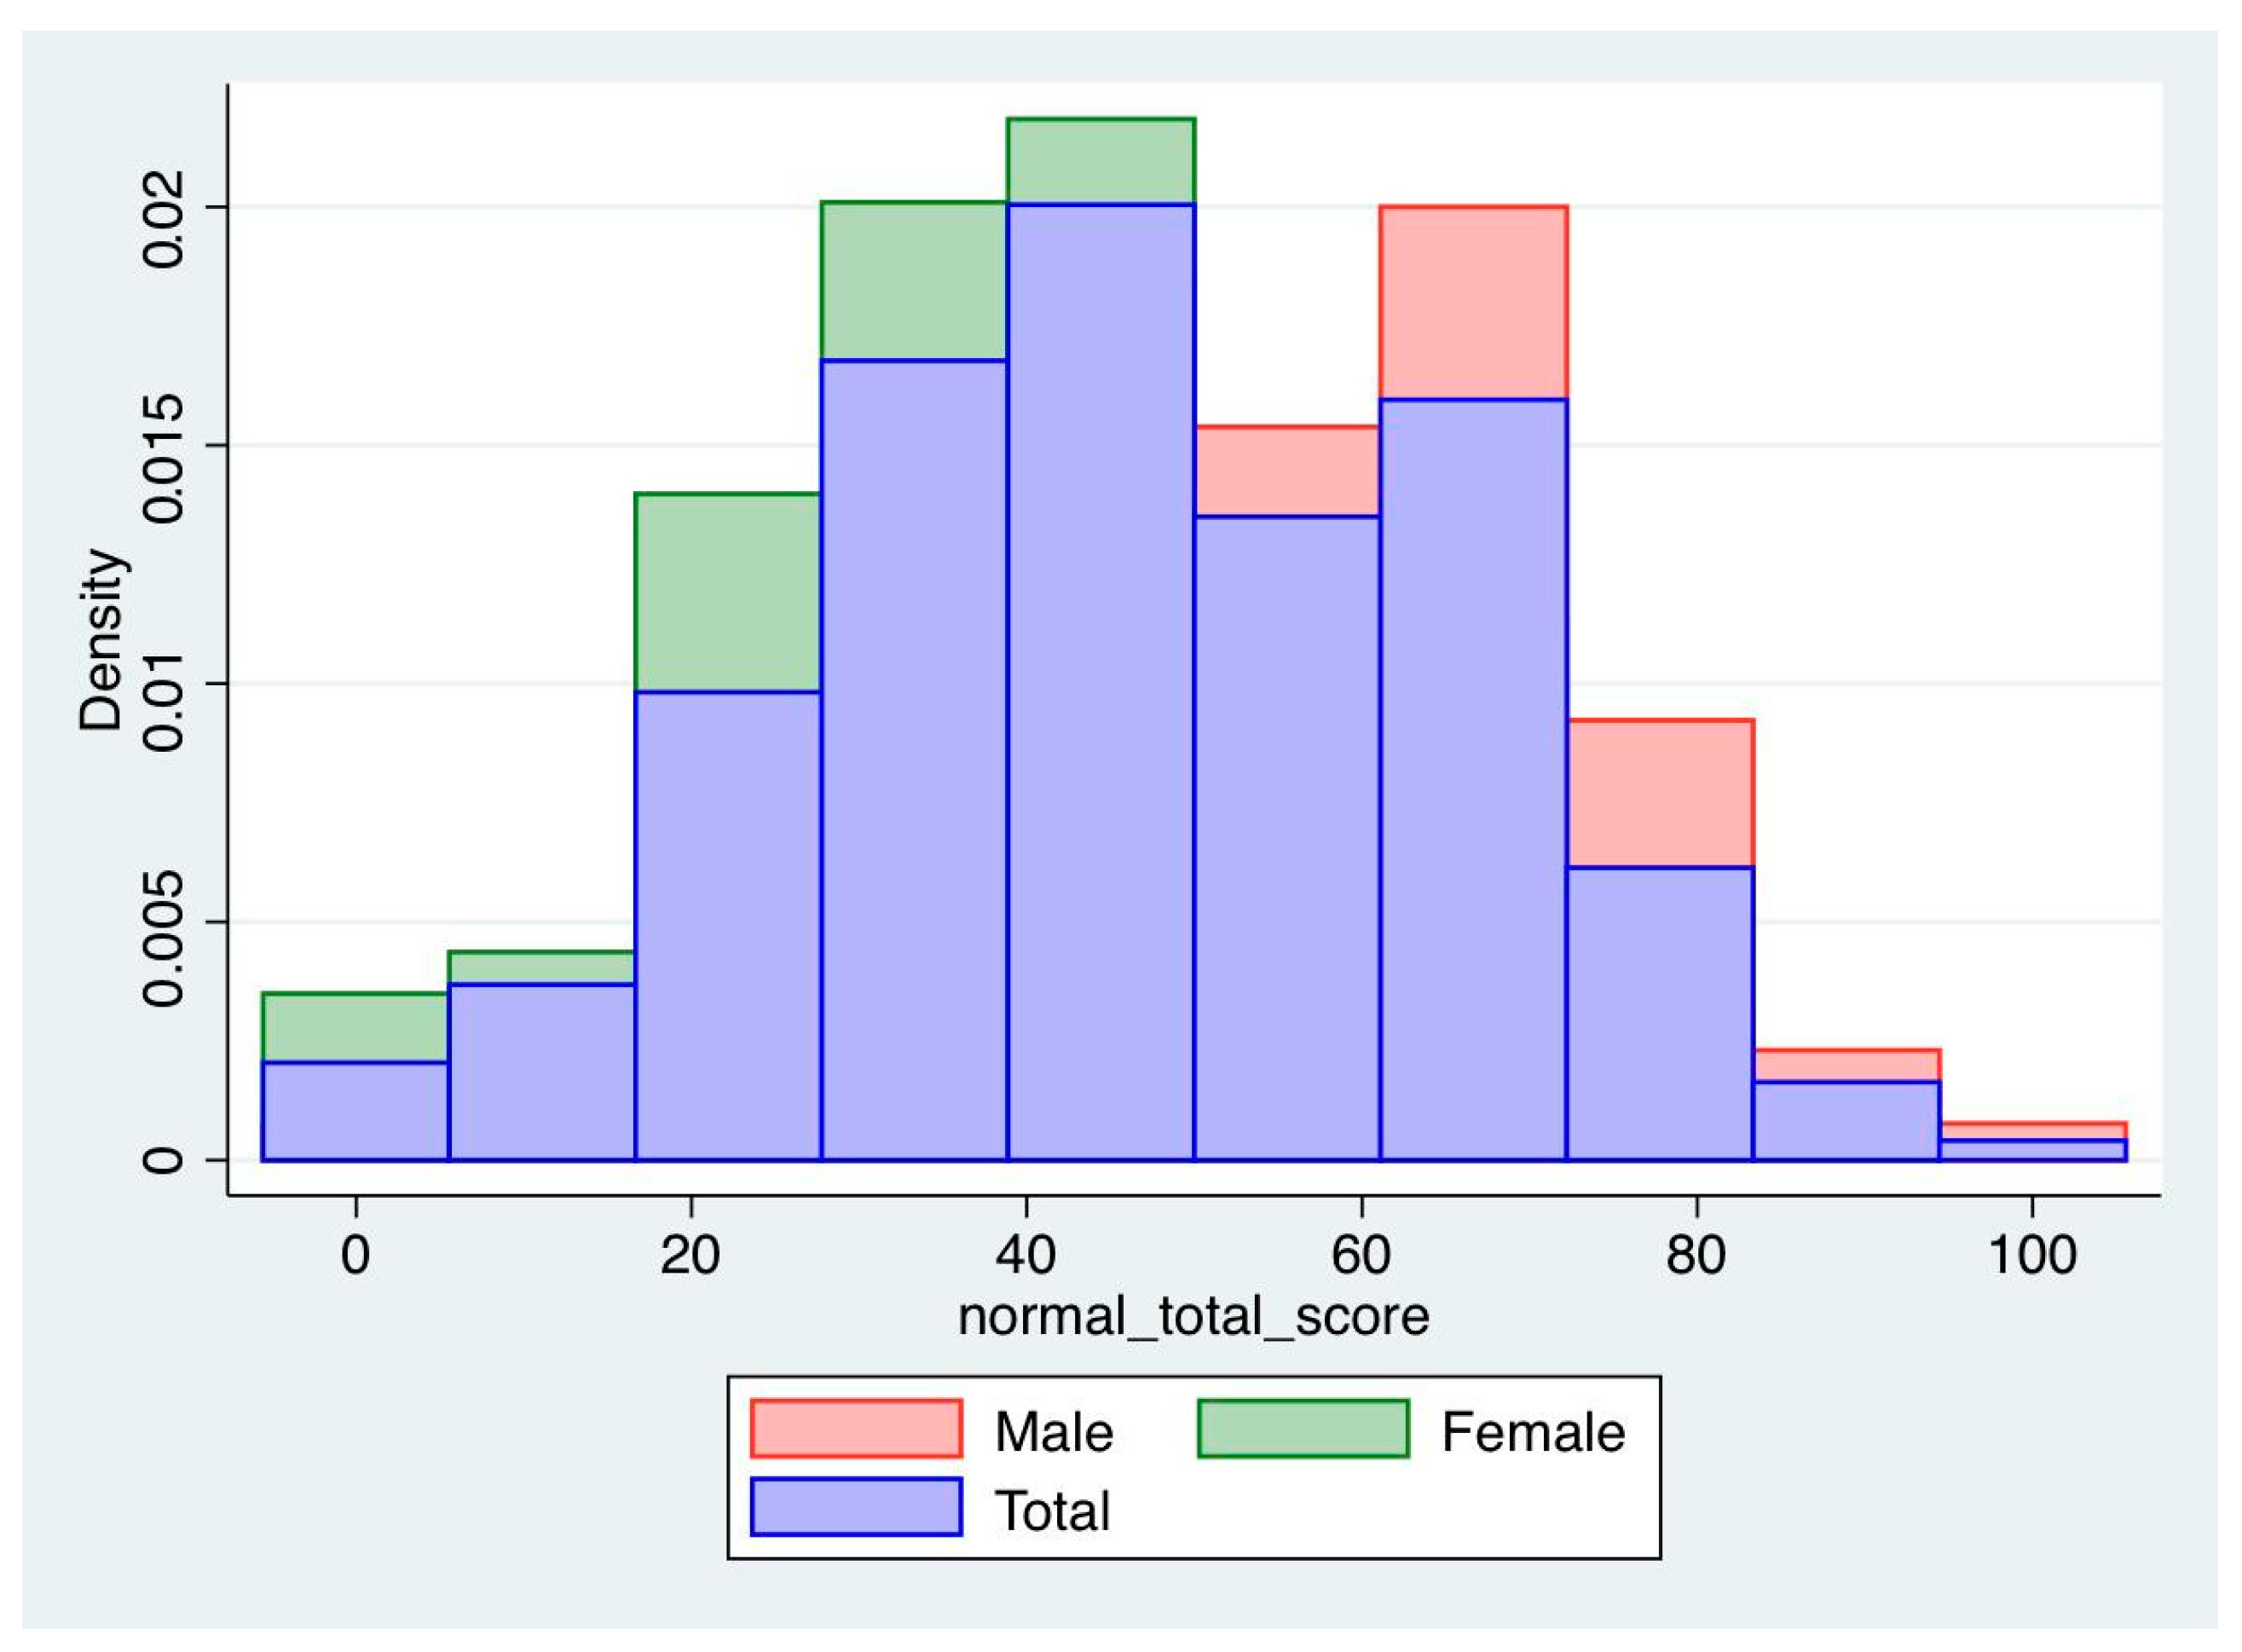
As shown in
Figure 1, the distribution of the total score is close to the standardized normal distribution (
p-value < 0.05). The mean score is 46.5, which corresponds to approximately 4 correct answers out of 10. Moreover, 60% of participants did not answer more than four questions correctly, and only 10% dealt successfully with more than seven questions. Males have an average total score significantly higher than females, 4.6 and 3.7, respectively (
p-value < 0.05).
To have an overview of participants’ performance on the examined tasks, we present the average performance in each task which measures departures from full rationality: economic rationality, cognitive reflection, financial literacy and numeracy abilities. Individuals record a higher score in cognitive reflection task (53.9) followed by the economic rationality task (46.5). These scores correspond to an average of 4 out of 10 correct answers for economic rationality and 1.6 out of 3 for cognitive reflection. The lowest performance was recorded in numeracy abilities, scoring on average 31.3 (
Table 4).
The Econometric Model
Can this information explain how one learns how to be a rational economic man? In other words, can we explain the score on the REM test by the performance in the more basic tests and ultimately on cognition? Does gender exert an independent influence? Our approach is similar to
Skagerlund et al. (
2018).
The regression analysis starts with a baseline model, controlling for covariates. In our purposely homogeneous sample, these are gender and age, which are collinear with stage in the course.
The bibliography has shown that women are more likely to exhibit behavioral biases compared to men; thus, we expect a negative coefficient. Next, we focus on the relationship between the cognitive performance and the behavioral and heurist biases as described by the variable “total score”. We also control for financial literacy and numerical abilities. CRT enters independently, but also through its effect on numerical and financial literacy.
The estimating equation is:
The dependent variable is the total score, and the independent variables include personal characteristics and the performance in numeracy abilities and financial literacy. In
Table 3, we summarize the mean and the standard deviation for all the measures that will be included in the regression. Also included is the correlation among the variables. The total score is positively correlated with the numeracy abilities and financial literacy while it is also correlated with the cognitive performance. Cognitive performance is highly correlated with economic rationality and negatively correlated with gender. It can be noticed that gender is negatively correlated with participants’ performance, highlighting the effect of gender on the behavioral biases (
Table 5).
In order to ensure that all the assumptions hold, we tested for multicollinearity issues, finding that the variance inflation factor (VIF) equals 1.18 and the tolerance above 0.80 flagging that no issue was detected. The heteroscedasticity tested using the Brusch–Pagan test (p-value > 0.05) indicates that we have not violated the assumption.
Table 6 summarizes the results of the analysis. The first model (Model 1) uses only cofactors, including gender and age, and explains only 8% of the total variation. Model 2 includes the cognitive reflection task driving up
; this almost trebles the explanatory power of the model. The next model adds information about numeracy, increasing the overall explanatory power by 0.05. The final model (Model 4) also captures the effect of financial literacy, slightly increasing
. The model confirms that women tend to have lower performance in total score, exhibiting behavioral biases more often. The effect of cognitive score seems to be positive; a unit increase in cognitive performance causes a positive effect of 5.55 points to the total score. The effects of numeracy and financial literacy are also positive; each additional increase in the Berlin test performance is associated with a 3.66-point increase while financial literacy adds 1.83 to the dependent variable. The halving of the CRT coefficient once numeracy and financial literacy are allowed for confirms that cognitive reflection operates
both independently
and through numeracy. These findings support evidence that individuals with lower cognitive performance are more likely to be suspectable to behavioral biases, as they might be more likely to show poor performance in numeracy and literacy tasks.
To investigate further if the effect of cognitive reflection on the behavioral biases depends on gender, we included an interaction term in the regression equation (Model 5) to see if it has a significant effect on the dependent variable. The model showed a significant interaction (p < 0.05), suggesting that the effect of cognitive performance on biases is notably lower among women.
Standardized coefficients are included to facilitate a comparison of the magnitude of effects of explanatory variables. These coefficients adjust standard deviations in such a way that all variables have equal standard deviations. The last column of
Table 2 shows that cognitive score contributes the most to total score (β = 0.36), followed by numerical abilities (β = 0.20) and financial literacy (β = 0.11). Interestingly, cognitive performance is three times as important as financial literacy in predicting behavioral biases.
To summarize, the final model suggests a strong impact of cognitive abilities on the prediction of behavioral performance in 10 well-known tasks linked to how close someone comes to REM. The higher the cognitive performance, the closer you approximate the legendary rational economic individual. The numerical performance as well as the financial literacy also positively affect the chance of exhibiting smaller biases and earning a higher score.
Gender has also a big impact, suggesting that women are less likely to avoid the biases examined
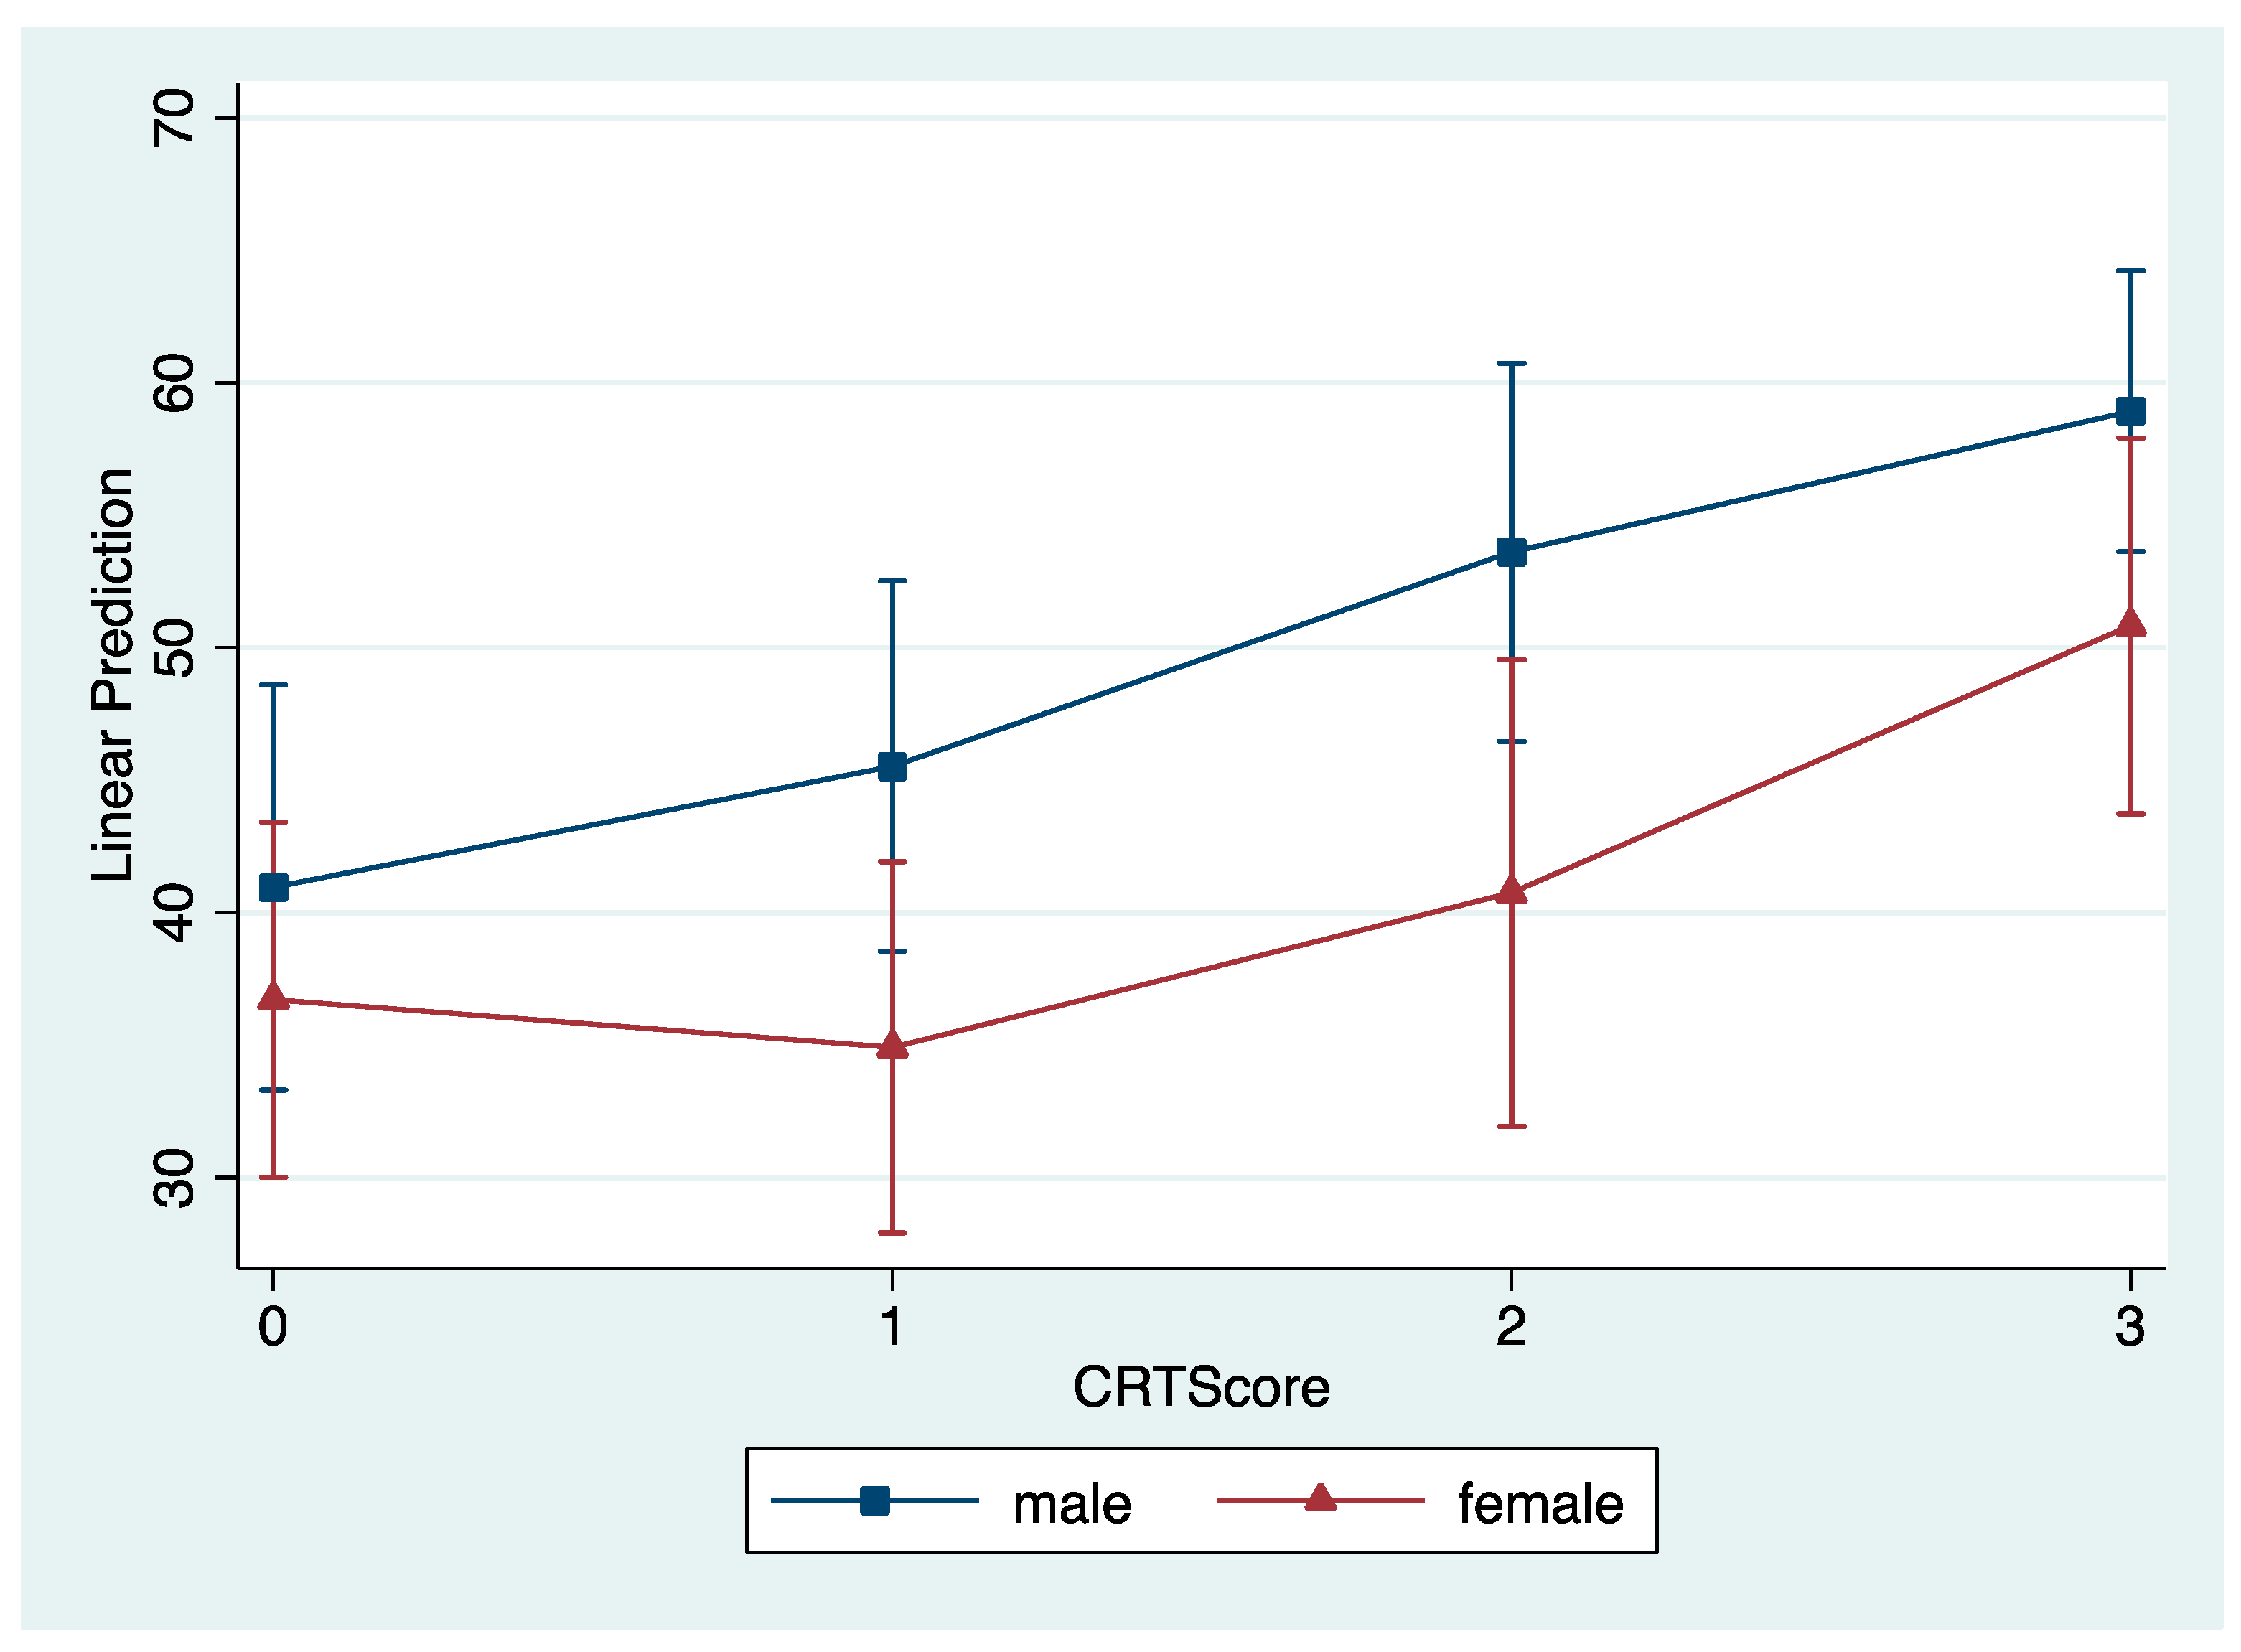
1. Concerning its effect on cognitive performance, we included an interaction term. This evidence depicts a different performance based on gender and cognitive capacity. The marginal effect allows us to examine the partial effect of CRT on the behavioral biases controlling for gender for some representative cases. Using the first-order derivative of the regression equation, we derive:
Controlling for covariates (CRT score and gender), we obtain the average marginal effect as the average first-order derivative:
Figure 2 illustrates the computed marginal effects on the prediction of exhibiting behavioral biases, using Model 5. As the cognitive score increases, the effect on behavioral biases score also increases, but at a different rate by gender. In the lowest cognitive group, the difference is small (9% difference), while it increases as the cognitive score increases. For example, if the cognitive score is 3, the estimation for males is 4.8 and 3.7 for females. Interestingly, in the model, a high CRT woman is 27% closer to REM than a low CRT male—indicating possibly that gender differences are not innate.
6. Discussion
Our findings highlight the connection between behavioral biases and individuals’ capacity to make rational choices associated with Homo economicus. They also ponder the influence of gender on the relationship between cognitive ability and behavioral biases. Previous studies uncovered the relationship between cognitive abilities and behavioral biases using laboratory experiments. For example,
Hoppe (
2011), using university students from different fields of study, investigated whether the cognitive reflection score is related to behavioral biases, focusing on the base rate fallacy, the conservatism bias, overconfidence and the endowment effect. They conclude that CRT is a good predictor for biases where there exists a correct solution and where analytical skills help to derive it (base rate fallacy, conservatism bias).
Albaity et al. (
2014) summoned undergraduate and postgraduate students to explore the correlation between behavioral biases and CRT. Their findings suggest that a lower cognitive score is correlated with conservatism (0.11) and impatience in time preference judgements (0.13). They also found that males score higher in the Cognitive Reflection Test, confirming
Oechssler et al. (
2009) and
Hoppe (
2011).
Noori (
2016) approach is similar, using university students to examine nine biases (
Table 7). His results underline that cognitive reflection can predict the occurrence of behavioral anomalies. He also found that illusion of control and the self-serving bias are correlated with gender. In contrast to the above studies which focused on students,
Oechssler et al. (
2009) and
Skagerlund et al. (
2018) used representative samples from the general population, and confirmed that biases are significantly more pronounced for people with low cognitive scores. Specifically, they found that risk aversion in the domain of gains, conjunction fallacy and conservatism are more pronounced among such individuals.
Our work focused on a purposely biased sample of young undergraduates. As no population registry exists in Greece, drawing a sample purporting to be representative is an ambitious undertaking. As the premise of the paper is that rationality is not innate but learned, a sampling frame composed of individuals with proven numeracy skills tilts the probabilities towards confirming the null hypothesis of REM; should tests reject this, the (unknown) “true” power of the test would be greater than if the sample was random. However it may be, a feature of behavioral economics is that most evidence comes from Anglo-Saxon or (to a lesser extent) Western European contexts. Adding a data point derived from the European southern rim, culturally and linguistically distinct, would possibly carry greater weight. This observation is compounded by the fact that behavioral economics and the specific cognitive tests are relatively unknown in Greece, with the probability of familiarity thus smaller.
Our work used a broader number of examined heuristics and biases; in doing so, we largely confirmed previous findings. The novelty of our approach is threefold. First, it examined the effect of cognitive abilities on the level of statistical numeracy and risk literacy and found that subjects in the low group score lower in the numeracy test. Second, it tested the relationship between financial literacy and cognitive performance, showing that the “high” CRT group has better performance on the task compared to the “low” CRT group. Third, it is the first study to examine these effects using a sample of Greek students. This is of importance to behavioral economics; it adds a data point from a cultural milieu less exposed to discussion on behavioral biases. It may also enlighten discussion of public policies and reforms in Greece.
7. Conclusions
In this study, we set out to test the effect of cognitive performance on selected behavioral anomalies. We utilized a barrage of tests on the same subjects, which allowed us to relate performance between the tasks: the Cognitive Reflection Test, the Berlin Numeracy Test and the financial literacy task. In our sample of numerate Greek university students, we found a strong correlation between the performance on cognitive tasks and several other biases (risk preference, conjunction fallacy, illusion of control, time preference, overconfidence). Despite the sample being predisposed to display “rationality”, this was far from the case—Greek undergraduates were no closer to REM than, say, the representative Swedes of
Skagerlund et al. (
2018). Our premise was that there is potential to correct this, through reflection and learning; even so, this potential was hardly taken up.
What is the significance of this for Greece? When these tests were taken, the country was gripped by a deep economic and financial crisis necessitating deep structural reforms. Most reforms, especially in the labor and social fields, were in the direction of limiting the State’s paternalistic role (
Meghir et al. 2017). Given that choice is taken away from the State and handed over to individuals, a valid issue is how efficiently such choice would be exercised (
Tinios 2020). In this sense, our results of widespread departures from rationality are not encouraging: if young students supposedly taught to handle complex concepts depart from rationality, what hope is there for their older counterparts, who are accustomed to deferring decisions to the State? However, if traits can be learned, there may be a silver lining: reflection leads to tangible results—even in the simplistic world of the instruments used in our tests. However, it may be, our results underline the importance of “educating” economic agents as an important component of reform programs. It is not enough to construct new structures; people should be able to make use of them.
These remarks are especially important in the case of gender. Low female labor market participation in Greece (at 56%) is far below that of its peers in the EU and constitutes the major untapped “growth potential” (
Lyberaki 2017;
Lyberaki et al. 2017). Our results are in line with other behavioral economics findings, but are especially poignant as they highlight the size of the work at hand. Public nudges for economic literacy urgently need a gender dimension.
Our study provided another data point in the accumulating evidence that Homo economicus is not born, but made. Further research could focus on the mechanics, process and content of learning. Conducting such research in the protected environment of academia, apart from providing easy answers to sampling issues, could profitably exploit the link between academic and experiential learning, relating, for example, cognitive tests to academic scores in different disciplines, using them as instrumental variables. Should students be followed into the labor market, this could result in panel data which could combine cognitive scores with labor market outcomes.
Author Contributions
Conceptualization, M.C. and P.T.; methodology, M.C. and P.T.; formal analysis, M.C.; investigation, M.C.; data curation, M.C.; writing—original draft preparation, M.C., P.X. and P.T.; writing—review and editing, P.T.; visualization, M.C. All authors have read and agreed to the published version of the manuscript.
Funding
The publication of this paper was partly supported by the University of Piraeus Research Center.
Institutional Review Board Statement
The study protocol received ethical approval from the scientific board of the Department of Statistics and Insurance Science of Piraeus University.
Informed Consent Statement
Informed consent was obtained from all subjects involved in the study.
Data Availability Statement
The data that support the findings of this study are available from the corresponding author upon reasonable request.
Conflicts of Interest
The authors declare no conflict of interest.
Appendix A
Table A1.
Heuristic and behavioral biases questions.
Table A1.
Heuristic and behavioral biases questions.
| Task | Question |
|---|
| Risk preference I | You have the choice between two alternatives. Alternative 1: You receive EUR 10. Alternative 2: You receive a lottery ticket that yields a 75% chance of winning EUR 20, with 25% probability it is worthless. Which alternative do you choose? |
| Risk preference II | You have to pay EUR 5000 as your debt is due. Would you prefer to replace this payment through the following alternatives: (1) with a probability of 75%, you must pay EUR 10,000; or (2) with 25% probability, you do not have to pay anything. |
| Conjunction fallacy | Linda is 31 years old, single, outspoken and very bright. She majored in philosophy. As a student, she was deeply concerned with issues of discrimination and social justice, and also participated in anti-nuclear demonstrations. Which is more probable? (a) Linda is a bank teller; (b) Linda is a bank teller and is active in the feminist movement. |
| Illusion of control | During a game, do you prefer to throw the dice, or does it not make a difference if someone else does it? (a) Makes a difference; (b) does not make a difference. |
| Time preference | Suppose that you won EUR 70,000 as a prize in a lottery and there are two options, which one do you choose? (1) Take the prize immediately, or (2) take the prize after a month with 5% premium. |
| Base rate fallacy | There are 100 officers in a commercial building, including 70 lawyers and 30 engineers. We interviewed a person from the building. Panos is a 30-year-old man. He is married with no children; a man of high ability and motivation, he promises to be quite successful in his field. He is well liked by his colleagues. What is the probability that he is an engineer? |
| Hyperbolic discount | Suppose that you receive a lump sum payment of EUR 70,000 and there are two options, which one do you choose? (1) Take the money immediately, or (2) take the money after eight years with 100% premium. |
| Status quo | You have to choose between three alternative scenarios. The first scenario is to stay in your current job; the second is to move to a village with equal chances to double your income or lose 30% of it; and the last one is to move to a village with a 50% chance to increase your income by 30%, a 20% chance not to increase your income and a 30% chance to lose 20% of your income. |
| Conservatism | You have a friend who works in a brokerage firm, and he is active in stock trades. Recently, he suggested that you buy a pharmaceutical company’s stock, and he said that, these days, he receives numerous buy orders for that stock. Furthermore, you found other information which supports the company’s profitability. Based on these facts, you bought 200,000 shares yesterday. Today, you heard news about a fire in one of the company’s warehouses, news that your friend confirmed. What is your reaction? (a) I wait for later news to be assured about the events that happened in the company, and after that I will decide; or (b) I sell order to my broker immediately. |
| Overconfidence | We asked participants, after answering CRT questions, to estimate the number of correct answers. |
Table A2.
Financial literacy questions.
Table A2.
Financial literacy questions.
| Task | Question |
|---|
| Compounding | Suppose you had EUR 100 in a savings account and the interest rate was 5% per year. After 2 years, how much do you think you would have in the account if you left the money to grow? |
| Inflation | Imagine that the interest rate on your savings account was 1% per year and inflation was 2% per year. After 1 year, how much would you be able to buy with the money in this account? |
| Mortgage | A 15-year mortgage typically requires higher monthly payments than a 30-year mortgage, but the total interest paid over the life of the loan will be less. |
| Diversification | Buying a single company’s stock usually provides a safer return than a stock mutual fund. |
| Bond pricing | If interest rates fall, what should happen to bond prices? |
Table A3.
Berlin Numeracy Test questions.
Table A3.
Berlin Numeracy Test questions.
| Question | Correct |
|---|
| Out of 1000 people in a small town, 500 are members of a choir. Out of these 500 members in the choir, 100 are men. Out of the 500 inhabitants who are not in the choir, 300 are men. What is the probability that a randomly drawn man is a member of the choir? | 35.6% |
| Imagine we are throwing a five-sided dice 50 times. On average, out of these 50 throws, how many times would this five-sided dice show an odd number (1, 3, 5)? | 53.2% |
| Imagine we are throwing a loaded dice (6 sides). The probability that the dice shows a 6 is twice as high as the probability of each of the other numbers. On average, out of these 70 throws, how many times would the dice show the number 6? | 24.3% |
| In a forest, 20% of mushrooms are red, 50% are brown and 30% are white. A red mushroom is poisonous with a probability of 20%. A mushroom that is not red is poisonous with a probability of 5%. What is the probability that a poisonous mushroom in the forest is red? | 13.1% |
Table A4.
Cognitive Reflection Test questions.
Table A4.
Cognitive Reflection Test questions.
| Question | % of Correct |
|---|
| A ball and a bat cost EUR 110 in total. The bat costs 100 euros more than the ball. How much does the ball cost? (intuitive answer: 10; correct answer: 5) | 46.4% |
| If it takes 5 machines 5 min to make 5 widgets, how long would it take 100 machines to make 100 widgets? (intuitive answer: 100; correct answer: 5) | 56.8% |
| In a lake, there is a patch of lily pads. Every day, the patch doubles in size. If it takes 37 days for the patch to cover the entire lake, how long would it take for the patch to cover half the lake? (intuitive answer: 19; correct answer: 36) | 29.0% |
Table A5.
Berlin Numeracy Test per answer (%).
Table A5.
Berlin Numeracy Test per answer (%).
| Question | Correct | False | No Answer | Male (%Correct) | Female (%Correct) |
|---|
| Choir members | 35.59 | 64.41 | - | 35.9 | 35.2 |
| Five-sided dice | 53.15 | 46.85 | - | 61.5 | 44.2 |
| Six-sided dice | 24.32 | 72.97 | 2.7 | 23.8 | 27.0 |
| Mushrooms | 13.06 | 84.23 | 2.7 | 16.4 | 10.0 |
Table A6.
Financial literacy questions (of correct questions by CRT group, gender and total, %).
Table A6.
Financial literacy questions (of correct questions by CRT group, gender and total, %).
| Question | Correct | Low | High | p-Value | Male | Female | p-Value |
|---|
| Compounding | 25.2 | 19.6 | 30.4 | <0.05 | 31.6 | 18.1 | <0.05 |
| Inflation | 54.8 | 49.0 | 60.0 | <0.1 | 61.5 | 47.1 | <0.05 |
| Diversification | 32.9 | 25.7 | 39.5 | <0.05 | 39.8 | 24.7 | <0.05 |
| Mortgage | 57.8 | 52.5 | 63.0 | <0.1 | 54.9 | 61.0 | n.s |
| Bond pricing | 38.0 | 34.9 | 40.9 | n.s | 39.3 | 36.5 | n.s |
| Total (average) | 2.1 | 1.9 | 2.4 | <0.05 | 1.4 | 1.1 | n.s |
Table A7.
CRT score per answer.
Table A7.
CRT score per answer.
| Question | Ball and Bat | Widget | Lily Pad |
|---|
| Impulsive | 42.8 | 29.3 | 28.9 |
| Correct | 46.4 | 56.8 | 59.3 |
| Other | 10.8 | 14.0 | 11.8 |
| Female (correct) | 41.9 | 50.5 | 51.4 |
| Male (correct) | 50.4 | 26.5 | 66.4 |
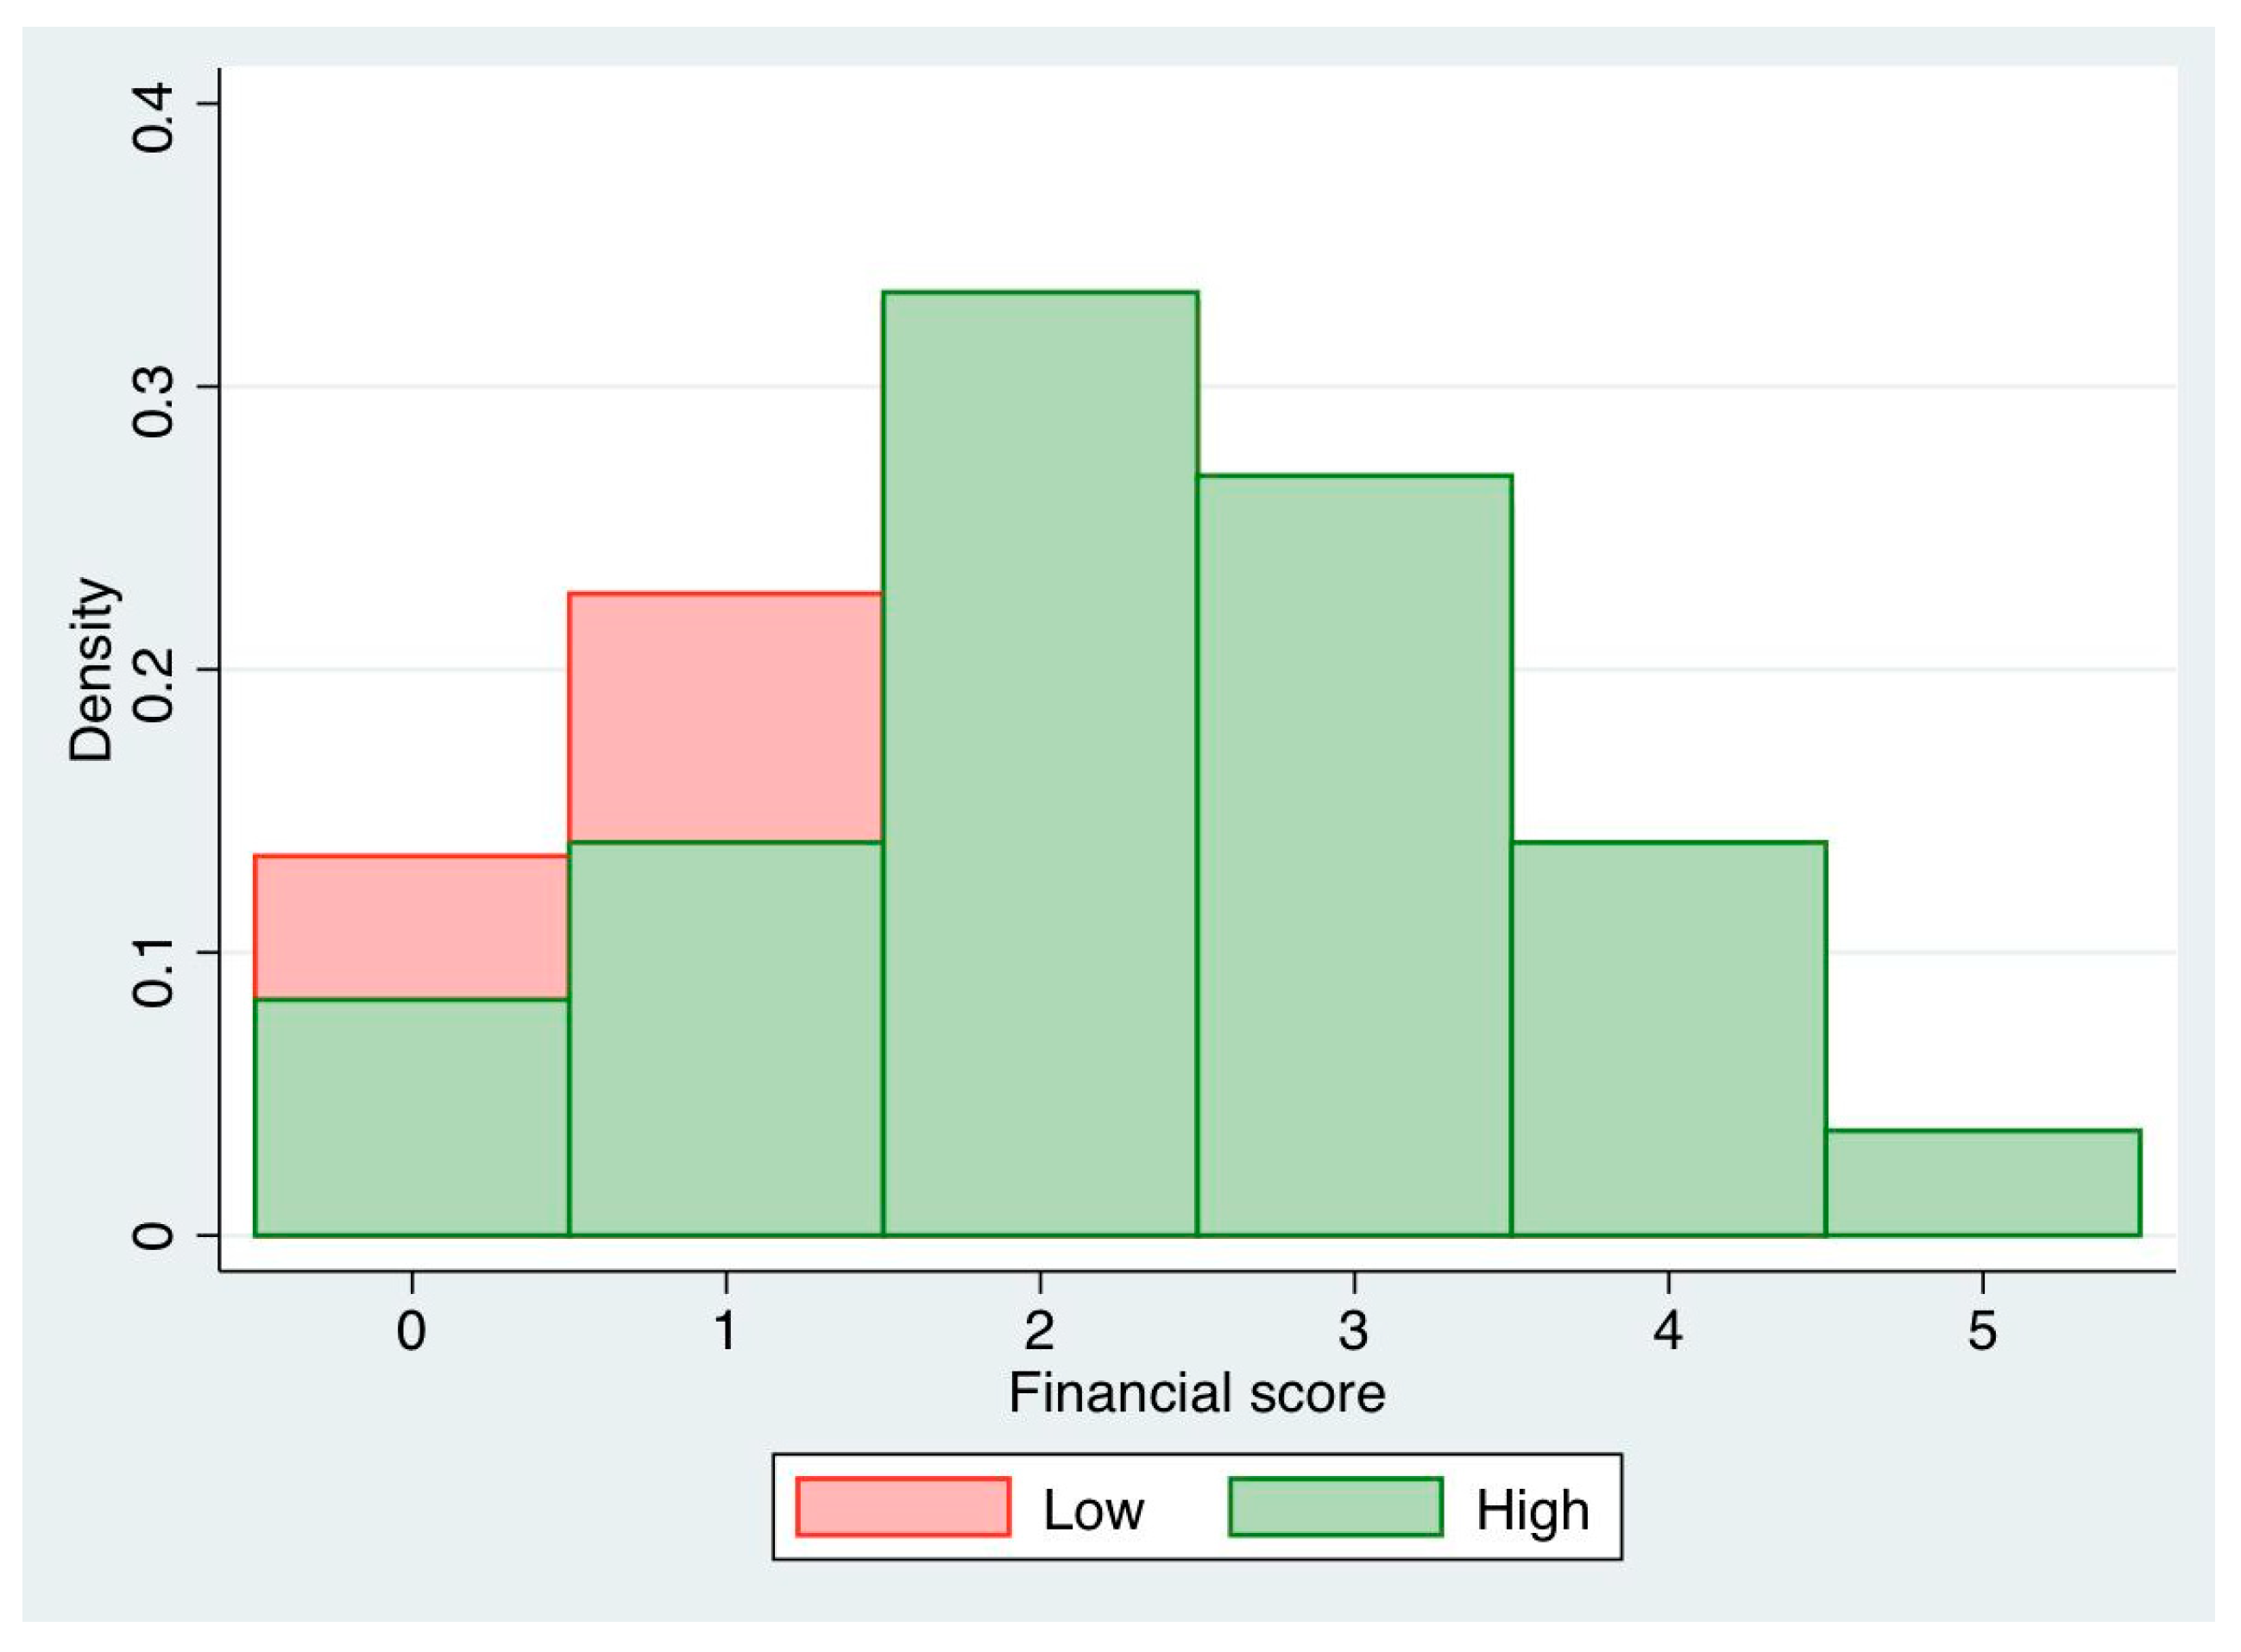
Figure A1.
Financial score by CRT score.
Figure A1.
Financial score by CRT score.
Note
| 1 | Chow test was performed to examine whether the coefficients in two different regression models (males and females) are equal; the null hypothesis was rejected. |
References
- Albaity, Mohamed, Mahfuzur Rahman, and Islam Shahidul. 2014. Cognitive reflection test and behavioral biases in Malaysia. Judgment and Decision Making 9: 149–51. [Google Scholar]
- Anderson, Anders, Forest Baker, and David T. Robinson. 2015. Optimism, Financial Literacy and Participation. Cambridge: National Bureau of Economic Research. [Google Scholar]
- Ateş, Sinem, Ali Coşkun, M. Abdullah Şahin, and M. Levent Demircan. 2016. Impact of Financial Literacy on the Behavioral Biases of Individual Stock Investors: Evidence from Borsa Istanbul. Business and Economics Research Journal 7: 1–19. [Google Scholar] [CrossRef]
- Benson, Buster. 2016. Cognitive bias cheat sheet. Available online: https://medium.com/better-humans/cognitive-bias-cheat-sheet-55a472476b18 (accessed on 10 March 2022).
- Bikhchandani, Sushil, David Hirshleifer, and Ivo Welch. 1998. Learning from the behavior of others: Conformity, fads, and informational cascades. Journal of Economic Perspectives 12: 151–70. [Google Scholar] [CrossRef] [Green Version]
- Brañas-Garza, Pablo, Teresa García-Muñoz, and Robert Hernán González. 2012. Cognitive effort in the beauty contest game. Journal of Economic Behavior and Organization 83: 254–60. [Google Scholar] [CrossRef] [Green Version]
- Camerer, Colin. 1998. Bounded rationality in individual decision making. Experimental Economics 1: 163–83. [Google Scholar] [CrossRef]
- Camerer, Colin, and Dan Lovallo. 1999. Overconfidence and excess entry: An experimental approach. American Economic Review 89: 306–18. [Google Scholar] [CrossRef] [Green Version]
- Cokely, Edward T., Mirta Galesic, Eric Schulz, Saima Ghazal, and Rocio Garcia-Retamero. 2012. Measuring risk literacy: The Berlin numeracy test. Judgment and Decision Making 7: 25–47. [Google Scholar]
- Coyle, Diane. 2021. Cogs and Monsters. Princeton: Princeton University Press. [Google Scholar]
- Croson, Rachel, and Uri Gneezy. 2009. Gender differences in preferences. Journal of Economic Literature 47: 448–74. [Google Scholar] [CrossRef] [Green Version]
- De Neys, Wim. 2021. On dual-and single-process models of thinking. Perspectives on Psychological Science 16: 1412–27. [Google Scholar] [CrossRef]
- Deck, Cary, and Salar Jahedi. 2015. The effect of cognitive load on economic decision making: A survey and new experiments. European Economic Review 78: 97–119. [Google Scholar] [CrossRef] [Green Version]
- Drydakis, Nick. 2009. Sexual orientation discrimination in the labour market. Labour Economics 16: 364–72. [Google Scholar] [CrossRef] [Green Version]
- Eckel, Catherina C., and Philip J. Grossman. 2008. Differences in the economic decisions of men and women: Experimental evidence. Handbook of Experimental Economics Results 1: 509–19. [Google Scholar]
- Fama, Eugene F. 1998. Market efficiency, long-term returns, and behavioral finance. Journal of Financial Economics 49: 283–306. [Google Scholar] [CrossRef]
- Frederick, Shane. 2005. Cognitive reflection and decision making. Journal of Economic Perspectives 19: 25–42. [Google Scholar] [CrossRef] [Green Version]
- Friedman, Daniel. 1998. Monty Hall’s three doors: Construction and deconstruction of a choice anomaly. The American Economic Review 88: 933–46. [Google Scholar]
- Hair, Joe F., Michael Page, and Niek Brunsveld. 2019. Essentials of Business Research Methods. London: Routledge. [Google Scholar]
- Holt, Charles A., Megan Porzio, and Michelle Yingze Song. 2017. Price bubbles, gender, and expectations in experimental asset markets. European Economic Review 100: 72–94. [Google Scholar] [CrossRef]
- Hoppe, Eva I., and David J. Kusterer. 2011. Behavioral biases and cognitive reflection. Economics Letters 110: 97–100. [Google Scholar] [CrossRef]
- Huettner, Frank, and Marco Sunder. 2012. Axiomatic arguments for decomposing goodness of fit according to Shapley and Owen values. Electronic Journal of Statistics 6: 1239–50. [Google Scholar] [CrossRef]
- Huston, Sandra J. 2010. Measuring financial literacy. Journal of Consumer Affairs 44: 296–316. [Google Scholar] [CrossRef]
- Hyde, Janet Shibley. 2005. The gender similarities hypothesis. American Psychologist 60: 581. [Google Scholar] [CrossRef] [Green Version]
- Kahneman, Daniel. 2000. Evaluation by Moments: Past and Future. Choices, Values, and Frames. New York: Cambridge University Press, pp. 693–708. [Google Scholar]
- Kahneman, Daniel. 2003. Maps of bounded rationality: Psychology for behavioral economics. American Economic Review 93: 1449–75. [Google Scholar] [CrossRef] [Green Version]
- Kahneman, Daniel, and Amos Tversky. 1979. On the interpretation of intuitive probability: A reply to Jonathan Cohen. Cognition 7: 409–11. [Google Scholar] [CrossRef]
- Kahneman, Daniel, and Amos Tversky. 2013. Choices, values, and frames. In Handbook of the Fundamentals of Financial Decision Making: Part I. Singapore: World Scientific, pp. 269–78. [Google Scholar]
- Lindskog, Marcus, Neda Kerimi, Anders Winman, and Peter Juslin. 2015. A Swedish validation of the Berlin numeracy test. Scandinavian Journal of Psychology 56: 132–39. [Google Scholar] [CrossRef] [PubMed]
- Lukas, Moritz, and Markus Nöth. 2019. Interest rate changes and borrower search behavior. Journal of Economic Behavior and Organization 163: 172–89. [Google Scholar] [CrossRef]
- Lusardi, Annamaria, and Olivia S. Mitchell. 2011. Financial Literacy around the World: An Overview. No. w17107. Cambridge: National Bureau of Economic Research. [Google Scholar]
- Lyberaki, Antigone. 2017. Women in the Economy. Athens: Papadopoulos. [Google Scholar]
- Lyberaki, Antigone, Costas Meghir, and Dahne Nicolitsas. 2017. Labor market regulation and reform in Greece. In Beyond Austerity: Reforming the Greek Economy. Cambridge: MIT Press, pp. 211–50. [Google Scholar]
- Meghir, Costas, Christopher A. Pissarides, Dimitri Vayanos, and Nikolaos Vettas, eds. 2017. Beyond Austerity: Reforming the Greek Economy. Cambridge: MIT Press. [Google Scholar]
- Morewedge, Carey K., and Daniel Kahneman. 2010. Associative processes in intuitive judgment. Trends in Cognitive Sciences 14: 435–40. [Google Scholar] [CrossRef] [Green Version]
- Nelson, Julie A. 2012. Are Women Really More Risk-Averse than Men? Available online: https://ageconsearch.umn.edu/record/179104/files/12-05NelsonRiskAverse.pdf (accessed on 10 March 2022).
- Nelson, Julie A. 2015. Are women really more risk-averse than men? A re-analysis of the literature using expanded methods. Journal of Economic Surveys 29: 566–85. [Google Scholar] [CrossRef]
- Nguyen, Linh, Gerry Gallery, and Cameron Newton. 2019. The joint influence of financial risk perception and risk tolerance on individual investment decision-making. Accounting & Finance 59: 747–71. [Google Scholar]
- Noori, Mohammad. 2016. Cognitive reflection as a predictor of susceptibility to behavioral anomalies. Judgment and Decision Making 11: 114. [Google Scholar]
- Oechssler, Jörg, Andreas Roider, and Patrick W. Schmitz. 2009. Cognitive abilities and behavioral biases. Journal of Economic Behavior and Organization 72: 147–52. [Google Scholar] [CrossRef] [Green Version]
- Panageas, S., and P. Tinios. 2017. 11 Pensions: Arresting a Race to the Bottom. In Beyond Austerity: Reforming the Greek Economy. Cambridge: The MIT Press, p. 459. [Google Scholar]
- Philippas, Nikolaos D., and Christos Avdoulas. 2020. Financial literacy and financial well-being among generation-Z university students: Evidence from Greece. The European Journal of Finance 26: 360–81. [Google Scholar] [CrossRef]
- Rabin, Matthew, and Richard H. Thaler. 2001. Anomalies: Risk aversion. Journal of Economic Perspectives 15: 219–32. [Google Scholar] [CrossRef] [Green Version]
- Ring, Patrick, Levent Neyse, Tamas David-Barett, and Ulrich Schmidt. 2016. Gender differences in performance predictions: Evidence from the cognitive reflection test. Frontiers in psychology 7: 1680. [Google Scholar] [CrossRef] [PubMed]
- Ross, Michael, and Fiore Sicoly. 1979. Egocentric biases in availability and attribution. Journal of Personality and Social Psychology 37: 322. [Google Scholar] [CrossRef]
- Seru, Amit, Tyler Shumway, and Noah Stoffman. 2010. Learning by trading. The Review of Financial Studies 23: 705–39. [Google Scholar] [CrossRef]
- Shulman, Elizabeth P., Ashley R. Smith, Karol Silva, Grace Icenogle, Natasha Duell, Jason Chein, and Laurence Steinberg. 2016. The dual systems model: Review, reappraisal, and reaffirmation. Developmental Cognitive Neuroscience 17: 103–17. [Google Scholar] [CrossRef] [Green Version]
- Simon, Andrew F., Nancy S. Fagley, and Jennifer G. Halleran. 2004. Decision framing: Moderating effects of individual differences and cognitive processing. Journal of Behavioral Decision Making 17: 77–93. [Google Scholar] [CrossRef]
- Simon, Hebert A. 1990. Bounded rationality. In Utility and Probability. London: Palgrave Macmillan, pp. 15–18. [Google Scholar]
- Skagerlund, Kenny, Thérèse Lind, Camilla Strömbäck, Gustav Tinghög, and Daniel Västfjäll. 2018. Financial literacy and the role of numeracy–How individuals’ attitude and affinity with numbers influence financial literacy. Journal of Behavioral and Experimental Economics 74: 18–25. [Google Scholar] [CrossRef]
- Sunstein, Cass R. 2014. Why Nudge? London: Yale University Press. [Google Scholar]
- Sutton, Richard S., and Andrew G. Barto. 1998. Reinforcement Learning: An Introduction. Cambridge: The MIT Press, pp. 22–23. [Google Scholar]
- Tinios, Platon. 2020. Pensions in the Greek Political Economy, Chapter 31. In The Oxford Handbook of Greek Politics. Edited by K. Featherstone and D. Sotiropoulos. Oxford: OUP, pp. 489–504. [Google Scholar]
- Zhang, Hang, and Laurence T. Maloney. 2012. Ubiquitous log odds: A common representation of probability and frequency distortion in perception, action, and cognition. Frontiers in Neuroscience 6: 1. [Google Scholar] [CrossRef] [Green Version]
| Publisher’s Note: MDPI stays neutral with regard to jurisdictional claims in published maps and institutional affiliations. |
© 2022 by the authors. Licensee MDPI, Basel, Switzerland. This article is an open access article distributed under the terms and conditions of the Creative Commons Attribution (CC BY) license (https://creativecommons.org/licenses/by/4.0/).


