Article

Persistence and Attrition among Participants in a Multi-Page Online Survey Recruited via Reddit’s Social Media Network

by
Dirk H.R. Spennemann
School of Agricultural, Environmental and Veterinary Sciences, Charles Sturt University, P.O. Box 789, Albury, NSW 2640, Australia
Soc. Sci. 2022, 11(2), 31; https://doi.org/10.3390/socsci11020031
Submission received: 13 December 2021 / Revised: 14 January 2022 / Accepted: 14 January 2022 / Published: 18 January 2022

Abstract

:
Participant attrition is a major concern for the validity of longer or complex surveys. Unlike paper-based surveys, which may be discarded even if partially completed, multi-page online surveys capture responses from all completed pages until the time of abandonment. This can result in different item response rates, with pages earlier in the sequence showing more completions than later pages. Using data from a multi-page online survey administered to cohorts recruited on Reddit, this paper analyses the pattern of attrition at various stages of the survey instrument and examines the effects of survey length, time investment, survey format and complexity, and survey delivery on participant attrition. The participant attrition rate (PAR) differed between cohorts, with cohorts drawn from Reddit showing a higher PAR than cohorts targeted by other means. Common to all was that the PAR was higher among younger respondents and among men. Changes in survey question design resulted in the greatest rise in PAR irrespective of age, gender or cohort.

1. Introduction

Online conducted surveys have become popular due to their ease of administration, low cost of dissemination and distributed data entry, as well as for their geographic reach. Like any other type of survey, online surveys suffer from participant attrition (‘survey break off,’ ‘drop out’), i.e., the phenomenon that participants will abandon the survey once they get distracted or bored; no longer perceive the questions to be relevant, or simply run out of the amount time that they had set aside for it. In paper-based surveys, this may lead to incomplete surveys or, more likely, to the survey form not being returned at all. This directly affects the unit response rate (i.e., fully completed surveys). Online surveys, where the questions are delivered as a set of discrete pages (screenfuls) with the respondent actively moving from one to the next, will save the response that has been submitted on the previous page. This allows for partial responses to be recorded even when respondents abandon the effort part way through completion. Thus, while the entire survey may not have been answered, the sets of questions on the saved discrete pages will have been, leading to different item response rates (Edwards 2002).
A number of studies have commented on participant attrition in online surveys (Monroe and Adams 2012), but only a few studies have been carried out to examine the underlying patterns (Hochheimer et al. 2016; Hochheimer et al. 2019; Zhou and Fishbach 2016).
Participant attrition may introduce a bias in the survey responses and thus their implied representativeness, either within the same survey cohort (Liu and Wronski 2018; Zhou and Fishbach 2016) or between survey cohorts of different years (longitudinal studies). (Khadjesari et al. 2011) Factors that may cause participant attrition are questions that are deemed irrelevant to the respondent (Zhou and Fishbach 2016) as well as the complexity and length of the survey instrument (Hoerger 2010; Kato and Miura 2021; Liu and Wronski 2018; Mirta and Michael 2009; Robb et al. 2017). In addition to outright attrition, studies have shown that the quality of responses provided in the later part of a survey can be less detailed, whereby respondents provided faster and more uniform responses (i.e., with less reflection) than answers to questions earlier in the survey (Mirta and Michael 2009).
This paper will report on participant attrition in a multi-page online survey (examining the perceptions of risk in outdoor creation activities) as administered to cohorts recruited on the social media network Reddit.

Reddit as a Sampling Universe

Reddit is a social media network, touting itself as the ‘front page of the internet.’ It is, in essence, an array of multi-channel discussion board-type groupings and online communities (sub-Reddits), where users (‘redditors’) congregate, express opinions, ask questions and share images, videos and links to other social media and websites (Amaya et al. 2019; Gaffney and Matias 2018; Shatz 2017). These sub-Reddits can be topical and thematic (e.g., covering activities, hobbies, TV shows, etc.), geographic and country-specific (e.g., Brazil, Kenya), event-specific (e.g., COVID-19) or generic (e.g., AskReddit). While the primary language on Reddit is English, there are sub-Reddits in all other languages and scripts supported by ASCII-based standard character encodings. The members of the online community drive the nature and extent of content as well as the volume and frequency of discussion threads and the posted comments. The nature of the content ranges from semi-professional advice in Q&A formats to flippant postings or internet memes. The content of each sub-Reddit is managed by sub-Reddit-specific moderators, who are guided by a general system-wide Reddit code of conduct (Almerekhi et al. 2020), which is also enforced by an artificial intelligence-driven auto-moderation bot. (Jhaver et al. 2019) Moderators have the discretion to add sub-Reddit-specific usage rules and codes of conduct. (Moore and Chuang 2017; Squirrell 2019) This is not the place to discuss the politics of content moderation, or lack thereof, in some of the sub-Reddits, which has recently attracted some media attention (Copland 2020; Gaudette et al. 2020; Potter 2021).
The breadth and specificity of the various Reddit communities make them an attractive target for data mining, primarily the mining of discussion comments, such as in the fields of public health (Balsamo et al. 2021; Bunting et al. 2021; Lu et al. 2019; Okon et al. 2020; Wang et al. 2015), private finance (Glenski et al. 2019), education (Staudt Willet and Carpenter 2020), or public information and disinformation management (Achimescu and Chachev 2021; Balalau and Horincar 2021; Dosono et al. 2017; Duguay 2021). The use of Reddit as a data set, however, is not without its critics, as the sociodemographic characteristics of participants on Reddit are not comparable to the general population (Amaya et al. 2019). The participation is skewed towards younger males from more affluent English-speaking backgrounds (Amaya et al. 2019; Shatz 2017).
Descriptive demographic data exist for the representativeness of the overall Reddit universe as it manifested itself in early 2019. The percentage of U.S. citizens using Reddit decreases with age, with 22% of 18–29 years U.S. adults using Reddit, compared to 6% of people over 50 (Tankovska 2021d). Reddit users are twice as likely to be male and tend to be better educated, have a higher income, are more than three times as likely to be Caucasian or Hispanic than African American, and are less likely to reside in rural areas (Tankovska 2021a, 2021b, 2021c, 2021e, 2021h). While the uptake of Reddit as a platform has increased, the pattern of demographics has not changed much since 2013, with the exception being that the dominance of male participants has decreased from a ratio of 3:1 in 2013 to 2:1 in 2019 (Duggan and Smith 2013).
The frequency of access has implications on survey responses and the latency of posts. In mid-2020, 52% of Reddit users reputedly accessed the site on a daily basis, while 82% accessed Reddit at least weekly (Tankovska 2021f). The consumption of Reddit was less in other countries, such as Finland (35% daily, 77% weekly) (Tankovska 2020a), Sweden (36% daily, 71% weekly), (Tankovska 2020b) Norway (41% daily, 78% weekly) (Tankovska 2020c), and Denmark (49% daily) (Tankovska 2020d).
In terms of geographical reach, U.S. citizens were the primary consumers of Reddit, with 49.3% of the desktop traffic originating in the U.S.A. This was followed by Canada and the United Kingdom (both 7.8%), Australia (4.3%) and Germany (3.1%) (Tankovska 2021g). The main reason for consumption of Reddit posts (by U.S. residents) was to ‘get entertainment’ (72%) followed by ‘news’ (43%) and other (17%) (Tankovska 2020b).
Reddit usage varies between the time of day and day of the week. (Shatz 2017) Given the diversity of Reddit communities, usage patterns cannot be generalized but will depend on the specific sub-Reddit(s) targeted. Factors that are known to influence this are related to global geographic location (time zones), age structure and socio-economics (Moore and Chuang 2017; Shatz 2017).
Limited data exist on the nature and depth of engagement on Reddit, which may have an influence on survey participation. Analyses of discussion comments showed that older users, as well as women, tend to provide more detailed comments in a discussion thread (Finlay 2014), while others favor the apparent anonymity that allows for voicing contentious opinions (Kilgo et al. 2018).

2. Methodology

Between 2019 and 2021, the author carried out a survey into the perceptions and attitudes towards risk in outdoor recreation activities. The findings of that survey will be discussed elsewhere. The purpose of this paper is to examine a number of methodological aspects associated with the administration of the survey.
This section describes the purpose of the main study (merely to provide context), the survey instrument, the sampling frames and modes of administration, and the limitations.

2.1. Purpose of the Study

Adventure recreation encompasses a broad range of outdoor activities that require physical and mental participation, as well as an element of risk of injury and misadventure. Examples are SCUBA diving, mountain biking, mountaineering or hang gliding. Adventure recreation includes internal motivations such as fear, control, skill development, and a sense of achievement, as well as external motives such as social-based factors defined as friends, image, escape, and competition with others or the environment (Buckley 2012).
While there is an abundance of literature on motivations for participation in outdoor recreation and adventure tourism (Albayearak and Caber 2018; Buckley 2012; Caber and Albayearak 2016; Holm et al. 2017; Pomfret 2011; Yang et al. 2017), the vast majority of research into the motivations for participation and perception of risk in adventure recreation has drawn on participants during activities or their instructors. (Ewert et al. 2013; Maria Gstaettner et al. 2017) While valid in their own right, these are predefined samples that do not consider the range of motivations exhibited by the general public, nor do they explore the barriers to participation. Moreover, most of these studies rarely included or explored social determinants for participation. A systematic literature survey (Yang et al. 2017), for example, showed that most of the surveys limit themselves to querying gender without considering aspects of spousal status and responsibility of care for children. Possible determinants such as education, occupation and ethnicity are also rarely explored (Naidoo et al. 2015).
The research project explores the attitudes towards personal motivation and perceived risk among a broad range of participants, both those who have and those who have not (yet) participated in outdoor adventure recreation. This survey specifically looks at samples of the general population.
The study was approved for general distribution by Charles Sturt University’s Human Research Ethics Committee for the period from 6 February 2019 to 3 February 2024. The study was also approved by the Institutional Review Board of the University of Guam, for dissemination among the University of Guam staff and student population for the period from 22 April 2021 to 31 May 2022.
The survey was first administered between March and May 2019 to various Australian cohorts using a two-page paper form or its PDF version which could be disseminated and completed electronically. The survey was repeated between March and May 2020 with respondents from now on offered a completion via an online survey form disseminated via the Survey Monkey platform.

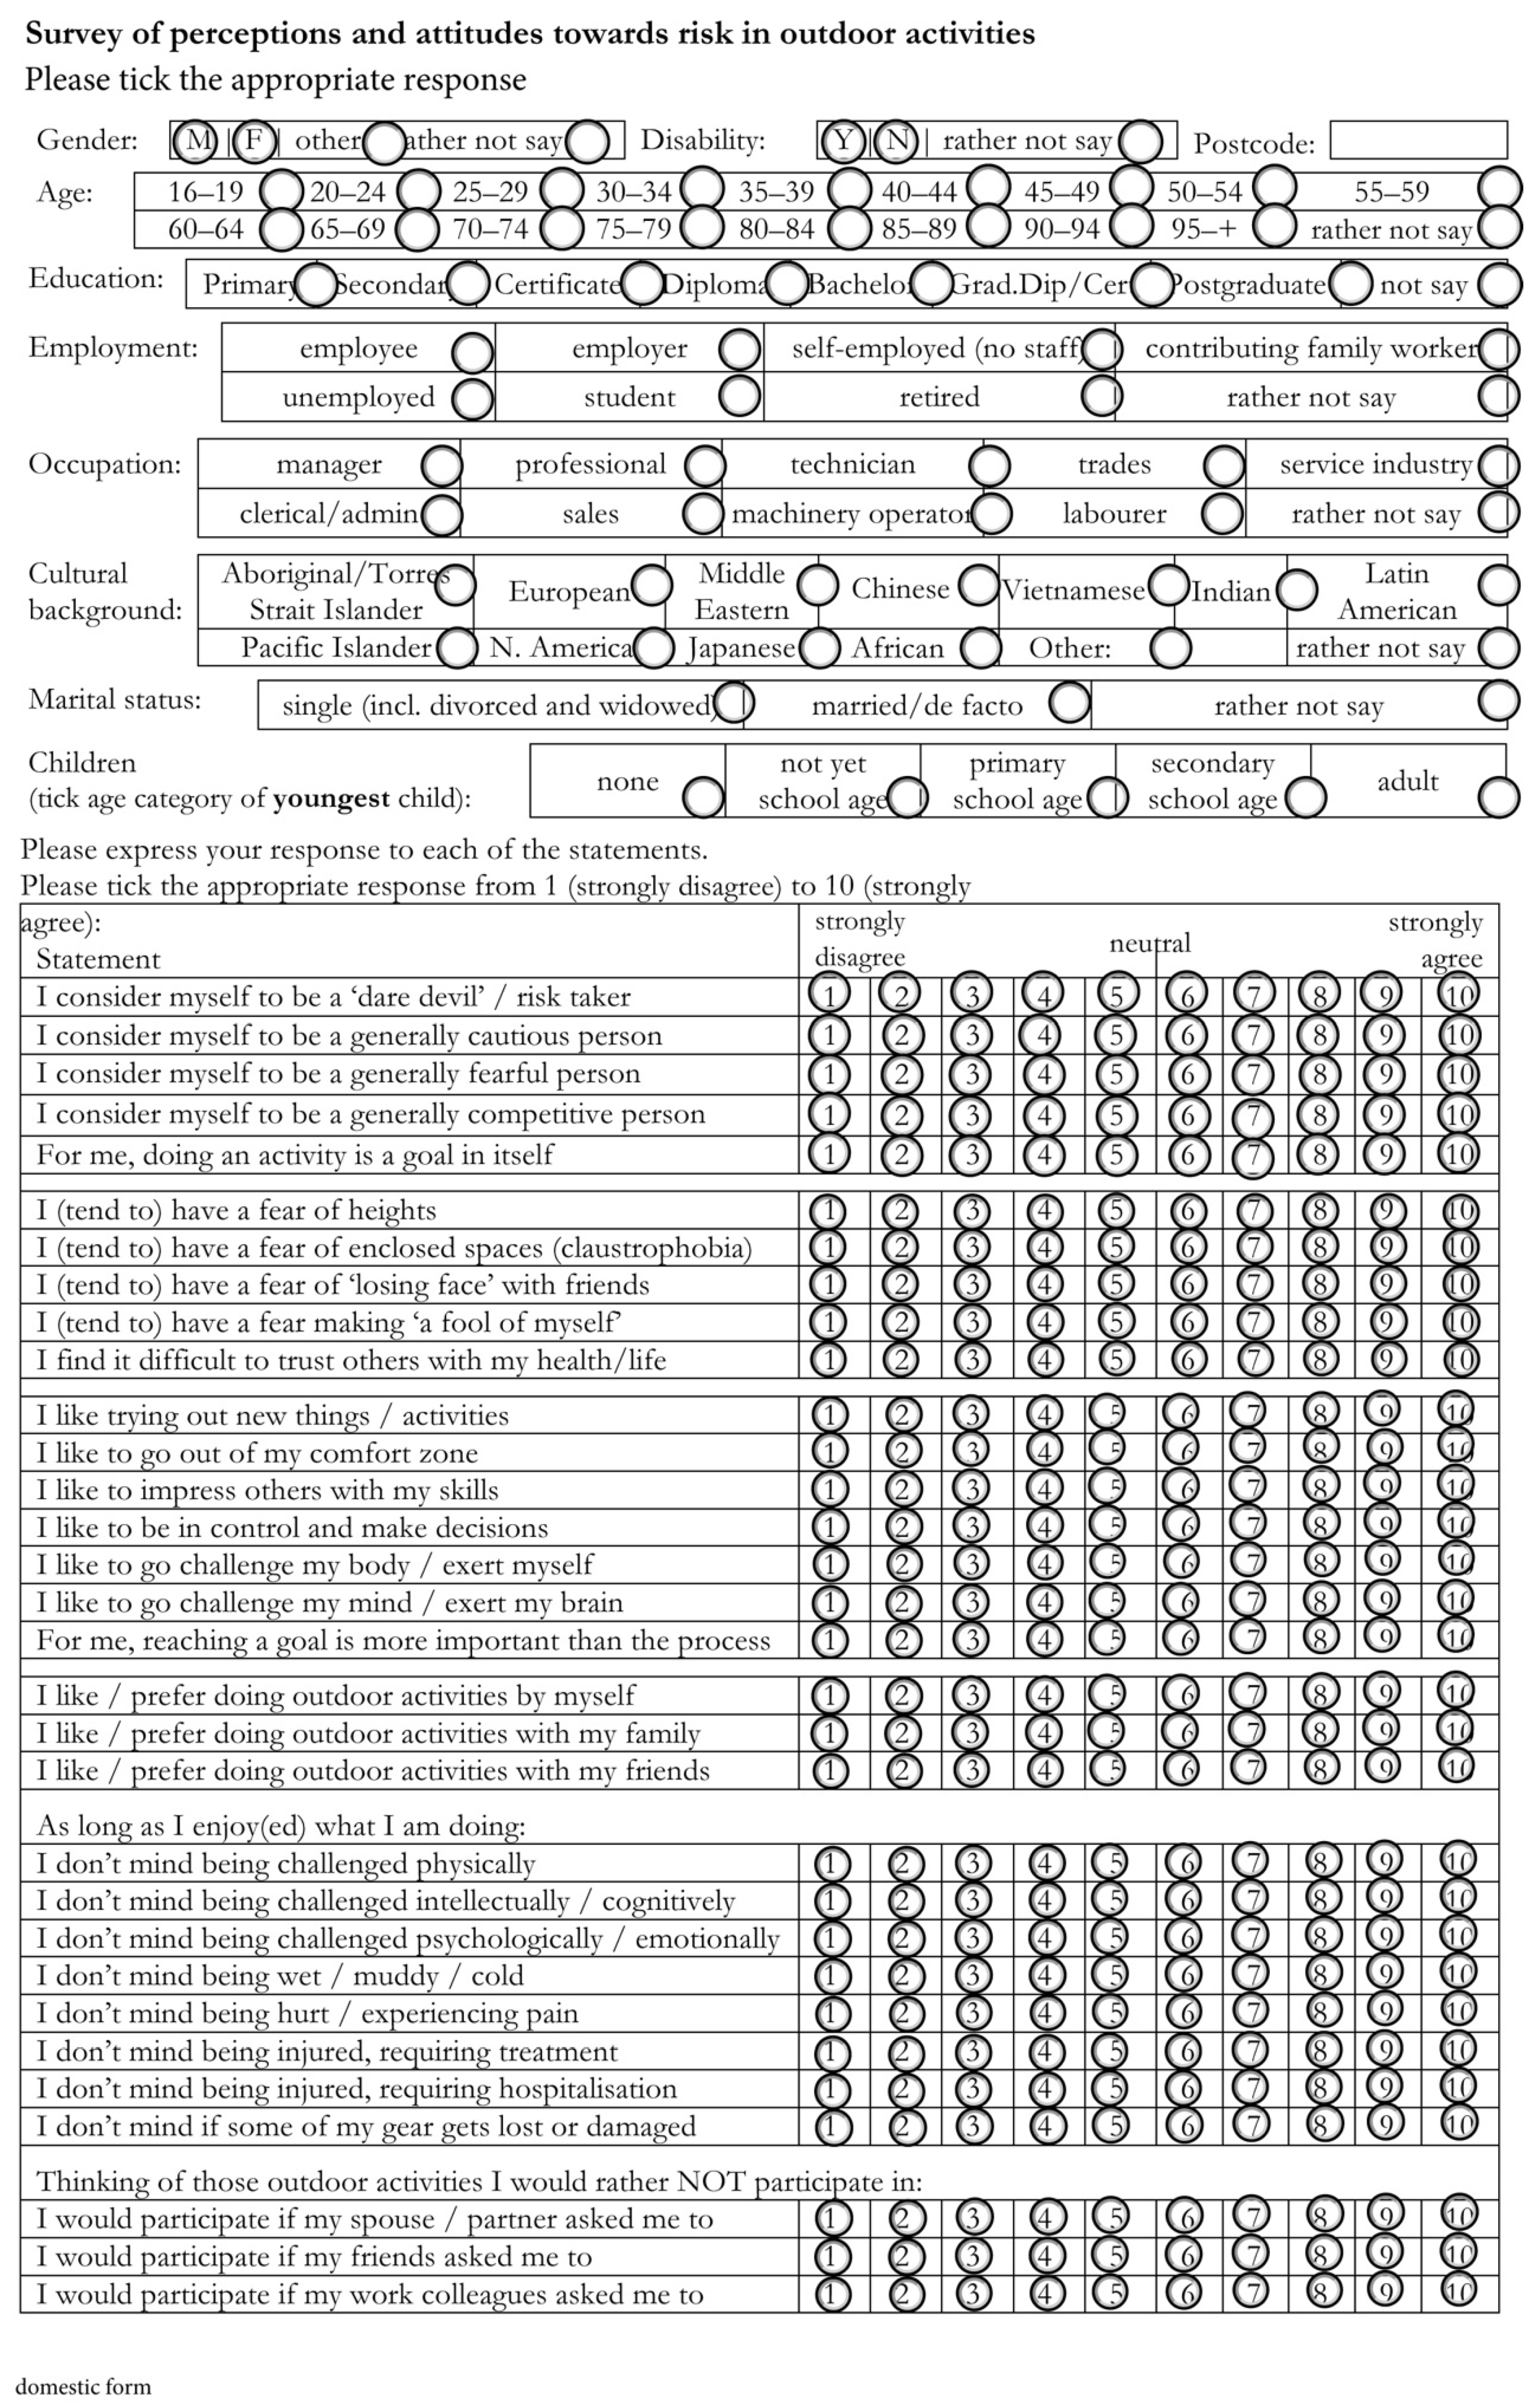
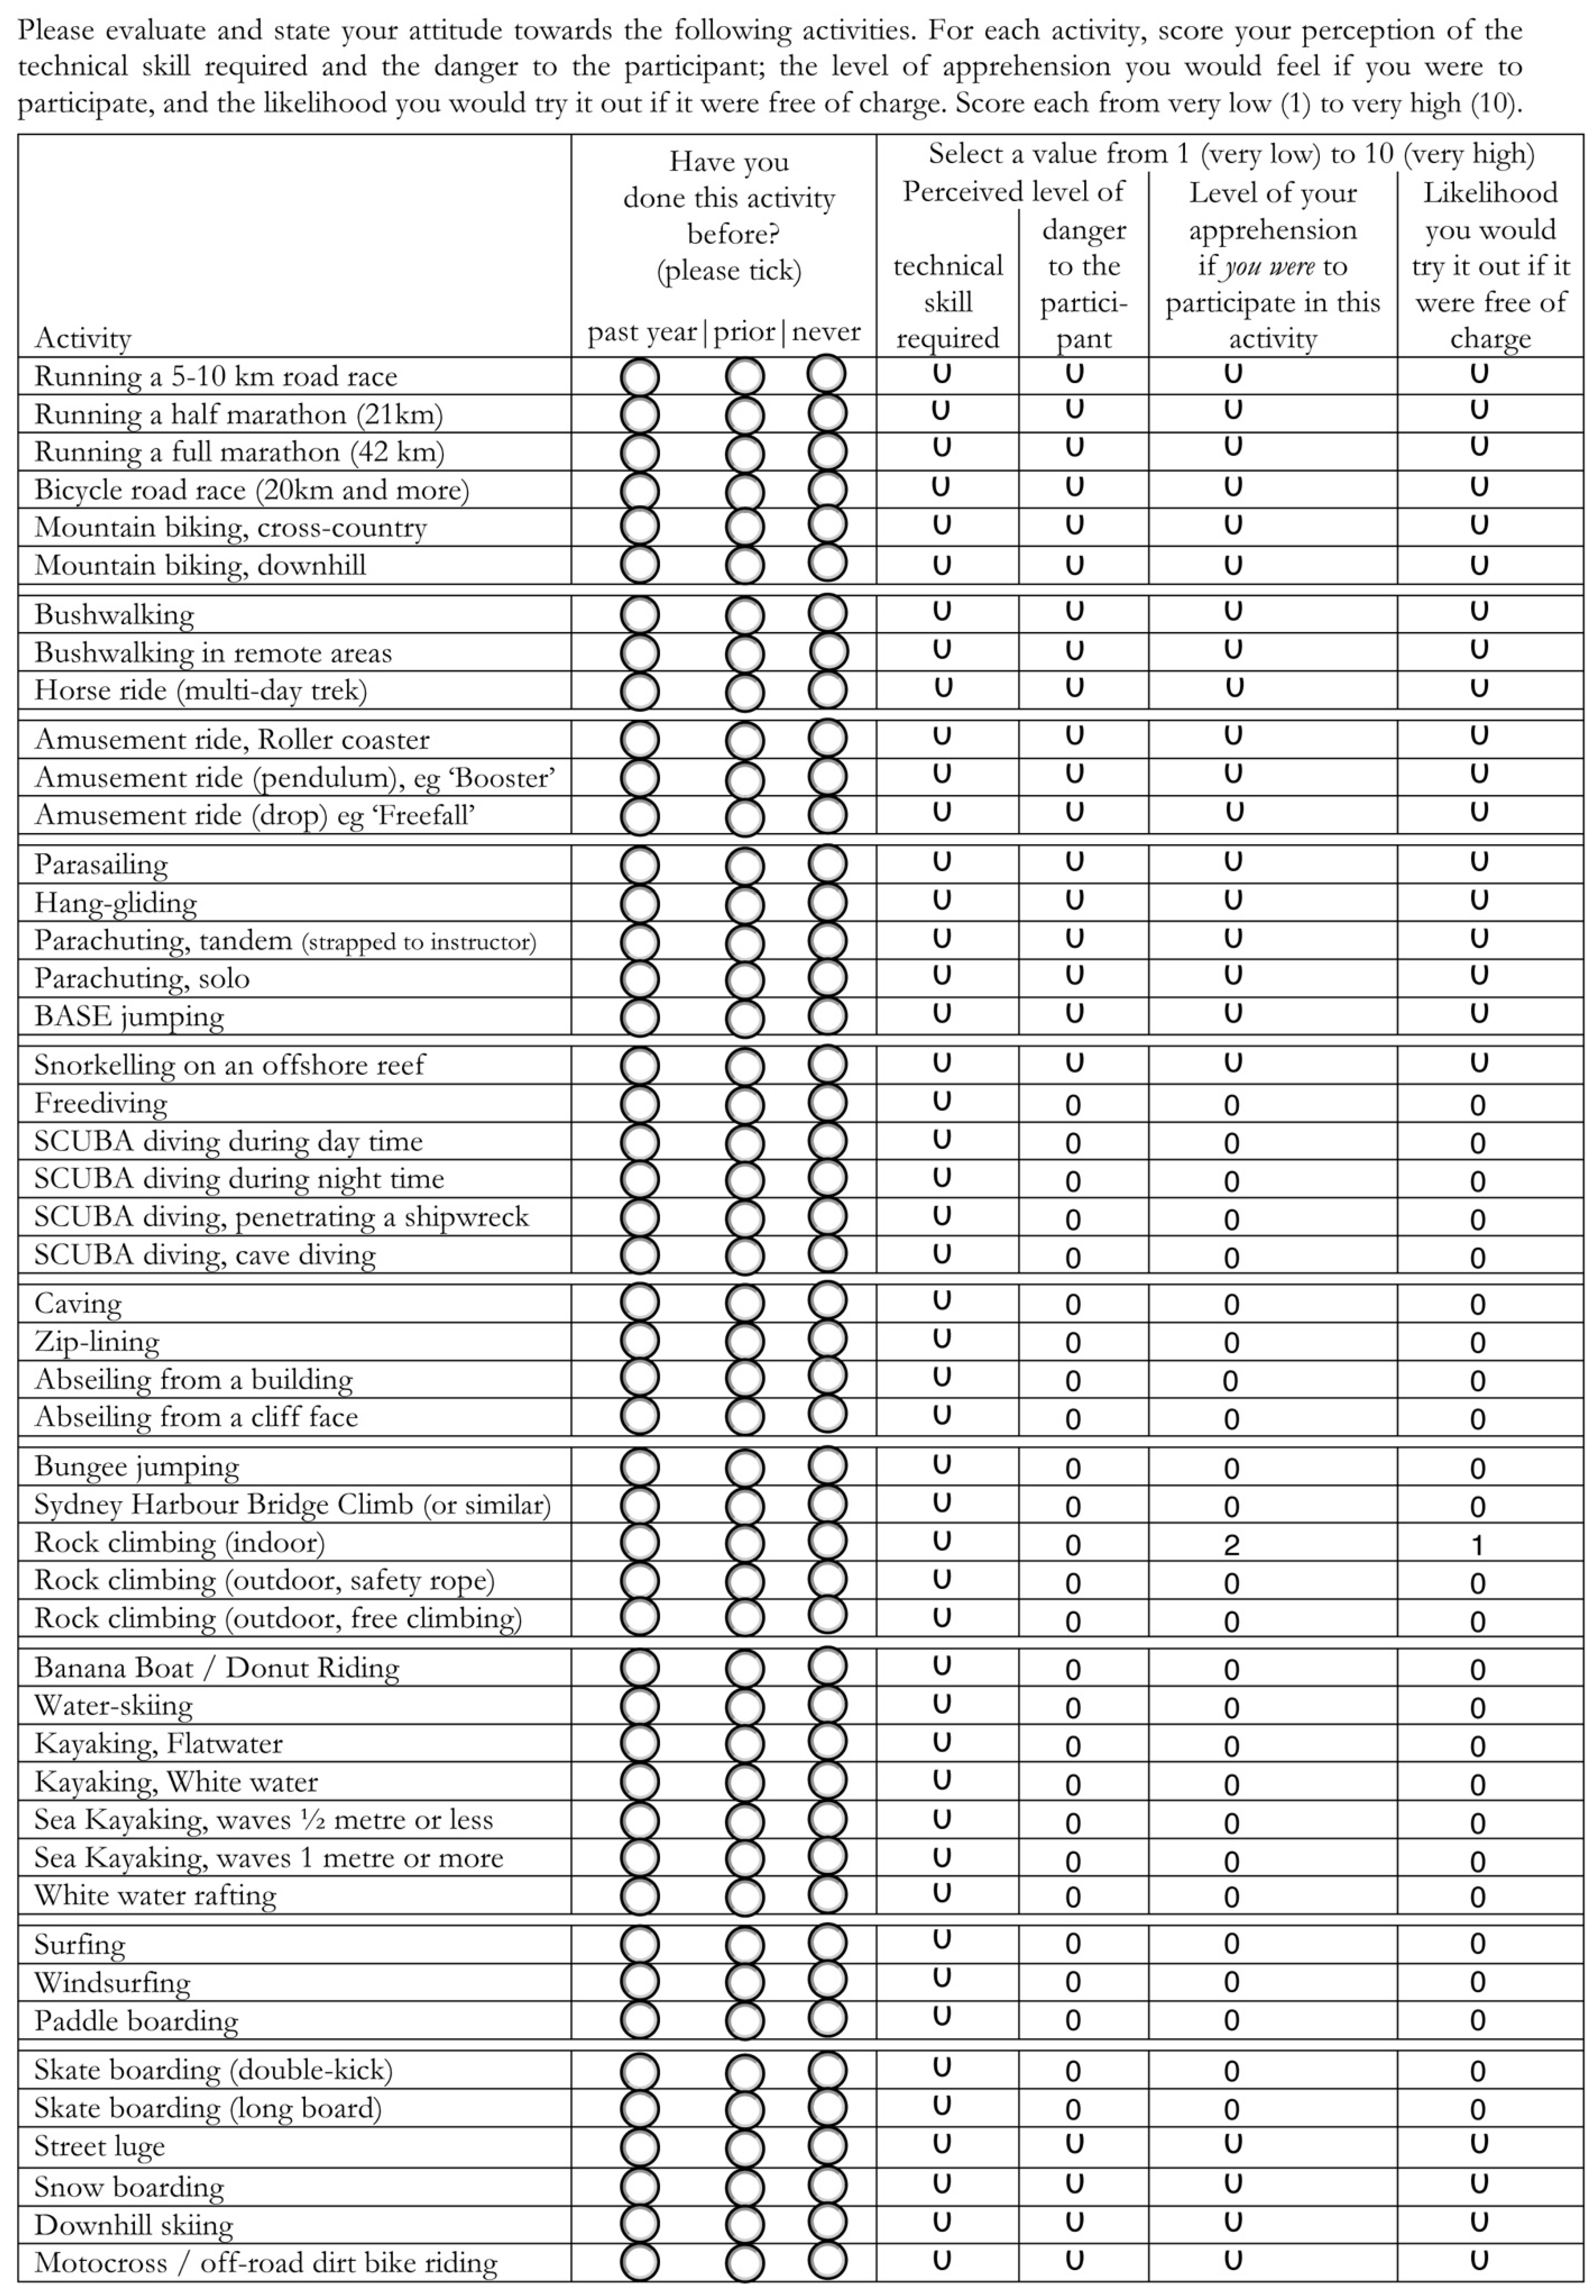
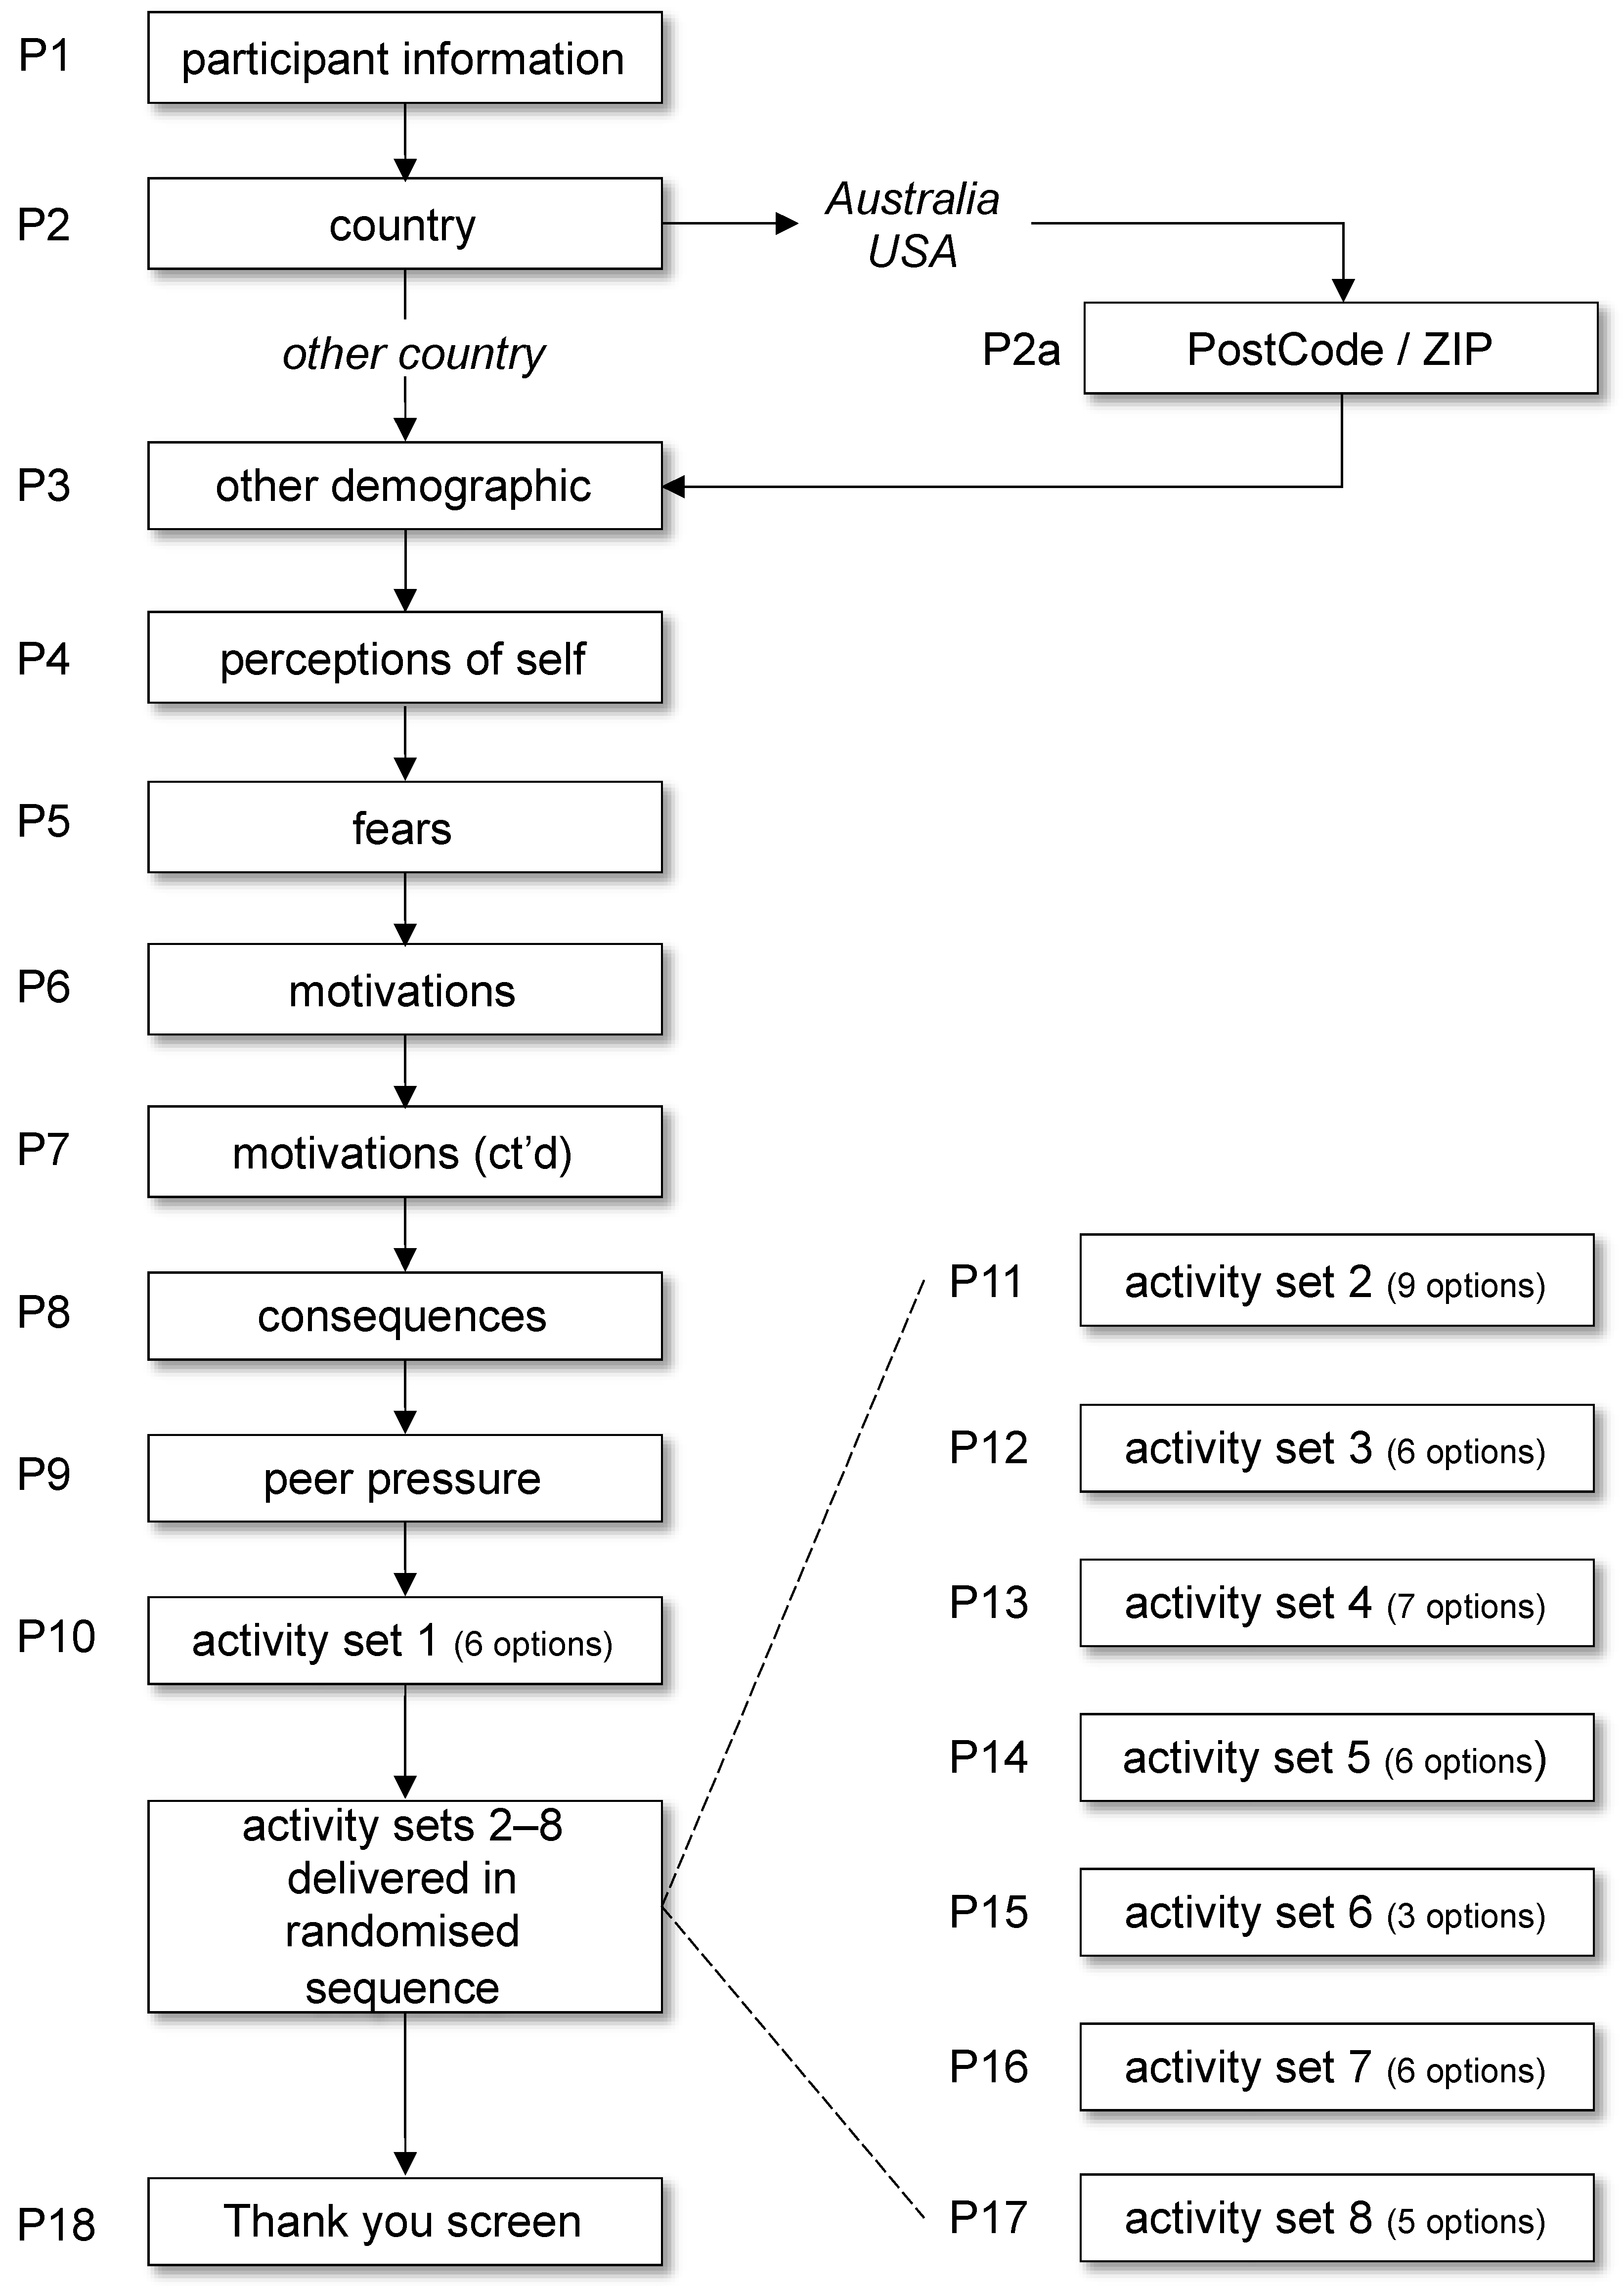
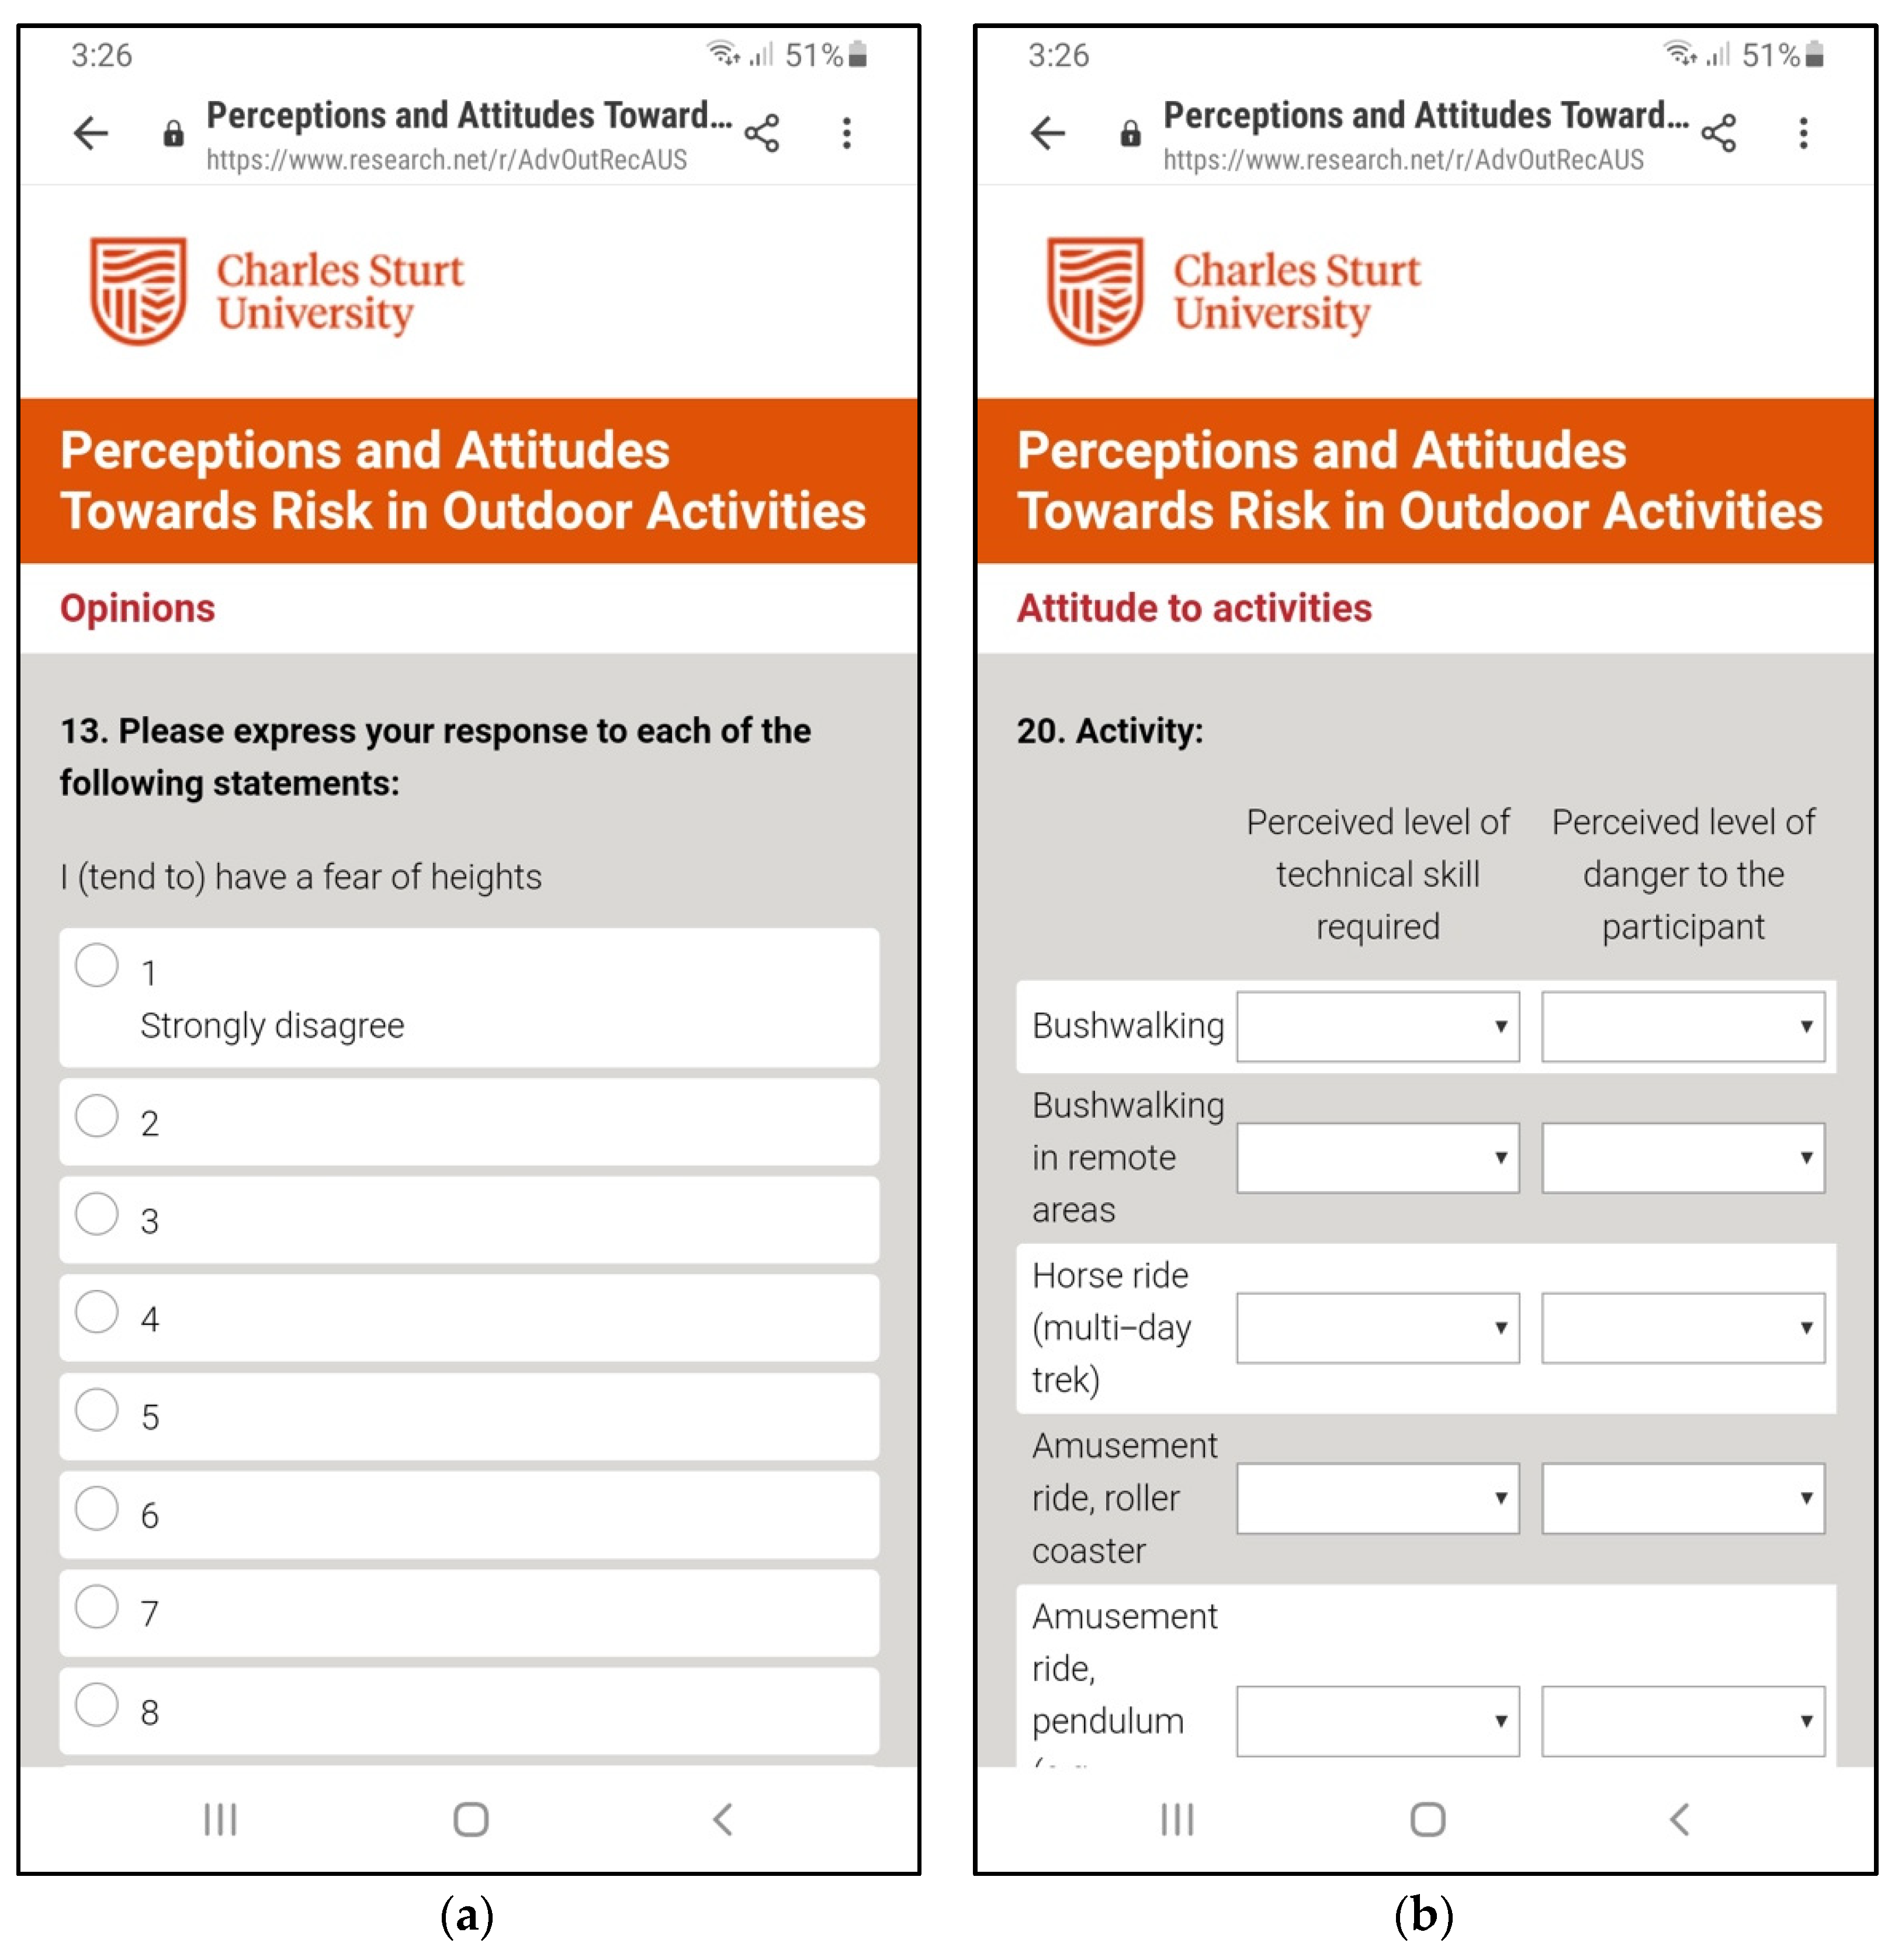
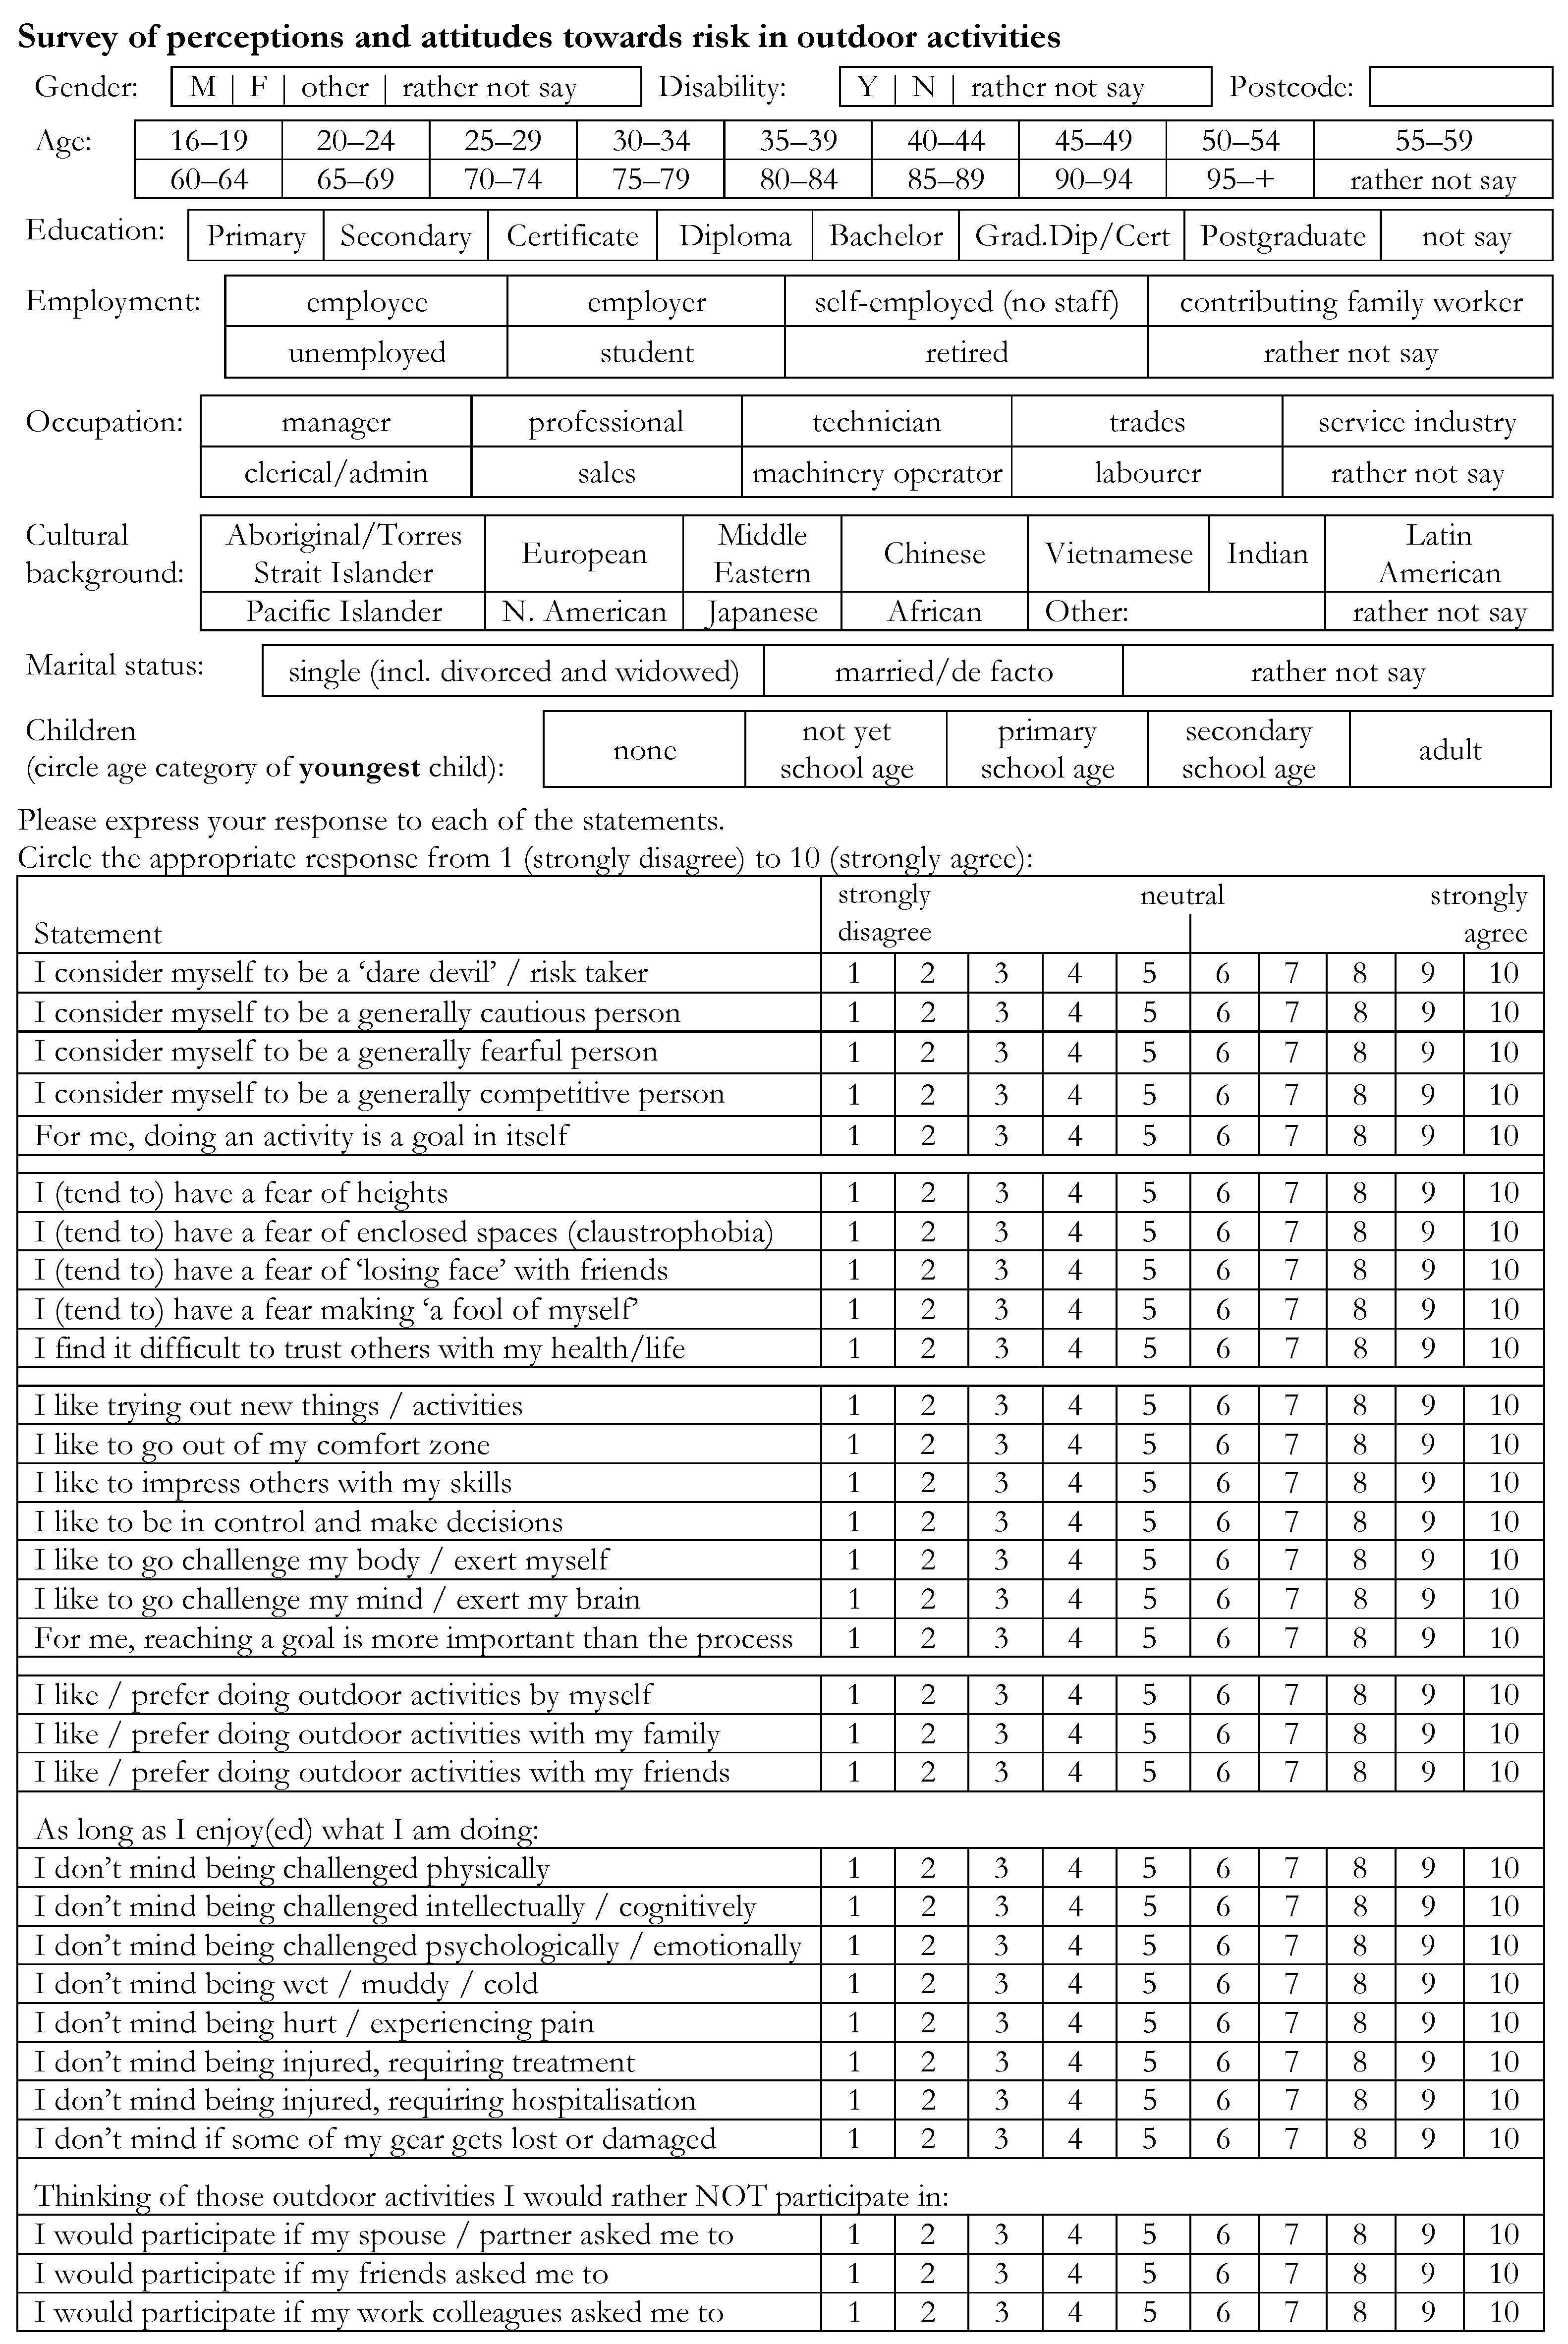
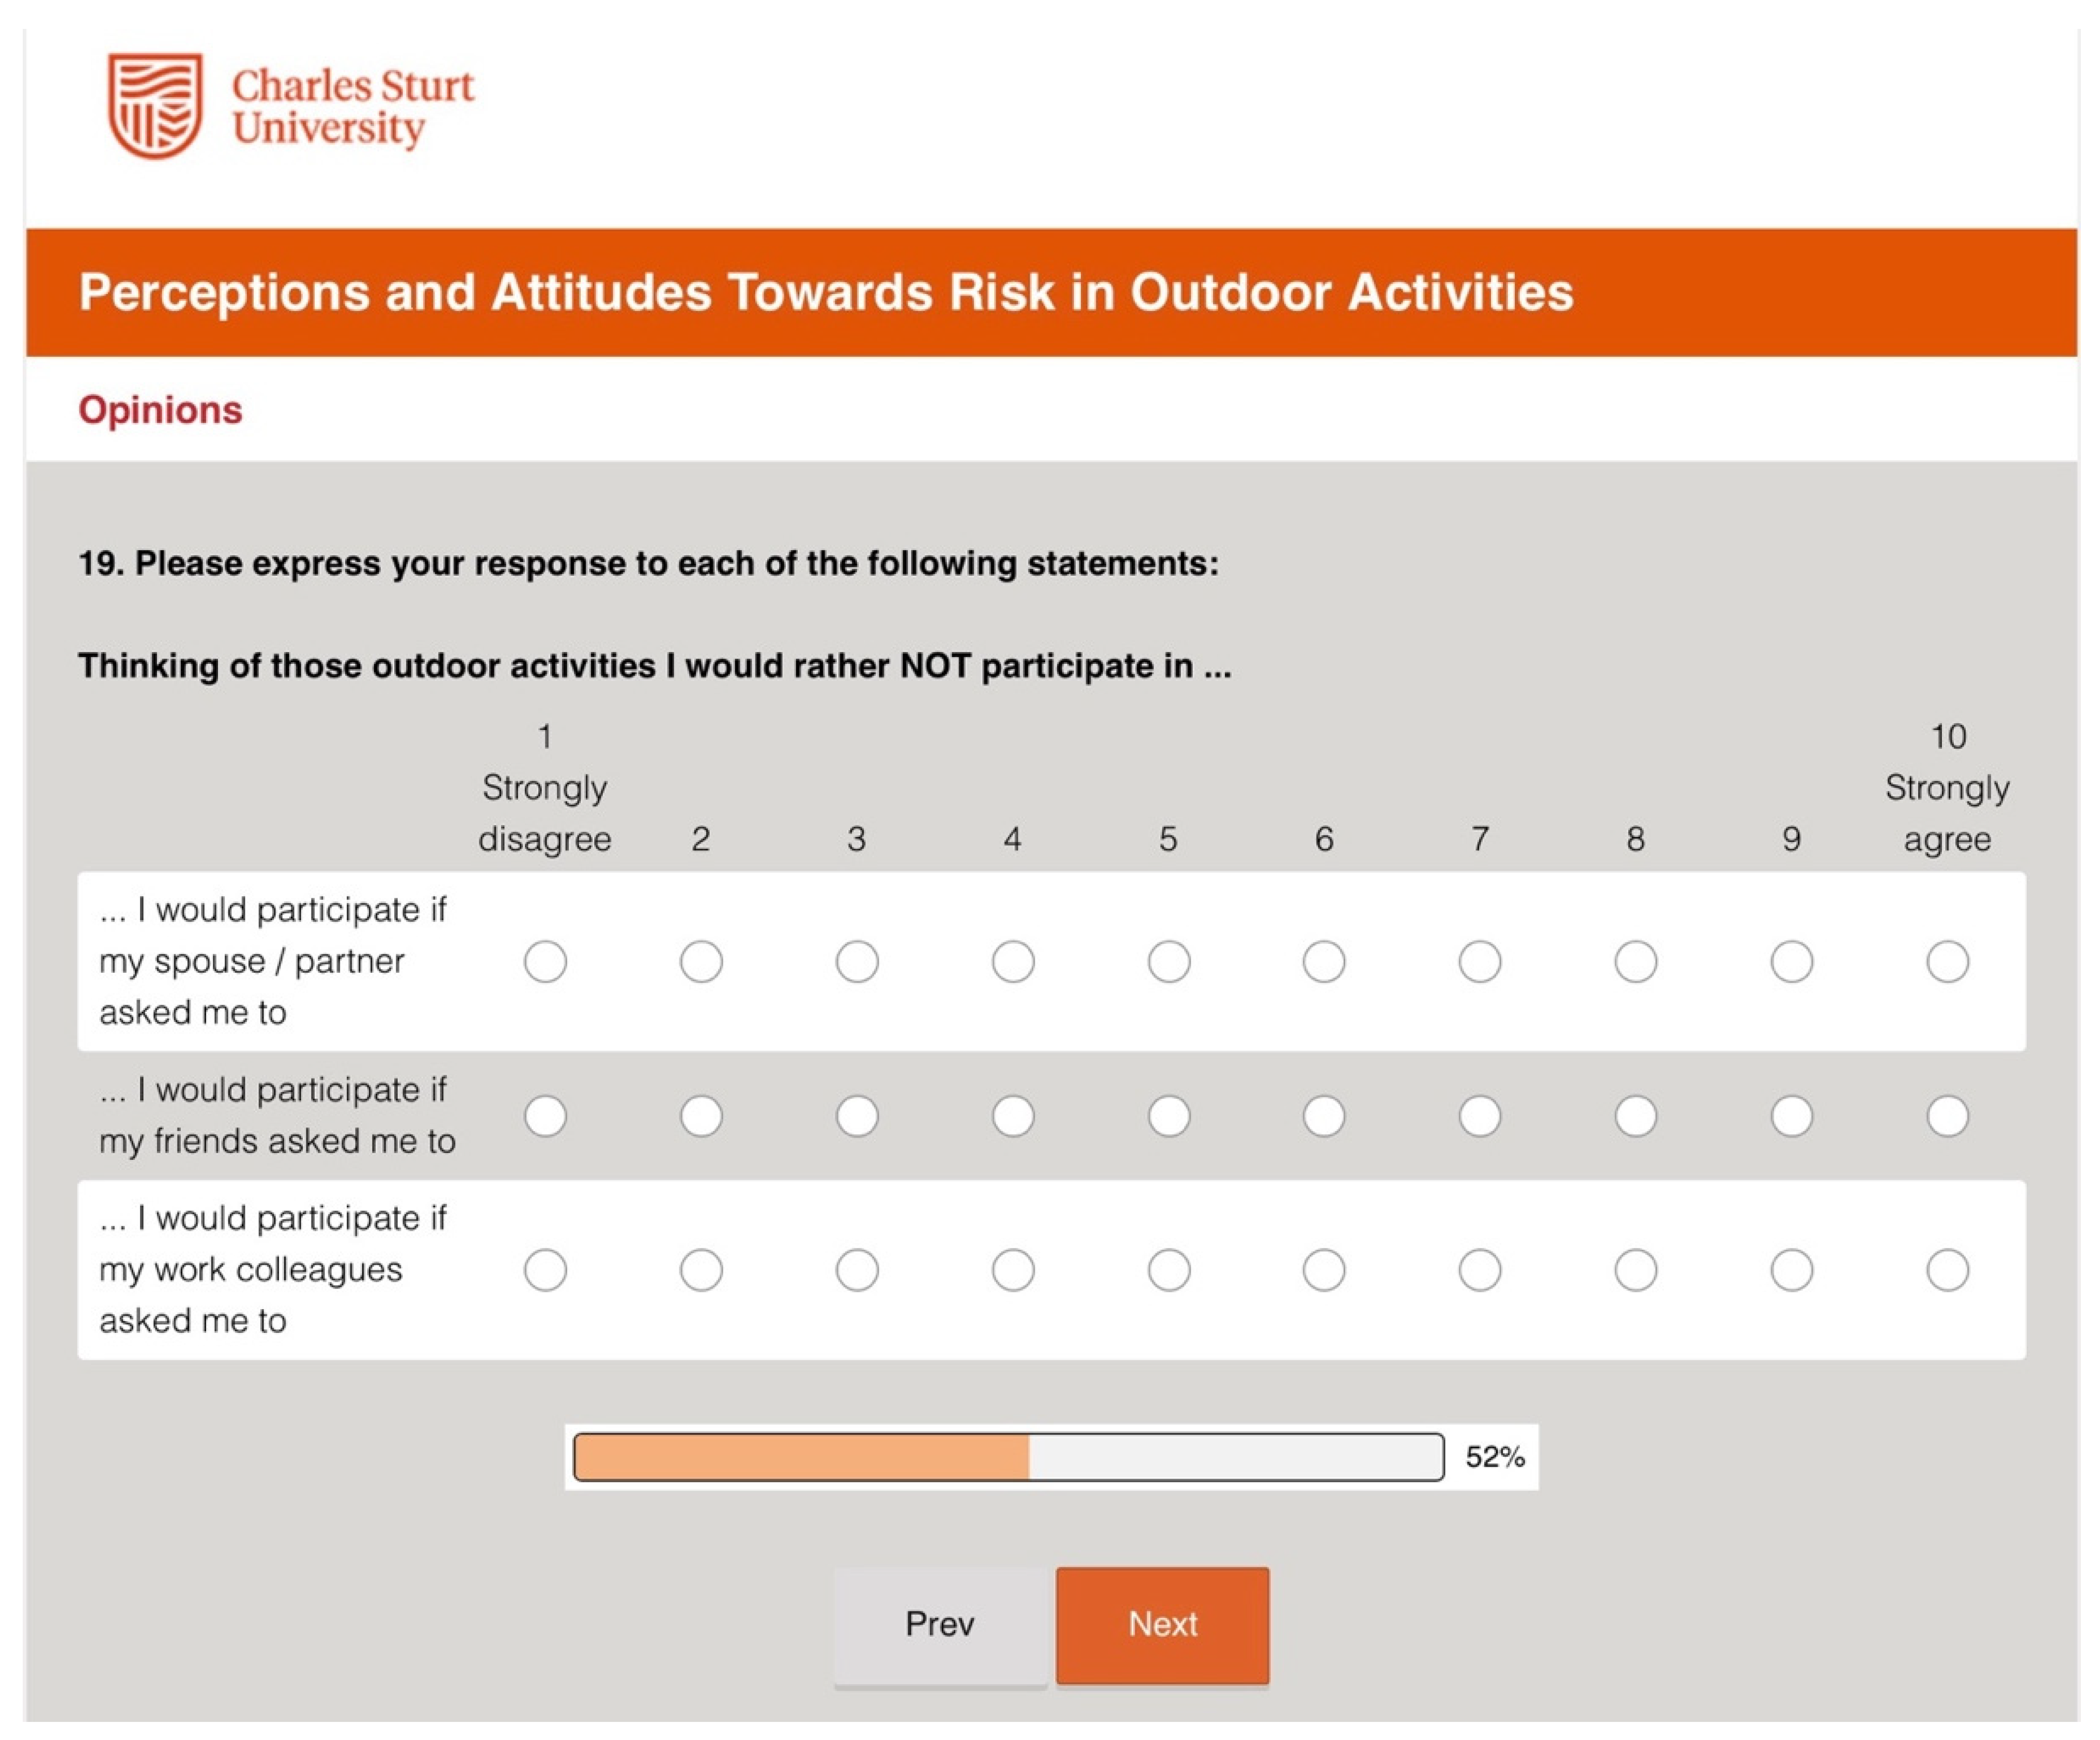
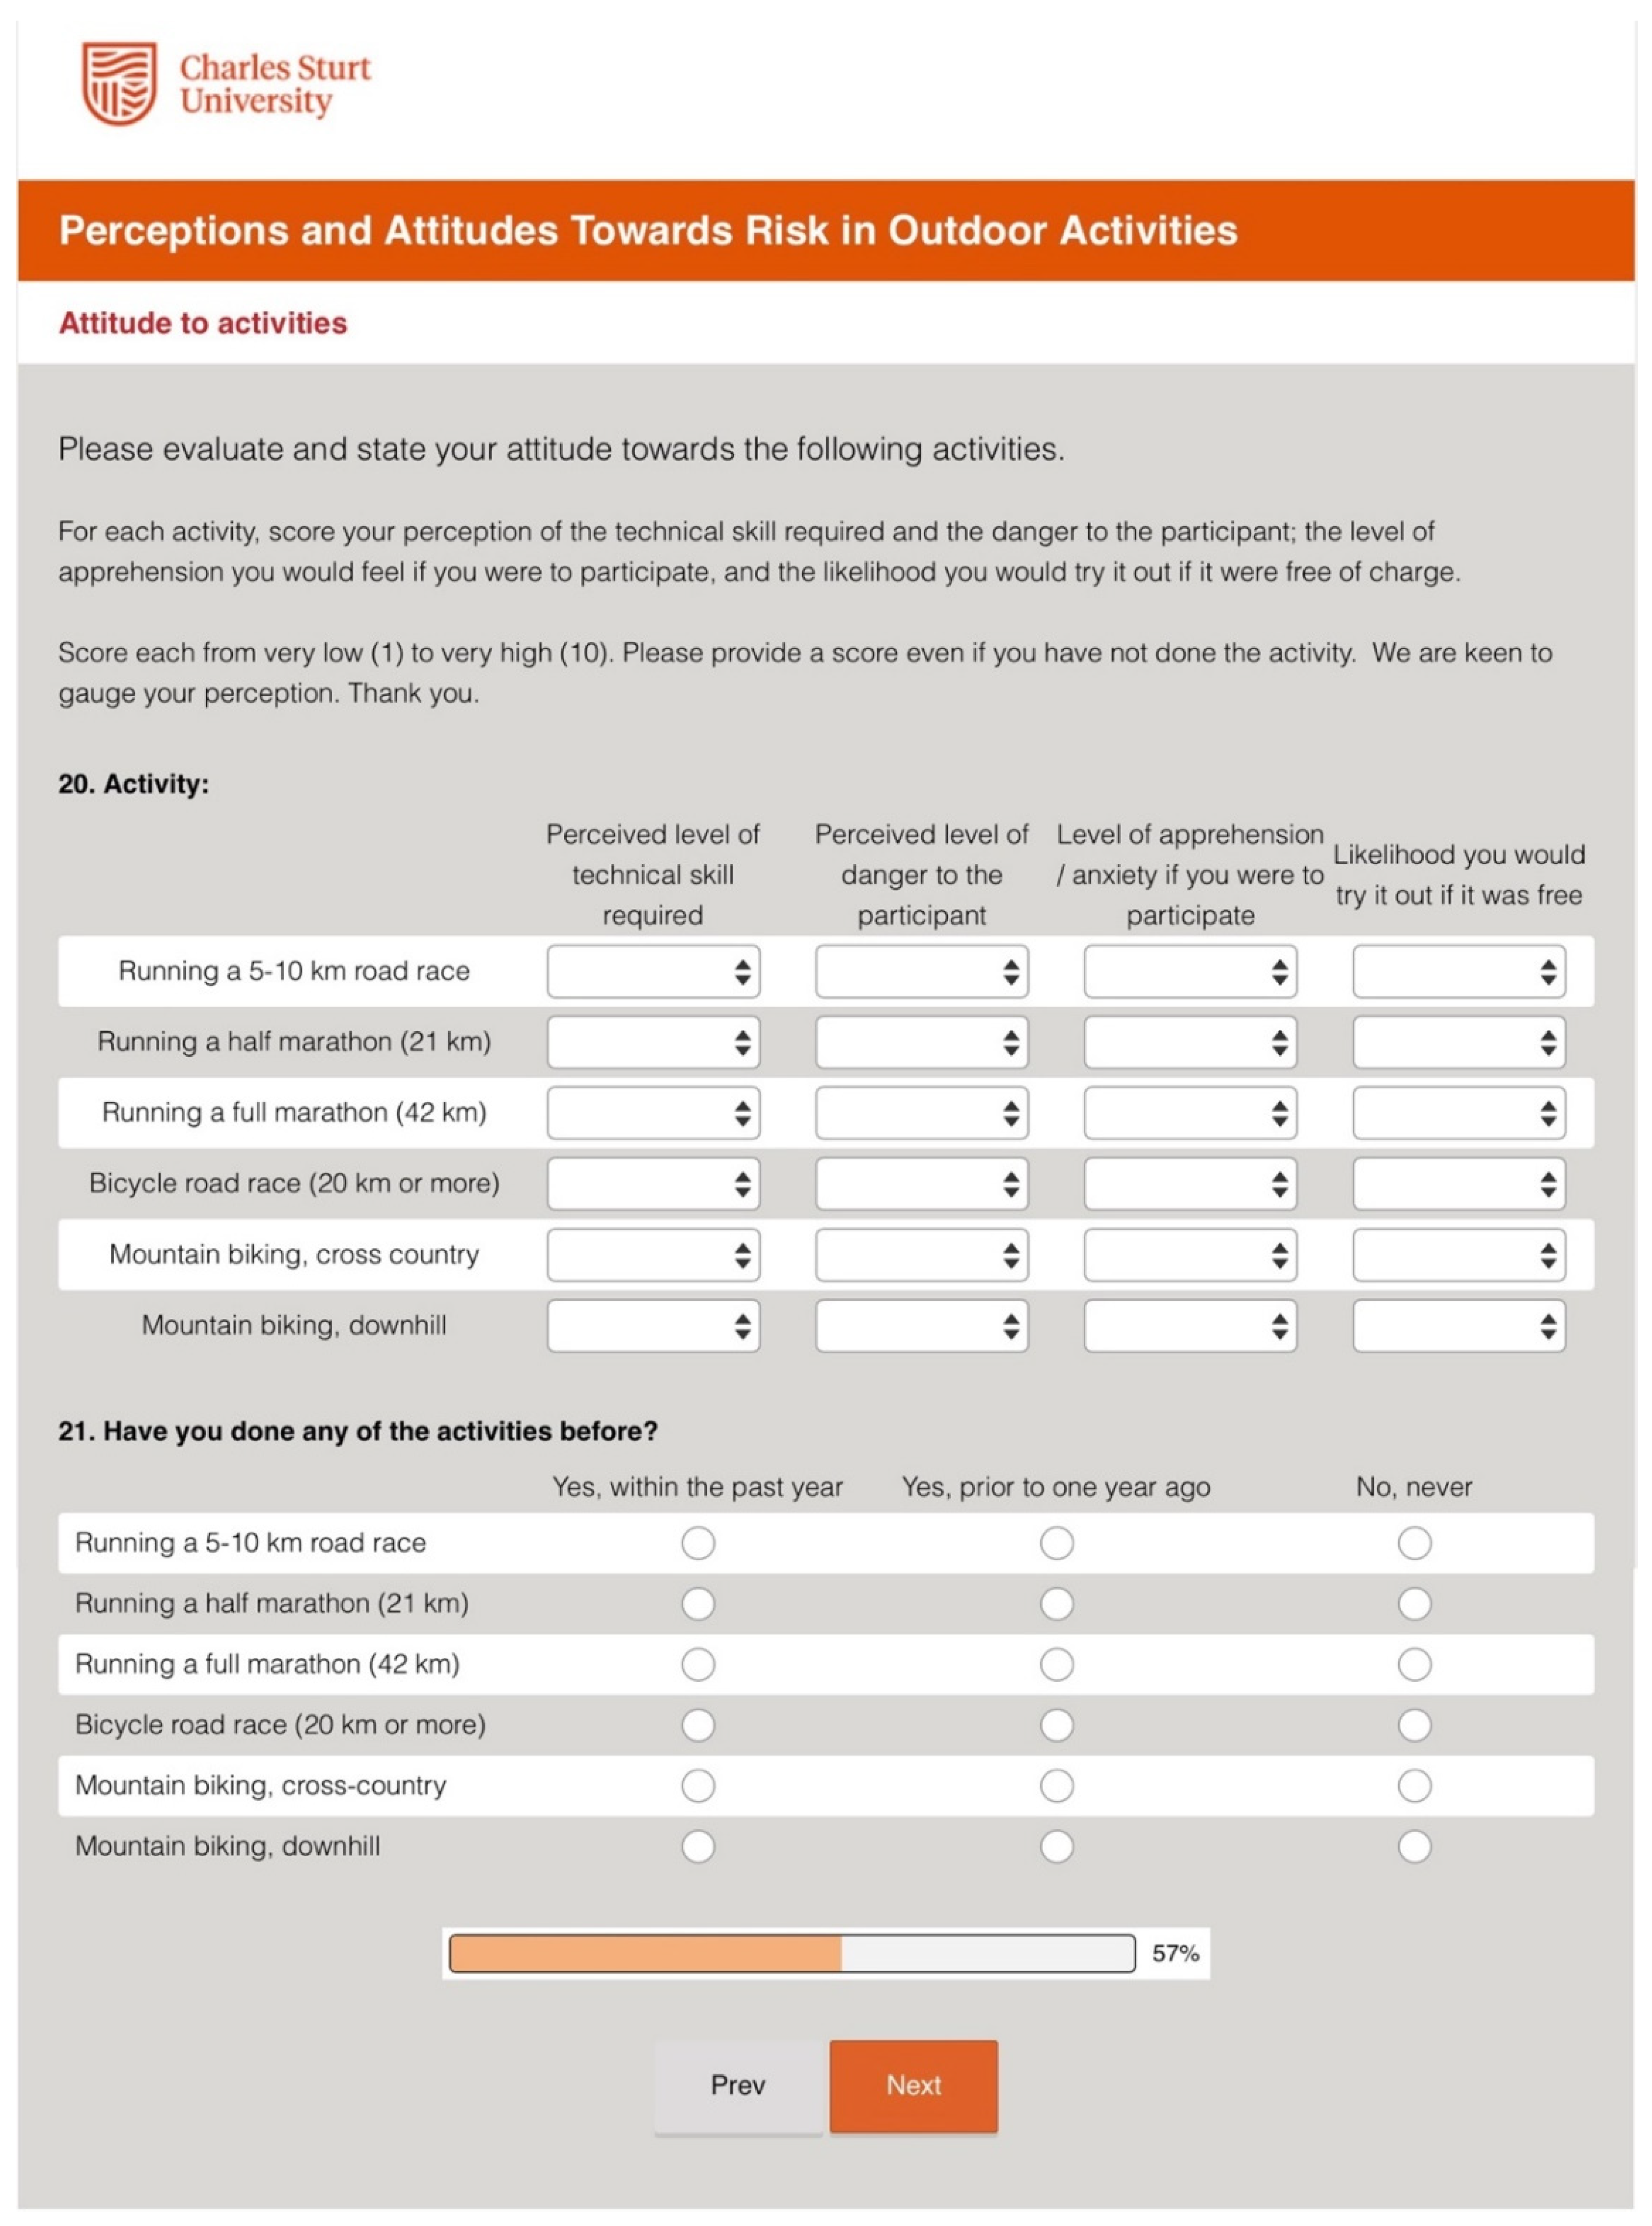
2.2. The Survey Instrument

The survey instrument, containing the same questions, exists in three versions. A two-page paper survey (Appendix A), a PDF version of the paper survey that could be disseminated and completed electronically (Appendix B), and a multi-page online version disseminated via the Survey Monkey platform.
The survey instrument comprises three sections: (1) demographics; (2) general attitudes towards risk and social determinants of risk-taking; and (3) questions related to specific activities. In the paper/PDF-based survey, Section (1) and Section (2) formed the front page, while Section (3) formed the obverse (see Appendix A). The participant information sheet was provided as a separate document.
On conversion for delivery via the online platform Survey Monkey, the survey instrument was broken up into a number of individual screens. In the online form, page 1 comprised participant information that had to be agreed to in order to progress. Section (1) (demographics) comprised two pages with a third conditional page collecting ZIP codes if the answer to Q1 (In which country do you live?) was either Australia or the U.S.A. This demographic section asked a total 11 (12) questions. Conditional on individuals stating a disability, an additional page was inserted, asking the nature of the disability. Subsequent Section (2) and Section (3) comprised eight pages each. Figure 1 shows the arrangement of the discreet pages as delivered by Survey Monkey.
To ensure that the survey was as similar as possible across the three modes of application (paper, PDF, SurveyMonkey), the responses in the online surveys to the responses were not forced, i.e., a respondent could choose to not answer a question but still be able to progress to the next page.
When filling out the paper-based survey, participants could estimate the required survey effort at any given time. The presence of a progress bar notwithstanding, the screen-by-screen online delivery caused fatigue among some respondents, leading to the abandonment of the survey partway through. As the progression from one question screen to another entailed the saving of the information that had been entered on that screen, partial responses could be captured even when a respondent abandoned the survey.
To ensure that all activity sets had an even chance of being assessed even if the survey was abandoned partway through, the pages of Section (3) were presented in a random sequence until all pages were exhausted. As Survey Monkey records the page order, it is possible to verify the randomization. The maximum deviation from the average number of responses for the randomly delivered P11 to P19 was 6.5% ± 3.5%.

2.3. Sampling Frames

The project used two different sampling frames, a semi-random sample of the general population (2019–2021) and a sample drawn from Reddit users (2021). None of the respondents were offered incentives or rewards. The participant population was restricted to persons aged 18 years of age or older. This was clearly spelled out in the information provided to prospective participants.

2.3.1. General Population
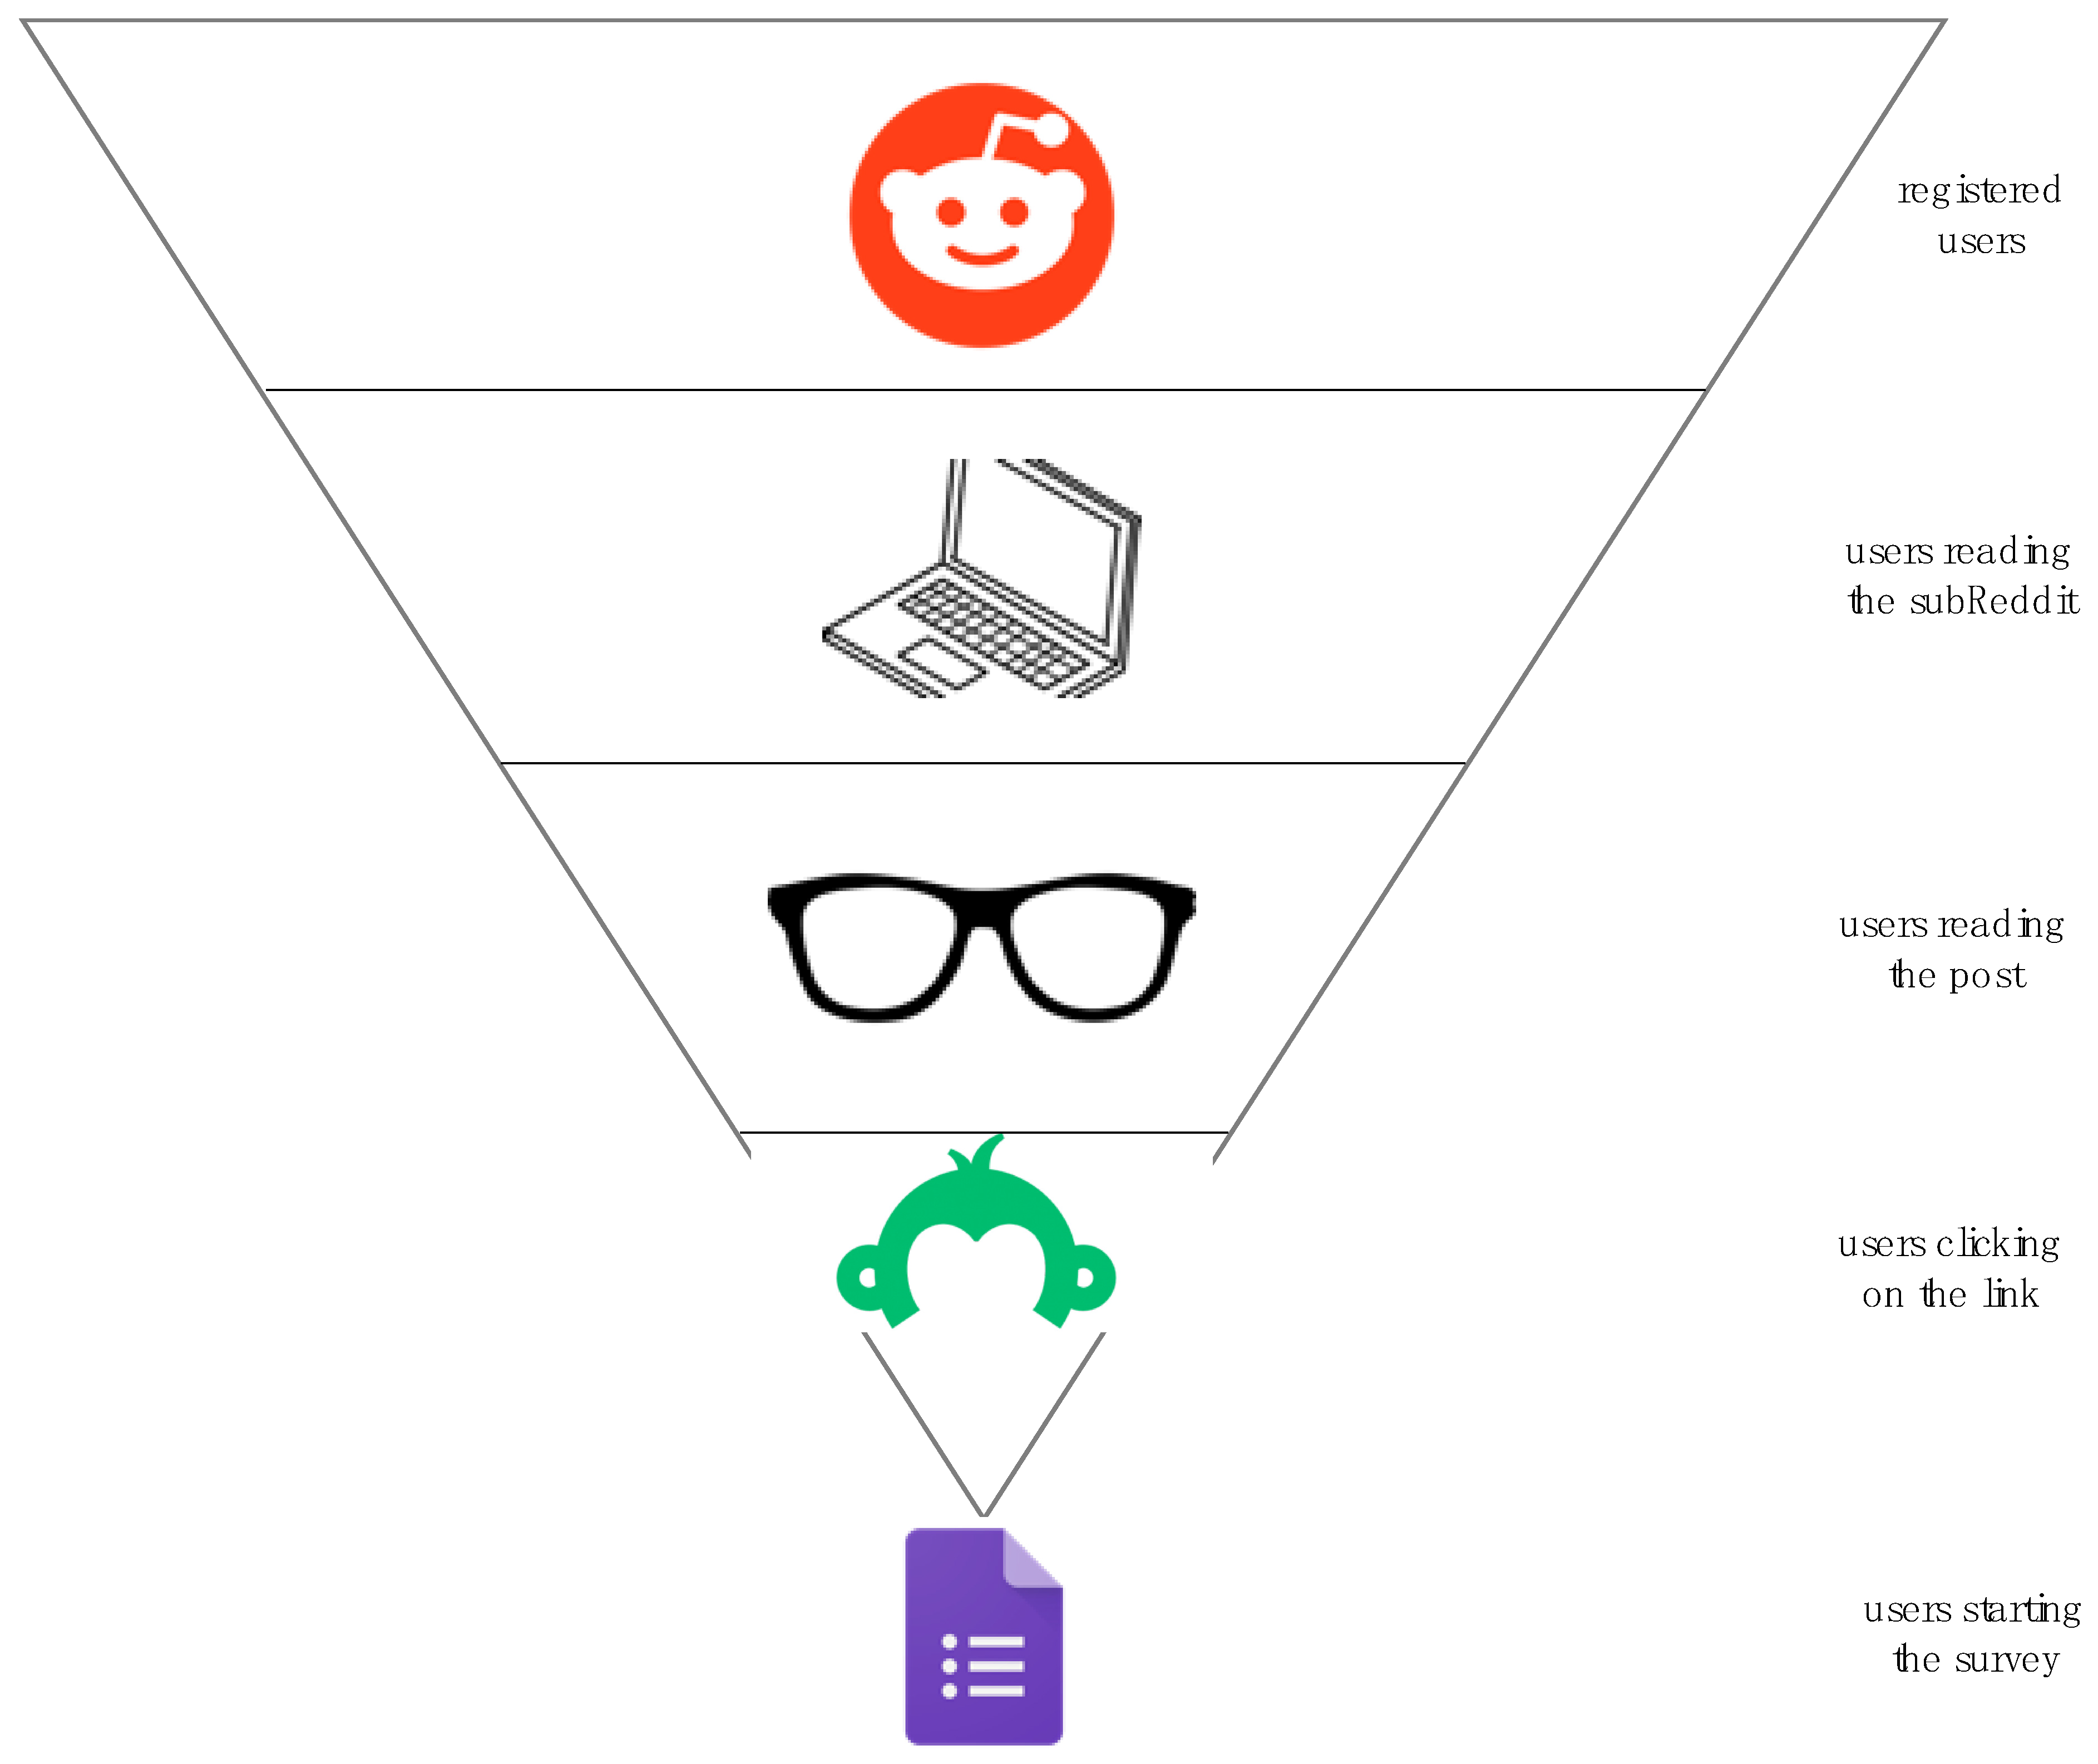
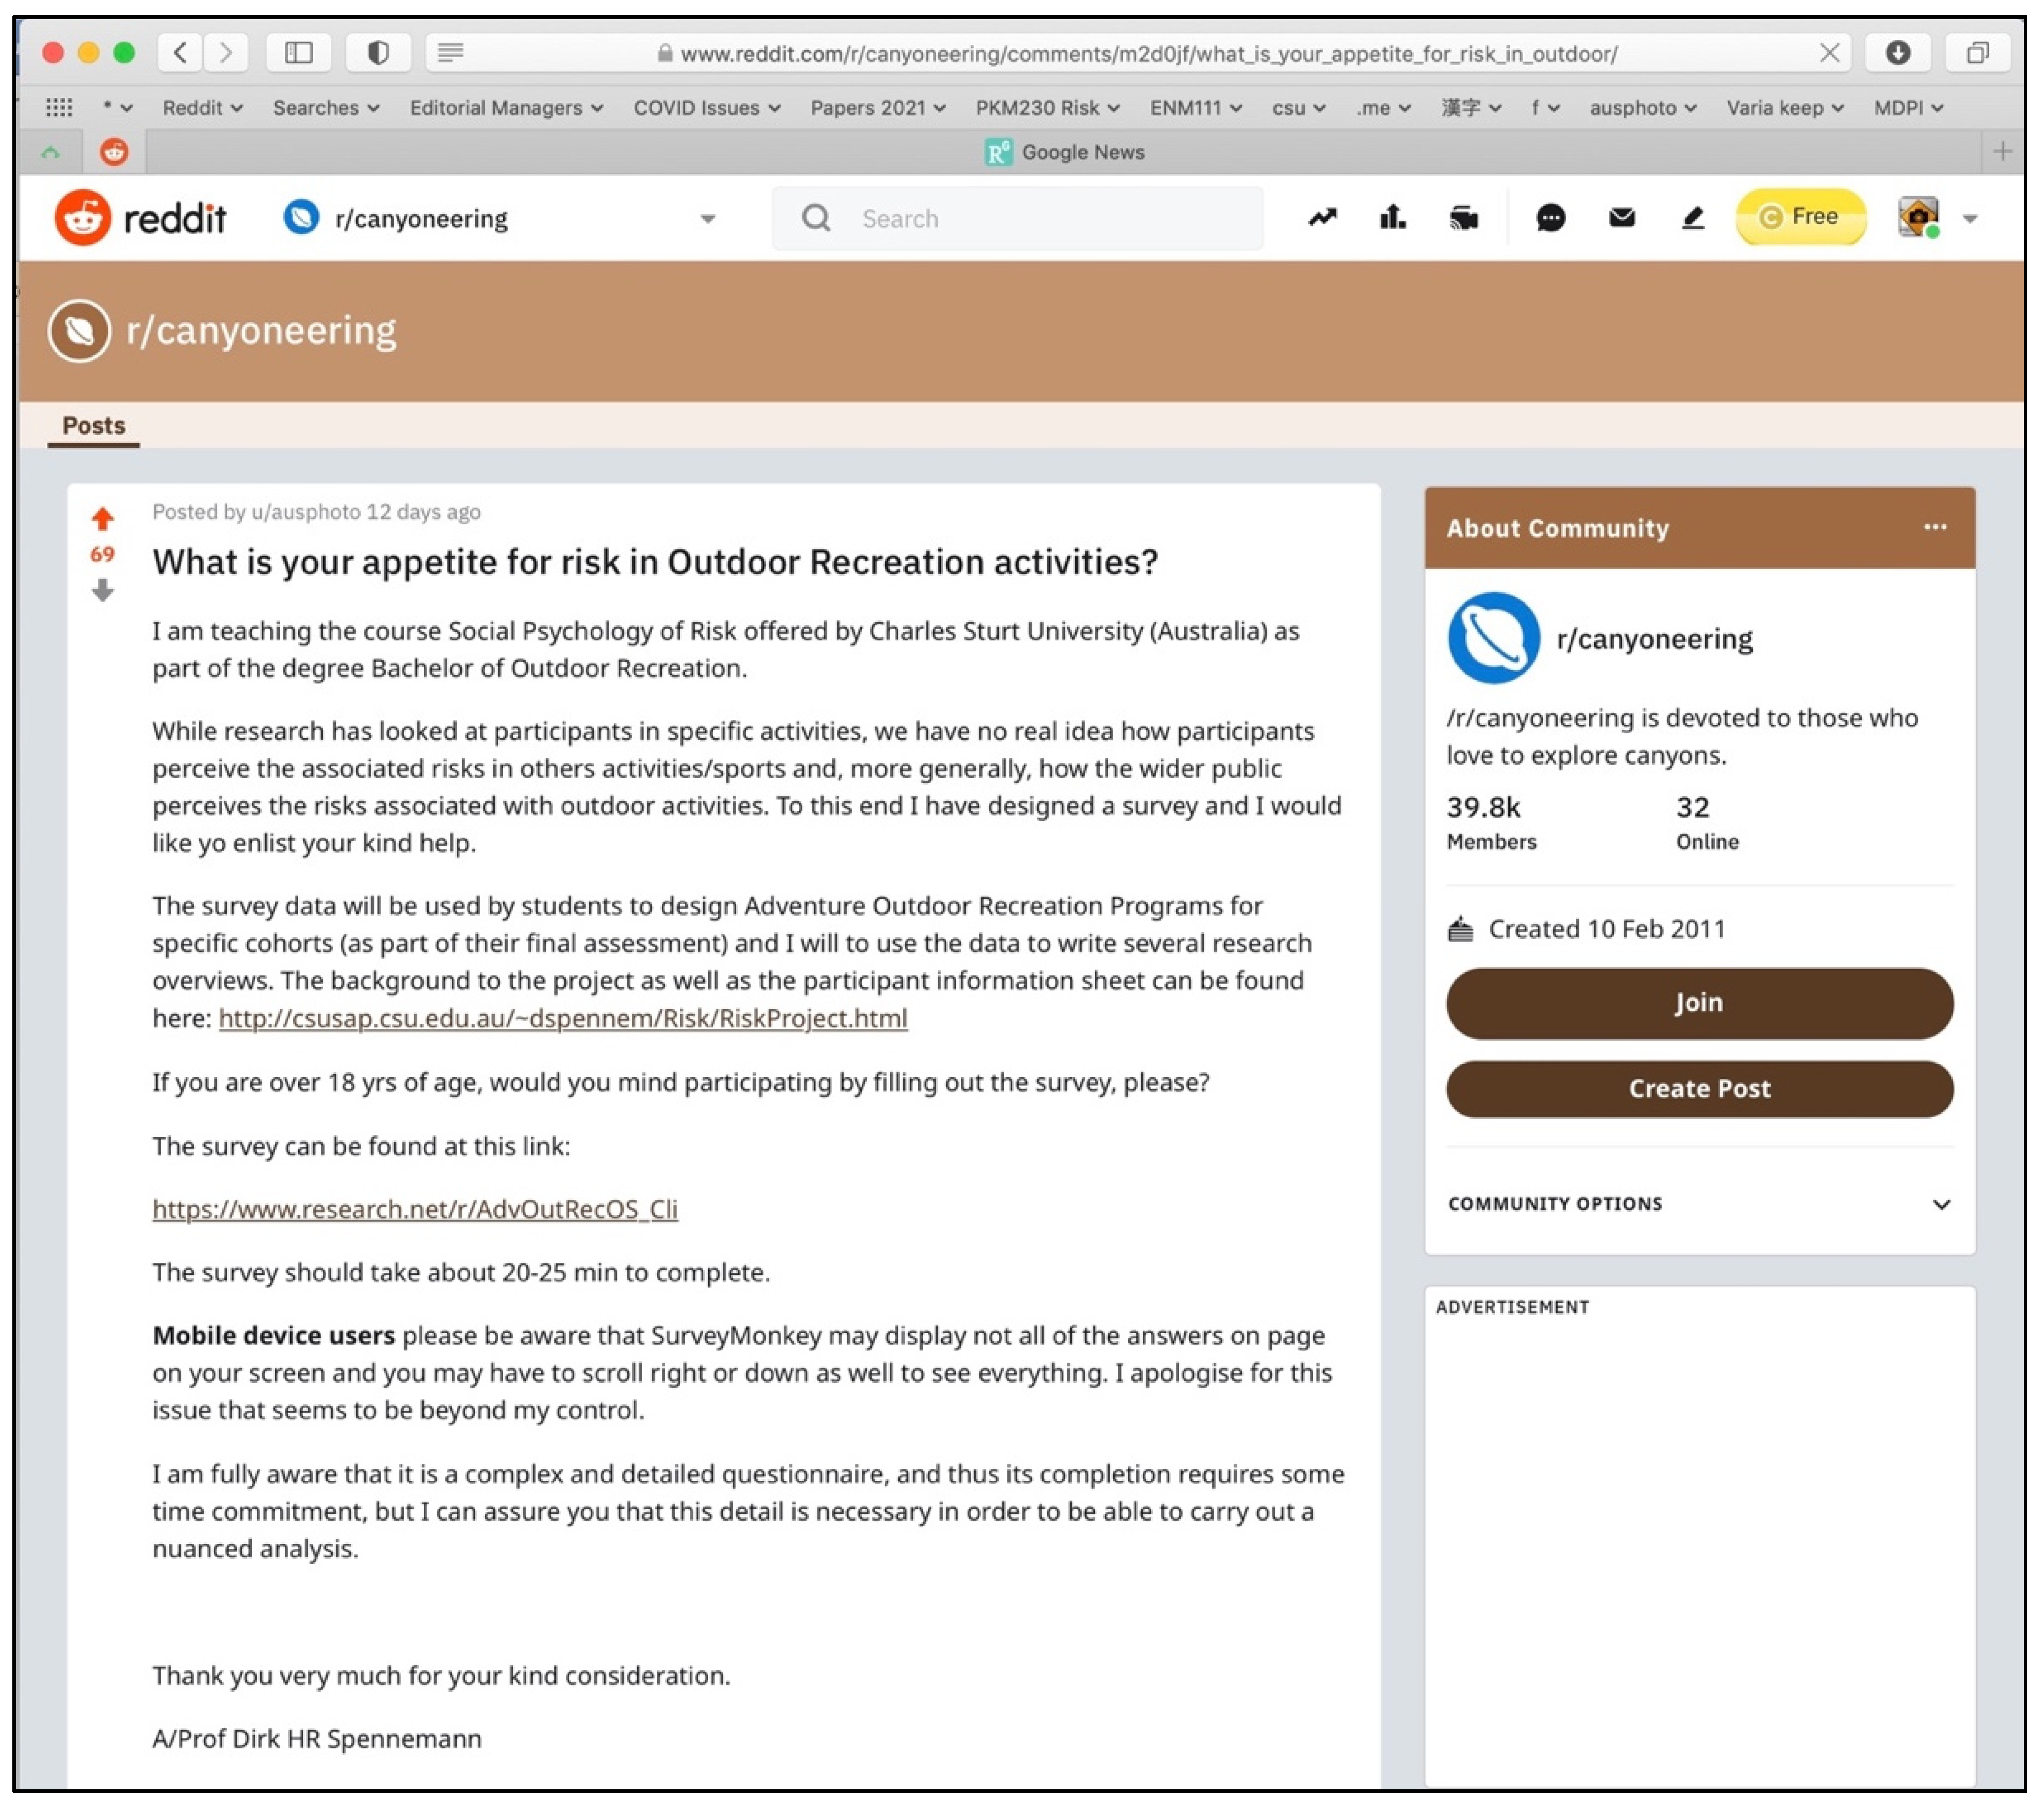
The survey was administered by students enrolled in the subject Social Psychology is Risk taught by the author. The subject forms part of the Bachelor of Applied Science (Outdoor Recreation and Ecotourism) offered by Charles Sturt University (Australia). This is a specialized degree offered in face-to-face and distance (online) mode of instruction, drawing participants from across Australia with a higher representation of southeast Australian states (Queensland, New South Wales, Victoria). The students were required to administer 15 copies through direct contact (digital or in-person) to their social circle of friends and family, for which they received course credit. While the course credit was applied to attracting 15 completed questionnaires, the students had no control over whether these surveys were fully completed or abandoned partway through. While each student carried out a purposive sample selection, the aggregate sample across all students enrolled in the subject generates a random sample of the population.
The survey was also administered by the author to the general public. This occurred through direct contact (digital or in-person) with his personal and national, and international professional networks with a separate response collector URLs for Australian and overseas cohorts. In addition, participants were recruited through snowballing, i.e., inviting contacts to send out invitations through their own networks. In addition, purposive sampling occurred by targeting underrepresented participant classes, such as people over 65, who were sampled at events through Rotary Clubs and retirement villages, or people with below-school-age children, who were sampled through placement of surveys in waiting areas of childcare centers and preschools. In addition, to obtain a larger cohort of a different cultural group, students of the University of Guam were also sampled using invitations disseminated through the university’s centralized mail system.
Several Reddit users engaged with the author in offline discussions about the project after the call for participation had been posted on the sub-Reddits (see below). These users were sent links to the overseas participant URL and invited to distribute this to their non-Reddit social networks.

2.3.2. Reddit

Reddit users were sampled to obtain cohorts of the general public, but also cohorts of participants who self-identified as having an interest in the general outdoors or in specific adventure recreation activities.
To adequately assess differences in the perception of risk in outdoor recreation activities, five conceptual sampling frames were chosen on Reddit. Two frames were specific to outdoor recreationists, i.e., adventure activity-specific sub-Reddits (e.g., canyoning, diving) and general outdoor activity sub-Reddits (e.g., outdoors, hiking). In addition, two general sampling frames were chosen to circumscribe the general population: mental general and research-related sub-Reddits (e.g., sample size, psychology) and country-specific sub-Reddits (e.g., Brazil, Pakistan). The latter was chosen as an attempt to address the heavy North American-centered imbalance in Reddit responses. The fifth sampling frames were health- and phobia-related sub-Reddits (e.g., depression, acrophobia). There is an increasing realization that participation in adventure has mental health benefits. Thus it was desirable to understand the perception of risk held by that cohort.
The online survey form was ‘cloned,’ with a series of cohort-specific URLs feeding into the same dataset as discrete collectors (Appendix C). The calls for participation were posted directly in the Reddit discussion forums (Figure 2) unless where sub-Reddit rules required that pre-approval for surveys had to be sought from moderators. For the sub-Reddits related to mental health, phobias and disabilities, prior moderator approval was sought as a matter of principle, irrespective of stated rules. While this approval was not always granted, some moderators promoted the survey on their sub-Reddits by ‘pinning’ the thread to the top of the page for a set time.
The survey was progressively posted between 11 March and 19 April 2021. Attempts were made to post early Saturday morning U.S. east coast time to ensure that the posts would be read over the weekend. A reminder was sent out (as a repost) one week after original posting, except in instances where the overall volume of posts was low, and the original post was still within the ten most recent posts. A second reminder was sent one week after the first reminder for all but the forums that were posted after 5 April. The data collection was concluded on 28 April 2021.
Critical for a comprehensive design are regular reminders (Fan and Yan 2010). Dillman et al. advocate two, if not three, reminders (Dillman et al. 2009). Posting reminders, as reposts of the survey on Reddit, tended to incur the wrath of forum participants who considered any repeat posting as spamming, even though formal reference was made that this was standard survey methodology. Resistance by Reddit forum members (and some moderators) emerged after the first reminder and occasionally became vocal after the second reminder. If a pre-notification were to have been posted a few days prior to the survey, that too would have attracted to ire of vocal participants, which in turn would have affected the willingness to participate.
To increase the perception of credibility of the survey, the researcher did not merely post the survey of the forum, but engaged regularly and timely, responding to any discussion comments that were posted in the discussion thread, as well as, where required or appropriate, offline with specific users who had commented. As noted, several Reddit users engaged with the author in offline discussions about the project after the call for participation had been posted on the sub-Reddits. As many users are participants in more than one sub-Reddit, they were invited to distribute a generic Reddit participation URL to their Reddit social networks beyond the specific sub-Reddit that generated the offline discussions.

2.4. Data Cleaning and Statistical Analysis

The data used for this paper are a subset of the full data set provided by the SurveyMonkey data collectors.

2.4.1. Data Cleaning

For the purposes of this paper, the full dataset was imported to MS Excel and reduced from a total of 294 columns to 32 columns by retaining the survey administrative (collector, timestamps) and demographic data and by replacing the answer columns with a set of columns whether the respondents had progressed to a given page.
The Survey Monkey platform provides timestamp data that give the time of the submission of the first page (in this case, the agreement with the participation information) and a timestamp for the last page submitted, which can be the final survey page or any page in between. This provides the opportunity of computing the time spent on the survey, which ranged from 8 s (respondent did not progress past the country demographic) to a maximum of two days, 13 h and 6 min (incomplete), which is clearly an unrealistic time. In total, 2.6% of the respondents took longer than 2 h to complete (or abandon) the survey, suggesting that they were interrupted or chose to set the survey aside and return to it later. In each case, the final timestamp represents an active submission of that page, irrespective of whether any questions were answered on that page, and not a mere closing of the browser window (confirmed by testing). As these extreme data points would distort the findings, all times longer than 2 h were excluded from analyses that included completion times.
Careless and/or mischievous responders are known factors that are more prevalent online than in paper-based surveys. (Robinson-Cimpian 2014; Ward et al. 2017) Cross-checking of responses, taking into account age, and free-form responses to country of origin, profession and cultural background identified some mischievous responses, which were removed from the data set.

2.4.2. Statistical Analysis

The correlation between the various participation attrition curves of different cohorts or survey methods was determined using the CORREL function in MSWord. Given that the PAR continually declines as the users progress from page to page, it is inevitable that the curves will always show some level of positive correlation. Thus, for the purposes of this paper, a very high level (***) of correlation was arbitrarily attributed to r ≥ 0.995, a high level (**) to r ≥ 0.985, and a moderate level (*) to r ≥ 0.95. A paired sample T-TEST was used to compare the PAR between different cohorts or survey methods.

2.5. Limitations

There are a number of limitations to the survey, both of a general and a Reddit-specific nature, which are placed on record here.

2.5.1. Data Quality

Since all data were self-reported, they are subject to a recall bias. While this does not affect the data collected in Section (1) (demographic) and Section (2) (general attitudes towards risk and social determinants of risk-taking), recall bias may affect responses to the activity-specific questions (Section (3)), in particular the rating of the risk posed by and apprehension of s participant in activities they had participated in their past. The granularity of options (participated in the past year, prior, never) is (by necessity) coarse, which allows for recall bias to creep in among those who answered ‘prior.’ In addition, all responses from the 2021 cohort may be affected by the prolonged period of enforced inactivity due to COVID-19.

2.5.2. Participation and Response Rate

The literature notes low response rates for online surveys in general (Monroe and Adams 2012). To boost response rates, Dillman et al., as well other authors drawing on their work, advocated the approach of a personalized and repeated contact (Cook et al. 2000; Dillman et al. 2009; Fan and Yan 2010; Koitsalu et al. 2018). While this is possible with fixed, well-circumscribed cohorts of known potential participants (Monroe and Adams 2012), it was not possible in the general public cohorts or the Reddit cohorts. Other modes to boost response rates are perceptions of scarcity (i.e., those surveyed are a group of a select few) (Fan and Yan 2010) pre-notification, (Fan and Yan 2010; Koitsalu et al. 2018) and reminders (Koitsalu et al. 2018).
Although there are dissenting opinions (Brown and Knowles 2019), remunerative incentives are frequently commented upon favorably, (Fan and Yan 2010; Monroe and Adams 2012) in particular for longitudinal studies, (Choga 2019; Khadjesari et al. 2011) with better response rates resulting from uniform monetary incentives rather than prize draws (Brown and Knowles 2019; Robb et al. 2017) and higher incentive values for longitudinal studies (Khadjesari et al. 2011).
The main limitation to assessing participation is that the mode of survey administration does not give the opportunity to adequately assess the response rate. Participation and uptake on survey invitations were voluntary, and the selection of the cohorts for the general population (see Section 2.3.1) was opportunistic. Thus, it can be surmised that the fact of participation entails a bias of general interest in either outdoor activities (signaled via the title of the survey), interest in the general issue of risk behavior, or social desirability bias with participants feeling compelled to support research in general or the individual disseminators of the survey.
Among Reddit users, the number of actual participants in a survey is subject to a range of filters and represents a small fraction of the overall population registered for a specific Sub-Reddit (Figure 3). While the total number of registered users in each sub-Reddit is publicly posted, and while the number of participants reading the same sub-Reddit as a user is also visible, the number of people actively (posting) engaging with a sub-Reddit is not readily discernible. It can be posited that the total number of persons consuming the content of a specific sub-Reddit will be greater than the number who registered for the sub-Reddit. The universe of readers looking at a sub-Reddit at any given time is subject to time richness of the participant population due to employment and social/family factors, the time of day at the user’s location (day, night) and the geographic mix of the sub-Reddit ’s users, i.e., whether it is primarily a single nation (with associated time zone implications) or truly global. The readers looking at a sub-Reddit need to be sufficiently interested to click on the headline of the specific post and then remain engaged to read that post. Only a fraction of readers will be further motivated to click on the link that takes them to the survey form hosted on SurveyMonkey. For reasons of survey ethics, all relevant participation information needs to be posted on the first page of an online survey. A downside of the lengthy required text is that it may further discourage participation. On the other hand, that step may have filtered out some user which would have commenced, but then quickly abandoned the survey after a handful of questions.
It can be assumed that reading the initial post and subsequent participation entails a bias of general interest in the outdoor activities of the targeted sub-Reddits and/or a social desirability bias with participants feeling compelled to support research in general or the survey in particular. The commercial version of SurveyMonkey subscribed to by Charles Sturt University records the answers but does not record the number of times the survey form was called up but was not progressed beyond reading the participation information section.
Some approximations of participation at that stage, however, can be made. The literature suggests that 90% of an internet community, such as Reddit, are pure consumers (readers), 9% contribute in general, and only 1% contribute and engage heavily (Carron-Arthur et al. 2014; Gasparini et al. 2020; Glenski et al. 2017; Van Mierlo 2014). In December 2020, Reddit claimed to have 52 million daily users out of a total population of 430 million, (Patel 2020) suggesting that 12% of the users visit daily. As this usage cuts across the entire site, the participation percentage will vary between sub-Reddits. Using the 1% rule, we can estimate that 0.12% of registered users will be active participants.
System-wide data suggest that the average user will visit the site for a 10-minute duration (SimilarWeb 2021), but it can be assumed that the duration is longer for specific-interest sub-Reddits which have developed into their own ecosystems. Moreover, the duration of active users will far exceed the average.
A glimpse of the user-reader-participant relationship of sub-Reddits used in the survey can be gleaned from Table 1. Most sub-Reddit forums allow creating posts with a single-question, fixed choice polls with a maximum of six short answer options, running for a duration of between one and seven days. A simple poll of three-day duration was administered on various adventure bicycling-related sub-Reddits asking respondents to choose a primary motivation for their participation in the bicycling activities. The number of users reading the sub-Reddit was recorded at six instances between 20:00 h and 8:00 h GMT (7 a.m. and 9 p.m. ADST) for three days, which allows us to calculate an average percentage of registered users reading the discussions at any one time. The percentages range from 0.1% to 0.7% (Table 1). While this is the average at any given time, it does not allow to estimate the cumulative total over a single day or the total three-days exposure period of the poll. Neither does it indicate the duration of participation.
When considering the participation in the poll, the average percentage of registered users doing so ranges from 0.08% to 1.51% (Table 1).
A formal response rate can be calculated for the student cohort recruited through the University of Guam mail system. The total e-mail list contains 3082 addresses. In total 210 responses were received, resulting in a response rate of 6.8%.

3. Results

3.1. Demographics

In total 4198 surveys were commenced, 422 by general online (not Reddit) users and 3776 by Reddit users. The two online cohorts show a gender bias with male respondents significantly overrepresented both among the non-Reddit (χ2 = 3.92, df = 1, p = 0.0476) and the Reddit population (χ2 = 1758.59, df = 1, p < 0.0001). When examining the gender differential among the major Reddit cohorts, women respondents are significantly better represented among the mental health Reddits (53.3%, n = 210; χ2 = 39.65, df = 1, p < 0.0001) than among the general population (30.0%, n = 793) and the outdoor activities related Reddits (31.0%, n = 786; χ2 = 35.87, df = 1, p < 0.0001). The representation of female respondents among adventure activities related Reddits is a sixth that of of the male respondents (14.3%, n = 1613, χ2 = 723.74, df = 1, p < 0.0001).
The gender representation varies between five-year age cohorts, with female representation among the non-Reddit respondents rising from 31.3% among the 16–19 years old age cohort to 70% among the 65–69 years old age cohort. No such trend is observable among Reddit respondents (Table 2). When looking at the age structure of the Reddit respondent population by gender, differences emerge (Figure 4). While the age curves generally track in a similar fashion, the general respondent cohorts tend to be younger than those in the adventure cohorts and those in the general outdoor cohort. Among both genders, adventure cohort respondents show a peak in the 25–29 year age bracket, while the outdoor cohort respondents peak in the 30–34 year age bracket. Among the general Reddit population, the age structure of female respondents shows a distinct peak in the 16–19 year age bracket, while among men, it is more diffuse, spanning the 16–34 age range (Figure 4).
The non-Reddit user respondents came from 25 countries, primarily the U.S.A. (48.65), Australia (35.1%) and Canada (4%). The Reddit respondents came from 68 different countries, primarily the U.S.A. (66.6%), Canada (8%), the UK (5.8%) and Australia (4.2%). On a major geographic scale, the Reddit population is dominated by participants from North America (64.6%), followed by Europe (14.5%) and Australia/New Zealand (5.2%). Least represented are the Middle East, Latin America and South East Asia (0.2% each), as well as East Asia and Africa (0.4% each).

3.2. Participant Attrition

Participant attrition rates (PAR) were assessed by establishing how many pages of the multi-page online survey a given participant completed before they abandoned the survey. In the online form delivered by SurveyMonkey, Page 1 was the participant information documentation and the invitation of the survey. The count started when participants progressed from page 1 to page 2, thus equating the start of page 2 as 100% participation. Pages 2 to 9 covered demographics and questions related to general attitudes towards risk and social determinants of risk taking (coded as P2–P9 in the graphs). P10 was the first page with questions related to specific activities, which also explained what was asked. The following seven pages are related to specific activities. These were presented to the participant in a randomized fashion to ensure that each had an equal chance of being answered in those cases where participants did not complete the survey (coded as R1–R7 in the graphs). In survey forms using the standard page layout (in paper or PDF), the first page equates to P2 to P9 and the obverse page to P10 and R1–R7.

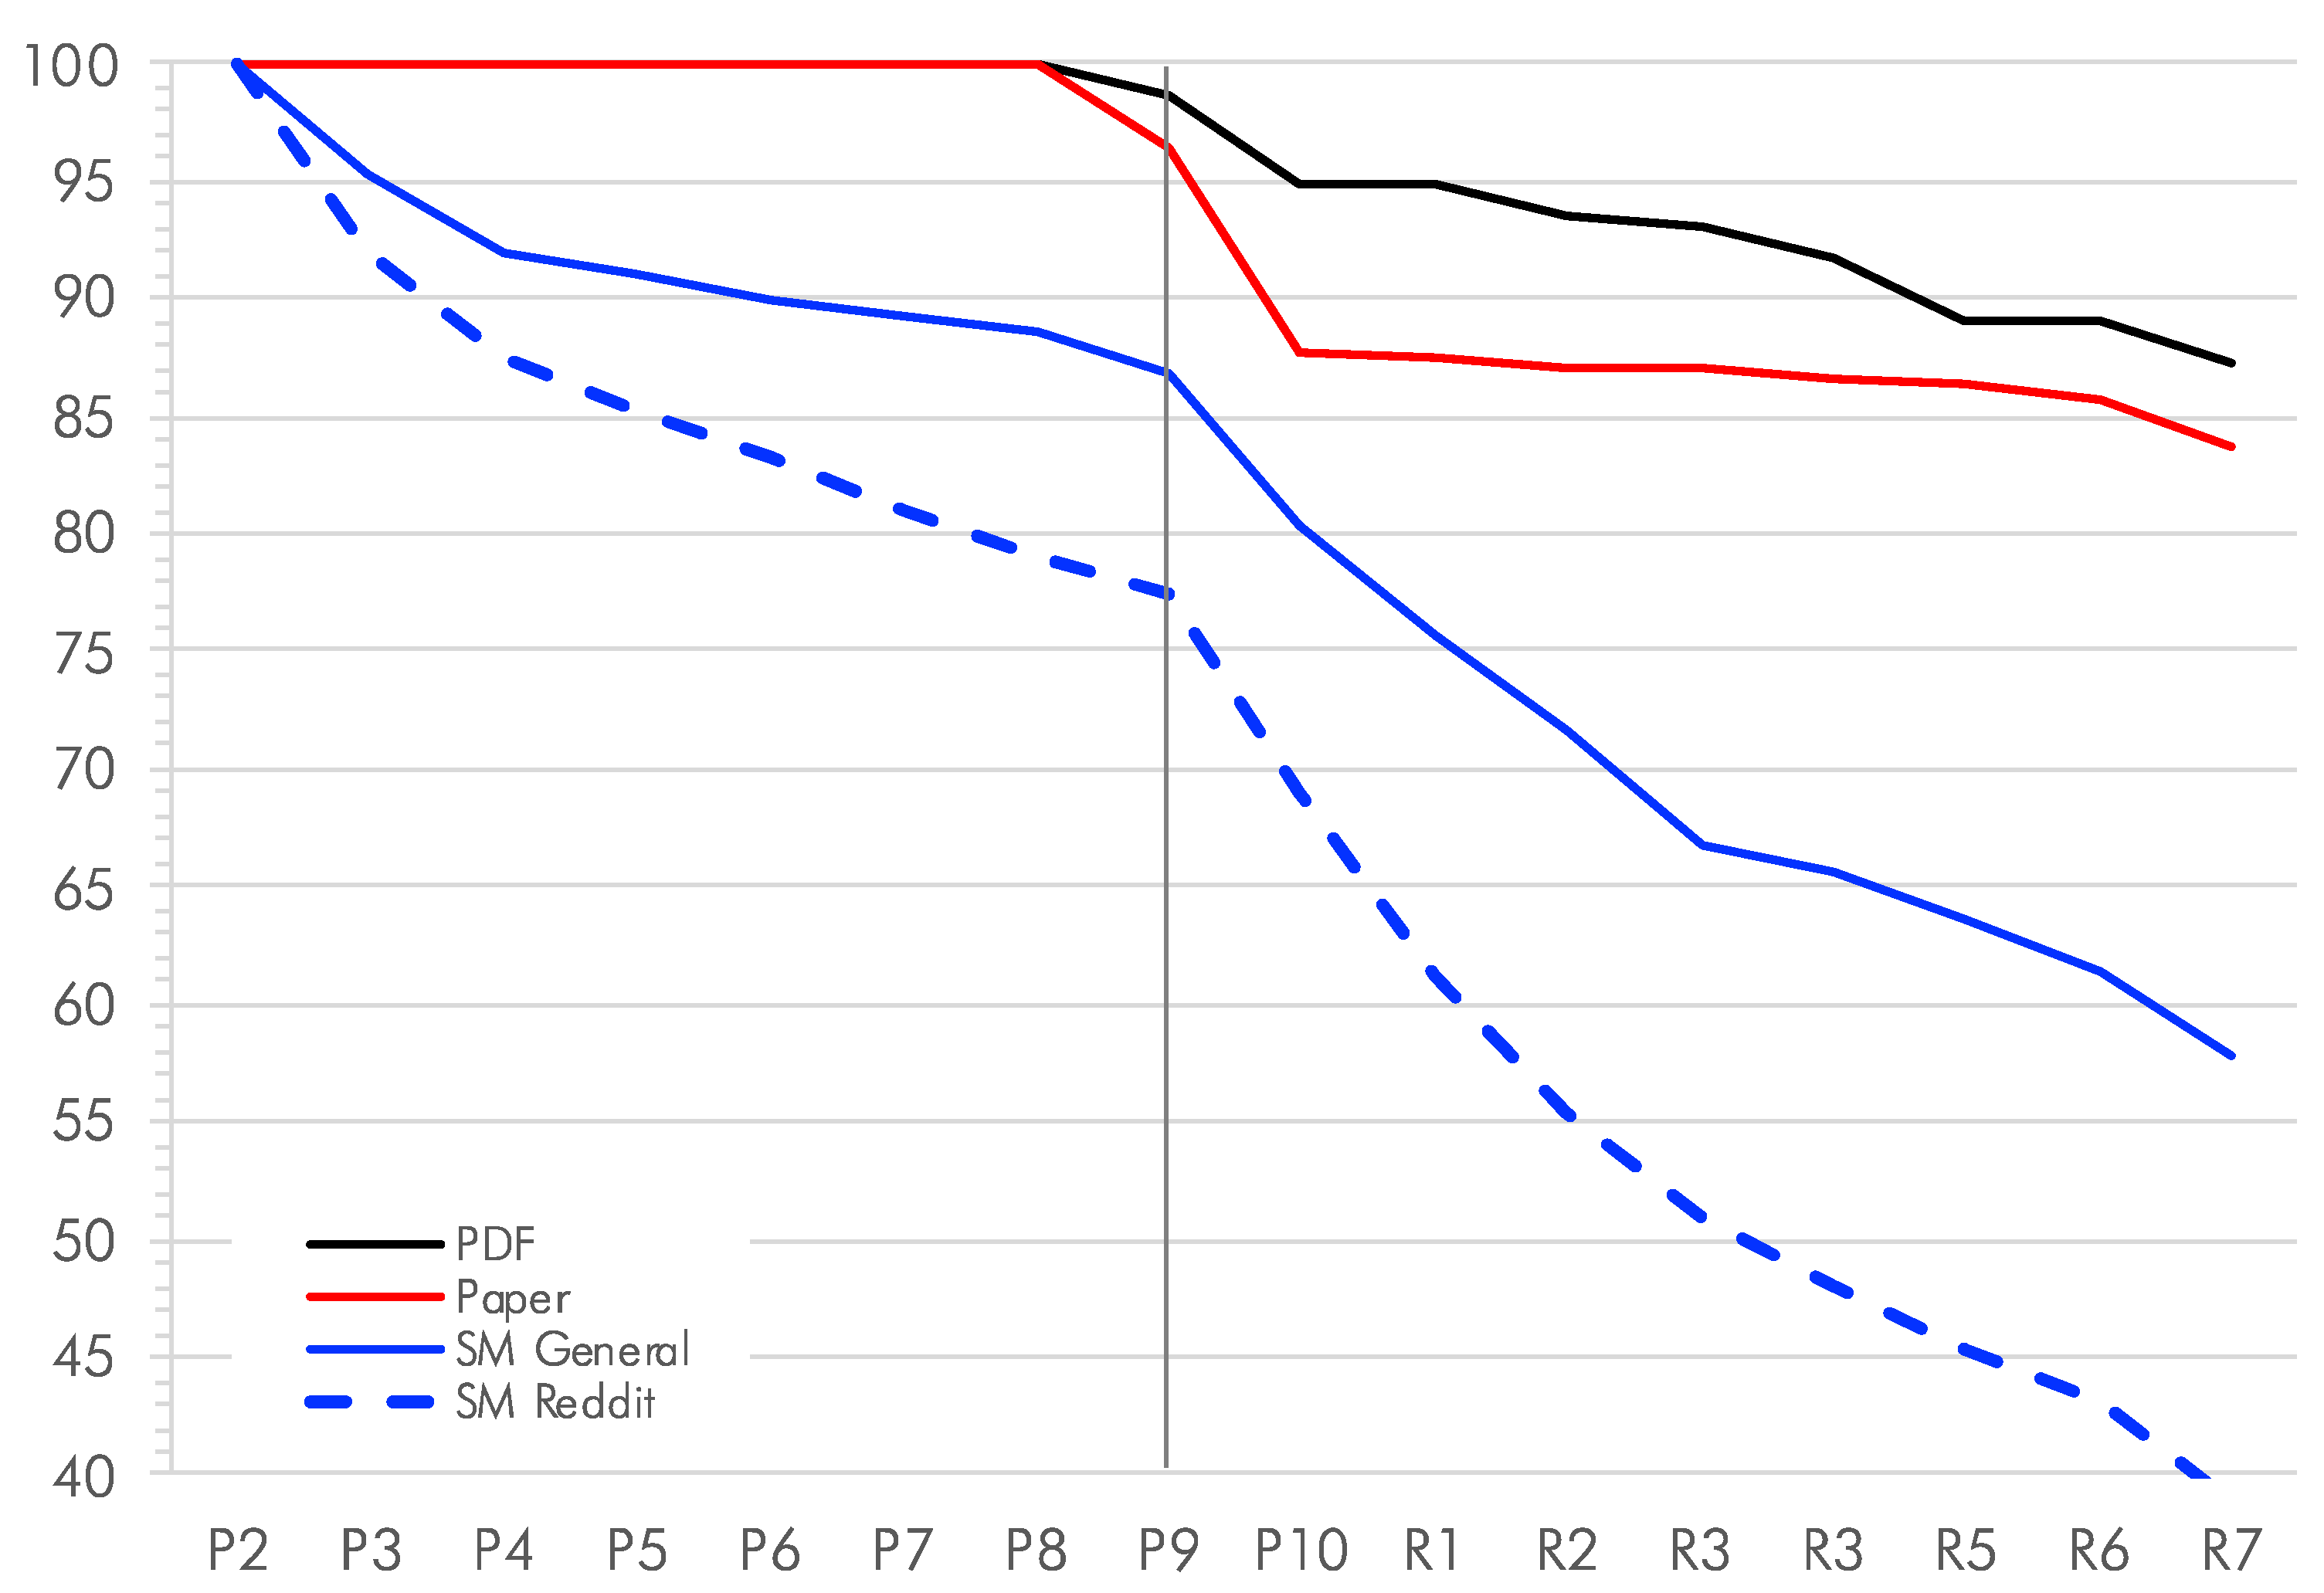
3.2.1. Effects of the Mode of Submission

The different modes of submission resulted in different PARs. In the case of the physical survey, which followed a standard page layout (in paper or PDF), the respondents tended to fully or almost fully complete the first page (P2 to P9 equivalent), but the PAR dropped after the first set of questions related to specific activities (P10 equivalent) (Figure 5). Thereafter, the PAR remained stable among paper surveys, whereas it continued to drop, albeit gradually (final PAR 16.3%), among respondents filling out the PDF versions (final PAR 12.8%). The difference between the two PAR trajectories is very significant (paired t-test, p = 0.0017). By comparison, the PAR of respondents using online forms dropped following the first set of demographic questions (P3), remained stable until the end of the section dealing with questions related to general attitudes towards risk and social determinants of risk-taking (P4–P9) but then dropped off steeply for the questions related to specific activities (Figure 5). The same trajectory was observed among Reddit users, except that the PAR already dropped continually among the section dealing with questions related to general attitudes towards risk and social determinants of risk-taking (final PAR 42.1%). The decline in PAR for the questions related to specific activities was steeper than that of non-Reddit participants dropping to a final PAR value of 61.1%. While the PAR decay curves (Figure 5) show a very high level of correlation (r = 0.998), the difference between the two PAR trajectories is highly significant (paired t-test, p < 0.0001).
The gender differences in participant attrition for paper and PDF versions are shown in Figure 6, with the greater final PAR by men filling out paper versions (92.6%) and the least loss among men filling out PDF versions (98.4%).
The remainder of the discussion of results focuses solely on participant attrition rates observed using online surveys hosted on Survey Monkey.

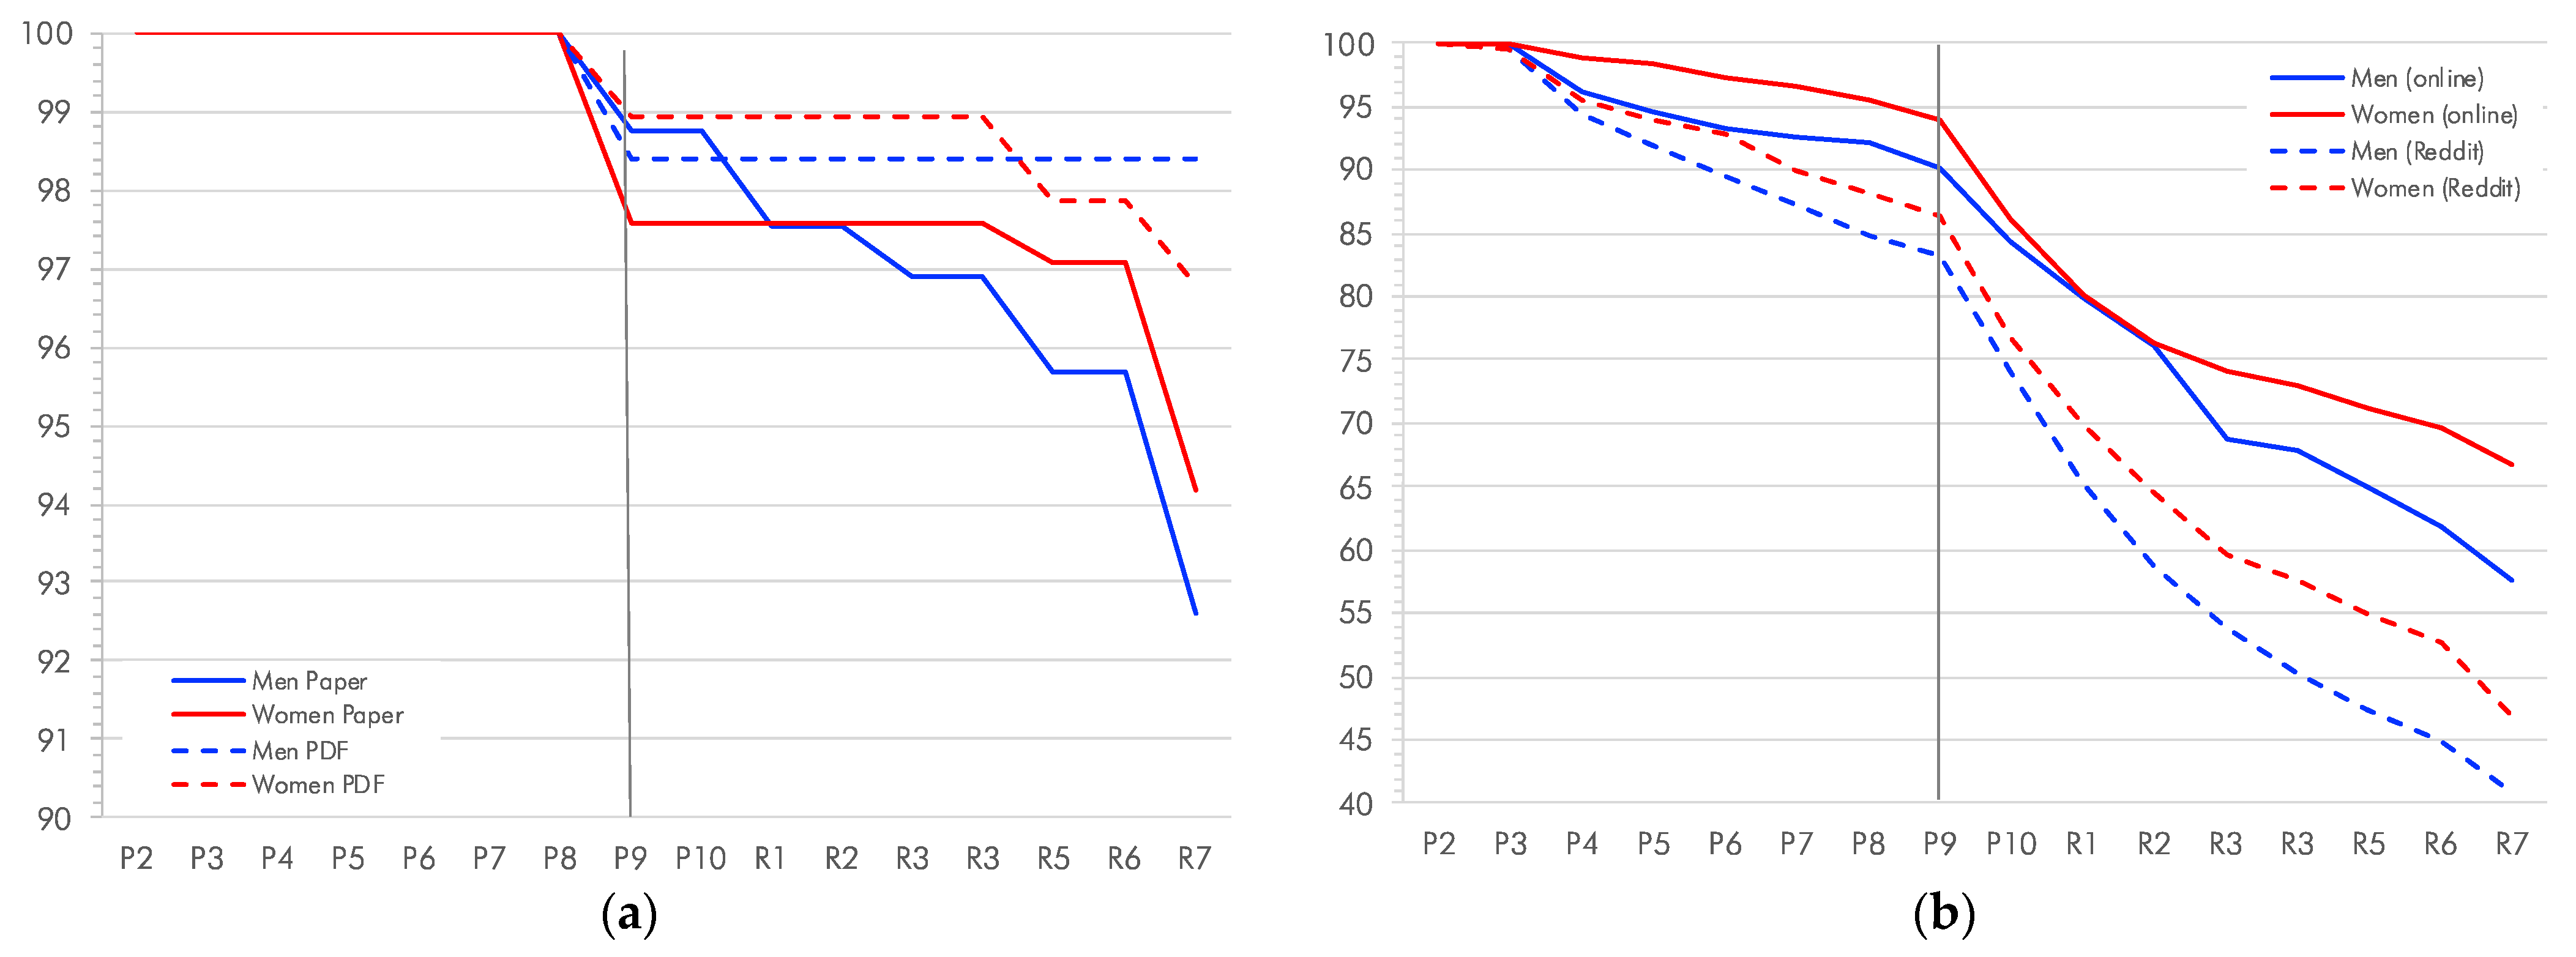
3.2.2. Effects of Gender on Participant Attrition among Reddit and Non-Reddit Cohorts

Gender differentiation in PAR can be observed both for Reddit and non-Reddit online cohorts (Figure 6b). While the PAR trajectories among men and women show a high level of correlation in the non-Reddit online cohort (r = 0.987) and a very high level of correlation the Reddit cohort (r = 0.999), women have a very significantly lower PAR than men in both the non-Reddit and the Reddit cohorts (both at p < 0.0001). For each gender, the non-Reddit cohorts (Figure 6a) have a significantly smaller decrease in PAR than the Reddit cohorts (both men and women at p < 0.0001).
Grouping the various Reddit cohorts into four main conceptual sampling frames of adventure activity, outdoor activity, mental health, and general (incl. country-specific) Reddits (Appendix C), gender differences emerge. Among men, the PAR trajectories for the four Reddit cohort groupings follow each other closely with very similar values, with the exception of the trajectory for the mental health grouping (Figure 7a). That group drops off sharply at the last randomized page, resulting in a final PAR of 81.5%. The other three PAR trajectories show a high to a very high level of correlation (r = 0.985–0.999). Of these, the PAR trajectory for the general Reddit cohort shows a significantly greater attrition rate than the trajectories for adventure activities (p = 0.0058) and general outdoor activities (p = 0.0363).
Among women, the PAR trajectories for the four Reddit cohort groupings follow each other closely, again with the exception of the trajectory for the mental health grouping, which drops off sharply at the last randomized page (Figure 7b). The other three PAR trajectories show a high to a very high level of correlation (r = 0.991–0.997). Of these, the PAR trajectory for the general Reddit cohort again shows a significantly greater attrition rate than the trajectories for adventure activities (p < 0.0001) and general outdoor activities (p = 0.0001).

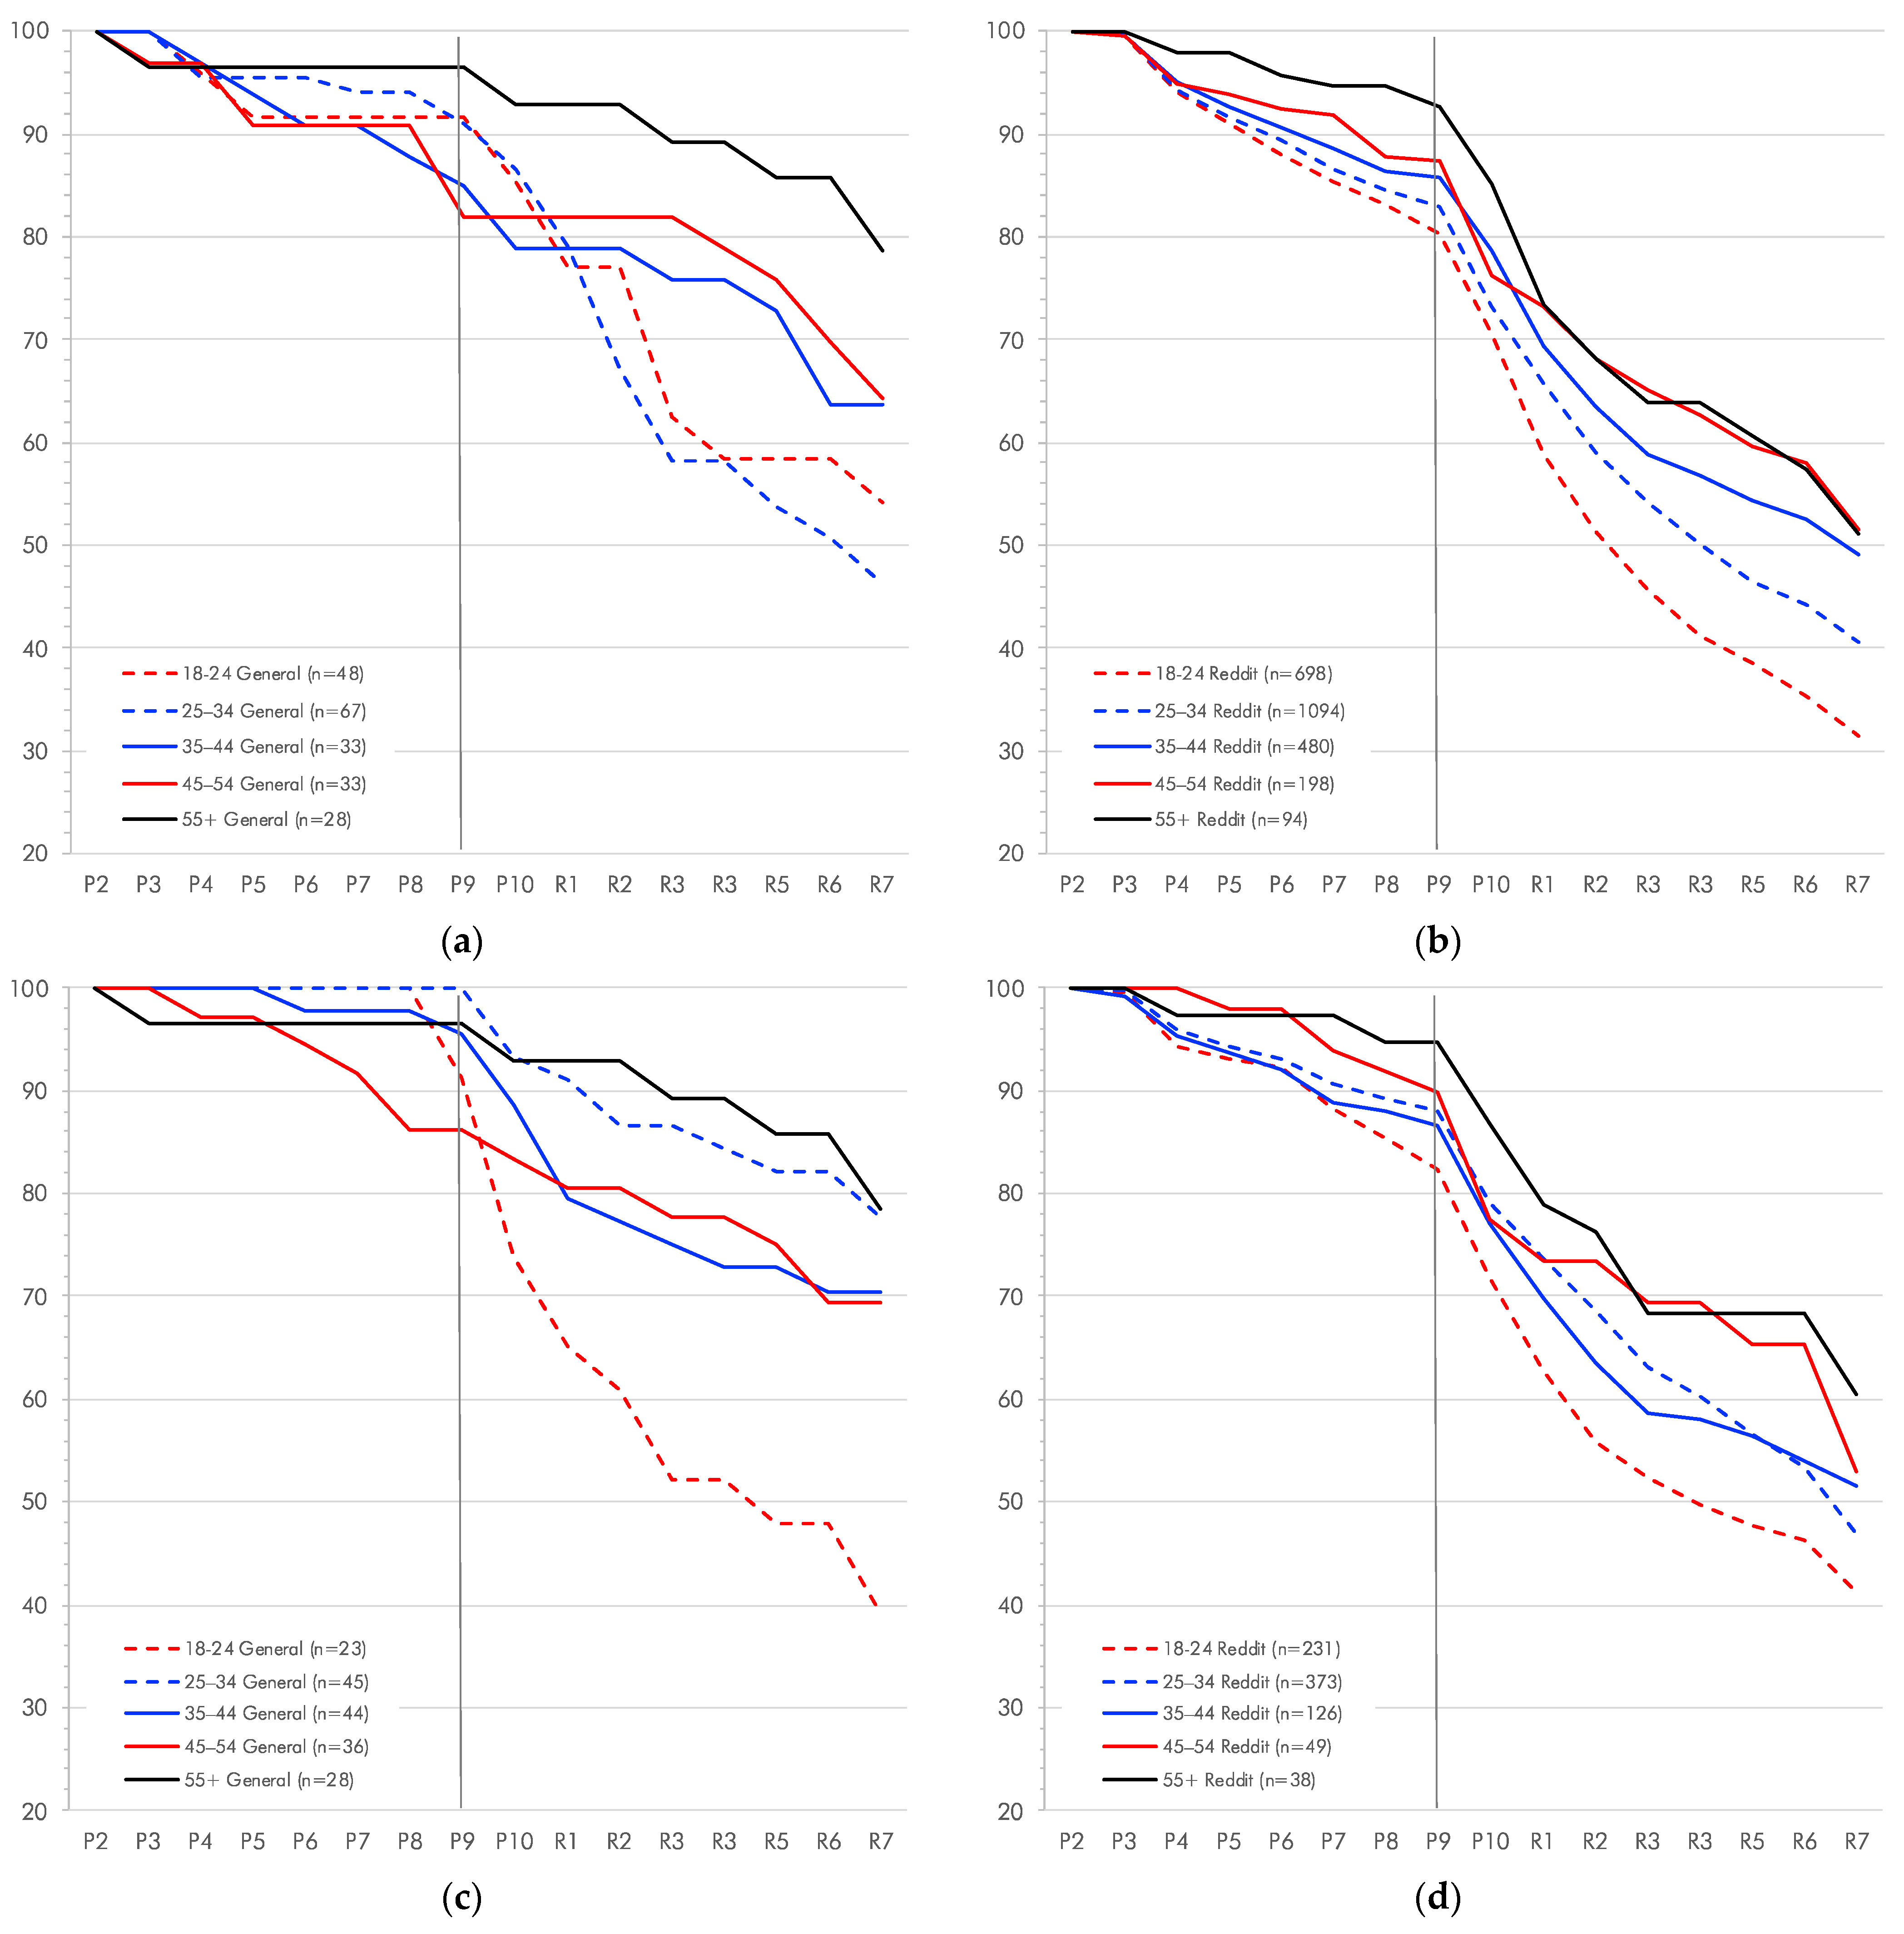
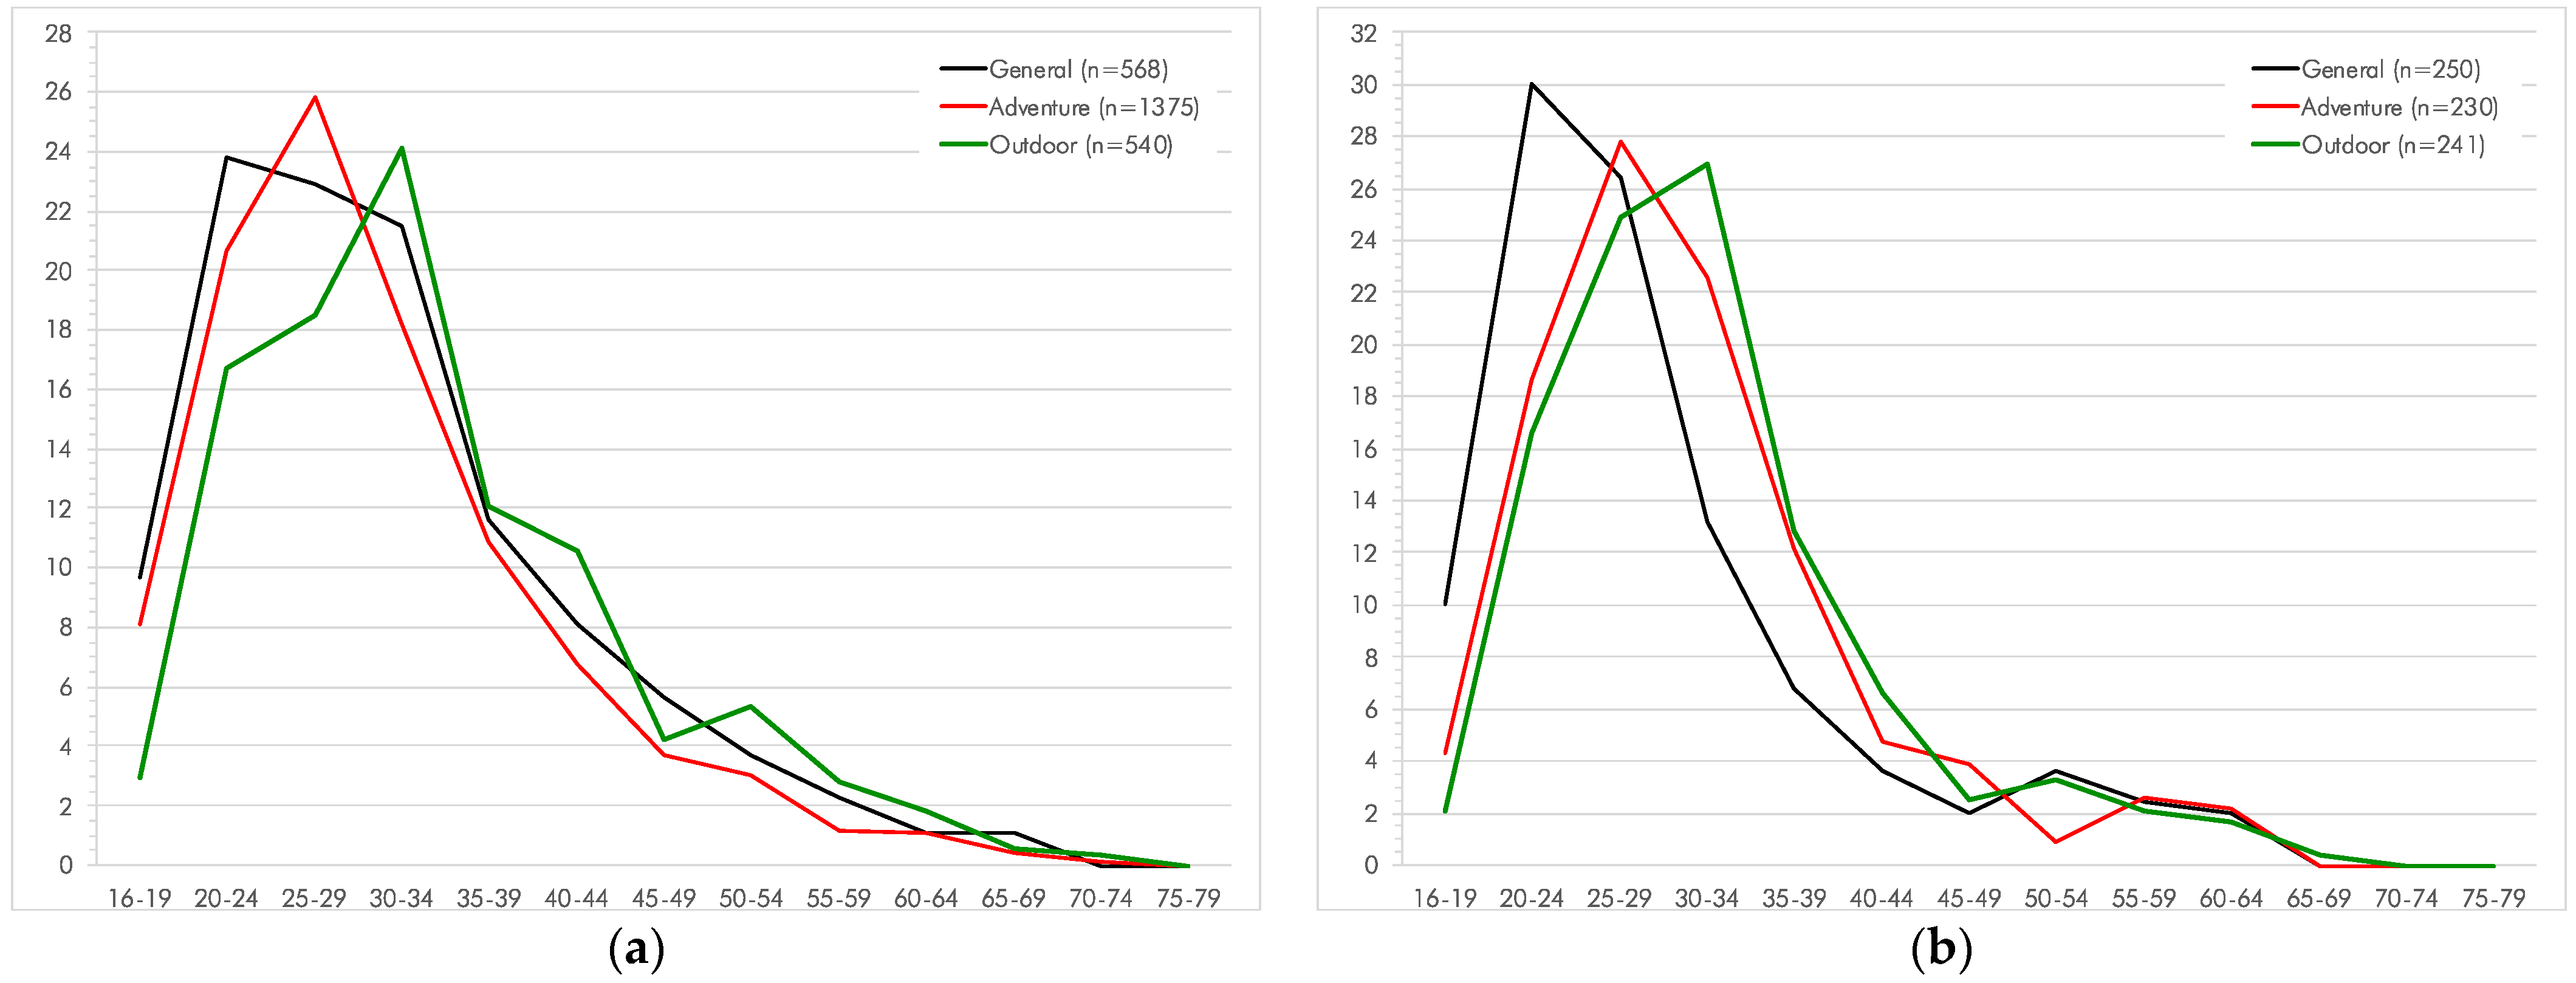
3.2.3. Effects of Age on Participant Attrition among Reddit and Non-Reddit Cohorts

To test whether a participant’s age has an influence on attrition rates, male and female respondents were grouped into ten-year age cohorts (Figure 8). Among both genders, increasing age had a positive effect on survey completion rates. For men of the general online cohorts (Figure 8a), the PAR of the age group 55+ was significantly less than all other age cohorts (paired t-test; range: p = 0.0001 for 35–44 year–p = 0.0096 for 44–54 year). For men of the Reddit cohorts (Figure 8b), the PAR of the age group 55+ was also very significantly less than all other age cohorts with p < 0.0001 for all except for the 44–45 year cohort (p = 0.01). Among women, the same trend can be observed among the Reddit cohorts (Figure 8d), where the age group 55+ was also very significantly less than all other age cohorts with p < 0.0001 for all except for the 44–45 year cohort (p = 0.0149), but not for the general online cohort (Figure 8c). Here the PAR for the age group 55+ was significantly less for all other age cohorts (range: p = 0.0002 for 45–54 year–p = 0.0161 for 34–44 year) with the exception of the 25–34 cohort (p = 0.8723).
Using the 55+ cohort, which shows the smallest PAR as the yardstick, the PAR decay curves for the age groups of male (Figure 8b) and female (Figure 8d) Reddit respondents each show a very high level of correlation (r = 0.987–0.992 for men and r = 0.9787–0.9889 for women), while the correlation for the male and female general online cohorts (Figure 8a,d) is not significant. Looking at the trajectories of PAR among men, the age groups 18–24 and 25–34 show the greatest and most rapid decline PAR once the activity set questions were asked. The PAR curves for the Reddit cohorts all follow the same trajectory, with the PAR decreasing with each increase in age cohort (Figure 8b). The PAR curves show a high to a very high level of correlation depending on the combination of adjacent age cohorts tested, ranging from r = 0.995 (35–44 vs. 45–54) to r = 0.999 (18–24 vs. 25–34).
The PAR curves for women Reddit cohorts follow similar trajectories compared to those of men but exhibit a more pronounced decrease once activity set questions were asked (Figure 8d). Differing from the men, however, the PAR curves for women respondents do not show a decrease in PAR with each increase in age cohort as the 35–44 year cohort shows a lower PAR than the 25–34 year cohort (Figure 8d). The PAR curves show a moderate to a high level of correlation depending on the combination of adjacent age cohorts tested, ranging from r = 0.978 (45–54 vs. 55+) to r = 0.992 (25–34 vs. 35–44). Among the general online cohorts of women respondents, the PAR curves are much more diverse without a clear pattern (Figure 8c). While the 55+ cohort shows the smallest increase in PAR (final value 78.6), the 18–24 year cohort shows the steepest and greatest increase PAR (final value 41.1%). Compared to the Reddit cohorts, which showed a gradual increase in PAR even among the attitude questions (P4–P9), the women respondents of the general online cohorts exhibited a high level of perseverance, with the younger age groups (18–24 and 25–34) maintaining 100% until P8 and P9 respectively. Two other cohorts (35–44 and 55+) maintained a PAR of over 95% until P9. From P10 onwards, the PAR increased rapidly in these four age groups. Only the 44–54 year cohort showed a gradual, almost linear increase in PAR (Figure 8c). The correlations of the curves are not significant or only moderately significant.

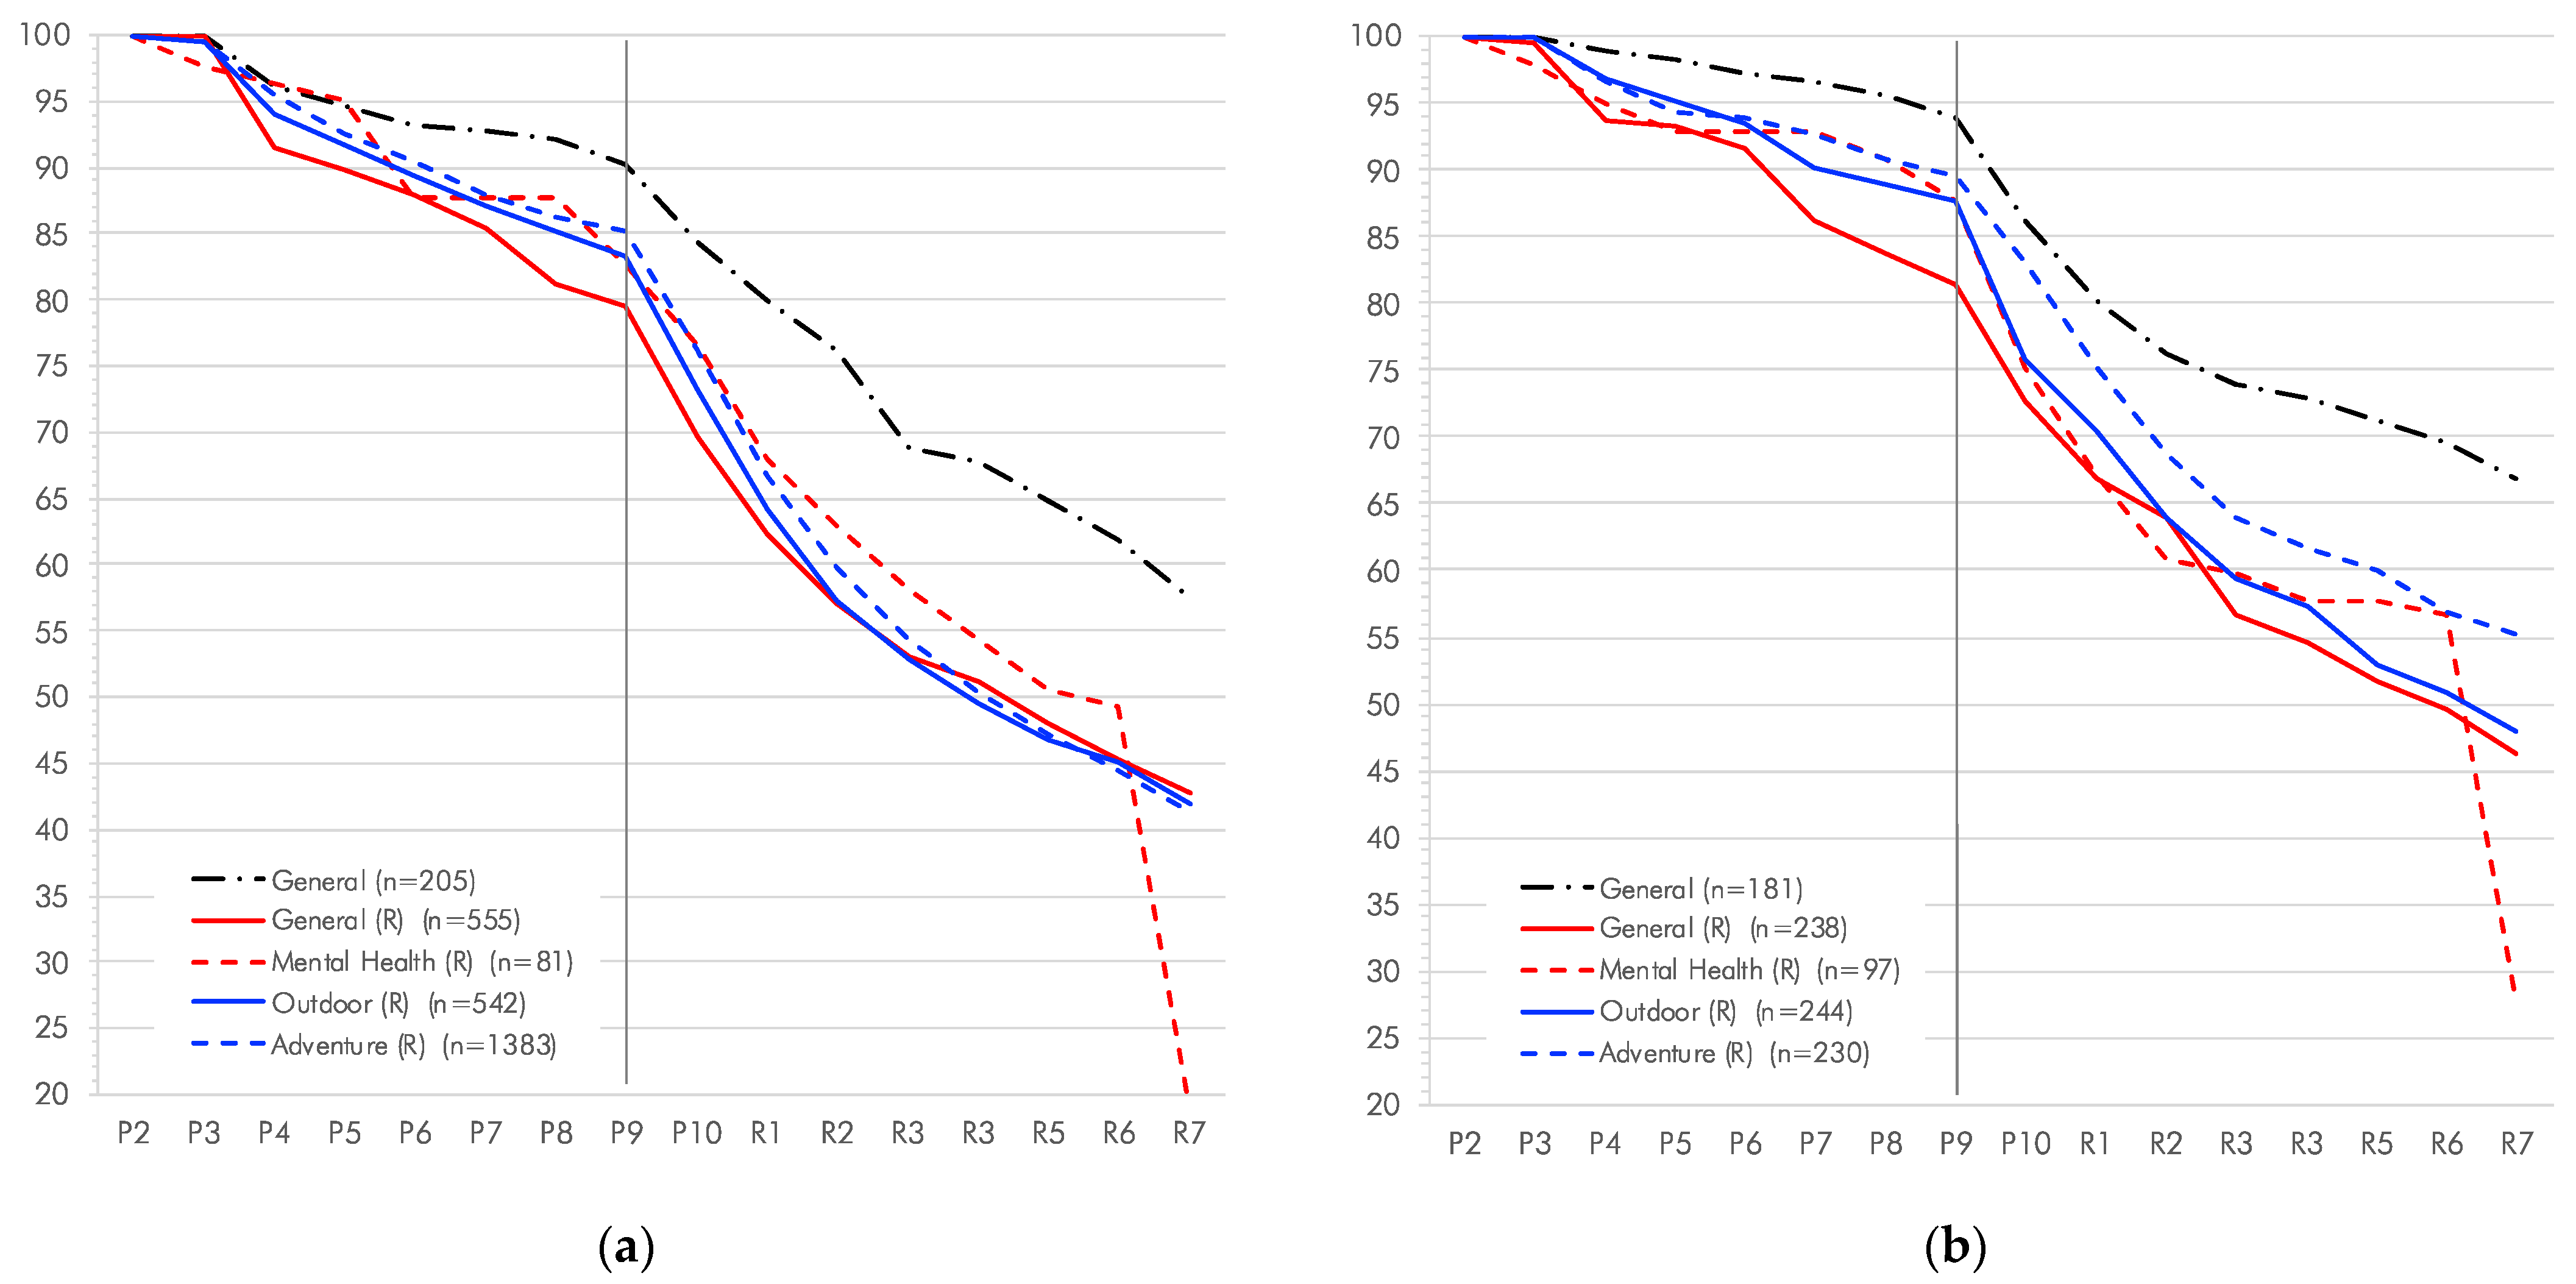
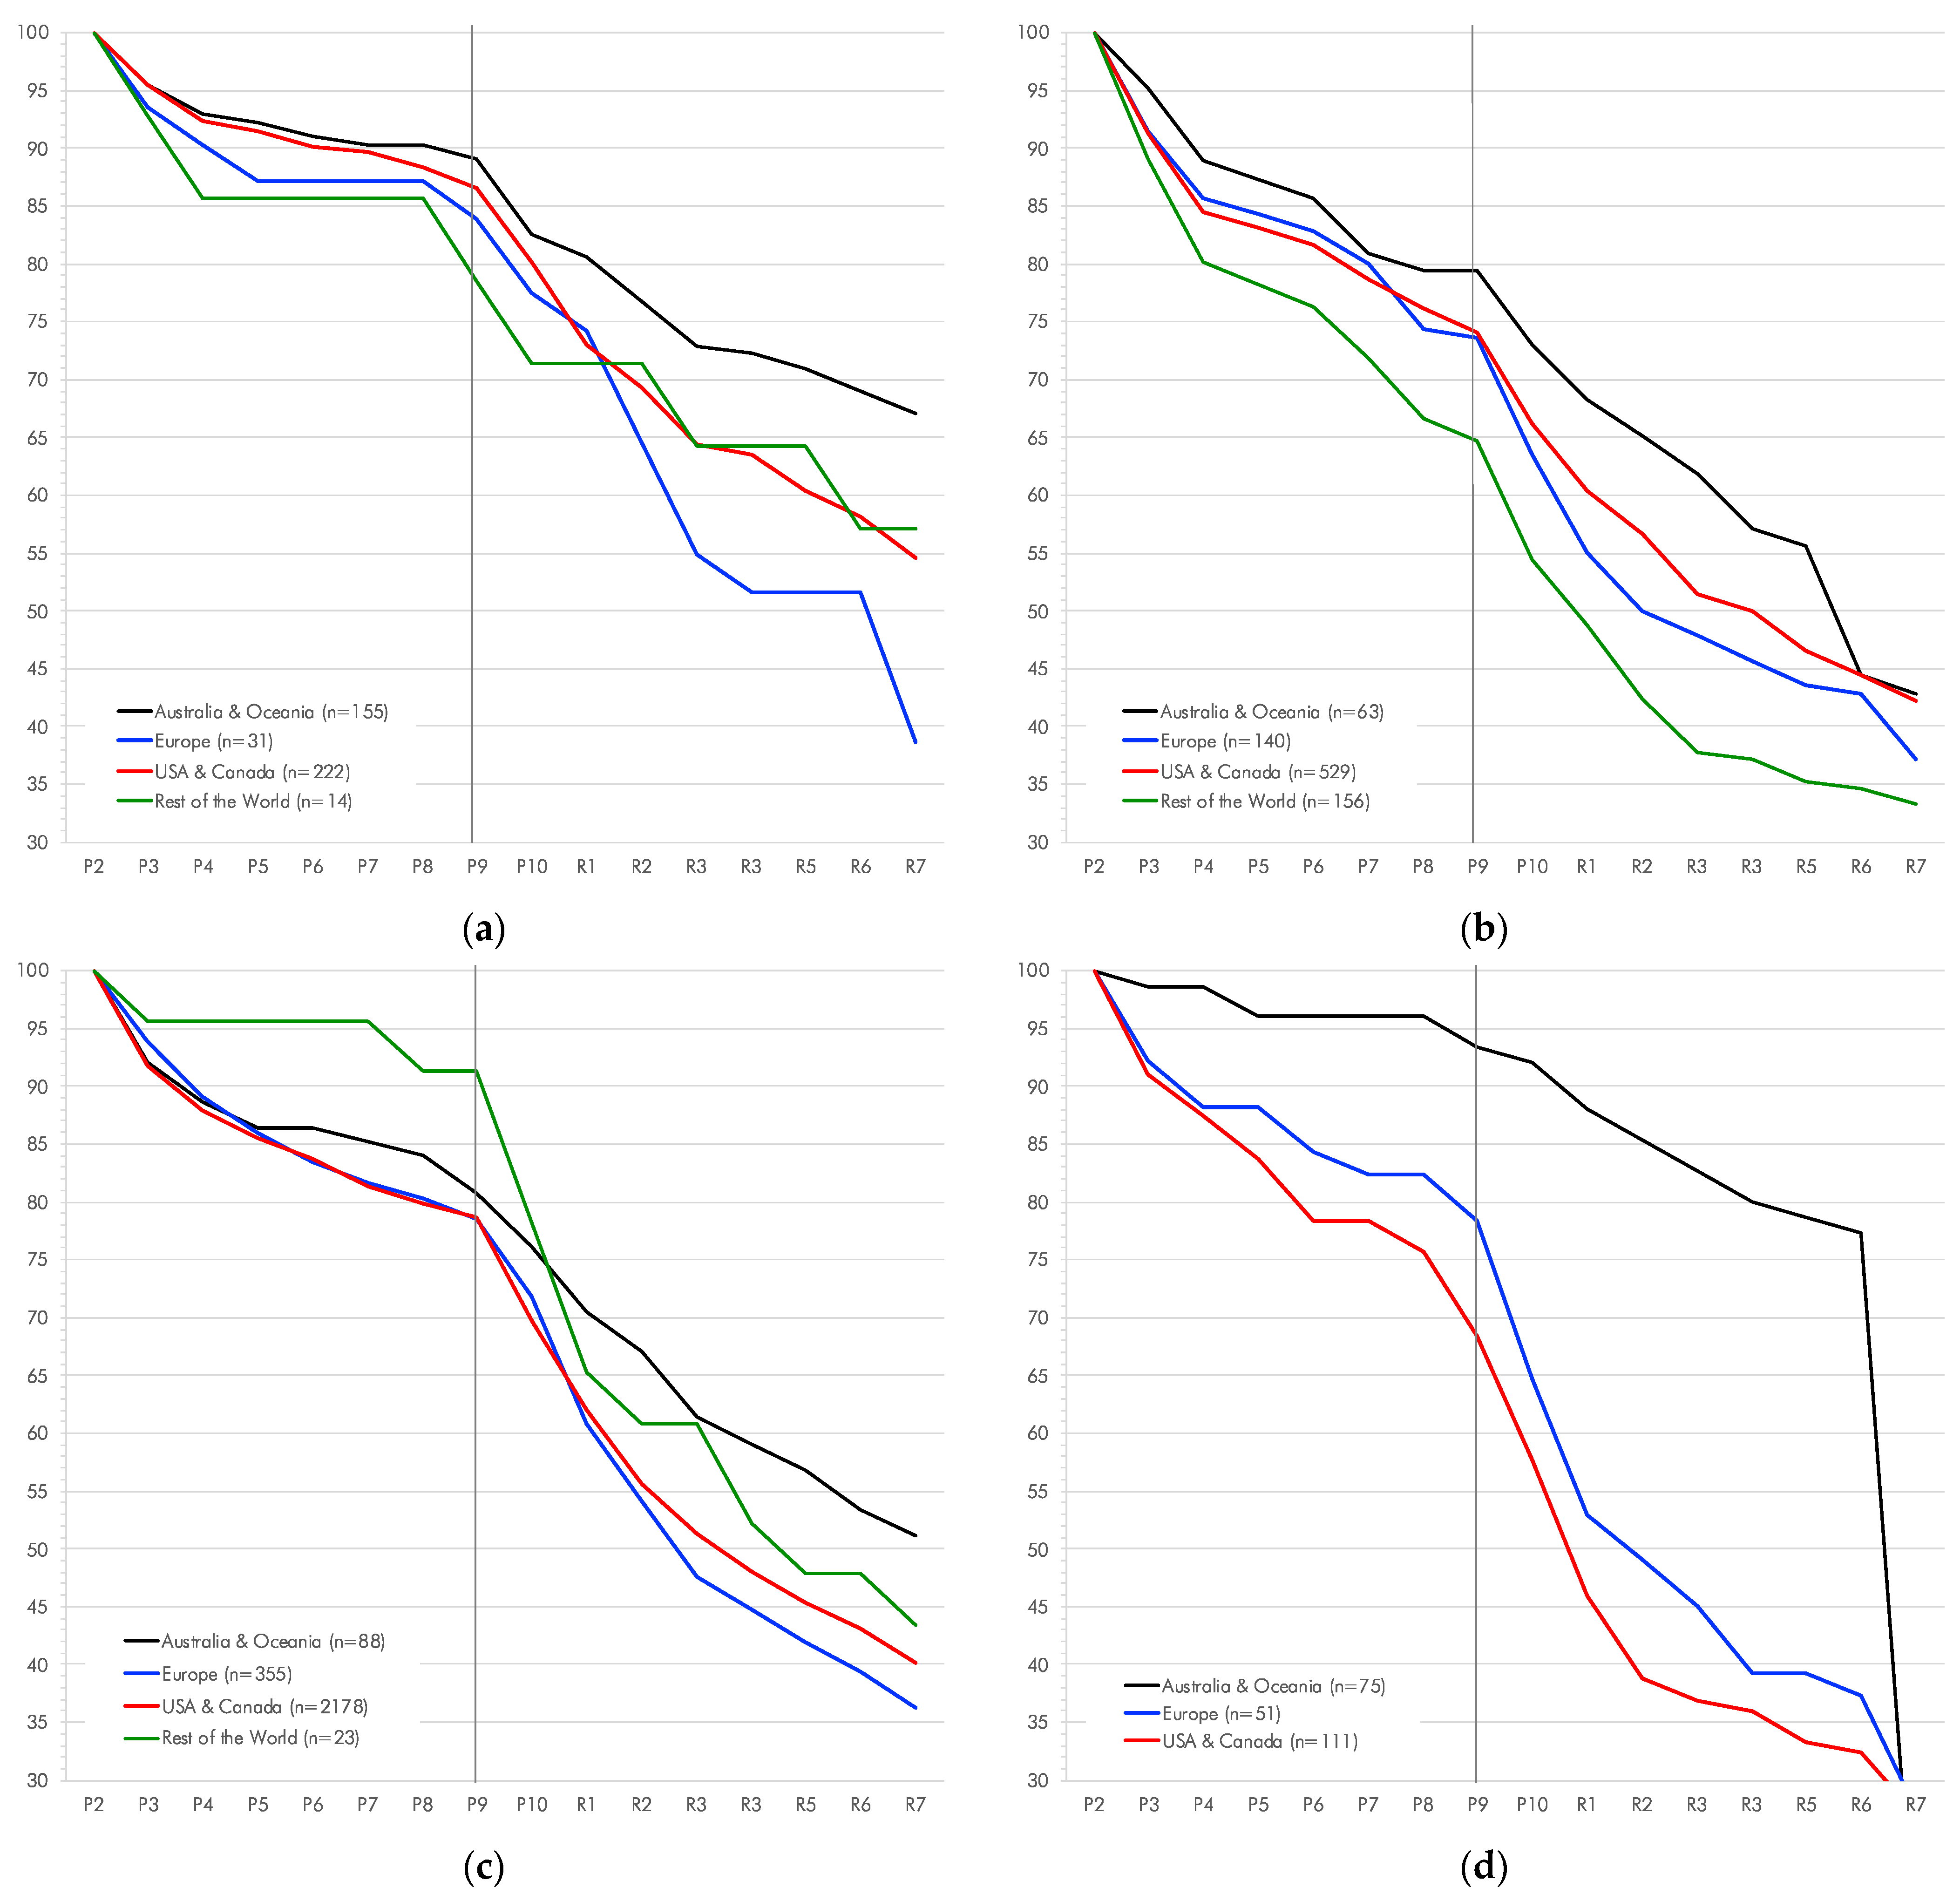
3.2.4. Effects of the Place of Origin on Participant Attrition

As noted in the demographic overview (Section 3.1), the population of Reddit respondents is heavily biased towards participants from the U.S.A. To assess to what extent a regional bias would influence the PAR, a separate country-specific analysis was carried out (Figure 9).
The PAR decay curves for the general online cohort and the general Reddit cohort track similarly for the four regions, with responses from Australia and Oceania showing a lower PAR. All decay curves for the general online cohort (Figure 9a) are moderately to very highly correlated (r = 0.958–r = 0.997), but the level of PAR differs very significantly (paired t-test p < 0.0001–p = 0.0008) with the exception of two pairings of the rest of the world cohort, whereas the decay curve differs from that of the U.S.A. and Canada (p = 0.032) but not of Europe (p = 0.1895).
The PAR decay curves for the general Reddit cohort (Figure 9b) are moderately to very highly correlated (r = 0.965–r = 0.995), but the level of PAR differs very significantly (paired t-test p < 0.0001–p = 0.0001) with the exception of the pairing of Europe and U.S.A. and Canada which is only significant (p = 0.0134). The PAR decay curves for the adventure and outdoor Reddit cohorts (Figure 9c) are very highly correlated (r = 0.996–r = 0.999) with the exception of the rest of the world cohort, where the correlation with the other regions is only moderate (r = 0.976–r = 0.982). The main difference is that respondents from the rest of the world cohort exhibited a lower PAR for the attitudinal questions (P3–P9) than those from the other regions.
The PAR decay curves for the mental health Reddit cohorts (Figure 9d) from Europe and the U.S.A. and Canada are highly correlated (r = 0.992), although the level of PAR differs very significantly (paired t-test p < 0.0001), while the Australia and Oceania cohort follows a totally different trajectory. The latter has a low PAR (value 77.3%) until the very last of the randomized pages when it increases dramatically (final value 13.3%). The rest of the world cohort needs to be excluded from consideration due to its very low sample size.

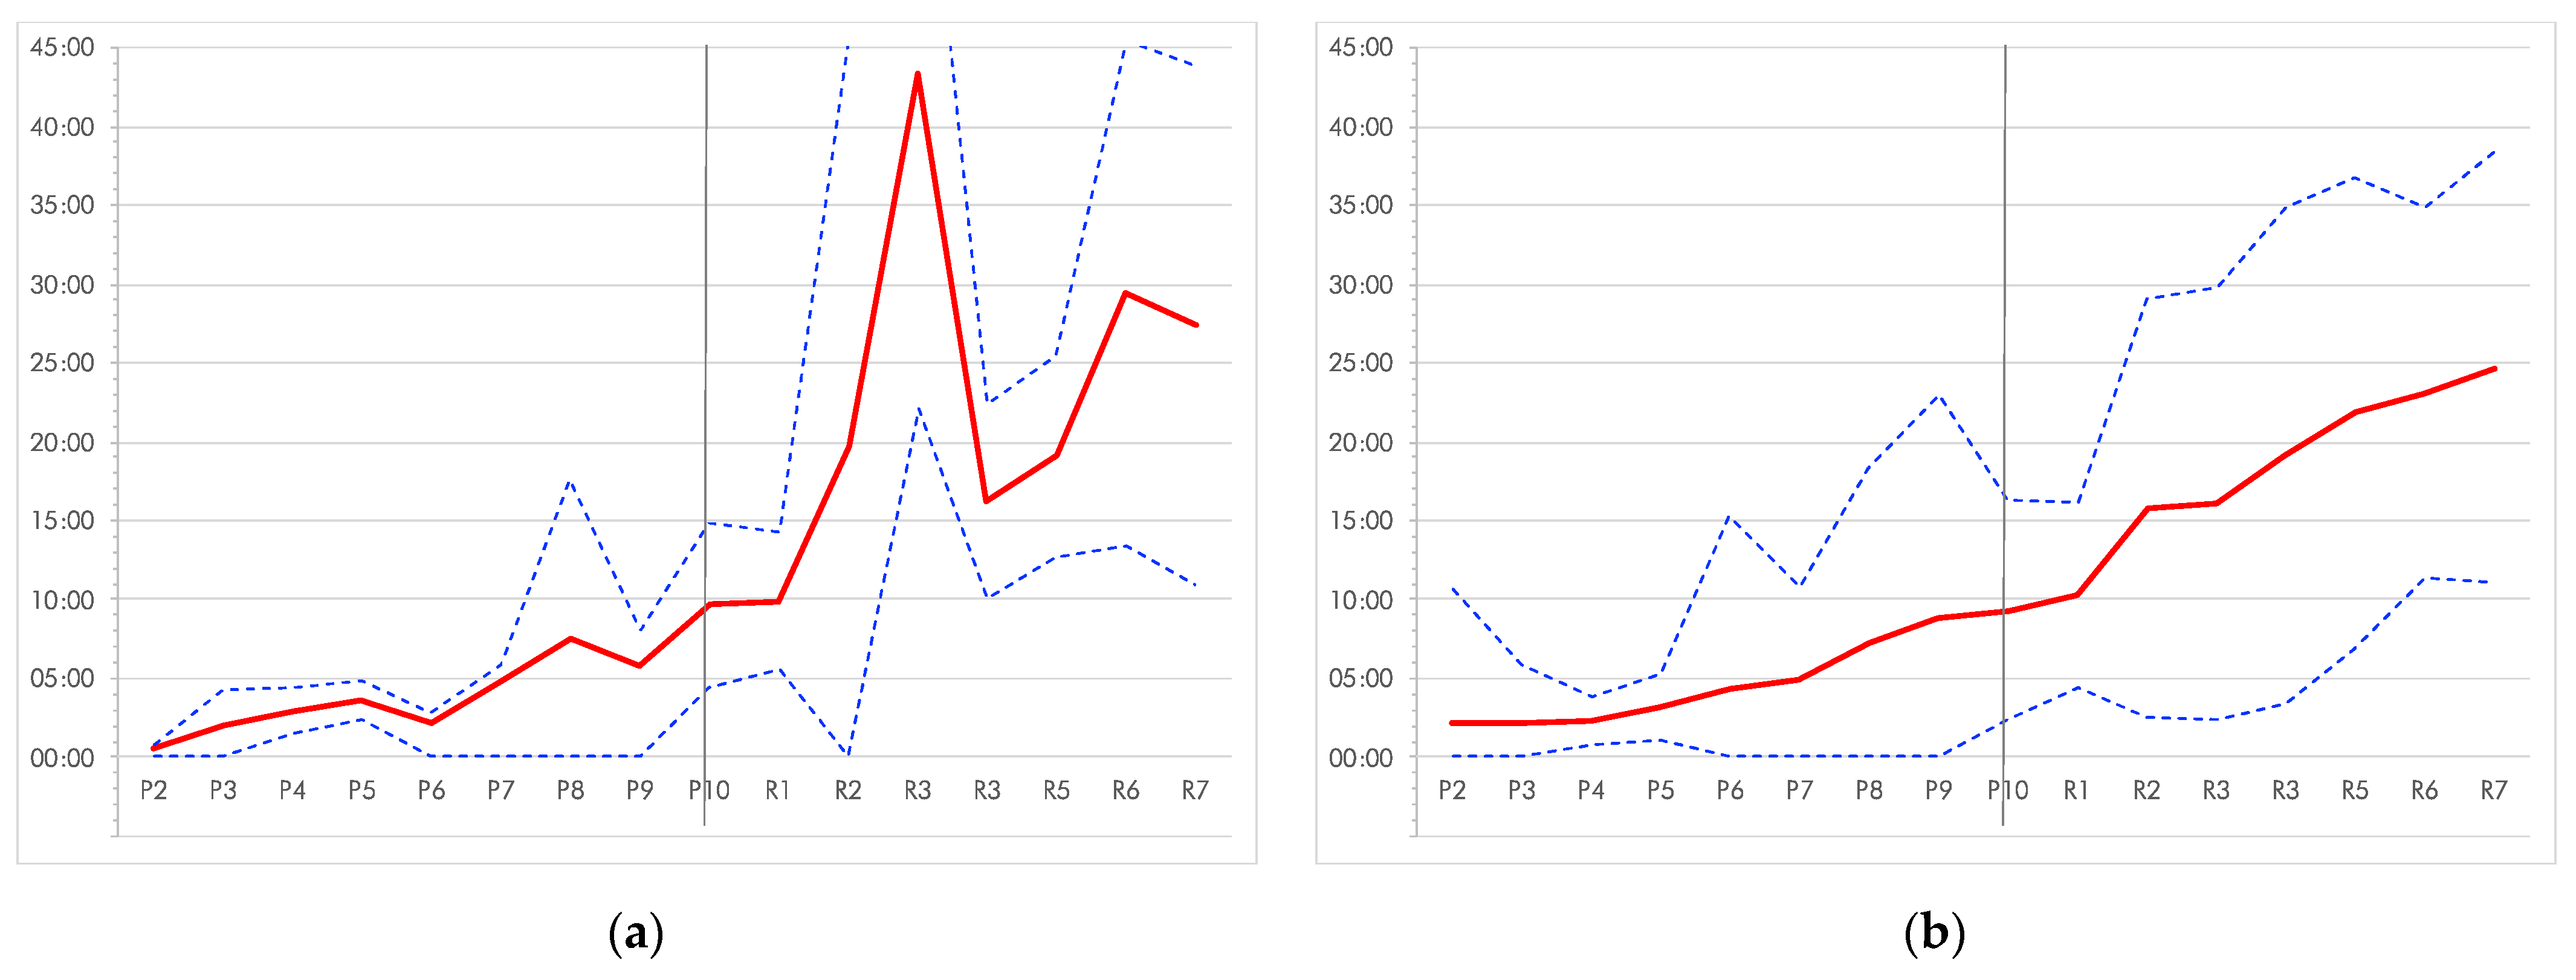
3.2.5. Attrition as a Factor of Time Spent Working on the Survey

As noted in Section 2.4, the time spent on the survey ranged from 8 s (respondent did not progress past the country demographic) to a maximum of two days, 13 h and 6 min (incomplete). In total, 2.6% of the respondents took longer than 2 h to complete (or abandon) the survey, suggesting that they were interrupted or chose to set the survey aside and return to it later. Response times longer than two h were omitted from the analysis. Median and average times spent completing the survey are very similar, and the completion times between men and women do not differ significantly overall (Table 3). Both women and men of the Reddit cohort tend to complete their surveys quicker than those from the general online cohort, but that difference is not significant. Median and average times spent on started but abandoned surveys were again similar between men and women (Table 3). While women of the Reddit cohort tend to abandon their surveys significantly faster than the general online cohort (p = 0.037), the difference among men was not significant.
When considering the Reddit cohorts, the average time spent to complete the survey did not significantly differ between the general, outdoor, adventure and mental health Reddit cohorts for men or women. Neither was a significant difference observed for the general, outdoor, adventure Reddit cohorts when considering the abandonment of the surveys. Respondents of the mental health sub-Reddits spent very significantly more time before they abandoned the survey than the general Reddit cohort (women p < 0.001; men p = 0.001), suggesting that commitment to the survey was much higher among the mental health Reddit cohort.
The average time spent on the survey progress is illuminating. The general Reddit cohorts will be considered first (Figure 10b). Graphing the average time invested in the survey against the number of pages completed shows that once the demographic questions (P2−P3) had been completed, in time spent increased in a near-linear fashion until the completion of the first randomly delivered activities page (R1), with an average time of 55 s between each page. The progress between the first and second randomly delivered activities page took on average 5 min and 52 s, while thereafter, the increase resumed being near-linear at twice the initial rate (1:55 min). The highly fluctuating standard deviation indicates variations in responses. The same time series curve for the general online cohorts shows significant differences (Figure 10a). The time spent increased in a broadly linear fashion until the completion of the first randomly delivered activities page (average 1:02 min), then increased sharply to R2 (9:48 min) and even more steeply to R3 (23:41 min), after which it dropped back (average 6:48 min).
To determine whether there is a linear pattern between the time invested in the (partial) completion of the survey and the point of abandonment, the time data are expressed in % of pages completed for each five-minute interval to 60 min, then in 30 min intervals (Table 4 and Table 5). The shading classes in the two figures are based on square-root transformed classes which provide a finer differentiation of the smaller values (Spennemann 1985). As the images clearly demonstrate, there is no discrete pattern. It is diffuse among female respondents (Table 4) and almost non-existent among male respondents (Table 5).

4. Discussion

This discussion will consider the possible effects on the attrition rate with regard to several key indicators: survey length and time investment, survey format, and survey delivery.

4.1. Effects of Survey Length and Time Investment on Participant Attrition

The survey under discussion had a total length of 1634 words, with another 300 words as participant information on the first page of the online form. Questionnaire length has been identified as a major constraint of survey completion (Hoerger 2010; Kato and Miura 2021; Liu and Wronski 2018; Mirta and Michael 2009; Robb et al. 2017), with some authors advocating surveys of less than 1000 words in length (Edwards 2002). Other authors, however, found the length to be less of a constraint (Robb et al. 2017) or even of an advantage (Koitsalu et al. 2018). Nuanced analysis suggests that the length of a questionnaire is not an issue where the respondent cohort perceives a sense of personal investment and agency in the outcomes of the research. (McCambridge et al. 2011). Where questions deviate from what participants expect to be the focus of the survey, attrition will occur (McCambridge et al. 2011).
In a comparative study of six surveys of college students, Hoerger found a near-immediate PAR of 6% after providing consent, with a PAR of 10% after the first dozen of questions, with a subsequent PAR of 2% per 100 extra survey items (Hoerger 2010). While the study is not fully compatible with the data discussed in this paper as the participants received course credits for completion, the initial 6% and the early 10% drop despite incentives is illuminating. Similar early increases in PAR were observed by other studies (Hochheimer et al. 2016).
The estimated survey time was either in the invitation to participate or on the participant information sheet. As this signals to the participant, the time investment that would be required, where stated, has a direct influence on the response rate (Mirta and Michael 2009). It has been argued that not providing an estimated survey time will increase the unit response rate (i.e., fully completed surveys) (Edwards 2002). Others note that it may have no effect on this (Lugtig and Luiten 2021) but may increase the item response rates due to partially completed surveys (Monroe and Adams 2012), although favoring questions asked early in the sequence. The approach advocated by the author’s institutional review board is to provide prospective participants with an estimated survey time as part of the informed consent of their burden. Consequently, this was included in the participation information sheet as well as on the first (consent) page of the online survey.
The effect of the inclusion of a progress bar on each of the online survey pages is contested. While some authors regard it as beneficial, (Couper et al. 2001; Sue and Ritter 2012) others argue it to be detrimental (Liu and Wronski 2018). A nuanced study showed that the actual survey length and the perceived length as estimated by the progress bar are interrelated, with surveys less likely to suffer from high PARs if they are ‘front loaded,’ that is that the user perceives a quick rate of progress early in the survey with subsequent slowing down as opposed a slow start and a subsequent increase in speed (Conrad et al. 2010).

4.2. Effects of Survey Format on Participant Attrition

The choice of the survey instrument has a direct effect on the participant attrition rate. The overall attrition rate was the highest for online surveys completed by the Reddit cohorts (PAR = 61.5%), followed by the non-Reddit cohorts (42.1%). In contrast, the final attrition rates for paper forms (16.3%) and PDF forms (12.8%) were much lower. As a caveat, it should be noted that it remains unknown how many participants looked at a paper-based or digital PDF questionnaire and never started it or how many commenced but terminated without submission. In hand are only those incomplete survey forms that were submitted physically or by e-mail.
Among the paper surveys that were submitted, the overwhelming majority had completed the first page, while the PAR dropped on the second page, especially after the first question related to specific activities. It can be posited that this is correlated with the increasing complexity of the survey question, with the survey form now requiring five responses per line (Appendix A). It is worth noting that the reduction in PAR among the paper forms is greater than among PDF forms. It may also be a factor that on the paper forms, the participants could cast their eyes down the page and quickly assess the effort required and then choose to answer in sequence, answer questions conceptually (i.e., answer whether they had participated in activities and then move to risk perception) or answer only selected elements, whereas the PDF version, which had drop boxes prefilled with a ‘0’ response (Appendix B), required the participants to answer line by line. This seems to suggest that once respondents had committed to a PDF form and its complexities, they persisted. As noted, the rate of non-submission cannot be estimated.
Among the online forms, the PAR shows an increase after P9, that is at the start of the activity-based questions, which could be observed among most cohorts of online surveys, regardless of age or gender (Figure 7, Figure 8 and Figure 9). The observed drop off after Page 9 may also be affected by an increase in complexity on the page. Until then, respondents only faced pages with standard radio buttons (Figure 11) to a page with multiple drop-down menus (Figure 12). This inflection point is not repeated in the curves of average time spent on progress. Here, the inflection point is between the first and second randomly delivered activities page.
While time data of the Reddit population suggest a hesitancy to progress beyond the first randomly delivered page (Figure 10b), this was extremely pronounced among the general online cohorts (Figure 10a). It is difficult to interpret this in the absence of post-survey interviews, but it can be surmised that users progressed from the first activities-focused question (P10) to the first randomized delivered page but then hesitated when presented with the third page of similarly complex questions. Given that the actual time to answer the randomized pages is not materially different, even when taking into account that respondents might require more time to answer activity groups they are less familiar with, the significant increase in time between R1 and R2 suggests that their enthusiasm flagged and they moved to other tasks, resuming and completing the survey later.
In order to be fully compatible with the paper- and PDF-based surveys modes, the online survey included no forced responses. That participants could skip questions and continue, leading to incomplete answers on some of the pages. It has been noted in the literature that forced answer designs have a higher completion rate (Tangmanee and Niruttinanon 2019). Conceptually, however, that assumes that the respondent is able to make an informed choice that fully captures the respondent’s view/perception. If this is not possible, random false responses will occur, or participants will abandon the survey out of frustration.

4.3. Effects of Gender on Participant Attrition

The two online cohorts show a gender bias, with male respondents significantly overrepresented both among the non-Reddit and in particular among the Reddit population (Table 2). Women, however, consistently exhibited a lower participation attrition rate than men, irrespective of the cohort. The underlying phenomenon appears to be social response bias, where women are more conscientious, agreeable to volunteer their time, more open to experiences and exhibit higher emotional stability to finish the questionnaire (Fan and Yan 2010).

4.4. Effects of Technology

Online surveys used to suffer from representativeness biases due to technology-related factors derived from information technology literacy and socio-economic realities with regard to the affordability of computer technology (Junco et al. 2010). The ubiquitous penetration of smartphones in the past five years has reduced this digital divide, with smartphone use now decreasing among people of the 65+ years age cohort (Stevic et al. 2021). Socio-economic issues are not a critical inhibiting factor in developed countries (Jamalova and Constantinovits 2020; Mouter et al. 2021) but remain at play in developing countries (Sharma et al. 2021).
Ideally, an online administered survey should be viewable and completable irrespective of the device (smartphone, tablet, PC) (Brosnan et al. 2017). Preferences vary by demographic, primarily overall economic capacity and age, with handheld devices, in particular smartphones, being preferred by younger users (Brosnan et al. 2017). Studies have shown that when larger screen devices are used, completion times are shorter (Nissen and Janneck 2019), the PAR is lower (Nissen and Janneck 2019; Wenz 2017), and the accuracy of responses may be higher (Kato and Miura 2021). Wenz also showed when grid-type questions are applied, data quality can vary between small and large devices (Wenz 2017).
The SurveyMonkey license as administered by Charles Sturt University allowed for automatic device optimization of the standard questions (P1–P9) (Figure 13a) but hid some of the responses on the activity-related pages (P10–P18) due to the width of the response frame (Figure 13b). This required either sideways scrolling or it could be overcome by turning the device sideways. Users were alerted to this in the invitation posts on Reddit, but not for general respondents.

4.5. Other Effects

The complexity, as well as the language used in the wording of questions, has a direct influence on survey commencement and completion (Sarantakos 2012). As the question complexity itself (unlike the format) did not change, this is unlikely to have affected the observed PAR patterns.
The analysis of the PAR based on place of origin seems to reveal a parochial bias, whereby the PAR is consistently lower among respondents from Australia and Oceania compared with respondents from Europe, the U.S.A. and Canada (Figure 9). This is particularly pronounced among respondents from mental health Reddits.

5. Conclusions

Participant attrition is a major concern for the validity of longer or complex surveys, in particular multi-page online surveys, which can capture responses from all completed pages until the time of abandonment or completion. Participant attrition will result in different item response rates, with questions asked near the tail end of the survey showing fewer completions. The reluctance of some respondents to persist until the end of the survey may cause a bias in the responses to questions asked later in the sequence.
While a sampling frame of cohorts drawn from Reddit is attractive as it allows to both target specific audience segments and to reach a larger and geographically more diverse audience, its reliability and usefulness for longer or complex surveys have been questioned. Data from a multi-page online survey administered to cohorts recruited on Reddit as well as recruited through standard channels with snowballing allows the assessment of participant attrition rates relative to the cohorts and, by implication, gauge their commitment to and engagement with a survey instrument.
While the demographics between the cohorts drawn from Reddit and those drawn by other means were broadly similar (and thus will not materially affect the study for which the data were collected for), the data also underline the previously reported geospatial boas inherent in the Reddit audience.
The study has shown that cohorts drawn from Reddit exhibit a higher PAR compared to cohorts targeted by other means.
Common to all cohorts was that the PAR was higher among younger respondents and among men. When considering the effects of survey length, time investment, survey format and complexity, and survey delivery on participant attrition, the greatest rise in PAR, irrespective of age, gender or cohort, was occasioned by changes in survey question design. It occurred when participants were asked activity-specific questions and were faced with a tabular layout containing drop-down boxes as opposed to a series of horizontally aligned radio buttons. The reduced item response rate bias this change in design introduced to the survey could in part be mitigated by the randomization of delivery of the activity-specific question groups (as pages). While participant attrition continued as these pages were delivered, the randomization of delivery ensured that any of the activity-specific question groups had a similar chance of being asked. This resulted in similar item response rates, which allows for a future, meaningful comparison of activities.
Future surveys need to balance the PAR caused by a tabular layout containing drop-down boxes against a PAR caused by an increased survey length if arrays of radio buttons have been used.

Funding

This research received no external funding.

Institutional Review Board Statement

The study was conducted in accordance with the Declaration of Helsinki, and was approved by Charles Sturt University Human Research Ethics Committee, Protocol number H19005, for the duration from 6 February 2019 to 3 February 2024. The study was also approved by the Institutional Review Board of the University of Guam, protocol number (P)CHRS# 21-41 for the duration from 22 April to 31 May 2021.

Informed Consent Statement

Informed consent was obtained from all subjects involved in the study.

Acknowledgments

The author is indebted to Gail Fuller (Spatial Analysis Network, Charles Sturt University) for converting the survey form to Survey Monkey, for creating a multitude of ‘clones’ with discrete URLs and for efficiently handling all technical details of data collection. Eden Suarez Galvez (Program Coordinator Graduate Admissions, University of Guam) kindly disseminated the survey and associated reminders through the University of Guam system. Julie Mushynsky (University of Regina, Regina, SK, Canada) administered the survey to students in her anthropology class. In particular, the author gratefully acknowledges the efforts of the 2019, 2020, and 2021 cohort students enrolled in the course ‘Social Psychology of Risk’ offered by Charles Sturt University (for a full listing of all names, see http://csusap.csu.edu.au/~dspennem/Risk/RiskProject.html, accessed on 29 March 2021).

Conflicts of Interest

The author declares no conflict of interest.

Appendix A. Page Images of the Paper-Based Questionnaire

Socsci 11 00031 g0a1
Socsci 11 00031 g0a2

Appendix B. Page Images of the PDF-Based Questionnaire

Socsci 11 00031 g0a3
Socsci 11 00031 g0a4

Appendix C. The Targeted Sub-Reddits

Table A1. The Targeted Sub-Reddits.
CodeSub-Reddit PostedSub-Reddit Not-Posted )
ADVENTURE: adventure activity specific sub-Reddits
CAVcaving
CLIcanyoneering, Indoorclimbing, mountaineeringbouldering, climbing
DIVdiving, freediving, scuba
INDindia, IndiaMain, IndianArmy, IndiaSpeaksIndian_Academia
KAYkayaking, rafting, whitewater
MBKbmx, cyclocross, dirtjumping, fatbike, gravelcycling, mountainbikes, mountainbiking, MTB, xbiking
SNOskiing, snowboarding
PARbasejumping, Hanggliding, SkyDiving
r2WheelsInTheSnow, adventures, BarefootRunning, bikecommuting, bungeejumping, Equestrian, freeflight, Gliding, rollercoasters, sailing, trailrunning, ultrarunning, WaterSkiingbicycletouring, bicycling, cycling; wintercycling
SLU *streetluge
SP02advrider
SP05longboarding, skateboarding
SURkiteboarding, windsurfingsurfing
OUTDOOR: outdoor activity related sub-Reddits
OUTAdirondacks, alaska, AppalachianTrail, CampAndHikeMichigan, coloradohikers, hiking, NationalPark, NCTrails, Outdoor, Outdoors, OutdoorScotland, PacificCrestTrail, PhysicalEducation, PNWhiking, snowshoeing, socalhiking, Survival, TrekkingItaly, UKhiking, vancouverhiking, WAOutdoors, Wilderness, WildernessBackpacking, Yosemitearizonatrail, backpacking, camping, CampingandHiking, norcalhiking, sports, TrailGuides, walking,
MENTAL HEALTH: Mental illness and other disability related sub-Reddits
SP07deaf, disability, disabled, hardofhearing, hearing, HearingAids, spinalcordinjuries
SP08BipolarSOs (self)bipolar, bipolar2,
SP09Veterans
STr01DID
STr02depression, mentalillness, PTSD
STr03TBI
STr04malementalhealth, MentalHealthUKmentalhealth
STr05adhd
STr07BipolarSOs (support person)
STr08TBI (support)
STr09OCD
STr10AvPDBPD
STr11autism (self), neurodiversity
STr13autism (support person)
Phobia related sub-Reddits
SP01 *acrophobiaclaustrophobia, socialanxiety
SP02thalassohobia
SP04anxiety, Phobia
STr06claustrophobia
GENERAL: general and research-related sub-Reddits
OSself, SeriousConversationCasualConversation, socialskills
SP01 *NoStupidQuestions
SP03psychology, psychologystudents, SampleSizeTeachers
SLU *britishmilitary, RoyalAirForceAirForce, AustralianMilitary, britisharmy, CanadianForces, Military
Str09shamelessplug
SP06country-specific sub-Reddits:
brasil, Jamaica, karachi, Kashmiri, Namibia, Nigeria, pakistan, south Africa, sudan, tanzania
Kenya, Philippines
The collectors marked with a * were re-used for different sub-Reddits where the responses to a single question would allow for positive discrimination either by participation (SLU) or by perception scoring (SP01).—) posts requests which were declined or removed by moderators or where moderators were unresponsive (inactive forums).

References

  1. Achimescu, Vlad, and Pavel Dimitrov Chachev. 2021. Raising the Flag: Monitoring User Perceived Disinformation on Reddit. Information 12: 4. [Google Scholar] [CrossRef]
  2. Albayearak, Tahir, and Meltem Caber. 2017. A motivation-based segmentation of holiday tourists participating in white-water rafting. Journal of Destination Marketing & Management 9: 64–7. [Google Scholar] [CrossRef]
  3. Almerekhi, Hind, Bernard J. Jansen, and Haewoon Kwak. 2020. Investigating Toxicity Across Multiple Reddit Communities, Users, and Moderators. In Paper presented at the Companion Proceedings of the Web Conference 2020, Taipei, Taiwan, April 20–24. [Google Scholar]
  4. Amaya, Ashley, Ruben Bach, Florian Keusch, and Frauke Kreuter. 2019. New data sources in social science research: Things to know before working with Reddit data. Social Science Computer Review 39: 943–60. [Google Scholar] [CrossRef]
  5. Balalau, Oana, and Roxana Horincar. 2021. From the Stage to the Audience: Propaganda on Reddit. In Proceedings of the 16th Conference of the European Chapter of the Association for Computational Linguistics: Main Volume. Stroudsburg: Association for Computational Linguistics. [Google Scholar]
  6. Balsamo, Duilio, Paolo Bajardi, Alberto Salomone, and Rossano Schifanella. 2021. Patterns of Routes of Administration and Drug Tampering for Nonmedical Opioid Consumption: Data Mining and Content Analysis of Reddit Discussions. Journal of Medical Internet Research 23: e21212. [Google Scholar] [CrossRef]
  7. Brosnan, Kylie, Bettina Grün, and Sara Dolnicar. 2017. PC, Phone or Tablet?: Use, preference and completion rates for web surveys. International Journal of Market Research 59: 35–55. [Google Scholar]
  8. Brown, Pike, and Stephen Knowles. 2019. Cash Is Not King in Incentivising Online Surveys. Dunedin: University of Otago. [Google Scholar]
  9. Buckley, Ralf. 2012. Rush as a key motivation in skilled adventure tourism: Resolving the risk recreation paradox. Tourism Management 33: 961–70. [Google Scholar] [CrossRef] [Green Version]
  10. Bunting, Amanda M., David Frank, Joshua Arshonsky, Marie A. Bragg, Samuel R. Friedman, and Noa Krawczyk. 2021. Socially-supportive norms and mutual aid of people who use opioids: An analysis of Reddit during the initial COVID-19 pandemic. Drug and Alcohol Dependence 222: 108672. [Google Scholar] [CrossRef]
  11. Caber, Meltem, and Tahir Albayearak. 2016. Push or pull? Identifying rock climbing tourists’ motivations. Tourism Management 55: 74–84. [Google Scholar] [CrossRef]
  12. Carron-Arthur, Bradley, John A. Cunningham, and Kathleen M. Griffiths. 2014. Describing the distribution of engagement in an Internet support group by post frequency: A comparison of the 90-9-1 Principle and Zipf’s Law. Internet Interventions 1: 165–8. [Google Scholar] [CrossRef] [Green Version]
  13. Choga, Ngonidzashe Nicholas. 2019. The Effects of Monetary and Non-Monetary Incentives on Respondent Attrition in Longitudinal Survey. Marter’s thesis, Faculty of Science, University of Cape Town, Cape Town, South Africa. [Google Scholar]
  14. Conrad, Frederick G., Mick P. Couper, Roger Tourangeau, and Andy Peytchev. 2010. The impact of progress indicators on task completion. Interacting with Computers 22: 417–27. [Google Scholar] [CrossRef] [Green Version]
  15. Cook, Colleen, Fred Heath, and Russel L. Thompson. 2000. A Meta-Analysis of Response Rates in Web- or Internet-Based Surveys. Educational and Psychological Measurement 60: 821–36. [Google Scholar] [CrossRef]
  16. Copland, Simon. 2020. Reddit quarantined: Can changing platform affordances reduce hateful material online? Internet Policy Review 9: 1–26. [Google Scholar] [CrossRef]
  17. Couper, Mick P., Michael W. Traugott, and Mark J. Lamias. 2001. Web survey design and administration. Public Opinion Quarterly 65: 230–53. [Google Scholar] [CrossRef] [PubMed]
  18. Dillman, Don A., Jolene D. Smyth, and Leah Melani Christian. 2009. Mail and Internet Surveys: The Tailored Design Method, 3rd ed. New York: John Wiley and Sons. [Google Scholar]
  19. Dosono, Bryan, Bryan Semaan, and Jeff Hemsley. 2017. Exploring AAPI identity online: Political ideology as a factor affecting identity work on Reddit. Paper presented at the 2017 CHI Conference Extended Abstracts on Human Factors in Computing Systems, Denver, CO, USA, May 6–11. [Google Scholar]
  20. Duggan, Maeve, and Aaron Smith. 2013. 6% of online adults are reddit users. Pew Internet & American Life Project 3: 1–10. [Google Scholar]
  21. Duguay, Philippe A. 2021. Read it on Reddit: Homogeneity and Ideological Segregation in the Age of Social News. Social Science Computer Review. [Google Scholar] [CrossRef]
  22. Edwards, P. 2002. Increasing response rates to postal questionnaires: Systematic review. Bristih Medical Journal 324: 1183. [Google Scholar] [CrossRef] [Green Version]
  23. Ewert, Alan, Ken Gilbertson, Yuan-Chun Luo, and Alison Voight. 2013. Beyond “because it is there”: Motivations for pursuing adventure recreation activities. Journal of Leisure Research 44: 91–111. [Google Scholar] [CrossRef]
  24. Fan, Weimiao, and Zheng Yan. 2010. Factors affecting response rates of the web survey: A systematic review. Computers in Human Behavior 26: 132–9. [Google Scholar] [CrossRef]
  25. Finlay, S. Craig. 2014. Age and gender in Reddit commenting and success. Journal of Information Science Theory and Practice 2: 18–28. [Google Scholar] [CrossRef]
  26. Gaffney, Devin, and J. Nathan Matias. 2018. Caveat emptor, computational social science: Large-scale missing data in a widely-published Reddit corpus. PLoS ONE 13: e0200162. [Google Scholar] [CrossRef] [Green Version]
  27. Gasparini, Mattia, Robert Clarisó, Marco Brambilla, and Jordi Cabot. 2020. Participation Inequality and the 90-9-1 Principle in Open Source. Paper presented at 16th International Symposium on Open Collaboration, Virtual, August 26–27. [Google Scholar]
  28. Gaudette, Tiana, Ryan Scrivens, Garth Davies, and Richard Frank. 2020. Upvoting extremism: Collective identity formation and the extreme right on Reddit. New Media & Society 23: 3491–508. [Google Scholar]
  29. Glenski, Maria, Corey Pennycuff, and Tim Weninger. 2017. Consumers and curators: Browsing and voting patterns on reddit. IEEE Transactions on Computational Social Systems 4: 196–206. [Google Scholar] [CrossRef] [Green Version]
  30. Glenski, Maria, Emily Saldanha, and Svitlana Volkova. 2019. Characterizing speed and scale of cryptocurrency discussion spread on reddit. Paper presented at the World Wide Web Conference, WWW ’19, San Francisco, CA, USA, May 13–17. [Google Scholar]
  31. Hochheimer, Camille J., Roy T. Sabo, Alex H. Krist, Teresa Day, John Cyearus, and Steven H. Woolf. 2016. Methods for evaluating respondent attrition in web-based surveys. Journal of Medical Internet Research 18: e301. [Google Scholar] [CrossRef]
  32. Hochheimer, Camille J., Roy T. Sabo, Robert A. Perera, Nitai Mukhopadhyay, and Alex H. Krist. 2019. Identifying attrition phases in survey data: Applicability and assessment study. Journal of Medical Internet Research 21: e12811. [Google Scholar] [CrossRef] [PubMed]
  33. Hoerger, Michael. 2010. Participant dropout as a function of survey length in Internet-mediated university studies: Implications for study design and voluntary participation in psychological research. Cyberpsychology, Behavior, and Social Networking 13: 697–700. [Google Scholar] [CrossRef] [Green Version]
  34. Holm, Michelle R., Peter Lugosi, Robertico R. Croes, and Edwin N. Torres. 2017. Risk-tourism, risk-taking and subjective well-being: A review and synthesis. Tourism Management 63: 115–22. [Google Scholar] [CrossRef] [Green Version]
  35. Jamalova, Maral, and Milán György Constantinovits. 2020. Smart for development: Income level as the element of smartphone diffusion. Management Science Letters 10: 1141–50. [Google Scholar] [CrossRef]
  36. Jhaver, Shagun, Iris Birman, Eric Gilbert, and Amy Bruckman. 2019. Human-machine collaboration for content regulation: The case of Reddit Automoderator. ACM Transactions on Computer-Human Interaction (TOCHI) 26: 1–35. [Google Scholar] [CrossRef]
  37. Junco, Reynol, Dan Merson, and Daniel W. Salter. 2010. The effect of gender, ethnicity, and income on college students’ use of communication technologies. Cyberpsychology, Behavior, and Social Networking 13: 619–27. [Google Scholar] [CrossRef] [PubMed]
  38. Kato, Takumi, and Taro Miura. 2021. The impact of questionnaire length on the accuracy rate of online surveys. Journal of Marketing Analytics 9: 1–16. [Google Scholar] [CrossRef]
  39. Khadjesari, Zarnie, Elizabeth Murray, Eleftheria Kalaitzaki, Ian R. White, Jim McCambridge, Simon G. Thompson, Paul Wallace, and Christine Godfrey. 2011. Impact and costs of incentives to reduce attrition in online trials: Two randomized controlled trials. Journal of Medical Internet Research 13: e26. [Google Scholar] [CrossRef] [PubMed]
  40. Kilgo, Danielle K., Yee Man Margaret Ng, Martin J. Riedl, and Ivan Lacasa-Mas. 2018. Reddit’s veil of anonymity: Predictors of engagement and participation in media environments with hostile reputations. Social Media+ Society 4: 2056305118810216. [Google Scholar] [CrossRef] [Green Version]
  41. Koitsalu, Marie, Martin Eklund, Jan Adolfsson, Henrik Grönberg, and Yvonne Brandberg. 2018. Effects of pre-notification, invitation length, questionnaire length and reminder on participation rate: A quasi-randomised controlled trial. BMC Medical Research Methodology 18: 3. [Google Scholar] [CrossRef] [Green Version]
  42. Liu, Mingnan, and Laura Wronski. 2018. Examining completion rates in web surveys via over 25,000 real-world surveys. Social Science Computer Review 36: 116–24. [Google Scholar] [CrossRef] [Green Version]
  43. Lu, John, Sumati Sridhar, Ritika Pandey, Mohammad Al Hasan, and Georege Mohler. 2019. Investigate transitions into drug addiction through text mining of Reddit data. Paper presented at the 25th ACM SIGKDD International Conference on Knowledge Discovery & Data Mining, Anchorage, AK, USA, August 4–8. [Google Scholar]
  44. Lugtig, Peter, and Annemieke Luiten. 2021. Do shorter stated survey length and inclusion of a QR code in an invitation letter lead to better response rates? Survey Methods: Insights from the Field (SMIF). Available online: https://surveyinsights.org/?p=14216 (accessed on 29 March 2021).
  45. Maria Gstaettner, Anna, Kate Rodger, and Diane Lee. 2017. Visitor perspectives of risk management in a natural tourism setting: An application of the Theory of Planned Behaviour. Journal of Outdoor Recreation and Tourism 19: 1–10. [Google Scholar] [CrossRef]
  46. McCambridge, Jim, Eleftheria Kalaitzaki, Ian R. White, Zarnie Khadjesari, Elizabeth Murray, Stuart Linke, Simon G. Thompson, Christine Godfrey, and Paul Wallace. 2011. Impact of length or relevance of questionnaires on attrition in online trials: Randomized controlled trial. Journal of Medical Internet Research 13: e96. [Google Scholar] [CrossRef]
  47. Mirta, Galesic, and Bosnjak Michael. 2009. Effects of Questionnaire Length on Participation and Indicators of Response Quality in a Web Survey. Public Opinion Quarterly 73: 349–60. [Google Scholar] [CrossRef]
  48. Monroe, Martha C., and Damian C. Adams. 2012. Increasing response rates to web-based surveys. Journal of Extension 50: 6–7. [Google Scholar]
  49. Moore, Carrie, and Lisa Chuang. 2017. Redditors revealed: Motivational factors of the Reddit community. Paper presented at the 50th Hawaii International Conference on System Sciences, Village, HI, USA, January 4–7. [Google Scholar]
  50. Mouter, Niek, Marion Collewet, G. Ardine de Wit, Adrienne Rotteveel, Mattijs S. Lambooij, and Roselinde Kessels. 2021. Societal Effects Are a Major Factor for the Uptake of the Coronavirus Disease 2019 (COVID-19) Digital Contact Tracing App in The Netherlands. Value in Health 24: 658–67. [Google Scholar] [CrossRef]
  51. Naidoo, Paidoo, P. Ramseook-Munhurrun, N. Vanessa Seebaluck, and Sharone Janvier. 2015. Investigating the Motivation of Baby Boomers for Adventure Tourism. Procedia-Social and Behavioral Sciences 175: 244–51. [Google Scholar] [CrossRef] [Green Version]
  52. Nissen, Helge, and Monique Janneck. 2019. Does User Choice of Device Impact the Results of Online Surveys?: An Analysis of the Effects of Screen Widths and Questionnaire Layouts. International Journal of End-User Computing and Development 8: 1–17. [Google Scholar] [CrossRef]
  53. Okon, Edidiong, Vishnutheja Rachakonda, Hyo Jung Hong, Chris Callison-Burch, and Jules B. Lipoff. 2020. Natural language processing of Reddit data to evaluate dermatology patient experiences and therapeutics. Journal of the American Academy of Dermatology 83: 803–8. [Google Scholar] [CrossRef]
  54. Patel, Sahil. 2020. Reddit Claims 52 Million Daily Users, Revealing a Key Figure for Social-Media Platforms. Wall Street Journal, December 1. [Google Scholar]
  55. Pomfret, Gill. 2011. Package mountaineer tourists holidaying in the French Alps: An evaluation of key influences encouraging their participation. Tourism Management 32: 501–10. [Google Scholar] [CrossRef] [Green Version]
  56. Potter, Martin. 2021. Bad actors never sleep: Content manipulation on Reddit. Continuum 35: 706–18. [Google Scholar] [CrossRef]
  57. Robb, Kathryn A., Lauren Gatting, and Jane Wardle. 2017. What impact do questionnaire length and monetary incentives have on mailed health psychology survey response? British Journal of Health Psychology 22: 671–85. [Google Scholar] [CrossRef] [PubMed]
  58. Robinson-Cimpian, Joseph P. 2014. Inaccurate estimation of disparities due to mischievous responders: Several suggestions to assess conclusions. Educational Researcher 43: 171–85. [Google Scholar] [CrossRef]
  59. Sarantakos, Sotirios. 2012. Social Research, 4th ed. Basingstoke: Macmillan International Higher Education. [Google Scholar]
  60. Sharma, Nandini, Saurav Basu, and Pragya Sharma. 2021. Sociodemographic determinants of the adoption of a contact tracing application during the COVID-19 epidemic in Delhi, India. Health Policy and Technology 10: 100496. [Google Scholar] [CrossRef]
  61. Shatz, Itamar. 2017. Fast, free, and targeted: Reddit as a source for recruiting participants online. Social Science Computer Review 35: 537–49. [Google Scholar] [CrossRef]
  62. SimilarWeb. 2021. Reddit.com April 2021 Overview. Available online: https://www.similarweb.com/website/reddit.com/ (accessed on 10 May 2021).
  63. Spennemann, Dirk H.R. 1985. Shaded Graphs of Skeletons: A Plea for Standardization. New Zealand Archaeological Association Newsletter 28: 184–86. [Google Scholar]
  64. Squirrell, Tim. 2019. Platform dialectics: The relationships between volunteer moderators and end users on reddit. New Media & Society 21: 1910–27. [Google Scholar]
  65. Staudt Willet, K. Bret, and Jeffrey P. Carpenter. 2020. Teachers on Reddit? Exploring contributions and interactions in four teaching-related subreddits. Journal of Research on Technology in Education 52: 216–33. [Google Scholar] [CrossRef]
  66. Stevic, Anja, Desirée Schmuck, Jörg Matthes, and Kathrin Karsay. 2021. ‘Age Matters’: A panel study investigating the influence of communicative and passive smartphone use on well-being. Behaviour & Information Technology 40: 176–90. [Google Scholar]
  67. Sue, Valerie M., and Lois A. Ritter. 2012. Conducting Online Surveys. Los Angeles: Sage. [Google Scholar]
  68. Tangmanee, Chatpong, and Phattharaphong Niruttinanon. 2019. Web Survey’s Completion Rates: Effects of Forced Responses, Question Display Styles, and Subjects’ Attitude. International Journal of Research in Business and Social Science (2147-4478) 8: 20–29. [Google Scholar] [CrossRef] [Green Version]
  69. Tankovska, H. 2020a. Reddit Usage in Finland in 2020, by Frequency. Available online: https://www.statista.com/statistics/1058811/reddit-usage-frequency-in-finland/ (accessed on 29 March 2021).
  70. Tankovska, H. 2020b. Reddit Usage in Sweden in 2020, by Frequency. Available online: https://www.statista.com/statistics/860453/reddit-usage-by-frequency-sweden/ (accessed on 29 March 2021).
  71. Tankovska, H. 2020c. Reddit Usage in Norway in 2020, by Frequency. Available online: https://www.statista.com/statistics/1058795/reddit-usage-frequency-in-norway/ (accessed on 29 March 2021).
  72. Tankovska, H. 2020d. Reddit Usage in Denmark in 2020, by Frequency. Available online: https://www.statista.com/statistics/860438/reddit-usage-frequency-in-denmark/ (accessed on 29 March 2021).
  73. Tankovska, H. 2021a. Reddit Usage Reach in the United States 2019, by Annual Household Income. Available online: https://www.statista.com/statistics/261774/share-of-us-internet-users-who-use-reddit-by-annual-income/ (accessed on 29 March 2021).
  74. Tankovska, H. 2021b. Reddit Usage Reach in the United States 2019, by Education. Available online: https://www.statista.com/statistics/261776/share-of-us-internet-users-who-use-reddit-by-education-level/ (accessed on 29 March 2021).
  75. Tankovska, H. 2021c. Reddit Usage Reach in the United States 2019, by Gender. Available online: https://www.statista.com/statistics/261765/share-of-us-internet-users-who-use-reddit-by-gender/ (accessed on 29 March 2021).
  76. Tankovska, H. 2021d. Reddit Usage Reach in the United States 2019, by Age Group. Available online: https://www.statista.com/statistics/261766/share-of-us-internet-users-who-use-reddit-by-age-group/ (accessed on 29 March 2021).
  77. Tankovska, H. 2021e. Reddit Usage Reach in the United States 2019, by Urbanity. Available online: https://www.statista.com/statistics/261783/share-of-us-internet-users-who-use-reddit-by-urbanity/ (accessed on 29 March 2021).
  78. Tankovska, H. 2021f. Frequency of Reddit Use in the United States as of 3rd Quarter 2020. Available online: https://www.statista.com/statistics/815177/reddit-usage-frequency-usa/ (accessed on 29 March 2021).
  79. Tankovska, H. 2021g. Regional Distribution of Desktop Traffic to Reddit.com as of December 2020, by Country. Available online: https://www.statista.com/statistics/325144/reddit-global-active-user-distribution/ (accessed on 29 March 2021).
  80. Tankovska, H. 2021h. Reddit Usage Reach in the United States 2019, by Ethnicity. Available online: https://www.statista.com/statistics/261770/share-of-us-internet-users-who-use-reddit-by-ethnicity/ (accessed on 29 March 2021).
  81. Van Mierlo, Trevor. 2014. The 1% rule in four digital health social networks: An observational study. Journal of Medical Internet Research 16: e33. [Google Scholar] [CrossRef]
  82. Wang, Lei, Yongcheng Zhan, Qiudan Li, Daniel D Zeng, Scott J. Leischow, and Janet Okamoto. 2015. An examination of electronic cigarette content on social media: Analysis of e-cigarette flavor content on Reddit. International Journal of Environmental Research and Public Health 12: 14916–35. [Google Scholar] [CrossRef] [PubMed] [Green Version]
  83. Ward, M. K., Adam W. Meade, Christopher M. Allred, Gabriel Pappalardo, and J. William Stoughton. 2017. Careless response and attrition as sources of bias in online survey assessments of personality traits and performance. Computers in Human Behavior 76: 417–30. [Google Scholar] [CrossRef]
  84. Wenz, Alexander. 2017. Completing Web Surveys on Mobile Devices: Does Screen Size Affect Data Quality? ISER Working Paper Series 2017-05; Wiesbaden: Springer. [Google Scholar]
  85. Yang, Elaine Chiao Ling, Catheryn Khoo-Lattimore, and Charles Arcodia. 2017. A systematic literature review of risk and gender research in tourism. Tourism Management 58: 89–100. [Google Scholar] [CrossRef] [Green Version]
  86. Zhou, Haotian, and Ayelet Fishbach. 2016. The pitfall of experimenting on the web: How unattended selective attrition leads to surprising (yet false) research conclusions. Journal of Personality and Social Psychology 111: 493. [Google Scholar] [CrossRef] [Green Version]
Figure 1. Flow chart showing the arrangement of pages as delivered by Survey Monkey.
Socsci 11 00031 g001
Figure 2. Example of a call for participation on a sub-Reddit (canyoneering in this instance).
Socsci 11 00031 g002
Figure 3. Sampling vs. participant universe of a sub-Reddit.
Socsci 11 00031 g003
Figure 4. Age structure of the Reddit respondent population by gender. (a) men; (b) women (The general category includes all sub-Reddits not classified as adventure, outdoor or mental health).
Socsci 11 00031 g004
Figure 5. Differences in participant attrition between various modes of submission.
Socsci 11 00031 g005
Figure 6. Differences in participant attrition by mode of submission and gender. (a) paper and pdf submission; (b) Reddit and non-Reddit online cohorts.
Socsci 11 00031 g006
Figure 7. Differences in participant attrition among online survey respondents between major sub-Reddit cohort groups. The curve for non-Reddit online surveys is shown for comparison. (a) Men; (b) Women.
Socsci 11 00031 g007
Figure 8. Differences in participant attrition among male respondents by age group for general and Reddit cohorts. (a) Men—General online cohorts, (b) Men—Reddit cohorts, (c) Women—General online cohorts, (d) Women—Reddit cohorts.
Socsci 11 00031 g008
Figure 9. Differences in participant attrition respondents by country of origin for general and Reddit cohorts. (a) General online cohorts, (b) General Reddit cohorts, (c) adventure and outdoor Reddit cohorts, (d) mental health Reddit cohorts.
Socsci 11 00031 g009
Figure 10. Average time invested in the survey against the number of pages completed (solid line: average time; dashed lines 1 σ variation). (a) General online cohorts, (b) Reddit cohorts.
Socsci 11 00031 g010
Figure 11. Layout of pages asking attitudinal questions (Pages 4 to 9) as viewed on a computer screen.
Socsci 11 00031 g011
Figure 12. Layout of pages asking questions related to specific activities (Pages 10 to 18) as viewed on a computer screen.
Socsci 11 00031 g012
Figure 13. Layout of pages as viewed on a smartphone screen. (a) attitudinal questions (Pages 4 to 9); (b) questions related to specific activities (Pages 10 to 18).
Socsci 11 00031 g013
Table 1. Participation statistics of a Reddit poll.
Sub-RedditRegistered Users in the Sub-RedditAverage % of Registered
Users Online
Total of Poll ParticipantsPoll Participants in % of Registered UsersPoll Participants in % of Average Number of Registered Users Online
bmx38,2000.585640.16828.6
cyclocross18,0000.266540.300112.9
dirtjumping59000.538360.610113.4
fatbike89000.465490.551118.4
fixed gear69,1000.5391400.20337.6
gravelcycling45,0000.628970.21634.3
mountainbiking86,2000.283710.08229.1
MTB223,0000.7071700.07610.8
single speed66000.1051001.5151440.0
xbiking35,8000.499880.24649.2
Table 2. Gender and age breakdown of the Reddit and non-Reddit respondent population.
RedditNon-Reddit
MenWomennMenWomenn
16–1977.322.724268.831.316
20–2474.425.668767.332.755
25–2973.426.680464.135.964
30–3476.024.066354.245.848
35–3977.522.536440.859.249
40–4481.818.224246.453.628
45–4981.518.513052.048.025
50–5478.621.411748.451.631
55–5969.830.26346.253.826
60–6464.635.44847.452.619
65–6988.211.81730.070.010
70+100.00.0437.562.58
All75.824.2338153.646.4379
Table 3. Time spent completing the survey in minutes and seconds (format hh:ss).
WomenMen
(a) CompleteMedianAvg ± StDevMin–MaxNMedianAvg ± StDevMin–Maxn
Non-Reddit22:5626:31 ± 14:1911:58–114:2811222:4628:17 ± 18:3811:10–118:25109
General Reddit20:0523:50 ± 11:458:41–70:1010721:4425:08 ± 13:186:46–99:12230
Outdoor21:4523:42 ± 10:018:10–69:2511421:4225:17 ± 15:097:54–111:06220
Adventure20:3024:46 ± 15:226:26–115:2212321:1224:31 ± 13:285:23–112:33545
Mental Health21:1523:08 ± 19:0313:26–35:272622:5922:37 ± 8:307:51–31:3214
Total21:4124:53 ± 13.336:26–115:2248721:4225:08 ± 14.195:23–118:251122
(b) IncompleteMedianAvg ± StDevMin–MaxnMedianAvg ± StDevMin–Maxn
Non-Reddit07:2013:22 ± 16:591:03–98:27588:5612:45 ± 14:041:00–87:3383
General Reddit5:498:23 ± 7:410:41–46:561256:4310:28 ± 14:120:37–108:44312
Outdoor7:1810:05 ± 11:450:54–103:531247:0310:24 ± 12:420:55–108:03309
Adventure8:0110:47 ± 12:281:11–106:401037:2910:38 ± 11:500:40–104:44802
Mental Health10:0713:26 ± 9:181:24–37:556914:4818:28 ± 15:431:07–86:2265
Total7:3010:40 ± 11.320:41–106:404897:2610:59 ± 12:460:37–108:441584
Table 4. Relative completion of the survey against time invested in the survey: female respondents.
P2P3P4P5P6P7P8P9P10R1R2R3R3R5R6R7n
52.219.47.85.013.37.28.329.44.42.20.6 180
10 1.3 2.61.317.929.819.912.64.02.61.31.35.3151
15 0.7 4.06.78.110.74.06.72.74.751.7149
20 0.61.20.63.02.44.22.47.977.6165
25 0.8 0.80.84.610.782.4131
30 1.1 1.11.11.12.212.281.190
35 2.4 2.4 2.492.741
40 4.3 8.7 4.382.623
45 12.5 87.58
50 12.5 87.58
55 12.5 12.5 12.5 12.550.08
60 100.05
90 11.188.99
120 12.5 12.5 12.5 62.58
150 20.020.0 60.05
180 4.24.28.3 4.28.370.824
Socsci 11 00031 i001 0.01–2.0; Socsci 11 00031 i002 2.1–8.2; Socsci 11 00031 i003 8.3–18.4; Socsci 11 00031 i004 18.5–32.7; Socsci 11 00031 i005 32.8–51.0; Socsci 11 00031 i006 51.1–73.5; Socsci 11 00031 i007 73.6–100.
Table 5. Relative completion of the survey against time invested in the survey: male respondents.
P2P3P4P5P6P7P8P9P10R1R2R3R3R5R6R7n
51.723.411.59.99.48.54.422.16.22.40.2 0.2 0.2585
100.2 0.81.11.53.217.631.520.411.34.02.11.50.64.2476
15 0.20.2 2.46.211.511.58.67.94.55.041.9418
20 0.2 0.20.72.11.92.44.04.85.57.171.0420
25 0.3 0.3 2.91.31.61.91.62.62.67.777.3313
30 0.5 1.11.12.61.61.10.55.386.2189
35 1.80.9 1.8 1.83.66.483.6110
40 2.42.42.4 2.4 4.985.441
452.22.2 2.2 11.1 2.24.48.966.745
50 4.5 9.14.54.5 4.54.5 4.563.622
55 6.76.713.373.315
60 20.010.0 10.020.040.010
90 2.7 2.7 16.28.12.75.45.456.837
120 4.0 16.0 4.04.04.04.064.025
150 12.5 12.56.3 68.816
180 1.7 1.75.05.01.75.06.75.01.73.363.360
Socsci 11 00031 i001 0.01–2.0; Socsci 11 00031 i002 2.1–8.2; Socsci 11 00031 i003 8.3–18.4; Socsci 11 00031 i004 18.5–32.7; Socsci 11 00031 i005 32.8–51.0; Socsci 11 00031 i006 51.1–73.5; Socsci 11 00031 i007 73.6–100.
Publisher’s Note: MDPI stays neutral with regard to jurisdictional claims in published maps and institutional affiliations.

