Abstract
While sex ratios at birth (SRB) have been shown to vary within and across populations, after over a century of research, explanations have remained elusive. A variety of ecological, demographic, economic, and social variables have been evaluated, yet their association with SRB has been equivocal. Here, in an attempt to shed light on this unresolved topic within the literature, we approach the question of what drives variation in SRB using detailed longitudinal data spanning the frontier-era to the early 20th century in a population from the US state of Utah. Using several measures of environmental harshness, we find that fewer boys are born during challenging times. However, these results hold only for the frontier-era and not into a period of rapid economic and infrastructure development. We argue that the mixed state of the literature may result from the impact and frequency of exogenous stressors being dampened due to industrialization.
1. Introduction
The ratio of male-to-female live births (sex ratio at birth, SRB; also known as the secondary sex ratio) for humans is male-biased (~1.05), yet SRB varies considerably both across time and place (James 1987). While this pattern has been well-documented, understanding why this variation occurs has been labeled as one of the most elusive concepts in the life sciences today (Pavic 2015). One well-developed line of inquiry targets ambient stressors as drivers of SRB outcomes given that prenatal stress is expected to negatively affect developing males more so than females (Schacht et al. 2019). However, from across social science disciplines, a variety of demographic, economic, and ecological variables have been evaluated, producing mixed findings (Lydersen 2007; Ruckstuhl et al. 2010; Song 2012; Stein et al. 2004; Zhao et al. 2013). A key consideration for this ambiguity is that living conditions in industrial societies (e.g., infrastructure development) may blunt possible adverse consequences associated with exogenous shocks (e.g., drought) due to connectivity between populations facilitating the flow of resources (Scalone and Rettaroli 2015). Fertility patterns within these societies too may contribute to the mixed state of literature, whereby the demographic transition and lower fertility limit our ability to detect patterns that may be clearer in natural fertility populations (Davis 1986). It is with these critiques in mind that we examine environmental drivers of variation in SRB using detailed, longitudinal historical data (births from 1851–1919) spanning a period encompassing natural fertility conditions for a US population. Specifically, we target novel measures of environmental quality on SRB across a time period of transitioning economic development: from subsistence agriculture to rapid industrialization.
Males experience higher rates of mortality across nearly all stages of development (Andreev 2000). This bias is particularly heightened during the prenatal period (male-biased fetal losses regularly outnumber those of females by 9 to 20 percent; Ammon et al. 2012) and is argued to be driven by their need for greater metabolic investments from mothers to survive (Tamimi et al. 2003; Harrell et al. 2008). Consequently, sources of maternal and/or environmental stress are expected to negatively affect males more so than females, earning them the moniker ‘frail males.’ Indeed, a growing body of research shows that following ambient stressors, SRB falls below expected levels. For example, findings from historical populations indicate that the type of shock associated with male-biased fetal loss ranges widely and includes famine, temperature swings, earthquakes, volcanic eruptions, and pandemics (Helle et al. 2009; Catalano et al. 2008; Fukuda et al. 1998; Casey et al. 2019; Schacht et al. 2019).
Results from studies on contemporary populations are more mixed, however. While some researchers examining 21st century stressors, such as terrorist attacks (Bruckner et al. 2010) and economic downturns (Catalano et al. 2005), have found SRB to fall after these events (i.e., fewer boys were born), other researchers found no relationship (e.g., Lydersen 2007). As noted, the presumed mechanism driving these associations involves elevated male frailty in utero. Unexpected sources of prenatal stress may more acutely affect frail male fetuses, reducing the number of male births relative to female births (Bruckner et al. 2013). However, in the modern era, fertility control and declining family sizes may decrease our ability to detect an effect (Davis 1986). Son-preference may also play a role, particularly where families seek to end reproduction after producing a boy and/or sex-selective practices are employed (female-biased abortions, infanticide; Hesketh and Min 2012). An additional consideration is the role of economic development on SRB. Both the impact and frequency of ambient stressors are likely diminished in industrial societies, as market integration and economic development blunt exogenous shocks, particularly those driven by resource scarcity (Scalone and Rettaroli 2015). Moreover, nutritional profiles are expected to improve with infrastructure development (i.e., individuals will be better nourished), making the population as a whole more resilient in the face of short-term resource scarcity (Cai and Feng 2005). Accordingly, infrastructure development, which allows for a more regular distribution of goods and access to health care, may play a crucial role in moderating how environmental stressors affect SRB.
Here, we analyze a longitudinal dataset (1851–1919) from the US state of Utah that spans the frontier era to a period of rapid economic and infrastructure development. The completion of the Trans-Continental Railroad in 1869 (this event is often referred to as the Golden Spike) initiated a period of industrialization that reduced the population’s reliance on subsistence agriculture by linking Utah’s previously insular economy to that of the larger national economy (Powell 1994). Given that the consequences of poor local ecological productivity changed with access to external markets, we examine how indicators of exogenous stressors covary with the sex ratio at birth both before and after 1869. During Utah’s frontier-era, farmers practiced a mix of dryland and irrigated farming, but in both cases, crop productivity depended heavily on rainfall (ibid). Severe droughts were documented during this period, and mortality rates followed inter-annual variation in rainfall. Therefore, for measures of ecological quality, we target historical water values for the Great Salt Lake (GSL; the largest saltwater lake in the western hemisphere) as they serve as ideal indicators of annual water availability in the area. Our GSL measures serve as gauges for ecological stress on this agrarian population, with potential impacts for SRB. Here, we test three predictions to examine whether measures of drought vary inversely with the sex ratio at birth in Utah from 1851 to 1919.
Predictions
- The SRB will increase with greater water availability (i.e., relatively more boys will be born in wet years).
- GSL water metrics (as measures of local environmental quality) will be most strongly associated with SRB for populations living near the lake since those living farther away will be affected by differing and other place-specific ecological conditions.
- The association between GSL metrics and SRB will be strongest prior to industrialization in Utah.
2. Methods
2.1. Settlement and Economic Development of Utah
The settlement by Euro-Americans of what is now the state of Utah began in 1847. Initially, Salt Lake County served as a central settlement area, with smaller populations forming to the north and south (Mineau et al. 1989). Over the next 20 years, migration rates were high, and the population grew rapidly (U.S. Census 1900). During this frontier period, the economy was primarily reliant on subsistence agriculture, with most households maintaining a small farm holding (Powell 1994). However, after the completion of the transcontinental railroad and the driving of the Golden Spike in 1869, industrialization rapidly began and urban populations began to grow, the manufacturing industry became established, and communities became connected through road, rail, and communication systems allowing for the rapid movement of goods, people, and news (ibid.). Thus, 1869 serves as a useful benchmark for the end of the frontier-era in Utah and the beginning of an industrializing state economy.
2.2. Sample and Data
We relied on SRB data from the Utah Population Database (UPDB; births pre-spike = 39,451; births post-spike = 348,421). The UPDB is one of the world’s richest sources of linked population-based information for demographic, genetic, and epidemiological studies. The UPDB has supported numerous biomedical investigations in large part because of its size, inclusion of multi-generational pedigrees, and linkages to numerous data sources. The UPDB now contains data on over 11 million individuals from the late 18th century to the present. The multigenerational pedigrees representing Utah’s founders and their descendants were constructed based on data provided by the Genealogical Society of Utah (GSU). Pedigrees spanning the past century have been expanded extensively based on vital records and, together with the GSU data, form the basis of the deep genealogical structure of the UPDB. This study has been approved by the University of Utah’s Resource for Genetic and Epidemiologic Research and its Institutional Review Board.
To be included in our analyses, eligible individuals were those with a known sex, year of birth, and county of birth in Utah (to determine geographic proximity to GSL; see map in Figure 1). County was selected as our level for data aggregation to generate sufficient sample sizes necessary for comparisons of SRB across geographic areas. We restricted the study population to births between 1851 and 1919. Our unit of analysis is the geographic year, with one observation for each year and each geography (Salt Lake County and other Utah counties).
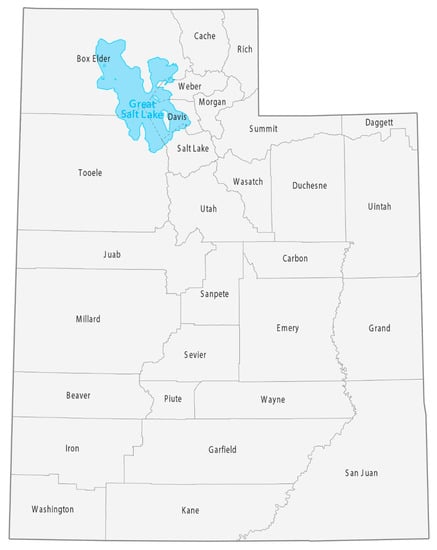
Figure 1.
Map of Utah, including the Great Salt Lake (GSL) and names of counties.
Our metrics of environmental quality come from data compiled in Bowles et al. (1985). This report contains data (and associated methodologies) for four historical measures of GSL dynamics. The four variables of interest, which gauge the presence of arid conditions, include the GSL’s (1) water level elevation, (2) river inflow, (3) precipitation, and (4) evaporation. These variables are reported annually (either estimated or measured directly, see below) beginning in 1851.
3. Variables
3.1. UPDB Variables
Agrarian, Natural Fertility Era (Pre-Golden Spike) is a binary indicator variable capturing the period 1869 and before (1 for 1851–1869, 0 for 1870–1919).
Salt Lake County was measured with a binary indicator variable (1 for born in Salt Lake County, 0 for born in another Utah county).
Sex Ratio at Birth is an interval-level variable determined by the number of male births divided by the number of female births. We calculated the SRB for each year and each geography (Salt Lake County or other Utah county; SRB pre-spike/Salt Lake County = 1.06; SRB pre-spike/other county = 1.04; SRB post-spike/Salt Lake County = 1.05; SRB post-spike/other county = 1.05).
3.2. Great Salt Lake Measures
We employ four measures of potential ecological hardship relevant to those living near the GSL.
Annual Peak Lake Elevation in feet, hereafter referred to as simply elevation.
Annual River Inflows in 1000 acre-feet, hereafter simply referred to as river flow. This includes the combined totals from the Bear, Weber, and Jordan Rivers.
Annual Lake Precipitation in inches, hereafter simply referred to as inches.
Annual Lake Freshwater Evaporation in inches, hereafter referred to simply as evaporation.
For the first three measures, higher values serve as indicators of better environmental conditions. The fourth, evaporation, is the only measure where a higher value indicates a worse environment. Bowles et al. (1985), used estimation methods to impute some data points that could not be directly measured, and we controlled for these with a dummy variable.
4. Analysis
First, we examined simple correlation coefficients among the four GSL measures and SRB. Second, we estimated an ordinary least squares (OLS) regression model for each GSL measurement with SRB as the outcome. The full OLS equation, with relevant interaction terms, appears below:
where SRB is the interval-level sex ratio at birth, r is the relevant GSL risk factor (elevation, river inflow, precipitation, or evaporation, introduced one at a time), t (time) is the Pre-Golden Spike indicator, g (geography) is the Salt Lake County indicator, and f is a flag for data estimation by Bowles et al. (1985). The marginal effect of SRB with respect to the GSL risk factor, then, is:
Since t and g are simple 0/1 binary variables, we can collect terms to develop a parsimonious two-by-two contingency table that examines the marginal effects separately. For example, to interpret the role of a particular GSL metric on SRB during the frontier (pre-spike) time period in Salt Lake County, we would add the coefficients bolded in the marginal effects table below:
| Time Period (t) Pre-spike = 1 Post-spike = 0 | ||
| Geography (g) Salt Lake County = 1 Other county = 0 | ||
Parameters were estimated with PROC REG in SAS (v9.4). Since births increased over time, we weighted each observation by the total number of births experienced. Continuous variables were centered about their grand mean to address multicollinearity and facilitate interpretation. We also apply Durbin–Watson tests and find no evidence for the presence of serial correlation.
5. Results
5.1. Descriptive
Descriptive statistics appear in Table 1. The SRB shows greater annual variability for Salt Lake County owing to a relatively smaller population size compared to Utah as a whole, though Salt Lake County was, and is, the largest county in the state (Harris 2020). This increased variability is also reflected in Figure 2 and Figure 3, which chart SRB alongside the total births for each geography.

Table 1.
Descriptive Statistics (N = 69 Years).
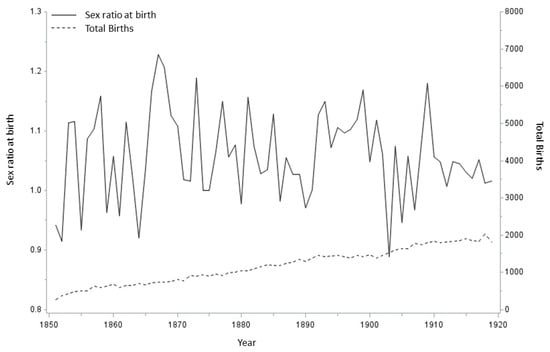
Figure 2.
Sex ratio at birth and total births for Salt Lake County 1851–1919.
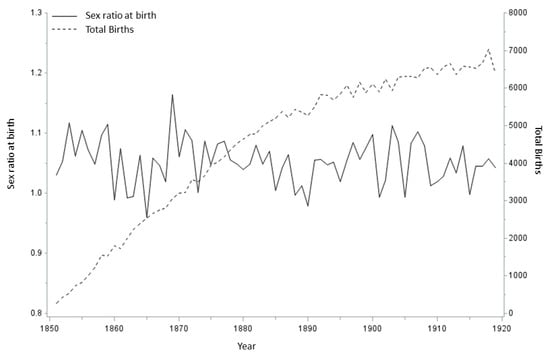
Figure 3.
Sex ratio at birth and total births for other Utah counties 1851–1919.
5.2. Correlations
The correlation matrix for SRB and GSL measures is shown in Table 2. River inflows and precipitation correlate positively with each other, but negatively with evaporation. Note that river inflow’s correlations with evaporation and precipitation are weak and not statistically significant but the correlation with lake elevation is. This may be because while river inflows affect the lake level, they are not affected by, for example, localized precipitation. In addition, as expected, SRB positively correlates with elevation and precipitation, but negatively with evaporation. The correlation with river inflows is positive but not statistically significant.
Table 2.
Pearson correlation coefficients of sex ratio at birth with four measures of Great Salt Lake (N = 138 geographic years).
5.3. Regressions
Given our interest in the GSL’s association with the SRB by time and space, we provide tabular results of the marginal effects in Table 3. For the pre-industrial period in Salt Lake County, lake elevation and precipitation vary positively with SRB—higher quality environments are associated with a relatively greater number of boys. For example, if the lake level rose by one foot during the pre-spike era, the SRB increased by ~0.026 (i.e., became more male-biased) in Salt Lake County, but there was no effect in other parts of the state. Evaporation shows a significant negative relationship with SRB in this same location and time. Outside of Salt Lake County in the pre-industrial period, those three measures show no statistically significant association with SRB. The findings for river inflows, however, show a significant negative association with SRB in the pre-spike period, but only for counties other than Salt Lake.
Table 3.
Marginal effects of the relevant GSL measure on sex ratios at birth, by time and space.
Lastly, we apply two robustness checks to the data. For the first, we model our outcome variable as ‘sex proportions’ (Nmales/(Nmales + Nfemales)) rather than ‘sex ratios’ (Nmales/Nfemales) due to possible methodological issues (detailed in Wilson and Hardy 2002 and Ancona et al. 2017). However, we find these results to follow those presented above (see Supplementary Materials Table S1 and Figure S1). For the second, we model the outcome as a binary variable (male = 1) through logistic regression. The results again follow those presented above, however, precipitation is no longer significant (although it still trends positively with the probability of a boy being born; Supplementary Materials Table S2). In sum, through a variety of analytical approaches, we find that the relative number of males to females born is generally positively associated with measures of environmental quality.
6. Discussion
We examined whether ambient environmental stressors were associated with lower sex ratios at birth using historical data from the US state of Utah. Across the time period under study here (1851–1919), this population exhibited natural fertility, which arguably better approximates conditions over much of human history than do contemporary societies. Moreover, and central to our research focus here, is that economic development occurred very rapidly, allowing us to compare the role of environmental quality on SRB pre- and post-frontier era. Our central finding is that, among the Salt Lake County population, sex ratios at birth fall below expected values in years of arid conditions. This result remains robust across three of our four measures of precipitation. However, SRB values are unassociated with GSL measures during the early industrial era (i.e., post 1869) and with the broader Utah population residing farther away from the Great Salt Lake. Taken together, findings from the high-fertility, subsistence agriculture population under study here support our predictions that ambient environmental stressors will affect SRB in the local area prior to industrialization.
The strengths of our analysis include the exogenous nature of aridity conditions, which precludes the possibility of reverse causality when examining associations with the sex ratio in the synchronous year. We also use as the dependent variable sex ratios from the full population of a well-described and well-documented historical population. We know of no indication in the UDPB of bias in reporting sex of live birth, particularly given that SRB averages here match the globally expected value of ~1.05. Moreover, the specificity of our results to Salt Lake County (but not to greater Utah) indicates that results cannot arise from broader general demographic or economic factors that affected these populations equally.
The limitations include that, as with most historical records, we do not have information on fetal deaths and/or pregnancy losses. Although the presumed mechanism for sex ratio reductions during ambient stressors involves excess male fetal loss, we cannot rule out the possibility of changes in fertility behaviors in response to environmental conditions. Information on pregnancy losses, combined with monthly resolution of the date of live birth, could better assist with the identification of such mechanisms. In addition, whereas we use 1869 as the end of the frontier period in Utah, we acknowledge strong temporal variability in the extent to which Utah families participated in the industrial economy. Lastly, the Trivers–Willard hypothesis is commonly invoked when studying sex ratios at birth (Trivers and Willard 1973). Central to this hypothesis is an expectation that mothers will adjust their parental investment in sons vs. daughters given their own condition relative to other mothers in the population. However, here we have no indicators of maternal quality (e.g., SES) and so can provide no test of this hypothesis.
In conclusion, our findings indicate that greater water availability, and likely a more productive environment, is positively associated with SRB in Salt Lake County. Moreover, we show a clear relationship whereby the association disappears with geographic distance from the putative stressor. With the exception of river inflows, our measures of water availability all performed as predicted, with greater availability increasing the number of boys born relative to girls. However, these results hold only for the frontier-era and not into the period of rapid industrialization. In sum, we argue that the mixed state of the literature may result from the fact that the impact and frequency of exogenous stressors are likely dampened in industrialized societies.
Supplementary Materials
The following are available online at https://www.mdpi.com/article/10.3390/socsci10090319/s1, Figure S1: Sex radio at birth (sr) by sex proportion (propmale), Table S1: Marginal effects of the relevant GSL measure on sex proportions at birth, by time and space, Table S2: Marginal effects of the relevant GSL measure on the probability of a birth being male, by time and space.
Author Contributions
Formal analysis, M.H., D.T. and K.R.S.; Writing—review & editing, R.S., M.H., H.H., T.B., S.J.M. and K.R.S. All authors have read and agreed to the published version of the manuscript.
Funding
Funding for this research was provided by the National Institutes of Health—National Institute of Aging, R01 AG022095 (Early Life Conditions, Survival and Health, Smith PI). We also thank the Pedigree and Population Resource of the Huntsman Cancer Institute, University of Utah for its role in supporting of the Utah Population Database (UPDB). We additionally acknowledge partial support for the UPDB through grant no. P30 CA2014 from the National Cancer Institute, Uni-versity of Utah and from the University of Utah’s Program in Personalized Health and Center for Clinical and Translational Science.
Institutional Review Board Statement
The research was approved by the University of Utah Institutional Review Board (IRB no. 00043524) as part of the ‘Early Life Conditions, Survival, and Health: A Pedigree-Based Population Study’ (PI Smith).
Informed Consent Statement
Not applicable.
Data Availability Statement
The UPDB is a unique research resource that enhances the value and furthers the advancement of research in studies linking early life circumstances to health and behavioral outcomes later in life. Special attention is given to protect individuals and their information contained within the UPDB and the organizations that contribute data while also allowing access to researchers. Accordingly, the Utah Resource for Genetic and Epidemiologic Research (RGE), established by the Executive Order of the Governor of Utah, administers access to the UPDB through a review process of all proposals using UPDB data. The protection of privacy and confidentiality of individuals repre-sented in these records has been negotiated with agreements between RGE and data contributors. Data from the UPDB are available only for approved health-related research studies and access is project-specific and granted after review and approval by an RGE oversight committee and the University of Utah’s IRB. This process allows researchers with approved protocols to use the data, a process that has proven effective and successful as evidenced by hundreds of approved studies that have relied on the UPDB.
Acknowledgments
We thank the Pedigree and Population Resource of the Huntsman Cancer Institute, University of Utah (funded in part by the Huntsman Cancer Foundation) for its role in the ongoing collection, maintenance, and support of the Utah Population Database (UPDB). We also thank Genevieve Atwood for her guidance on early rounds of this manuscript.
Conflicts of Interest
The authors declare no conflict of interest.
References
- Ammon, Avalos L., Claudia Galindo, and De-Kun Li. 2012. A systematic review to calculate background miscarriage rates using life table analysis. Birth Defects Research 94: 417–23. [Google Scholar] [CrossRef]
- Ancona, Sergio, Francisco V. Dénes, Oliver Krüger, Tamás Székely, and Steven R. Beissinger. 2017. Estimating adult sex ratios in nature. Philosophical Transactions of the Royal Society B: Biological Sciences 372: 20160313. [Google Scholar] [CrossRef] [Green Version]
- Andreev, Kirill. 2000. Sex differentials in survival in the Canadian population, 1921–1997: A descriptive analysis with focus on age-specific structure. Demographic Research 3. [Google Scholar] [CrossRef]
- Bowles, David S., L. Douglas James, D. George Chadwick, Ronald V. Canfield, and Norman Stauffer. 1985. Methodology Report: Updating the Estimation of Water Surface Elevation Probabilities and Associated Damages for Great Salt Lake. Logan: Utah State University. [Google Scholar]
- Bruckner, Tim, Bitte Modin, and Denny Vågerö. 2013. Cold ambient temperature in utero and birth outcomes in Uppsala, Sweden, 1915–1929. Annals of Epidemiology 24: 116–21. [Google Scholar] [CrossRef] [PubMed]
- Bruckner, Tim, Ralph Catalano, and Jennifer Ahern. 2010. Male fetal loss in the U.S. following the terrorist attacks of 11 September 2001. BMC Public Health 10: 273. [Google Scholar] [CrossRef] [PubMed] [Green Version]
- Cai, Yong, and Wang Feng. 2005. Famine, social disruption, and involuntary fetal loss: Evidence from Chinese survey data. Demography 42: 301–22. [Google Scholar] [CrossRef] [PubMed]
- Casey, Joan A., Alison Gemmill, Holly Elser, Deborah Karasek, and Ralph Catalano. 2019. Sun smoke in Sweden: Perinatal implications of the Laki volcanic eruptions, 1783–1784. Epidemiology (Cambridge, Mass.) 30: 330. [Google Scholar] [CrossRef] [PubMed]
- Catalano, Ralph, Tim Bruckner, and Kirk R. Smith. 2008. Ambient temperature predicts sex ratios and male longevity. Proceedings of the National Academy of Sciences 105: 2244–47. [Google Scholar] [CrossRef] [Green Version]
- Catalano, Ralph, Tim Bruckner, Elizabeth Anderson, and Jeffrey B. Gould. 2005. Fetal death sex ratios: A test of the economic stress hypothesis. International Journal of Epidemiology 34: 944–48. [Google Scholar] [CrossRef] [PubMed] [Green Version]
- Davis, Kingsley. 1986. Low Fertility in Evolutionary Perspective. Population and Development Review 12: 48–65. [Google Scholar] [CrossRef]
- Fukuda, Misao, Kyomi Fukuda, Takashi Shimizu, and Henrik Møller. 1998. Decline in sex ratio at birth after Kobe earthquake. Human Reproduction (Oxford, England) 13: 2321–22. [Google Scholar] [CrossRef] [Green Version]
- Harrell, C. Janna, Ken R. Smith, and Geraldine. P. Mineau. 2008. Are girls good and boys bad for parental longevity? Human Nature 19: 56. [Google Scholar] [CrossRef] [PubMed]
- Harris, Emily. 2020. State and County Population Estimates for Utah: 2020. Salt Lake City: Kem C. Garnder Policy Institute, University of Utah. [Google Scholar]
- Helle, Samuli, Samuli Helama, and Kalle Lertola. 2009. Evolutionary ecology of human birth sex ratio under the compound influence of climate change, famine, economic crises and wars. Journal of Animal Ecology 78: 1226–33. [Google Scholar] [CrossRef]
- Hesketh, Therese, and Jiang Min Min. 2012. The effects of artificial gender imbalance: Science & Society Series on Sex and Science. EMBO Reports 13: 487–92. [Google Scholar]
- James, William H. 1987. The Human Sex Ratio. Part 1: A Review of the Literature. Human Biology 59: 721–52. [Google Scholar] [PubMed]
- Lydersen, Stian. 2007. The human sex ratio in New York City did not change after 11 September 2001. Human Reproduction 22: 1192–93. [Google Scholar] [CrossRef] [PubMed] [Green Version]
- Mineau, Geraldine P., Lee L. Bean, and Douglas L. Anderton. 1989. Migration and fertility: Behavioral change on the American frontier. Journal of Family History 14: 43–61. [Google Scholar] [CrossRef]
- Pavic, Dario. 2015. Secular trends and geographical variations in sex ratio at birth. Early Human Development 91: 811–15. [Google Scholar] [CrossRef]
- Powell, Allan Kent, ed. 1994. Utah History Encyclopedia. Salt Lake City: University of Utah Press. [Google Scholar]
- Ruckstuhl, Kathreen E., Grant P. Colijn, Volodymyr Amiot, and Erin Vinish. 2010. Mother’s occupation and sex ratio at birth. BMC Public Health 10: 1–11. [Google Scholar] [CrossRef] [Green Version]
- Scalone, Francesco, and Rosella Rettaroli. 2015. Exploring the variations of the sex ratio at birth from an historical perspective. Statistica 75: 213–26. [Google Scholar]
- Schacht, Ryan, Douglas Tharp, and Ken R. Smith. 2019. Sex ratios at birth vary with environmental harshness but not maternal condition. Scientific Reports 9: 1–7. [Google Scholar] [CrossRef] [PubMed]
- Song, Shige. 2012. Does famine influence sex ratio at birth? Evidence from the 1959–1961 Great Leap Forward Famine in China. Proceedings of the Royal Society B 279: 2883–90. [Google Scholar] [CrossRef] [Green Version]
- Stein, Aryeh D., Patricia A. Zybert, and Lambert H. Lumey. 2004. Acute undernutrition is not associated with excess of females at birth in humans: The Dutch Hunger Winter. Proceedings of the Royal Society of London. Series B: Biological Sciences 271: S138–41. [Google Scholar] [CrossRef] [PubMed] [Green Version]
- Tamimi, Rulla M., Pagona Lagiou, Lorelei A. Mucci, Chung-Cheng Hsieh, Hans-Olov Adami, and Dimitrios Trichopoulos. 2003. Average energy intake among pregnant women carrying a boy compared with a girl. BMJ 326: 1245–46. [Google Scholar] [CrossRef] [PubMed] [Green Version]
- Trivers, Robert. L., and Dan E. Willard. 1973. Natural Selection of Parental Ability to Vary the Sex Ratio of Offspring. Science 179: 90–92. [Google Scholar] [CrossRef] [Green Version]
- U.S. Bureau of the Census. 1900. Twelfth Census of the United States. Washington, DC: U.S. Government Printing Office. [Google Scholar]
- Wilson, Kenneth, and Ian CW Hardy. 2002. Statistical analysis of sex ratios: An introduction. Sex Ratios: Concepts and Research Methods 1: 48–92. [Google Scholar]
- Zhao, Zhongwei, Yuan Zhu, and Anna Reimondos. 2013. Could changes in reported sex ratios at birth during and after China’s 1958–1961 famine support the adaptive sex ratio adjustment hypothesis? Demographic Research 29: 885–906. [Google Scholar] [CrossRef] [Green Version]
Publisher’s Note: MDPI stays neutral with regard to jurisdictional claims in published maps and institutional affiliations. |
© 2021 by the authors. Licensee MDPI, Basel, Switzerland. This article is an open access article distributed under the terms and conditions of the Creative Commons Attribution (CC BY) license (https://creativecommons.org/licenses/by/4.0/).