Pedestrians’ Crossing Dilemma during the First Seconds of the Red-Light Phase
Abstract
1. Introduction
2. Description of the Undertaken Research
2.1. Study Area
2.2. Data Collection
- Gender: male or female
- Age: classes, based on pedestrians’ characteristics
- Distraction: it was recorded if pedestrians were engaged in parallel activities, such as a child escort, food consumption, mobile phone use, and any other action delaying their movement, such as carrying suitcases, shopping bags etc.
- Other pedestrians waiting: the exact number of other pedestrians waiting in the signalized crossing
- Other pedestrians crossing: the exact number of other pedestrians crossing illegally
- Decision making: pedestrians’ decision of crossing or not the signalized crossings.
3. Results
3.1. Descriptive Statistics
3.2. Classification Tree
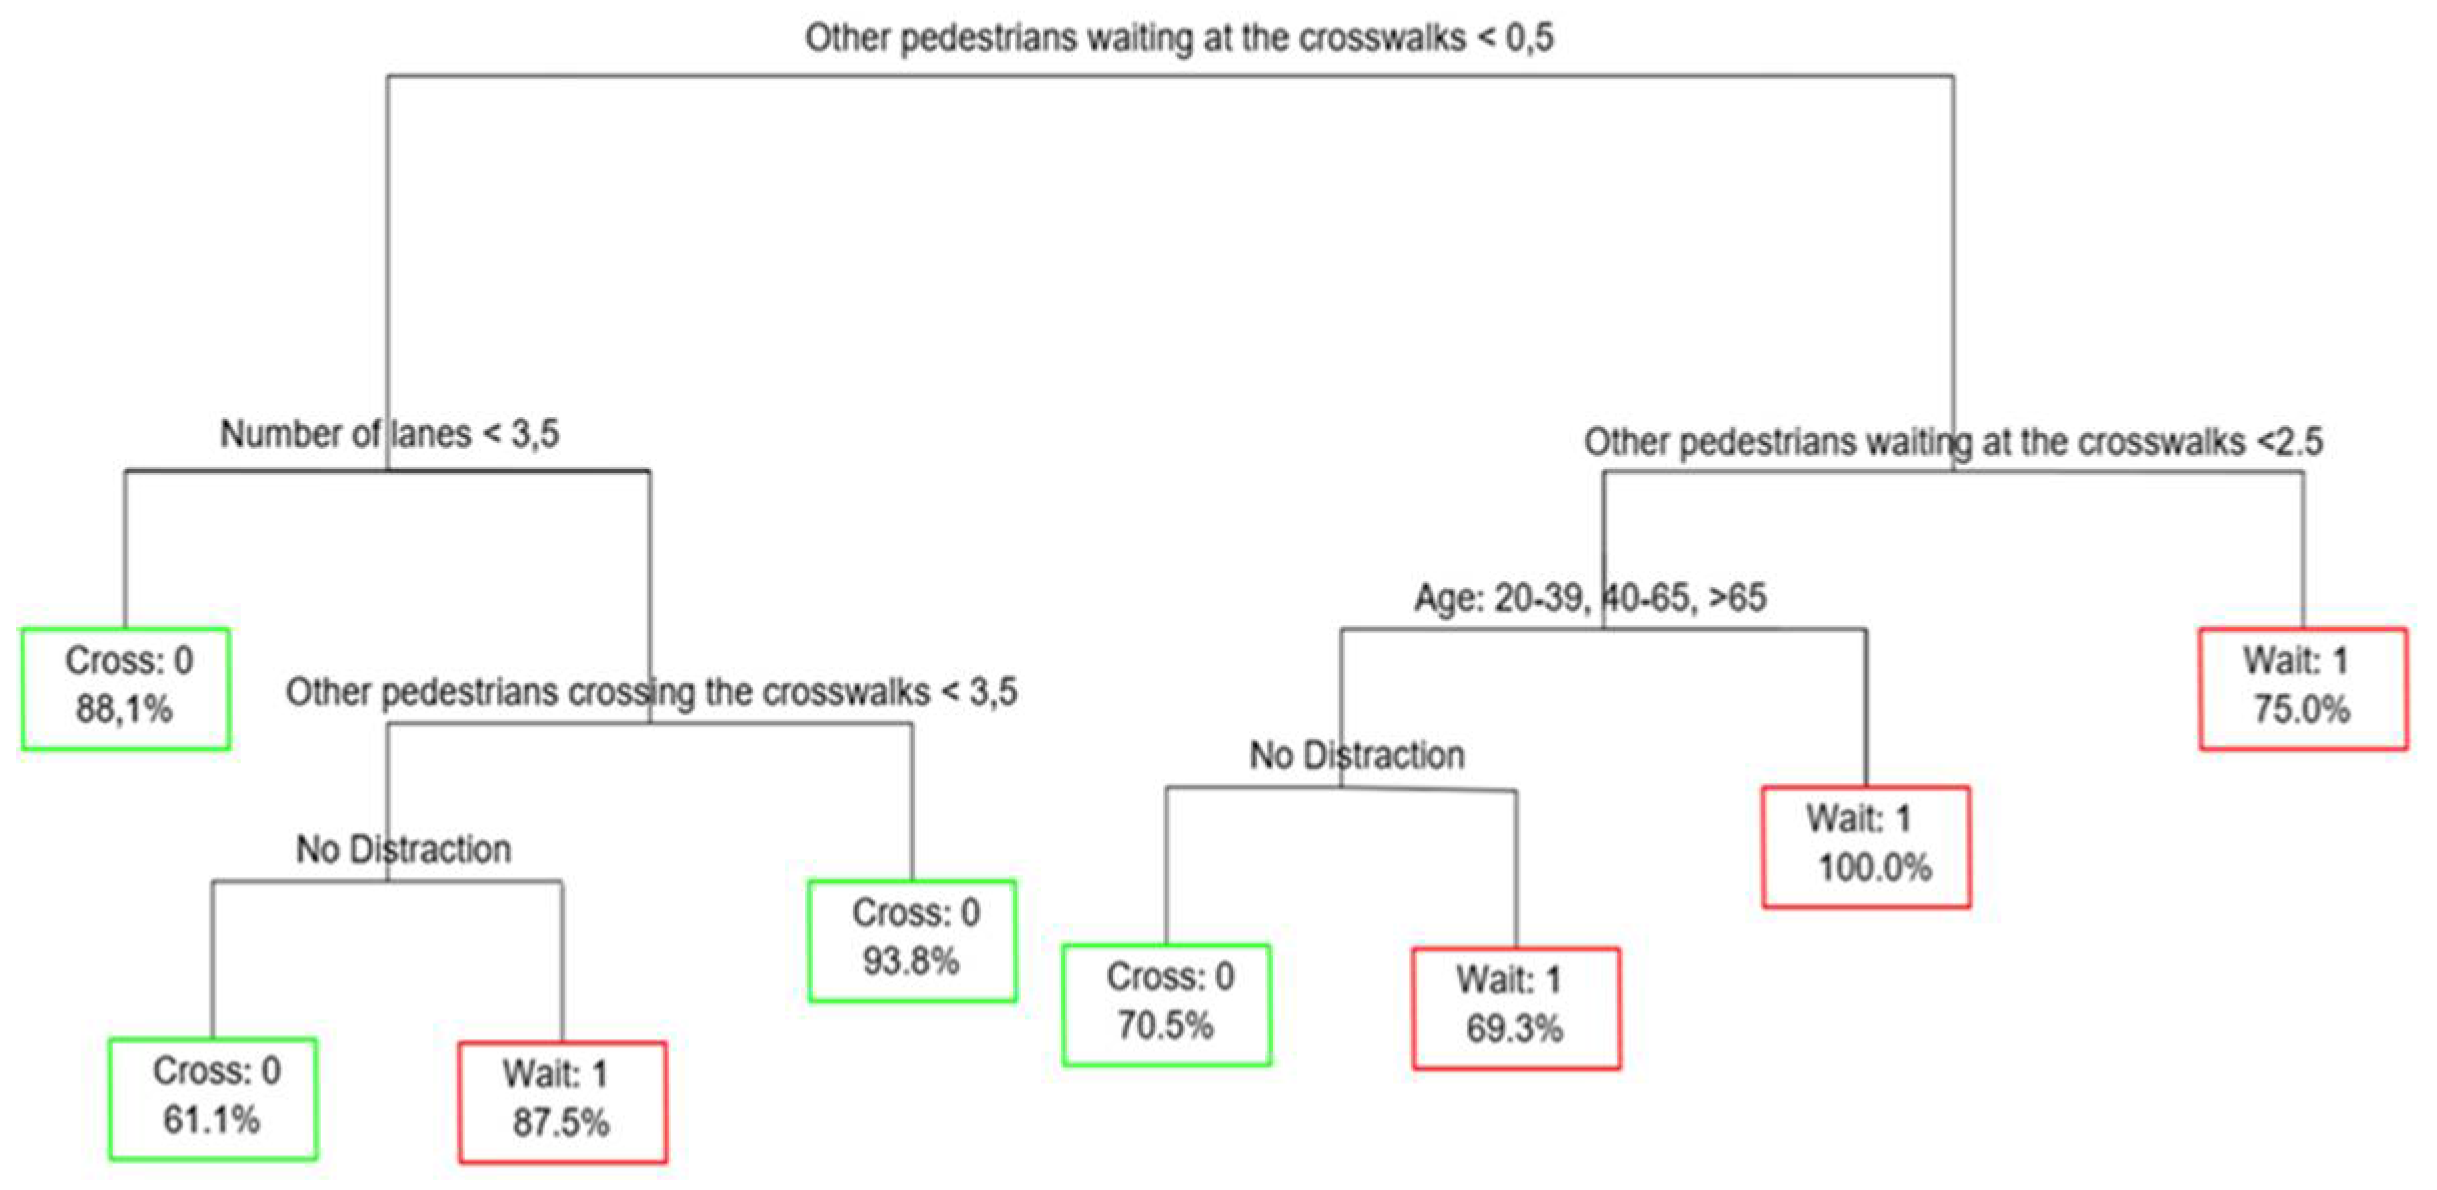
- The most prominent factor in adopting illegal behavior seems to be the behavior of other pedestrians at the signalized crossing. Pedestrians, and especially the younger ones, are significantly affected by other people’s behavior
- The number of lanes is also of particular importance in decision making. Infringements of pedestrian red signs are more frequent on narrow width roads
- Distracted pedestrians usually adopt more cautious behavior when crossing a road.
4. Conclusions
4.1. Comparison with the Literature and Recommendations
4.2. Limitations and Future Research
Author Contributions
Funding
Conflicts of Interest
References
- Aghabayk, Kayvan, Javad Esmailpour, Ahmad Jafari, and Nirajan Shiwakoti. 2021. Observational-based study to explore pedestrian crossing be-haviors at signalized and unsignalized crosswalks. Accident Analysis & Prevention 151: 105990. [Google Scholar]
- Ahuja, S., X. Hao, M. Bell, and S. Phull. 2008. Pedestrian crossing behaviour at signalised crossings. Paper presented at the European Transport Conference, Amsterdam, The Netherlands, October 6–8. [Google Scholar]
- Basbas, Socrates, Andreas Nikiforiadis, Evaggelia Sarafianou, and Nikolaos Kolonas. 2019. Behavior and Perceptions of University Students at Pedestrian Crossings. In Data Analytics: Paving the Way to Sustainable Urban Mobility. Advances in Intelligent Systems and Computing. Edited by E. Nathanail and I. Karakikes. Berlin: Springer, vol. 879, pp. 280–87. [Google Scholar] [CrossRef]
- Brosseau, Marilyne, Sohail Zangenehpour, Nicolas Saunier, and Luis Miranda-Moreno. 2013. The Impact of Waiting Time and Other Factors on Dangerous Pedestrian Crossings and Violations at Signalized Intersections: A Case Study in Montreal. Transportation Research Part F 21: 159–72. [Google Scholar] [CrossRef]
- Cinnamon, Jonathan, Nadine Schuurman, and Morad Hameed. 2011. Pedestrian injury and human behaviour: Observing road-rule violations at high-incident intersections. PLoS ONE 6: e21063. [Google Scholar] [CrossRef] [PubMed]
- Cook, Eddie, and Glen Koorey. 2013. A study of pedestrian characteristics at traffic signals. Paper presented at the IPENZ Transportation Group Conference, Dunedin, New Zealand, April 14–16. [Google Scholar]
- de Lavalette, Brigitte Cambon, Charles Tijus, Sebastien Poitrenaud, Christine Leproux, Jacques Bergeron, and Jean-Paul Thouez. 2009. Pedestrian crossing decision-making: A situational and behavioral approach. Safety Science, 1248–53. [Google Scholar] [CrossRef]
- De Vries Sjerp, Thomas Classen, Stella-Maria Eigenheer-Hug, Kalevi Korpela, Jolanda Maas, Richard Mitchell, and Peter Schantz. 2011. Contributions of natural environments to physical activity: Theory and evidence base. In Forests, Trees, and Human Health. Edited by Kjell Nilsson, Marcus Sangster, Christos Gallis, Terry Hartig, Sjerp de Vries, Klaus Seeland and Jasper Schipperijn. Berlin: Springer, pp. 205–43. [Google Scholar] [CrossRef]
- European Commission. 2011. Roadmap to a Single European Transport Area—Towards a Competitive and Resource Efficient Transport System: White Paper. Luxembourg: Publications Office of the European Union. [Google Scholar]
- Fu, Lianning, and Nan Zou. 2016. The influence of pedestrian countdown signals on children’s crossing behavior at school intersections. Accident Analysis and Prevention 94: 73–79. [Google Scholar] [CrossRef]
- Guo, Hongwei, Ziyou Gao, Xiaobao Yang, and Xiaobei Jiang. 2011. Modeling pedestrian violation behavior at signalized crosswalks in China: A hazards-based duration approach. Traffic Injury Prevention 1: 96–103. [Google Scholar] [CrossRef]
- Hamed, Mohammed. 2001. Analysis of pedestrians’ behavior at pedestrian crossings. Safety Science 38: 63–72. [Google Scholar] [CrossRef]
- Hatfield, Julie, and Susanne Murphy. 2007. The effects of mobile phone use on pedestrian crossing behaviour at signalised and unsignalised intersections. Accident Analysis and Prevention 39: 197–205. [Google Scholar] [CrossRef]
- Hirschi, Travis, and Michael Gottfredson. 1994. The Generality of Deviance. London: Routledge and Transaction Publishing, vol. 1, pp. 1–22. [Google Scholar]
- Israel Police. 2006. Annual Report. Available online: https://www.gov.il/he/Departments/israel_police (accessed on 5 June 2021). (In Hebrew)
- Johansson, Marcus, Terry Hartig, and Henk Staats. 2011. Psychological Benefits of Walking: Moderation by Company and Outdoor Environment. Applied Psychology: Health and Well-Being 3: 261–80. [Google Scholar] [CrossRef]
- Kim, Hyung Min, and Iderlina Mateo-Babiano. 2018. Pedestrian Crossing Environments in an Emerging Chinese City: Vehicle Encountering, Seamless Walking, and Sensory Perception Perspectives. Sustainability 10: 2200. [Google Scholar] [CrossRef]
- King, Mark, David Soole, and Ameneh Ghafourian. 2009. Illegal pedestrian crossing at signalized intersections: Incidence and relative risk. Accident Analysis and Prevention 41: 485–90. [Google Scholar] [CrossRef] [PubMed]
- Koh, P. P., Y. D. Wong, and P. Chandrasekar. 2014. Safety evaluation of pedestrian behaviour and violations at signalised pedestrian crossings. Safety Science 70: 143–52. [Google Scholar] [CrossRef]
- Lamberg, Eric, and Lisa Muratori. 2012. Cell phones change the way we walk. Gait & Posture 35: 688–90. [Google Scholar]
- Lambrianidou, Polixeni, Socrates Basbas, and Ioannis Politis. 2012. Can pedestrians’ crossing countdown signal timers promote green and safe mo-bility? Sustainable Cities and Society 6: 33–39. [Google Scholar] [CrossRef]
- Lee, I-Min, and David Buchner. 2008. The importance of walking to public health. Medicine and Science in Sports and Exercise 40: 515–18. [Google Scholar] [CrossRef] [PubMed]
- Leyden, Kevin. 2003. Social Capital and the Built Environment: The Importance of Walkable Neighborhoods. American Journal of Public Health 93: 1546–51. [Google Scholar] [CrossRef] [PubMed]
- Li, Yue, and Geoff Fernie. 2010. Pedestrian behavior and safety on a two-stage crossing with a center refuge island and the effect of winter weather on pedestrian compliance rate. Accident Analysis and Prevention 42: 1156–63. [Google Scholar] [CrossRef] [PubMed]
- Lipovac, Krsto, Milan Vujanic, Bojan Maric, and Miladin Nesic. 2013. The influence of a pedestrian countdown display on pedestrian behavior at signalized pedestrian crossings. Transportation Research Part F 20: 121–34. [Google Scholar] [CrossRef]
- Lobjois, Regis, Nicolas Benguigui, and Viola Cavallo. 2013. The Effects of Age and Traffic Density on Street-Crossing Behavior. Accident Analysis and Prevention 53: 166–75. [Google Scholar] [CrossRef] [PubMed]
- Marshall, Martin. 1996. Sampling for qualitative research. Family Practice 13: 522–26. [Google Scholar] [CrossRef] [PubMed]
- Moyano, Emilio Diaz. 2002. Theory of planned behavior and pedestrians’ intentions to violate traffic regulations. Transportation Research Part F 5: 169–75. [Google Scholar] [CrossRef]
- Nasar, Jack, and Derek Troyer. 2013. Pedestrian injuries due to mobile phone use in public places. Accident Analysis and Prevention 57: 91–95. [Google Scholar] [CrossRef] [PubMed]
- Nasar, Jack, Peter Hecht, and Richard Wener. 2008. Mobile telephones, distracted attention, and pedestrian safety. Accident Analysis and Prevention 40: 69–75. [Google Scholar] [CrossRef]
- Neider, Mark, Jason McCarley, James Crowell, Henry Kaczmarski, and Arthur Kramer. 2010. Pedestrians, vehicles, and cell phones. Accident Analysis and Prevention 42: 589–94. [Google Scholar] [CrossRef]
- Nikiforiadis, Andreas, Socrates Basbas, and Marina Iliana Garyfalou. 2020. A methodology for the assessment of pedestrians-cyclists shared space level of service. Journal of Cleaner Production 254: 120172. [Google Scholar] [CrossRef]
- Nikiforiadis, Andreas, Evangelos Paschalidis, Nikiforos Stamatiadis, Alexandra Raptopoulou, Athanasia Kostareli, and Socrates Basbas. 2021. Analysis of attitudes and en-gagement of shared e-scooter users. Transportation Research Part D 94: 102790. [Google Scholar] [CrossRef]
- Oxley, Jennie, Brian Fildes, Elfriede Ihsen, Judith Charlton, and Ross Day. 1997. Differences in Traffic Judgements between Young and Old Adult Pedestrians. Accident Analysis and Prevention 29: 839–47. [Google Scholar] [CrossRef]
- Paschalidis, Evangelos, Ioannis Politis, Socrates Basbas, and Polixeni Lambrianidou. 2015. Pedestrian compliance and cross walking speed adaptation due to countdown timer installations: A self-report study. Transportation Research Part F 42: 456–67. [Google Scholar] [CrossRef]
- Perra, Vasiliki-Maria, and Socrates Basbas. 2019a. Distracted walking and the impact of mobile phone use: A literature review. Paper presented at the Young Researchers Seminar 2019, Thessaloniki, Greece, June 5–7. [Google Scholar]
- Perra, Vasiliki-Maria, and Socrates Basbas. 2019b. Investigating Pedestrians’ Crossing Behavior While Using Mobile Phones At Signalized And Unsignalized Intersections In The City Of Thessaloniki. Paper presented at the 9th International Congress on Transportation Research, Athens, Greece, October 24–25. [Google Scholar]
- Perra, Vasiliki-Maria, Socrates Basbas, Andreas Nikiforiadis, and Nikolaos-Marios Militsis. Forthcoming. Investigation of Distracted Pedestrians’ Exposure Duration at Signalized and Unsignalized Pedestrian Crossings: A Bayesian Modeling Approach. Periodica Polytechnica Transportation En-Gineering.
- R Core Team. 2013. R: A Language and Environment for Statistical Computing. Vienna: R Foundation for Statistical Computing. [Google Scholar]
- Ripley, Brian. 2018. Tree: Classification and Regression Trees. R Package Version 1.0.39. Available online: https://mran.microsoft.com/snapshot/2018-03-20/web/packages/tree/index.html (accessed on 5 June 2021).
- Rosenbloom, Τova. 2009. Crossing at a red light: Behaviour of individuals and groups. Transportation Research Part F 12: 389–94. [Google Scholar] [CrossRef]
- Rosenbloom, Tova. 2011. Traffic light compliance by civilians, soldiers and military officers. Accident Analysis and Prevention 43: 2010–14. [Google Scholar] [CrossRef] [PubMed]
- Schwebel, David, Despina Stavrinos, Katherine Byington, Tiffany Davis, Elizabeth O’Neal, and Desiree de Jong. 2012. Distraction and pedestrian safety: How talking on the phone, texting, and listening to music impact crossing the street. Accident Analysis and Prevention 45: 266–71. [Google Scholar] [CrossRef] [PubMed]
- Sdoukopoulos, Alexandros, Magda Pitsiava-Latinopoulou, Socrates Basbas, and Panagiotis Papaioannou. 2019. Measuring progress towards transport sus-tainability through indicators: Analysis and metrics of the main indicator initiatives. Transportation Research Part D 67: 316–33. [Google Scholar] [CrossRef]
- Soathong, Ajjima, Subeh Chowdhury, Douglas Wilson, and Prakash Ranjitkar. 2021. Investigating the motivation for pedestrians’ risky crossing behaviour at urban mid-block road sections. Travel Behaviour and Society 22: 155–65. [Google Scholar] [CrossRef]
- Thessaloniki SUMP. 2019. Thessaloniki’s Sustainable Urban Mobility Plan, 1st ed. Thessaloniki: Centre for Research and Technology Hel-Las, Hellenic Institute of Transport. Available online: https://www.svakthess.imet.gr/Portals/0/Diavoulefseis/Diavoulefsi03/SVAK_Thessalonikis.pdf (accessed on 5 June 2021).
- Thompson, Leah, Frederick Rivara, Rajiv Ayyagari, and Beth Ebel. 2013. Impact of social and technological distraction on pedestrian crossing behaviour: An observational study. Injury Prevention: Journal of the International Society for Child and Adolescent Injury Prevention 19: 232–37. [Google Scholar] [CrossRef]
- Tiwari, Geetam, Shrikant Bangdiwala, Arvind Saraswat, and Sushant Gaurav. 2006. Survival analysis: Pedestrian risk exposure at signalized intersections. Transportation Research Part F 10: 77–89. [Google Scholar] [CrossRef]
- Tom, Ariane, and Marie-Axelle Granié. 2011. Gender Differences in Pedestrian Rule Compliance and Visual Search at Signalized and Un-signalized Crossroads. Accident Analysis and Prevention 43: 1794–801. [Google Scholar] [CrossRef]
- Walker, Esther, Sophie Lanthier, Evan Risko, and Alan Kingstone. 2012. The effects of personal music devices on pedestrian behaviour. Safety Science 50: 123–28. [Google Scholar] [CrossRef]
- Wanty, Dave Keith, and S. M. Wilkie. 2010. Trialling Pedestrian Countdown Timers at Traffic Signals. Technical Report. NZ Transport Agency Research Report 428. Available online: https://www.nzta.govt.nz/resources/research/ (accessed on 5 June 2021).
- World Health Organization (WHO). 2015. Global Status Report on Road Safety. Geneva: World Health Organization. [Google Scholar]
- Xiong, Hui, Lingli Xiong, Xiaoyong Deng, and Wuhong Wang. 2014. Evaluation of the impact of pedestrian countdown signals on crossing behavior. Advances in Mechanical Engineering 6: 518295. [Google Scholar] [CrossRef]
- Xu, Yaoshan, Yongjuan Li, and Feng Zhang. 2013. Pedestrians’ Intention to Jaywalk: Automatic or Planned? A Study Based on a Dual-Process Model in China. Accident Analysis and Prevention 50: 811–19. [Google Scholar] [CrossRef] [PubMed]
- Yagil, Dana. 2000. Beliefs, motives and situational factors related to pedestrians’ self-reported. Transportation Research Part F 3: 1–13. [Google Scholar] [CrossRef]
- Yang, Jianguo, Wen Deng, Jinmei Wang, Qingfeng Li, and Zhaoan Wang. 2006. Modeling pedestrians’ road crossing behavior in traffic system micro-simulation in China. Transportation Research Part A 40: 280–90. [Google Scholar] [CrossRef]
- Yannis, George, Eleonora Papadimitriou, and Athanasios Theofilatos. 2010. Pedestrian Gap Acceptance for Mid-Block Street Crossing. Paper presented at the 12th World Conference on Transport Research, Lisbon, Portugal, July 11–15. [Google Scholar]
- Zafri, Niaz Mahmud, Rashada Sultana, Md. Rakibul Hasan Himal, and Tanzila Tabassum. 2020. Factors influencing pedestrians’ decision to cross the road by risky rolling gap crossing strategy at intersections in Dhaka, Bangladesh. Accident Analysis and Prevention 142: 105564. [Google Scholar] [CrossRef] [PubMed]
- Zhou, Ronggang, William Horrey, and Ruifeng Yu. 2009. The effect of conformity tendency on pedestrians’ road-crossing intentions in China: An application of the theory of planned behavior. Accident Analysis and Prevention 41: 491–97. [Google Scholar] [CrossRef] [PubMed]
- Zhuang, Xiangling, Changxu Wu, and Shu Ma. 2018. Cross or wait? Pedestrian decision making during clearance phase at signalized intersections. Accident Analysis and Prevention 111: 115–24. [Google Scholar] [CrossRef] [PubMed]
| Signalized Crossing | Characteristics | Photograph | |
|---|---|---|---|
| Ioannis Tsimiski (Ethnikis Amynis St. intersection) | Number of lanes | 4 | 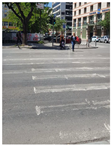 |
| Crossing width (meters) | 14 | ||
| Vehicle Signaling Time | Red: 40”|Orange: 3”|Green: 37” | ||
| Pedestrian Signaling Time | Red: 50”|Green: 30” | ||
| Ethnikis Amynis (Ioannis Tsimiski St. intersection) | Number of lanes | 2 |  |
| Crossing width (meters) | 9 | ||
| Vehicle Signaling Time | Red: 50”|Orange: 3”|Green: 27” | ||
| Pedestrian Signaling Time | Red: 40”|Green: 40” | ||
| Eleftheriou Venizelou (Ioannis Tsimiski St. intersection) | Number of lanes | 3 |  |
| Crossing width (meters) | 9 | ||
| Vehicle Signaling Time | Red: 43”|Orange: 3”|Green: 24” | ||
| Pedestrian Signaling Time | Red: 35”|Green: 35” | ||
| Nikis Avenue (Agias Sofias St. intersection) | Number of lanes | 3 |  |
| Crossing width (meters) | 10 | ||
| Vehicle Signaling Time | Red: 20”|Orange: 3”|Green: 65” | ||
| Pedestrian Signaling Time | Red: 80”|Green: 8” | ||
| Agias Sofias (Mitropoleos St. intersection) | Number of lanes | 2 |  |
| Crossing width (meters) | 7 | ||
| Vehicle Signaling Time | Red: 28”|Orange: 3”|Green: 14” | ||
| Pedestrian Signaling Time | Red: 25”|Green: 20” | ||
| Mitropoleos (Kouskoura St. intersection) | Number of lanes | 2 | 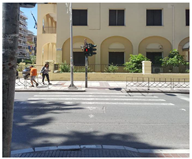 |
| Crossing width (meters) | 8 | ||
| Vehicle Signaling Time | Red: 18”|Orange: 3”|Green: 24” | ||
| Pedestrian Signaling Time | Red: 35”|Green: 10” | ||
| Megalou Alexandrou (Georgiou Karaiskaki St. intersection) | Number of lanes | 6 |  |
| Crossing width (meters) | 21 | ||
| Vehicle Signaling Time | Red: 27”|Orange: 3”|Green: 60” | ||
| Pedestrian Signaling Time | Red: 75”|Green: 15” | ||
| Pavlou Mela (Ioannis Tsimiski St. intersection) | Number of lanes | 2 | 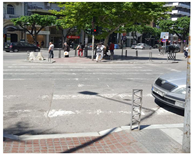 |
| Crossing width (meters) | 9 | ||
| Vehicle Signaling Time | Red: 98”|Orange: 3”|Green: 15” | ||
| Pedestrian Signaling Time | Red: 26”|Green: 90” | ||
| Palaion Patron Germanou (Pavlou Mela St. intersection) | Number of lanes | 1 | |
| Crossing width (meters) | 6.5 |  | |
| Vehicle Signaling Time | Red: 62”|Orange: 3”|Green: 25” | ||
| Pedestrian Signaling Time | Red: 38”|Green: 52” | ||
| Vasilissis Olgas (25th Martiou St. intersection) | Number of lanes | 4 | 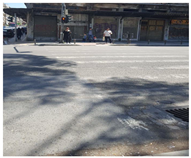 |
| Crossing width (meters) | 14 | ||
| Vehicle Signaling Time | Red: 35”|Orange: 3”|Green: 52” | ||
| Pedestrian Signaling Time | Red: 65”|Green: 25” | ||
| Paraskevoloulou (Vasilissis Olgas St. intersection) | Number of lanes | 1 | 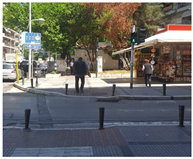 |
| Crossing width (meters) | 3 | ||
| Vehicle Signaling Time | Red: 68”|Orange: 3”|Green: 19” | ||
| Pedestrian Signaling Time | Red: 28”|Green: 62” | ||
| Ionos Dragoumi (Ioannis Tsimiski St. intersection) | Number of lanes | 1 |  |
| Crossing width (meters) | 3 | ||
| Vehicle Signaling Time | Red: 68”|Orange: 3”|Green: 19” | ||
| Pedestrian Signaling Time | Red: 28”|Green: 62” | ||
| Variable | Frequencies |
|---|---|
| Gender | Male: 44.33%, Female: 55.67% |
| Age | <19: 4.83%, 20–39: 48.17%, 40–64: 30.50%, >65: 16.50% |
| Distraction (if pedestrians were engaged in parallel activities while crossing or not) | No: 79.00%, Yes: 21.00% |
| Number of other pedestrians waiting in the signalized crossing | 0: 68.67%, 1: 13.83%, 2: 8.33%, 3: 4.17%, >3: 5% |
| Number of other pedestrians crossing illegally | 0: 26.00%, 1: 19.17%, 2: 20.33%, 3: 14.17%, 4: 8.83%, 5: 8.83%, 6: 3.50%, >6: 3.50% |
| Other pedestrian(s) crossing | No: 26.00%. Yes: 74.00% |
| Number of road lanes | 1: 16.67%, 2: 41.67%, 3: 16.67%, 4: 16.67%, 6: 8.33% |
| Crossing width (meters) | 3: 16.67%. 6.5: 8.33%, 7: 8.33%, 8: 8.33%, 9: 25.00%, 10: 8.33%, 14: 16.67%, 21: 8.33% |
| Vehicle green phase duration (seconds) | 18: 8.33%. 20: 8.33%. 27: 8.33%, 28: 8.33%, 35: 8.33%, 40: 8.33%, 42: 8.33%, 43: 8.33%, 50: 8.33%, 62: 8.33%, 68: 8.33%, 98: 8.33% |
| Vehicle red phase duration (seconds) | 14: 8.33%, 15: 8.33%, 19: 8.33%, 20: 8.33%, 24: 16.67%, 25: 8.33%, 27: 8.33%, 37: 8.33%, 52: 8.33%, 60: 8.33%, 65: 8.33% |
| Pedestrian green phase duration (seconds) | 8: 8.33%, 10: 8.33%, 15: 8.33%, 20: 8.33%, 25: 8.33%, 27: 8.33%, 30: 8.33%, 35: 8.33%, 40: 8.33%, 52: 8.33%, 62: 8.33%, 90: 8.33% |
| Pedestrian red phase duration (seconds) | 25: 8.33%, 26: 8.33%, 28: 8.33%, 35: 16.67%, 38: 16.67%, 40: 8.33%, 50: 8.33%, 65: 8.33%, 75: 8.33%, 80: 8.33% |
| Pedestrians’ decision of crossing or not the signalized crossings | Cross: 70.83%, Wait: 29.17% |
Publisher’s Note: MDPI stays neutral with regard to jurisdictional claims in published maps and institutional affiliations. |
© 2021 by the authors. Licensee MDPI, Basel, Switzerland. This article is an open access article distributed under the terms and conditions of the Creative Commons Attribution (CC BY) license (https://creativecommons.org/licenses/by/4.0/).
Share and Cite
Anapali, I.S.; Basbas, S.; Nikiforiadis, A. Pedestrians’ Crossing Dilemma during the First Seconds of the Red-Light Phase. Soc. Sci. 2021, 10, 213. https://doi.org/10.3390/socsci10060213
Anapali IS, Basbas S, Nikiforiadis A. Pedestrians’ Crossing Dilemma during the First Seconds of the Red-Light Phase. Social Sciences. 2021; 10(6):213. https://doi.org/10.3390/socsci10060213
Chicago/Turabian StyleAnapali, Iliani Styliani, Socrates Basbas, and Andreas Nikiforiadis. 2021. "Pedestrians’ Crossing Dilemma during the First Seconds of the Red-Light Phase" Social Sciences 10, no. 6: 213. https://doi.org/10.3390/socsci10060213
APA StyleAnapali, I. S., Basbas, S., & Nikiforiadis, A. (2021). Pedestrians’ Crossing Dilemma during the First Seconds of the Red-Light Phase. Social Sciences, 10(6), 213. https://doi.org/10.3390/socsci10060213


