Abstract
The creation of cities has been one of the most phenomenal achievements of human endeavor. Adults are the major stakeholders for such achievements but the children are helpless and representationless. The current research paper aims at understanding the issues faced by the children in the rapidly urbanized world where the lack of child-friendly environments/open spaces for their outdoor activities is cause for concern. The research paper looked at various national and international norms, standards, and practices of parks and open spaces to identify various child-friendly environmental parameters. The research adopted the Delphi method as a tool for the validation of child-friendly environment parameters. It also used children’s drawings and essays to understand children’s perceptions about the child-friendly environment. It is observed that present government norms and policies do not adhere to those parameters. The research found that Lucknow city does not meet the defined quantitative norms and standards as laid out by the national norms and standards for open spaces and parks. The quality dimensions for planning a child-friendly environment are weakly addressed by cities and neighborhoods. The city neighborhoods lack the physical, cognitive, perceptional, emotional, and social dimensions of a child-friendly environment. There is a need to adopt suitable norms and standards with measurable parameters as part of various dimensions and implement these in creating a child-friendly environment in planned neighborhoods.
1. Introduction
Since the inception of humanity, we have tended to settle in coherent groups that led to the formation of hamlets and villages. With the advent of technology and the expansion of economics, these settlements have begun taking the form of urban areas as we know them now. Population growth and urbanization have led to the emergence of new cities, with the urban population doubling between 1990–2015 in cities with populations of more than 10 million. Around 40 percent of the world’s population is currently accounted for and by 2030, 60 percent of the urban dwellers in developing countries will be under the age of 18 (OECD 2020; UN-Habitat 2020a). The phenomenon of urbanization, which is the culmination of most human inventions, has led to a lot of transformations in society, with improved living standards in some parts of the world, better education and healthcare, and better life expectancy. This has emerged as a spatial outcome of the economic process, leading to the concentration of the population and economic activities in some places (Bhagat 2018). However, in the rush to accommodate millions inside the cities, the phenomenon of urbanization has also come with some perils, such as the fragmented social structure, the lack of green open spaces leading to a sense of alienation from nature, the formation of slums, traffic and congestion, a rise in epidemiological problems, obesity, behavioral problems and related issues such as excessive politicization, and abject poverty as well as crime (Shackel 2011).
Cities impact all of their people in one way or the other. The children of the cities form one of the key stakeholders, who, in this race for urbanization, have been missed out to some extent in terms of planning for and designing a child-friendly environment. The inception of cities, as well as their governing structures, were created by adults and for adults, with the result that all amenities and infrastructures were laid out to cater to the comfort of the adult population, barring a few exceptions (Davis and Jones 1996). Cities have taken several initiatives in providing parks/open spaces for children. These parks and communities show clearly that the various child-friendly environmental parameters have been taken into account, e.g., the Barcelona park has included the health and traffic aspect; Rotterdam, a variety of amenities and facility aspects; Bogotá—safety; Santiago—social interaction; Qian’an—the environment and sustainability; Copenhagen—resilience; and Tirana has depicted that child-friendly urban planning acts as an effective catalyst such as safety, pollution, etc. (ARUP 2017). Although policies are there to cater to the needs of the children, their requirements are often neglected in urban planning processes towards their health and well-being through several dimensions of a child-friendly environment. For children growing up in cities, there are advantages as well as disadvantages—access to better schools, sports facilities, and health care is often in contrast to disadvantages such as pollution, lack of independent mobility, inadequate play spaces, lack of recreational spaces, breakdown of community support structures and lack of open space (NIUA 2017; Agarwal et al. 2019).
Most current Indian cities are not adequate for the healthy growth of children and are host to a multitude of problems as a result of a lack of good quality schools, poor education, poor infrastructure, excessive and also unsafe traffic, where the youthful pedestrians are the main sufferers (Thomas et al. 2012). There is inadequate access to open and green spaces and playgrounds, which seldom have any equipment. Adding to the woes of children is the lack of empathy shown towards their plight by the guardians, who form resident welfare associations whose only aims are to beautify the neighborhood parks and keep the children out of them (Garg 2011). Since there is a perennial struggle for land use in the cities, vote bank politics shapes the urban environment (Benjamin 2008; Vanka 2014). The economic priorities of parents and government agencies do not include youngsters. Nobody vies to appease them in any manner. They lose out on their open spaces where they can play and socialize, as play enhances the social competencies of a child (Navidi 2014). Cities need to be more sensitive to the requirements of children with spaces for the children that are more ecological, safer in terms of traffic and crime, socially livable and have activity spaces. Such cities foster interaction with nature, opportunities for walking and cycling, and active participation in social life, thus improving the health and well-being of children and adults (Thomas et al. 2012). The cities can only be great places for children to grow up in if we offer quality schools and inviting safe play environments. For senior citizens, the presence of the children in public/open spaces can also be life-affirming and rejuvenating. Such an environment develops their capabilities and broadens their horizons (Lansdown 2011).
The enhanced quality of open spaces/environment has a significant impact on children’s personal growth and social interaction (Oloumi et al. 2012). Playing together and conversing can help make neighborhoods truly livable and enjoyable for children. Another possibility for children is to find new friends (Korpela et al. 2002; Castonguay and Jutras 2009; Min and Lee 2006). Sufficient open spaces, and well-planned and designed urban areas are highly relevant in public perception (Ndebele and Ogra 2014). Urban planners need to ensure that these are provided adequately. Well-designed, inviting social spaces are magnets for children and their families as well as city visitors—a place to re-energize and engage minds of all ages together (Thomas et al. 2012). Through such a social place, “children shape their environment and the environment shaped them” (Striniste and Moore 1989). Improvements such as to changes to a playground are good for children because there are more things to do, such as swinging and climbing up a wall, and the playground is more beautiful and green (ARUP 2017).
The United Nations Convention on the Rights of the Child emphasizes the importance of natural environments for the growth and well-being, particularly of children. It recognizes the need for a family environment, an atmosphere of happiness, love, and understanding for the harmonious development and personality of children (United Nations 1989). Children are the biggest users of public outdoor spaces. They use these spaces ten times more than adults (Moore 1986). Active play reenergizes both children and adults, but for children, it is their preferred activity during the day. It is important to keep this in mind when designing urban environments and to remember that a moving child is a learning child. It is noticeable that in recent years, most of children’s leisure time is spent watching TV, and doing other non-physical activities; play is the best remedy for the digital obsession which is a bane of the present generation that spends an enormous amount of time online (Oloumi et al. 2012).
The research question for this research paper is “Do present Indian standards incorporate the quality parameters of a child-friendly environment?” therefore, the research paper aims to review these standards in terms of the parameters responsible for creating a child-friendly environment. The research objectives are: (a) to identify the parameters of the child-friendly environment; (b) to validate these identified parameters from the point of view of experts as well as children; (c) to review the current standards for parks/open spaces with respect to these validated parameters; (d) to understand the consideration of parameters of child-friendly environment in the parks and open spaces of Lucknow city, India.
2. Literature Review
2.1. Parameters of Child-Friendly Environment
The direction of the parameters to analyze child-friendly open spaces/environment suggests various factors within the parameters that need to be emphasized viz. flexibility, variety, and accessibility of the physical environment; also included are creativity, accomplishment, and participation through cognitive skills, etc. Ward (1978) in his book The Child in the City, had lamented up on the lack of safety, isolation, traffic, physiological and emotional wellbeing of the children in urban areas. The major hindrances to the development of a child-friendly environment are the fear of crime and poor layout of communities that are not conducive to children and their activities (Frumkin et al. 2004; Lynch 1977; Gibson 1979; Kytta 2004).
Hart (2002) elucidates the physical, intellectual, social, and emotional needs for the creation of a child-friendly environment by providing safe access, quality, organized sports, freedom, creativity, resourcefulness, inventiveness, flexibility, diverse topography, diverse vegetation, and diverse surface materials. It has been found that a built environment that affords a child to be cognitively alert to external stimuli through movement and social action will encourage him or her to affiliate or create bonding with it. (Chawala 1992; Kahn and Kellert 2002; Malone and Tranter 2003) in their research on the use and design of playgrounds discussed the various methods of involving children in the design process and conclude that location, access, material, positioning, the scale of play equipment, organization of the place and safety are the vital factors for consideration while designing child-friendly spaces. Most of the studies conducted in the last two decades found that playgrounds and sports facilities were located in likable spaces (Tandy 1999; Korpela et al. 2002; Min and Lee 2006, Castonguay and Jutras 2009).
Safety was always a primary requirement. Kingston et al. (2007) advocate safe crossings on the way to schools, safe play spaces, child-friendly toilets, child amenities, and facilities. They also emphasized community gateways, shady places, common areas for gathering together, gardens that were both wild and cultivated, outdoor arts, improved multipurpose fields, improved hard surface games, play equipment that included education elements for mental development, and the enhancement of creativity to promote a child-friendly environment. Stevenson (2007) focuses on the significance of safe walking, cycling, and play so that there is a focus on the health of children in the built environment. This aspect has also been seconded by Veitch et al. (2006).
Rutledge (1981) highlights environmental diversity, identity, flexibility, and visual richness as well as character and scale as considerations while designing public parks with children at the forefront as users. Public parks include metaphysical aspects of child-friendliness and focus on friendship as a primary driving force for children (Chatterjee 2006). According to Chatterjee, parks act as promotional areas for the investment of emotional resources, cognitive resources, and social resources, which are essentials in any society. Therefore, her focus was the development of mutual affection and regard, shared interest, and activities. She felt an environment that promotes learning, loyalty, creativity, private space, freedom of expression is essential while planning and designing a child-friendly environment. Nordstrom (2010); Zhang and Li (2017) have also emphasized a child-friendly perspective on space. Mohammadi et al. (2015) similarly focused on child-friendly factors in urban spaces, emphasizing the need for accessibility, depth of perceptible space, visual range, diversity in height, and color. Horelli (2007) suggested a structured questionnaire to identify at least ten qualities of environmental child friendliness in her research and proposes that human scale, flexibility, meeting places, nature and technology should be focal points in determining child-friendly environments. Said (2007); Adams et al. (2018) endorsed the socialization dimension of sustainability.
Interestingly, Miller (2009) proposed nine contrasting dimensions to be taken into consideration while designing child-friendly environments. These are accessible/inaccessible, active/passive, challenge/risk, insecurity/security, hard/soft, natural/artificial, open/closed, private/public and simple/complex. Most of the literature provided detailed examples of how children can be involved in drafting local action plans such as those discussed in children’s participation (Hart 1997), changing places (Adams and Ingham 1998), creating better cities for children and youth (Driskell 2001), and creating child-friendly cities (Gleeson et al. 2006). These researchers also raise several practical planning and design issues and offer recommendations about the focus on the physical environment of communities.
This research identifies the key parameters that are highly relevant to the child-friendly environment for overall child development using the open spaces/parks of neighborhoods. The significance of child-friendly environment parameters is highly critical in the planning and development of child-friendly open spaces and includes a wide range of dimensions, namely safety, diversity, social interaction, accessibility, play variety, aesthetics, independence, sense of belonging, natural attributes, adventure, amenities and facilities, traffic, the scale of play equipment, walkability, openness, pollution, location, organization of space, visual range, comfortability, and visual instructions. These dimensions are referred to by various scholars as highlighted in Table 1.

Table 1.
Priority List of Parameters of Child-Friendly Environment (CFE).
The key aspect appearing from previous research highlights the challenges for planners and advocates of public health to recognize the link between spaces that we call the “Child-Friendly Environment” and how they impact the lives of the children who use them. It is observed that safety and security are more important to children from metropolitan areas, as well as the dimension of urban and environmental qualities. The various studies show that aspects such as amenities and facilities, openness, visual instructions, cleanliness, walkability, adventure, etc. all played a vital role in enabling children to effectively utilize these spaces. Horelli (1998) promotes “Complex multidimensional and multilevel spaces …where young and old can experience a sense of belonging whether individually or collectively”. The researchers also emphasize that these open spaces should be “inclusive and democratic” so that they promote active play and creativity (Thomas et al. 2012).
2.2. Open Space/Parks Standards
Prevailing international, as well as Indian standards for open space/parks, were reviewed further with respect to the parameters for child-friendly environment identified through the literature study. Open spaces and parks were selected for this research as these are the spaces where children remain for maximum times after home and school. The literature has also highlighted the important role of green spaces in the health and well-being of the population, particularly children, as one of the main user groups.
2.2.1. International Standards
The open space standard has four dimensions of implementation, i.e., quantity, accessibility, quality, and locality in various developed countries (Jafrin and Beza 2018). The quantity standard is the total area of publicly open and green space in hectares per 1000 people or area in square meters per person. Britain has followed the standard of 6 acres of open space per 1000 population, i.e., 24 sq. meter per person as per guidelines by the National Fields Association (now Fields in Trust) since 1920 (Theobald 1984), whereas the USA and Australia follow the standard of 4 acres of open space (Jafrin and Beza 2018) and 2.83 ha per 1000 persons (Veal 2012), but Germany reduced it to 0.5 ha per 1000 persons (Awad 2018). The Open Space Standards suggested by World Health Organization (WHO 2012) is 9 m2 per person. The UN-Habitat (2020b) suggests 15 percent of land should be allocated to open spaces, green spaces, and public facilities (see Table 2). The accessibility standard refers to how close people should be to their nearest public usable open space. International research into the impacts of green space on health and wider quality of life shows that having green space within a 5-minute walk from home is a strong indicator for health and quality of life benefits (Bell et al. 2008). The British standards for accessibility recommend 300 m to the nearest 2 ha green space, 2 km to the nearest 20 ha green space, 5 km to the nearest 100 ha green space, 10 km to the nearest 500 ha green space (Awad 2018).
Table 2.
Open Space Norms.
The USA, UK, and Australia also recommend accessibility and quality dimensions to measure open space. The quality dimension is an indicator that identifies the satisfaction level of infrastructure and landscape features present in particular open spaces. Last but not the least, the dimension of an open standard is locality, i.e., local authorities should derive standards within the statutory development plan and these standards should be based on the local assessment of needs instead of a national standard. In the USA and the UK, local bodies assess open space or green park development concerning local requirements, conditions, and environment. Therefore, it is very clear from Table 3 that countries such as the USA, UK, Australia, and others follow all four dimensions, while Australian cities have three dimensions, i.e., quantity, quality, and accessibility (Jafrin and Beza 2018).
Table 3.
Dimensions of Open Space Standards.
2.2.2. International Cases
The international cases included in the study represent rapidly urbanizing growth (see Table 4) where the implementation of the concept of the child-friendly environment has been suitably implemented and the Rights of Children given due cognizance. In a world that is becoming increasingly urbanized and decentralized the local stakeholders as well as UNICEF and other agencies can help to create safe, inclusive, and the child–responsive cities and communities.
Table 4.
International Cases of Child-Friendly Cities.
The cases highlight that maintaining and developing parks and open spaces are very important aspects for making a child-friendly environment in cities. If we are creating a child-friendly environment in cities, issues such as health and wellbeing, nature and sustainability, local economy, resiliency, etc. are automatically resolved. Cities become friendly not merely for children but satisfy the needs of other inhabitants of different ages and genders (Dhar and Thakre 2020).
It is found that many developed foreign countries have clear-cut demarcation of quantity as well as qualitative parameters for the planning and designing of parks and open spaces. Location and accessibility parameters were also being considered for the planning of open spaces/parks. From the study of the case areas, it is seen that many foreign cities have created a child-friendly environment by incorporating various parameters such as safety, diversity, social interaction, play varieties, aesthetics, independence, natural attributes, adventure, amenities, and facilities, traffic, and walkability.
2.2.3. National Standards (India)
As per the Urban Regional Development Plans Formulation and Implementation (URDPFI) Guidelines TCPO (2015), open spaces can include the following three categories, namely (a) Recreational space, (b) Organized green, and (c) Other common open spaces such as vacant lands/open spaces including flood plains, forest cover, etc. in plain areas. Considering open spaces, including all the mentioned categories, a provision of 10 to 12 m2 per person may be desirable. In the present scenario, the City Development Plan considers recreational land use in urban centers as 12–14% for small and medium cities and 14–16% for large and medium cities (Refer Table 5).
Table 5.
Recreational Land Use Structure for Developable Area in Urban Centers.
The URDPFI guidelines (TCPO 2015), also suggest the distribution of open and green spaces (See Table 6).
Table 6.
Open and Green Space Distribution.
The distribution of this land use covers a “Housing Area Park” of 0.50 ha per five thousand population; a “Neighborhood Park” of 1.00 ha per fifteen thousand population; a “Community Level Park” of 5.00 ha per one lakh (100,000) population; a “District Park” of 25 ha per five lakh population; and a “Subcity Park” of 100 ha per ten lakh population (Table 7).
Table 7.
Zonewise Existing Situation of Open and Green Spaces in Lucknow City.
As per the Urban Green Guidelines (TCPO 2014), and URDPFI Guidelines (TCPO 2015) of the Ministry of Urban Development, the proportion of recreational areas to the total developed area should be between 12–14% in small towns, 18–20% for medium towns and 20–25% in metropolitan cities. Further, recreational space is categorized as open space in revised URDPFI Guidelines (TCPO 2015) as 1–2 ha per 1000 persons for small towns, 1.4–1.16 ha per 1000 persons for medium towns, and 1.2–1.4 ha per 1000 persons for a large city, metropolitan and megapolis. It states that areas under parks, playgrounds, botanical gardens, open spaces, bodies of water, and other natural features, will be considered as recreational areas. It also says the different open spaces need to be interlinked by providing connectivity and linkages and should be maintained/developed in an integrated manner. These have to be properly maintained in terms of irrigating the plants/trees and making the provision of pruning at regular intervals.
3. Case Study: Lucknow City
Lucknow is the capital city of Uttar Pradesh, the most populated State of India. The city is challenged with various problems due to urbanization and this has impacted on planning and development of appropriate spaces for a child-friendly environment. The development of the city is managed by the Lucknow Development Authority (LDA), and Lucknow Municipal Corporation (LMC), which follows the national standards on parks and open spaces of cities. The city has 110 administrative wards consisting of eight zones (Figure 1). The total population of the city is 2.8 million and the number of children aged 6-14 years is 833,859 as per the 2011 census.
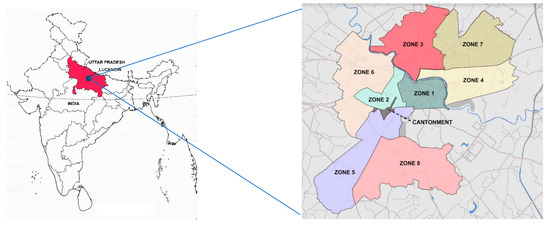
Figure 1.
Location of Lucknow city and municipal administrative zones.
The findings about a child-friendly environment for the city can be implemented in other capital cities of the same magnitude and characteristics and these cities can be a model for developing child-friendly environments in cities in the rest of in India.
The standards of planning of open spaces/park are governed by the national policies, therefore the spaces in Lucknow are observed to have a lack of other qualitative parameters. To examine the existing situation of quantitative parameters for parks/open space standards, various zones in Lucknow City were analyzed (Figure 2).
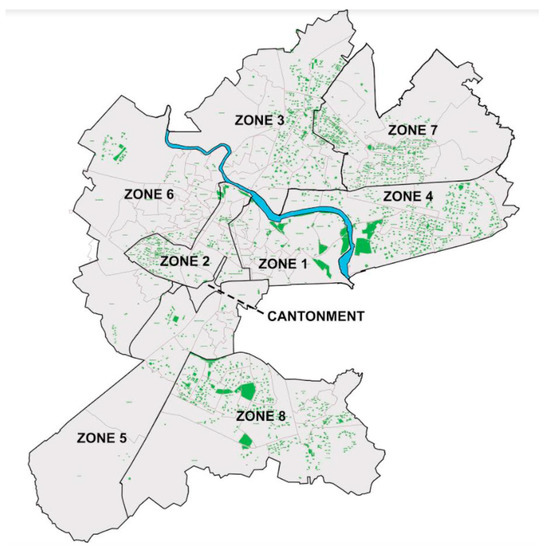
Figure 2.
Regional Open/Green Spaces, Lucknow City.
It was found that the condition of parks of various zones of Lucknow is critical and open space/parks standards are not even as per the first dimension, i.e., quantity. None of the zones has neighborhood open spaces as per the norms. According to the URDPFI Guidelines (TCPO 2014), they should be 14–16% of the total area of the city, but as per Table 7 the open spaces occupied only 2.67% within Lucknow city boundary, which shows the reality of park and open spaces are far away from the standards. This shows that the parks and open spaces of Lucknow city are very far away from the quantitative and qualitative dimensions (Figure 3).
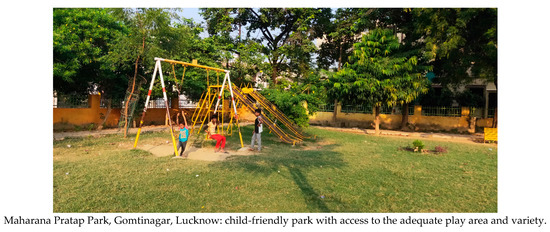
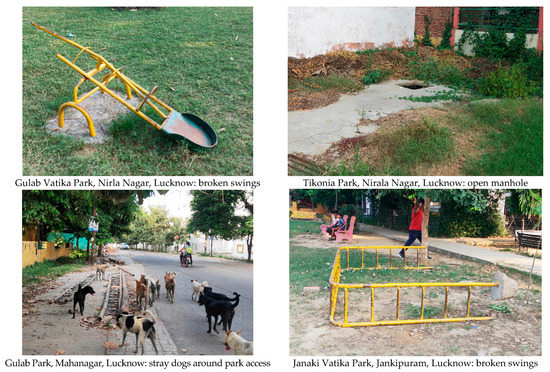
Figure 3.
Child-friendly and unfriendly spaces in Lucknow city.
4. Materials and Methods
Research determines the various broad parameters needed for the child-friendly environments based on the studied literature of forty research papers, as well as the preference given to those parameters by various professionals and stakeholders, i.e., the children.
The research incorporates the Delphi method with a statistical analysis tool for the validation of the identified parameters through the literature. It is a structured communication technique or method originally developed as a systematic, interactive forecasting method that relies on a panel of experts (Adler and Ziglio 1996; Delbecq et al. 1975). Two different target groups—professionals/experts from the built environment sector and children—were included for ascertaining relevant parameters associated with child-friendly environment. The sample size included 47 professionals/experts such as architects, planners, psychologists, and pediatricians that were approached for the Delphi process, and 59 children in the age group of 6–14 years for a drawing assessment (Khan et al. 2020) and essay writing to arrive at the consensus about the parameters that are most appropriate in the Indian context.
The first round involved the validation of the key parameters emerging from the detailed literature review. The second round involved sharing the results obtained from the first round and the third round involved the final consensus on the parameters that are more relevant to the child-friendly environment. From the initial 23 parameters, 19 parameters were shortlisted from the Delphi outcome. These identified parameters were grouped into five categories, namely Physical, Cognitive, Emotional, Perception, and Social, from the professionals/experts cohort. Statistical techniques such as one-way ANOVA and two-way ANOVA were carried out to analyze and validate the results.
As the stakeholders of the research are children, the research is also incorporated to validate the above-identified parameters from them. Fifty-nine children aged 6 years to 14 years, belonging to various neighborhoods of the eight zones of Lucknow city were asked to make a drawing of the park “A Park Where I Wish to Play” and an essay on “A Park Where I Go to Play”. The children participated happily in both the events and the researcher was friendly with children so that they can become involved in these exercises fully without any hesitation. All the drawings and essays were collected and content analysis was carried out by an expert in child psychology to obtain the children’s perceptions about the child-friendly Environment. The parameters identified through the literature survey were also observed through content analysis of both the exercises completed by children.
The research was approved by the Research Degree Committee of Dr A.P.J. Abdul Kalam Technical University before Delphi feedback was taken from the panel of professionals/experts, and engagement with the group of children on drawing and essay writing. The respondents were briefed about the ethical considerations and consent was provided by the expert panel and the group of children before the engagements were carried out. Only those children who showed interest were allowed to participate. Verbal consent was taken from participating children and parents (Sondergaard and Reventlow 2019; Thomas and O’Kane 1998). The interaction with children was carried out and children were asked to draw in a friendly environment. The children were provided with the option to leave the drawing/engagement, but no one left and they participated happily. A child’s choice not to participate must always be respected (Crane and Broome 2017). The children’s assent for participation was obtained prior to their engagement in the process (Tait and Geisser 2017).
The research examines various texts focusing on societies and cities that are described as child-friendly along with the practices that are enabling them to achieve child-friendly spaces and settings. The research looked at the various national and as well as international standards for parks and open spaces. The research also measured the area of parks/open spaces in different planning zones of Lucknow City to verify with the standards provided for the same.
5. Analysis and Results
5.1. Identification of Child-Friendly Parameters
Figure 4 highlights the literature review findings (See Table 1). The safety, diversity, social interaction and accessibility, and play variety appear as the top five parameters most commonly identified and reported by scholars for the child-friendly environment. The parameters such as aesthetics, independence, sense of belonging, natural attributes, adventure, amenities and facilities, traffic, the scale of equipment, walkability, openness, pollution, location, and organization of space as other parameters form, among others, highly relevant parameters for a child-friendly environment. The visual instructions are considered the least important factor among the parameters. However, the parameters are spread across factors such as Physical, Cognitive, Perceptional, Emotional, and Social Dimensions of the child-friendly environment.
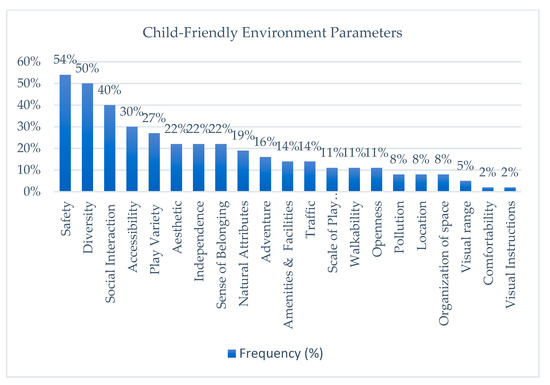
Figure 4.
Findings of the literature review.
These identified parameters from the literature study were of foreign context, therefore these were validated by the experts with respect to the Indian context through the Delphi Technique.
5.2. Validation of Parameters for Child-Friendly Environment by the Experts
Experts were selected from the various fields responsible for planning and designing open spaces/parks and understanding children’s behavior and their health issues. Therefore, experts—architects, planners, psychologists, and pediatricians—who had working experience of more than ten years with respect to children or spaces related to children, were selected for this research. The results of Figure 1, i.e., the frequency of the parameters found in the literature, were discussed with the experts through the Delphi Technique.
To assess whether the variables of the survey have any variation within and among the groups of experts, an Analysis of Variance was performed based on the primary survey of built environment professionals/experts. The one-way ANOVA was applied, which had discrete values. The dependent variable in this analysis was taken as the district and the independent variables are the same as identified in the study. The one-way ANOVA test was performed on each of the parameters to check the mean value variation among the professionals on each parameter.
Table 8 shows the result of the one-way ANOVA performed to the single factor of accessibility. The result displays the summary of the test and then provides us with the F value of the parameter and the Fcrit (F critical value). Since the F value (1.425) is less than the Fcrit value (2.821) it can be said that the variance in the data as per the different professionals is under the critical limit, so the mean is more or less in the same group. This way we can hypothesize that accessibility is the parameter where different professionals have the same opinions and there are not many differences among them.
Table 8.
One-Way ANOVA.
Similarly, the test was performed using the Microsoft Excel sheet on each of the parameters and similar values for each of the parameters were achieved. See Appendix B for the F value and the Fcrit value for each of the parameters. The value of the F is in each case below the critical value so therefore in each case, a similar inference can be drawn that the parameters do not face variation in the idea of acceptance from the various professionals.
To assess whether the variables of the survey together have any variation within and among the groups, an Analysis of Variance was performed and a two-way ANOVA was applied. This was applied to variables that had discrete values. The dependent variable in this analysis was taken as the professionals and the parameters were grouped. To proceed further with the test the two null hypotheses were proposed, which were:
Hypothesis 1 (H1).
That the mean of observation grouped by the professions are the same.
Hypothesis 2 (H2).
That the mean of observation grouped by the parameters are the same.
The detailed tables and observations are shown below:
The test results are summarized based on the observations. Since the two-factor ANOVA requires discrete data of the same number of samples in each group, the data that provided is in an aggregated form in the groups as per the means of each group. The data in discrete form only deliver the six samples as the minimum numbers for observation; these data were from the pediatricians where six data samples were available. The data are the same as presented earlier in the stack graph where the mean values of the parameters were compared among each other.
From the result, it is evident that the F value is less than the critical value only in the second case (Table 9). Therefore, there is no variation in the datasets among the columns but the F value is higher than the fcrit value in the first case, i.e., among the rows. Therefore, there is variance among the datasets in the rows. This makes us accept our second null hypothesis and makes the first one void.
Table 9.
ANOVA: Two-Factor Without Replication.
This brings us to the conclusion that the parameters set earlier for the analysis of the child-friendly cities are acceptable at large after the survey was conducted. The variance of acceptability of the parameters is under the critical limit, thus professionals from each group can identify the parameters acceptable to each other. The F value is more than the F crit value. It can be seen from the two-factor ANOVA (Table 9) among the groups that the value of interaction F is 11.24 and the value of F crit is 2.75. This suggests that there is variation among the professional groups when the values are arranged under each parameter. Additionally, the F value of interaction F is 1.745 and the Fcrit value is 1.747 when we arrange the groups columnwise (each parameter’s data under all the professionals headings), which is slightly less than the critical value. Hence, the acceptance of the variable by each professional group is established. Although the presence of the variables over each other is different the consensus can be established over the various groups. There is also enough variance among the groups of professionals over each parameter when observed individually. This establishes a check that the ratings for each parameter are not treated the same by each group and there is a lack of consensus. This proves that although the perceptions of the groups of professionals are not influencing each other, there is still a consensus on the validity of parameters. Hence, the parameters are validated within the Indian context.
5.3. Validation of Parameters for Child-Friendly Environment by the Children
The planning and development of the child-friendly environment ecosystem at a neighborhood and city level involves wider engagements. In planning projects, engagement/consultation with key stakeholders is critical and it often defines the success/failure of the projects. The children form one of the key stakeholders at the neighborhood level and cities need to understand their perceptions about open space and park environments. The parameters identified through children’s engagement/participation in understanding more about the child-friendly environment address the inclusionary process in the planning and development of child-friendly cities and thus help with the overall results. The results obtained from children’s participation can be further instrumental in detailing some of the finer aspects around planning and development of a child-friendly environment.
A total of 59 children, aged between 6 years to 14 years, were selected from various zones of Lucknow city. Children in these age groups can express their views through drawings and essays. The children participated happily in both the events of drawing and essay writing. All the drawings and essays were collected and content analysis was carried out to obtain the children’s perceptions of their neighborhood. The parameters identified through the literature survey were also observed through content analysis of both the exercises undertaken by children (Ghanbari-Azarneir et al. 2015).
Children’s drawings about “A Park Where I Wish to Play”:
Through content analysis of drawings, it is found that children have expressed “accessibility”, “amenities and facilities”, “openness”, “walkability”, “play variety”, “safety”, “freedom of movement”, “sense of belonging”, “diversity”, “biotic attributes”, “aesthetics”, “scale of play equipment”, and “social interaction” as the major parameters. The “location” parameter did not feature enough in the reflection of the drawing. The children did not give enough reflection of “openness”, “traffic” and “pollution”, and “scale of play equipment”. This was discussed with a psychologist and the feedback was that some of these relevant factors cannot be expressed by children through drawings.
The children’s drawings showed their perception about child-friendly environment dimensions (Figure 5).
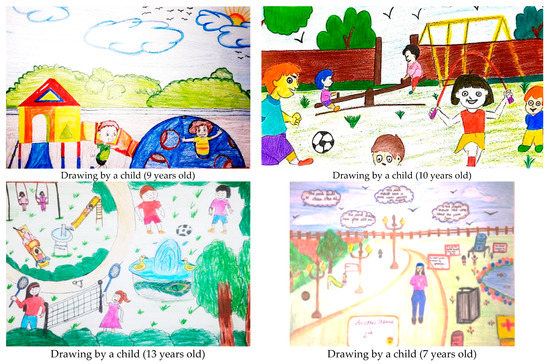
Figure 5.
Children’s drawings about “A Park Where I Wish to Play”.
Children’s essays on “A Park Where I Go to Play”:
Analysis of the content of the essays revealed the current problems faced by the children in their neighborhood parks/open spaces. One of the children—Boy-1, 12 years of age, resident of Vivekkhand, Gomtinagar, Lucknow, stated —“Parents do not allow us to play unmonitored as the neighborhood is not safe due to the heavy traffic flow. There are no proper amenities in Neighborhood Park. Broken swings, run-down slides with sharp edges pose serious hazards”.
Boy-2, 8 years of old age, from Vivekkhand, Gomtinagar, Lucknow feels—“The park makes the neighborhood more beautiful. It becomes a gathering place for all the residents of the neighborhood, where they can chit--chat with each other and the kids can play. There is clean air and we enjoy the evenings spent at the park”. It was found that the children were aware of the problems related to the open spaces/parks in their neighborhoods such as traffic, safety and security, play varieties, natural attributes, amenities and facilities. Children’s essays also validated the parameters of the child-friendly environment.
5.4. Reviewing the Standards of Parks/Open Spaces
After reviewing the national and international guidelines/norms and standards related to parks/open spaces it is quite apparent that all the Indian open space standards have only one dimension of open space standard, i.e., quantity only. Other dimensions related to the identified parameters for evaluating a child-friendly environment, such as the of Physical, Cognitive, Perception, Emotional, and Social categories, are generally lacking. However, the Atal Mission for Rejuvenation and Urban Transformation (MOUD 2015) highlights that during the process of planning the Urban Local Bodies (ULBs) will strive to include some smart features in the physical infrastructure components. The development of green spaces and parks should have special provisions for child-friendly components. Globally, the average per capita green space allocated by cities ranges from 25–100 m2 (TCPO 2014), whereas most of the Indian cities are far behind in the quality as well as quantity of urban open spaces/parks (See Appendix A) compared to their counterparts in other regions such as Australia, Europe, and North America.
6. Discussion
The paper examines the parameters of a “Child-Friendly Environment” in a planned neighborhood based on the evaluation of the extensive literature research, norms and standards, and case study to formulate the parameters for child-friendly environment. The paper also lists the “Open Space Standards” from various countries and organizations and it had been observed that Indian standards do not have quality dimensions for creating parks and open spaces. Today’s population is burdened by high rates of mental illnesses, particularly depression and what are commonly referred to as “lifestyle diseases”—which are a result of the obesogenic environment that we all live in. This lifestyle has affected all the age groups of the population. However, it has impacted children adversely, and as a result of suffering a lot due to the absence of a friendly play environment, they are being lost in the digital world and developing health issues. One expert of the Delphi Panel, Expert 1, who is a practicing child psychologist who has more than twenty years of experience, feels—“Child-friendly environment is certainly very important for our society as we can see there is a scarcity of quality of playing area that is why children are always busy with the mobile and internet”. Another expert from the same panel, Expert 2, who is a pediatrician and has been practicing in Lucknow for the past twenty-two years, also feels that—“We must be very careful and sensitive while dealing with emotions of children.” Expert 3 is resident in Lucknow, has more than 25 years of experience and has planned and designed many residential apartments, parks, and schools, also tells us—“Neighborhood parks are breathers in terms of social activities, festival gatherings, kids playground, an interactive place which bring people close to each other but the present scenario has restricted everything”. Expert 4, who is former Chief Architect Planner for the Uttar Pradesh Housing Board, Lucknow, with more than fifty years of experience, states—“Parks are the enclosed green open spaces which are used by all age groups. However, the activity level for different age groups varies. For children, they primarily act as a playground; for the youth, they act as socializing spots; while for the elderly, they mainly act as a leisure space. For making the parks ‘children friendly’ these must provide ample play areas which should be safe and secure”. It is found that the experts were of the opinion that this is not enough to provide open spaces in terms of quantity only; instead, qualitative dimensions play an important role in the planning and designing of open spaces or parks in the neighborhood through which children can undergo physical, cognitive, perceptional, emotional and social development.
Most of the previous research has identified some findings on limited parameters of child-friendly environment; however, this research paper identifies the key quality parameters that are highly relevant in creating open spaces for child-friendly environment. The parameters for evaluating the child-friendly environment in the Indian context identified, selected, and validated by the field experts and children from the primary survey are mentioned below under five broad categories (see Table 10). Hence, the research proves its objective of identifying and validating the parameters for the child-friendly environment.
Table 10.
Factors for Evaluating Child-Friendly Environment.
The allocation of open space as per international institutions varies, with the provision of at least 15 percent of the total land (UN-Habitat 2020b) and 9 m2 as a standard (WHO 2012). The developed countries are found to have higher per sq. meters of open space, ranging from 16–28 m2 per capita, as compared to India with 10–12 m2. The implementation dimensions of open space standards cover quantity, quality, accessibility, and locality. The international cases reflect that countries have mainstreamed child-friendly environment through a thematic approach for the quality of open spaces. The thematic areas span across various aspects of city master planning/development undertaken by cities, such as well-located public spaces, safe green spaces integrated into the culture, social activities, attractive landscape, and activity points, among others.
However, in the Indian scenario, the open spaces are generally classified into recreational space, organized green spaces, and other common spaces and vary from 12–16% based on the land use system in small, medium, large and metropolitan cities (TCPO 2015). Lucknow city is far away from the fulfillment of the required norms of the quantity dimension. Not only Lucknow but most Indian cities also lag in terms of parks and open spaces (see Appendix A). Hence, as per the research objective—“To know the consideration of parameters for the child-friendly environment in the parks and open spaces of Lucknow city, India.” The above research proved that the parks and open spaces of Lucknow city have no consideration of child-friendly environment. There might be urban open spaces as per standards for the neighborhood but without quality, these are meaningless and are unable to function as livable activity spaces. When we discuss the quality of parks and open spaces, we must consider children and the environments they prefer because the first user group of the park is the children. The essays and drawings of children also convey the same.
One of the children—Boy, 3 of 10 years age from Sector-B, Indiranagar, Lucknow, stated that—“Neighborhoods are considered to be indispensable elements of urban space. Our park is in a disheveled condition. It has tall grasses and entering it is such as entering the Amazon Forest. People throw their waste in the park and it has got new colonies of ants and is infested with dogs. Due to no support from the neighbors, the structures in the park are not been repaired and there is no place to play. There is an abandoned and useless pump house at one corner, which is occupying space undesirably”. He very innocently expressed his problems, which he is facing in neighborhood parks/open spaces. In the same way, another child—Girl 4, 6 years of age, lived in Vineet Khand, Gomtinagar, informed us that—“Some bike drivers drive as though they are driving in a racing game. Young boys drive bikes and scooters at very high speed causing inconvenience to us, while we walk to the parks”. She also told us in her writings about the problems she is facing in accessing the neighborhood parks/open spaces. Therefore, while designing the parks/open spaces one has to incorporate the perceptions and views of children of various age groups, neglecting the previous approaches of the design in which their requirements were assumed as per the views of adults. The above statements of children show that they want quality spaces for the child-friendly environment.
Child-friendly environment dimensions/parameters cannot be separated from the open spaces and parks. The planning norms and standards cover them but are not seen to be implemented on the ground in the Indian scenario. The open space and parks have multiple dimensions and act as a common link in the cultural and social activities, and emotional relationships of children with the elderly as well. The environmental and infrastructure dimensions play critical roles in the perception of the quality of the open spaces and parks and create a negative impression of the child-friendly environment if the necessary parameters are not well attended to in terms of appropriate infrastructure provision and its service delivery.
To make them livable for children, these parks should possess the qualities wherein children can actively be involved, enjoy themselves, interact socially and feel free to move without fear, without danger, and without any hesitation. There is a greater need to develop a child-friendly environment that should incorporate the standards within the statutory Local Development Plans and should set a methodology for the quality assessment of these parks and open spaces. Therefore, local authorities should develop suitable guidelines incorporating child-friendly parameters, defined by this research, as well as other researchers, instead of depending only on national standards. The listed parameters can be made applicable in the implementation of Atal Mission for the Rejuvenation and Urban Transformation (MOUD 2015) as per the local requirements of the city where these parks are being located.
The multi-dimensional parameters identified from the research highlight the need for better provision of norms and standards in areas of child-friendly environment of open spaces and parks. At last, the question arises that why parks and open spaces should be planned and designed for friendly to children only? The justification is, if a space or environment is friendly to children, it will also satisfy the needs of other age groups of the population.
The research was limited to identifying the parameters in areas of a child-friendly environment and was based on evaluating the norms and standards with selected global cities, Indian cities, and was supplemented by a case study from Lucknow city. There is further research scope to perform a comparative analysis among the neighborhood parks/cities taking into wider socio-demographic factors, spatial dimensions, planning, governance, and the management of such spaces for children. The research can be further linked to the impact of such environment/healthy spaces on children, community participation, and development.
7. Conclusions
From its earliest beginnings planning, as a profession, has been driven by the desire to improve the living conditions of the population. Children are considered to be the most vulnerable members of the population, therefore the child-friendly initiative was launched in 1996 to initiate the challenge of realizing the rights of children in a rapidly urbanizing and decentralizing world. There is a need for a clear understanding of the issues for the formulation of clear-cut parameters required for the creation of a child-friendly environment. These have been identified by this research in the form of physical, cognitive, perceptional, emotional, and social categories. The research highlights that various professionals, such as child psychologists, architects, planners, and pediatricians, as well as children agree with the parameters listed in the research. The challenge for planners, architects, and public health advocates, as well as children, is now, therefore, to recognize the link between the built environment and the current problems that affect children so that the custodians of child-friendly environments implement the necessary measures for rectification through parks, open spaces, and green environments. Government should come forward to incorporate the identified quality dimension with the standards of parks and open spaces. There could be guidelines for the creation of a child-friendly environment in the parks and open spaces by the government. These guidelines should be for the physical planning and design of the park and open spaces. Thus, children must be consulted first, for the planning and designing of the parks and open spaces, so that these spaces could be transformed into child-friendly spaces or as per their wishes. In this way, these spaces will provide opportunities for the overall development of the children.
Children function for the rest of society as the “Canary in the coal mine”. It must be kept in mind that children are a universal indicator of states of human development and the well-being of society. This study is limited to open spaces and parks in an urban environment, but there is scope for developing child-friendly spaces in health, education, recreational and commercial spaces.
Author Contributions
Conceptualization, M.K.A. and V.S.; methodology, M.K.A. and V.S.; software, M.K.A.; validation, M.K.A.; formal analysis, M.K.A. and V.S.; investigation, M.K.A.; resources, M.K.A., V.S., A.O.; data curation, M.K.A.; writing—original draft preparation, M.K.A.; writing—review and editing, M.K.A., V.S., and A.O.; visualization, M.K.A.; supervision, V.S.; project administration, M.K.A. All authors have read and agreed to the published version of the manuscript.
Funding
This research received no external funding.
Institutional Review Board Statement
The study was conducted according to the guidelines of the Declaration of Helsinki, and approved by the Institutional Review Board/Research Degree Committee of A.P.J. Abdul Kalam Technical University (Protocol 13ARCH1332 approved on 9 December 2019).
Informed Consent Statement
Informed consent was obtained from all subjects involved in the study.
Data Availability Statement
Data presented in this study are available on request from the corresponding author.
Acknowledgments
The authors sincerely acknowledge the efforts and support of professionals/experts who were part of the Delphi panel, the children and their parents, and all those who responded and helped at various stages of completion of the research work. Special gratitude to the reviewers for their constructive valuable inputs and feedback for improving and strengthening the research paper and addressing the missing links and gaps.
Conflicts of Interest
The authors declare no conflict of interest.
Appendix A
Table A1.
Area Under Park and Open Spaces in Indian Cities.
Table A1.
Area Under Park and Open Spaces in Indian Cities.
| S.N. | Master Plans | Existing Scenario of Recreation/Open Space | Proposed Scenario of Recreation/Open Space | ||||||||
|---|---|---|---|---|---|---|---|---|---|---|---|
| Land Use Year | Population | Total (Ha) | Rec. Open Space | Open Space m2/capita | Prop. Land Use (Year) | Population | Total (Ha) | Rec./Open Space | Open Space m2/capita | ||
| 1 | Chennai | 2006 | 4,509,210 | 17,553 | 366 | 0.81 | 2026 | 12,582,000 | 17,617.7 | 1000.65 | 0.80 |
| 2 | Varanasi | 1999 | 1,091,918 | 14,494.4 | 2705.76 | 24.78 | 2011 | 1,201,815 | 17,927.22 | 984.47 | 8.19 |
| 3 | Jaipur | 2011 | 3,073,350 | 30,830 | 3461 | 11.26 | 2025 | 6,495,000 | 19,800 | 5745 | 8.85 |
| 4 | Ghaziabad | - | - | 8445 | 399.5 | - | 2021 | 2,300,000 | 15,554 | 2484 | 10.80 |
| 5 | Bhopal | 2005 | 1,571,182 | 17,500 | 2925 | 18.62 | 2028 | 352,000 | 15,572.12 | 646.46 | 18.37 |
| 6 | Portblair | 2001 | 99,984 | 1774 | 101.25 | 10.13 | 2021 | 4,500,000 | 41,360 | 8400 | 18.67 |
| 7 | Lucknow | 2004 | 2,358,393 | 16,270 | 2455 | 10.41 | 2021 | 1,270,000 | 21,570 | 5000 | 39.37 |
| 8 | Greater Noida | 2011 | 107,676 | 13,570 | 3000 | 278.61 | 2031 | 149,256 | 1500 | 240 | 16.08 |
| 9 | Tara Taran | 2010 | 72,337 | 569 | 63.7 | 8.81 | 2031 | 149,256 | 1500 | 240 | 16.08 |
| 10 | Srinagar | 2000 | 1,200,000 | 11,527 | 481.31 | 4.01 | 2021 | 2,350,000 | 23,853.94 | 2853.01 | 12.14 |
| 11 | Allahabad | 2001 | 1,081,622 | 21,689.13 | 2602.696 | 24.06 | 2021 | 2,043,735 | 30,917.38 | 4953.47 | 24.24 |
| 12 | Ludhiana | 2007 | 1524,081 | 127,122 | 300 | 1.97 | 2021 | 4,800,000 | 127,122 | 7416 | 15.45 |
| 13 | Batla | 2010 | 190,418 | 1474.19 | 11.9 | 0.62 | 2031 | 346,651 | 3467 | 346.7 | 10.00 |
| 14 | Noida | 2010 | 1,068,228 | 9210.74 | 1761.98 | 16.49 | 2031 | 2,500,000 | 15,279 | 2432.82 | 9.73 |
| 15 | Amritsar | 2010 | 1,976,050 | 139,419.5 | 186.8 | 0.95 | 2031 | 3,017,936 | 16,594 | 2489.1 | 8.25 |
| 16 | Banglore | 2003 | 6,501,343 | 42,141 | 1310 | 2.01 | 2011 | 8,015,000 | 56,463 | 7788 | 9.72 |
| 17 | Mysore | 2009 | 7,786,510 | 27,864.32 | 766.31 | 0.98 | 2031 | 2,100,000 | 27,863.83 | 1584.2 | 7.54 |
| 18 | Dehradun | 2004 | 753,420 | 9698.97 | 222.8 | 2.96 | 2025 | 1,530,000 | 35,867.2 | 928.17 | 6.07 |
| 19 | Kanpur | 2001 | 2,551,000 | 89,131 | 959.08 | 3.76 | 2021 | 4,000,000 | 33,703.99 | 3221 | 8.05 |
| 20 | Trivandraum | 2012 | 989,099 | 21,586 | 54 | 0.55 | 2031 | 1,032,292 | 21,586 | 101.64 | 0.98 |
| 21 | Aizwal | - | - | - | - | - | 2030 | 820,000 | 15,280 | 244 | 2.98 |
| 22 | Chandigarh | 2011 | 1,054,686 | 6648.23 | 1838.26 | 17.43 | 2031 | 1,600,000 | 11,400.00 | 3152.91 | 19.71 |
Source: Urban Green Guidelines (TCPO 2014).
Appendix B
Table A2.
F value and the Fcrit value for each of the parameters.
Table A2.
F value and the Fcrit value for each of the parameters.
| Source of Variation | SS | df | MS | F | p-Value | F Crit | |
|---|---|---|---|---|---|---|---|
| Accessibility | Between Groups | 8.73573117 | 3 | 2.911910391 | 1.42582291 | 0.248336798 | 2.82162822 |
| Amenities and Facilities | Between Groups | 5.44715974 | 3 | 1.815719914 | 0.690289944 | 0.56296573 | 2.82162822 |
| Traffic | Between Groups | 7.90271530 | 3 | 2.634238433 | 0.86698691 | 0.465562674 | 2.82162822 |
| Pollution | Between Groups | 3.04432286 | 3 | 1.014774288 | 0.380852463 | 0.767283354 | 2.82162822 |
| Openness | Between Groups | 12.28914556 | 3 | 4.096381853 | 1.461544537 | 0.238379148 | 2.82162822 |
| Walkability | Between Groups | 6.43899358 | 3 | 2.146331194 | 1.00986366 | 0.397653893 | 2.82162822 |
| Location | Between Groups | 6.18357488 | 3 | 2.061191626 | 0.68949596 | 0.563556643 | 2.827048712 |
| Organization of Space | Between Groups | 2.14344478 | 3 | 0.714481594 | 0.371461649 | 0.773977175 | 2.82162822 |
| Play Variety | Between Groups | 6.74982776 | 3 | 2.249942587 | 1.109393105 | 0.355747544 | 2.82162822 |
| Adventure | Between Groups | 15.94675447 | 3 | 5.315584825 | 2.348407688 | 0.0858602 | 2.82162822 |
| Safety | Between Groups | 8.89766971 | 3 | 2.965889902 | 1.151418135 | 0.339305569 | 2.82162822 |
| Independence | Between Groups | 16.77441405 | 3 | 5.59147135 | 2.540776406 | 0.06886979 | 2.82162822 |
| Sense of Belongingness | Between Groups | 19.21652 | 3 | 6.405508 | 2.610507 | 0.056273 | 2.705838 |
| Diversity | Between Groups | 11.12324890 | 3 | 3.707749634 | 1.502516651 | 0.227435392 | 2.82162822 |
| Natural Attributes | Between Groups | 10.33290200 | 3 | 3.444300667 | 1.387288679 | 0.259875443 | 2.827048712 |
| Aesthetics | Between Groups | 22.54178994 | 3 | 7.513929979 | 2.273799643 | 0.093545815 | 2.82162822 |
| Scale of Play Equipment | Between Groups | 5.54715974 | 3 | 1.849053248 | 0.597787097 | 0.619922715 | 2.82162822 |
| Social Interactions | Between Groups | 6.43169875 | 3 | 2.143899583 | 0.834886906 | 0.482136988 | 2.82162822 |
| Visual Interactions | Between Groups | 8.29204323 | 3 | 2.76401441 | 0.85724958 | 0.470538301 | 2.82162822 |
Source: Authors.
References
- Adams, Eileen, and Sue Ingham. 1998. Changing Places: Children’s Participation in Environmental Planning. London: Children’s Society. [Google Scholar]
- Adams, Sabirah, Shazly Savahl, Maria Florence, and Kyle Jackson. 2018. Considering the Natural Environment in the Creation of Child-Friendly Cities: Implications for Children Subjective Well-Being. Child Indicators Research 12: 545–67. [Google Scholar] [CrossRef]
- Adler, Michael, and Erio Ziglio. 1996. Gazing into the Oracle: The Delphi Method and Its Application to Social Policy and Public Health. London: Jessica Kingsley. [Google Scholar]
- Agarwal, Krati, Mohit Kumar Agarwal, and Aurobindo Ogra. 2019. Sustainable retrofitting of Urban Transitions through Socio-Technical Regimes: An Assessment of Moradabad City. Paper presented at International Conference on Sustainable Globalization (ICSG 2019), Kochi, India, January 10–12; ISBN 9789353460020. [Google Scholar]
- American Society of Landscape Architects (ASLA). 2015. The Psychology of Urban Play: The Human Dimension of the City. Chicago: Playground Professionals. [Google Scholar]
- Anbari, Maral, and Hossein Soltanzadeh. 2015. Child Oriented Architecture from the Perspective of Environmental Psychology. Natural and Social Sciences, 137–45. [Google Scholar]
- ARUP. 2017. Cities Alive: Designing for Urban Childhoods. London: ARUP. [Google Scholar]
- Atiyat, Diala. 2016. Relationship of Children Psychology and Use of Public Parks: Case Study of Baiha Amman Jordan. Journal of Architectural Engineering Technology 5: 173. [Google Scholar] [CrossRef]
- Awad, Zuhal Eltayeb. 2018. Evaluating Neighborhoods Developed Open Spaces in Khartoum-Sudan. Civil Engineering and Architecture 6: 269–82. [Google Scholar] [CrossRef]
- Ghanbari-Azarneir, Sharareh, Sara Anbari, Seyed-Bagher Hosseini, and Seyed-Abbas Yazdanfar. 2015. Identification of Child-Friendly Environments in Poor Neighborhoods. Procedia Social and Behavioral Sciences 201: 19–29. [Google Scholar] [CrossRef]
- Bell, Simon, Val Hamilton, Alicia Montarzino, Helen Rothnie, Penny Travlou, and Susana Alves. 2008. Greenspace Scotland Research Report. Stirling: Stirling University Innovation Park. [Google Scholar]
- Benjamin, Solomon. 2008. Occupancy Urbanism: Radicalizing Politics and Economy beyond Policy and Programs. International Journal of Urban and Regional Research 32: 719–29. [Google Scholar] [CrossRef]
- Bhagat, R. B. 2018. Development Impacts of Migration and Urbanisation. Economic & Political Weekly 53: 15–19. [Google Scholar]
- Birch, Jo, Curtis Penny, and Allison James. 2007. Sense and Sensibilities: In Search of the Child-Friendly Hospital. Children, Young People, and Built Environments 33: 405–16. [Google Scholar] [CrossRef]
- Botsoglou, Kafenia, and Domna-Mika Kakana. 2010. Play Value and Safety in Greek Playgrounds. Paper presented at 25th ICCP World Play Conference, New Goals for the Future Children Play, Lisbon, Portugal, June 17–19. [Google Scholar]
- Castonguay, Genevie’ve, and Sylvie Jutras. 2009. Children’s Appreciation of Outdoor Places in a Poor Neighborhood. Journal of Environmental Psychology 29: 101–9. [Google Scholar] [CrossRef]
- Census. 2011. Census of India District Census Handbook Lucknow. Uttar Pradesh: Directorate of Operations. [Google Scholar]
- Chatterjee, Sudeshna. 2006. Children’s Friendship with Place: An Exploration of Environmental. Ann Arbor: Proquest Information and Learning Company. [Google Scholar]
- Chawala, Louise. 1992. Childhood place attachments. In Place Attachment. Edited by Irwin Altman and Low Setha M. New York: Plenum Press, pp. 63–86. [Google Scholar]
- Cilliers, Elizelle Juanee, and Selna Cornelius. 2019. The Creation of Rural Child-Friendly Spaces: A Spatial Planning Perspective. Applied Research Quality Life 14: 925–39. [Google Scholar] [CrossRef]
- Crane, Stacey, and Marion E. Broom. 2017. Understanding Ethical Issues of Research Participation from the Perspective of Participating Children and Adolescents: A Systematic Review. Worldviews on Evidence-Based Nursing 14: 200–9. [Google Scholar] [CrossRef]
- Crow, Lester D., and Alice Crow. 1962. Child Psychology. New York: Barnes & Noble Books. [Google Scholar]
- Danica, Stankovic. 2008. Space in the function of Psychological Stability of a child. Facta Universitatis-Series Architecture and Civil Engineering 6: 229–33. [Google Scholar]
- Davis, Adrian, and Linda J. Jones. 1996. Children in the Urban Environment: An Issue for the New Public Health Agenda. Health & Place 2: 107–13. [Google Scholar]
- Delbecq, Andre L., Andrew H. Van de Ven, and David H. Gustafson. 1975. Group Techniques for Program Planning: A Guide to Nominal Groups and Delphi Process. Glenview: Scott Foresman Company. [Google Scholar]
- Dhar, Devashish, and Manish Thakre. 2020. No Child’s Play: The Enduring Challenge of Creating Child-Friendly Cities. ORF Issue Brief 415: 1–10. [Google Scholar]
- Driskell, David. 2001. Creating Better Cities with Children and Youth: A Manual for Participation. London: Routledge. [Google Scholar]
- Drown, Kimberly K. Cloward, and Keith M. Christensen. 2014. Dramatic Play Affordances of Natural and Manufactured Outdoor Settings for Preschool-Aged Children. Children Youth and Environments 24: 53–57. [Google Scholar] [CrossRef]
- Erikson, Erik H. 1995. Childhood and Society. New York: Vintage. [Google Scholar]
- Frumkin, Howard, Lawrence D. Frank, and Richard Jackson. 2004. Urban Sprawl and Public Health. Washington, DC: Island Press. [Google Scholar]
- Garg, Abhinav. 2011. Don’t be ‘Selfish Giant’, Let Kids Play in the Park: HC to RWA. Available online: https://timesofindia.indiatimes.com/city/delhi/dont-be-selfish-giant-let-kids-play-in-park-hc-to-rwa/articleshow/8104149.cms#:~:text=NEW%20DELHI%3A%20In%20a%20significant,a%20park%20as%20a%20playground (accessed on 14 October 2020).
- Gibson, James J. 1979. The Ecological Approach to Visual Perception. Boston: Houghton Mifflin. [Google Scholar]
- Gleeson, Brendan, Neil Sipe, and Rolley Kylie. 2006. Pathways to the Child-Friendly Cities. In Creating Child-Friendly Cities: Reinstating Kids in the City. London: Routledge. [Google Scholar]
- Hart, Roger. 2002. Containing Children: Some lessons on planning for play from New York City. Environment and Urbanization 14: 135–48. [Google Scholar] [CrossRef]
- Hart, Roger A. 1997. Children’s Participation: The Theory and Practice of Involving Young Citizens in Community Development and Environmental Care. New York: Earthscan/UNICEF. [Google Scholar]
- Horelli, Liisa. 1998. Creating Child-Friendly Environment. Childhood 5: 225–39. [Google Scholar] [CrossRef]
- Horelli, Liisa. 2007. Constructing a Theoretical Framework for Environmental Child-Friendliness. Children, Youth, and Environments 17: 268–98. [Google Scholar]
- Jafrin, Maharina, and Beau B. Beza. 2018. Developing an Open Space Standard in a Densely Populated City: A Case Study of Chittagong City. Infrastructures 3: 40. [Google Scholar] [CrossRef]
- Jefferies, Duncan. 2014. Children should be at the Heart of Future Cities. KOSMOS, Journal for Global Transformation. Available online: https://www.kosmosjournal.org/news/duncan-jefferies-on-the-child-friendly-city/ (accessed on 14 October 2020).
- Kahn, Peter H., and Stephen R. Kellert. 2002. Children and Nature: Psychological, Sociocultural and Evolutionary Investigations. Cambridge: The MIT Press. [Google Scholar]
- Karsten, Lia, and Willem van Vliet. 2006. Children in the City Reclaiming the Street. Children, Youth, and Environments 16: 151–67. [Google Scholar]
- Khan, Matluba, Simon Bell, and Sarahs McGeown. 2020. School Ground Interventions for Pedagogy and Play: How Can We Evaluate the Design? In Place, Pedagogy and Play: Participation, Design, and Research with Children. Edited by Matluba Khan, Simon Bell and Jenny Wood. New York: Routledge. ISBN 9780367086374. [Google Scholar]
- Kingston, Beverly E., Pamela Wridt, Louise Chawla, van Vliet Willem, and Lois Brink. 2007. Creating Child-Friendly Cities: The Case of Denver, USA. In Municipal Engineer. London: Thomas Telford Services Ltd. [Google Scholar] [CrossRef]
- Kopec, Dac. 2006. Environmental Psychology. New York: Fairchild Publication. [Google Scholar]
- Korpela, Kalevi, Kytta Marketta, and Terry Hartig. 2002. Restorative Experience, Self-Regulation, and Children’s Place Preferences. Journal of Environmental Psychology 22: 387–98. [Google Scholar] [CrossRef]
- Kylin, Maria, and Stina Bodelius. 2015. A Lawful Space for Play: Conceptualizing Childhood in Light of Local Regulations. Children, Youth and Environments 25: 86–106. [Google Scholar] [CrossRef]
- Kytta, Marketta. 2004. The Extent of Children’s Independent Mobility and the Number of Actualized Affordances as Criteria for Child-Friendly Environments. Journal of Environmental Psychology 24: 179–98. [Google Scholar] [CrossRef]
- Lansdown, Gerison. 2011. Every Child’s Right to be Heard. UK, Save the Children. Available online: https://www.unicef.org/files/Every_Childs_Right_to_be_Heard.pdf (accessed on 14 October 2020).
- Lawson, Bryan. 2001. The Language of Space. Oxford: Architectural Press. [Google Scholar]
- Londal, Knut. 2013. Places for Child—Managed Bodily Play at After—School Program. Children, Youth and Environments 23: 103–26. [Google Scholar] [CrossRef]
- Londal, Knut, Karoline B. Norbeck, and Anne-Karine H. Thoren. 2015. How Does a Manmade Outdoor Area in a Large, Urban Kindergarten Afford Physical Activity to 5-year-Old Children. Children, Youth and Environments 25: 128–52. [Google Scholar] [CrossRef]
- Lynch, Kevin. 1977. Growing Up in Cities. Cambridge: MIT Press. [Google Scholar]
- Malone, Karren Ann. 2012. The Future lies in our Hands: Children as Researchers and Environmental Change Agent in Designing a Child-Friendly Neighbourhood. Local Environment: The International Journal of Justice and Sustainability 18: 372–95. [Google Scholar] [CrossRef]
- Malone, Karen, and Paul Tranter. 2003. Children’s Environmental Learning and the Use, Design, and Management of School Grounds. Children, Youth and Environments 13: 87–137. [Google Scholar]
- Miller, Wade Alan. 2009. An Examination of Role for Landscape Architects in the no Child Left Inside Movement. Arlington: The University of Texas. [Google Scholar]
- Min, Byungho, and Jongmin Lee. 2006. Children’s neighborhood place as a psychological and behavioral domain. Journal of Environmental Psychology 26: 51–71. [Google Scholar] [CrossRef]
- Ministry of Urban Development (MOUD), Government of India. 2015. Atal Mission for Rejuvenation and Urban Transformation, Mission Statement and Guidelines; New Delhi: Government of India.
- Mohammadi, Anahita, Ali Jabbari Jahromi, and Azadeh Alighanbari. 2015. “Kids Friendly Factor” in Urban Spaces. In Proceedings of the International Conference on Information and Knowledge Engineering (IKE). Athens: The Steering Committee of the World Congress in Computer Science, Computer Engineering and Applied Computing (WorldComp), pp. 168–72. [Google Scholar]
- Molello, Teresa. 2015. Adapting Resting Spaces of the Hospital Environment to Support Pediatric Patient’s Psychological Wellbeing. Master’s Thesis, Mills College, Oakland, CA, USA. [Google Scholar] [CrossRef]
- Moore, Robin C. 1986. Childhood’s Domain. London: Croom Helm. [Google Scholar]
- National Institute of Urban Affairs (NIUA). 2014. Small Children Big Cities: Building Smart Child-Friendly Cities for 21-Century India. New Delhi: National Institute of Urban Affairs. [Google Scholar]
- National Institute of Urban Affairs (NIUA). 2017. Compendium of Best Practices of Child-Friendly Cities. New Delhi: National Institute of Urban Affairs. [Google Scholar]
- Navidi, Ute. 2014. The Role of Play in Children’s Health and Development. Children Volume Special Issue. Basel: MDPI AG. [Google Scholar]
- Ndebele, Robert, and Aurobindo Ogra. 2014. A Place-Based Approach to Spatial Transformation—A Case Study of Transit-Oriented Development (TOD), Johannesburg. Paper presented at Planning Africa Conference, Durban, South Africa, October 19–22. [Google Scholar]
- Nordstrom, Maria. 2010. Children’s Views on Child-Friendly Environments in Different Geographical, Cultural and Social Neighborhood. Urban Studies 47: 514–28. [Google Scholar] [CrossRef]
- OECD. 2020. Cities in the World: A New Perspective on Urbanisation. Paris: OECD Urban Studies, OECD Publishing. [Google Scholar] [CrossRef]
- Oloumi, Shima, Mohammadjavad Mahdavinejad, and Alireza Namvarrad. 2012. Evaluation of Outdoor Environment from the Viewpoint of Children. Social and Behavioral Sciences 35: 431–39. [Google Scholar] [CrossRef][Green Version]
- Rutledge, Albert J. 1981. A Visual Approach to Park Design. New York: Garland STPM Press. [Google Scholar]
- Said, Ismail. 2007. Architecture for Children: Understanding Children Perception towards built Environment. Available online: https://core.ac.uk/download/pdf/11779912.pdf (accessed on 20 October 2020).
- Shackel, Rita. 2011. The Impact of Urbanization on the Child’s Right. Sydney: Sydney Law School, University of Sydney. Available online: http://ssrn.com/abstract=1973367 (accessed on 20 October 2020).
- Sondergaard, Elisabeth, and Reventlow Susanne. 2019. Drawing as a Facilitating Approach When Conducting Research among Children. International Journal of Qualitative Methods 18: 1–11. [Google Scholar] [CrossRef]
- Stevenson, Anna. 2007. What We Know About How Urban Design Affects Children and Young People: The Interaction between Health Outcomes and the Built Environment. Public Health Registrar Christchurch City Council Canterbury District Health Board. Available online: https://www.cph.co.nz/wp-content/uploads/children-and-urban-design.pdf (accessed on 30 October 2020).
- Striniste, Nancy A., and Robin C. Moore. 1989. Early Childhood Outdoors: A Literature Review Related to the Design of Childcare Environments. Children’s Environments Quarterly 6: 25–31. [Google Scholar]
- Tait, Alan R., and Michael E. Geisser. 2017. Development of a Consensus Operational Definition of Child Assent for Research. BMC Medical Ethics 18: 41. [Google Scholar] [CrossRef] [PubMed][Green Version]
- Tandy, C. A. 1999. Children’s Diminishing Play Space: A Study of Intergenerational Change in Children’s Use of their Neighbourhoods. Australian Geographical Studies 37: 154–62. [Google Scholar] [CrossRef]
- Theobald, William. 1984. A history of recreation resource planning: The origins of space standards. Leisure Studies 3: 189–200. [Google Scholar] [CrossRef]
- Thomas, Nigel, and Claire O’Kane. 1998. The Ethics of Participatory Research with Children. Children and Society 12: 336–48. [Google Scholar] [CrossRef]
- Thomas, Phaeba, Lori Jones, and Debra Efroymson. 2012. Cities for Children: Defining the Dream and Achieving the Reality. Ottawa: Health Bridge Foundation. [Google Scholar]
- Town and Country Planning Organization (TCPO), Government of India. 2014. Urban Green Guidelines; New Delhi: Government of India, Ministry of Urban Development.
- Town and Country Planning Organization (TCPO), Government of India. 2015. Urban and Regional Development Plan Formulation and Implementation (URDPFI) Guidelines; New Delhi: Government of India, Ministry of Urban Development.
- UN-Habitat. 2020a. World Cities Report—Value of Sustainable Urbanization. Nairobi: United Nations Human Settlements Programme. [Google Scholar]
- UN-Habitat. 2020b. National Urban Policies Driving Guiding Public Space Led Development. Nairobi: UN-Habitat. [Google Scholar]
- United Nations. 1989. The United Nations Convention on the Rights of the Child. United Nations Human Rights. Available online: https://www.ohchr.org/EN/ProfessionalInterest/Pages/CRC.aspx (accessed on 3 May 2021).
- Vanka, Salila P. 2014. Public Space and Life in an Indian City: The Politics of Space in Bangalore. Michigan: University of Michigan. [Google Scholar]
- Veal, A. J. 2012. Fit for the purpose? Open Space Planning Standards in Britain. Journal of Policy Research in Tourism, Leisure and Events 4: 375–79. [Google Scholar] [CrossRef]
- Veitch, Jenny, Bagley Sarah, Ball Kylie, and Salmon Jo. 2006. Where do children Usually Play? A Qualitative Study of Parents’ Perceptions of Influences on Children’s Active Free-Play. Health & Place 12: 383–93. [Google Scholar]
- Ward, Colin. 1978. The Child in the City. New York: Pantheon Books. [Google Scholar]
- World Health Organization (WHO). 2012. Health Indicators of Sustainable Cities. Rio de Janeiro: WHO. [Google Scholar]
- Yuniastuti, E., and H. S. Hasibuan. 2018. Child-friendly green open space to enhance the education process for children. In Conference Series: Earth and Environmental Science. Bristol: IOP Publishing. [Google Scholar]
- Zhang, Heng, and Min-Jin Li. 2017. Environmental Characteristics of Children’s Neighborhood Activities. Asian Journal of Environment-Behaviour 2: 47–56. [Google Scholar] [CrossRef][Green Version]


Publisher’s Note: MDPI stays neutral with regard to jurisdictional claims in published maps and institutional affiliations. |
© 2021 by the authors. Licensee MDPI, Basel, Switzerland. This article is an open access article distributed under the terms and conditions of the Creative Commons Attribution (CC BY) license (https://creativecommons.org/licenses/by/4.0/).