Abstract
The concept of different publishing patterns during a day has been employed for many decades in the broadcasting industry. These patterns are close related with dayparts, which are defined as sequential time blocks on comparable days during which the audience size is homogeneous, as is the group depiction using the specific medium. During the first decade of the World Wide Web, Internet media strategy was focused on total web reach, demographics and affinity of content without particular attention to how the nature of the audience changes by time of day. This paper studies the variation of publishing patterns of the top 22 Greek media websites. More than 550 thousand articles were indexed in a period of four and a half months. The study identified distinct WWW time periods that exhibit specific publishing characteristics. Specifically, different categories of news articles present different publishing patterns during weekdays and weekends. The results appear to be in agreement with findings of previous studies.
1. Introduction
Journalism has always been influenced and transformed by technology (Örnebring 2010; Pavlik 2000; Spyridou et al. 2013; Zelizer 2019). Digitalization and the introduction of the internet—in particular that of the World Wide Web (WWW)—have changed considerably the way journalism is conducted and journalism content is disseminated to the audience (Siapera and Veglis 2012). Multiple communication channels are currently employed by media organizations in order to reach different audience groups that include different consumption habits (Veglis 2012; Veglis et al. 2016). Those habits can be differentiated in various terms, for example, type of medium, type of device that is employed for content consumption, consumption time and consumption place (Taneja et al. 2012; Veglis 2008).
Today, news can be published and edited 24 h a day through different media. In journalism, and especially in breaking events, information is posted in line with the timing of events. This is not necessary in the case of opinion articles and articles that review topics of wider interest. In any case, the “question” of the selective configuration and presentation of the data remains. For example, a topic of local interest may relate to specific categories of users and at specific times, while corresponding priorities appear at the level of media and channels. Thus, publications should combine “real-time” adaptation of events, audience personalization preferences and media specialization (American Press Institute 2014). For this reason, recordings and statistical analytics are conducted, which determine the acceptance and traffic of media to the various categories of the public. These contribute to the optimization of the services provided and the targeted information at multiple levels (current and emergency news, topics of local and wider interest, opinion articles, advertisements). Thus, the media try to gain fame and recognition, to establish their credibility and to build relationships of trust with the public, in order to achieve a high degree of traffic that will provide the necessary revenue (Colace et al. 2015; Elliott et al. 2016; Leskovec 2011; Pang and Lee 2008; Schultz et al. 2018; Spann et al. 2016).
The term daypart is considered to be quite familiar in broadcast media and has been used for several decades by television and radio stations that broadcast different programs at different times of the day (Avraam 2012; Beyers 2004). It is a division of days into time periods according to the viewing models of the viewers and significantly affects the TV/radio time and advertising programming of a channel. A time period or daypart includes a specific continuous period of time during which a particular television program is broadcast and watched by viewers who can be characterized by specific homogeneous demographics and other similar characteristics (Beyers 2004). This is achieved by measuring the flow of viewers during the day and matching it with the broadcast programs (Sherman 1995). In these time periods, TV stations compete for viewers, trying to attract and keep viewers for the specific period of time. The types of programs broadcasted by television stations at specific times of the day are determined by studies on viewers’ habits (Sherman 1995). Naturally, television stations broadcast programs that are compatible with the preferences of the majority of viewers at this time (Avraam 2012). As expected, dayparts have been heavily exploited by the advertisement industry (MORI Research 2003).
With the introduction of the WWW, media organizations’ planning has been characterized by overall site reach, demographics and content affinity without particular focus on how audience dynamics vary by time of day, or during weekends. It was rational to hypothesize that there are no day sections on the WWW as users can access the content at any time, from any place. Studies have reported that this hypothesis is valid and media consumption is found to take place anywhere and anytime (Taneja et al. 2012). Web content is available 24 h a day, seven days a week (OPA 2003). Additionally, a media website publishes news articles every hour of the day. The headlines may be amended, depending on the news flow, but the genre of the media website remains constant (MORI Research 2003).
Researchers began to worry when they found that news websites were experiencing a drop in late afternoon traffic and a sharp drop in the evening hours. For most news websites, the drop in traffic coincided with the end of the business day. Furthermore, during the weekend, website traffic numbers are very different (Beyers 2004). All of the above resulted in the adoption of dayparts in the case of the internet (Avraam 2012).
Two surveys conducted in 2002 and 2003 on the Newspaper Association of America (NAA) and the Online Publishers Association (OPA) in the US indicated that dayparts exist in the case of the Internet (OPA 2003; MORI Research 2003). Specifically, MORI (research company) conducted a research on behalf of the Newspaper Association of America (NAA), which examined the temporal opportunities for online newspapers (MORI Research 2003). The study confirmed the existence of dayparts in the access of online newspaper content. Similarly, another study conducted by Online Publishers Associations (OPA) verified the existence of five distinct dayparts on WWW access (2003). Four years later, Burst Media in a related study identified different usage patterns in different time periods. Similar results were reported by Newell et al. (2008) from a four-year study on media consumption, which compared new media usage with traditional media, namely newspapers, magazines, radio and television. Moreover, another study (Avraam 2012) proposed a dayparting model for online media consumption which employed four dayparts during the weekdays. The main findings of the studies showed that in the morning, the majority of users are interested in the news, in the afternoon in fun and in the evening in online shopping and social networking. Based on this information, media websites can change the content and setup of their pages to better respond to their visitors, offering different content at different times of the day (Beyers 2004).
Online dayparting can be defined as the display of different content (as well as advertisements) on the internet during different times of the day, in order to best meet the interests of users. Obviously, in order to be able to distinguish between time periods in the case of the internet, a significant continuous volume of internet traffic with significant differences is required. Successful definition of dayparts and their proper use, for example, by websites (news and more) can be of benefit to the user, as different content will be available in different dayparts based on recorded user preferences (Avraam 2012).
The identification of the daypart phenomenon has significant implications on the success of media websites that continuously publish new content (Pascual 2004). It is worth noting that news is very topical in nature and thus loses its value if not reported on time (Sabelström 1998). On the other hand, not all news articles need to be published immediately. For example, opinion articles, articles that report on social issues and technology development or cultural events can be published during the time period that attracts the biggest audience. Moreover, the news may be available online indefinitely, but it is not easy to access if not visible from the media website’s homepage. In other words, media organizations can modify their content they offer on their first page throughout the day, thus attempting to meet users’ needs by offering specific news categories at different time periods (Beyers 2004). Morrissey (2003) has proposed that the best strategy is to promote news stories in the morning and entertainment stories in the afternoon.
The problem is that the vast majority of internet usage surveys conducted to date did not investigate the possible existence of dayparts. However, from some results collected from a specific research, some key conclusions can be drawn (Avraam 2012). In particular, from Bari’s research conducted from September 2009 to March 2010 in Greece, some data can be extracted for different percentages of internet service usage. This study used four dayparts which are different from the dayparts defined in the US surveys. Specifically, Bari divided the 24 h into four, six-hour periods with a starting point at midnight. The daypart with the highest usage rates was 18:01–24:00, while the 12:01–18:00 one presented the immediately best usage rates. The same research reported some interesting facts about the use of certain internet services (e.g., email, social networking, search engines and information and sports websites) per daypart.
The only research that investigated in more detail the existence of dayparts in the Greek media was done in 2014 by Veglis. The research examined the traffic metrics of two online media. The results indicated the existence of dayparts, but the survey sample was relatively small. This was due to the fact that media companies do not disclose their traffic data, since they consider them to be critical information for their business that could be exploited by their competitors.
Based on the above, one would assume that media organizations have adopted their publishing cycles in order to be compatible with the users’ consumption habits. This is very significant since research has identified a significant shift in media consumption from the incumbent media to new media and especially to WWW (Newell et al. 2008). The problem is that although users’ consumption behavior seems to have been investigated to a significant extent, there are no studies on the actual publishing cycles of media websites. Such a study faces significant difficulties in being implemented, since it requires substantial resources and a considerable amount of data.
Thus, the aim of this study is to investigate the existence of publishing patterns on media websites. The study is based on publishing data from the top 22 Greek media websites in terms of web traffic. This study continues the work of Veglis (2014) and Avraam (2012), by investigating if media companies follow specific publishing patterns that match the user-defined dayparts. Various parameters such as time, day, and content type are also included in the study.
Based on the above discussion, the following research questions have been formulated and are addressed in this study. Specifically:
- Do Greek media websites exhibit specific publishing patterns?
- Do publishing patterns vary between weekdays and weekends?
- Do all categories of news articles exhibit the same publishing patterns?
2. Material and Methods
The sample of the study comprises 22 Greek media websites. Since no other official ranking based on their traffic of Greek media websites is available, the selection of the websites was based on their classification on the Alexa’s top 100 Greek websites (data retrieved on 5 June 2020). In the list, we have excluded media which are devoted to sports coverage since their publishing cycles depend on the day and time of athletic events. All other media websites were included. The final list of the websites comprised 22 media organizations. Some of them also publish a print edition (daily or weekly), but the majority of them publish only on the web. It is worth noting that media organizations do not publish their traffic measurements; thus, the Alexa classification was the only available means for selecting the media website to be included in the study. Table 1 presents the list of the media websites that was studied.

Table 1.
Greek media websites (Alexa.com, accessed on 5 June 2020).
The data were obtained from the leading media monitoring company in Greece, INNEWS (http://innews.gr—accessed on 7 February 2021). INNEWS provides information management services, indexing of all media and delivers its services to hundreds of clients in the Greek public sector and also to clients from the private sector. The INNEWS monitoring, analysis and publicity management service automatically records and analyzes on a 24-h basis articles from the main internet media, concerning Greece and Cyprus (news sites, blogs, forums, Twitter and YouTube) as well as from all print, TV channels and radio stations, which are indexed daily. The software of the monitoring system has been developed in-house by INNEWS. All services of the company are implemented under the Quality Management System ELOT EN ISO 9001:2015. The data covered four and a half months, specifically from the 1st of July until the middle of November 2020. The collected data comprised 562,525 news articles. Most of the news articles included a title, text and one static image. Figure 1 and Figure 2 display two examples on news articles from two different media organizations. Each article was characterized as belonging to a specific category in relation to its content. Eleven content categories were used, namely politics, economy, society, international, culture, health, technology, sports, tourism, lifestyle and various. It is worth noting that the classification of the news articles to categories was done by INNEWS. The data were obtained in the form of 22 separate CSV files, one for every medium of the sample. All data were imported into a single spreadsheet file in Microsoft Excel. Necessary conversions were executed in order to categorize each article based on its time stamp to the defined time periods month, day, hour. These conversions were made with the help of date and time functions which are available in Microsoft Excel. The selection of the variables which were required for the production of the visualizations was made with the pivot table feature of Microsoft Excel. The Pivot Table feature can be employed to summarize, sort, reorganize, group, count, total or average data included in a table. The results of the pivot table were visualized with the help of bar and line charts. Those charts types were selected in order to allow the identification of publishing patterns. For the needs of the study, Microsoft Excel Version Office 365 MSO was employed.
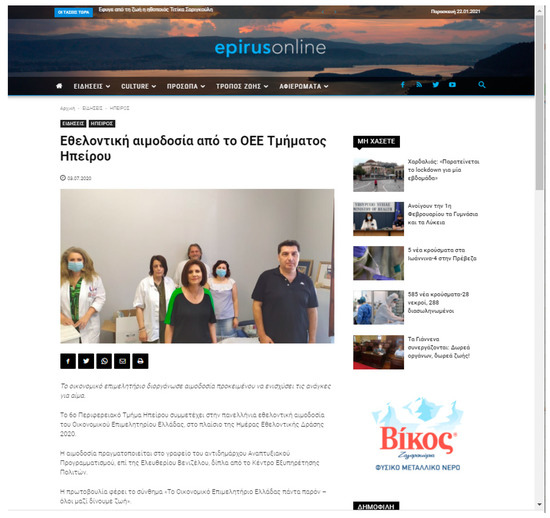
Figure 1.
A news article from epirusoline (https://epirusonline.gr/eidiseis/ipeiros/ethelontiki-aimodosia-apo-to-oee-tmimatos-ipeiroy/ accessed on 7 February 2021).
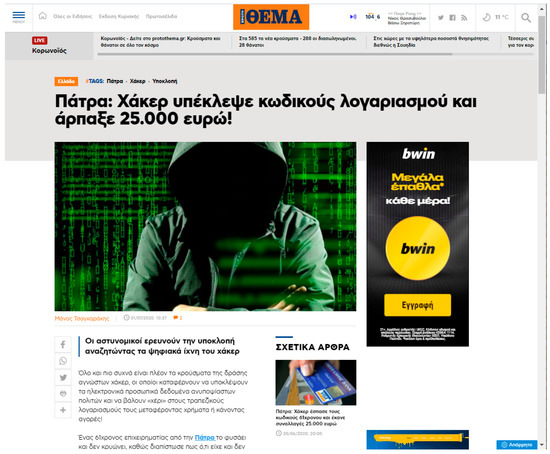
Figure 2.
A news article from protothema (https://www.protothema.gr/greece/article/1022354/patra-haker-upeklepse-kodikous-logariasmou-kai-arpaxe-25000-euro/ accessed on 7 February 2021).
3. Results
In this section, the findings from the analysis of the collected news articles are presented. Specifically, the media websites under study vary in the number of articles they have published in the specific time period. The number of articles varies considerably from 3176 published by epirusonline to 40,726 that were produced by protothema. All the results can be found in Figure 3. It is worth noting that protothema and pronews have published about the same number of articles. Next, there is a group of media websites (in.gr, zougla, newsit, newsbomb, and cretalive) that are relatively close as far as the total number of news articles they have produced.
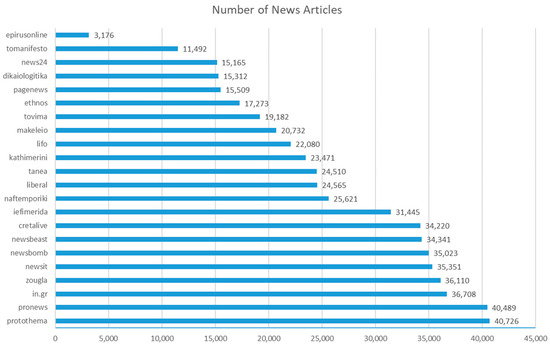
Figure 3.
Total number of articles per media website.
In Figure 4, the average number of articles published per day is displayed. As was expected, the number of published articles during the weekend is significantly lower (more than 30% smaller) than the number of articles during the weekdays. Sunday seems to be the day with the lowest number of published news articles. Additionally, during weekdays, there is an increase as the days pass, with the busiest day being Thursday. There seems to be a gradual increase in the number of published articles from Monday to Thursday, followed by a moderate decrease during Friday that is followed by a sharp reduction during the weekend.
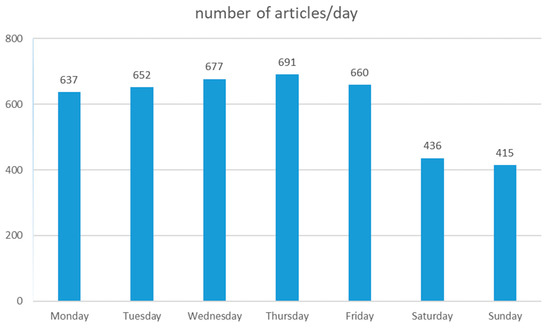
Figure 4.
Average number of articles/day.
Next, the average number of articles per hour of the day is plotted in Figure 5. The plot exhibits significant variations on the number of articles that are published during a twenty-four-hour period. Specifically, during the morning hours (5:00–11:00), there is a sharp increase in the number of published news articles. From 11:00 to 13:00. the number of published news articles remains almost constant. Then, there is a gradual decrease in the number of published articles with some fluctuations around 18:00. It is also worth noting a small increase, just before the end of the day, which is followed by a sharp reduction during the first hours of the new day.
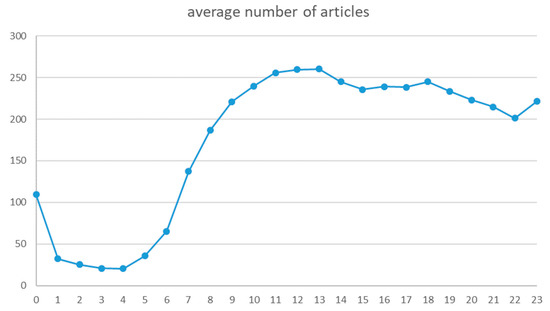
Figure 5.
Average number of articles/hours of day.
In order to examine if the publishing patterns per hour remain the same between weekdays and weekends, we plot in Figure 6 the average number of articles per hour for the two periods of the week. It is worth noting that, as was expected, during the weekend, the average number of articles per hour is lower, but there seems to be a different publishing pattern during the time period 8:00–22:00. Specifically, during weekends, the average number of published news articles seems to remain relatively constant during that time period, whereas in the case of weekdays, the publishing pattern exhibits specific peaks and fluctuations.
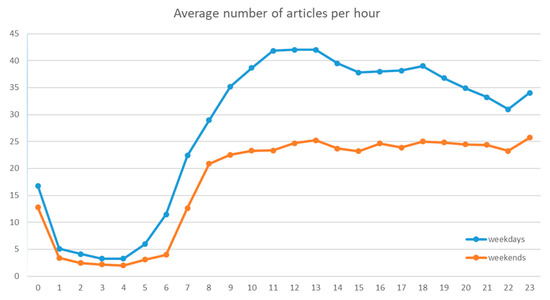
Figure 6.
Average number of articles/hour (weekdays and weekends).
The different categories of articles appear to have different publishing patterns during the days of the week (Figure 7). It is worth noting the categories international, society, politics and economy appear to have the bulk of the news articles and also exhibit distinct behaviors. Specifically, international news articles display their peak number of articles on Wednesday, society news articles on Friday and politics and economy news articles on Thursday. Furthermore, the above categories seem to have significantly fewer articles during the weekends in comparison with the other article categories that appear to have the same small number of articles that remains relatively constant during all days of the week.
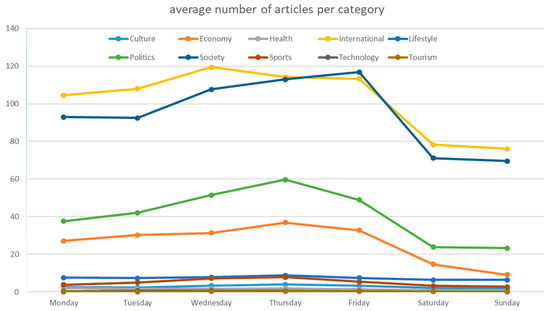
Figure 7.
Average number of articles per category/day.
Next, in Figure 8, the average number of articles per category per hour during weekdays is presented. The categories that include the highest number of articles appear to have distinct publishing patterns. Specifically, the news articles that relate to society display a sharp increase during the 18:00 to 19:00 period. Additionally, international news exhibits its peak number of published articles at the end of the day (23:00). It is worth noting that each content category seems to peak at a different time period (international—23:00, society—18:00, politics—13:00, economy—11:00).
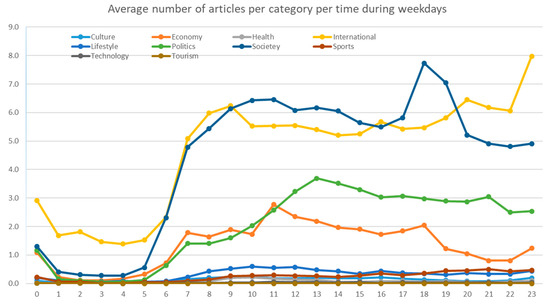
Figure 8.
Average number of articles per category per hour during weekdays.
The same observation can also be made for the plots in Figure 9, where the data refer to the average number of articles per category per hour but for Saturdays and Sundays. It is worth noting that the publishing patterns of the different categories appear to have a lot of similarities during weekdays and weekends, but they also have significant differences. For example, there seems to be a shift in some categories regarding the time periods when they exhibit their peak publishing rhythms (society—19:00, economy—8:00), whereas other categories retain the same peak hours (international, politics).
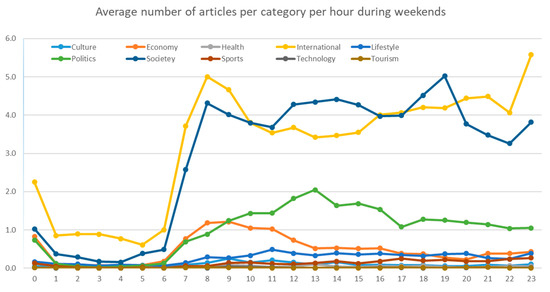
Figure 9.
Average number of articles per category per hour during weekends.
4. Discussion
The results show that there is a significant variation on the number of articles that the 22 Greek media websites publish. This difference exceeds the level of 1 to 10 (protothema in comparison with epirusonline). This can be explained by the fact that protothema in a national media organization, whereas epirusonline is a regional media organization located in one for the smallest, in terms of population, geographical areas of the country. It would be reasonable to expect that the media that are higher in terms of traffic will have the largest number of published articles. In reality, however, this is not the case, as can be seen from Figure 10, which includes the number of articles per media, with the media organizations appearing in the order of their ranking in the Alexa list. It is worth noting that although protothema, which exhibits the highest traffic numbers, also has the highest number of published articles, pagenews (which resides in the 20th position in terms of traffic) exhibits about the same number of published articles.
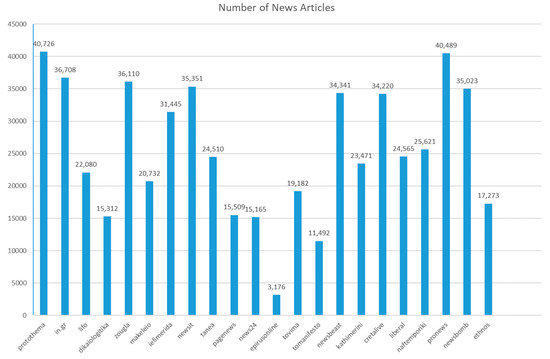
Figure 10.
Total number of articles per media organization. Media organizations are displayed based on the Alexa ranking—leftmost being the highest and rightmost the lowest traffic.
As far as the distribution of published news articles during a twenty-four-hour period is concerned (refer to Figure 5), we can clearly distinguish four distinctive time periods where specific publishing patterns are observed. The first one spans from 0:01 to 6:00 and it is characterized by the small number of published articles. The second daypart which lasts from 6:01 up to 12:00 exhibits a sharp rise in the number of news articles. Around 12:00, the number of articles saturates. The next daypart lasts until 18:00, during which the number of published articles remains relatively constant with a small decrease during the early afternoon hours. Finally, the last time period (18:01–0:00) is characterized be a slight gradual decrease in the number of published articles with a significant increase during the last hour of the day. These findings are in agreement with the reported internet access patterns from OPAeurope (2007). It is worth mentioning that during weekends (refer to Figure 6), there is a relatively constant rate of news article publication from 8:00 to 23:00. On the other hand, more variations in the publishing rate can be found during weekdays. It would be interesting to study in detail the actual content consumption per hour during weekends.
Based on the above analysis, we can confirm that overall, Greek media websites exhibit specific publishing patterns (Research Question 1). Of course, each media organization has its own publishing rhythm that is defined by various factors. This is exhibited more clearly in Figure 11, which includes the number of articles per hour per media website. It is worth noting that tanea exhibits its highest number of articles early in the morning, something that can be explained by the fact that this particular media organization also produces a newspaper. On the other hand, many news organizations display unique behaviors, namely epirusonline that starts publishing after 8:00, zougla that appears to be quite active during the night, in.gr that peaks its publishing rhythm at the end of the day, or pagenews that peaks at 21:00.
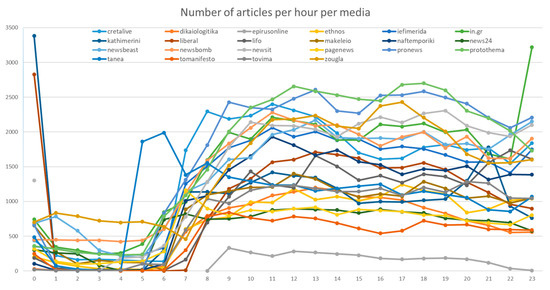
Figure 11.
Number of articles per hour per media.
Moving to the average number of articles per day, we can conclude that there is a completely different approach between weekdays and weekends (see Figure 4). Overall, Saturdays and Sundays include on average 36% fewer news articles in relation to weekdays. This is expected to some degree, since media organizations operate during weekends with a reduced number of staff, and also, during working days, more important events take place. It is worth noting that a previous study (Veglis 2014) reported a 10–20% drop on the number of visits to media websites during weekends. Of course, this percentage is significantly smaller than the 35% actual reduction on the average number of published news articles during weekends. One can argue that during weekends, people have more time to consume news, and thus, media companies may try to exploit this fact. On the other hand, during weekends, people tend to socialize more and thus have less time to read news articles.
The distribution of the news articles during a twenty-four-hour period appears to differentiate between weekdays and weekends. It is worth noting that during weekends, the average number of articles per time period remains almost constant between 9:00 and 23:00. On the other hand, during weekdays, from 11:00 until 13:00, the numbers of articles per hour exhibit their highest value, and then, until the end of the day, they seem to decrease with some fluctuations. Around 18:00, there seems to be another peak in the number of published news articles, which is lower than the previous peak (from 11:00 to 13:00). If one examines separately the average number of published articles of each media website, they will identify two peak time periods that may vary between different media. One peak is located in the 11:00–13:00 time period and the second around 18:00. This finding is consistent with the findings of Veglis (2014).
That means that publishing patterns vary significantly between weekdays and weekends (Research Question 2). As was derived from the above discussion, publishing patterns during weekends are not on par with the traffic patterns exhibited by internet users (Veglis 2014).
If we compare this finding with the reported traffic data from the previous study (Veglis 2014), we can spot a significant difference between what news websites publish and what the readership consumes. There seems to be a lack of content during late afternoon and evening, when the readership seems to be keener to consume content. On the other hand, one must take into account the fact that journalists also have specific working hours that are in line with the usual everyday working hours. However, there are tools available today with which journalists can prepare news articles during their regular working hours and program them to be published during the afternoon and evening, thus enhancing their publishing schedule at the time periods when there is high demand from the readership.
Another parameter that was thoroughly examined was the category of the news articles. The results indicate that during weekends, publishing patterns remain the same. One exception seems to be articles related to the economy where there seems to be a significant decrease in the average number of published articles between Saturday and Sunday. Moreover, specific article categories (technology, tourism, lifestyle and sports) do not appear to have any variation in publishing patterns between weekdays and weekends (refer to Figure 7). On the other hand, specific article categories exhibit distinctive publishing patterns. For example, articles related to society have the highest publishing rate during Fridays, whereas articles related to international issues peak on Wednesdays, and politics and economy on Thursdays. The previous mentioned variations in publishing rates between different days appear to be significant (up to a 50% increase in some cases) and apparently may require additional detailed studies in order to identify the causes.
Moving to the publishing patterns of different category articles per hour, the results have also pinpointed distinct behaviors (see Figure 8 and Figure 9). Specifically, international news articles appear to exhibit peak publishing rates at the end of the day (both during weekdays and weekends), something that can be explained by the time differences that exist between Greece and the USA, from where a significant part of Greek news websites’ international content derives. Interesting publishing patterns have also been identified in news articles related to society where the publishing peak is late in the afternoon (17:00 on weekdays and 18:00 during weekends). Additionally, news articles related to politics exhibit their peak publishing rate at 13:00 on both weekdays and weekends. Finally, news articles about the economy exhibit two peaks at 11:00 and 18:00 during weekdays and 8:00 in the morning during weekends. Of course, important economic events happen during working days, and this can explain the two peaks that appear during weekdays, whereas during weekends, important economic developments are not so usual. Further, the peak exhibited at 18:00 can be attributed to the time difference between the USA (from where important economic news originate) and Greece. The rest of the news article categories do not display any significant variations during the day since the number of articles they include is quite small.
Based on the previous discussion, we can conclude that different categories of news exhibit unique publishing patterns (Research Question 3), and in many cases, the same category of news articles demonstrates dissimilar behavior during weekdays and weekends.
Without doubt, the above results indicate the existence of a specific publishing strategy for the top 22 Greek media websites. More study is now required among the readership that consumes news articles. Although the existing publishing strategy implemented by media organizations seems to match the needs of the audience (that derive from past studies), there is a lack of specific information on the categories of news articles that the readership consumes during various time periods in a day or during a week. Such information will allow media organizations to fine-tune their publishing strategies. The benefits of space–time and thematic adaptation to the interests of users are multiple. On the one hand, “universal information” is served, as it provides access to all sources and flows of information, which are formed based on the personal preferences of everyone. On the other hand, the optimization of the provided services and the expected increase of web traffic ensure financial resources for the performance of the journalistic function (without degradations in quality and objectivity due to underfinancing phenomena). The audience will also benefit from targeted information, saving valuable time when it comes to staying informed, both on specific news (focused spatiotemporal framing) and on issues of wider interest. This includes targeted advertising, which makes ads useful and not unwanted.
5. Conclusions
This study has examined publishing patterns in Greek media websites. It is based on a sample of more than five hundred thousand news articles that were published during four and a half months in 2020. The study answered three research questions. Specifically, it identified specific publishing patterns in terms of weekdays and weekends and also during the twenty-four-hour cycle during a day. These patterns appear to be in agreement with the reported users’ consumption habits (OPA 2003; OPAeurope 2007; Veglis 2014). The study also identified that different categories of news articles exhibit different publishing patterns during a day and also dissimilar behavior during weekdays and weekends. This study has contributed to the existing knowledge on the issue of media companies’ publishing patterns. This study is to be followed by detailed mapping of news articles consumption habits of internet users. Thus, we will be able to determine if media publishing patterns coincide with the users’ consumption patterns or further adjustments are required in order for media organizations to best exploit their news production. Such optimization is required from media organizations in order to increase their readability as well as their revenue.
It is worth noting that this study also has certain limitations that have to do with the fact that it is based on data from a specific time period (mid-summer to mid-autumn) and during the COVID-19 pandemic, which may have in some cases disrupted the normal publishing rhythm of the media organizations. Additionally, the study only counts the number of published articles, and in many cases, that number does not reflect new content but recycled existing content, a phenomenon that is known as churnalism (Saridou et al. 2017). One other parameter that needs to be considered is that the number of news articles published is dependent on the size and qualification of the staff in each media organization. This is something that definitely requires further, perhaps qualitative studies and is certain to be one of the aspects that will be investigated in a future extension of this work. One other thing that needs to be mentioned is that in the last decade, the fake news phenomenon has come into force (Baptista and Gradim 2020). Two media that have been flagged as potential sources of fake news are included in the media websites under investigation. In other words, there is no guarantee that all data refer to regular news articles.
Nevertheless, this study in only the first step in the detailed formation of a publishing strategy. The second step is the data collection of the consumption habits of news content consumers. The results of the two studies will be compared to identify discrepancies, and the results will be used to devise news publishing strategies by media that will take advantage of the specific characteristics of each time period.
Another aspect that requires further research is the use of social media for news dissemination. On the one hand, there is the ability of media organizations to share their news articles through their social media accounts, and on the other hand, there is the possibility of news sharing by users, something that is out of the control of media organizations (Kümpel et al. 2015).
The expected positive effects from the successful outcome of this study can help to improve the media product. The development of successful content publishing strategies will contribute to the optimization of journalistic practices and the development of the media industry that has been challenged in many ways in recent years. Many practices that will be adopted as a necessity of the Greek reality can be developed into innovative strategies with an international research contribution.
Author Contributions
Conceptualization, E.A., A.V. and C.D.; methodology, E.A.; formal analysis, E.A.; resources, A.V.; data curation, A.V.; writing—original draft preparation, E.A.; writing—review and editing, E.A.; visualization, E.A.; supervision, C.D. All authors have read and agreed to the published version of the manuscript.
Funding
This research was funded by Greece and the European Union (European Social Fund) through the Operational Program “Human Resources Development, Education and Lifelong Learning”, in the framework of the Act “SUPPORT OF POSTGRADUATE RESEARCHERS-B cycle” (MIS 5033021) implemented by the State Scholarships Foundation (IKY).
Data Availability Statement
Restrictions apply to the availability of the data employed in the study. Data was obtained from INNEWS.gr and are available from INNEWS.gr with its permission.
Conflicts of Interest
The authors declare no conflict of interest.
References
- American Press Institute. 2014. Social and Demographic Differences in News Habits and Attitudes. Available online: https://www.americanpressinstitute.org/publications/reports/survey-research/social-demographic-differences-news-habits-attitudes/ (accessed on 7 February 2021).
- Avraam, Evangelia. 2012. Contribution of New Information and Communication Technologies in the Production Distribution and Consumption of News. Ph.D. dissertation, School of Journalism & MMC, Aristotle University of Thessaloniki, Thessaloniki, Greece. (In Greek). [Google Scholar]
- Baptista, João P., and Anabela Gradim. 2020. Understanding Fake News Consumption: A Review. Social Sciences 9: 185. [Google Scholar] [CrossRef]
- Beyers, Hans. 2004. Dayparting online: living up to its potential? International Journal on Media Management 6: 67–73. [Google Scholar] [CrossRef]
- Colace, Francesco, Luca Casaburi, Massimo De Santo, and Luca Greco. 2015. Sentiment detection in social networks and in collaborative learning environments. Computers in Human Behavior 51: 1061–67. [Google Scholar] [CrossRef]
- Elliott, Charlotte, Wallace Chuma, Y.E. Gendi, Davor Marko, and Alisha Patel. 2016. Hate Speech. Key concept paper in Media, Conflict and Democratisation Working Paper (MeCoDEM) ISSN 2057 (unpublisched). Available online: http://eprints.whiterose.ac.uk/117296/1/Elliott%20etal%202016_Hate%20Speech.pdf (accessed on 8 February 2021).
- Kümpel, Anna Sophie, Veronika Karnowski, and Till Keyling. 2015. News sharing in social media: A review of current research on news sharing users, content, and networks. Social Media+ Society 1: 1–14. [Google Scholar] [CrossRef]
- Leskovec, Jure. 2011. Social media analytics: tracking, modeling and predicting the flow of information through networks. Paper presented at the 20th International Conference Companion on World Wide Web, Hyderabad, India, March 28–April 1; pp. 277–78. [Google Scholar]
- MORI Research. 2003. Online Dayparting: Claiming the Day, Seizing the Night. Report. Available online: https://www.wkconline.org/resources/pdf/2003maynm_coats_daypart.pdf (accessed on 7 February 2021).
- Morrissey, Brian. 2003. Defining Dayparts. Internetnews.com. Available online: http://www.Internetnews.com/IAR/article.php/1580701/Defining+Dayparts.htm (accessed on 7 February 2021).
- Newell, Jay, Joseph J. Pilotta, and John C. Thomas. 2008. Mass media displacement and saturation. The International Journal on Media Management 10: 131–38. [Google Scholar] [CrossRef]
- Online Publishers Association (OPA). 2003. The Existence and Characteristics of Dayparts on the Internet. New York: The OPA White Papers, vol. 1, pp. 1–19. [Google Scholar]
- OPAeurope. 2007. Internet Access at Work. A Media Consumption study, SKOPOS Market Insight. Available online: https://robertoigarza.files.wordpress.com/2008/11/rep-mediascope-europe-study-eiaa-2007.pdf (accessed on 7 February 2021).
- Örnebring, Henrik. 2010. Technology and journalism-as-labour: Historical perspectives. Journalism 11: 57–74. [Google Scholar] [CrossRef]
- Pang, Bo, and Lillian Lee. 2008. Opinion mining and sentiment analysis. Foundations and Trends® in Information Retrieval 2: 1–135. [Google Scholar] [CrossRef]
- Pascual, Michael. 2004. ‘Dayparting’ and ‘Prime-Time’: Two Trumps of Online Advertising. Newspaper Techniques. pp. 20–21. Available online: https://www.researchgate.net/publication/294334268_%27Dayparting%27_and_%27prime-time%27_Two_trumps_of_online_advertising (accessed on 7 February 2021).
- Pavlik, John. 2000. The impact of technology on journalismz. Journalism Studies 1: 229–37. [Google Scholar] [CrossRef]
- Sabelström, Kristina. 1998. Consumer needs and competing products in printing and publishing. Paper presented at 98 Conference beyond Convergence, Stockholm, Sweden, June 21–24. [Google Scholar]
- Saridou, Theodora, Lia-Paschalia Spyridou, and Andreas Veglis. 2017. Churnalism on the rise? Assessing convergence effects on editorial practices. Digital Journalism 5: 1006–24. [Google Scholar] [CrossRef]
- Schultz, Don E., Martin P. Block, and Vijay Viswanathan. 2018. Consumer-driven media planning and buying. Journal of Marketing Communications 24: 761–78. [Google Scholar] [CrossRef]
- Sherman, Barry. L. 1995. Telecommunications Management: Broadcasting/cable and the New Technologies. New York: McGraw-Hill. [Google Scholar]
- Siapera, Eugenia, and Andreas Veglis, eds. 2012. The Handbook of Global Online Journalism. Hoboken: John Wiley & Sons. [Google Scholar]
- Spann, Martin, Dominik Molitor, and Stephan Daurer. 2016. Tell Me Where You Are and I’ll Tell You What You Want: Using Location Data to Improve Marketing Decisions. GfK Marketing Intelligence Review 8: 30–37. [Google Scholar] [CrossRef][Green Version]
- Spyridou, Lia-Paschalia, Maria Matsiola, Andreas Veglis, George Kalliris, and Charalambos Dimoulas. 2013. Journalism in a state of flux: Journalists as agents of technology innovation and emerging news practices. International Communication Gazette 75: 76–98. [Google Scholar] [CrossRef]
- Taneja, Harsh, James G. Webster, Edward C. Malthouse, and Thomas B. Ksiazek. 2012. Media consumption across platforms: Identifying user-defined repertoires. New Media & Society 14: 951–68. [Google Scholar]
- Veglis, Andreas. 2008. Comparison of alternative channels in cross media publishing. Publishing Research Quarterly 24: 111–23. [Google Scholar] [CrossRef]
- Veglis, Andreas. 2012. Journalism and Cross-Media Publishing: The Case of Greece. In The Handbook of Global Online Journalism. Edited by Siapera Eugenia and Veglis Andreas. Chichester: John Wiley & Sons Inc., pp. 209–30. [Google Scholar]
- Veglis, Andreas. 2014. Dayparting in online media: The case of Greece. International Journal of Computers and Communications 8: 77–85. [Google Scholar]
- Veglis, Andreas, Charalampos Dimoulas, and George Kalliris. 2016. Towards intelligent cross-media publishing: media practices and technology convergence perspectives. In Media Convergence Handbook. Edited by Lugmayr Artur and Dal Zotto Cinzia. Berlin: Media Business and Innovation, Springer, vol. 1, pp. 131–50. [Google Scholar]
- Zelizer, Barbie. 2019. Why journalism is about more than digital technology. Digital Journalism 7: 343–50. [Google Scholar] [CrossRef]


Publisher’s Note: MDPI stays neutral with regard to jurisdictional claims in published maps and institutional affiliations. |
© 2021 by the authors. Licensee MDPI, Basel, Switzerland. This article is an open access article distributed under the terms and conditions of the Creative Commons Attribution (CC BY) license (http://creativecommons.org/licenses/by/4.0/).