COVID-19 Is Examining the EU and the Member States: The Role of Attitudes and Sociodemographic Factors on Citizens’ Support towards National Policies


Abstract
1. Introduction
2. Literature Review
3. Data and Variables
4. Methodology, Econometric Model
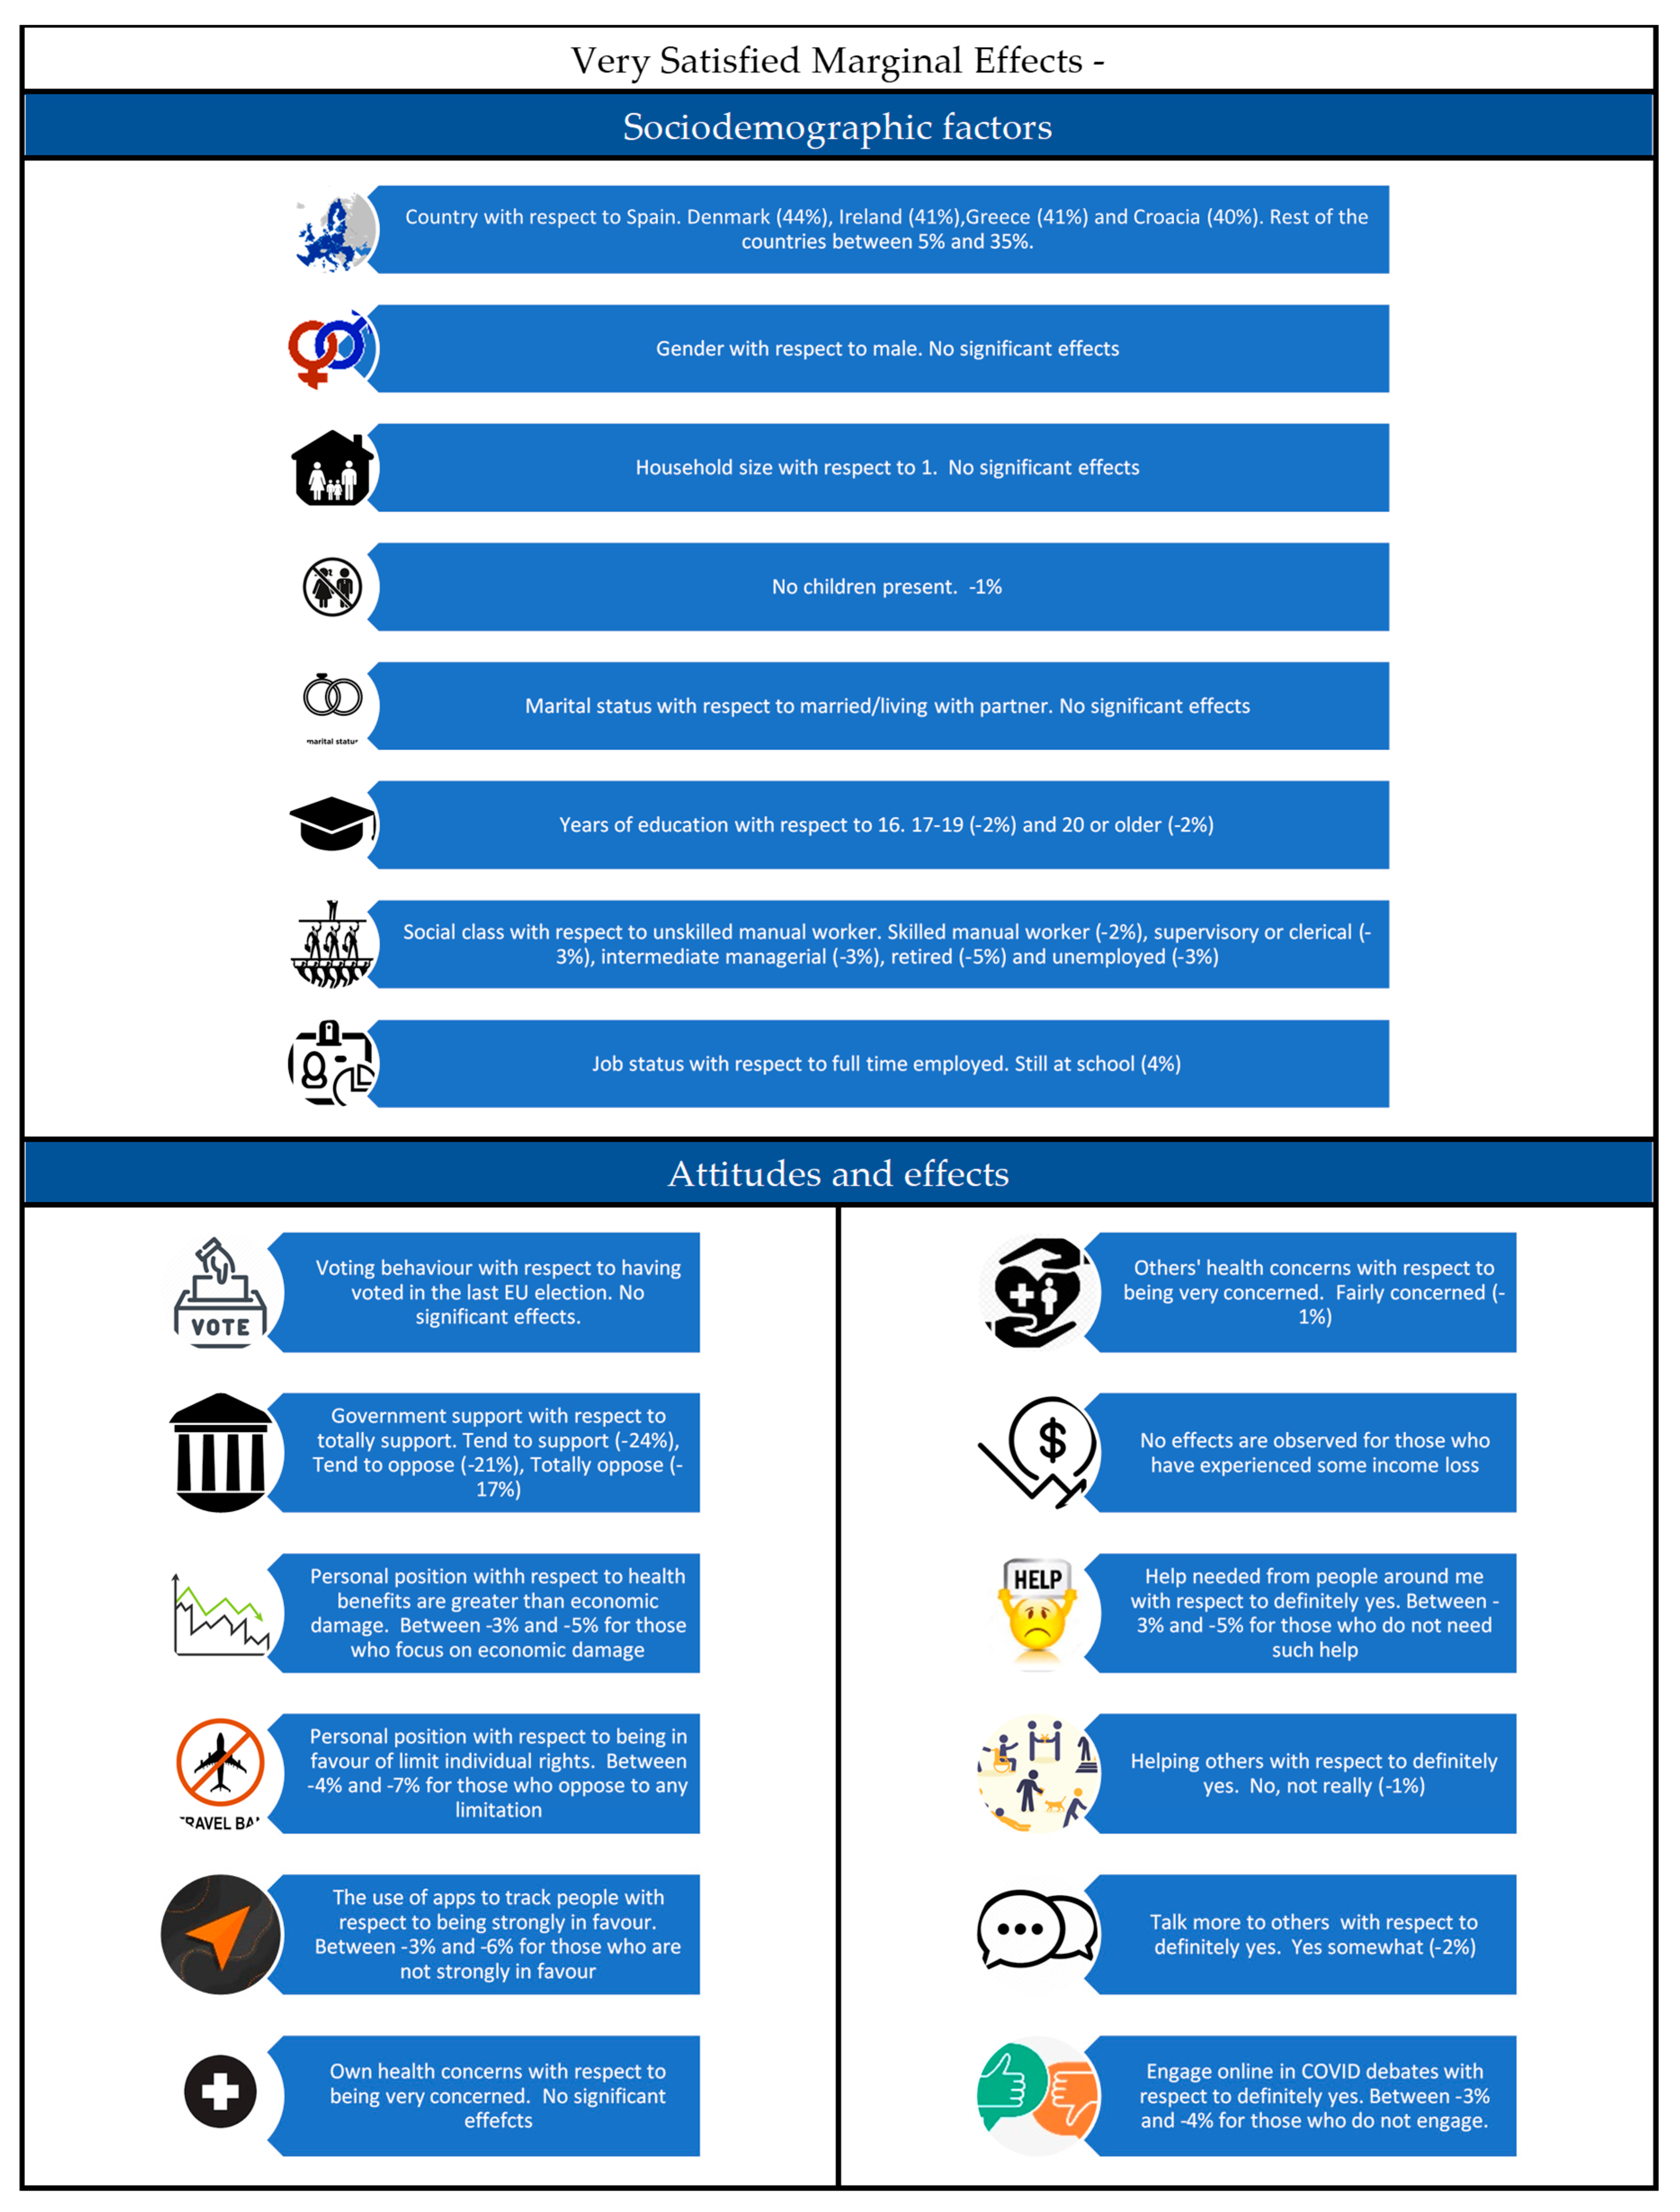
5. Results
6. Discussion
7. Conclusions
Author Contributions
Funding
Institutional Review Board Statement
Informed Consent Statement
Data Availability Statement
Conflicts of Interest
Appendix A

| Country | Frequency | Percentage (%) |
|---|---|---|
| France | 1054 | 4.8 |
| Germany | 1054 | 4.8 |
| Spain | 1054 | 4.8 |
| Italy | 1054 | 4.8 |
| Netherlands | 1046 | 4.8 |
| Belgium | 1046 | 4.8 |
| Austria | 1041 | 4.8 |
| Poland | 1051 | 4.8 |
| Sweden | 1041 | 4.8 |
| Finland | 1049 | 4.8 |
| Denmark | 1025 | 4.7 |
| Bulgaria | 1020 | 4.7 |
| Croatia | 1029 | 4.7 |
| Czech | 1011 | 4.6 |
| Greece | 1050 | 4.8 |
| Hungary | 1043 | 4.8 |
| Ireland | 1019 | 4.7 |
| Portugal | 1026 | 4.7 |
| Romania | 1017 | 4.7 |
| Slovakia | 1035 | 4.7 |
| Slovenia | 1039 | 4.8 |
| Total | 21,804 | 100.0 |
| Variable | Categories | Definition |
|---|---|---|
| 21 country dummy variables | Country1 | France |
| Country2 | Germany | |
| Country3 (Base) | Spain | |
| Country4 | Italy | |
| Country5 | Netherlands | |
| Country6 | Belgium | |
| Country7 | Austria | |
| Country8 | Poland | |
| Country9 | Sweden | |
| Country10 | Finland | |
| Country11 | Denmark | |
| Country12 | Bulgaria | |
| Country13 | Croatia | |
| Country14 | Czech | |
| Country15 | Greece | |
| Country16 | Hungary | |
| Country17 | Ireland | |
| Country18 | Portugal | |
| Country19 | Romania | |
| Country20 | Slovakia | |
| Country21 | Slovenia | |
| 4 gender dummy variables | Gender1 (Base) | Male |
| Gender2 | Female | |
| Gender 3 | I don’t identify as either | |
| Gender4 | Prefer not to answer | |
| 4 household size dummy variables | HHsize1 (Base) | 1 |
| HHsize 2 | 2 | |
| HHsize 3 | 3 | |
| HHsize 4 | 4 or more | |
| 1 no children present in the household dummy variable | Ch_Presence(N) | There are no children in the household |
| 6 marital status dummy variables s | MarSta1 (Base) | Married/living with partner |
| MarSta2 | Never married (single) | |
| MarSta3 | Divorced/widowed | |
| MarSta4 | Living with parents | |
| MarSta5 | Domestic partner/living with other adults | |
| MarSta6 | NA | |
| 4 terminal age of education dummy variables | Edu1 (Base) | 16 years or younger |
| Educ2 | 17–19 years | |
| Edu3 | 20 years or older | |
| Edu4 | Still studying | |
| 8 social class dummy variables | SClass1 (Base) | Semi or unskilled manual worker |
| SClass2 | Skilled manual worker | |
| SClass3 | Supervisory or clerical/Junior managerial/Professional/Administrator | |
| SClass4 | Intermediate managerial/Professional/Administrative | |
| SClass5 | Higher managerial/Professional/Administrative | |
| SClass6 | Student | |
| SClass7 | Retired and living on state pension only | |
| SClass8 | Unemployed (for over 6 months) or not working due to long term sickness | |
| 9 employment status dummy variables | Employ1 (Base) | Employed full time (30+ h per week) |
| Employ2 | Employed part time (less than 30 h per week) | |
| Employ3 | Self-employed | |
| Employ4 | Retired/Unable to work/Disabled | |
| Employ5 | Still at school | |
| Employ6 | In full time higher education | |
| Employ7 | Unemployed and seeking work | |
| Employ8 | Not working and not seeking work | |
| Employ9 | Prefer not to say | |
| 3 dummy variables regarding the participation in 2019 May EU elections | VoteEU1 (Base) | Voted |
| VoteEU2 | Did not vote | |
| VoteEU3 | Don’t know/Not applicable | |
| 5 dummy variables regarding national government support in general | Gov_Sup1 (Base) | Totally support |
| Gov_Sup2 | Tend to support | |
| Gov_Sup3 | Tend to oppose | |
| Gov_Sup4 | Totally oppose | |
| Gov_Sup5 | Don’t know/Not applicable | |
| 7 dummy variables regarding the personal position between the health benefits and economic damage | HBvsED1 (Base) | 1—The health benefits are greater than the economic damage |
| HBvsED2 | 2 | |
| HBvsED3 | 3 | |
| HBvsED4 | 4 | |
| HBvsED5 | 5 | |
| HBvsED6 | 6—The economic damage is greater than the health benefits | |
| HBvsED7 | Don’t know/Not applicable | |
| 7 dummy variables regarding the personal position on the recent limitations to my individual freedoms | LimIndFree1 (Base) | 1 The fight against the coronavirus pandemic fully justifies recent limitations to my individual freedoms |
| LimIndFree2 | 2 | |
| LimIndFree3 | 3 | |
| LimIndFree4 | 4 | |
| LimIndFree5 | 5 | |
| LimIndFree6 | 6 I am strongly opposed to any limitations of my individual freedoms, regardless of the coronavirus pandemic | |
| LimIndFree7 | Don’t know/Not applicable | |
| 5 dummy variables regarding the personal position on the use of apps to fight the virus’ expansion | AppsUse1 (Base) | Strongly in favor |
| AppsUse2 | Somewhat in favor | |
| AppsUse3 | Somewhat opposed | |
| AppsUse4 | Strongly opposed | |
| AppsUse5 | Don’t know/Not applicable | |
| 5 dummy variables regarding the own health concern because of the coronavirus | Health1 (Base) | Very concerned |
| Health2 | Fairly concerned | |
| Health3 | Not very concerned | |
| Health4 | Not at all concerned | |
| Health5 | Don’t know/Not applicable | |
| 5 dummy variables regarding the health concern of family and friends because of the coronavirus | Health_Fam1 (Base) | Very concerned |
| Health_Fam2 | Fairly concerned | |
| Health_Fam3 | Not very concerned | |
| Health_Fam4 | Not at all concerned | |
| Health_Fam5 | Don’t know/Not applicable | |
| 1 dummy variable that reflects whether the respondent is suffering some economic loss | Eco_loss | Loss of income, difficulties in paying bills/rents, partial unemployment or bankruptcy, difficulties in having decent meals |
| 5 dummy variables regarding if respondents receive help from people around them | Helped1 (Base) | Yes, definitely |
| Helped2 | Yes, somewhat | |
| Helped3 | No, not really | |
| Helped4 | No, not at all | |
| Helped5 | Don’t know/Not applicable | |
| 5 dummy variables regarding if respondents help other people in need | Helping1 (Base) | Yes, definitely |
| Helping2 | Yes, somewhat | |
| Helping3 | No, not really | |
| Helping4 | No, not at all | |
| Helping5 | Don’t know/Not applicable | |
| 5 dummy variables regarding if respondents talk more often to people on phone, social media or apps | Talk1 (Base) | Yes, definitely |
| Talk2 | Yes, somewhat | |
| Talk3 | No, not really | |
| Talk4 | No, not at all | |
| Talk5 | Don’t know/Not applicable | |
| 5 dummy variables regarding if respondents engage online in debates on the measures applied against the coronavirus | Debates1 (Base) | Yes, definitely |
| Debates2 | Yes, somewhat | |
| Debates3 | No, not really | |
| Debates4 | No, not at all | |
| Debates5 | Don’t know/Not applicable |
| Variable | Definition | Model | Marginal Effects | ||||
|---|---|---|---|---|---|---|---|
| Coefficient | Freq = 1 | Freq = 2 | Freq = 3 | Freq = 4 | Freq = 5 | ||
| Country1 | France | 0.1944 *** | −0.0131 *** | −0.0507 *** | −0.0045 *** | 0.0398 *** | 0.0284 *** |
| Country2 | Germany | 0.6924 *** | −0.0465 *** | −0.1804 *** | −0.0160 *** | 0.1419 *** | 0.1010 *** |
| Country4 | Italy | 0.4348 *** | −0.0292 *** | −0.1133 *** | −0.0100 *** | 0.0891 *** | 0.0634 *** |
| Country5 | Netherlands | 1.0710 *** | −0.0720 *** | −0.2790 *** | −0.0247 *** | 0.2195 *** | 0.1562 *** |
| Country6 | Belgium | 0.6585 *** | −0.0443 *** | −0.1715 *** | −0.0152 *** | 0.1349 *** | 0.0960 *** |
| Country7 | Austria | 1.2256 *** | −0.0824 *** | −0.3193 *** | −0.0283 *** | 0.2511 *** | 0.1788 *** |
| Country8 | Poland | 0.8204 *** | −0.0551 *** | −0.2137 *** | −0.0189 *** | 0.1681 *** | 0.1197 *** |
| Country9 | Sweden | 0.8714 *** | −0.0586 *** | −0.2270 *** | −0.0201 *** | 0.1786 *** | 0.1271 *** |
| Country10 | Finland | 0.9733 *** | −0.0654 *** | −0.2536 *** | −0.0224 *** | 0.1995 *** | 0.1420 *** |
| Country11 | Denmark | 1.4701 *** | −0.0988 *** | −0.3829 *** | −0.0339 *** | 0.3012 *** | 0.2144 *** |
| Country12 | Bulgaria | 0.8171 *** | −0.0549 *** | −0.2128 *** | −0.0188 *** | 0.1674 *** | 0.1192 *** |
| Country13 | Croatia | 1.3922 *** | −0.0936 *** | −0.3627 *** | −0.0321 *** | 0.2853 *** | 0.2031 *** |
| Country14 | Czech | 0.9449 *** | −0.0635 *** | −0.2461 *** | −0.0218 *** | 0.1936 *** | 0.1378 *** |
| Country15 | Greece | 1.3751 *** | −0.0924 *** | −0.3582 *** | −0.0317 *** | 0.2818 *** | 0.2006 *** |
| Country16 | Hungary | 0.6345 *** | −0.0426 *** | −0.1653 *** | −0.0146 *** | 0.1300 *** | 0.0925 *** |
| Country17 | Ireland | 1.3954 *** | −0.0938 *** | −0.3635 *** | −0.0322 *** | 0.2859 *** | 0.2035 *** |
| Country18 | Portugal | 1.1157 *** | −0.0750 *** | −0.2906 *** | −0.0257 *** | 0.2286 *** | 0.1627 *** |
| Country19 | Romania | 0.4425 *** | −0.0297 *** | −0.1153 *** | −0.0102 *** | 0.0907 *** | 0.0645 *** |
| Country20 | Slovakia | 1.0446 *** | −0.0702 *** | −0.2721 *** | −0.0241 *** | 0.2140 *** | 0.1523 *** |
| Country21 | Slovenia | 1.0792 *** | −0.0725 *** | −0.2811 *** | −0.0249 *** | 0.2211 *** | 0.1574 *** |
| Gender2 | Female | 0.0598 *** | −0.0040 *** | −0.0156 *** | −0.0014 *** | 0.0123 *** | 0.0087 *** |
| Gender 3 | I don’t identify as either | 0.2088 | −0.0140 | −0.0544 | −0.0048 | 0.0428 | 0.0305 |
| Gender4 | Prefer not to answer | 0.2439 | −0.0164 | −0.0635 | −0.0056 | 0.0500 | 0.0356 |
| HHsize 2 | 2 | −0.0510. | 0.0034. | 0.0133. | 0.0012. | −0.0105. | −0.0074. |
| HHsize 3 | 3 | −0.0668 * | 0.0045 * | 0.0174 * | 0.0015 * | −0.0137 * | −0.0097 * |
| HHsize 4 | 4 or more | −0.0525. | 0.0035. | 0.0137. | 0.0012. | −0.0108. | −0.0077. |
| Ch_Presence(N) | There are no children in the household | −0.0131 | 0.0009 | 0.0034 | 0.0003 | −0.0027 | −0.0019 |
| MarSta2 | Never married (single) | −0.0153 | 0.0010 | 0.0040 | 0.0004 | −0.0031 | −0.0022 |
| MarSta3 | Divorced/widowed | −0.0465 | 0.0031 | 0.0121 | 0.0011 | −0.0095 | −0.0068 |
| MarSta4 | Living with parents | 0.0218 | −0.0015 | −0.0057 | −0.0005 | 0.0045 | 0.0032 |
| MarSta5 | Domestic partner/living with other adults | −0.0187 | 0.0013 | 0.0049 | 0.0004 | −0.0038 | −0.0027 |
| MarSta6 | NA | −0.1327 * | 0.0089 * | 0.0346 * | 0.0031 * | −0.0272 * | −0.0194 * |
| Educ2 | 17−19 years | 0.0019 | −0.0001 | −0.0005 | 0.0000 | 0.0004 | 0.0003 |
| Edu3 | 20 years or older | 0.0179 | −0.0012 | −0.0047 | −0.0004 | 0.0037 | 0.0026 |
| Edu4 | Still studying | −0.0126 | 0.0008 | 0.0033 | 0.0003 | −0.0026 | −0.0018 |
| SClass2 | Skilled manual worker | −0.0384 | 0.0026 | 0.0100 | 0.0009 | −0.0079 | −0.0056 |
| SClass3 | Supervisory or clerical/Junior managerial/Professional/administrator | −0.0361 | 0.0024 | 0.0094 | 0.0008 | −0.0074 | −0.0053 |
| SClass4 | Intermediate managerial/Professional/Administrative | −0.0294 | 0.0020 | 0.0077 | 0.0007 | −0.0060 | −0.0043 |
| SClass5 | Higher managerial/Professional/Administrative | −0.0237 | 0.0016 | 0.0062 | 0.0005 | −0.0048 | −0.0035 |
| SClass6 | Student | −0.0072 | 0.0005 | 0.0019 | 0.0002 | −0.0015 | −0.0011 |
| SClass7 | Retired and living on state pension only | −0.1244 ** | 0.0084 * | 0.0324 ** | 0.0029 * | −0.0255 * | −0.0181 ** |
| SClass8 | Unemployed (for over 6 months) or not working due to long term sickness | −0.0258 | 0.0017 | 0.0067 | 0.0006 | −0.0053 | −0.0038 |
| Employ2 | Employed part time (less than 30 h per week) | −0.0358 | 0.0024 | 0.0093 | 0.0008 | −0.0073 | −0.0052 |
| Employ3 | Self-employed | −0.0621. | 0.0042. | 0.0162. | 0.0014. | −0.0127. | −0.0091. |
| Employ4 | Retired/Unable to work/Disabled | −0.0079 | 0.0005 | 0.0021 | 0.0002 | −0.0016 | −0.0012 |
| Employ5 | Still at school | 0.0079 | −0.0005 | −0.0021 | −0.0002 | 0.0016 | 0.0012 |
| Employ6 | In full time higher education | 0.0182 | −0.0012 | −0.0047 | −0.0004 | 0.0037 | 0.0027 |
| Employ7 | Unemployed and seeking work | −0.0555. | 0.0037. | 0.0145. | 0.0013. | −0.0114. | −0.0081. |
| Employ8 | Not working and not seeking work | −0.0404 | 0.0027 | 0.0105 | 0.0009 | −0.0083 | −0.0059 |
| Employ9 | Prefer not to say | −0.0617 | 0.0041 | 0.0161 | 0.0014 | −0.0126 | −0.0090 |
| VoteEU2 | Did not vote | −0.0675 *** | 0.0045 *** | 0.0176 *** | 0.0016 *** | −0.0138 *** | −0.0098 *** |
| VoteEU3 | Don’t know/Not applicable | −0.0586. | 0.0039. | 0.0153. | 0.0014. | −0.0120. | −0.0085. |
| Gov_Sup2 | Tend to support | −1.2181 *** | 0.0819 *** | 0.3173 *** | 0.0281 *** | −0.2496 *** | −0.1777 *** |
| Gov_Sup3 | Tend to oppose | −2.2106 *** | 0.1486 *** | 0.5759 *** | 0.0510 *** | −0.4530 *** | −0.3224 *** |
| Gov_Sup4 | Totally oppose | −3.1360 *** | 0.2108 *** | 0.8169 *** | 0.0723 *** | −0.6426 *** | −0.4574 *** |
| Gov_Sup5 | Don’t know/Not applicable | −1.7409 *** | 0.1170 *** | 0.4535 *** | 0.0401 *** | −0.3567 *** | −0.2539 *** |
| HBvsED2 | 2 | 0.0379 | −0.0025 | −0.0099 | −0.0009 | 0.0078 | 0.0055 |
| HBvsED3 | 3 | −0.0519 | 0.0035 | 0.0135 | 0.0012 | −0.0106 | −0.0076 |
| HBvsED4 | 4 | −0.0889 ** | 0.0060 ** | 0.0231 ** | 0.0020 ** | −0.0182 ** | −0.0130 ** |
| HBvsED5 | 5 | −0.2542 *** | 0.0171 *** | 0.0662 *** | 0.0059 *** | −0.0521 *** | −0.0371 *** |
| HBvsED6 | 6—The economic damage is greater than the health benefits | −0.5678 *** | 0.0382 *** | 0.1479 *** | 0.0131 *** | −0.1163 *** | −0.0828 *** |
| HBvsED7 | Don’t know/Not applicable | −0.0894 * | 0.0060 * | 0.0233 * | 0.0021 * | −0.0183 * | −0.0130 * |
| LimIndFree2 | 2 | −0.1320 *** | 0.0089 *** | 0.0344 *** | 0.0030 *** | −0.0271 *** | −0.0193 *** |
| LimIndFree3 | 3 | −0.2857 *** | 0.0192 *** | 0.0744 *** | 0.0066 *** | −0.0585 *** | −0.0417 *** |
| LimIndFree4 | 4 | −0.3933 *** | 0.0264 *** | 0.1025 *** | 0.0091 *** | −0.0806 *** | −0.0574 *** |
| LimIndFree5 | 5 | −0.4292 *** | 0.0288 *** | 0.1118 *** | 0.0099 *** | −0.0880 *** | −0.0626 *** |
| LimIndFree6 | 6—I am strongly opposed to any limitations of my individual freedoms, regardless of the coronavirus pandemic | −0.7536 *** | 0.0506 *** | 0.1963 *** | 0.0174 *** | −0.1544 *** | −0.1099 *** |
| LimIndFree7 | Don’t know/Not applicable | −0.3498 *** | 0.0235 *** | 0.0911 *** | 0.0081 *** | −0.0717 *** | −0.0510 *** |
| AppsUse2 | Somewhat in favor | −0.1449 *** | 0.0097 *** | 0.0377 *** | 0.0033 *** | −0.0297 *** | −0.0211 *** |
| AppsUse3 | Somewhat opposed | −0.2794 *** | 0.0188 *** | 0.0728 *** | 0.0064 *** | −0.0573 *** | −0.0408 *** |
| AppsUse4 | Strongly opposed | −0.4534 *** | 0.0305 *** | 0.1181 *** | 0.0105 *** | −0.0929 *** | −0.0661 *** |
| AppsUse5 | Don’t know/Not applicable | −0.2645 *** | 0.0178 *** | 0.0689 *** | 0.0061 *** | −0.0542 *** | −0.0386 *** |
| Health2 | Fairly concerned | 0.0795 ** | −0.0053 ** | −0.0207 ** | −0.0018 ** | 0.0163 ** | 0.0116 ** |
| Health3 | Not very concerned | 0.1654 *** | −0.0111 *** | −0.0431 *** | −0.0038 *** | 0.0339 *** | 0.0241 *** |
| Health4 | Not at all concerned | 0.1248 *** | −0.0084 ** | −0.0325 *** | −0.0029 ** | 0.0256 ** | 0.0182 ** |
| Health5 | Don’t know/Not applicable | 0.0555 | −0.0037 | −0.0145 | −0.0013 | 0.0114 | 0.0081 |
| Health_Fam2 | Fairly concerned | 0.0329 | −0.0022 | −0.0086 | −0.0008 | 0.0067 | 0.0048 |
| Health_Fam3 | Not very concerned | 0.0101 | −0.0007 | −0.0026 | −0.0002 | 0.0021 | 0.0015 |
| Health_Fam4 | Not at all concerned | −0.0141 | 0.0009 | 0.0037 | 0.0003 | −0.0029 | −0.0021 |
| Health_Fam5 | Don’t know/Not applicable | 0.1089 | −0.0073 | −0.0284 | −0.0025 | 0.0223 | 0.0159 |
| Eco_loss | Loss of income, difficulties in paying bills/rents, partial unemployment or bankruptcy, difficulties in having decent meals | −0.1122 *** | 0.0075 *** | 0.0292 *** | 0.0026 *** | −0.0230 *** | −0.0164 *** |
| Helped2 | Yes, somewhat | −0.1414 *** | 0.0095 *** | 0.0368 *** | 0.0033 *** | −0.0290 *** | −0.0206 *** |
| Helped3 | No, not really | −0.1840 *** | 0.0124 *** | 0.0479 *** | 0.0042 *** | −0.0377 *** | −0.0268 *** |
| Helped4 | No, not at all | −0.2136 *** | 0.0144 *** | 0.0556 *** | 0.0049 *** | −0.0438 *** | −0.0312 *** |
| Helped5 | Don’t know/Not applicable | −0.1533 ** | 0.0103 ** | 0.0399 ** | 0.0035 ** | −0.0314 ** | −0.0224 ** |
| Helping2 | Yes, somewhat | 0.0169 | −0.0011 | −0.0044 | −0.0004 | 0.0035 | 0.0025 |
| Helping3 | No, not really | −0.0042 | 0.0003 | 0.0011 | 0.0001 | −0.0009 | −0.0006 |
| Helping4 | No, not at all | 0.0157 | −0.0011 | −0.0041 | −0.0004 | 0.0032 | 0.0023 |
| Helping5 | Don’t know/Not applicable | −0.0950 * | 0.0064 * | 0.0247 * | 0.0022 * | −0.0195 * | −0.0139 * |
| Talk2 | Yes, somewhat | −0.0401 * | 0.0027 * | 0.0104 * | 0.0009. | −0.0082 * | −0.0058 * |
| Talk3 | No, not really | −0.0164 | 0.0011 | 0.0043 | 0.0004 | −0.0034 | −0.0024 |
| Talk4 | No, not at all | −0.0070 | 0.0005 | 0.0018 | 0.0002 | −0.0014 | −0.0010 |
| Talk5 | Don’t know/Not applicable | −0.0516 | 0.0035 | 0.0135 | 0.0012 | −0.0106 | −0.0075 |
| Debates2 | Yes, somewhat | −0.0835. | 0.0056. | 0.0218. | 0.0019. | −0.0171. | −0.0122. |
| Debates3 | No, not really | −0.0926 * | 0.0062 * | 0.0241 * | 0.0021 * | −0.0190 * | −0.0135 * |
| Debates4 | No, not at all | 0.0016 | −0.0001 | −0.0004 | 0.0000 | 0.0003 | 0.0002 |
| Debates5 | Don’t know/Not applicable | −0.0316 | 0.0021 | 0.0082 | 0.0007 | −0.0065 | −0.0046 |
| Threshold parameters | |||||||
| −3.4185 *** | |||||||
| −2.1584 *** | |||||||
| −2.0386 *** | |||||||
| −0.1126 | |||||||
| Model adjustment Log-Likelihood: −21,401.82 McFadden’s R2: 0.2738 AIC: 43,005.65 | |||||||
| Variable | Definition | Model | Marginal Effects | |||||
|---|---|---|---|---|---|---|---|---|
| Coefficient | SD | Freq = 1 | Freq = 2 | Freq = 3 | Freq = 4 | Freq = 5 | ||
| Country1 | France | 0.1015 *** | 0.0382 | −0.0088 | −0.0535 *** | −0.0060 *** | 0.0191 | 0.0493 *** |
| Country2 | Germany | 0.3154 *** | 0.0608 | −0.0237 *** | −0.1478 *** | −0.0179 *** | 0.0155 | 0.1740 *** |
| Country4 | Italy | 0.1969 *** | 0.0174 | −0.0193 *** | −0.1047 *** | −0.0112 *** | 0.0431 * | 0.0921 *** |
| Country5 | Netherlands | 0.5062 *** | 0.1711 *** | −0.0264 *** | −0.1898 *** | −0.0260 *** | −0.0825 *** | 0.3247 *** |
| Country6 | Belgium | 0.3065 *** | 0.1347 ** | −0.0183 *** | −0.1319 *** | −0.0173 *** | −0.0164 | 0.1838 *** |
| Country7 | Austria | 0.5464 *** | 0.0703 | −0.0311 *** | −0.2152 *** | −0.0290 *** | −0.0701 *** | 0.3454 *** |
| Country8 | Poland | 0.3700 *** | −0.0306 | −0.0296 *** | −0.1836 *** | −0.0219 *** | 0.0421 * | 0.1930 *** |
| Country9 | Sweden | 0.4130 *** | 0.2552 *** | −0.0160 *** | −0.1496 *** | −0.0217 *** | −0.0855 *** | 0.2727 *** |
| Country10 | Finland | 0.4443 *** | 0.0842. | −0.0280 *** | −0.1869 *** | −0.0243 *** | −0.0295 | 0.2686 *** |
| Country11 | Denmark | 0.6662 *** | 0.1335 ** | −0.0320 *** | −0.2300 *** | −0.0323 *** | −0.1473 *** | 0.4416 *** |
| Country12 | Bulgaria | 0.3628 *** | 0.0916 * | −0.0243 *** | −0.1595 *** | −0.0202 *** | −0.0081 | 0.2121 *** |
| Country13 | Croatia | 0.6151 *** | 0.1561 *** | −0.0303 *** | −0.2173 *** | −0.0303 *** | −0.1255 *** | 0.4034 *** |
| Country14 | Czech | 0.4294 *** | 0.1183 ** | −0.0258 *** | −0.1764 *** | −0.0232 *** | −0.0378 * | 0.2633 *** |
| Country15 | Greece | 0.6259 *** | 0.1305 ** | −0.0313 *** | −0.2233 *** | −0.0311 *** | −0.1248 *** | 0.4105 *** |
| Country16 | Hungary | 0.2873 *** | 0.0459 | −0.0231 *** | −0.1394 *** | −0.0165 *** | 0.0263 | 0.1526 *** |
| Country17 | Ireland | 0.6267 *** | 0.1247 ** | −0.0314 *** | −0.2238 *** | −0.0312 *** | −0.1250 *** | 0.4114 *** |
| Country18 | Portugal | 0.5070 *** | 0.0266 | −0.0313 *** | −0.2125 *** | −0.0280 *** | −0.0378 * | 0.3096 *** |
| Country19 | Romania | 0.2020 *** | 0.1389 ** | −0.0090. | −0.0887 *** | −0.0123 *** | −0.0137 | 0.1238 *** |
| Country20 | Slovakia | 0.4637 *** | 0.0479 | −0.0298 *** | −0.1982 *** | −0.0257 *** | −0.0244 | 0.2781 *** |
| Country21 | Slovenia | 0.4795 *** | −0.0494 | −0.0324 *** | −0.2174 *** | −0.0281 *** | 0.0009 | 0.2770 *** |
| Gender2 | Female | 0.0256 *** | −0.0268. | −0.0072 *** | −0.0172 *** | −0.0004 | 0.0217 *** | 0.0032 |
| Gender 3 | I don’t identify as either | 0.0550 | 0.0245 | −0.0047 | −0.0296 | −0.0033 | 0.0113 | 0.0263 |
| Gender4 | Prefer not to answer | 0.0791 | −0.0582 | −0.0152 | −0.0541 | −0.0032 | 0.0551 | 0.0174 |
| HHsize 2 | 2 | −0.0233. | 0.0219 | 0.0065. | 0.0153 * | 0.0004 | −0.0189. | −0.0033 |
| HHsize 3 | 3 | −0.0267 * | 0.0297 | 0.0082 * | 0.0176 * | 0.0003 | −0.0233 * | −0.0028 |
| HHsize 4 | 4 or more | −0.0255. | 0.0145 | 0.0058 | 0.0162 * | 0.0008 | −0.0171 | −0.0056 |
| Ch_Presence(N) | There are no children in the household | −0.0037 | −0.0400 * | −0.0046. | −0.0005 | 0.0013. | 0.0137. | −0.0099. |
| MarSta2 | Never married (single) | −0.0045 | 0.0202 | 0.0033 | 0.0040 | −0.0004 | −0.0097 | 0.0027 |
| MarSta3 | Divorced/Widowed | −0.0130 | −0.0010 | 0.0019 | 0.0078 | 0.0006 | −0.0056 | −0.0046 |
| MarSta4 | Living with parents | −0.0001 | 0.0089 | 0.0012 | 0.0007 | −0.0003 | −0.0034 | 0.0019 |
| MarSta5 | Domestic partner/living with other adults | −0.0035 | 0.0579. | 0.0084 | 0.0054 | −0.0015 | −0.0236. | 0.0113 |
| MarSta6 | NA | −0.0508 * | −0.0020 | 0.0082 | 0.0307 * | 0.0023 | −0.0244 | −0.0167 |
| Educ2 | 17–19 years | 0.0021 | −0.0953 * | −0.0118 * | −0.0088 | 0.0026. | 0.0373 * | −0.0192. |
| Edu3 | 20 years or older | 0.0081 | −0.1002 ** | −0.0141 * | −0.0116 | 0.0025. | 0.0418 * | −0.0186. |
| Edu4 | Still studying | −0.0029 | −0.0805. | −0.0090 | −0.0049 | 0.0025 | 0.0290 | −0.0176 |
| SClass2 | Skilled manual worker | −0.0188 | −0.0576 * | −0.0044 | 0.0073 | 0.0026 * | 0.0127 | −0.0183 ** |
| SClass3 | Supervisory or clerical/Junior managerial/Professional/administrator | −0.0137 | −0.1045 *** | −0.0106 ** | 0.0002 | 0.0037 *** | 0.0327 ** | −0.0261 *** |
| SClass4 | Intermediate managerial/Professional/Administrative | −0.0151 | −0.1177 *** | −0.0117 *** | −0.0002 | 0.0042 *** | 0.0366 ** | −0.0289 *** |
| SClass5 | Higher managerial/Professional/Administrative | −0.0080 | −0.0419 | −0.0040 | 0.0017 | 0.0016 | 0.0121 | −0.0114 |
| SClass6 | Student | 0.0001 | −0.0049 | −0.0006 | −0.0004 | 0.0001 | 0.0019 | −0.0010 |
| SClass7 | Retired and living on state pension only | −0.0590 ** | −0.1861 *** | −0.0126 ** | 0.0250 | 0.0093 *** | 0.0291 | −0.0507 *** |
| SClass8 | Unemployed (for over 6 months) or not working due to long term sickness | −0.0195 | −0.1116 ** | −0.0101 * | 0.0031 | 0.0044 * | 0.0310. | −0.0284 ** |
| Employ2 | Employed part time (less than 30 h per week) | −0.0059 | 0.0497 * | 0.0076. | 0.0064 | −0.0012 | −0.0215 * | 0.0087 |
| Employ3 | Self−employed | −0.0242 | 0.0669 * | 0.0135 ** | 0.0171 * | −0.0010 | −0.0357 ** | 0.0061 |
| Employ4 | Retired/Unable to work/Disabled | −0.0062 | 0.0388 | 0.0062 | 0.0059 | −0.0009 | −0.0175 | 0.0062 |
| Employ5 | Still at school | 0.0228 | 0.1223 ** | 0.0135. | −0.0059 | −0.0043 ** | −0.0392 * | 0.0359 ** |
| Employ6 | In full time higher education | 0.0087 | 0.0270 | 0.0022 | −0.0033 | −0.0012 | −0.0067 | 0.0089 |
| Employ7 | Unemployed and seeking work | −0.0120 | −0.0292 | −0.0019 | 0.0052 | 0.0014 | 0.0054 | −0.0101 |
| Employ8 | Not working and not seeking work | −0.0119 | 0.0742 * | 0.0124. | 0.0105 | −0.0017 | −0.0332 * | 0.0120 |
| Employ9 | Prefer not to say | −0.0135 | 0.0797 | 0.0136 | 0.0115 | −0.0018 | −0.0359. | 0.0126 |
| VoteEU2 | Did not vote | −0.0259 ** | 0.0262. | 0.0074 ** | 0.0171 *** | 0.0004 | −0.0217 ** | −0.0033 |
| VoteEU3 | Don’t know/Not applicable | −0.0200 | 0.0232 | 0.0063 | 0.0132. | 0.0002 | −0.0178 | −0.0019 |
| Gov_Sup2 | Tend to support | −0.6094 *** | −0.3391 *** | 0.0738 *** | 0.3639 *** | 0.0282 *** | −0.2265 *** | −0.2395 *** |
| Gov_Sup3 | Tend to oppose | −1.0407 *** | −0.2594 *** | 0.4469 *** | 0.3366 *** | −0.0096 *** | −0.5637 *** | −0.2102 *** |
| Gov_Sup4 | Totally oppose | −1.5004 *** | −0.0318 | 0.8510 *** | −0.0204. | −0.0277 *** | −0.6370 *** | −0.1660 *** |
| Gov_Sup5 | Don’t know/Not applicable | −0.8368 *** | −0.3363 *** | 0.3637 *** | 0.3403 *** | −0.0157 *** | −0.5609 *** | −0.1273 *** |
| HBvsED2 | 2 | 0.0028 | −0.0593 * | −0.0076 * | −0.0064 | 0.0016 | 0.0239 * | −0.0115 |
| HBvsED3 | 3 | −0.0398 ** | −0.1082 *** | −0.0073 * | 0.0171. | 0.0053 *** | 0.0194 | −0.0345 *** |
| HBvsED4 | 4 | −0.0591 *** | −0.0725 * | −0.0001 | 0.0323 ** | 0.0051 *** | −0.0038 | −0.0334 *** |
| HBvsED5 | 5 | −0.1369 *** | −0.0242 | 0.0213 *** | 0.0835 *** | 0.0064 *** | −0.0660 *** | −0.0451 *** |
| HBvsED6 | 6—The economic damage is greater than the health benefits | −0.3028 *** | 0.0864 * | 0.0962 *** | 0.1573 *** | 0.0034 * | −0.1978 *** | −0.0590 *** |
| HBvsED7 | Don’t know/Not applicable | −0.0523 ** | −0.1370 *** | −0.0086. | 0.0241. | 0.0071 *** | 0.0192 | −0.0418 *** |
| LimIndFree2 | 2 | −0.0635 *** | −0.1098 *** | −0.0041 | 0.0325 *** | 0.0065 *** | 0.0075 | −0.0423 *** |
| LimIndFree3 | 3 | −0.1324 *** | −0.1188 *** | 0.0062 | 0.0806 *** | 0.0100 *** | −0.0368 *** | −0.0600 *** |
| LimIndFree4 | 4 | −0.1793 *** | −0.0857 ** | 0.0210 *** | 0.1131 *** | 0.0101 *** | −0.0802 *** | −0.0640 *** |
| LimIndFree5 | 5 | −0.1911 *** | −0.0510. | 0.0306 *** | 0.1199 *** | 0.0087 *** | −0.0999 *** | −0.0593 *** |
| LimIndFree6 | 6—I am strongly opposed to any limitations of my individual freedoms, regardless of the coronavirus pandemic | −0.3821 *** | 0.0262 | 0.1192 *** | 0.2024 *** | 0.0044 * | −0.2508 *** | −0.0752 *** |
| LimIndFree7 | Don’t know/Not applicable | −0.1706 *** | −0.1135 ** | 0.0158 * | 0.1120 *** | 0.0109 *** | −0.0771 *** | −0.0617 *** |
| AppsUse2 | Somewhat in favour | −0.0630 *** | −0.0595 ** | 0.0021 | 0.0346 *** | 0.0048 *** | −0.0083 | −0.0331 *** |
| AppsUse3 | Somewhat opposed | −0.1223 *** | −0.0769 ** | 0.0101 * | 0.0736 *** | 0.0079 *** | −0.0402 *** | −0.0515 *** |
| AppsUse4 | Strongly opposed | −0.1914 *** | −0.0161 | 0.0335 *** | 0.1160 *** | 0.0079 *** | −0.0983 *** | −0.0592 *** |
| AppsUse5 | Don’t know/Not applicable | −0.1130 *** | −0.1307 *** | 0.0014 | 0.0684 *** | 0.0098 *** | −0.0241. | −0.0555 *** |
| Health2 | Fairly concerned | 0.0392 ** | −0.0687 ** | −0.0139 *** | −0.0292 *** | 0.0000 | 0.0441 *** | −0.0009 |
| Health3 | Not very concerned | 0.0723 *** | −0.0969 *** | −0.0214 *** | −0.0521 *** | −0.0011 | 0.0697 *** | 0.0049 |
| Health4 | Not at all concerned | 0.0619 *** | −0.0399 | −0.0128 *** | −0.0408 *** | −0.0022. | 0.0419 ** | 0.0139 |
| Health5 | Don’t know/Not applicable | 0.0384 | 0.0280 | −0.0021 | −0.0200 | −0.0026 | 0.0043 | 0.0203 |
| Health_Fam2 | Fairly concerned | 0.0076 | −0.0605 ** | −0.0087 ** | −0.0090 | 0.0014. | 0.0266 ** | −0.0102. |
| Health_Fam3 | Not very concerned | 0.0018 | −0.0550 * | −0.0070 * | −0.0054 | 0.0015 | 0.0218. | −0.0109 |
| Health_Fam4 | Not at all concerned | −0.0064 | 0.0345 | 0.0056 | 0.0059 | −0.0007 | −0.0159 | 0.0052 |
| Health_Fam5 | Don’t know/Not applicable | 0.0102 | −0.0942 | −0.0117. | −0.0154 | 0.0021 | 0.0410 | −0.0159 |
| Eco_loss | Loss of income, difficulties in paying bills/rents, partial unemployment or bankruptcy, difficulties in having decent meals | −0.0469 *** | 0.0478 ** | 0.0127 *** | 0.0318 *** | 0.0010 | −0.0393 *** | −0.0062 |
| Helped2 | Yes, somewhat | −0.0553 ** | −0.0650. | 0.0002 | 0.0301 ** | 0.0046 ** | −0.0039 | −0.0311 *** |
| Helped3 | No, not really | −0.0746 *** | −0.0781 * | 0.0015 | 0.0410 *** | 0.0059 *** | −0.0082 | −0.0402 *** |
| Helped4 | No, not at all | −0.0903 *** | −0.0743 * | 0.0044 | 0.0507 *** | 0.0065 *** | −0.0167 | −0.0448 *** |
| Helped5 | Don’t know/Not applicable | −0.0575 * | −0.1011 * | −0.0038 | 0.0304. | 0.0061 ** | 0.0044 | −0.0371 *** |
| Helping2 | Yes, somewhat | −0.0012 | −0.0537 * | −0.0065. | −0.0033 | 0.0016 | 0.0199. | −0.0117 |
| Helping3 | No, not really | −0.0084 | −0.0569 * | −0.0058. | 0.0009 | 0.0020 * | 0.0177 | −0.0148 * |
| Helping4 | No, not at all | 0.0029 | −0.0023 | −0.0007 | −0.0019 | −0.0001 | 0.0022 | 0.0005 |
| Helping5 | Don’t know/Not applicable | −0.0324 | −0.0489 | −0.0012 | 0.0169 | 0.0031. | 0.0017 | −0.0204. |
| Talk2 | Yes, somewhat | −0.0221 * | −0.0393 * | −0.0017 | 0.0105. | 0.0022 ** | 0.0048 | −0.0159 ** |
| Talk3 | No, not really | −0.0137 | −0.0185 | −0.0003 | 0.0070 | 0.0012 | 0.0006 | −0.0085 |
| Talk4 | No, not at all | −0.0108 | 0.0780 ** | 0.0126 * | 0.0103 | −0.0018. | −0.0342 ** | 0.0132 |
| Talk5 | Don’t know/Not applicable | −0.0283 | 0.0294 | 0.0087 | 0.0182 | 0.0003 | −0.0240 | −0.0033 |
| Debates2 | Yes, somewhat | −0.0342 | −0.1173 ** | −0.0090 | 0.0127 | 0.0053 * | 0.0252 | −0.0342 ** |
| Debates3 | No, not really | −0.0383 | −0.1494 *** | −0.0125 * | 0.0125 | 0.0064 ** | 0.0365. | −0.0429 *** |
| Debates4 | No, not at all | 0.0047 | −0.1347 ** | −0.0177 ** | −0.0125 | 0.0036 * | 0.0535 ** | −0.0269 * |
| Debates5 | Don’t know/Not applicable | −0.0208 | −0.1049 * | −0.0092 | 0.0046 | 0.0042. | 0.0279 | −0.0275 * |
| Threshold parameters | ||||||||
| −1.5923 *** | ||||||||
| −1.0112 *** | ||||||||
| −0.9594 *** | ||||||||
| −0.1308 ** | ||||||||
| Model Adjustment: Log-Likelihood: −20,866.18 No. Iterations: 26 McFadden’s R2: 0.2920604 AIC: 42,128.36 | ||||||||
References
- Acemoglu, Daron, and James A. Robinson. 2001. A theory of political transitions. American Economic Review 91: 938–63. [Google Scholar] [CrossRef]
- Achen, Christopher H., and Larry M. Bartels. 2017. Democracy for Realists: Why Elections Do Not Produce Responsive Government. Princeton: Princeton University Press, vol. 4. [Google Scholar]
- Amat, Francesc, Andreu Arenas, Albert Falcó-Gimeno, and Jordi Muñoz. 2020. Pandemics Meet Democracy: Experimental Evidence from the COVID-19 Crisis in Spain. Working Paper, Preprint. Available online: https://osf.io/preprints/socarxiv/dkusw/ (accessed on 1 July 2020).
- Andersen, Martin. 2020. Early Evidence on Social Distancing in Response to COVID-19 in the United States. SSRN 3569368. Available online: https://papers.ssrn.com/sol3/papers.cfm?abstract_id=3569368 (accessed on 1 July 2020).
- Andersson, Staffan, and Nicholas Aylott. 2020. Sweden and Coronavirus: Unexceptional Exceptionalism. Social Sciences 9: 232. [Google Scholar] [CrossRef]
- Argote, Linda. 2012. Organizational Learning: Creating, Retaining and Transferring Knowledge. Berlin: Springer Science and Business Media. [Google Scholar]
- Ashworth, Scott, Ethan Bueno de Mesquita, and Amanda Friedenberg. 2018. Learning about voter rationality. American Journal of Political Science 62: 37–54. [Google Scholar] [CrossRef]
- Besley, Timothy. 2007. Principled Agents?: The Political Economy of Good Government. Oxford: Oxford University Press. [Google Scholar]
- Bol, Damien, Marco Giani, André Blais, and Peter John Loewen. 2020. The effect of COVID-19 lockdowns on political support: Some good news for democracy? European Journal of Political Research. forthcoming. [Google Scholar] [CrossRef]
- Bull, Martin J. 2020. Italy’s ‘Darkest Hour’: How Coronavirus Became a Very Political Problem. Available online: https://theconversation.com/italys-darkest-hour-how-coronavirus-became-a-very-political-problem-133178 (accessed on 29 June 2020).
- Celi, Giuseppe, Dario Guarascio, and Annamaria Simonazzi. 2020. A fragile and divided European Union meets Covid-19: Further disintegration or ‘Hamiltonian moment’? Journal of Industrial and Business Economics 47: 411–24. [Google Scholar] [CrossRef]
- CGTN. 2020. COVID-19 Timeline Betrays European Countries’ Different Responses. Available online: https://newseu.cgtn.com/news/2020-03-24/COVID-19-timeline-betrays-European-countries-different-responses-P4x9fbgzYs/index.html (accessed on 29 June 2020).
- Cole, Shawn, Andrew Healy, and Eric Werker. 2012. Do voters demand responsive governments? Evidence from Indian disaster relief. Journal of Development Economics 97: 167–81. [Google Scholar] [CrossRef]
- Devine, Daniel, Jennifer Gaskell, Will Jennings, and Gerry Stoker. 2020. Trust and the Coronavirus Pandemic: What are the Consequences of and for Trust? An Early Review of the Literature. Political Studies Review. [Google Scholar] [CrossRef]
- European Commission. 2020. Questions and Answers on the Agreement on the €1.8 Trillion Package to Help Build Greener, More Digital and More Resilient Europe. Brussels: European Commission, November 11. [Google Scholar]
- Fetzer, Thiemo, Lukas Hensel, Johannes Hermle, and Christopher Roth. 2020. Coronavirus perceptions and economic anxiety. Review of Economics and Statistics, 1–36. [Google Scholar] [CrossRef]
- Flores, Alejandro Quiroz, and Alastair Smith. 2013. Leader survival and natural disasters. British Journal of Political Science 43: 821–43. [Google Scholar] [CrossRef]
- Gallego, Jorge. 2018. Natural disasters and clientelism: The case of floods and landslides in Colombia. Electoral Studies 55: 73–88. [Google Scholar] [CrossRef]
- Greene, William H., and David A. Hensher. 2010. Modeling Ordered Choices: A Primer. Cambridge: Cambridge University Press. [Google Scholar]
- Grossman, Guy, Soojong Kim, Jonah M. Rexer, and Harsha Thirumurthy. 2020. Political Partisanship Influences Behavioral Responses to Governors? Recommendations for COVID-19 Prevention in the United States. SSRN Working Paper. Available online: https://papers.ssrn.com/sol3/papers.cfm?abstract_d=3578695 (accessed on 1 July 2020).
- Harell, Allison. 2020. How Canada’s Pandemic Is Shifting Political Views. Report for the Institute for Research on Public Policy. Available online: https://policyoptions.irpp.org/fr/magazines/avril-2020/how-canadas-pandemic-response-is-shifting-political-views/ (accessed on 1 July 2020).
- Hetherington, Marc J., and Michael Nelson. 2003. Anatomy of a rally effect: George W. Bush and the war on terrorism. PS: Political Science and Politics 36: 37–42. [Google Scholar] [CrossRef]
- Jessop, Bob. 2019. The Capitalist State and State Power. In The Oxford Handbook of Karl Marx. Edited by Vidal Matt, Tony Smith, Tomás Rotta and Paul Prew. Oxford: Oxford University Press, pp. 299–320. [Google Scholar]
- Katz, Gabriel, and Ines Levin. 2016. The dynamics of political support in emerging democracies: Evidence from a natural disaster in Peru. International Journal of Public Opinion Research 28: 173–95. [Google Scholar] [CrossRef]
- Kushner Gadarian, Shana, Sara Wallace Goodman, and Thomas B. Pepinsky. 2020. Partisanship, Health Behavior, and Policy Attitudes in the Early Stages of the COVID-19 Pandemic. SSRN Working Paper. Available online: https://ssrn.com/abstract=3574605 (accessed on 1 July 2020).
- Legido-Quigley, Helena, José Tomás Mateos-García, Vanesa Regulez Campos, Montserrat Gea-Sánchez, Carles Muntaner, and Martin McKee. 2020. The resilience of the Spanish health system against the COVID-19 pandemic. The Lancet Public Health 5: 251–52. [Google Scholar] [CrossRef]
- Leininger, Arndt, and Max Schaub. 2020. Voting at the Dawn of a Global Pandemic. Working Paper, Preprint. Available online: https://osf.io/preprints/socarxiv/a32r7 (accessed on 1 July 2020).
- Margalit, Yotam. 2019. Political responses to economic shocks. Annual Review of Political Science 22: 277–95. [Google Scholar] [CrossRef]
- Mauk, Marlene. 2020. Citizen Support for Democratic and Autocratic Regimes. Oxford: Oxford University Press. [Google Scholar]
- Merkley, Eric, Aengus Bridgman, Peter John Loewen, Taylor Owen, Derek Ruths, and Oleg Zhilin. 2020. A rare moment of cross-partisan consensus: Elite and public response to the COVID-19 pandemic in Canada. Canadian Journal of Political Science/Revue canadienne de science politique 2: 311–18. [Google Scholar] [CrossRef]
- Reardon, Sean F., Benjamin R. Shear, Katherine E. Castellano, and Andrew D. Ho. 2017. Using heteroskedastic ordered probit models to recover moments of continuous test score distributions from coarsened data. Journal of Educational and Behavioral Statistics 42: 3–45. [Google Scholar] [CrossRef]
- Schraff, Dominik. 2020. Political Trust during the Covid-19 Pandemic: Rally around the Flag or Lockdown Effects? SocArXiv Papers. Available online: https://osf.io/preprints/socarxiv/pu47c/ (accessed on 2 July 2020).
- Sibley, Chris G., Lara M. Greaves, Nicole Satherley, Marc S. Wilson, Nickola C. Overall, Carol H. J. Lee, Petar Milojev, Taciano L. Milfont, Carla A. Houkamau, Isabelle M. Duck, and et al. 2020. Effects of the COVID-19 pandemic and nationwide lockdown on trust, attitudes toward government, and well-being. American Psychologist 75: 618–30. [Google Scholar] [CrossRef] [PubMed]
- Tepe, Markus, Pieter Vanhuysse, Michael Jankowski, Christina-Marie Juen, and Florian Erlbruch. 2020. Pandemic Balancing Acts: Early COVID-19 Lockdown Changes How Germans Trade Off Lives and Weigh Constitutional Powers. OSFPreprints. Available online: https://osf.io/geu52 (accessed on 7 July 2020).
- Theodoridis, Alexander G. 2017. Me, myself, and (I), (D), or (R)? Partisanship and political cognition through the lens of implicit identity. The Journal of Politics 79: 1253–67. [Google Scholar] [CrossRef]
- Van Bavel, Jay J., Katherine Baicker, Paulo S. Boggio, Valerio Capraro, Aleksandra Cichocka, Mina Cikara, Molly J. Crockett, Alia J. Crum, Karen M. Douglas, James N. Druckman, and et al. 2020. Using social and behavioural science to support COVID-19 pandemic response. Nature Human Behaviour 4: 460–71. [Google Scholar] [CrossRef] [PubMed]
- WHO (World Health Organization). 2020. Coronavirus Disease 2019 (COVID-19) Situation Report—51. Geneva: World Health Organization. [Google Scholar]
- WHO (World Health Organization). 2020. WHO Director-General’s Opening Remarks at the Media Briefing on COVID-19—11 March 2020. Geneva: World Health Organization. [Google Scholar]
- Williams, Richard. 2010. Fitting heterogeneous choice models with oglm. The Stata Journal 10: 540–67. [Google Scholar] [CrossRef]
- Winter, Taylor, Benjamin C. Riordan, Amir H. Pakpour, Mark D. Griffiths, Andre Mason, John W. Poulgrain, and Damian Scarf. 2020. Evaluation of the English version of the Fear of COVID-19 Scale and its relationship with behavior change and political beliefs. International Journal of Mental Health and Addiction, 1–11. [Google Scholar] [CrossRef]
- Zalc, Julien, and Robin Maillard. 2020. Uncertainty/EU/Hope. Public opinion in times of COVID-19. Brussels: Public Opinion Monitoring Unit. [Google Scholar]

Publisher’s Note: MDPI stays neutral with regard to jurisdictional claims in published maps and institutional affiliations. |
© 2021 by the authors. Licensee MDPI, Basel, Switzerland. This article is an open access article distributed under the terms and conditions of the Creative Commons Attribution (CC BY) license (http://creativecommons.org/licenses/by/4.0/).
Share and Cite
Martín, J.C.; Román, C. COVID-19 Is Examining the EU and the Member States: The Role of Attitudes and Sociodemographic Factors on Citizens’ Support towards National Policies. Soc. Sci. 2021, 10, 46. https://doi.org/10.3390/socsci10020046
Martín JC, Román C. COVID-19 Is Examining the EU and the Member States: The Role of Attitudes and Sociodemographic Factors on Citizens’ Support towards National Policies. Social Sciences. 2021; 10(2):46. https://doi.org/10.3390/socsci10020046
Chicago/Turabian StyleMartín, Juan Carlos, and Concepción Román. 2021. "COVID-19 Is Examining the EU and the Member States: The Role of Attitudes and Sociodemographic Factors on Citizens’ Support towards National Policies" Social Sciences 10, no. 2: 46. https://doi.org/10.3390/socsci10020046
APA StyleMartín, J. C., & Román, C. (2021). COVID-19 Is Examining the EU and the Member States: The Role of Attitudes and Sociodemographic Factors on Citizens’ Support towards National Policies. Social Sciences, 10(2), 46. https://doi.org/10.3390/socsci10020046