
The Reinstatement of Returnees in District Swat, Pakistan: An Evaluative Study of the Rehabilitation Initiatives


Abstract
:1. Introduction
2. Literature Review
- (1)
- GDP Per Capita: The GDP is the country’s total production divided by its whole population, whereas GDP per capita measures its wealth. The wealth of a country is arguably highly related to its happiness (Goyal 2018).
- (2)
- Social Support: Social support is the help a citizen can avail if in trouble from his fellow citizens such as family members or friends. Countries that rank high in social support tend to have a higher happiness rating. Nevertheless, to some extent, this relation is linear, as some countries have low social support and are not very happy (Kim et al. 2008).
- (3)
- Healthy Life Expectancy: A healthy life expectancy reflects how many years a person can happily live his life. The average life expectancy of citizens is usually considered to measure happiness. A healthy life expectancy and happiness index are highly related to each other. Countries that have a high life expectancy rate tend to be happier. Similarly, the perception of corruption, freedom to make life choices, and generosity are also determinants of the happiness index (Goyal 2018).
- (4)
- Unexplained Happiness: The WHR (World Happiness Report) explains the key factors essential in determining a country’s happiness. The happiness index rating can be calculated by adding all the elements, but there is some unexplained happiness besides these factors. Unexplained happiness is also known as residual happiness and includes stable factors that affect happiness and might include cognitive bias. It is seen that many countries in the world are happy without any reason (Graham et al. 2004). Unexplained happiness is also a part of the factors determining the world happiness index by WHR.
3. Methodology of the Study
4. Data Collection
5. Construction of Returnees Happiness Index (RHI)
- The COUNTIF () function was used to count the number of indicators where a respondent achieved the happiness sufficiency threshold.
- The COUNTIF () function was used to count the number of happy people who achieved sufficiency in 25 or more indicators.
- The COUNTIF () function was used to count the number of unhappy people who have not achieved sufficiency in 25 or more indicators.
6. Conclusions and Discussion
Author Contributions
Funding
Institutional Review Board Statement
Informed Consent Statement
Acknowledgments
Conflicts of Interest
References
- Al-Qawasmi, Jamal, Muhammad Saeed, Omar S. Asfour, and Adel S. Aldosary. 2021. Assessing Urban Quality of Life: Developing the Criteria for Saudi Cities. Frontiers in Built Environment 7: 70. [Google Scholar] [CrossRef]
- Alzyadat, Jumah A., and Iyad A. Al-Nsour. 2021. The Fiscal Policy Instruments and the Economic Prosperity in Jordan. Journal of Asian Finance, Economics and Business 8: 113–22. [Google Scholar] [CrossRef]
- Andrews, Frank M., and Stephen B. Withey. 1976. Social Indicators of Well-Being. New York and London: Plenum, vol. 201, pp. 696–717. [Google Scholar]
- Bangash, Salman. 2012. Socio-Economic Conditions of Post-Conflict Swat: A Critical Appraisal. A Journal of Peace and Development 2: 66–79. [Google Scholar]
- Bates, Winton. 2009. Gross national happiness. Asian-Pacific Economic Literature 23: 1–16. [Google Scholar] [CrossRef]
- Clark, Andrew E., Paul Frijters, and Michael A. Shields. 2008. Relative income, happiness, and utility: An explanation for the Easterlin paradox and other puzzles. Journal of Economic Literature 46: 95–144. [Google Scholar] [CrossRef] [Green Version]
- Clark, Vicki L. Plano, and John W. Creswell. 2014. Understanding Research: A Consumer’s Guide. UK: Pearson Higher Ed. [Google Scholar]
- Diener, Ed, and Robert A. Emmons. 1984. The independence of positive and negative affect. Journal of Personality and Social Psychology 47: 1105–17. [Google Scholar] [CrossRef]
- Diener, Edward. 2009. Assessing Well-Being: The Collected Works of Ed Diener. New York: Springer, vol. 331. [Google Scholar] [CrossRef]
- Din, Najam U. 2010. Internal Displacement in Pakistan: Contemporary Challenges. Islamabad: Human Rights Commission of Pakistan, pp. 1–57. Available online: http://hrcp-web.org/hrcpweb/wp-content/pdf/ff/22.pdf (accessed on 15 March 2020).
- Elahi, Noor. 2015. Militancy conflicts and displacement in Swat Valley of Pakistan: Analysis of transformation of social and cultural network. International Journal of Humanities and Social Science 5: 226–36. [Google Scholar]
- Frey, Bruno S., and Alois Stutzer. 2009. Should national happiness be maximized? In Happiness, Economics and Politics. Cheltenham: Edward Elgar Publishing. [Google Scholar]
- Gallup Pakistan. 2019. Happiness in Pakistan. Available online: http://gallup.com.pk/wp-content/uploads/2020/01/Happiness-in-Pakistan.pdf (accessed on 18 March 2020).
- Goyal, Malini. 2018. World Happiness Report: A look at the ingredients of Happiness. The Economic Times. Available online: https://economictimes.indiatimes.com/magazines/panache/World-happiness-report-a-look-at-the-ingredients-of-happiness/articleshow/63445210.cms (accessed on 3 May 2020).
- Graham, Carol, Andrew Eggers, and Sandip Sukhtankar. 2004. Does happiness pay? An exploration based on panel data from Russia. Journal of Economic Behavior and Organization 55: 319–42. [Google Scholar] [CrossRef]
- Haider, Zeeshan. 2009. How Did Islamist Militancy Emerge in Pakistani Paradise? Available online: https://www.reuters.com/article/us-pakistan-swat/qa-how-did-islamist-militancy-emerge-in-pakistani-paradise-idUSTRE51F21620090216 (accessed on 3 May 2020).
- Helliwell, John F., Haifang Huang, and Shun Wang. 2015. The Geography of World Happiness. Available online: https://www.researchgate.net/publication/277876478_The_Geography_of_World_Happiness (accessed on 15 August 2020).
- Helliwell, John F., Haifang Huang, and Shun Wang. 2019. Changing World Happiness. Available online: https://worldhappiness.report/ed/2019/changing-world-happiness/ (accessed on 12 September 2020).
- Helliwell, John F., Haifang Huang, Shun Wang, and Hugh Shiplett. 2018. International Migration and World Happiness. Available online: https://www.researchgate.net/publication/323775616_International_Migration_and_World_Happiness (accessed on 10 September 2020).
- IDMC. 2018. Pakistan—Internally Displaced Persons—IDPs. Available online: https://data.humdata.org/dataset/idmc-idp-data-for-pakistan (accessed on 13 March 2019).
- Kahneman, Daniel, and Alan B. Krueger. 2006. Developments in the measurement of subjective well-being. Journal of Economic Perspectives 20: 3–24. [Google Scholar] [CrossRef] [Green Version]
- Kim, Heejung S., David K. Sherman, and Shelley E. Taylor. 2008. Culture and social support. American Psychologist 63: 518–26. [Google Scholar] [CrossRef] [Green Version]
- Krejcie, Robert V, and Daryle W. Morgan. 1970. Determining sample size for research activities. Educational and Psychological Measurement 30: 607–10. [Google Scholar] [CrossRef]
- Land, Kenneth C., Alex C. Michalos, and M. Joseph Sirgy, eds. 2011. Handbook of Social Indicators and Quality of Life Research. Berlin and Heidelberg: Springer Science & Business Media. [Google Scholar]
- Lepeley, Maria-Teresa. 2017. Bhutan’s gross national happiness: An approach to human centred sustainable development. South Asian Journal of Human Resources Management 4: 174–84. [Google Scholar] [CrossRef]
- Mackey, Alison, and Susan M. Gass. 2015. Second Language Research: Methodology and Design. New York: Routledge. [Google Scholar]
- Mercer, Andrew, Arnold Lau, and Courtney Kennedy. 2018. How Different Weighting Methods Work. Available online: https://www.pewresearch.org/methods/2018/01/26/how-different-weighting-methods-work/ (accessed on 30 December 2019).
- Munro, Lauchlan T. 2016. Where did Bhutan’s Gross National Happiness come from? The Origins of an Invented Tradition. Asian Affairs 47: 71–92. [Google Scholar] [CrossRef]
- Musikanski, Laura, Scott Cloutier, Erica Bejarano, Davi Briggs, Julia Colbert, Gracie Strasser, and Steven Russell. 2017. Happiness index methodology. Journal of Social Change 9: 14–31. [Google Scholar] [CrossRef]
- Nanyang, Yew-Kwang. 2015. Happiness, life satisfaction, or subjective well-being? A measurement and moral philosophical perspective. Nanyang Technological University. pp. 1–27. Available online: https://scholar.googleusercontent.com/scholar?q=cache:kS2-dRuQ5l4J:scholar.google.com/+Happiness,+life+satisfaction,+or+subjective+well-being%3F+A+measurement+and+moral+philosophical+perspective.+Nanyang+Tech-nological+University&hl=en&as_sdt=0,5 (accessed on 18 March 2020).
- OPHI. 2018. Bhutan’s Gross National Happiness Index. Available online: https://ophi.org.uk/policy/gross-national-happiness-index/ (accessed on 18 June 2019).
- Provincial Disaster Management Authority (PDMA). 2019. Available online: https://www.pdma.gov.pk/ (accessed on 13 March 2019).
- Ramesh, Randeep. 2011. Happiness index planned to influence government policy. The Guardian. 25. Available online: https://www.theguardian.com/society/2011/jul/25/happiness-index-government-policy (accessed on 3 May 2019).
- Sanaullah. 2020. Effectiveness of civilians’ survival strategies: Insights from the Taliban’s insurgency (2007–2009) in Swat Valley, Pakistan. Global Change, Peace and Security 32: 275–96. [Google Scholar] [CrossRef]
- Sayeed, Saad, and Radha Shah. 2017. Displacement, Repatriation and Rehabilitation: Stories of Dispossession from Pakistan’s Frontier’. Stiftung Wissenschaft und Politik. Available online: https://www.swp-berlin.org/publications/products/arbeitspapiere/Sayeed_and_Shah_2017_Internal_Displacement_Pakistan.pdf (accessed on 18 March 2020).
- Schubert, Christian. 2012. Pursuing happiness. Kyklos 65: 245–61. [Google Scholar] [CrossRef]
- Serghiou, Michael.A., Jon Niszczak, Ingrid Parry, C. W. P. Li-Tsang, Eric Van den Kerckhove, Sarah Smailes, and Dale Edgar. 2016. One world one burn rehabilitation standard. Burns 42: 1047–58. [Google Scholar] [CrossRef] [PubMed]
- Suwanda, Dadang, and Dodi Suryana. 2021. Human resource development in local governments: Increased transparency and public accountability. Journal of Asian Finance, Economics and Business 8: 1063–69. [Google Scholar] [CrossRef]
- Udjianto, Djoko, Abdul Hakim, Tjahjanulin Domai, Suryadi Suryadi, and Hayat Hayat. 2021. Community Development and Economic Welfare through the Village Fund Policy. The Journal of Asian Finance, Economics, and Business 8: 563–72. [Google Scholar] [CrossRef]
- Ura, Karma, Sabina Alkire, and Tshoki Zangmo. 2012. Bhutan: Gross National Happiness and the GNH Index. Available online: https://opendocs.ids.ac.uk/opendocs/bitstream/handle/20.500.12413/11798/Bhutan-Happiness.pdf?sequence=1 (accessed on 5 August 2021).


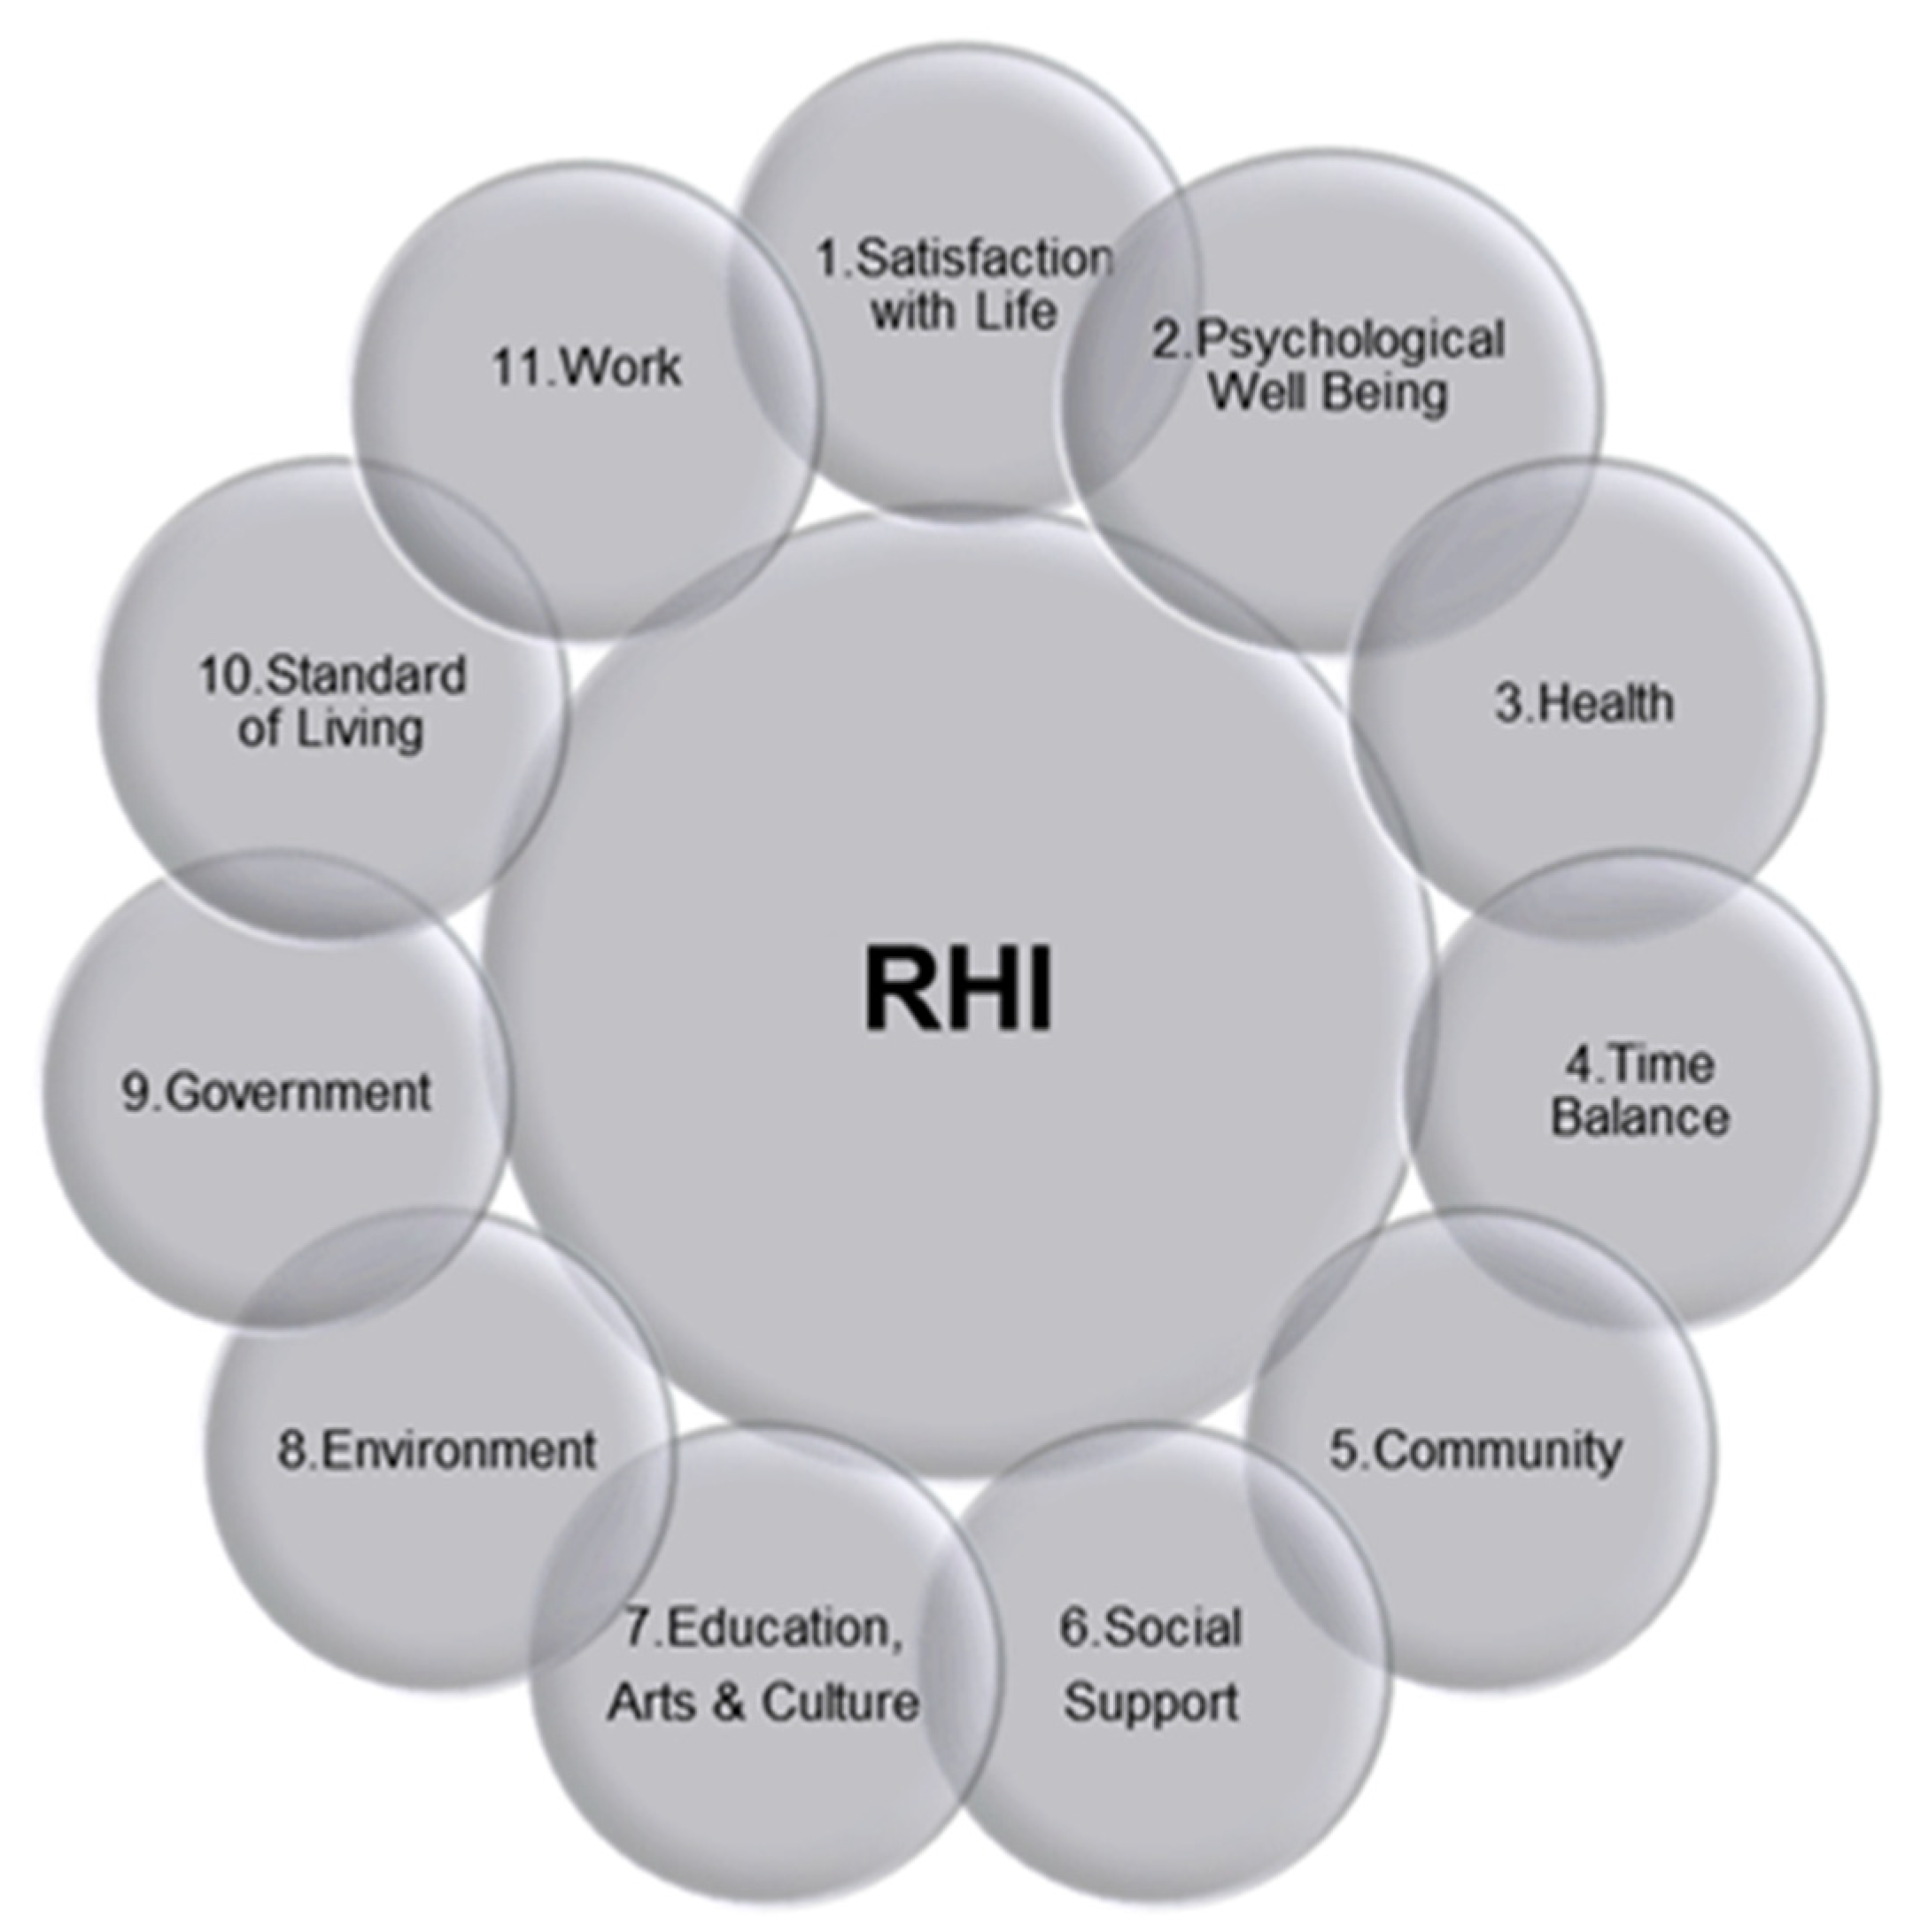
| Domain | Indicator | |||
|---|---|---|---|---|
| No | Code | Name | Threshold | |
| 1. Satisfaction with Life (SWL) | 01 | SWL1 | Worthwhile life | 80% |
| 02 | SWL2 | Happy life | 80% | |
| 03 | SWL3 | Worried life | 80% | |
| 2. Psychological Well Being (PSWB) | 04 | PSWB1 | Meaningful life | 80% |
| 05 | PSWB2 | Interest in daily activities | 80% | |
| 06 | PSWB3 | Future Optimism | 80% | |
| 3. Health (H) | 07 | H1 | Health condition | 60% |
| 08 | H2 | Work accomplishment | 80% | |
| 4. Time Balance (TB) | 09 | TB1 | Time balance | 80% |
| 10 | TB2 | Feeling rushed | 80% | |
| 5. Community (COM) | 11 | COM1 | Feelings for community | 80% |
| 12 | COM2 | Relationship with community | 80% | |
| 13 | COM3 | Fairness of people | 80% | |
| 14 | COM4 | Personal Safety | 80% | |
| 15 | COM5 | Volunteerism | 80% | |
| 16 | COM6 | Donation | 80% | |
| 6. Social Support (SS) | 17 | SS1 | Satisfaction with friends and family | 80% |
| 18 | SS2 | Feeling loved | 80% | |
| 19 | SS3 | Feeling lonely | 60% | |
| 7. Education, Art and Culture (EDAC) | 20 | EDAC1 | Access to sports and recreation | 80% |
| 21 | EDAC2 | Access to artistic and cultural activities | 80% | |
| 22 | EDAC3 | Skills through informal education | 80% | |
| 23 | EDAC4 | Discrimination | 60% | |
| 8. Environment (ENV) | 24 | ENV1 | Access to nature | 80% |
| 25 | ENV2 | Natural environment | 80% | |
| 26 | ENV3 | Nature enjoyment | 80% | |
| 27 | ENV4 | Pollution | 80% | |
| 9. Government (GOV) | 28 | GOV1 | Government corruption level | 80% |
| 29 | GOV2 | Government competency | 80% | |
| 30 | GOV3 | Trust in national government | 80% | |
| 31 | GOV4 | Trust in local government | 80% | |
| 10. Standard of Living (SOL) | 32 | SOL1 | Personal finances | 80% |
| 33 | SOL2 | Eating Mutton | 80% | |
| 11. Work (WO) | 34 | WO1 | Work satisfaction | 80% |
| 35 | WO2 | Work compensation | 80% | |
| 36 | WO3 | Work productivity | 80% | |
| 37 | WO4 | Work autonomy | 80% | |
| Domain | Indicators | |||||||||||
|---|---|---|---|---|---|---|---|---|---|---|---|---|
| BR(before Rehabilitation) | AR(after Rehabilitation) | |||||||||||
| 1 | 2 | 3 | 4 | 5 | 6 | 1 | 2 | 3 | 4 | 5 | 6 | |
| 1. SWL | 34 | 55 | 54 | - | - | - | 269 | 248 | 255 | - | - | - |
| % | 9.0 | 14.40 | 14.13 | - | - | - | 70.42 | 64.92 | 66.75 | - | - | - |
| 2. PSWB | 103 | 127 | 102 | - | - | - | 185 | 189 | 176 | |||
| % | 26.96 | 33.24 | 26.70 | - | - | - | 48.43 | 49.48 | 46.07 | - | - | - |
| 3. H | 76 | 223 | - | - | - | - | 284 | 98 | - | - | - | - |
| % | 19.89 | 58.37 | - | - | - | - | 74.35 | 25.65 | - | - | - | - |
| 4. TB | 151 | 141 | - | - | - | - | 175 | 116 | - | - | - | - |
| % | 39.52 | 36.91 | - | - | - | - | 45.81 | 30.37 | - | - | - | - |
| 5. COM | 138 | 126 | 127 | 113 | 133 | 133 | 160 | 169 | 161 | 181 | 159 | 142 |
| % | 36.12 | 32.98 | 33.24 | 29.58 | 34.81 | 34.81 | 41.88 | 44.24 | 42.15 | 47.38 | 41.62 | 37.17 |
| 6.SS | 109 | 115 | 218 | - | - | - | 175 | 155 | 291 | - | - | - |
| % | 28.53 | 30.10 | 57.06 | - | - | - | 45.81 | 40.58 | 76.18 | - | - | - |
| 7. EDAC | 103 | 109 | 127 | 172 | - | - | 192 | 190 | 176 | 230 | - | - |
| % | 26.96 | 28.53 | 33.24 | 65.96 | - | - | 50.26 | 49.74 | 46.07 | 60.21 | - | - |
| 8. ENV | 93 | 113 | 132 | 152 | - | - | 170 | 176 | 173 | 177 | - | - |
| % | 24.34 | 29.58 | 34.55 | 39.79 | - | - | 44.5 | 46.07 | 45.29 | 46.34 | - | - |
| 9. GOV | 148 | 135 | 111 | 114 | - | - | 111 | 119 | 126 | 114 | - | - |
| % | 38.74 | 35.24 | 29.05 | 29.84 | - | - | 29.06 | 31.15 | 32.98 | 29.84 | - | - |
| 10. SOL | 106 | 135 | - | - | - | - | 166 | 157 | - | -- | - | - |
| % | 27.74 | 35.34 | - | - | - | - | 43.46 | 41.1 | - | - | - | - |
| 11. WO | 124 | 131 | 145 | 127 | - | - | 172 | 186 | 171 | 171 | - | - |
| % | 32.46 | 34.29 | 37.95 | 33.24 | - | - | 45.03 | 48.69 | 44.76 | 44.76 | - | - |
| No | 1 | 2 | 3 | 4 | 5 | 6 | 7 | 8 | 9 | 10 | 11 | 12 | 13 | 14 | 15 | 16 | 17 | 18 | 19 | 20 | 21 | 22 | 23 | 24 | 25… 37 | Status | |
|---|---|---|---|---|---|---|---|---|---|---|---|---|---|---|---|---|---|---|---|---|---|---|---|---|---|---|---|
| BR | 0 | NH | |||||||||||||||||||||||||
| AR | 0 | NH | |||||||||||||||||||||||||
| BR | 13 | NH | |||||||||||||||||||||||||
| AR | 0 | NH | |||||||||||||||||||||||||
| BR | 77 | NH | |||||||||||||||||||||||||
| AR | 0 | NH | |||||||||||||||||||||||||
| BR | 6 | NH | |||||||||||||||||||||||||
| AR | 0 | NH | |||||||||||||||||||||||||
| BR | 87 | NH | |||||||||||||||||||||||||
| AR | 86 | NH | |||||||||||||||||||||||||
| BR | 61 | NH | |||||||||||||||||||||||||
| AR | 78 | NH | |||||||||||||||||||||||||
| BR | 3 | NH | |||||||||||||||||||||||||
| AR | 28 | NH | |||||||||||||||||||||||||
| BR | 2 | NH | |||||||||||||||||||||||||
| AR | 4 | NH | |||||||||||||||||||||||||
| BR | 0 | NH | |||||||||||||||||||||||||
| AR | 1 | NH | |||||||||||||||||||||||||
| BR | 1 | NH | |||||||||||||||||||||||||
| AR | 4 | NH | |||||||||||||||||||||||||
| BR | 4 | NH | |||||||||||||||||||||||||
| AR | 4 | NH | |||||||||||||||||||||||||
| BR | 1 | NH | |||||||||||||||||||||||||
| AR | 1 | NH | |||||||||||||||||||||||||
| BR | 0 | NH | |||||||||||||||||||||||||
| AR | 0 | NH | |||||||||||||||||||||||||
| BR | 0 | NH | |||||||||||||||||||||||||
| AR | 0 | NH | |||||||||||||||||||||||||
| BR | 1 | NH | |||||||||||||||||||||||||
| AR | 1 | NH | |||||||||||||||||||||||||
| BR | 2 | NH | |||||||||||||||||||||||||
| AR | 0 | NH | |||||||||||||||||||||||||
| BR | 9 | NH | |||||||||||||||||||||||||
| AR | 0 | NH | |||||||||||||||||||||||||
| BR | 1 | NH | |||||||||||||||||||||||||
| AR | 2 | NH | |||||||||||||||||||||||||
| BR | 1 | NH | |||||||||||||||||||||||||
| AR | 1 | NH | |||||||||||||||||||||||||
| BR | 0 | NH | |||||||||||||||||||||||||
| AR | 1 | NH | |||||||||||||||||||||||||
| BR | 2 | NH | |||||||||||||||||||||||||
| AR | 0 | NH | |||||||||||||||||||||||||
| BR | 2 | NH | |||||||||||||||||||||||||
| AR | 1 | NH | |||||||||||||||||||||||||
| BR | 0 | NH | |||||||||||||||||||||||||
| AR | 1 | NH | |||||||||||||||||||||||||
| BR | 3 | NH | |||||||||||||||||||||||||
| AR | 3 | NH | |||||||||||||||||||||||||
| BR | 106 | Happy | |||||||||||||||||||||||||
| AR | 166 | Happy | |||||||||||||||||||||||||
| BR (Before rehabilitation) AR (After Rehabilitation) | NH (Not Happy): Achieved Sufficiency in less than 25 indicators | ||||||||||||||||||||||||||
| Happy: Achieved Sufficiency in 25 or more indicators | |||||||||||||||||||||||||||
 The number of NH, achieved sufficnecy in less than 25 indicators.i.e. out of total 37 indicators, how many people achieved sufficiency in how many indicators.
  The number of happy people, achieved sufficinecy in 25 or more indicators.
| BR (Before Rehabilitation) | AR (After Rehabilitation) | ||||
|---|---|---|---|---|---|
| A. Hn | B. Indicator’s Sufficiency | A × B | C. Hn | D. Indicator’s Sufficiency | C × D |
| 0 | 0/37 | 0 | 0 | 0/37 | 0 |
| 0 | 1/37 | 0 | 0 | 1/37 | 0 |
| 13 | 2/37 | 0.702702703 | 0 | 2/37 | 0 |
| 77 | 3/37 | 6.243243243 | 0 | 3/37 | 0 |
| 6 | 4/37 | 0.648648649 | 0 | 4/37 | 0 |
| 87 | 5/37 | 11.75675676 | 86 | 5/37 | 11.62162162 |
| 61 | 6/37 | 9.891891892 | 78 | 6/37 | 12.64864865 |
| 3 | 7/37 | 0.567567568 | 28 | 7/37 | 5.297297297 |
| 2 | 8/37 | 0.432432432 | 4 | 8/37 | 0.864864865 |
| 0 | 9/37 | 0 | 1 | 9/37 | 0.243243243 |
| 1 | 10/37 | 0.27027027 | 4 | 10/37 | 1.081081081 |
| 4 | 11/37 | 1.189189189 | 4 | 11/37 | 1.189189189 |
| 1 | 12/37 | 0.324324324 | 1 | 12/37 | 0.324324324 |
| 0 | 13/37 | 0 | 0 | 13/37 | 0 |
| 0 | 14/37 | 0 | 0 | 14/37 | 0 |
| 1 | 15/37 | 0.405405405 | 1 | 15/37 | 0.405405405 |
| 2 | 16/37 | 0.864864865 | 0 | 16/37 | 0 |
| 9 | 17/37 | 4.135135135 | 0 | 17/37 | 0 |
| 1 | 18/37 | 0.486486486 | 2 | 18/37 | 0.972972973 |
| 1 | 19/37 | 0.513513514 | 1 | 19/37 | 0.513513514 |
| 0 | 20/37 | 0 | 1 | 20/37 | 0.540540541 |
| 2 | 21/37 | 1.135135135 | 0 | 21/37 | 0 |
| 2 | 22/37 | 1.189189189 | 1 | 22/37 | 0.594594595 |
| 0 | 23/37 | 0 | 1 | 23/37 | 0.621621622 |
| 3 | 24/37 | 1.945945946 | 3 | 24/37 | 1.945945946 |
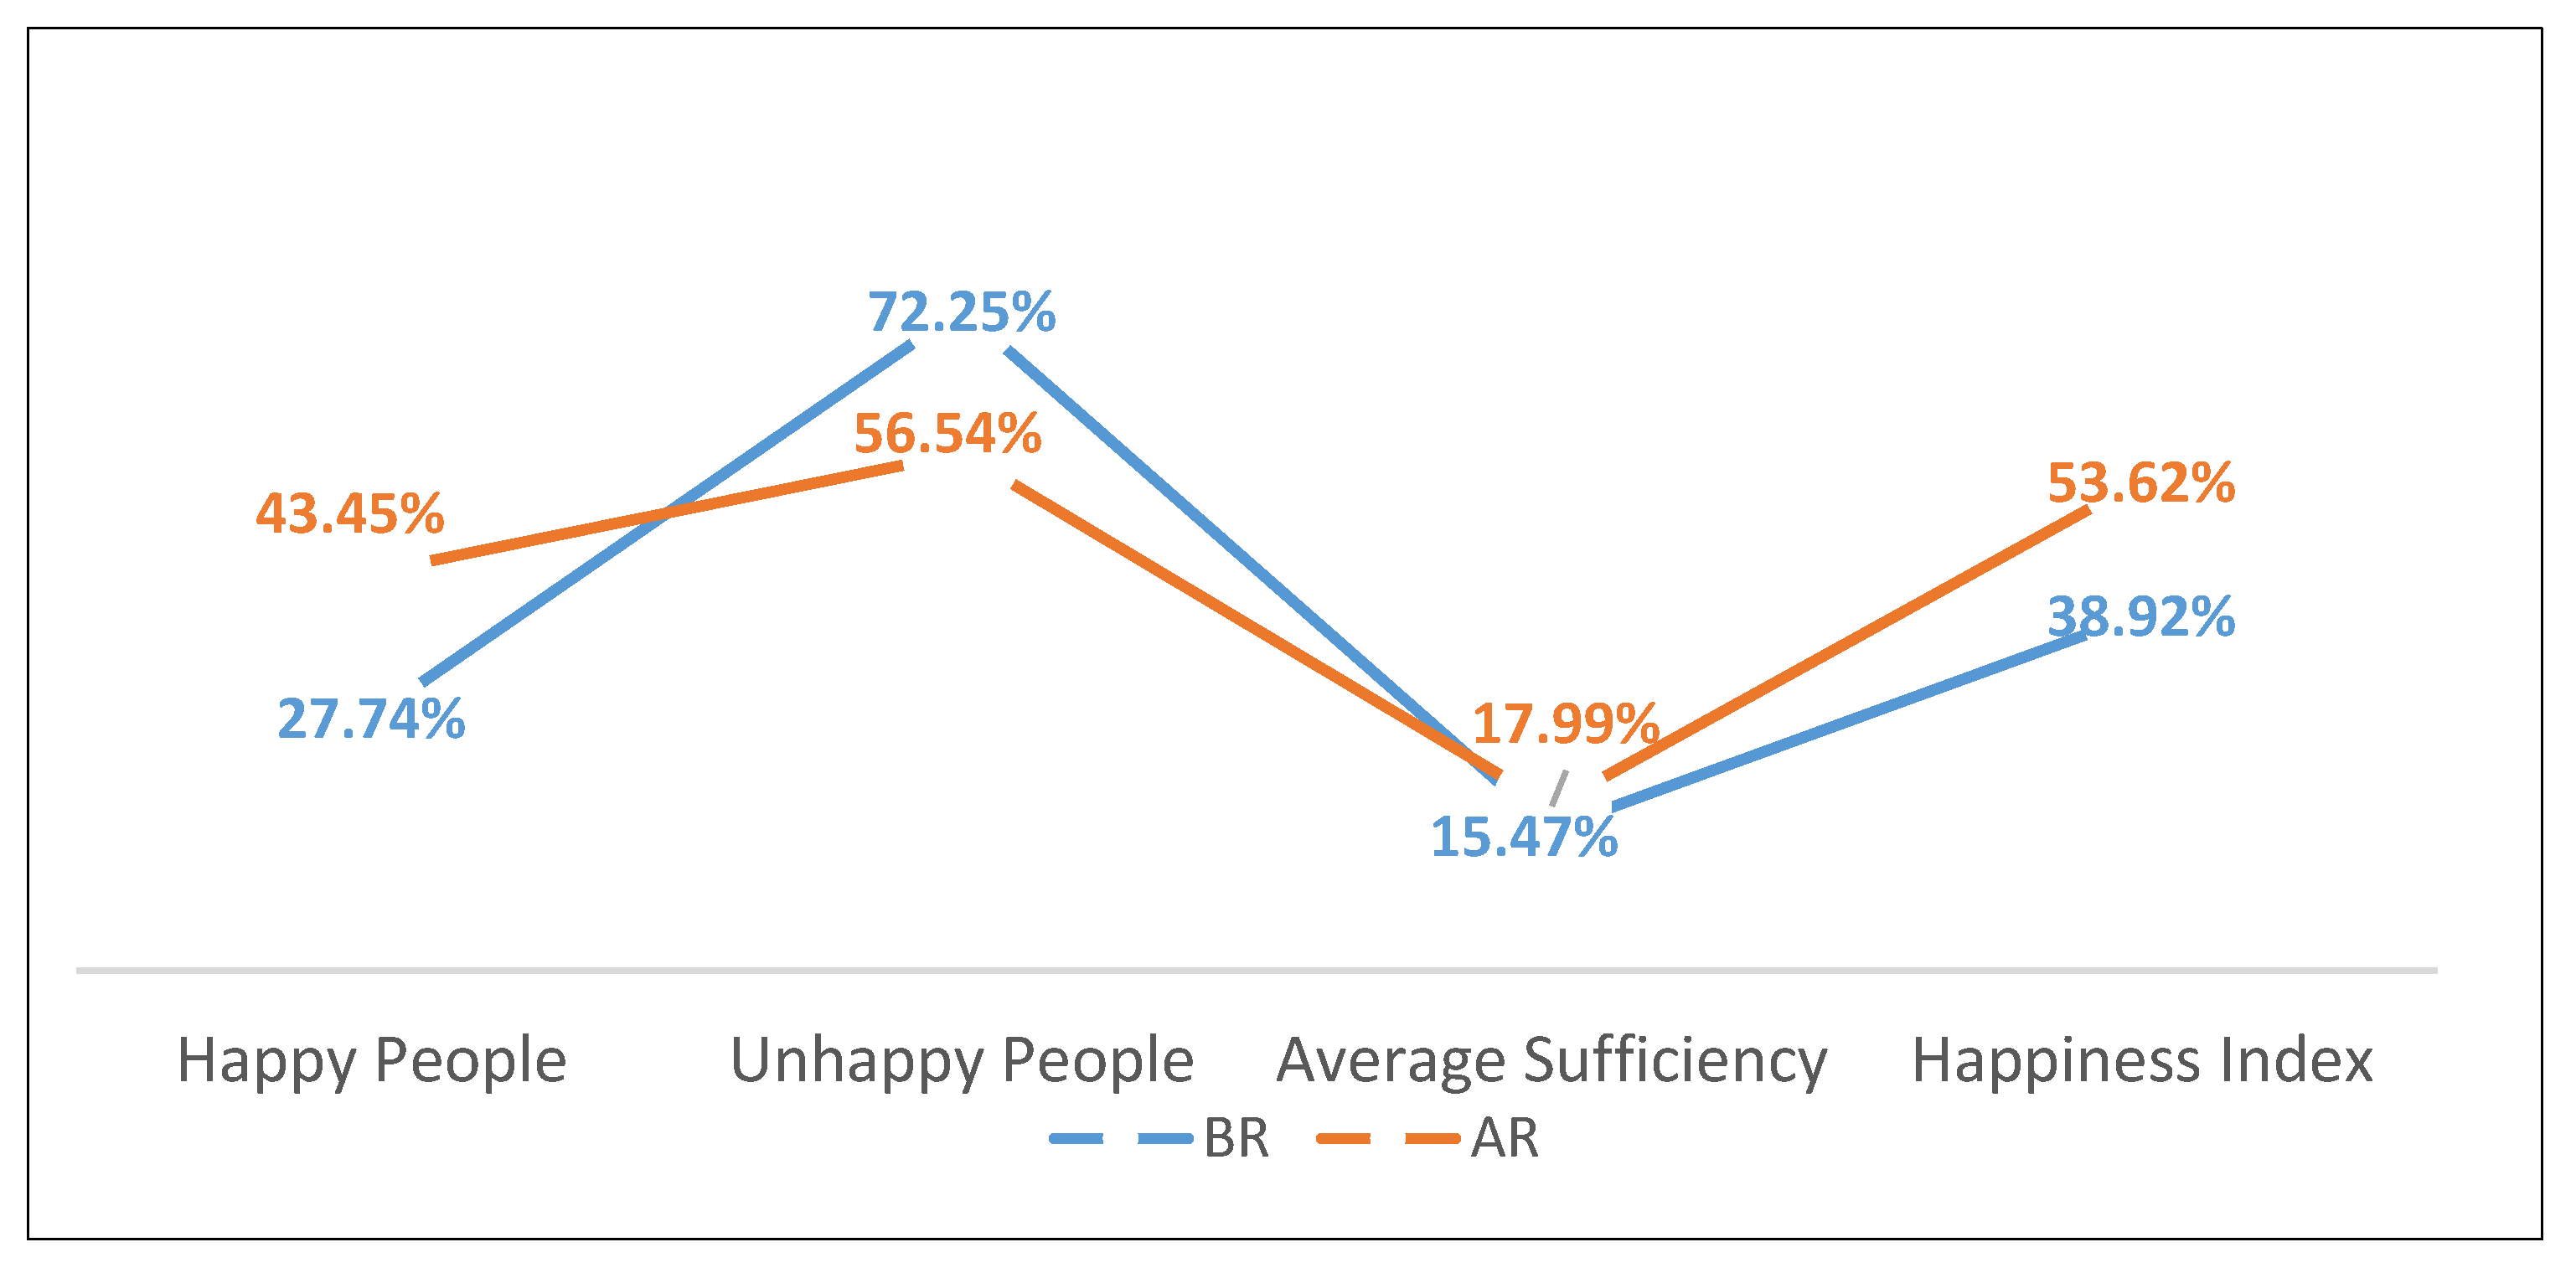
| BR, total Hn = 276 or Hn = 72.25% | BR, total S = 42.7027027 | AR, total Hn = 216 or Hn = 56.54% | AR, total S = 38.86486486 | ||
| As % = (42.7027027/276) × 100 As = 15.47199373% | As % = (38.86486486/216) × 100 As = 17.99299299% | ||||
| Total Hh = 382 − 276 = 106 Or Hh = 27.74% | Total Hh = 382 − 216 = 166 Or Hh = 43.45% | ||||
Publisher’s Note: MDPI stays neutral with regard to jurisdictional claims in published maps and institutional affiliations. |
© 2021 by the authors. Licensee MDPI, Basel, Switzerland. This article is an open access article distributed under the terms and conditions of the Creative Commons Attribution (CC BY) license (https://creativecommons.org/licenses/by/4.0/).
Share and Cite
Rafiq, M.; Hassan, A.A.G.; Saeed, M. The Reinstatement of Returnees in District Swat, Pakistan: An Evaluative Study of the Rehabilitation Initiatives. Soc. Sci. 2021, 10, 476. https://doi.org/10.3390/socsci10120476
Rafiq M, Hassan AAG, Saeed M. The Reinstatement of Returnees in District Swat, Pakistan: An Evaluative Study of the Rehabilitation Initiatives. Social Sciences. 2021; 10(12):476. https://doi.org/10.3390/socsci10120476
Chicago/Turabian StyleRafiq, Muhammad, Asan Ali Golam Hassan, and Muhammad Saeed. 2021. "The Reinstatement of Returnees in District Swat, Pakistan: An Evaluative Study of the Rehabilitation Initiatives" Social Sciences 10, no. 12: 476. https://doi.org/10.3390/socsci10120476
APA StyleRafiq, M., Hassan, A. A. G., & Saeed, M. (2021). The Reinstatement of Returnees in District Swat, Pakistan: An Evaluative Study of the Rehabilitation Initiatives. Social Sciences, 10(12), 476. https://doi.org/10.3390/socsci10120476