Article

Lacquerware Pigment Identification with Fixed and Mobile Raman Microspectrometers: A Potential Technique to Differentiate Original/Fake Artworks

Laboratoire de Dynamique, Interaction et Réactivité – UMR7075, CNRS, Université Pierre-et- Marie-Curie (UPMC) C49, 4 Place Jussieu, 75252 Paris Cedex 05, France
*
Author to whom correspondence should be addressed.
Arts 2013, 2(3), 111-123; https://doi.org/10.3390/arts2030111
Submission received: 3 June 2013 / Revised: 6 July 2013 / Accepted: 9 July 2013 / Published: 15 July 2013
(This article belongs to the Section Visual Arts)

Abstract

:
(FT) Raman spectroscopy is used for the first time to identify pigments used in 19th & 20th century Japanese and Vietnamese Lacquerwares. IR spectroscopy is used to assess the Lacquer matrix. Different operative conditions and parameters were experimented with on a limited number of lacquerwares in order to determine the optimal procedure for the identification of pigments/dyes as potential chronological or technological markers. The test was then performed in the collector’s rooms with a mobile Raman set-up. Different pigments (vermilion, Prussian Blue, Naples Yellow, Phtalocyanine Blue, anatase, rutile, chalk, carbon black) were identified despite a strong fluorescence and a rapid degradation of both pigments and binder under increasing laser power. Better spectra were obtained on older lacquerwares.

1. Introduction

Until the early 18th century in Europe, and even later in Asia, pigments belonged to a limited number of minerals or synthetic materials with well-known spectral signatures [1,2,3,4]. New organic and inorganic pigments were then synthesized. Among marked examples are the Prussian blue (iron hexacyanoferrate), discovered in 1704 and available from 1710 in Europe, Scheele’s green (CuHAsO3), invented in 1775, available at the end of the 18th century, and chrome yellow (late 1790s, available from the first quarter of the 19th century). Introduction date differs from country to country [1,2,3]. The second half of the 19th and the whole 20th centuries are characterized by the emergence of many new and patented pigments (phthalocyanines, alizarin, etc.) offering a large choice to artists and craftsmen [5,6,7,8,9,10]. Pigments and specific mixtures by which sometimes they were commercialized can be used to trace given periods of production. Therefore identification of specific pigments in artwork can be used for dating purposes, as was already demonstrated for paintings, glass, ceramic or enameled metal objects [1,3,5,6,7,8,9,10,11,12,13,14,15,16,17,18]. Their presence of certain pigments may indicate a restoration, later embellishment or identify a fake or a modern replica.
In this work we present the characterization of Asian lacquer artworks (Figure 1) ranging from the very end of the 19th century to the end of 20th century, as potential examples of use of a large variety of pigment types, as well as possible modifications of the lacquering materials and techniques. In the preliminary phase we optimized the parameters and condition for pigment identification using bench-top Infrared (IR) and Raman spectroscopy instrumentation in the laboratory, in view of performing corresponding measurements using IR and Raman portable set-ups, out of the laboratory (Figure 2) [19,20]. Preliminary optimization of the instrumental conditions was performed on three lacquer wares (Figure 1) from Japan and Vietnam, and then the portable instrumentation is used for the study of two contemporary Vietnamese lacquer paintings (Figure 3). The mobile IR spectrometer was used to get information on the organic matrix.
Figure 1. Reference lacquerwares: (a) Japanese tray, end of the 19th century; (b) Vietnamese artwork from Ta Ty workshop, 1980s; (c) Vietnamese artwork, 1990s, depicting Kim heroin. The analysed spots are marked.
Arts 02 00111 g001
In general it is difficult to obtain good Raman spectra directly from artworks using green laser excitation (514.5 or 532 nm), due to the very strong fluorescence originating from varnish coatings and some binding media. Preliminary measurements on the lacquer ware using the green laser also produce local artifacts and degradation. Consequently, accurate characterization requires analysis of samples prepared and examined on cross sections, either sampled or collected from those fallen as a consequence of handling and local damage. In order to overcome the need of taking samples, the potential of 785 and 1064 nm excitation wavelength for the identification of pigments in lacquer ware was tried first using the laboratory Raman set-up and then using the corresponding portable equipment, one by the famous Vietnamese artist Tranh Cung, and a decorative anonymous item, both offering a variety of color shades. Portable IR instrument determines the media and 785 nm Raman instrument identifies only a limited number of the pigments identified at the laboratory with fixed instruments. Previous lacquerware studies dealt with archaeological artifacts and with Japanese urushi, 16–18th century artifacts [21,22,23,24,25,26,27,28,29,30], mainly using Pyrolysis Gas Chromatography and Mass Spectrometry (Py-GC/MS) but did not concern the pigment palette identification. FT-IR spectroscopy was also used on powdered samples in KBr pellets or specially prepared films [26,27,28,29].
Advantages ((ultra-)mobile instruments, high sensitivity due to resonance Raman Effect, micron scale spatial resolution, etc.) and drawbacks (limited choice of exciting laser lines, poor resolution, limited spectral range, complex background) of on-site Raman measurements have been recently discussed [19] and compared with other mobile techniques (X-Ray Fluorescence (XRF), X-ray Diffraction (XRD) and Laser Induced Breakdown Spectroscopy (LIBS)) [20]. XRF and LIBS determine the elemental composition but failed to detect/identify some minor phases such as organic chromophores/dyes and pigments. On the other hand, vibrational spectroscopies, as XRD, give additional information related to phase structure and symmetry, but only Raman spectroscopy can identify amorphous phases as well as colored organic chromophores.

2. Context

Lacquer ware are decorated by applying layers of a resin, obtained from the sap of three lacquer trees, Toxicodendron vernicifluum in China, Japan or Korea, T. succedaneum in Vietnam and Taiwan and Melanorrhoea usitate in Thailand and Burma. Liquid lacquer is the sap of these trees and is composed of a mixture of catechol derivatives, water, polysaccharides, glycoproteins and enzymes that catalyse the polymerisation-oxidation mechanism leading to a hard and insoluble matter [21,22,23,24,25,26,27,28,29,30]. The sap is collected and then stored for several weeks in waterproof baskets where fermentation and decantation will give different qualities. The selected quality is then mashed (water removal promotes oxidation and a subsequent viscosity increase) and annealed. Tung/abrasin oil is then added [21,22]. The pigment is generally mixed with the liquid lacquer before the application on the substrate pre-coated with lacquer. The object is coated layer upon layer with the viscous medium to make a smooth surface, polished and engraved with intricate designs. The oldest lacquerware known is 7000 years old ([25,26,27] and references herein); lacquerwares are still produced today following the traditional fashion or modern art trends. In Japan and Vietnam, the contact between Western and Oriental Cultures gave rise to new lacquerware typologies, with gradual mixing between western and eastern techniques and ingredients. For instance, under the leadership of the École des Beaux-Arts de l’Indochine founded in 1925 in Hanoi by Victor Tardieu and then directed by Evariste Jonchère, and with the support of Fine Art schools in Thu Dau Mot and Gia Dinh (East and North-East of Saigon city, respectively), Vietnamese artists and craftsmen created peculiar works of art at the crossing between Modern Art, Cubism and Expressionism [31,32,33,34]. After the Second World War, the Socialist Realism and Proletarian Art trends strongly influenced artists. The opening of the reunified country to international Art Market trends led to stylistic modifications but also to the production of workshops’ copies and even fakes. Synthetic polymer coatings based on nitrocellulose and acrylic resins give a gloss similar to that of natural lacquerwares, and it seems interesting to ensure that only sap has been used. In this paper, we try to evaluate the potential of the Raman technique to identify the used pigments as potential chronological markers and the use of IR mobile set-up for the characterization of the lacquer medium.
Figure 2. Raman (a) and IR (b) mobile set-ups.
Arts 02 00111 g002
Figure 3. Lacquerware masterpieces: (a) Tranh Cung and (b) a decorative production analysed with mobile Raman set-up.
Arts 02 00111 g003

3. Experimental Methods

3.1. Artworks

Three items from a private collection were selected and studied at the laboratory:
(a)
a Japanese tray (26 × 26 cm2), accessory of a two-level table imported from Japan at the end of the 19th century, depicting flowers and leaves (Figure 1a), with seven different colors: red, rose, brown, green, yellow, black and gold. Millimeter chips were taken from the reverse black side as well as from a companion black tray with a yellow lacquered rim.
(b)
a non-representational artwork (30 × 39.5 cm2, 1961, Figure 1b) in the style of Ta Ty, a famous Vietnamese Painter (1922–2004), with eight different colors: red, green, light green, brown, yellow, white and gold.
(c)
a portrait (15 × 20 cm2) from the beginning of the 1990s (Figure 1c), depicting the heroin from the famous Kim Vân Kiều novel by Nguyễn Du (1765–1820) with red, black and gold colors.
The analyzed spots are indicated in Figure 1.
Figure 3 (shows the lacquer paintings studied in the Collector’s rooms with the HE785 mobile Raman set-up:
(d)
a Đinh Cường (1939-) artwork, depicting a woman playing violin (60 × 40 cm2) with red, black, green, blue, yellow, white and gold colors.
(e)
an anonymous decorative lacquerware depicting flowers.

3.2. Techniques

Two Raman spectrometers were used in the laboratory:
(i)
a Senterra microspectrometer from Bruker Optics (Germany) equipped with a Peltier-cooled CCD matrix detector and with two laser sources (edge filtered Nd:YAG 532 nm and 785 nm diode).
(ii)
a RFS 100 s FT-Raman microscope III, also from Bruker Optics, equipped with a 1064 nm double Nd:YAG laser.
We used a long working distance x50 (N.A. = 0.45) objective from Nikon (Japan). For the 1064 nm FT Raman instrument an Olympus x40 (N.A. = 0.65) objective optimized for IR wavelength was also used. The power of illumination was changed according to the laser wavelength, the optics and the colors to be analyzed. The powers applied were 1 mW and 15 to 20 mW for the 785 and 1064 nm excitations, respectively.
A mobile HE785 Horiba Jobin-Yvon (France) equipped with a Peltier cooled Andor CCD detector was used (Figure 2a, on-site measurement). Specially developed concave holographic gratings provide unsurpassed sensitivity. A 785 nm OEM 300mW laser and the HE spectrometer are optical fibre coupled to a remote SuperHead® optical head equipped with selected high quality Notch filters and a long working distance microscope objective for sample illumination and light scattering collection. The laser beam is injected into the optical head through the optical fiber. The spectral window ranges between 80 and 3300 cm−1 but the sensitivity—and the collected intensity—decreases above 2000 cm−1. Applied powers were 5 mW and 10 mW (as measured on the sample).
A portable ALPHA Bruker Optics FT-IR spectrometer equipped with dedicated contact-less reflection optics was used (Figure 2b, on-site measurement). Data are examined in the form of a ‘raw’ reflection spectrum (360–4000 cm−1 range). Water/CO2 compensation correction was used. Actually, the reflectance spectra were collected in reflection mode on the glossy lacquerware surface and divided by the background reflection signal from a mirror-like surface. We thus obtained the converted reflectance spectrum expressed as pseudo absorbance A’ = log 1/R, where R is the reflectance. The Kramers-Kronig transformation was not used because the different characters of organic (with derivative-like bands) and inorganic (with inverted/Restrahlen peaks) compounds signature made the calculation too complex. The ATR accessory was also used to analyze small-scale samples from the Japanese lacquerware reverse side and rim. Despite the good flatness and very low surface roughness of the collected chips, the background correction is complex and bands are distorted. Furthermore, the studied wavenumber range is more limited than that measured by reflection.

4. Results

4.1. Lacquer Medium

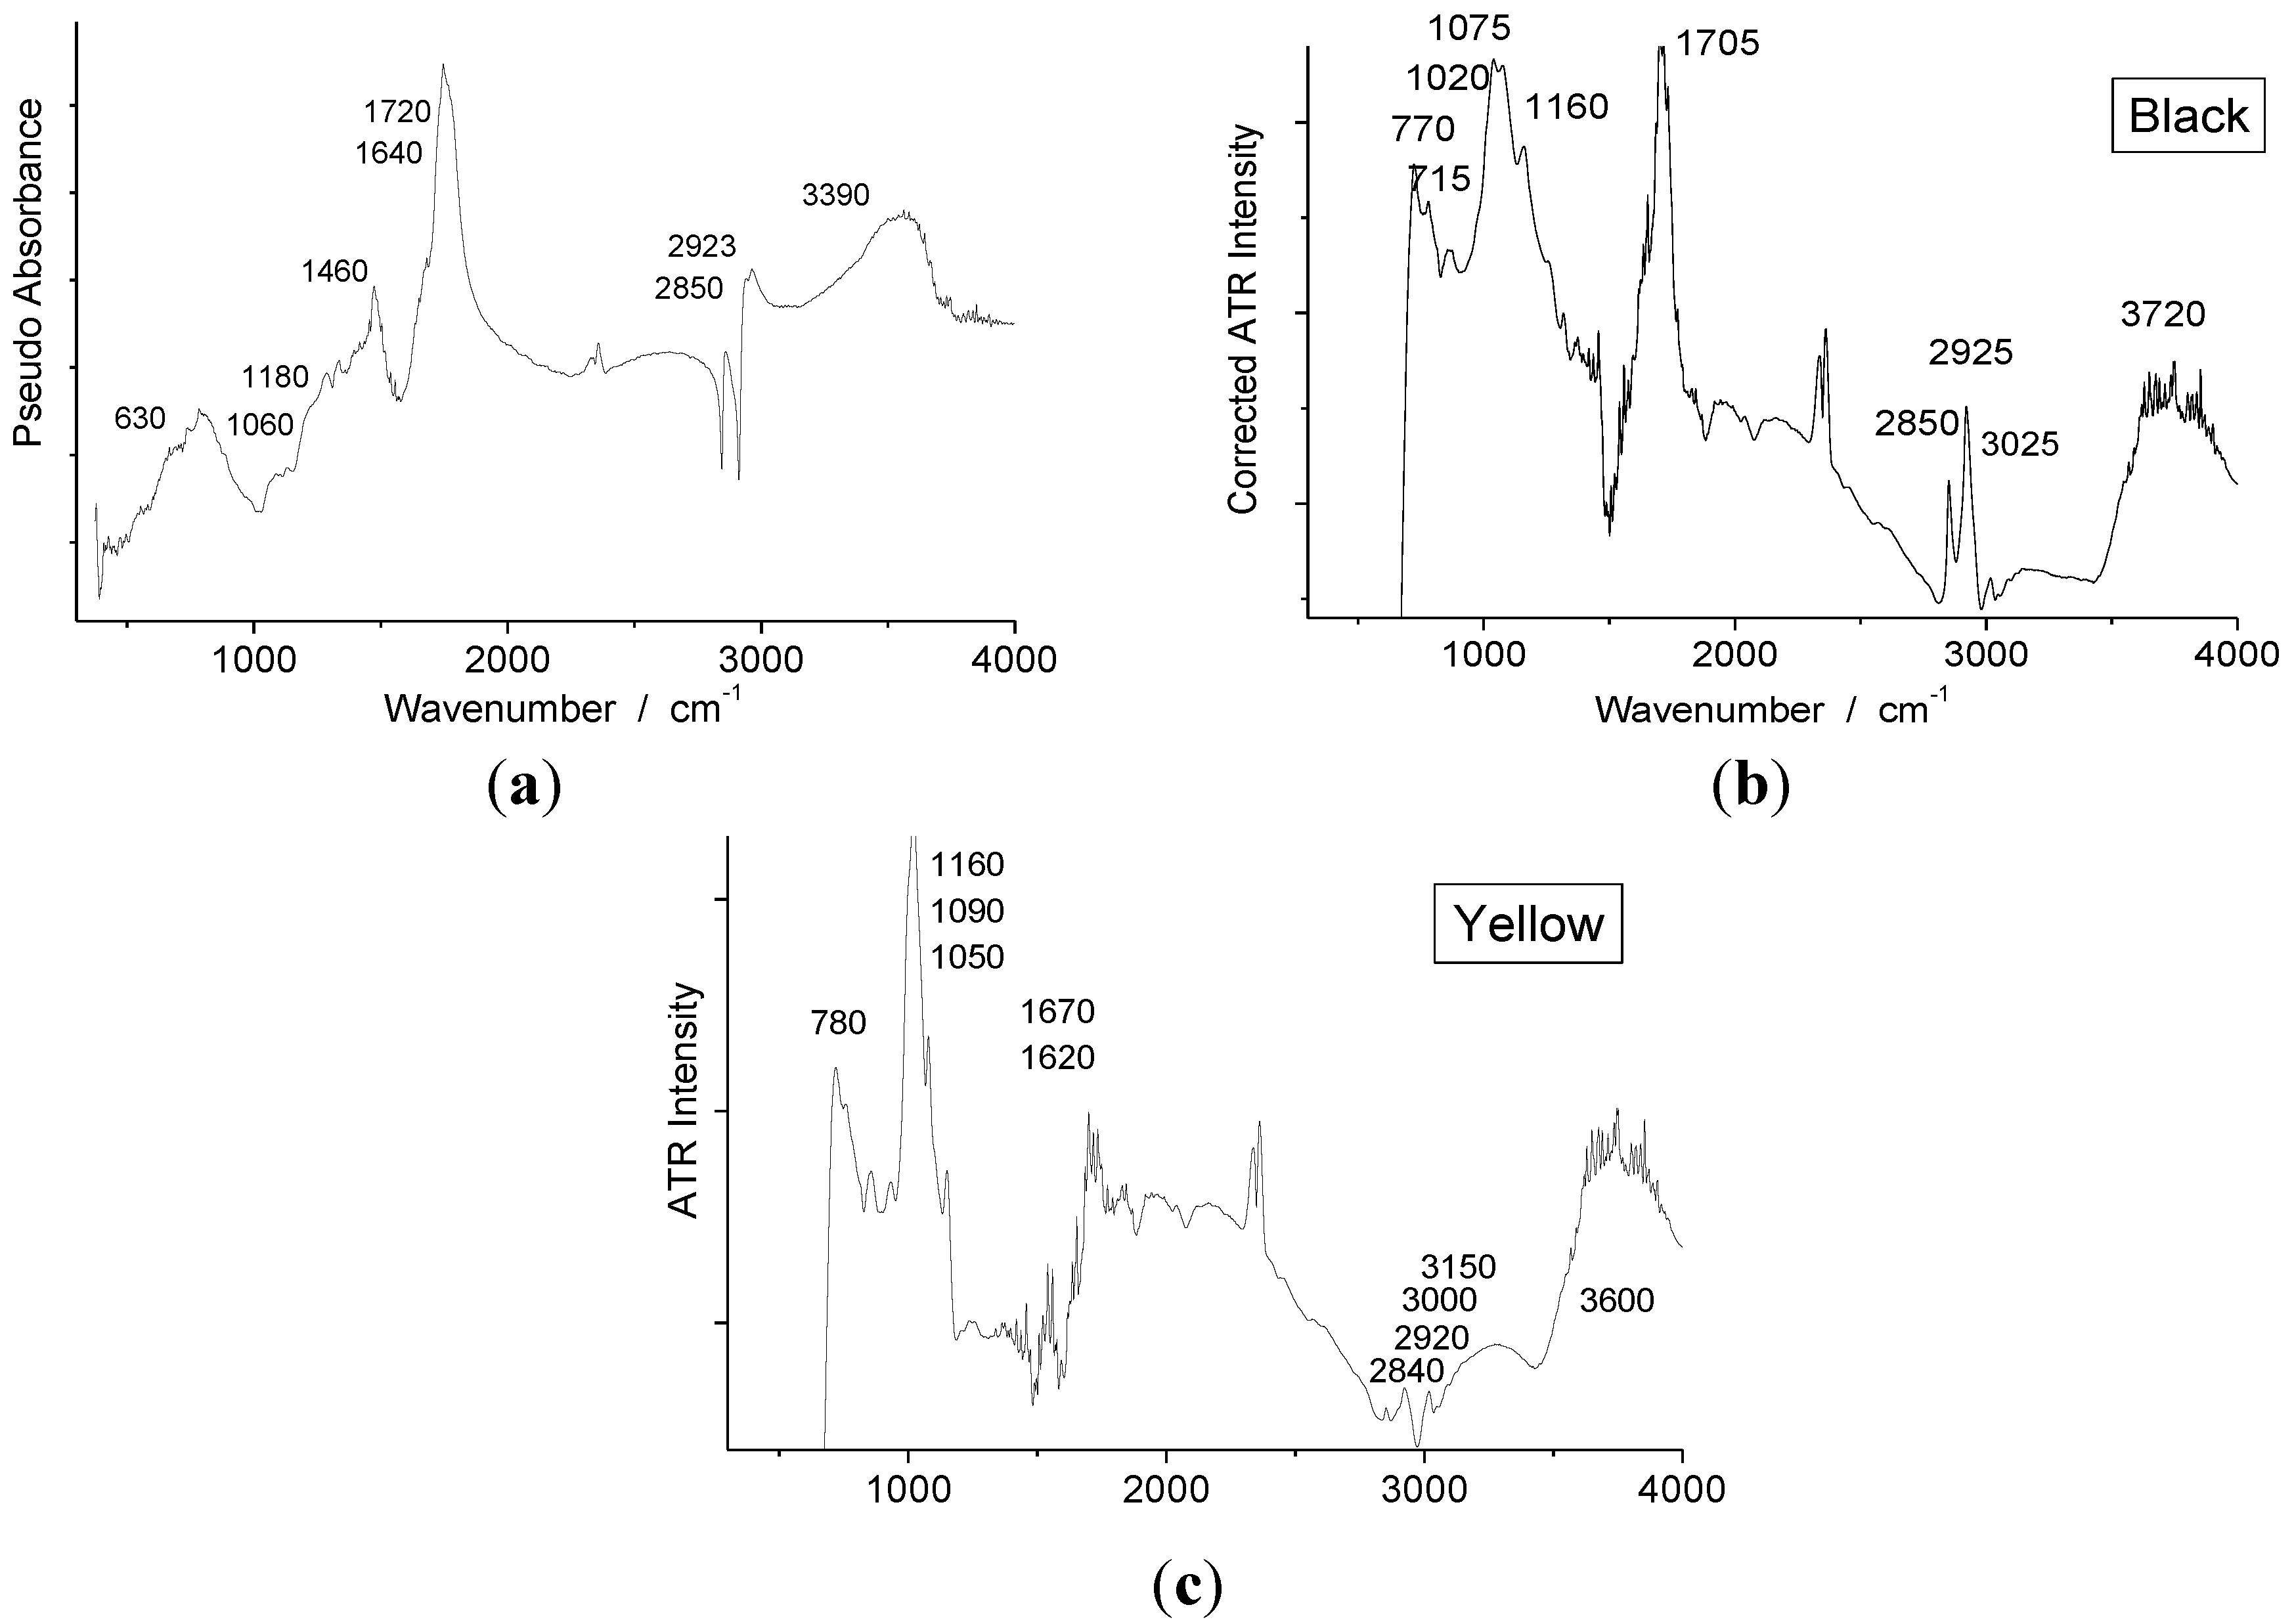
Figure 4a shows the raw reflectance spectrum recorded in a non-invasive way on the Japanese tray black area with the ALPHA mobile instrument or with the microATR portable accessory on a sampled black scale. Inflexion points and peak maxima obtained from Kramers-König transformation correspond rather well: the strong doublet at 2850–2925 cm−1 (C-H stretching), the broad band at 1630–1720 cm−1 (C=O stretching) and the 1450 to 1075 cm−1 massif (C-H deformations, C-O-C glycosidic modes, C-OH modes…) confirm that the matter is a lacquer [23,24]. The small 3020 cm−1 peak, characteristic of aromatic species is better observed on ATR spectra than on reflectance ones. It is not possible to say if this arises from the different layer thickness analysed by the used techniques. Obviously, the reflectance non-contact measurement is very efficient to assess the media but failed to identify chromophores: the ATR-FTIR spectrum recorded on a yellow scale (Figure 4c) shows an additional component at 1620–1670 cm−1, but the complex background due to the mixing of the absorption and reflection contributions hinder a precise assignment.
Figure 4. Pseudo-absorbance spectrum (a) recorded with portable IR instrument on the black Japanese tray (Figure 1a) and (b) ATR-FTIR spectrum recorded using the ATR accessory on a black small scale sampled on the tray back rim; (c) ATR corrected FT-IR spectrum recorded using the mobile ATR accessory on a small yellow scale sampled from the tray rim.
Arts 02 00111 g004

4.2. Pigments

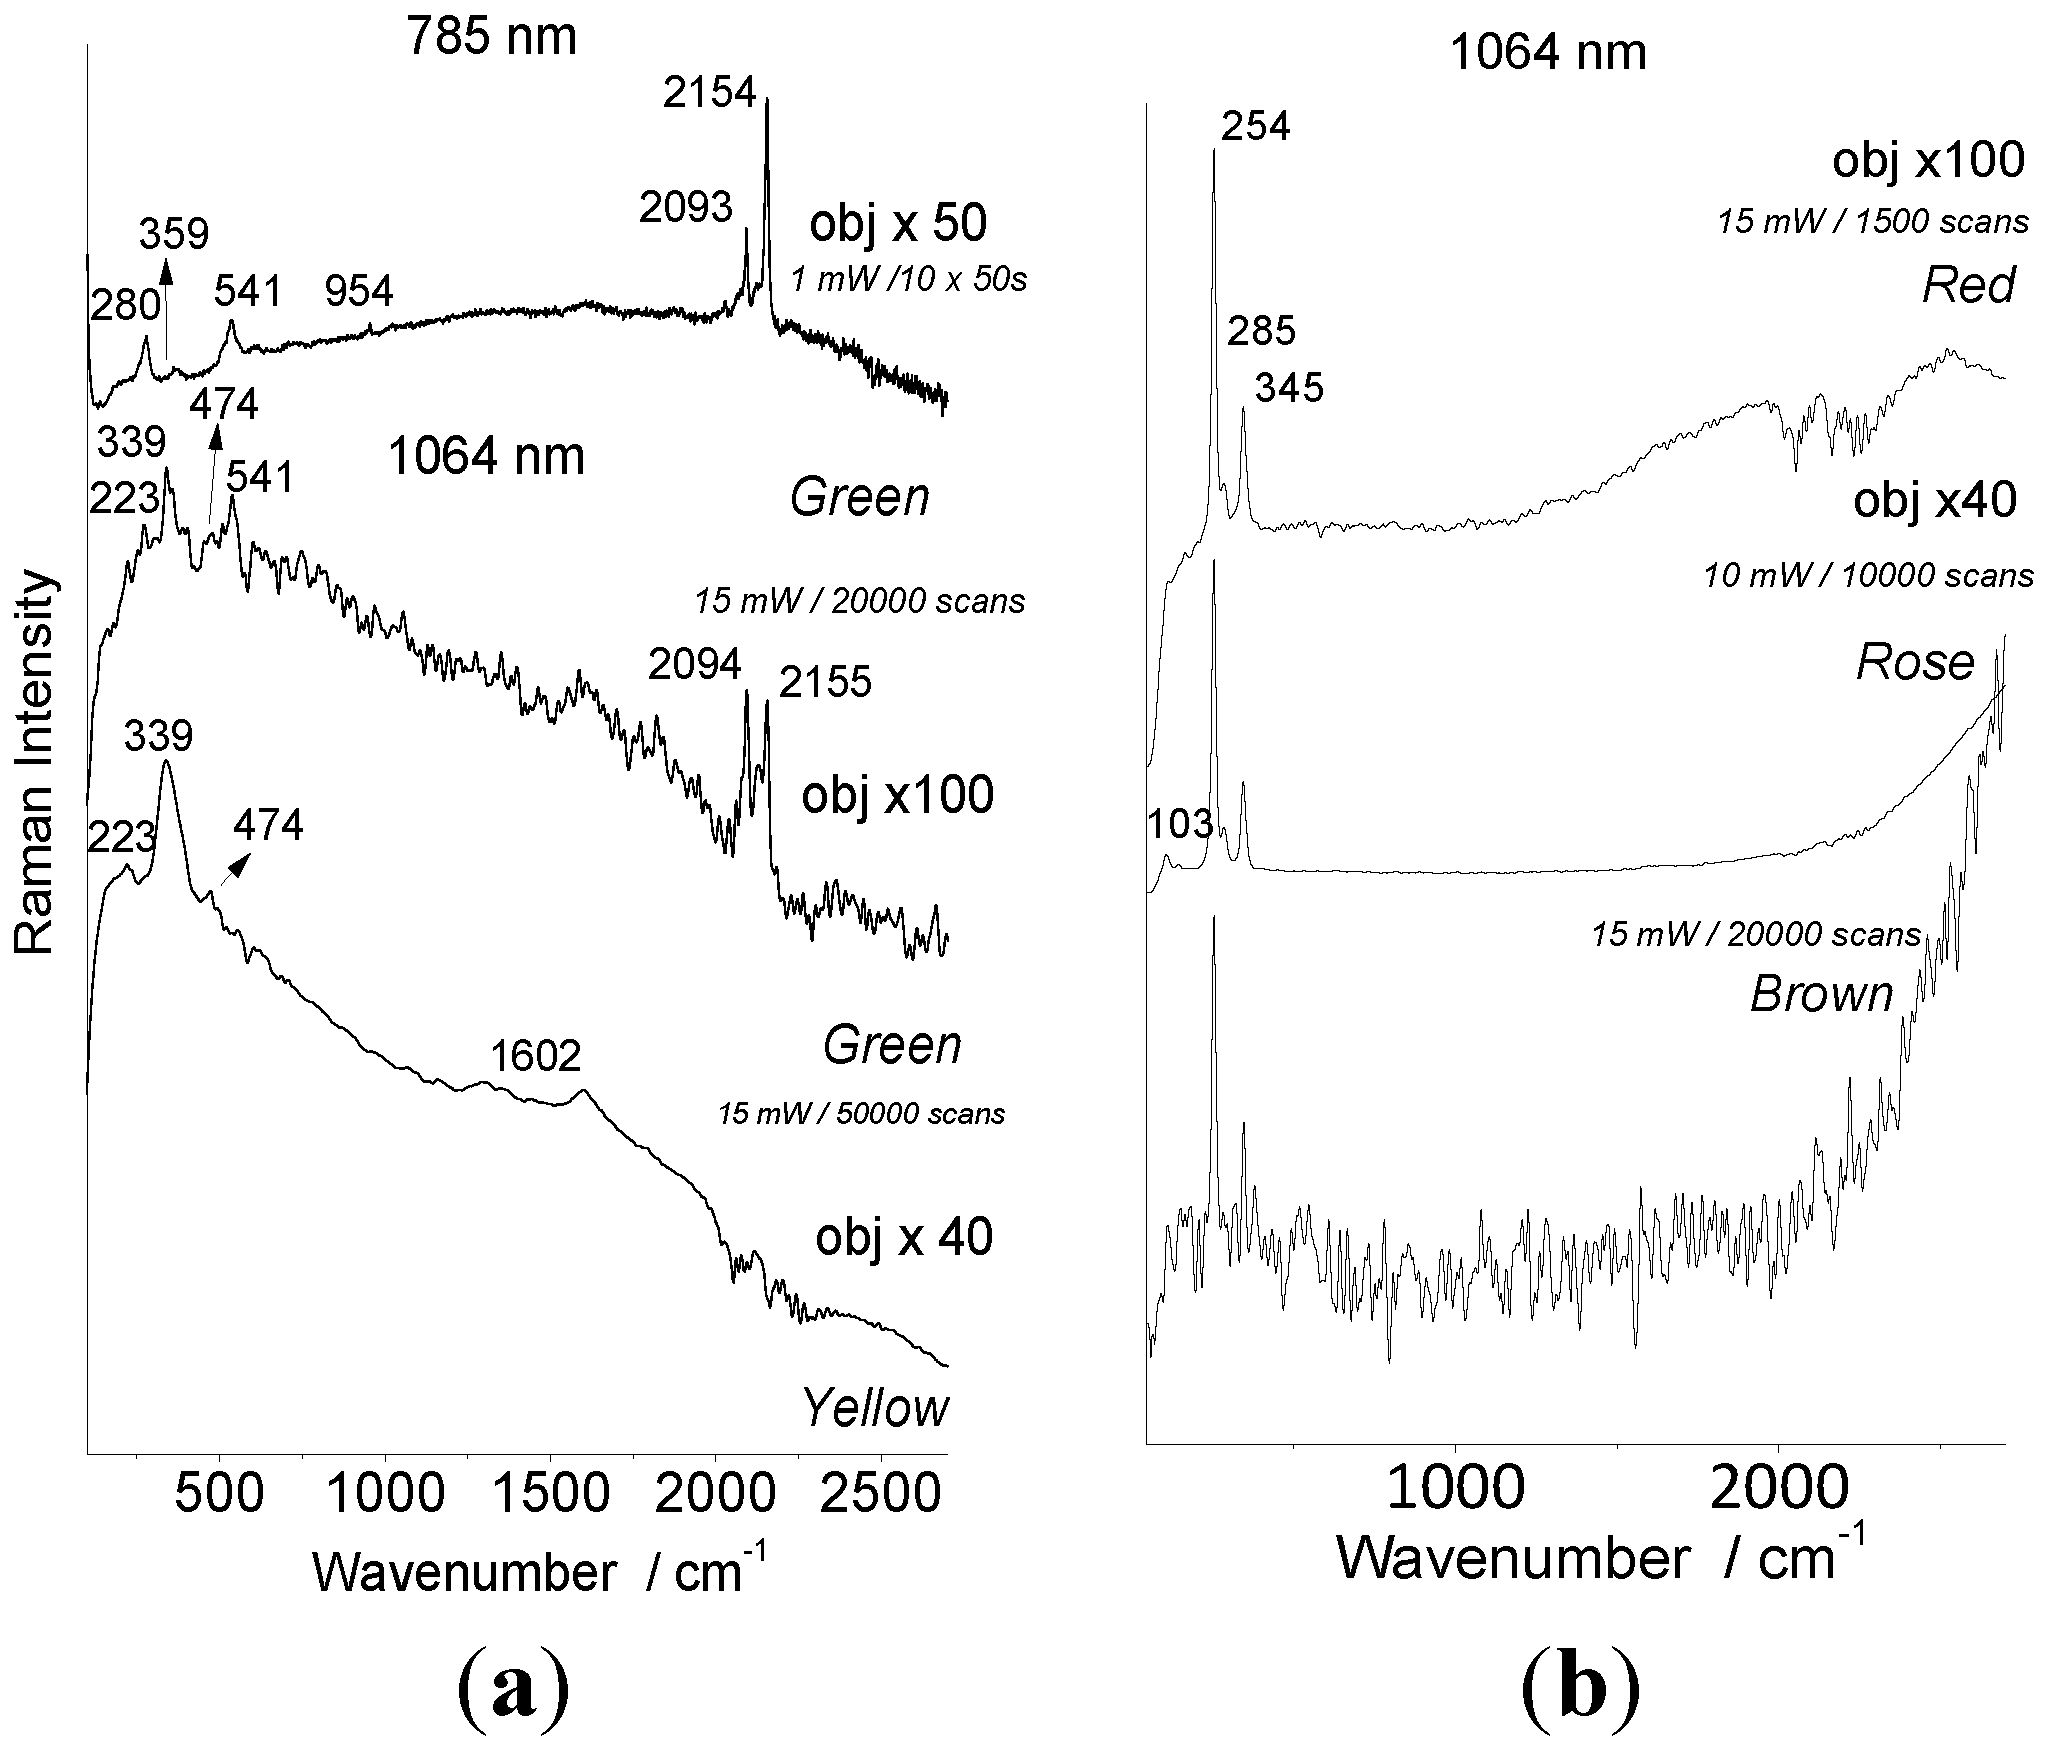
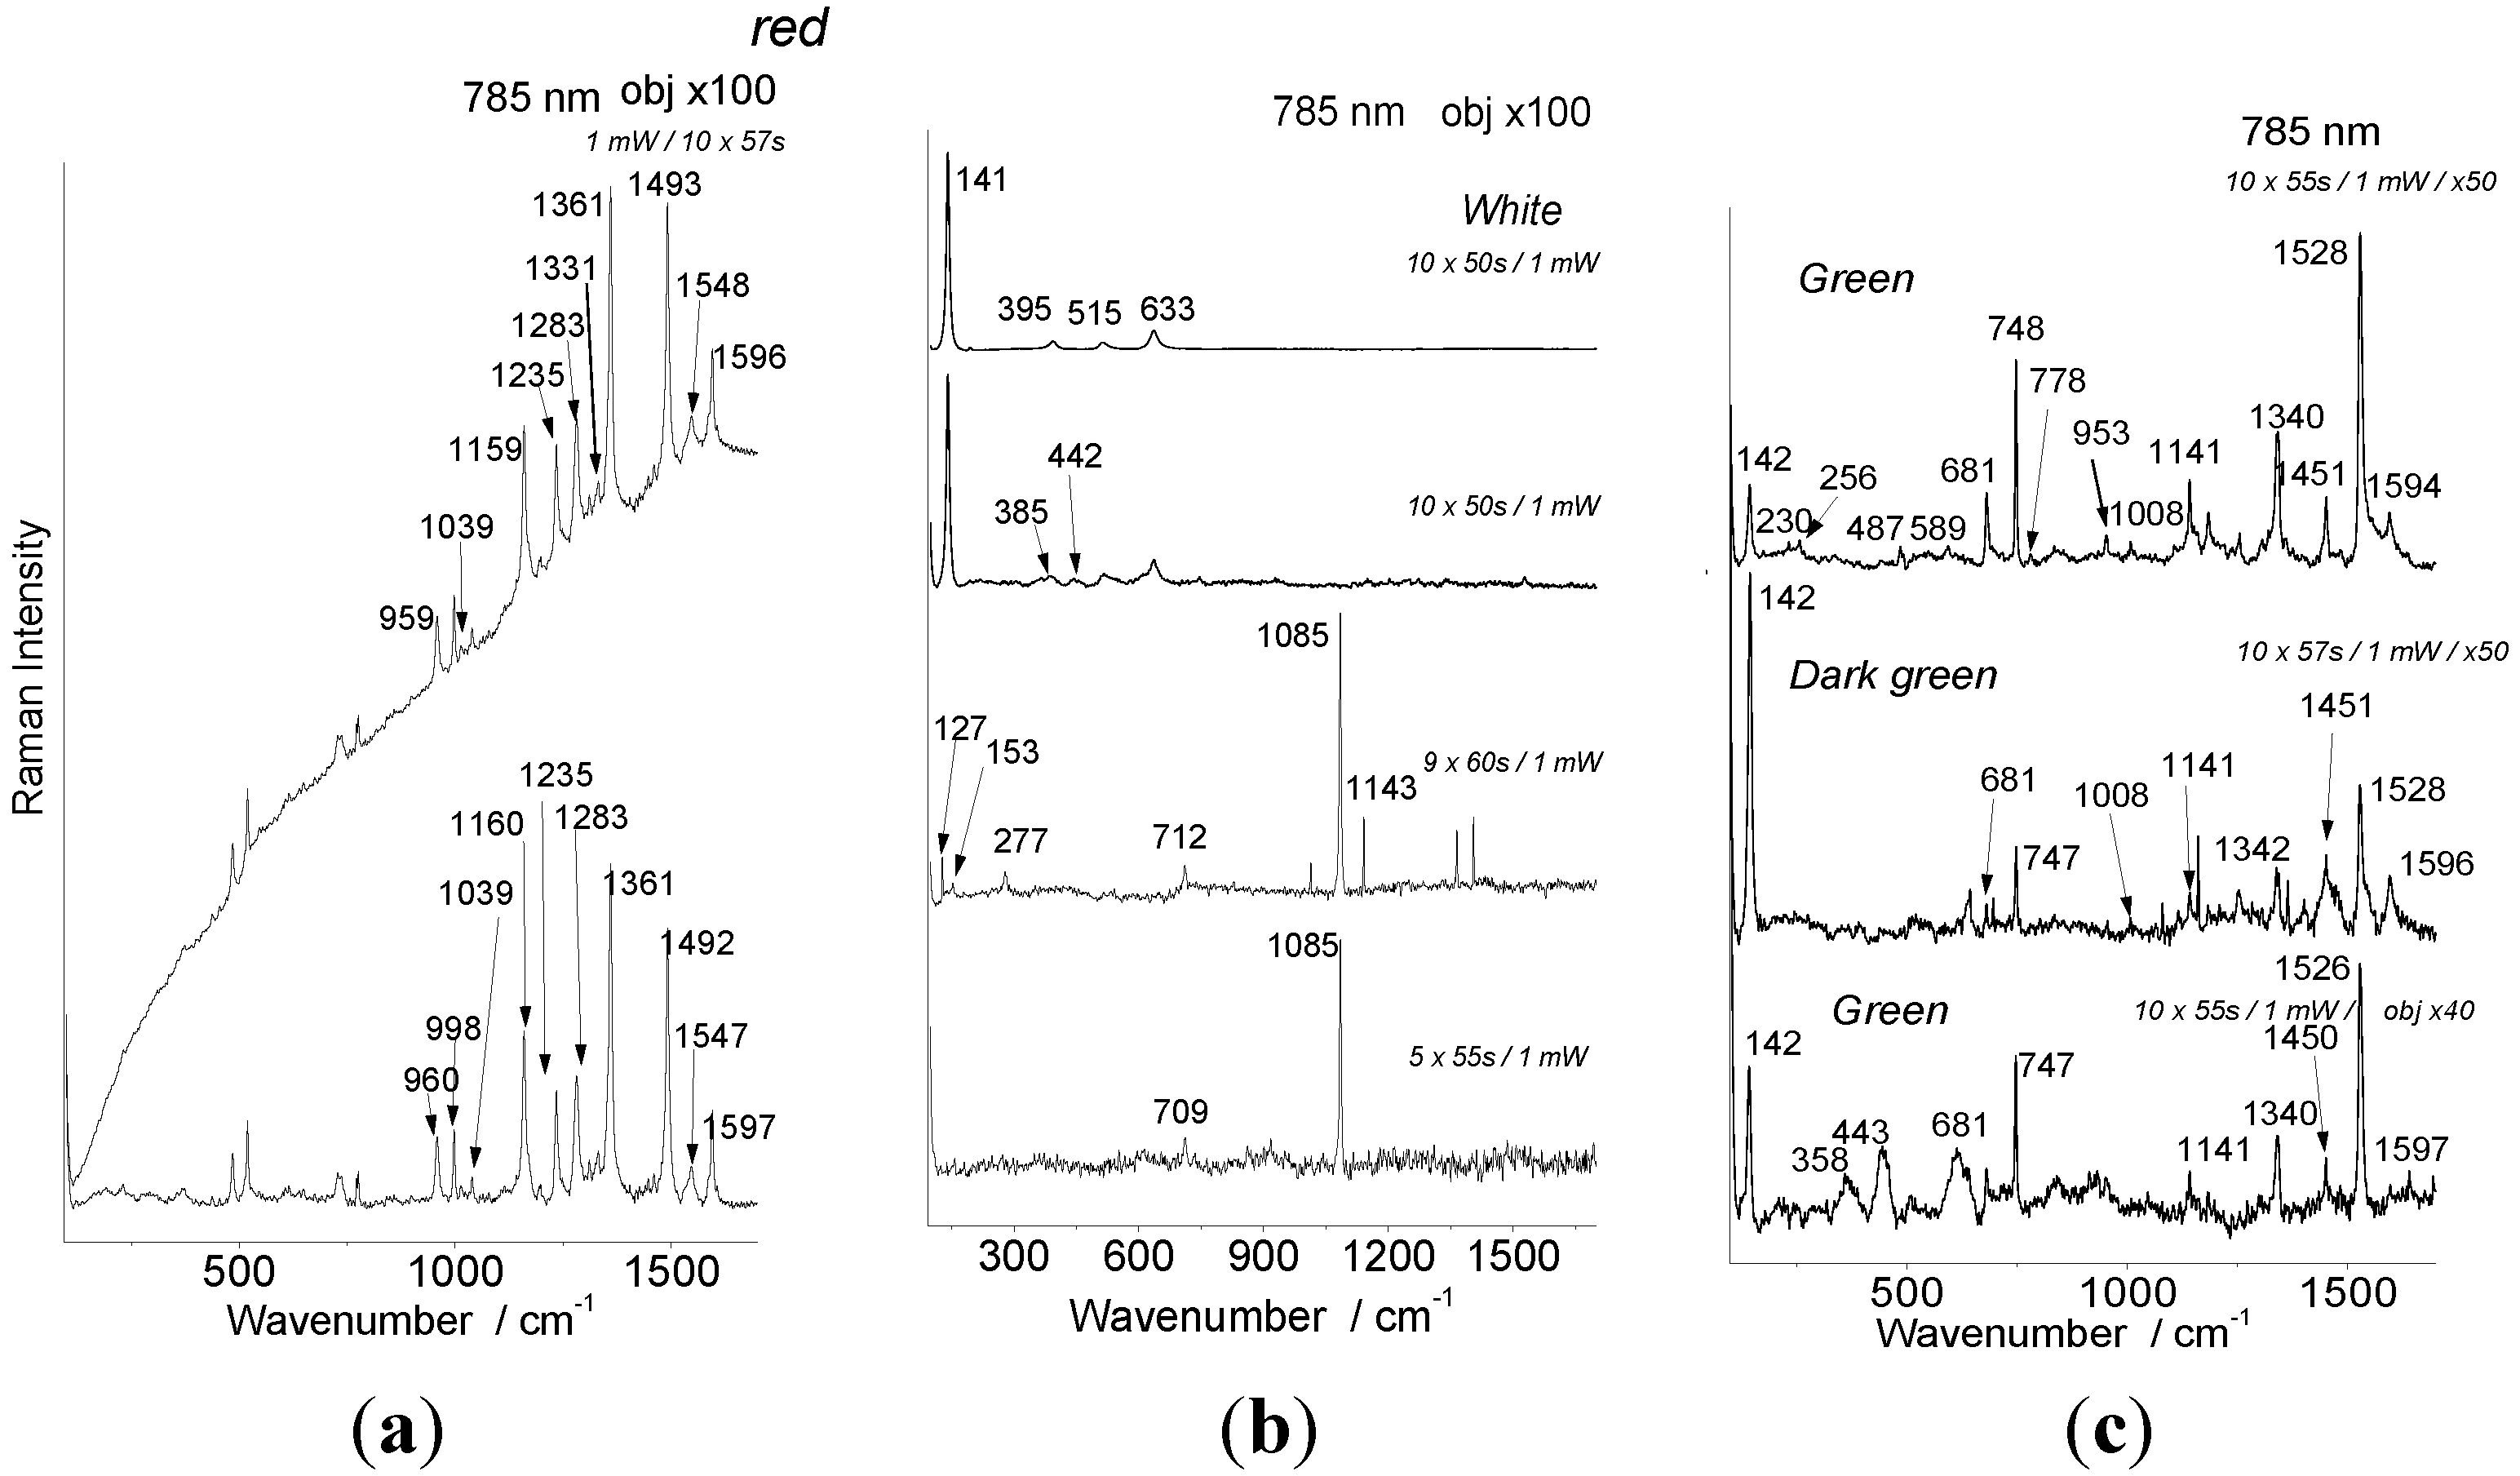
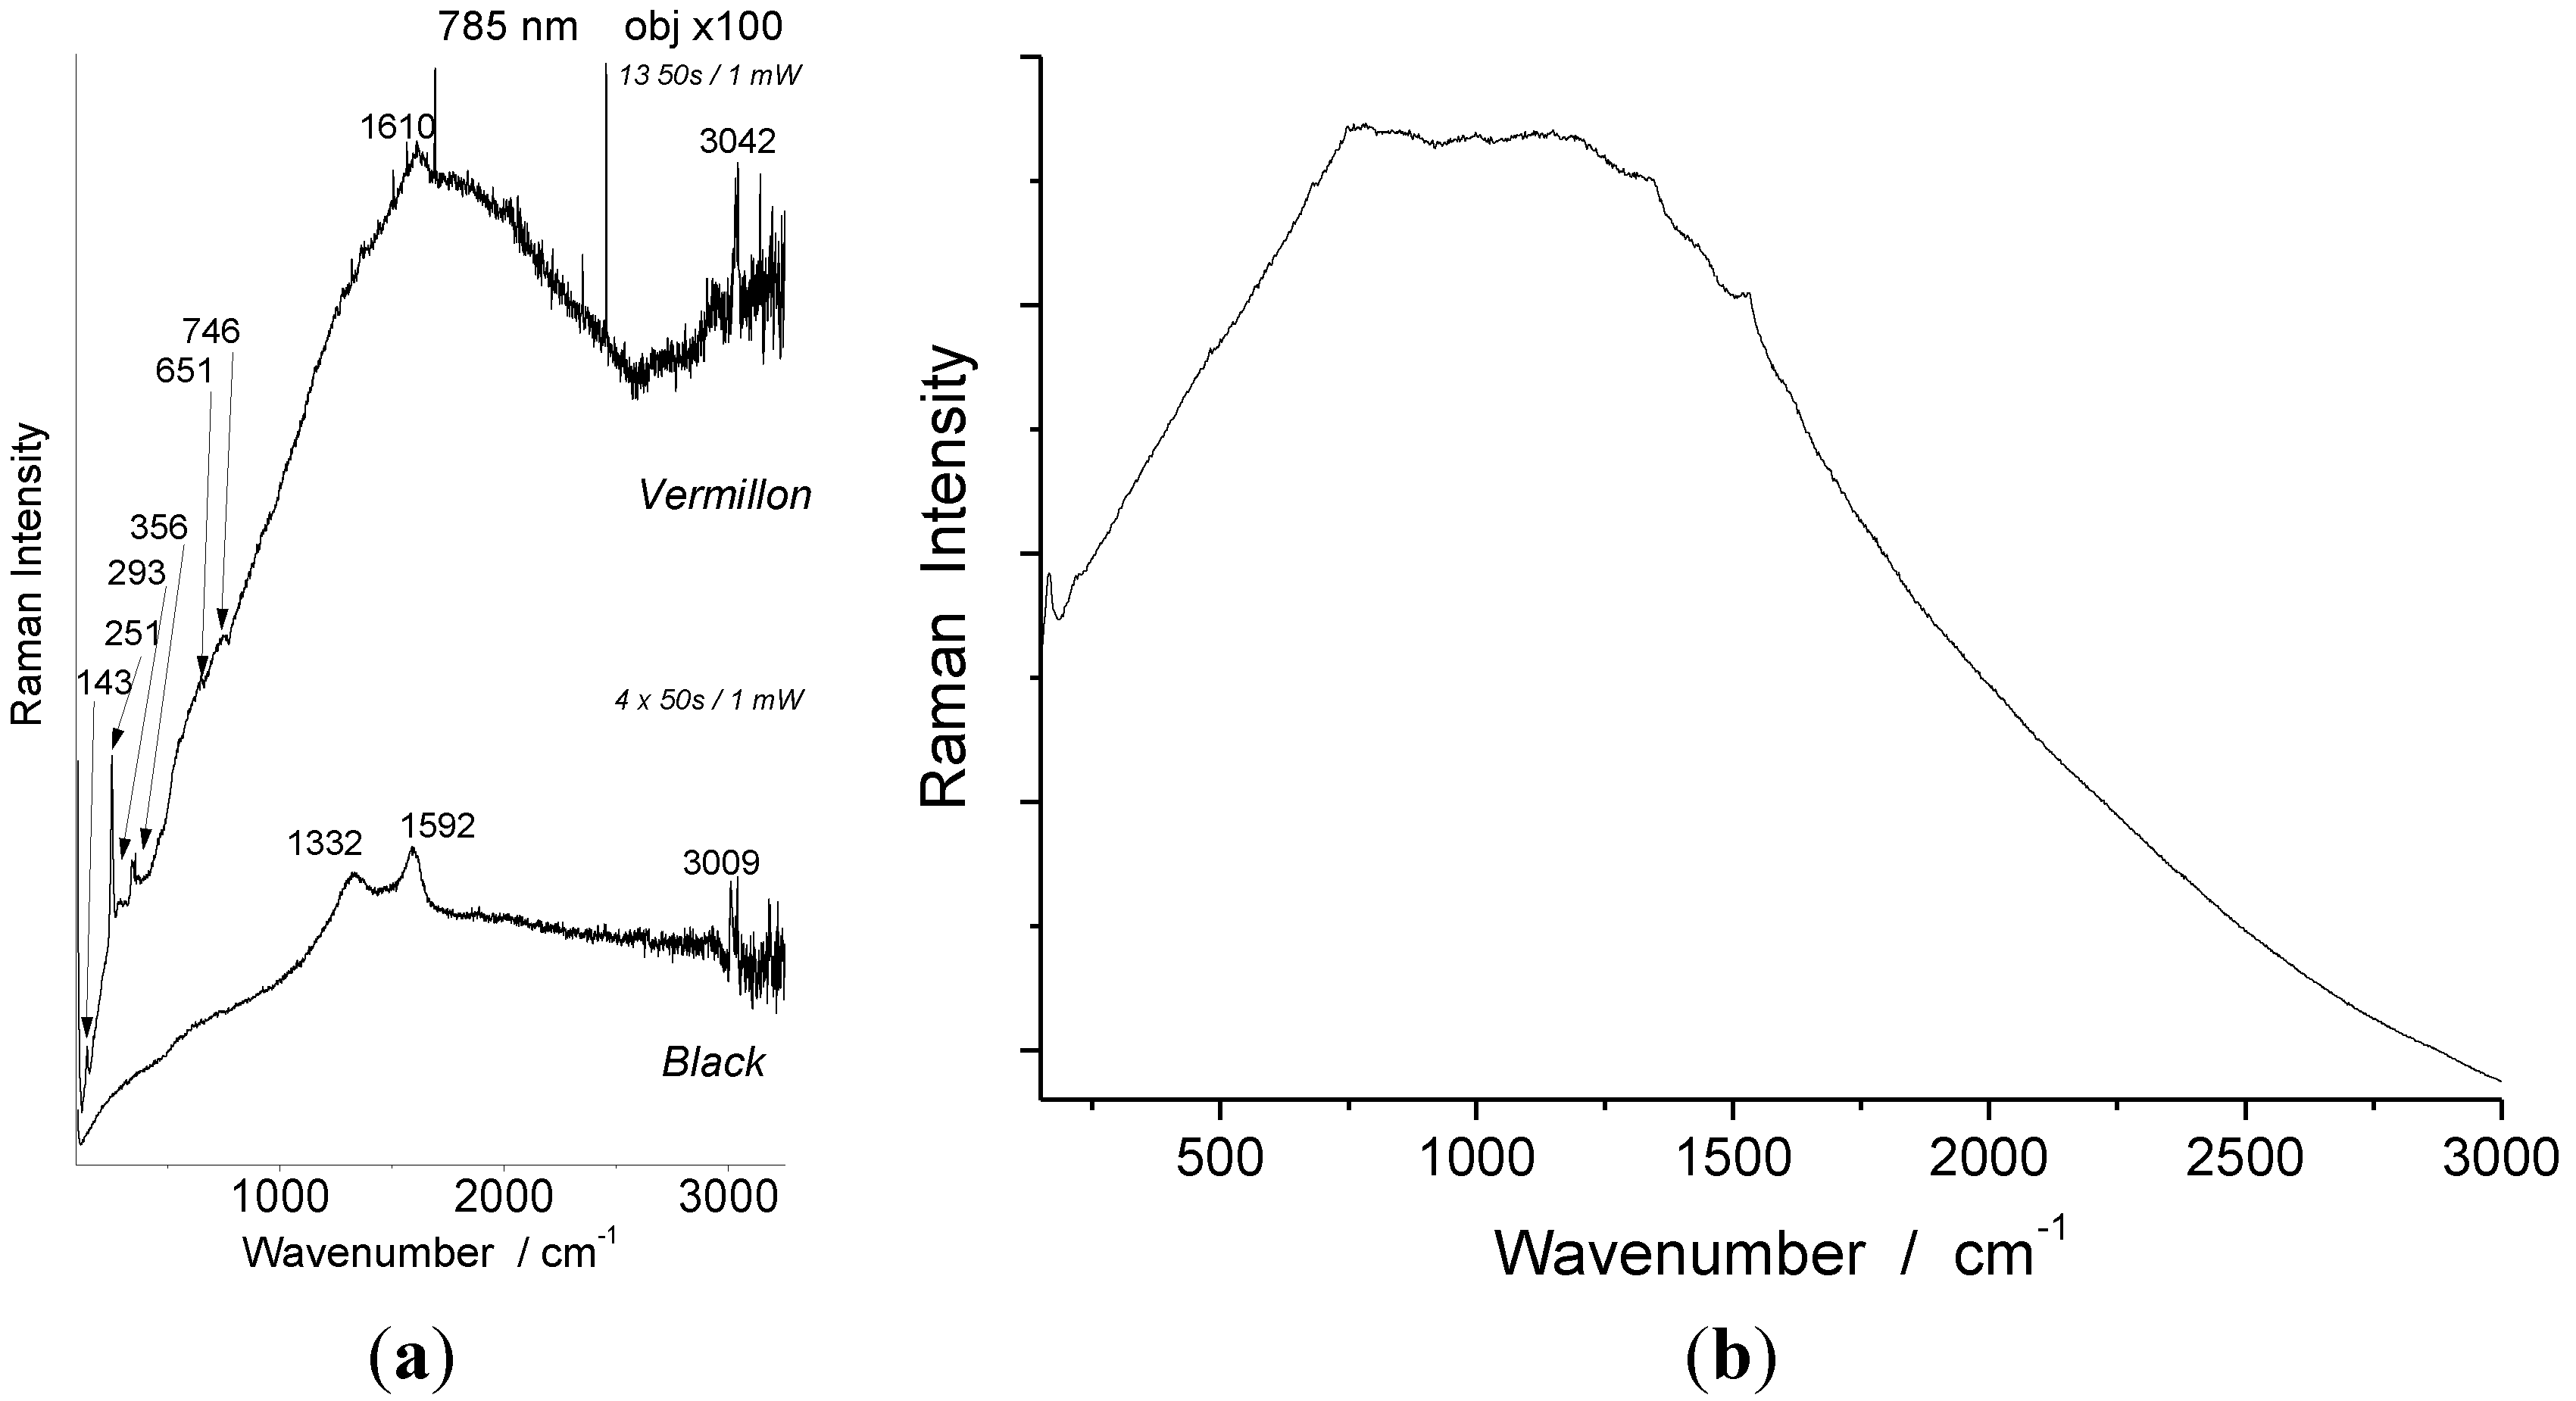
Japanese tray: Representative Raman spectra are presented in Figure 5 (Japanese tray), Figure 6 (Ta Ty’s abstract lacquerware) and Figure 7 (Kim’s portrait). As shown in Figure 5, Figure 6, Figure 7, the fluorescence background is high under both excitation conditions, and only a few spots exhibiting the lowest fluorescence level give acceptable spectra. The identified pigments are listed in Table 1:
Figure 5. Representative Raman signatures recorded with 785 and 1064 nm excitations at different spots (see Figure 1) on the Japanese tray. The colors of the analyzed spot as well as the recording parameters (objective, illumination power, recording time (785 nm) or number of scans (1064 nm) are given.
Arts 02 00111 g005
Figure 6. Representative Raman signatures recorded with 785 nm excitation, at different spots on the Ta Ty Lacquerware: (a) red, (b) white and (c) green. The baseline has been subtracted (except for a-top spectrum: the spectra before and after baseline subtraction are compared).
Arts 02 00111 g006
Figure 7. (a) Representative Raman signatures recorded with 785 nm excitation at red and black spots (see Figure 1) on Kim’s portrait. (b) Representative raw Raman signature recorded with 785 nm mobile Raman set-up at blue area of the Flowers’ lacquerware (Figure 2a).
Arts 02 00111 g007
Table 1. Pigments Identified in the lacquerware presented in Figure 1.
ArtifactColor785 nm identified1064 nm identified
Japanese trayRedHgS vermilionHgS vermilion
RosenoneHgS vermilion
GreenPrussian bluePrussian blue
BrownHgS vermilionHgS vermilion
YellownonePb3O4?
Ta Ty’s lacquerwareRedPurpurinePurpurine
GreenAnatase
Phthalocyanine blue
None
Dark greenAnatase
Phthalocyanine blue
None
YellowAnataseAnatase
BrownAnatase, CarbonCarbon
WhiteAnataseAnatase
White 1Egg shellEgg shell
Kim portraitRedHgS vermilionHgS vermilion
BlackCarbon blackCarbon black
- Vermilion (HgS) pigment is identified in red areas with its characteristic triplet at 254, 285 and 345 cm−1, whatever the exciting wavelength. The quality of the spectrum depends more on the analyzed spot than on the used wavelength. Vermilion is also used for the rose and brown decorations. The high light absorption on brown spots makes it difficult to record spectra. No spectra could be collected for the black lacquer. Green colored areas show the typical 2093–2154 cm−1 narrow doublet characteristic of Prussian blue (Fe4[Fe(CN)6]3 n H2O) [1,6,12]. Additional broader peaks are observed at ~223, 280, 359, 474 and 541 cm−1. Bands at about 280 and 540 have already been reported in the spectrum of Prussian blue [35]. The other components can be related to a yellow pigment(s) added in order to obtain the green color. The weak bands at 359 cm−1 (Figure 5a, upper spectrum), 223 and 339 cm−1 (Figure 5a, central and bottom spectra) may correspond to signature mixture of orpiment (As2S3) and realgar (As4S4), which are traditional minerals to produce yellow to orange color [1,2,3]. The 541 cm−1 peak is consistent with red Pb3O4 pigment. The limited spectral range of the instrument hinders recording data below ~180 cm−1, mandatory wavenumber domain to identify lead-rich phases. Phase transformation under the laser beam is not excluded, although no visible changes were detected. The weak 474 cm−1 peak (Figure 5, center spectrum) may correspond to CuS [17], another traditional red pigment, and/or to associated sulfide impurities of the realgar/orpiment mixture. The impossibility to record a spectrum below 200 cm−1 makes it difficult to reliably assign these low intensity peaks. Note, the broad feature with bumps at ~1350 and 1600 cm−1 in yellow spectrum (Figure 5a) corresponds to disordered carbon.
Ta Ty’s style non-representational lacquerware: Representative spectra recorded under 1064 and 785 nm excitations are presented in Figure 6. Two types of white pigments are identified: calcium carbonate of the egg shell pieces (not nacre) and anatase (TiO2) in the homogeneous white area. The strong ca. 144 cm−1 anatase signature is observed for all the other colored areas, indicating that this compound is used as a support for the organic dyes or mixed with them, as usual to support many organic pigments. The 785 nm excitation appears more efficient than the 1064 nm one (not shown) to obtain good spectra. The red colored region shows an unassigned spectrum with strong peaks at 1492, 1361 and 1160 cm−1, likely due to purpurine. The darker shades are obtained by the addition of carbon black. Green color is obtained with a dye giving a spectrum very close to that of Phthalocyanine blue (1595, 1528, 1451, 1340, 953, 748 cm−1) [12]. Note the small wavenumber shifts may originate from the baseline subtraction and/or from modifications related to the interaction with the lacquer matrix components. Broader components are observed at 255, 358, 443 and 681 cm−1 (Figure 6c). The former component is consistent with vermilion, but its very low intensity (Vermilion spectrum intensity is huge) indicates that it is more probably a contamination.
Kim portrait: The spectra recorded in different places give the characteristic ~255–345 cm−1 doublet signature of vermilion (Figure 7). In some spots, the tiny signature of anatase is observed. Black lines give the typical carbon black doublet.

4.3. Test with the Mobile Raman Set-up

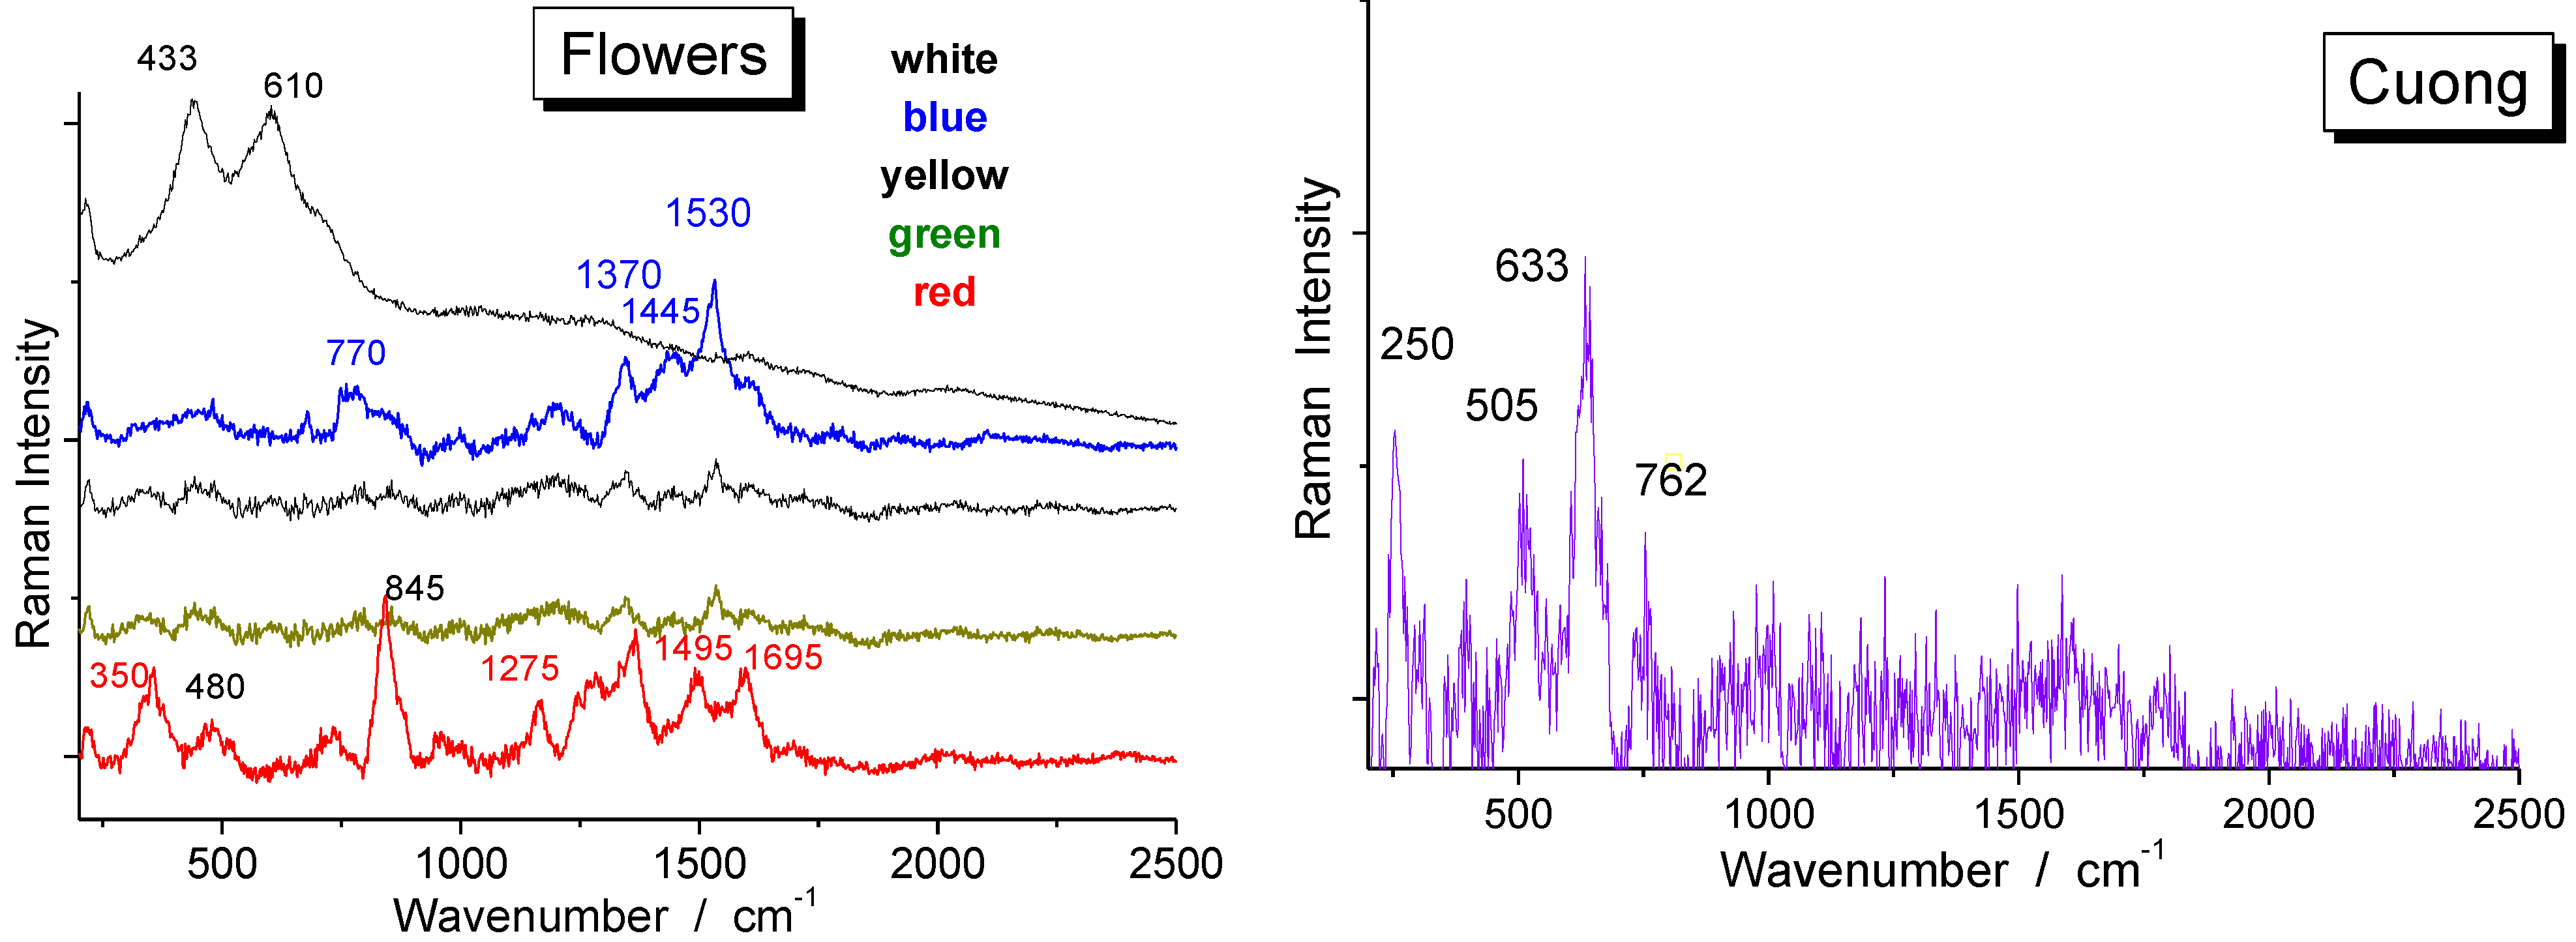
The 785 nm excitation appears to be the most efficient laser line. It also has the great advantage that it can be used to perform “out of the lab” measurements with the portable Raman set up. An example of raw spectrum is given in Figure 7b. The recording is difficult because of a huge fluorescence, higher than that observed with the fixed instrument. A baseline subtraction is mandatory to make the specific signatures visible (Figure 8). The lacquer cannot support a power of illumination higher than ~5–10 mW with x50 objective, which is an important limitation for measurements with a mobile set-up (there is a lot of ambient light collected even when a black textile is used to cover the setup. Some spectra could however be recorded for the contemporary lacquerware depicting flowers (Figure 3b): the stronger signal is obtained in white areas with the characteristic strong signature of rutile; for the red (main peaks at 1610, 1495, 1365, 845 and 350 cm−1; the latter peak may correspond to vermilion), green and blue (1530, 1445 and 770 cm−1, consistent with a phthalocyanine dye) colored area significant spectra are obtained. For yellow (1610 and 1275 cm−1) and green areas (main components already mentioned indicate a mixing of yellow and blue dyes) the spectra are weak and addition of azo compounds is possible [7]. Sampling is necessary to verify using appropriate analytical technique. The poor quality of the as-recorded spectra makes a more complete assignment questionable. For Cuong’s artwork, only a very tiny signature assigned to cassiterite opacifier (~633/765 cm−1 doublet), as well as the 255–345 cm−1 vermilion doublet, are detected in rare spots where the fluorescence is sufficiently low. Peaks around 350 and 845 cm−1 are consistent with a chrome orange pigment. The use of cassiterite and vermilion in the latter artwork is consistent with a production using the traditional lacquer technique mixed with pigments of the oil painting palette, the technique most used by the artist.
Figure 8. Representative raw Raman signature recorded with 785 nm mobile Raman set-up above blue areas of the Flowers’ (Figure 3b) and Cuong’s (Figure 3a) lacquerwares.
Arts 02 00111 g008

5. Conclusion

The 785 nm excitation appears as the best suited excitation for the study of lacquerware pigments with fixed instrument, notwithstanding the strong fluorescence. By comparison with the analysis of pastels, drawings and paintings, the high fluorescence requires testing many spots to have some of them give a usable spectrum. Nevertheless, some pigments/dyes can be identified.
The Kim portrait has been made according to the tradition (carbon, vermilion) and does not present enough colors and specific markers to be used to characterize the artist/workshop technique. On the other hand, the Japanese tray and the Ta Ty’s work show specific characteristics. The use of Prussian blue in the Japanese tray and of phthalocyanine in Ta Ty’s lacquerware painting are typical of pre-industrial and modern pigment technologies, respectively. Indeed, lacquerwares made with a variety of colors offer more potential tools to identify the used pigment palette and hence their date of production. The best quality spectra are collected from the Japanese lacquerware, the older one. Consequently, the study of old artifacts appears to be easier than that of modern artworks. We expect the technique to be best adapted to study lacquerwares of 16th and 19/20th century, a period in which many new pigments and dyes were created.
The study with the portable Raman set-up was less successful, a lot of measurements in different spots being necessary to obtain a rather poor spectrum. After background subtraction, we could however find evidence for more or less characteristic Raman peaks. The inorganic colorless phases (anatase or rutile TiO2) used to support the modern colored organic dye give a signature that covers the chromophores signature. On the other hand, the easy collection of rather good reflectance spectra directly on the glossy surface of the lacquerware (using the mobile IR spectrometer) and ATR-spectra collected on sampled chips allowed a certification of the lacquer matrix nature and, hence, a discrimination with replica made with acrylic resins. However, the IR signature is complex, which makes a full assessment difficult.

Acknowledgments

Collectors are kindly acknowledged for the permission to study the artworks.

Conflict of Interest

The authors declare no conflict of interest.

References

  1. I.M. Bell, R.J.H. Clark, and P.J. Gibbs. “Raman spectroscopic library of natural and synthetic pigments (pre–similar to 1850 AD).” Spectrochim. Acta Part A 53 (1997): 2159–2179. [Google Scholar] [CrossRef]
  2. L. Burgio, and R.J.H. Clark. “Library of FT–Raman spectra of pigments, minerals, pigment media and varnishes, and supplement to existing library of Raman spectra of pigments with visible excitation.” Spectrochim. Acta Part A 57 (2001): 1491–1521. [Google Scholar] [CrossRef]
  3. R.J.H. Clark. “Raman Microscopy—Application to the identification of pigments on medieval manuscript.” Chem. Soc. Rev. 24 (1995): 187–196. [Google Scholar] [CrossRef]
  4. P. Colomban. Chemistry and the Heritage—From the Arts Chimiques to the Chemistry of Arts—The Destructive/Non–destructive Analysis Techniques of Enamelled Pottery and Glass Artefacts and Associated Pigments Chemistry for the XXI Century. Edited by J. Livage and F. Rochetm. Berlin: Springer Verlag, in press.
  5. S. Saverwyns. “Russian avant–garde … or not? A micro–Raman spectroscopy of six paintings attributed to Liubov Popovastudy.” J. Raman Spectrosc. 41 (2010): 1525–1532. [Google Scholar] [CrossRef]
  6. M.C. Caggiani, and P. Colomban. “Testing of Raman spectroscopy as a non–invasive tool for the investigation of glass–protected pastels.” J. Raman Spectrosc. 42 (2011): 790–798. [Google Scholar] [CrossRef]
  7. P. Vandenabeele, L. Moens, H.G.M. Edwards, and R. Dams. “Raman Spectroscopic Database of azo–pigments and application to modern art studies.” J. Raman Spectrosc. 31 (2000): 509–517. [Google Scholar] [CrossRef]
  8. F. Casadio, M. Leona, J.R. Lombardi, and R. van Dyune. “Identification of organic colorants in fibers, paints and glazes by Surface enhanced spectroscopy.” Acc. Chem. Res. 43 (2010): 782–791. [Google Scholar] [CrossRef]
  9. K.L. Wustholz, C.L. Brosseau, F. Casadio, and R. van Duyne. “Surface–enhanced Raman spectroscopy of dyes: From single molecules to the artists’ canvas.” Phys. Chem. Chem. Phys. 11 (2009): 7350–7359. [Google Scholar]
  10. F. Schulte, K.W. Brzezinka, K. Lutzenberger, H. Stege, and U. Panne. “Raman spectroscopy of synthetic organic pigments used in 20th century works of art.” J. Raman Spectrosc. 39 (2008): 1455–1463. [Google Scholar]
  11. J. Winter. East Asian Paintings Materials, Structures and Deterioration Mechanismes. London, UK: Archetype, 2008. [Google Scholar]
  12. D. Mancini, A. Tournié, M.C. Caggiani, and P. Colomban. “Testing of Raman spectroscopy as a non–invasive tool for the investigation of glass–protected miniature portraits.” J. Raman Spectrosc. 43 (2012): 294–302. [Google Scholar] [CrossRef]
  13. P. Colomban, G. Sagon, and X. Faurel. “Differentiation of antique ceramics from the Raman spectra of their colored glazes and paintings.” J. Raman Spectrosc. 32 (2001): 351–360. [Google Scholar] [CrossRef]
  14. P. Ricciardi, P. Colomban, A. Tournié, and V. Milande. “Non–destructive on–site identification of ancient glasses: Genuine artefacts, embellished pieces or forgeries? ” J. Raman Spectrosc. 40 (2009): 604–617. [Google Scholar] [CrossRef]
  15. K. Sakellariou, C. Miliani, A. Morresi, and M. Ombelli. “Spectroscopic investigation of yellow majolica glazes.” J. Raman Spectrosc. 35 (2004): 61–67. [Google Scholar] [CrossRef]
  16. P. Colomban. “On–site Raman identification and dating of ancient glasses: Procedures and tools.” J. Cult. Herit. 9 (2008): e55–e60. [Google Scholar] [CrossRef]
  17. P. Colomban, A. Tournié, M. Maucuer, and P. Meynard. “On–site Raman and XRF analysis of Japanese/Chinese Bronze/Brass Patina—The search of specific Raman signatures.” J. Raman Spectrosc. 43 (2012): 799–808. [Google Scholar] [CrossRef]
  18. P. Colomban, A. Tournié, and L. Bellot–Gurlet. “Raman Identification of glassy silicates used in ceramic, glass and jewellry: A tentative differentiation guide.” J. Raman Spectrosc. 37 (2006): 841–852. [Google Scholar] [CrossRef]
  19. P. Colomban. “The on–site/remote Raman analysis with portable instruments—A review of drawbacks and success in Cultural Heritage studies and other associated fields.” J. Raman Spectrosc. 43 (2012): 1529–1535. [Google Scholar] [CrossRef]
  20. P. Colomban. “Analyses Non–destructives des Objets d'art par Méthodes Portables.” in Techniques de l'Ingénieur, RE 217. Paris; 2012. Available online: http://www.techniques-ingenieur.fr/base-documentaire/innovations-th10/innovations-en-analyses-et-mesures-42112210/analyse-non-destructive-des-objets-d-art-par-methodes-spectroscopiques-portables-re217 (accessed on 8th July 2013).
  21. T. Honda, R. Lu, R. Sakai, T. Ishimura, and T. Miyakoshi. “Characterization and comparison of Asian lacquer saps.” Progr. Organ. Coatings 61 (2008): 68–75. [Google Scholar] [CrossRef]
  22. N. Niimura. “Determination of the type of lacquer on East Asian lacquer ware.” Int. J. Mass Spectrom. 284 (2009): 93–97. [Google Scholar] [CrossRef]
  23. J.C. Frade, M.I. Ribeiro , J. Graça, and J. Rodrigues. “Applying pyrolysis–gas chromatography/mass spectrometry to the identification of oriental lacquers: Study of two lacquered shields.” Anal. Bioanal. Chem. 395 (2009): 2167–2174. [Google Scholar] [CrossRef]
  24. N. Niimura, and T. Miyakoshi. “Structural studies of oriental lacquer films during the hardning process.” Talanta 70 (2006): 146–152. [Google Scholar] [CrossRef]
  25. T. Li, Y.-F. Xie, Y.-M. Yang, C.-S. Wang, X.-Y. Fang, J.-L. Shi, and Q.-J. He. “Pigment identification and decoration analysis of a 5th century Chinese lacquer painting lacquer screen: A micro Raman and FTIR study.” J. Raman Spectrosc. 40 (2009): 1911–1918. [Google Scholar] [CrossRef]
  26. P.-J. Jin, Z.-Q. Yao, M.-L. Zhang, Y.-H. Li, and H.-P. Xing. “A pigment (CuS) identified by micro-Raman spectroscopy on a Chinese funerary lacquer ware of West Han Dynasty.” J. Raman Spectrosc. 41 (2010): 222–225. [Google Scholar]
  27. S. Wei, V. Pintus, V. Pitthard, M. Schreiner, and G. Song. “Analytical characterization of lacquer objects excavated from a Chu tomb in China.” J. Archaeol. Sci. 38 (2011): 2667–2674. [Google Scholar]
  28. V. Pitthard, S. Wei, S. Miklin-Kniefacz, S. Stanek, M. Griesser, and M. Schreiner. “Scientific investigation of antique lacquers from a 17th century Japanese ornamental cabinet.” Archaeometry 52 (2010): 1044–1056. [Google Scholar]
  29. K. Hatada, T. Kitayama, T. Nishiura, A. Nishimoto, W.J. Simonsick, and O. Vogl. “Structural analysis of the component of Chinese lacquer Kuro–Urushi.” Macromol. Chem. Phys. 5 (1994): 1865–1870. [Google Scholar]
  30. T. Honda, R. Lu, N. Kitano, Y. Kamiya, and T. Miyakoshi. “Applied analysis and identification of ancient lacquer based on pyrolysis–gas chromatography/mass spectrometry.” J. Appl. Polymer Sci. 2 (2010): 897. [Google Scholar]
  31. N. André–Pallois. “L’Indochine: Un lieu d'échange culturel? ” Monographies n° 184; de L'Ecole Française d'Extrême Orient, Paris, 1997. [Google Scholar]
  32. J.-F. Hubert. L'Âme du Viêt Nam. Paris, France: Cercle d'Art, 1996. [Google Scholar]
  33. E. Daydé, N. André–Pallois, C. de Ménonville, D.P. Quynh, N. Trung, and P. Jorland. Paris–Hanoi–Saigon, L'Aventure de l'Art Moderne au Viêt Nam. PARIS musées, 1998. [Google Scholar]
  34. T.V. Can. Lacquer Paintings of Viet Nam. Hanoi, Vietnam: Foreign Languages Publishing House, 1977. [Google Scholar]
  35. “Raman Spectroscopic library. ” Available online: www.chem.ucl.ac.uk/ resources/raman/index.html (accessed on day June 2012).