Experimental Evaluation of the Ventilation Effectiveness of Corner Stratum Ventilation in an Office Environment


Abstract
:1. Introduction
- To conduct experimental study involving the tracer gas technique in order to determine different ventilation effectiveness indices: local air change index, air exchange efficiency and temperature effectiveness.
- To carry out measurements of the air velocity and temperature in the office room in order to determine the thermal comfort conditions.
- To conduct flow visualization to ascertain the airflow pattern in the office room.
2. Theory and Mathematical Models
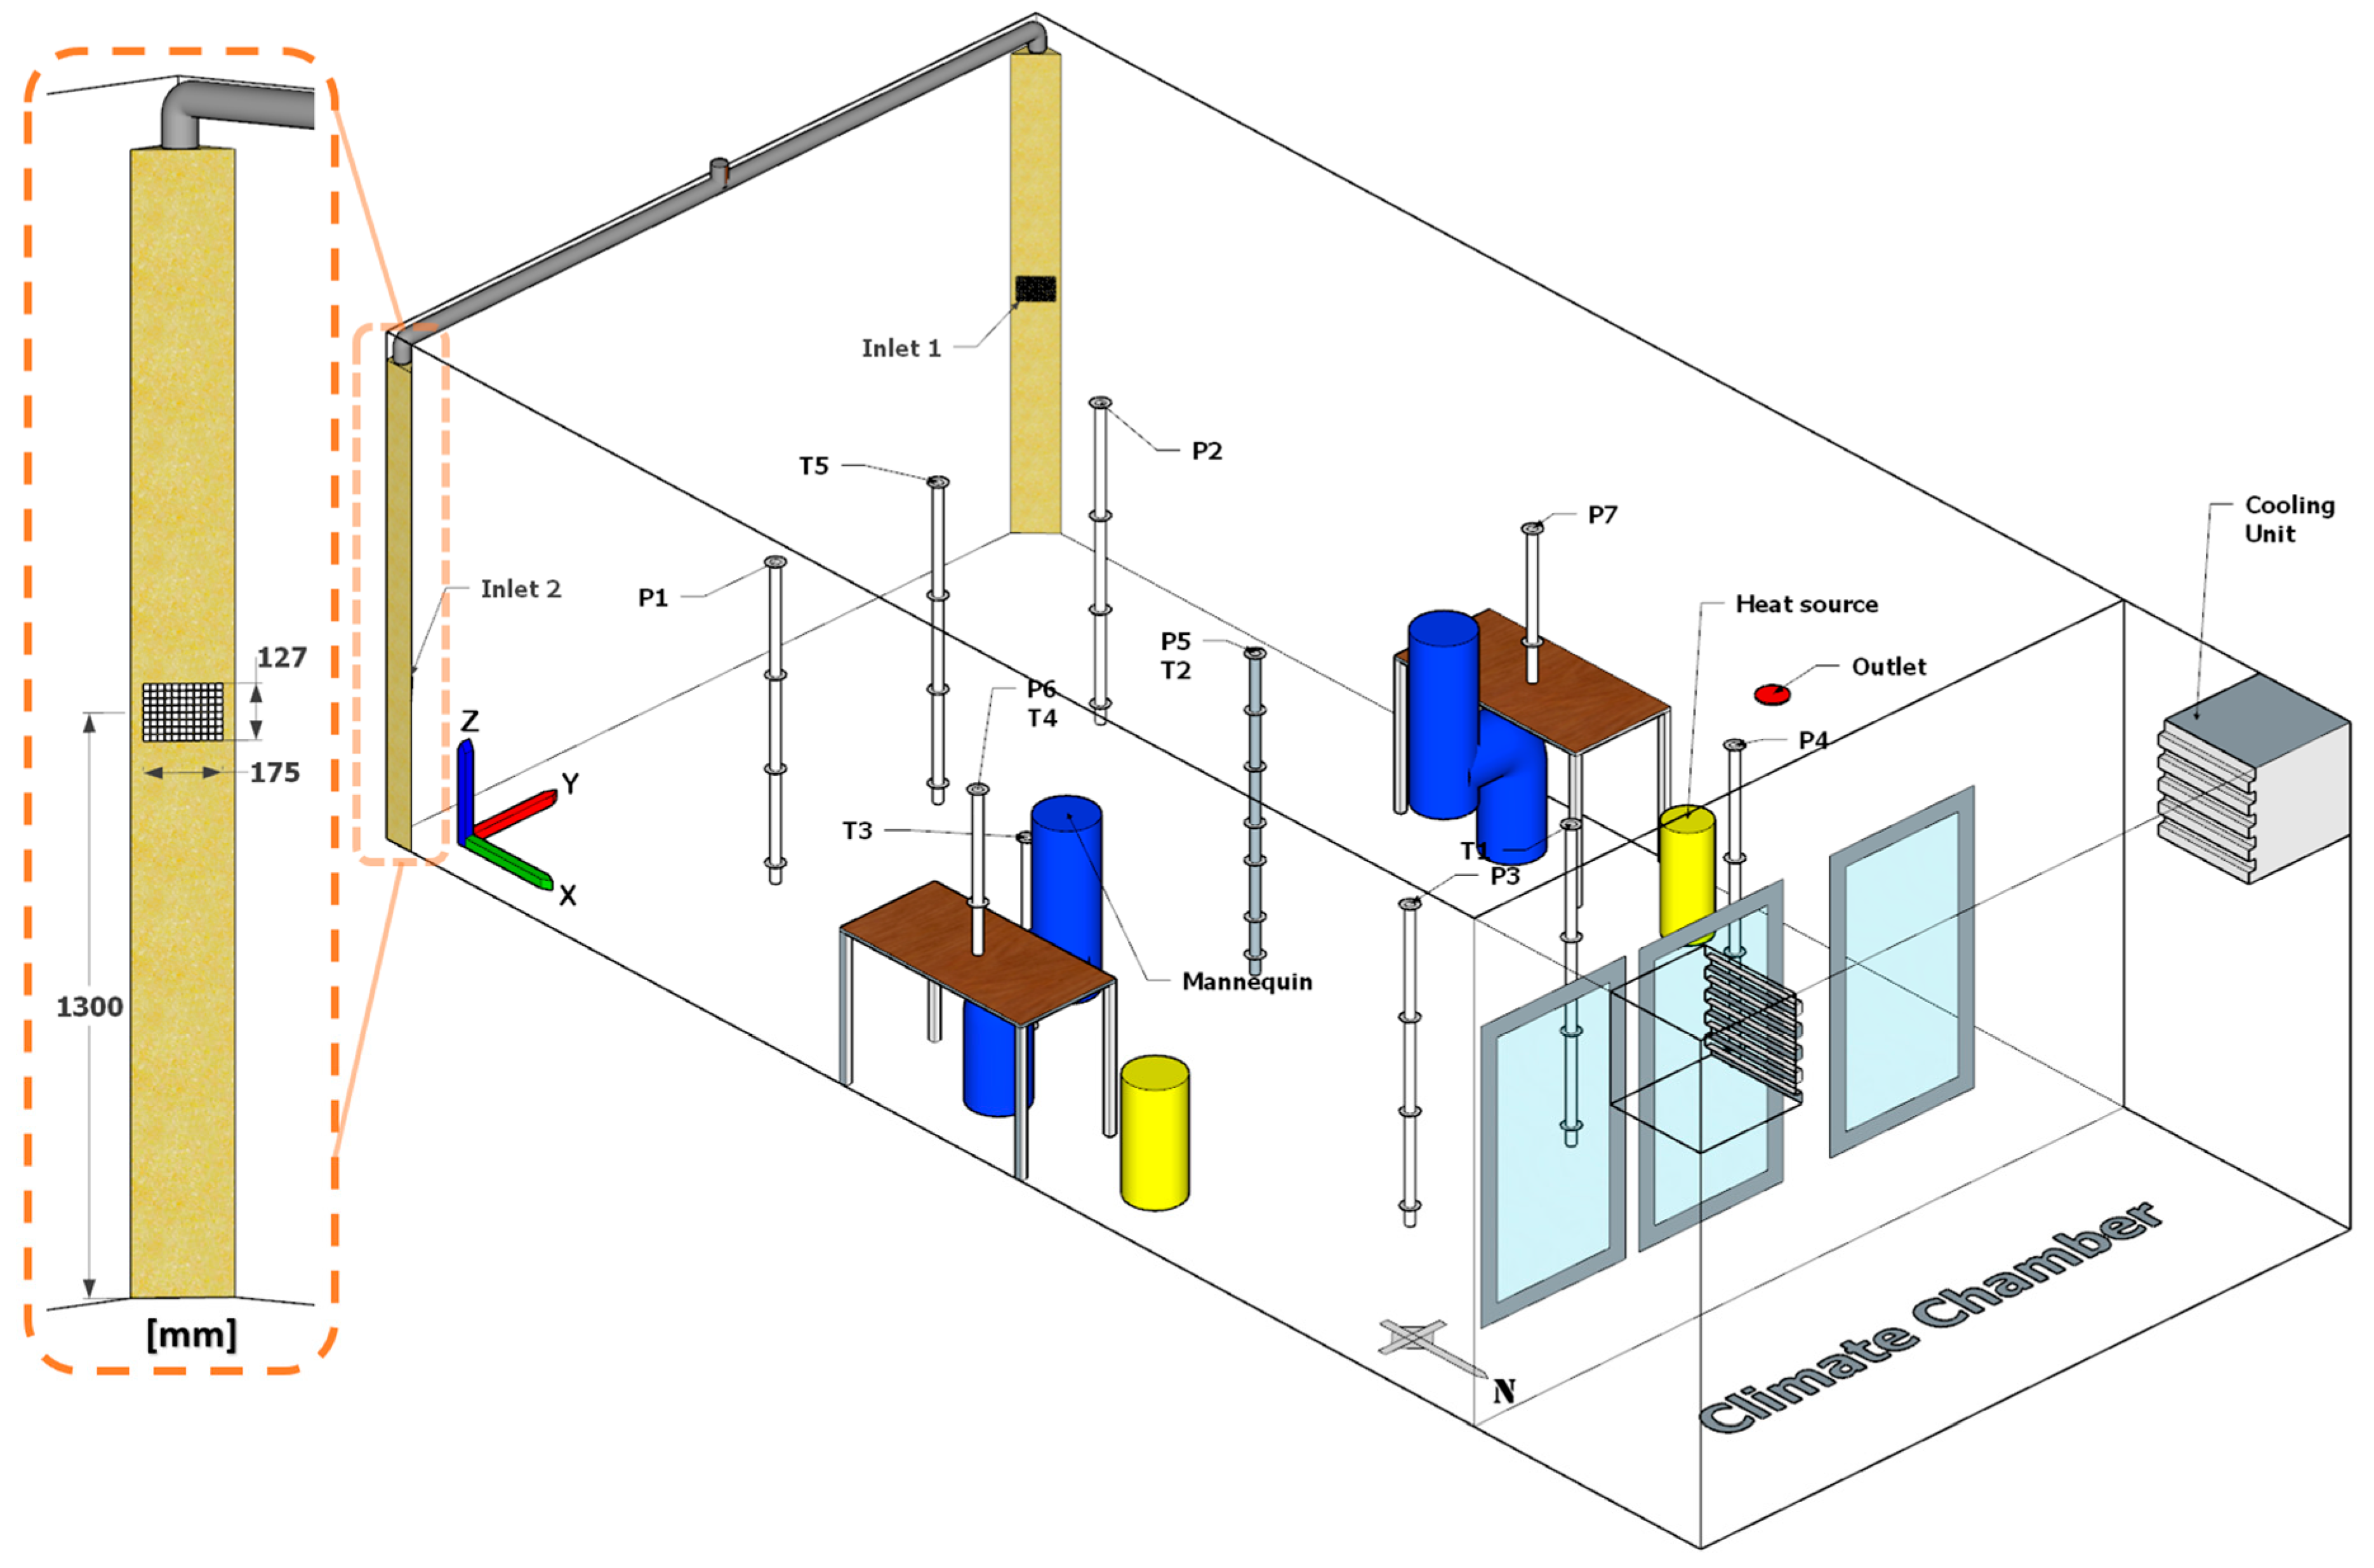
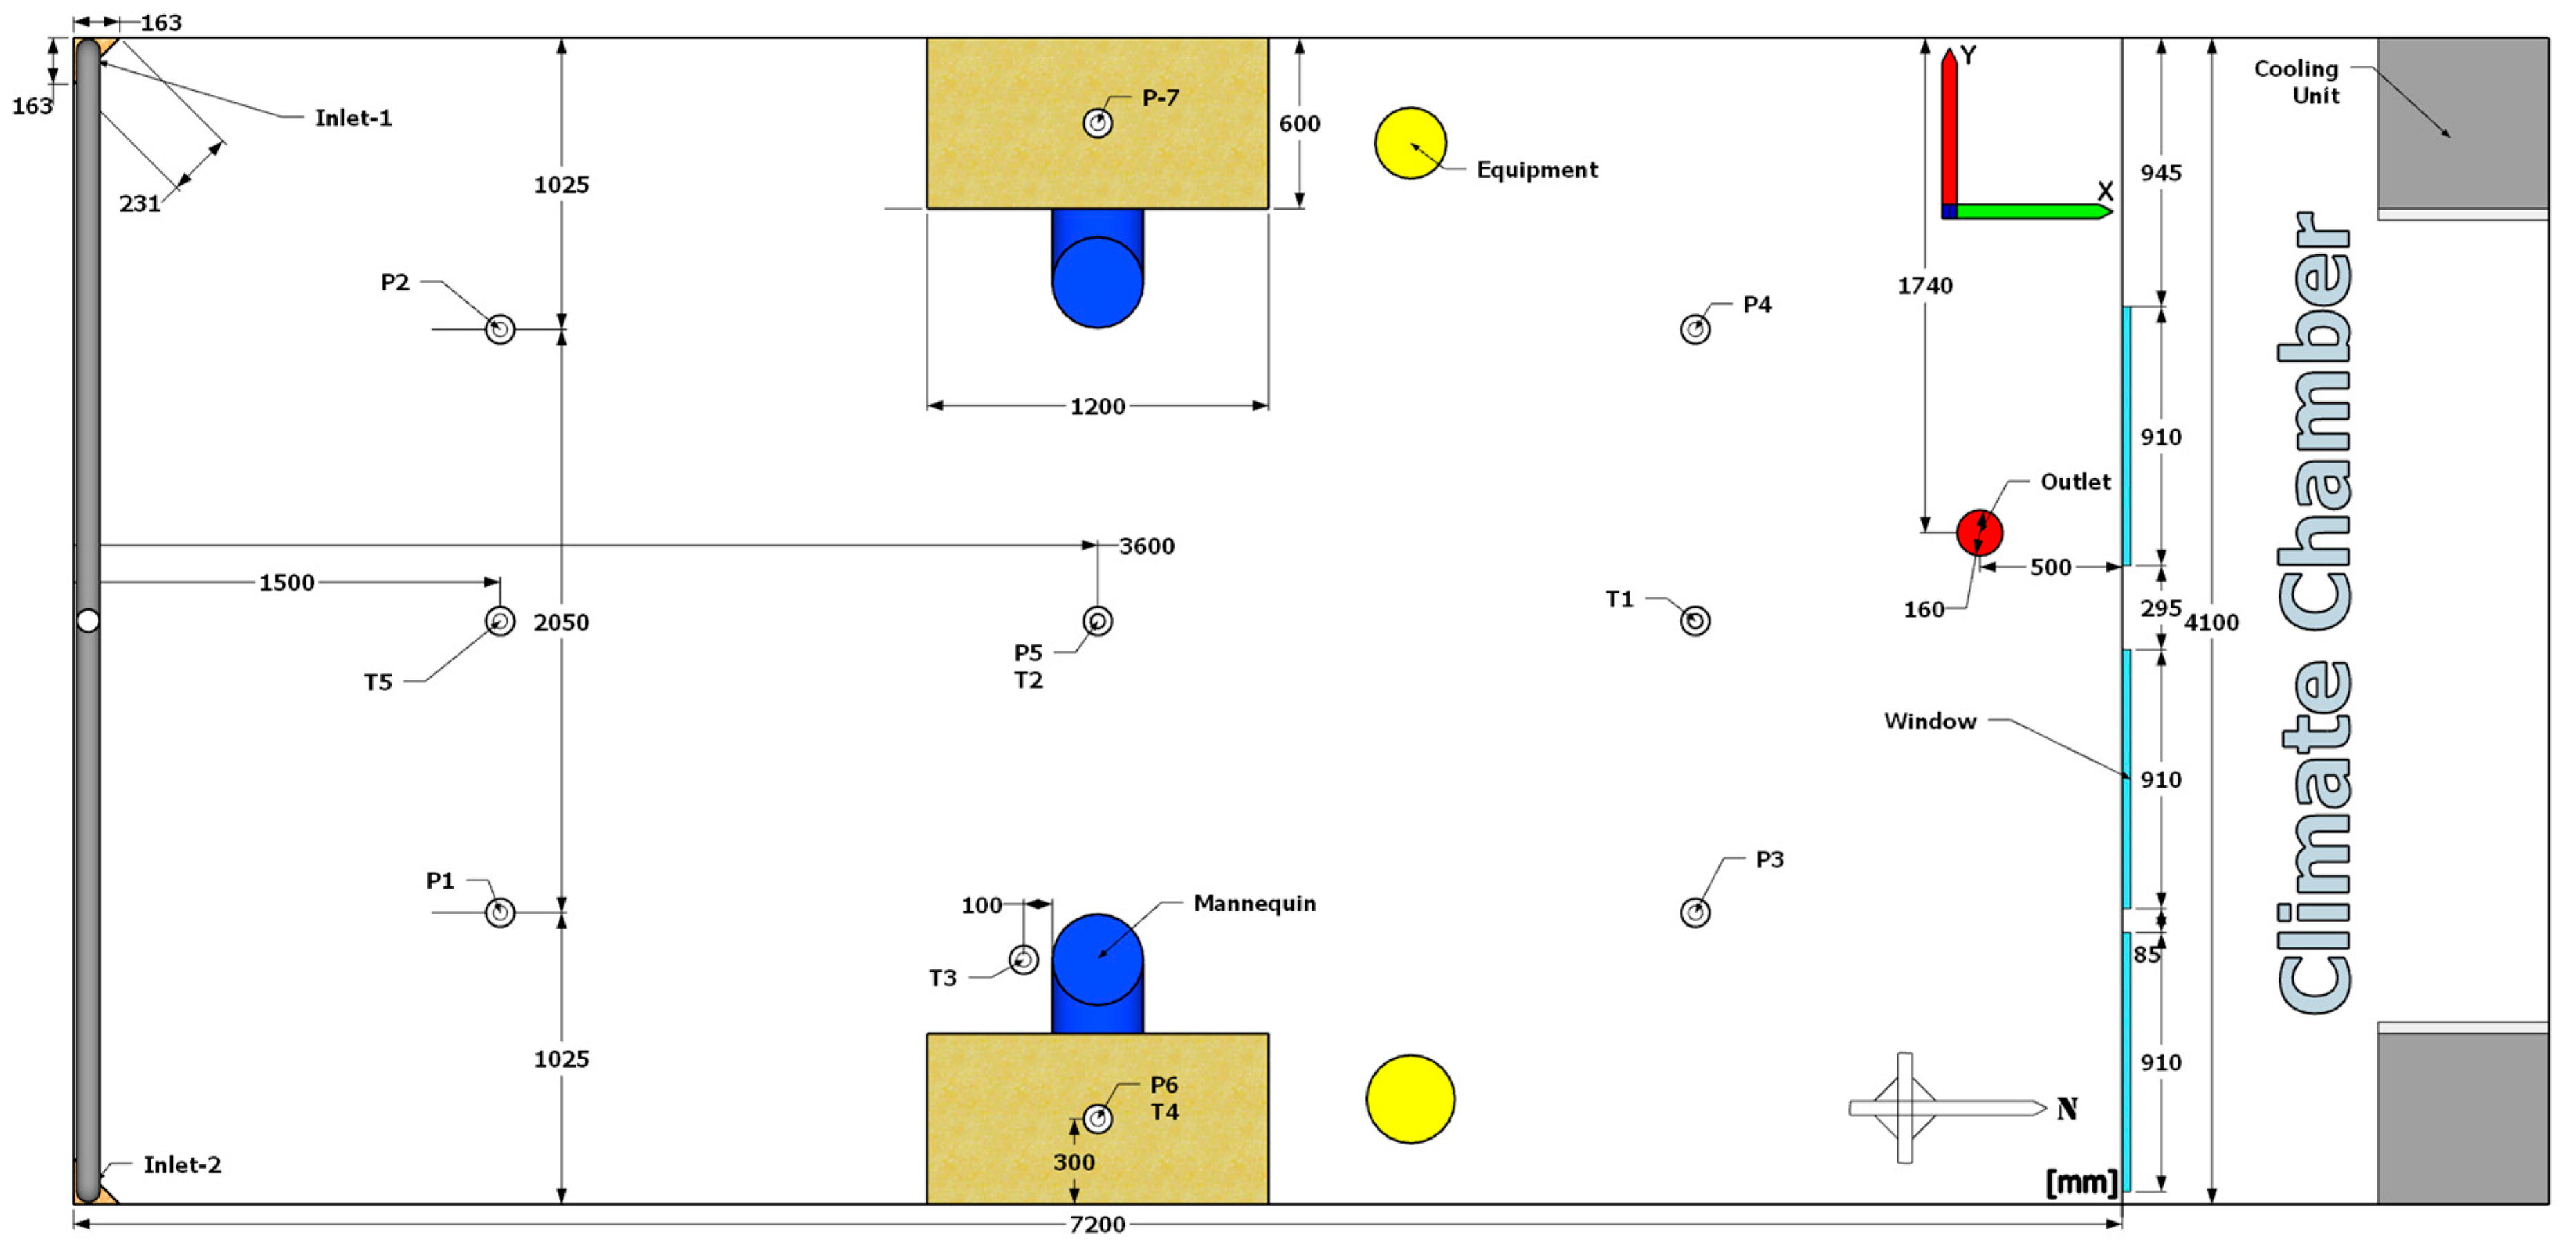
3. Experimental Set-up and Procedure
4. Results and Discussion
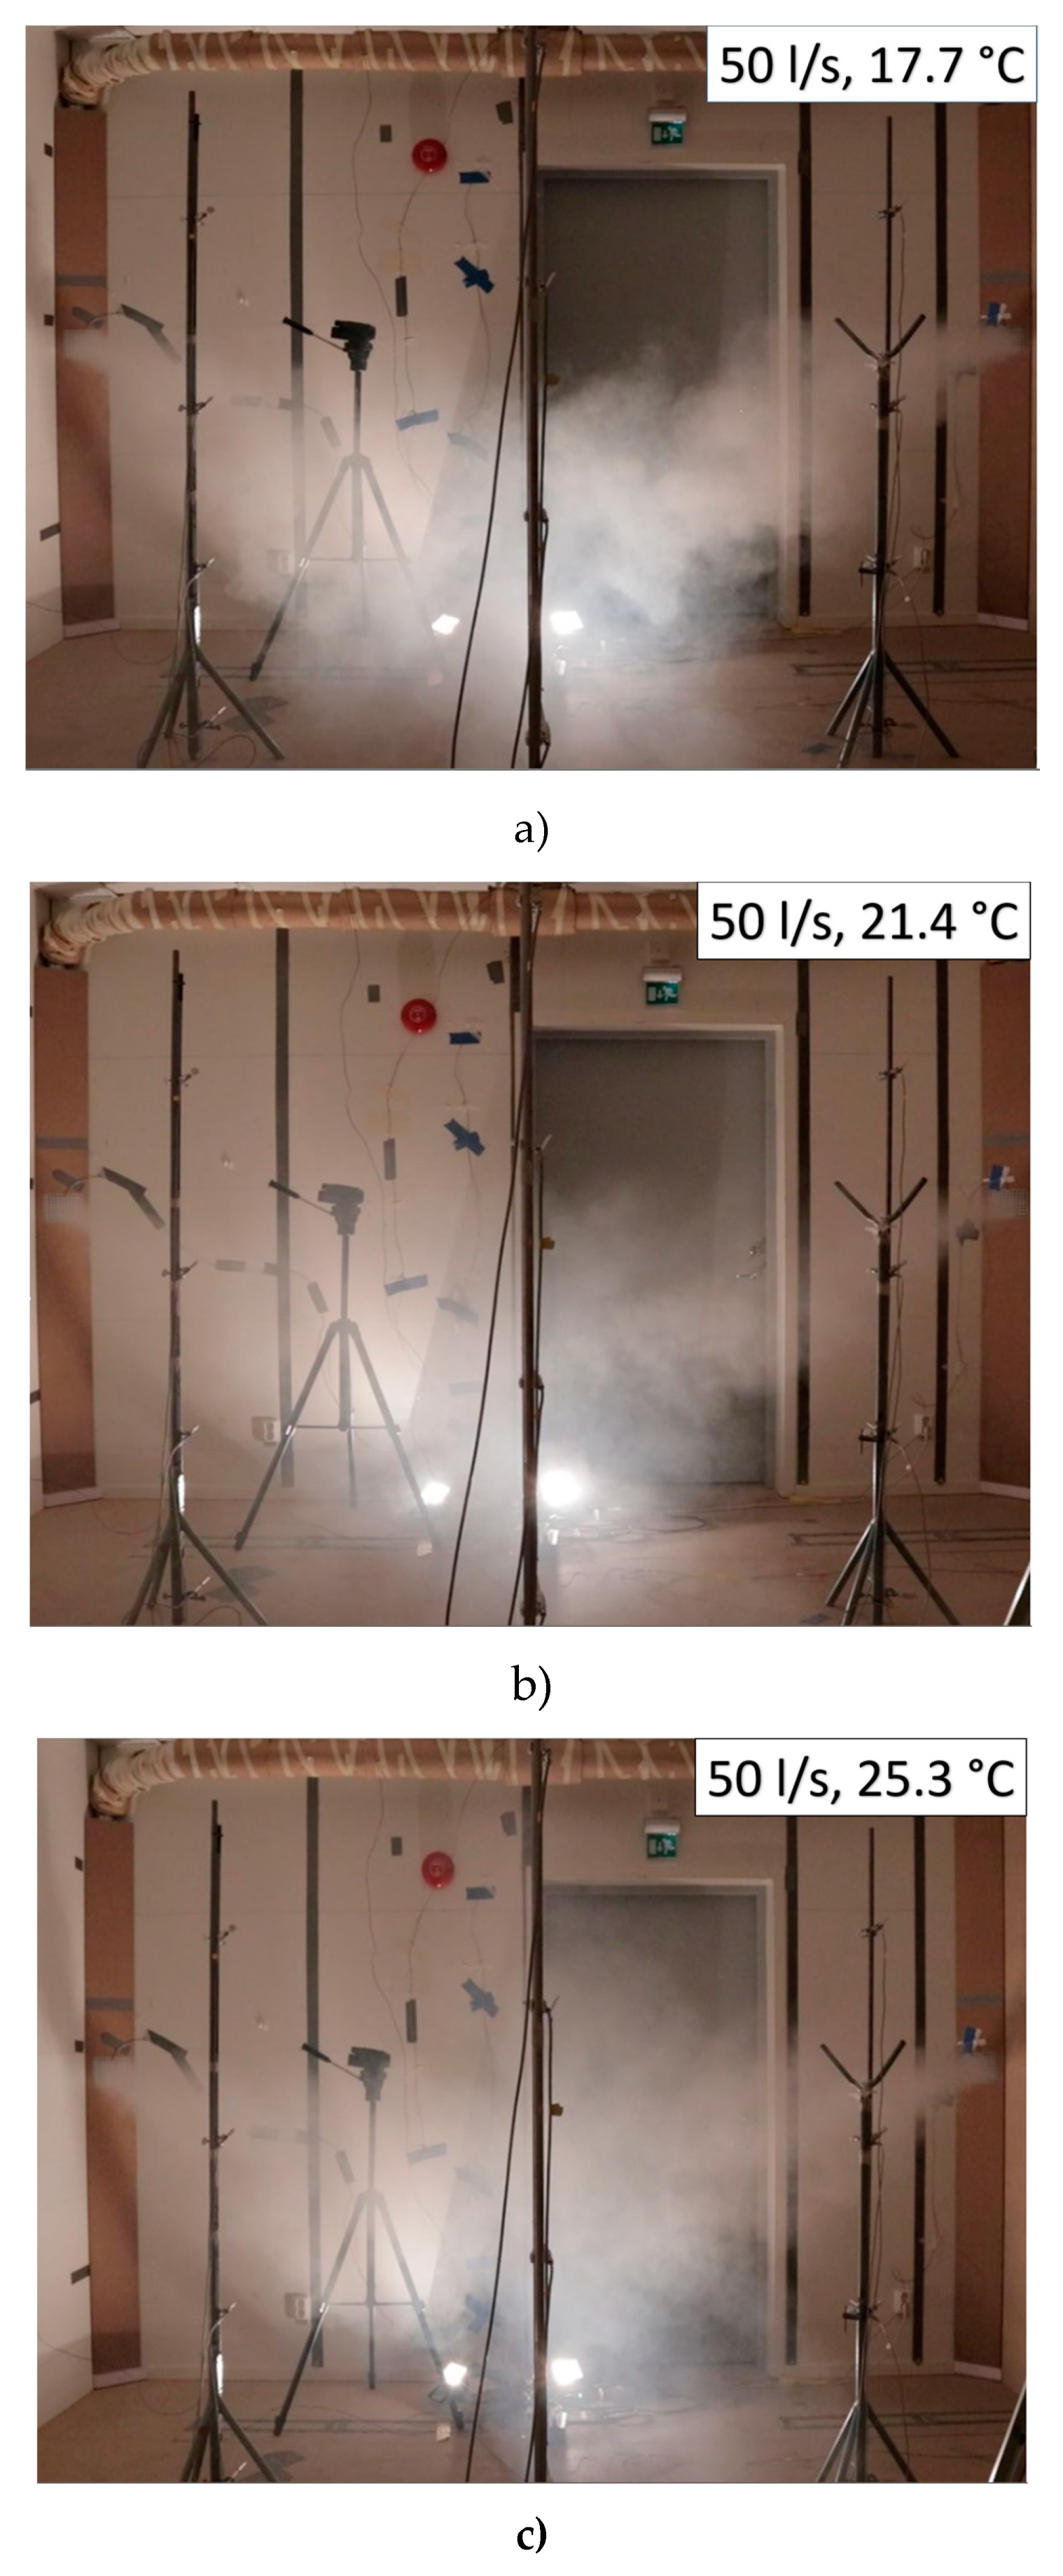
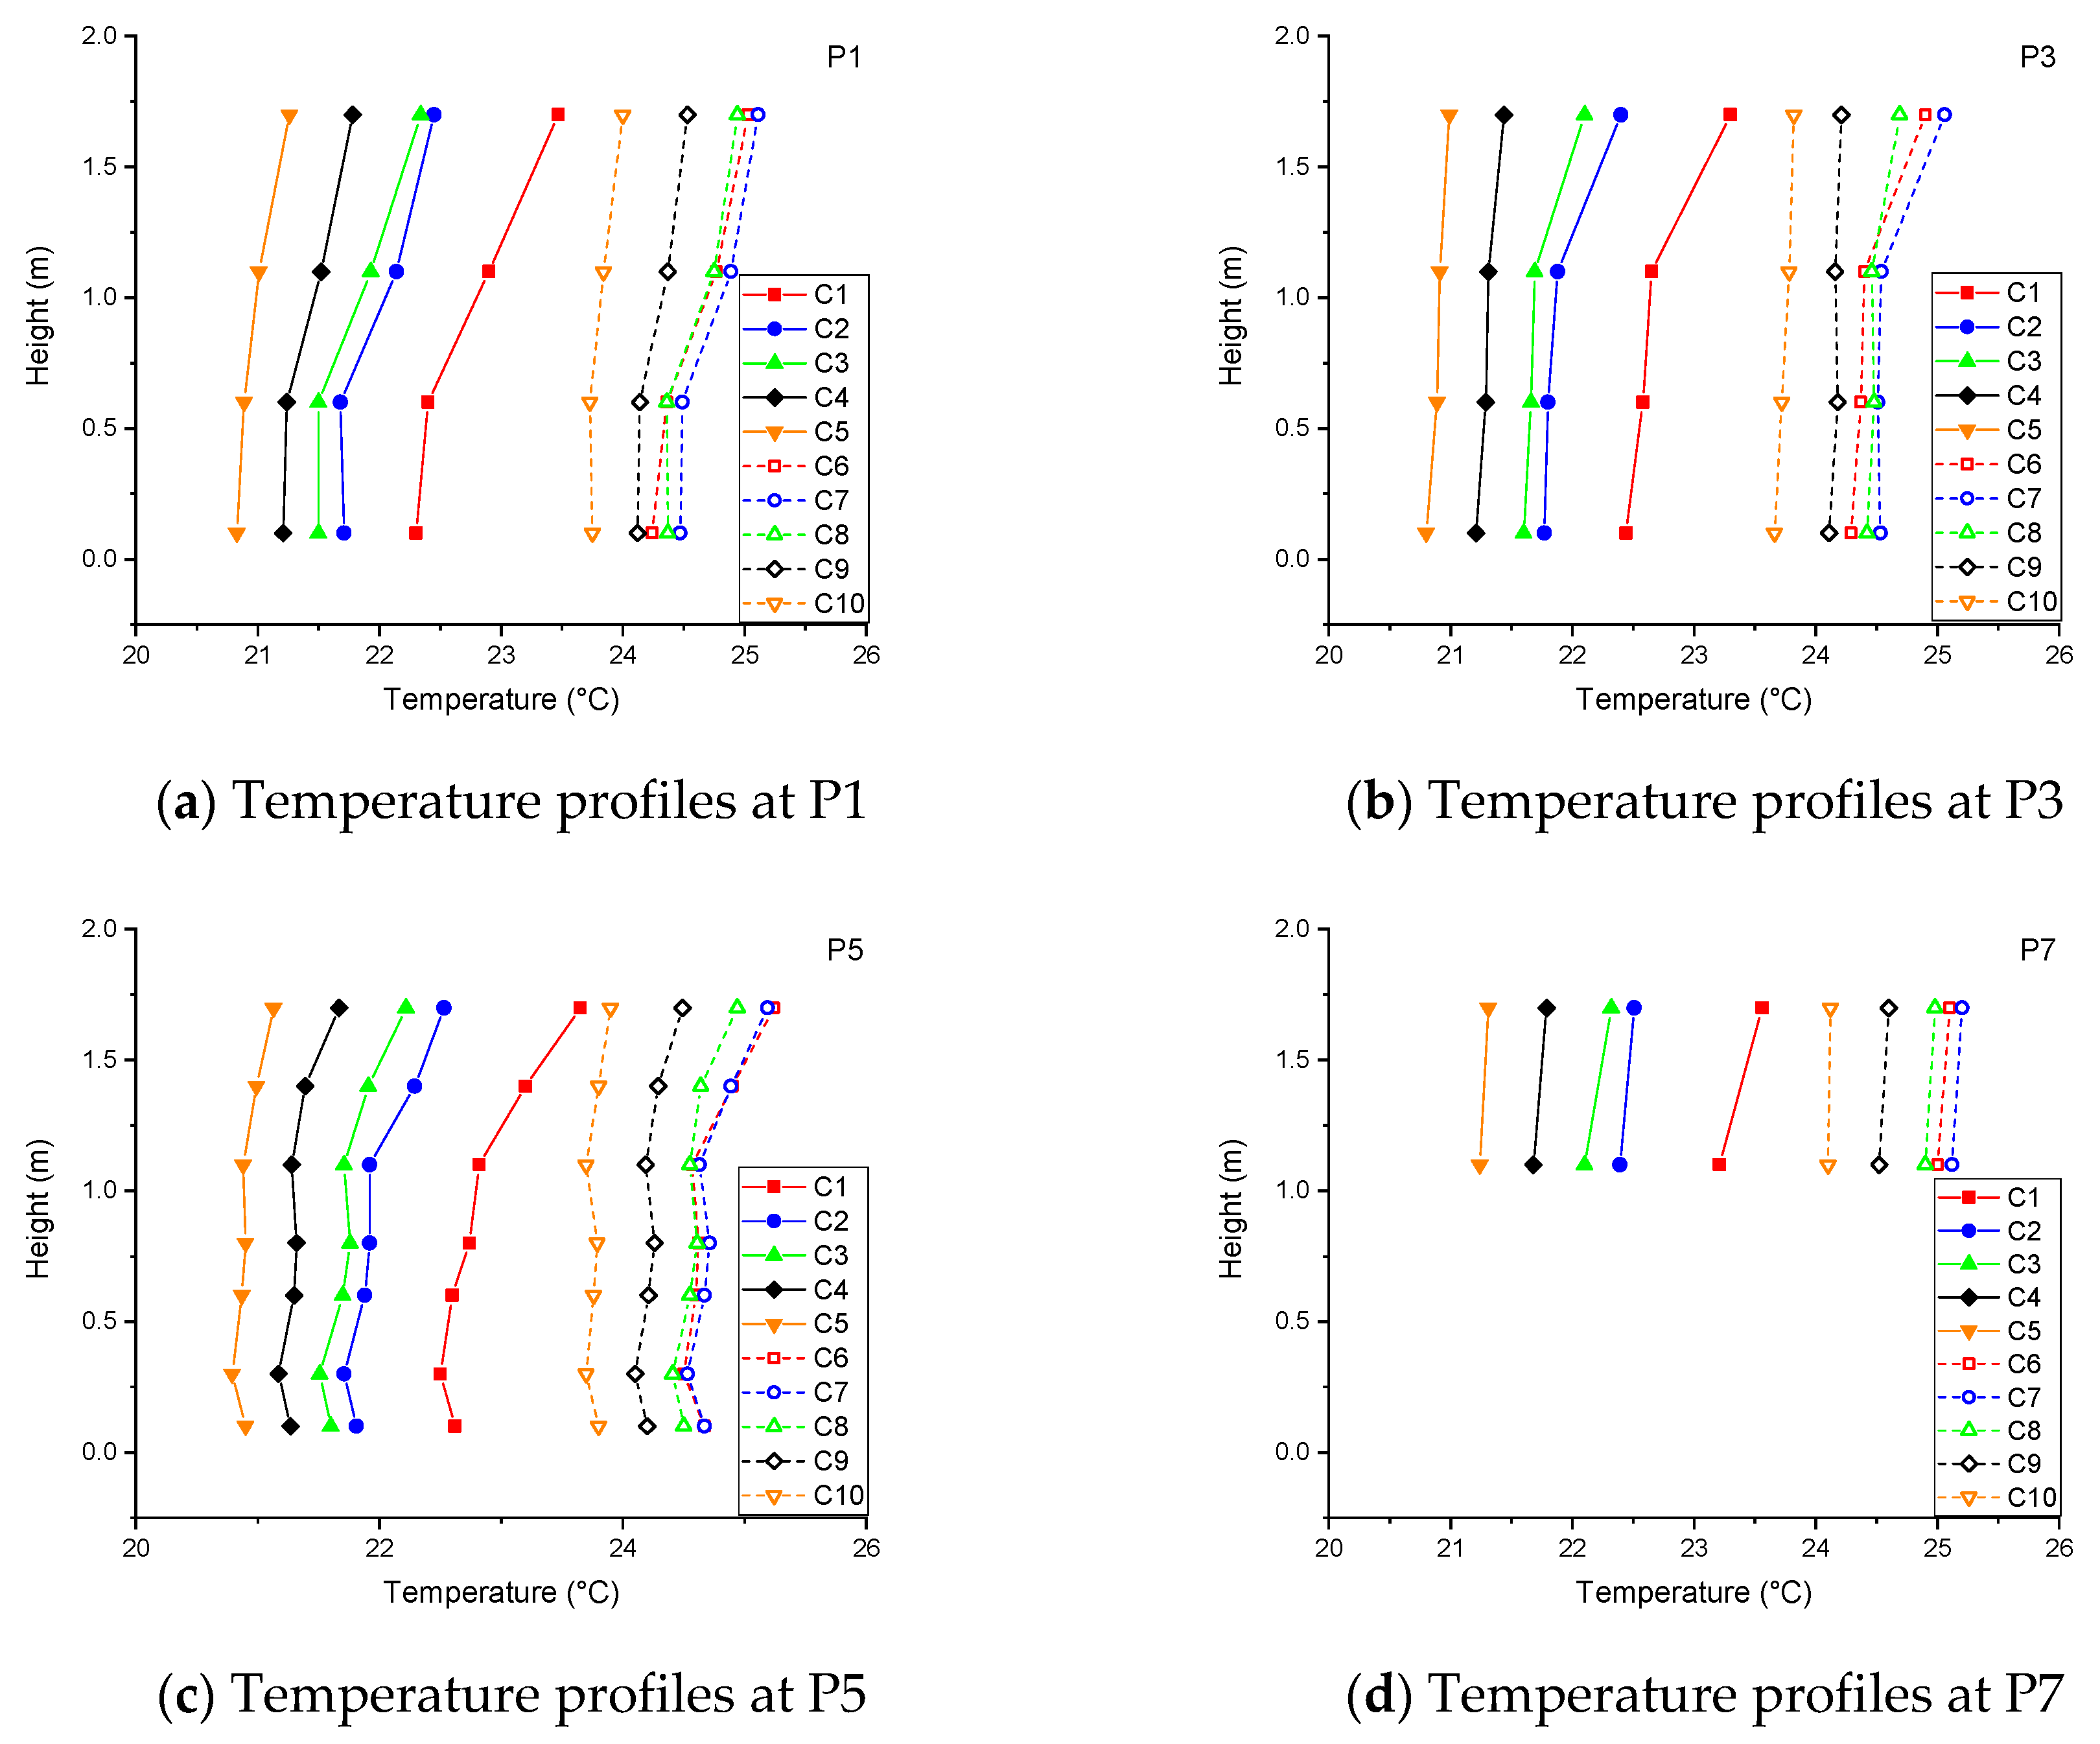
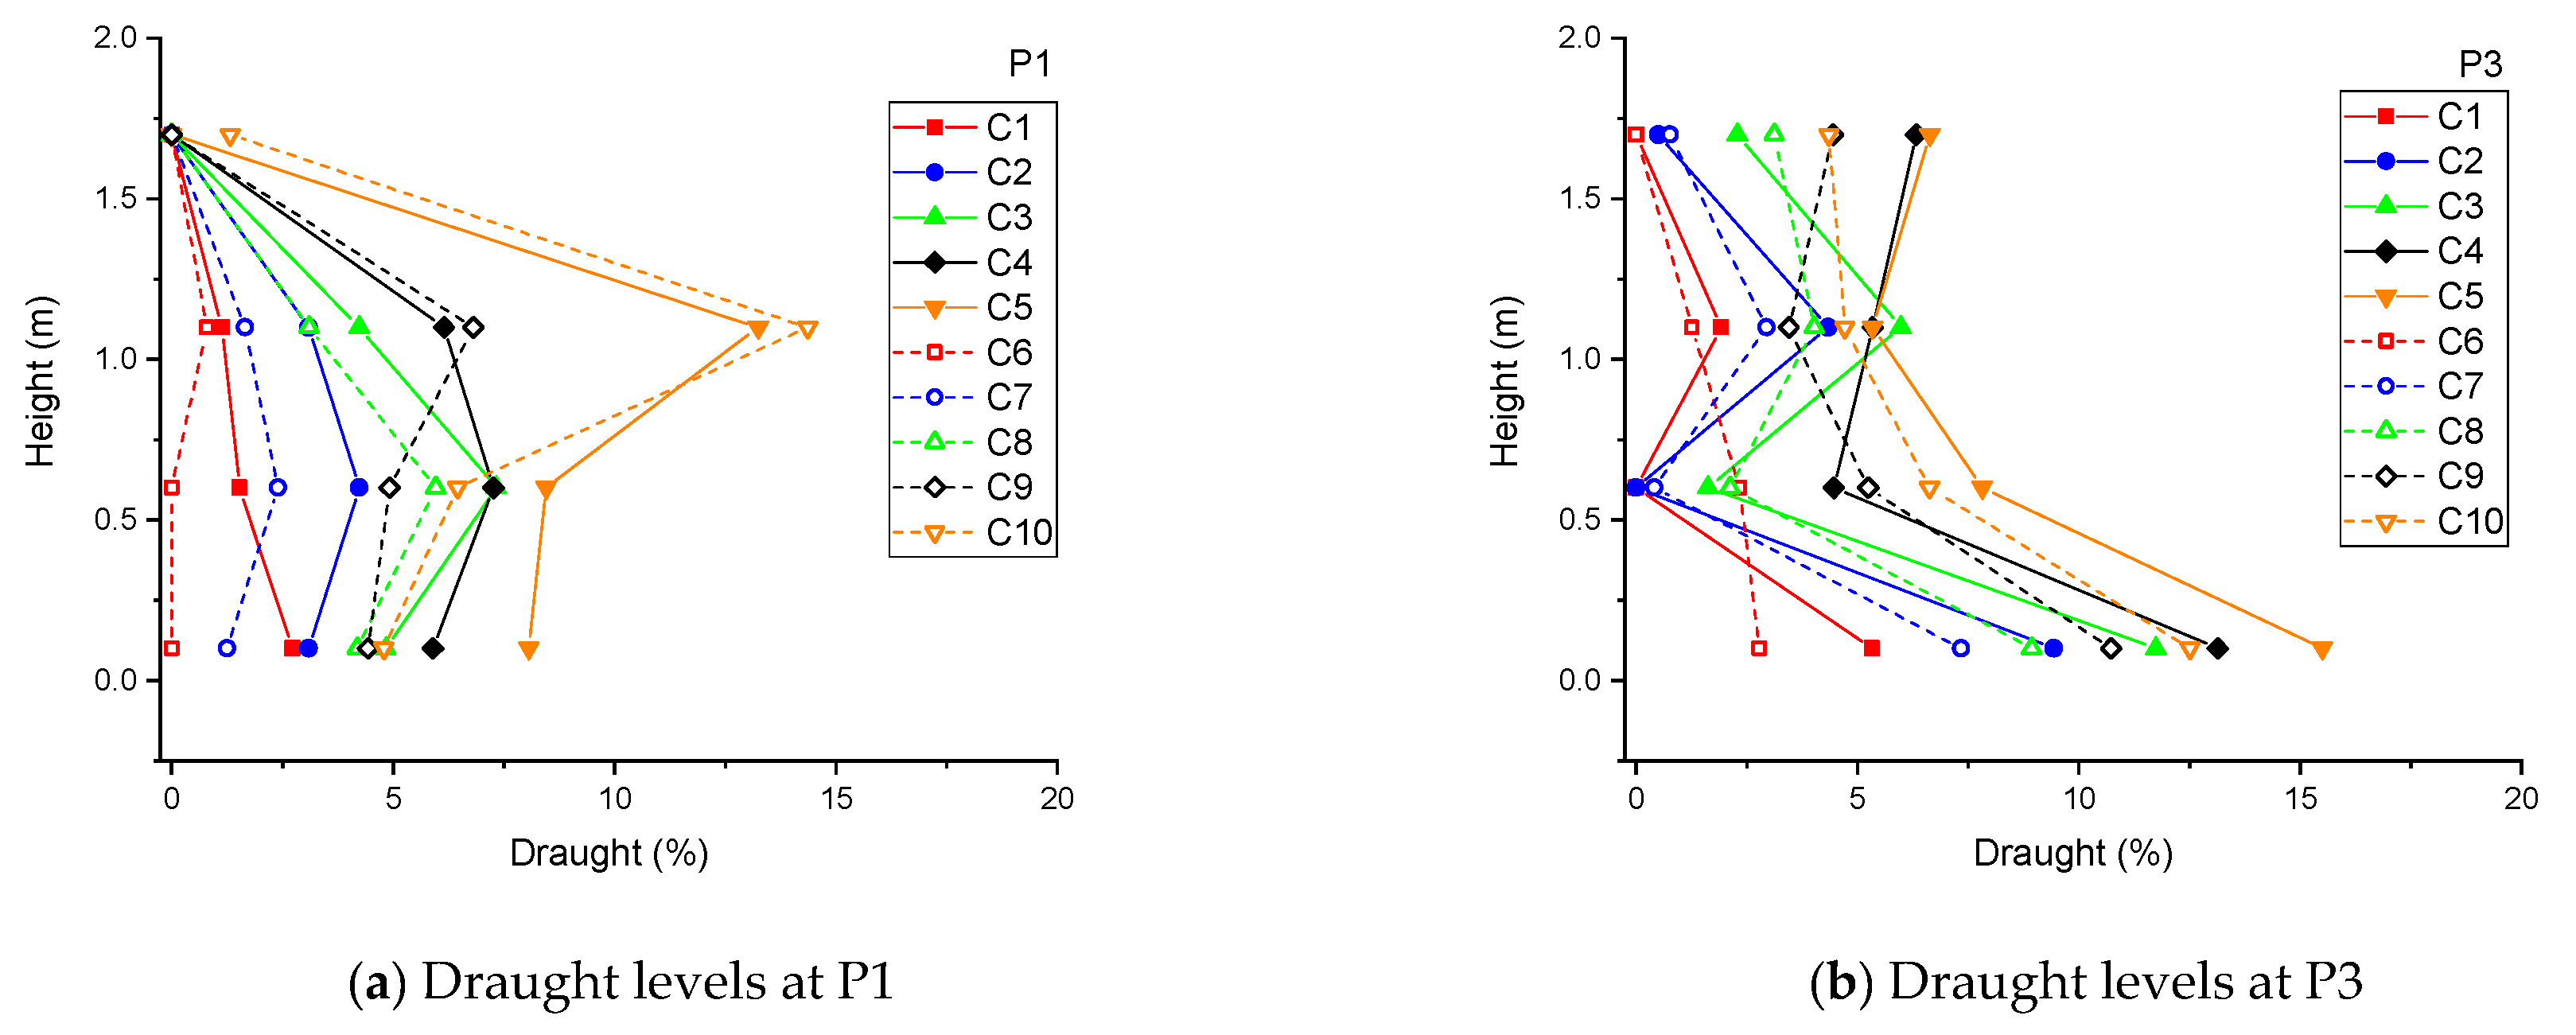
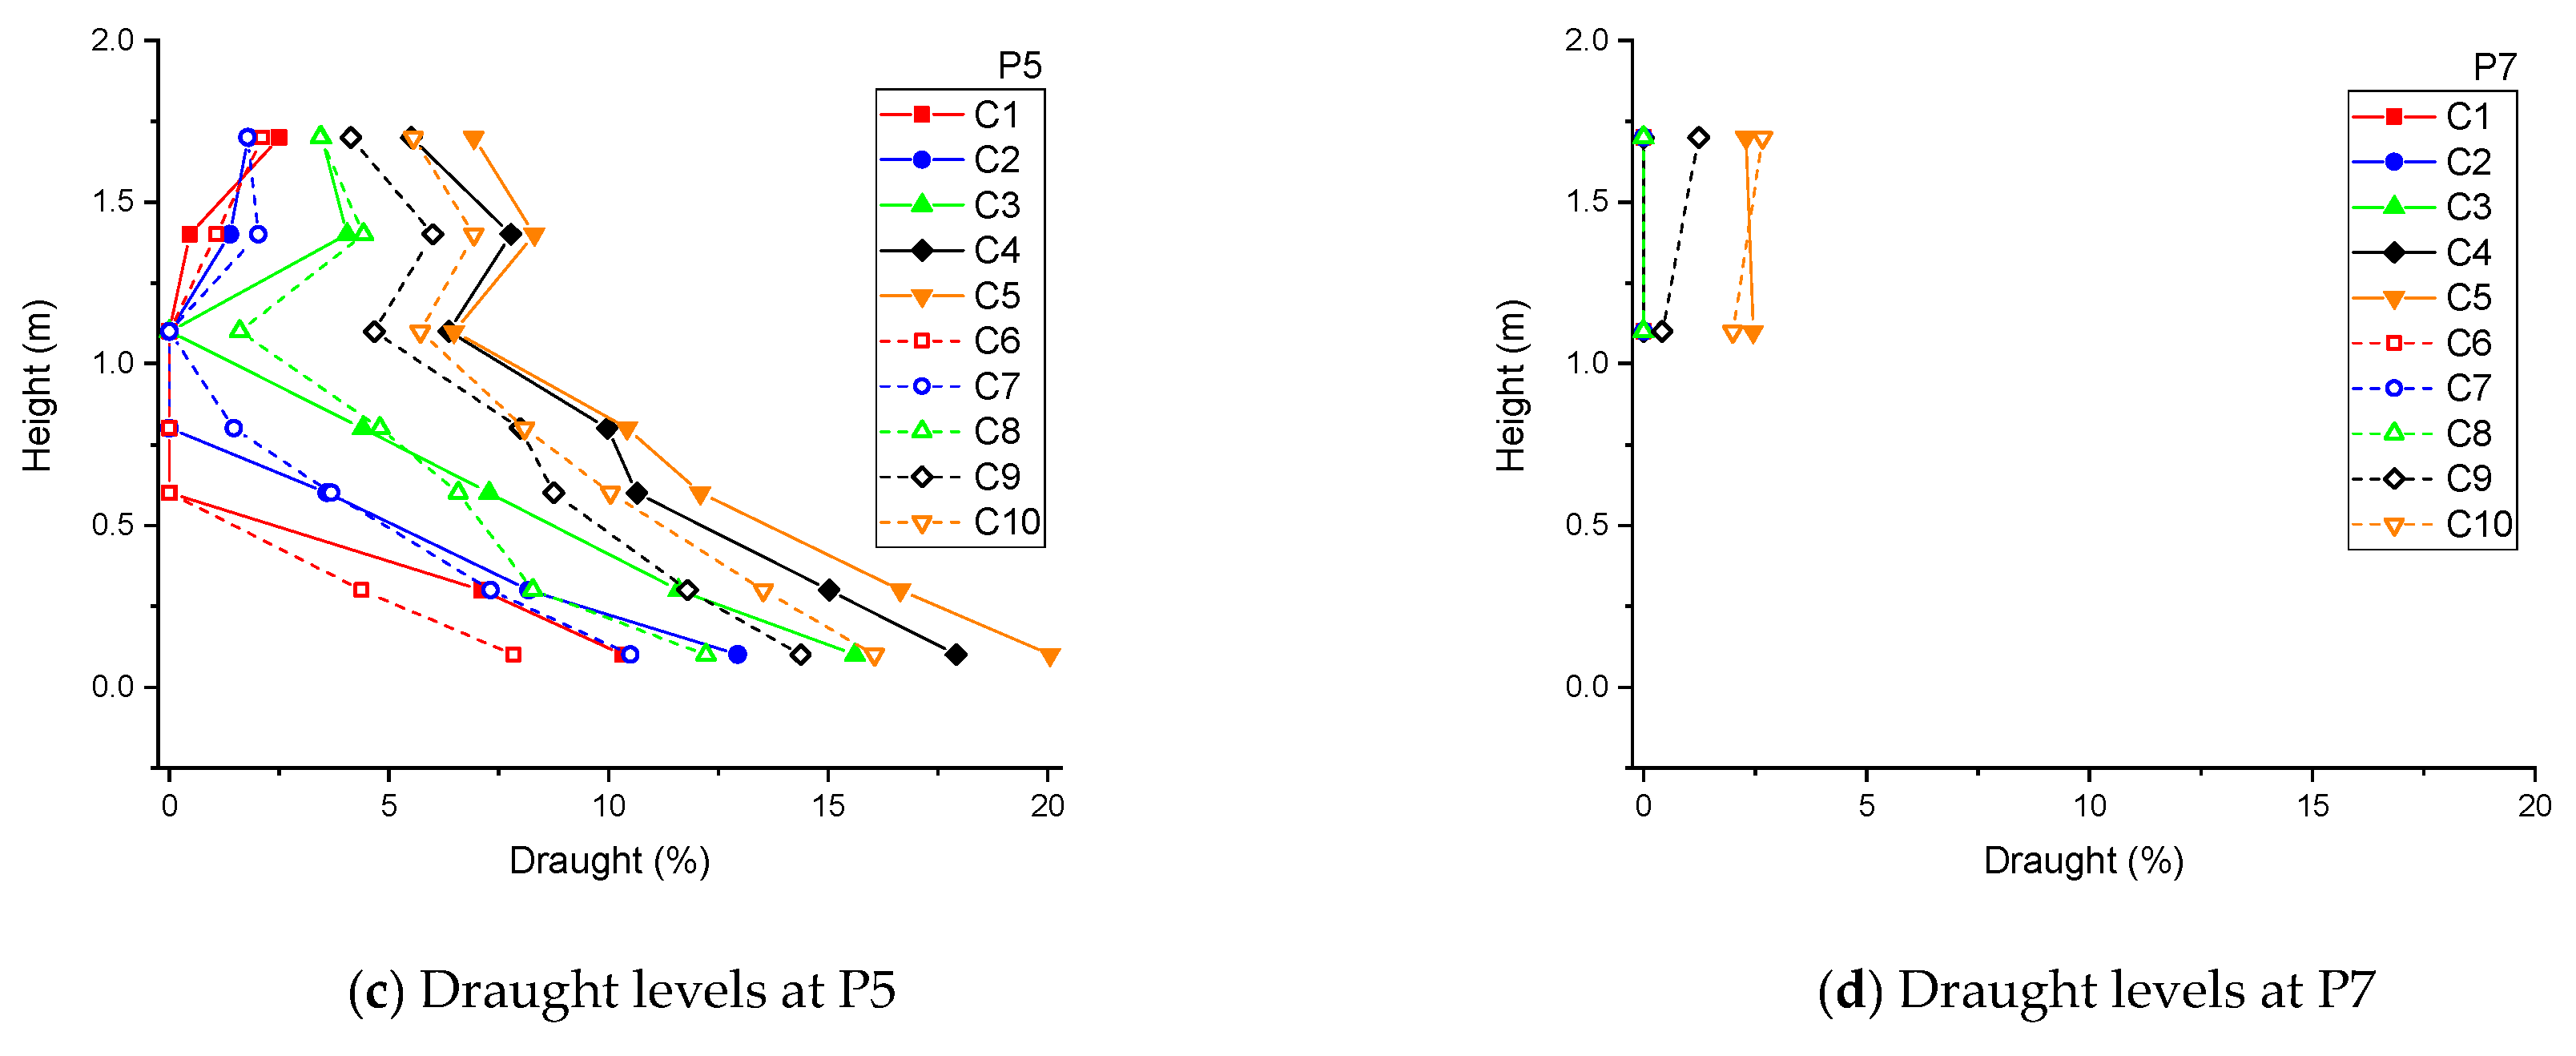
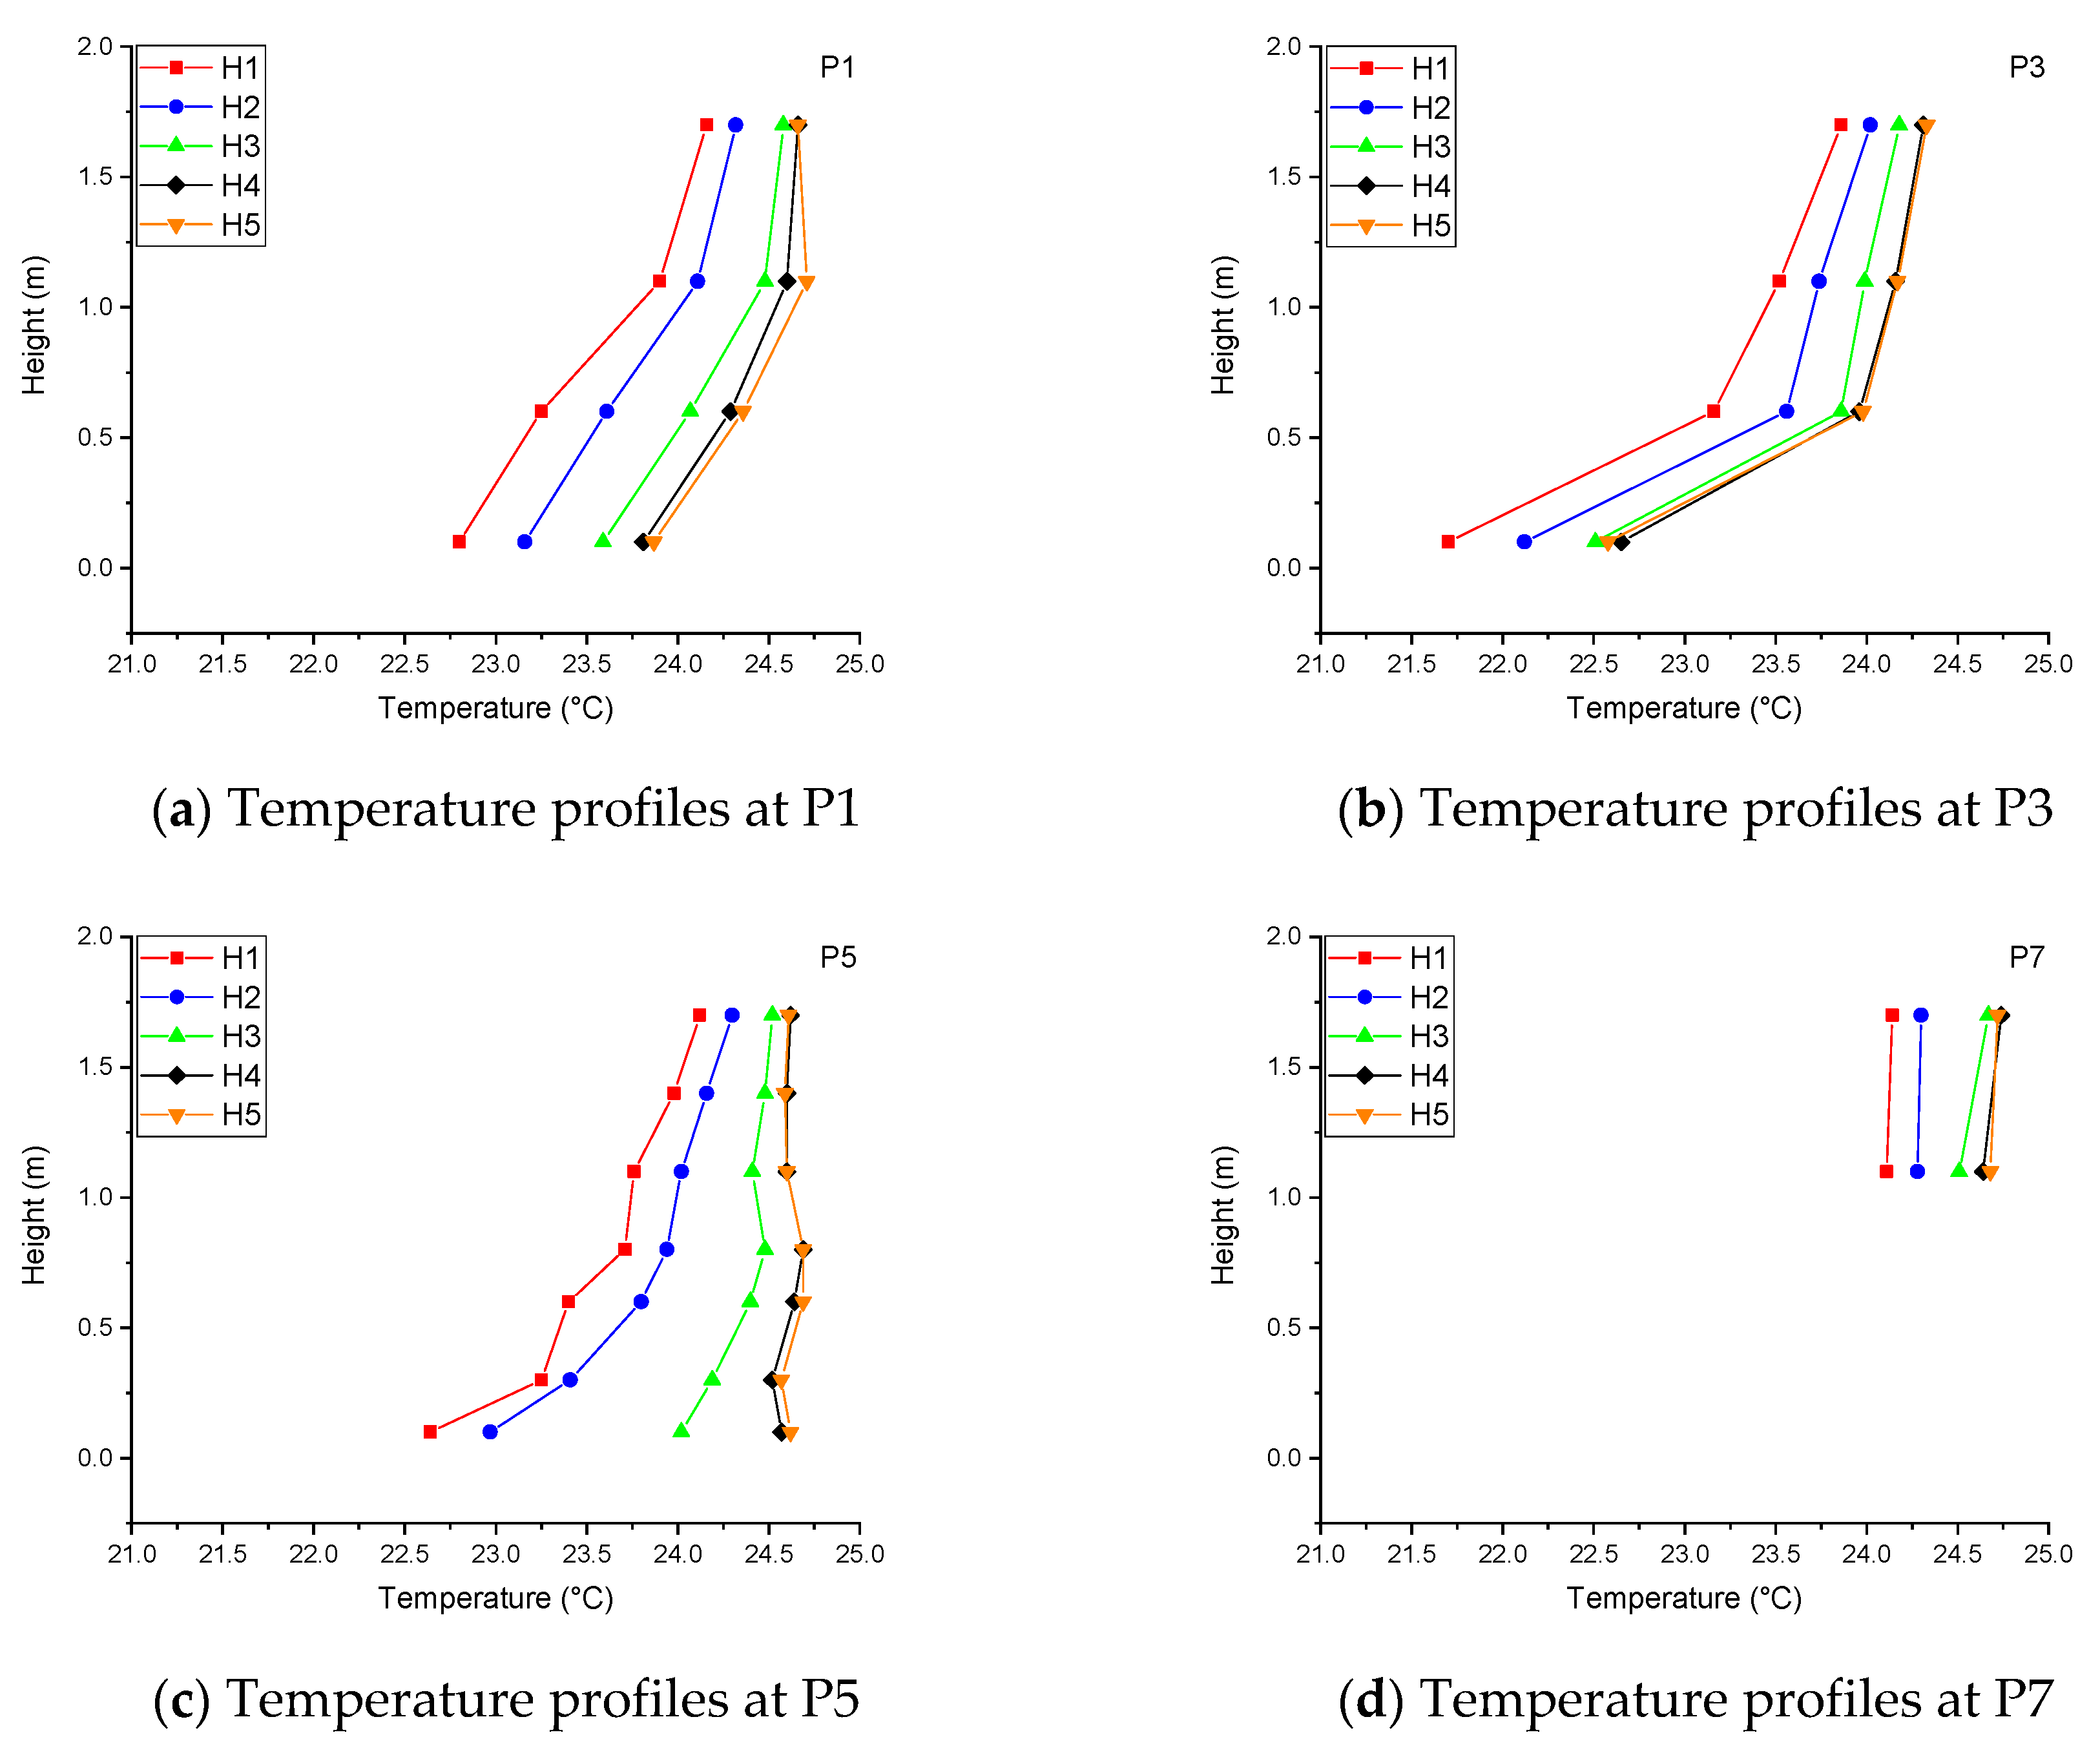
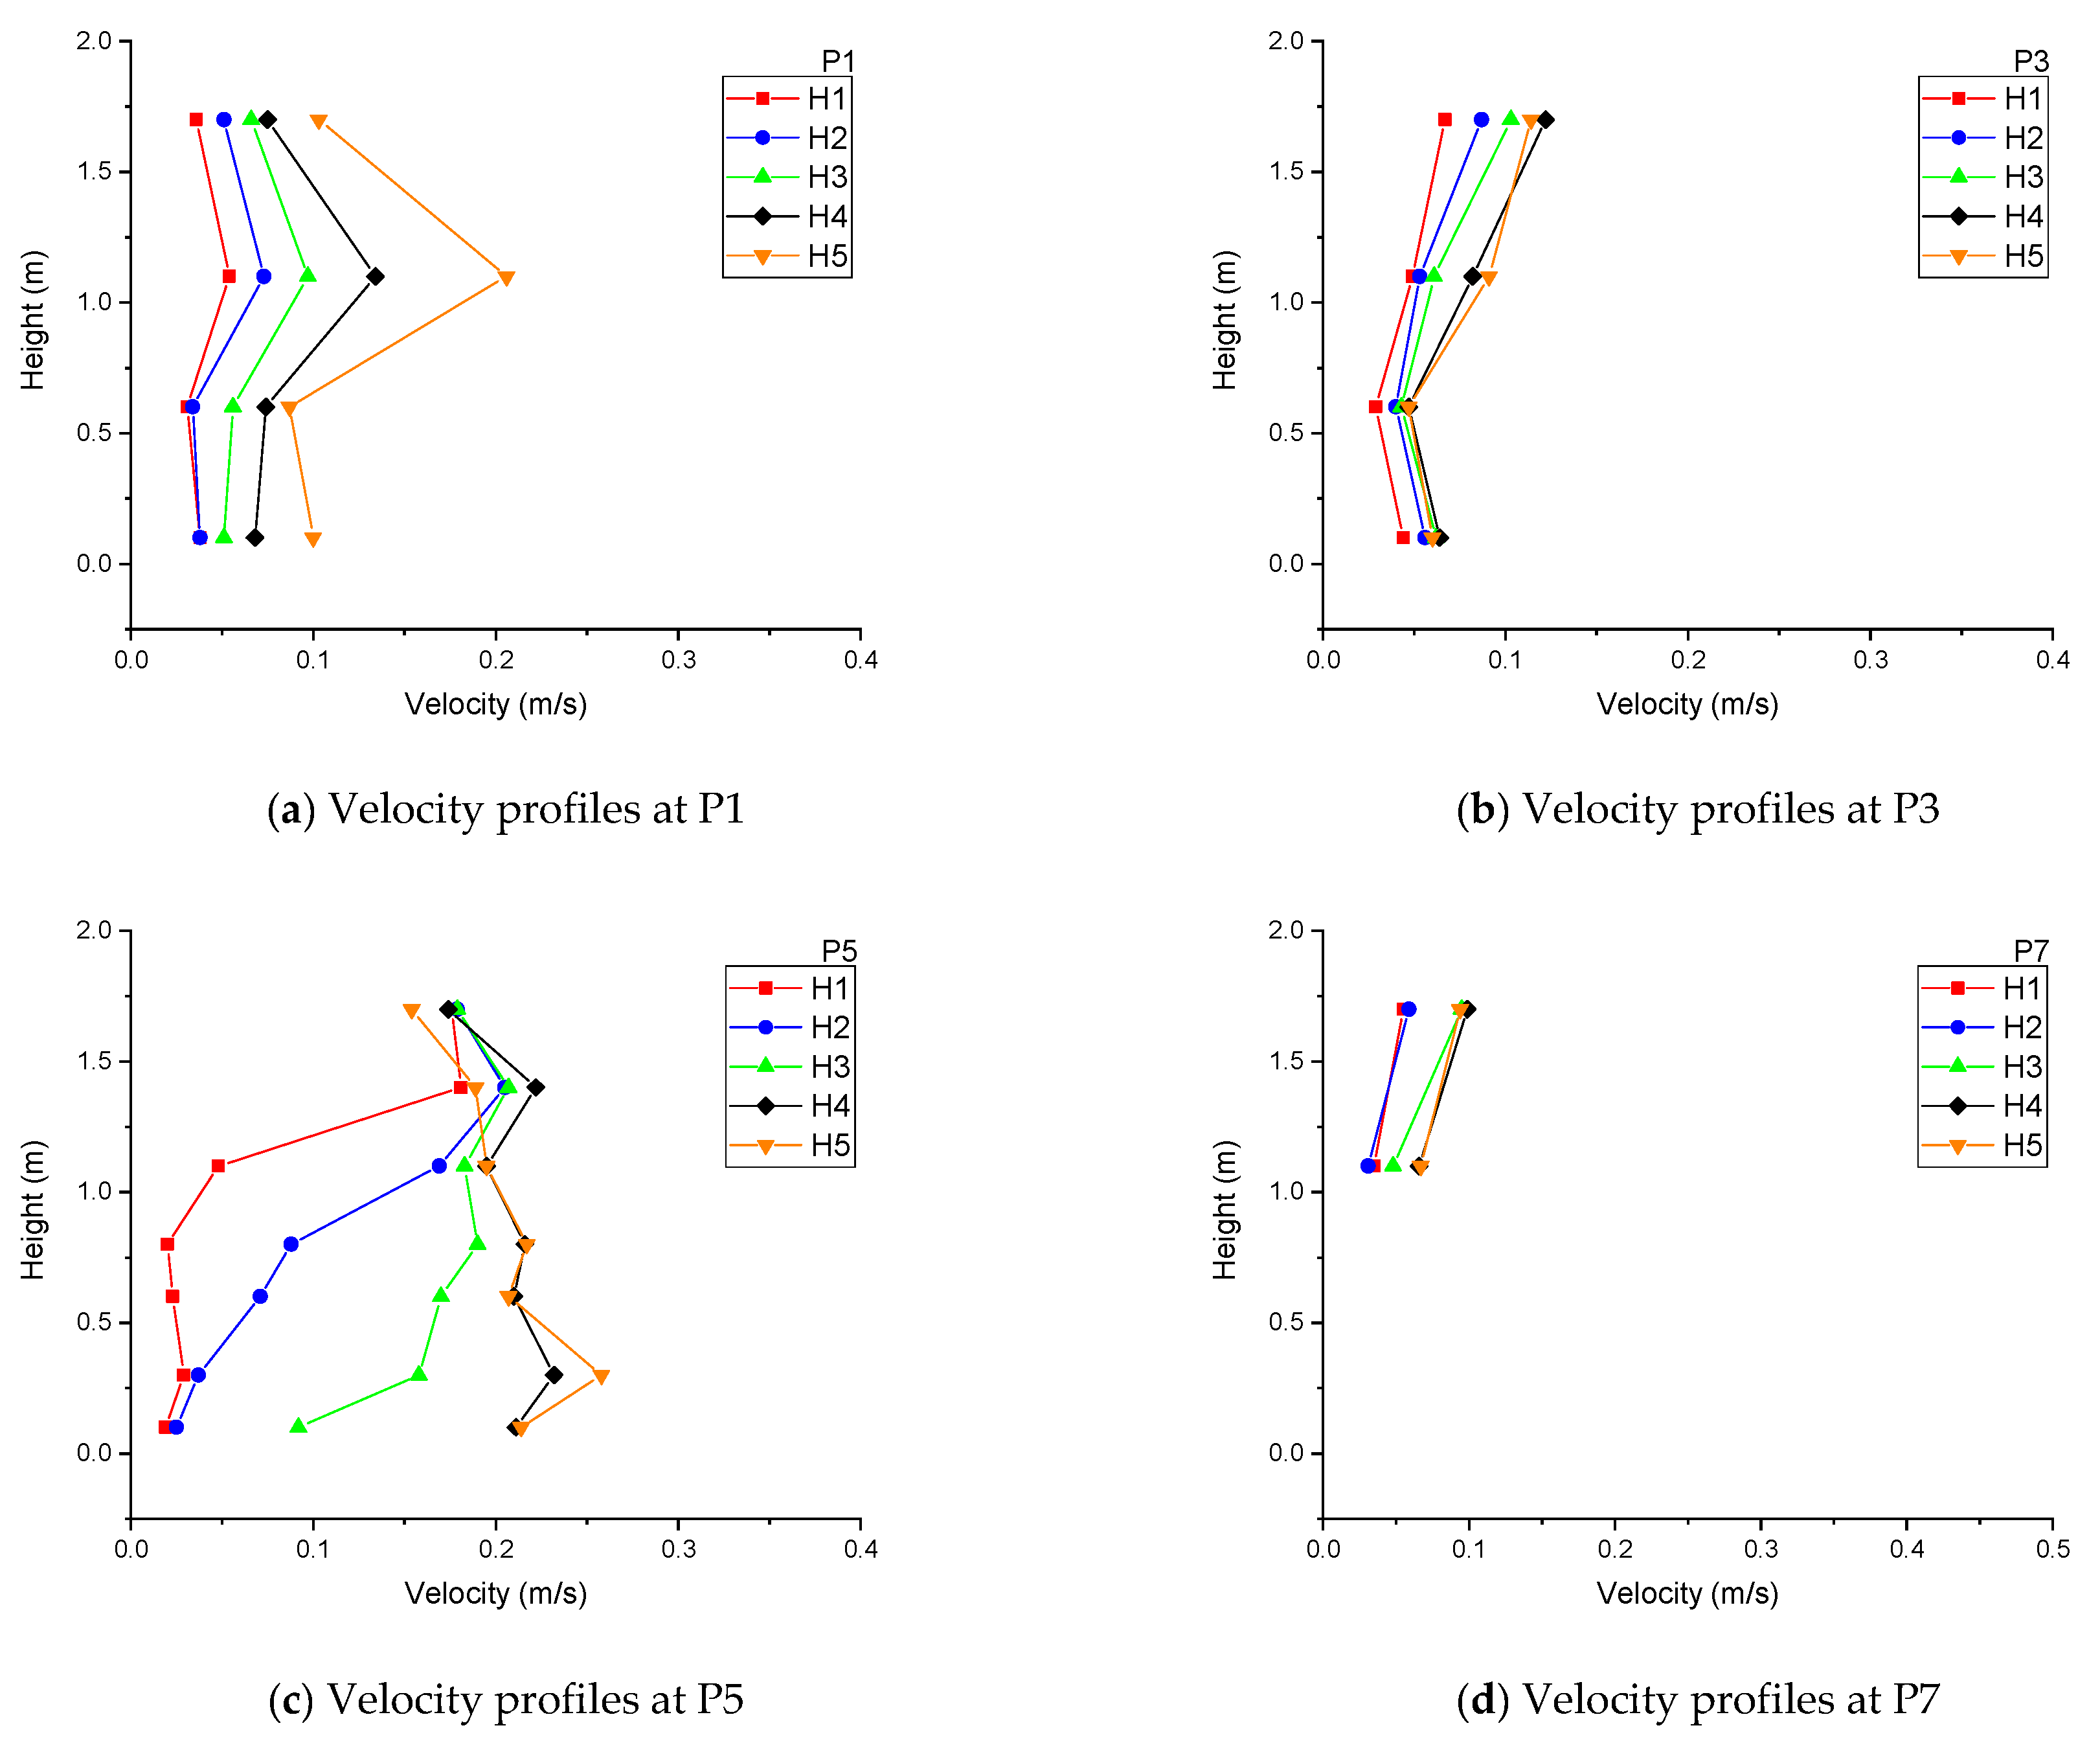
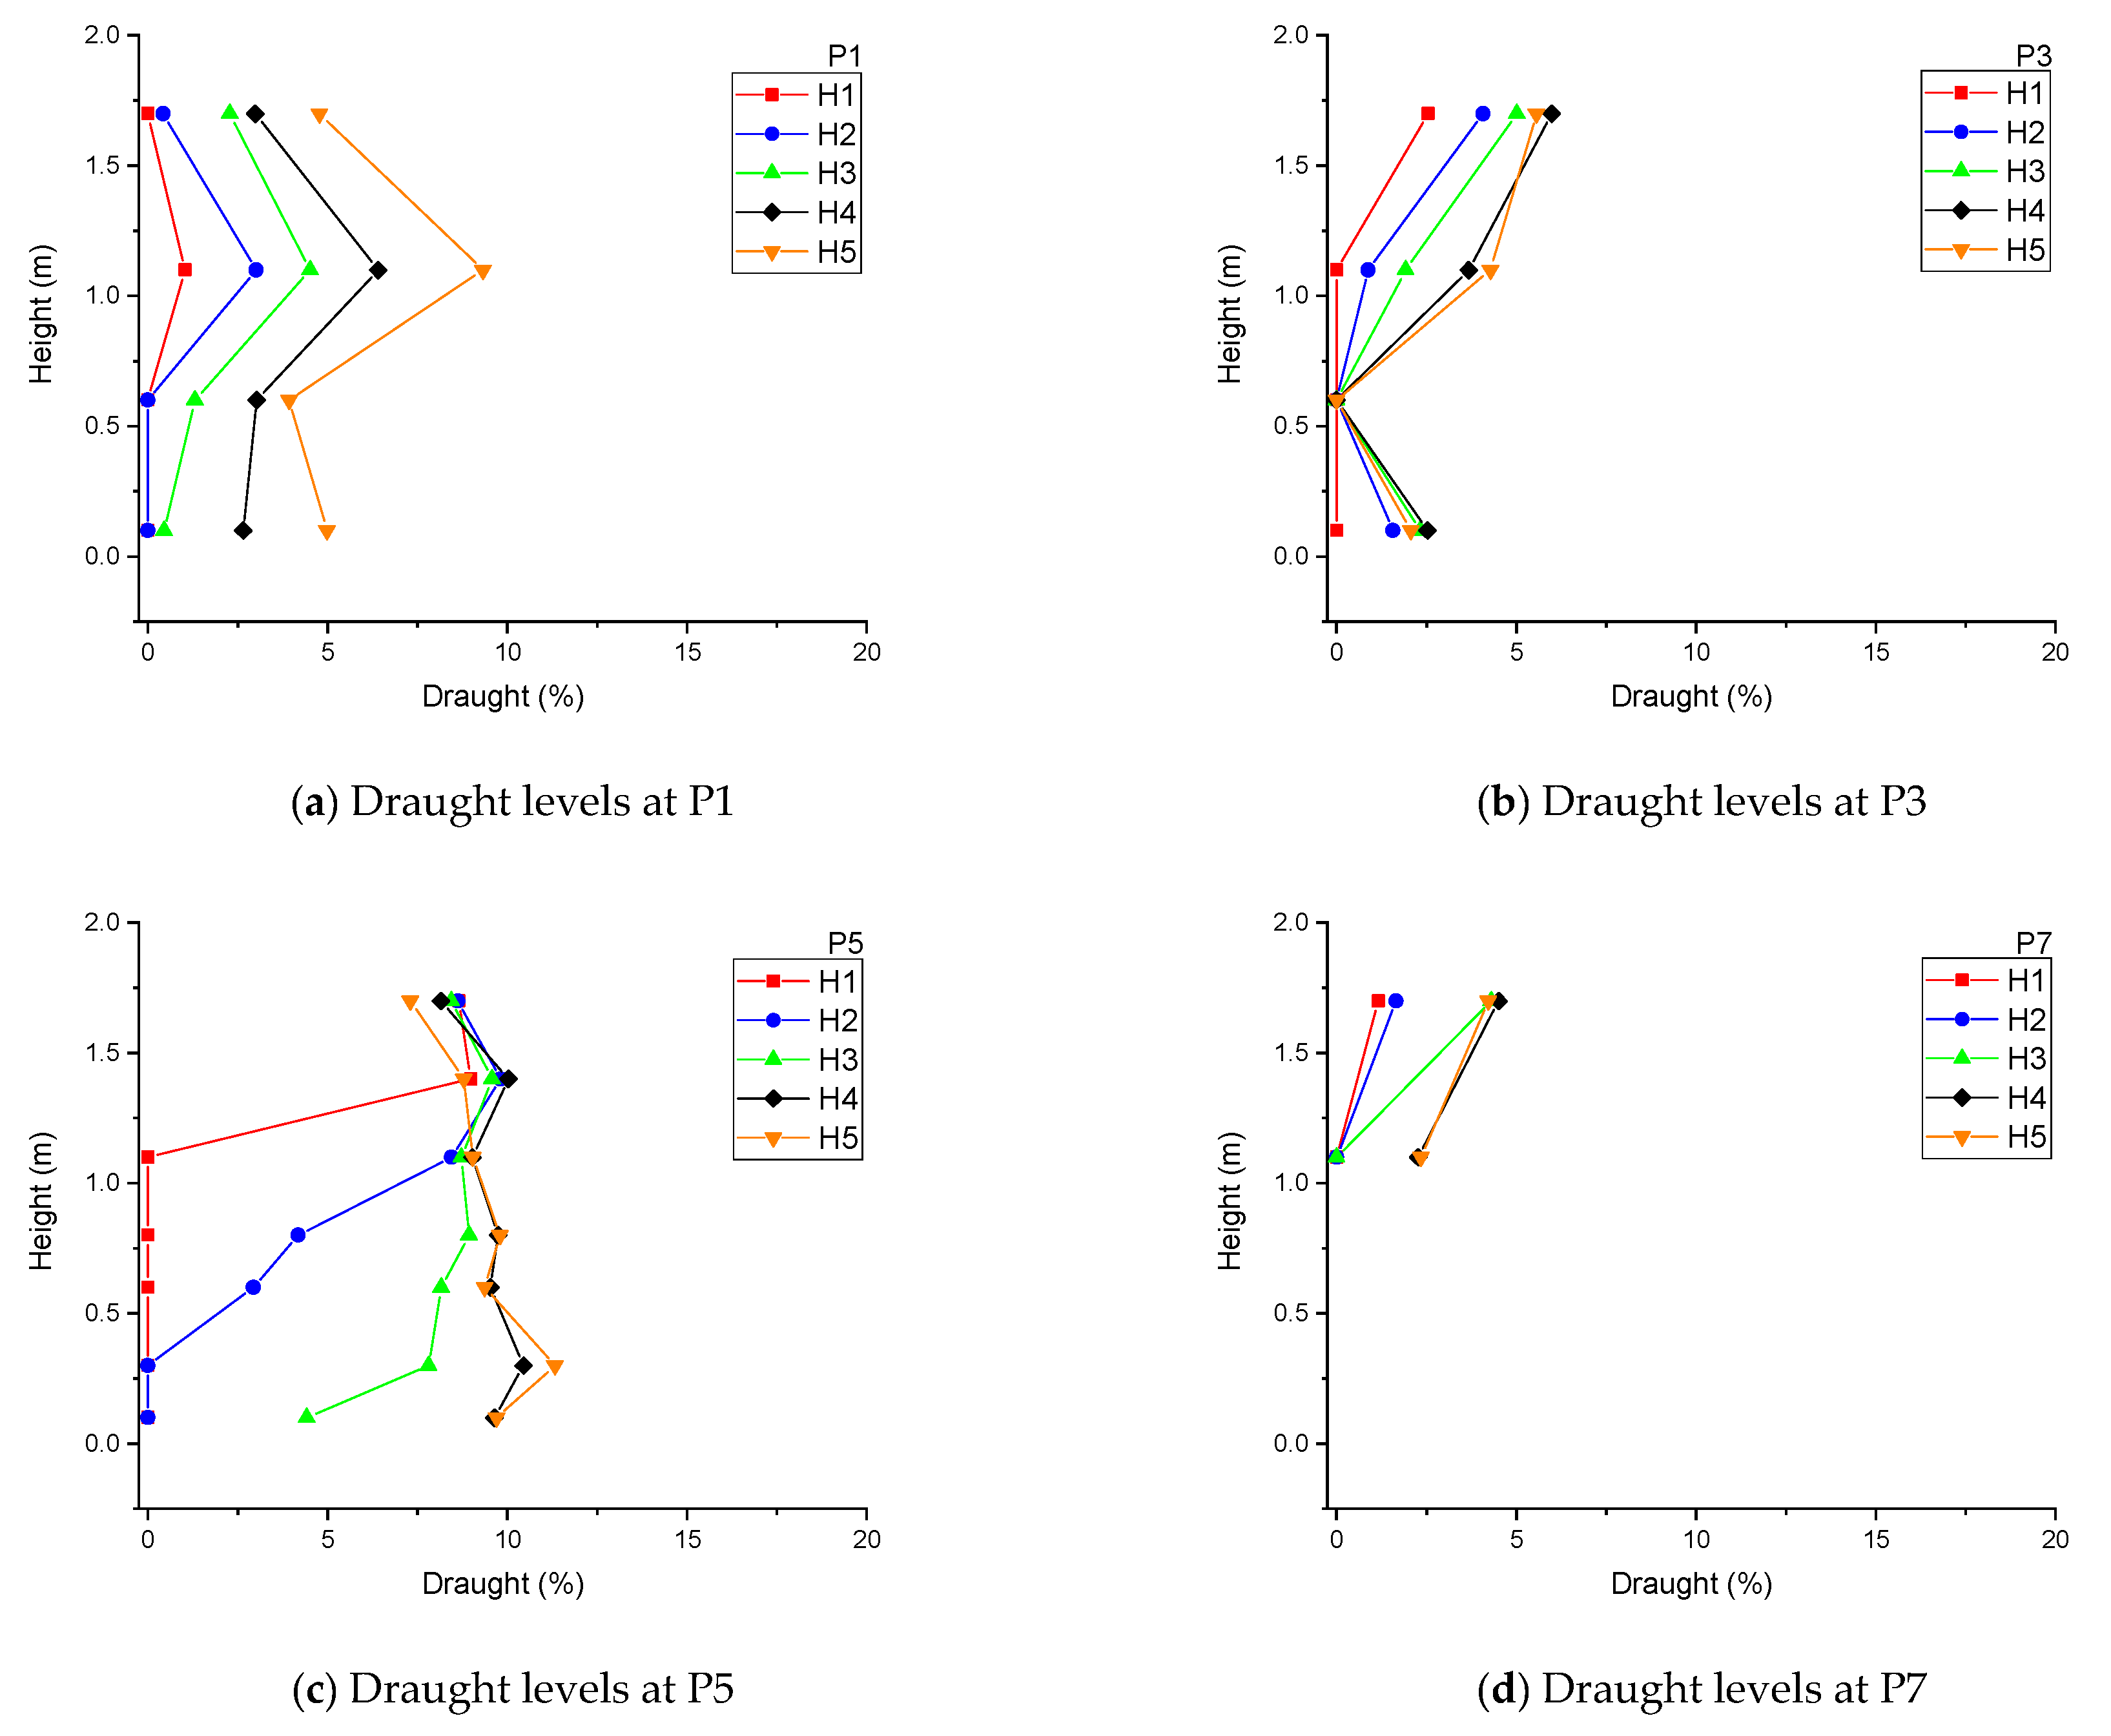
4.1. Flow Pattern and Thermal Conditions
4.2. Ventilation Effectivesness
5. Conclusions
Author Contributions
Funding
Acknowledgments
Conflicts of Interest
Abbreviation
| ACE | air change effectiveness [-] |
| ACEavg | average spatial air change effectiveness in a region [-] |
| ACEp | local air change effectiveness [-] |
| AEE | air exchange efficiency [-] |
| Ari | inlet Archimedes number [-] |
| COP | coefficient of performance [-] |
| CSV | corner-placed stratum ventilation |
| DR | draught rate [%] |
| DV | displacement ventilation |
| IAQ | indoor air quality |
| IJV | impinging jet ventilation |
| MV | mixing ventilation |
| PD | percentage dissatisfied due to vertical air temperature difference [%] |
| PMV | predicted mean vote [-] |
| PPD | predicted percentage of dissatisfied [-] |
| SV | stratum ventilation |
| arithmetic mean air temperature based on the values at the heights of 0.1, 0.6, and 1.1 m [°C] | |
| Ti | mean supply air temperature [°C], [K] |
| To | mean outlet air temperature [°C] |
| vertical air temperature gradient between 0.1 m and 1.1 m above floor level [°C] | |
| uin | nominal inlet air velocity [m/s] |
| temperature effectiveness (effectiveness of heat removal) [-] | |
| temperature effectiveness (effectiveness of space heating) [-] |
References
- Mazzeo, N. Chemistry, Emission Control, Radioactive Pollution and Indoor Air Quality; InTech: Rijeka, Croatia, 2011; ISBN 978-953-307-316-3. [Google Scholar]
- Awbi, H.B. Ventilation of Buildings; Routledge: London, UK, 2002; ISBN 1135817413. [Google Scholar]
- Bakó-Biró, Z.; Clements-Croome, D.J.; Kochhar, N.; Awbi, H.B.; Williams, M.J. Ventilation rates in schools and pupils’ performance. Build. Environ. 2012, 48, 215–223. [Google Scholar] [CrossRef]
- Nazaroff, W.W. Indoor Particle Dynamics; Indoor Air: Berkeley, CA, USA, 2004; Volume 14, pp. 175–183. [Google Scholar] [CrossRef]
- IEA World Energy Balances 2018: Overview. 2018, p. 24. Available online: https://webstore.iea.org/world-energy-balances-2018-overview (accessed on 12 October 2018).
- Cao, G.; Awbi, H.; Yao, R.; Fan, Y.; Sirén, K.; Kosonen, R.; Zhang, J.J. A review of the performance of different ventilation and airflow distribution systems in buildings. Build. Environ. 2014, 73, 171–186. [Google Scholar] [CrossRef]
- Fong, M.; Lin, Z.; Fong, K.; Hanby, V.; Greenough, R. Life cycle assessment for three ventilation methods. Build. Environ. 2017, 116, 73–88. [Google Scholar] [CrossRef]
- Rim, D.; Novoselac, A. Ventilation effectiveness as an indicator of occupant exposure to particles from indoor sources. Build. Environ. 2010, 45, 1214–1224. [Google Scholar] [CrossRef]
- Lin, Z.; Chow, T.T.; Tsang, C.; Fong, K.; Chan, L. Stratum ventilation—A potential solution to elevated indoor temperatures. Build. Environ. 2009, 44, 2256–2269. [Google Scholar] [CrossRef]
- Lin, Z.; Chow, T.; Tsang, C. Stratum ventilation? A conceptual introduction. In Proceedings of the 10th International Conference on Indoor Air Quality and Climate (Indoor Air 2005), Beijing, China, 4–9 September 2005; pp. 3260–3264. [Google Scholar]
- Tian, L.; Lin, Z.; Liu, J.; Yao, T.; Wang, Q. The impact of temperature on mean local air age and thermal comfort in a stratum ventilated office. Build. Environ. 2011, 46, 501–510. [Google Scholar] [CrossRef]
- Tian, L.; Lin, Z.; Wang, Q. Experimental investigation of thermal and ventilation performances of stratum ventilation. Build. Environ. 2011, 46, 1309–1320. [Google Scholar] [CrossRef]
- Lin, Z.; Yao, T.; Chow, T.T.; Fong, K.; Chan, L. Performance evaluation and design guidelines for stratum ventilation. Build. Environ. 2011, 46, 2267–2279. [Google Scholar] [CrossRef]
- Cheng, Y.; Lin, Z. Experimental study of airflow characteristics of stratum ventilation in a multi-occupant room with comparison to mixing ventilation and displacement ventilation. Indoor Air 2015, 25, 662–671. [Google Scholar] [CrossRef]
- Lin, Z.; Chow, T.; Tsang, C. Validation of a CFD model for research into stratum ventilation. Int. J. Vent. 2006, 5, 345–363. [Google Scholar] [CrossRef]
- Wang, X.; Lin, Z. An experimental investigation into the pull-down performances with different air distributions. Appl. Therm. Eng. 2015, 91, 151–162. [Google Scholar] [CrossRef]
- Shao, X.; Wang, K.; Li, X.; Lin, Z. Potential of stratum ventilation to satisfy differentiated comfort requirements in multi-occupied zones. Build. Environ. 2018, 143, 329–338. [Google Scholar] [CrossRef]
- Lin, Z.; Lee, C.K.; Fong, S.; Chow, T.T.; Yao, T.; Chan, A. Comparison of annual energy performances with different ventilation methods for cooling. Energy Build. 2011, 43, 130–136. [Google Scholar] [CrossRef]
- Fong, M.; Lin, Z.; Fong, K.; Chow, T.T.; Yao, T. Evaluation of thermal comfort conditions in a classroom with three ventilation methods. Indoor Air 2011, 21, 231–239. [Google Scholar] [CrossRef] [PubMed]
- Ruparathna, R.; Hewage, K.; Sadiq, R. Improving the energy efficiency of the existing building stock: A critical review of commercial and institutional buildings. Renew. Sustain. Energy Rev. 2016, 53, 1032–1045. [Google Scholar] [CrossRef]
- Tian, L.; Lin, Z.; Liu, J.; Wang, Q. Numerical study of indoor air quality and thermal comfort under stratum ventilation. Prog. Comput. Fluid Dynamic 2008, 8, 541–548. [Google Scholar] [CrossRef]
- Ameen, A.; Cehlin, M.; Larsson, U.; Karimipanah, T. Experimental investigation of ventilation performance of different air distribution systems in an office environment -cooling mode. Energies 2019, 12, 1354. [Google Scholar] [CrossRef]
- Ameen, A.; Cehlin, M.; Larsson, U.; Karimipanah, T. Experimental investigation of ventilation performance of different air distribution systems in an office environment-heating mode. Energies 2019, 12, 1835. [Google Scholar] [CrossRef]
- ISO 7730. Ergonomics of the Thermal Environment-Analytical Determination and Interpretation of Thermal Comfort Using Calculation of the PMV and PPD Indices and Local Thermal Comfort Criteria; ISO: Geneva, Switzerland, 2005.
- Qingyan, C.; Van Der Kooi, J.; Meyers, A. Measurements and computations of ventilation efficiency and temperature efficiency in a ventilated room. Energy Build. 1988, 12, 85–99. [Google Scholar] [CrossRef]
- Artmann, N.; Jensen, R.L.; Manz, H.; Heiselberg, P. Experimental investigation of heat transfer during night-time ventilation. Energy Build. 2010, 42, 366–374. [Google Scholar] [CrossRef]
- Olesen, B.W.; Simone, A.; KrajcÍik, M.; Causone, F.; Carli, M.D. Experimental study of air distribution and ventilation effectiveness in a room with a combination of different mechanical ventilation and heating/cooling systems. Int. J. Vent. 2011, 9, 371–383. [Google Scholar] [CrossRef]
- Rabani, M.; Madessa, H.B.; Nord, N.; Schild, P.; Mysen, M. Performance assessment of all-air heating in an office cubicle equipped with an active supply diffuser in a cold climate. Build. Environ. 2019. [Google Scholar] [CrossRef]
- ASHRAE Standard 129-1997 (RA 2002). Measuring Air Change Effectiveness; ASHRAE: Atlanta, GA, USA, 2002.
- Mundt, M.; Mathisen, H.M.; Moser, M.; Nielsen, P.V. Ventilation Effectiveness; REHVA: Brussels, Belgium, 2004; ISBN 978-29-6004-680-9. [Google Scholar]
- Breum, N. Ventilation efficiency in an occupied office with displacement ventilation-a laboratory study. Environ. Int. 1992, 18, 353–361. [Google Scholar] [CrossRef]
- Both, B.; Szánthó, Z. Objective investigation of discomfort due to draught in a tangential air distribution system: Influence of air diffuser’s offset ratio. Indoor Built Environ. 2018, 27, 1105–1118. [Google Scholar] [CrossRef]
- Buratti, C.; Mariani, R.; Moretti, E. Mean age of air in a naturally ventilated office: Experimental data and simulations. Energy Build. 2011, 43, 2021–2027. [Google Scholar] [CrossRef]
- Cehlin, M.; Karimipanah, T.; Larsson, U.; Ameen, A. Comparing thermal comfort and air quality performance of two active chilled beam systems in an open-plan office. J. Build. Eng. 2019, 22, 56–65. [Google Scholar] [CrossRef]
- Lin, Z.; Chow, T.; Tsang, C.; Chan, L.; Fong, K. Effect of air supply temperature on the performance of displacement ventilation (Part I)-thermal comfort. Indoor Built Environ. 2005, 14, 103–115. [Google Scholar] [CrossRef]
- Kong, X.; Xi, C.; Li, H.; Lin, Z. A comparative experimental study on the performance of mixing ventilation and stratum ventilation for space heating. Build. Environ. 2019, 157, 34–46. [Google Scholar] [CrossRef]
- Ge, H.; Fazio, P. Experimental investigation of cold draft induced by two different types of glazing panels in metal curtain walls. Build. Environ. 2004, 39, 115–125. [Google Scholar] [CrossRef]
- Manz, H.; Frank, T. Analysis of thermal comfort near cold vertical surfaces by means of computational fluid dynamics. Indoor Built Environ. 2004, 13, 233–242. [Google Scholar] [CrossRef]
- Jurelionis, A.; Isevičius, E. CFD predictions of indoor air movement induced by cold window surfaces. J. Civ. Eng. Manag. 2008, 14, 29–38. [Google Scholar] [CrossRef]
- Yao, T.; Lin, Z. An experimental and numerical study on the effect of air terminal types on the performance of stratum ventilation. Build. Environ. 2014, 82, 431–441. [Google Scholar] [CrossRef]
- Cheng, Y.; Lin, Z.; Fong, A.M. Effects of temperature and supply airflow rate on thermal comfort in a stratum-ventilated room. Build. Environ. 2015, 92, 269–277. [Google Scholar] [CrossRef]
- Lee, C.; Fong, K.; Lin, Z.; Chow, T. Year-round energy saving potential of stratum ventilated classrooms with temperature and humidity control. HVAC&R Res. 2013, 19, 986–991. [Google Scholar] [CrossRef]


| Case | Supply Flow Rate. (L/s) | Inlet Temp. (°C) | Occupant (W) | Equipment (W) | uin (m/s) | Ari × 10−4 |
|---|---|---|---|---|---|---|
| C1 | 2 × 15 | 17.7 | 2 × 100 | 2 × 75 | 0.76 | 484 |
| C2 | 2 × 20 | 17.7 | 2 × 100 | 2 × 75 | 1.01 | 220 |
| C3 | 2 × 25 | 17.7 | 2 × 100 | 2 × 75 | 1.26 | 133 |
| C4 | 2 × 30 | 17.7 | 2 × 100 | 2 × 75 | 1.52 | 80 |
| C5 | 2 × 35 | 17.6 | 2 × 100 | 2 × 75 | 1.77 | 53 |
| C6 | 2 × 15 | 21.3 | 2 × 100 | 2 × 75 | 0.76 | 318 |
| C7 | 2 × 20 | 21.2 | 2 × 100 | 2 × 75 | 1.01 | 181 |
| C8 | 2 × 25 | 21.4 | 2 × 100 | 2 × 75 | 1.26 | 104 |
| C9 | 2 × 30 | 21.2 | 2 × 100 | 2 × 75 | 1.52 | 66 |
| C10 | 2 × 35 | 21.2 | 2 × 100 | 2 × 75 | 1.77 | 40 |
| H1 | 2 × 15 | 25.5 | 2 × 100 | 2 × 75 | 0.76 | −109 |
| H2 | 2 × 20 | 25.4 | 2 × 100 | 2 × 75 | 1.01 | −49 |
| H3 | 2 × 25 | 25.3 | 2 × 100 | 2 × 75 | 1.26 | −24 |
| H4 | 2 × 30 | 25.3 | 2 × 100 | 2 × 75 | 1.52 | −15 |
| H5 | 2 × 35 | 25.4 | 2 × 100 | 2 × 75 | 1.77 | −12 |
| Case | PD | ||||
|---|---|---|---|---|---|
| P1 | P2 | P3 | P4 | P5 | |
| C1 | 0.5% | 0.5% | 0.4% | 0.4% | 0.4% |
| C2 | 0.5% | 0.4% | 0.3% | 0.4% | 0.3% |
| C3 | 0.5% | 0.4% | 0.3% | 0.4% | 0.3% |
| C4 | 0.4% | 0.4% | 0.3% | 0.4% | 0.3% |
| C5 | 0.4% | 0.3% | 0.3% | 0.4% | 0.3% |
| C6 | 0.5% | 0.4% | 0.3% | 0.4% | 0.3% |
| C7 | 0.4% | 0.4% | 0.3% | 0.4% | 0.3% |
| C8 | 0.4% | 0.4% | 0.3% | 0.4% | 0.3% |
| C9 | 0.4% | 0.4% | 0.3% | 0.4% | 0.3% |
| C10 | 0.3% | 0.3% | 0.3% | 0.3% | 0.3% |
| H1 | 0.8% | 0.8% | 1.5% | 1.3% | 0.8% |
| H2 | 0.7% | 0.7% | 1.2% | 0.9% | 0.8% |
| H3 | 0.7% | 0.5% | 1.1% | 0.8% | 0.4% |
| H4 | 0.6% | 0.5% | 1.1% | 0.8% | 0.3% |
| H5 | 0.6% | 0.5% | 1.2% | 0.8% | 0.3% |
| Case | 1 | 2 | ||||
|---|---|---|---|---|---|---|
| P1 | P2 | P3 | P4 | P5 | P7 | |
| C1 | 1.21 | 1.23 | 1.20 | 1.21 | 1.17 | 1.06 |
| C2 | 1.19 | 1.20 | 1.20 | 1.21 | 1.18 | 1.05 |
| C3 | 1.18 | 1.17 | 1.18 | 1.19 | 1.17 | 1.06 |
| C4 | 1.14 | 1.13 | 1.16 | 1.17 | 1.15 | 1.04 |
| C5 | 1.00 | 0.99 | 1.02 | 1.03 | 1.01 | 0.91 |
| C6 | 1.25 | 1.27 | 1.29 | 1.28 | 1.19 | 1.06 |
| C7 | 1.21 | 1.23 | 1.24 | 1.24 | 1.19 | 1.05 |
| C8 | 1.19 | 1.17 | 1.20 | 1.21 | 1.17 | 1.05 |
| C9 | 1.05 | 1.05 | 1.07 | 1.08 | 1.05 | 0.95 |
| C10 | 0.98 | 0.98 | 1.00 | 1.02 | 0.99 | 0.87 |
| Case | 1 | 2 | ||||
|---|---|---|---|---|---|---|
| P1 | P2 | P3 | P4 | P5 | P7 | |
| H1 | 0.63 | 0.64 | 0.51 | 0.56 | 0.62 | 1.00 |
| H2 | 0.70 | 0.69 | 0.55 | 0.61 | 0.69 | 1.12 |
| H3 | 0.75 | 0.74 | 0.51 | 0.57 | 0.91 | 1.17 |
| H4 | 0.80 | 0.85 | 0.51 | 0.57 | 1.20 | 1.26 |
| H5 | 0.83 | 0.87 | 0.50 | 0.56 | 1.18 | 1.25 |
| Case | ACEp | ACEavg 2 | AEE | ||||
|---|---|---|---|---|---|---|---|
| T1 | T2 | T3 1 | T4 | T5 | |||
| C1 | 1.12 | 1.08 | 1.06 | 1.15 | 1.05 | 1.09 | 0.51 |
| C2 | 1.08 | 1.06 | 1.09 | 1.08 | 1.08 | 1.08 | 0.52 |
| C3 | 1.08 | 1.07 | 1.06 | 1.06 | 1.10 | 1.07 | 0.53 |
| C4 | 1.00 | 1.01 | 1.01 | 1.00 | 1.06 | 1.02 | 0.50 |
| C5 | 1.00 | 1.02 | 1.03 | 1.00 | 1.12 | 1.03 | 0.50 |
| C6 | 0.99 | 1.05 | 1.05 | 1.04 | 1.12 | 1.05 | 0.47 |
| C7 | 1.00 | 1.02 | 1.00 | 1.01 | 1.03 | 1.01 | 0.45 |
| C8 | 1.03 | 1.05 | 1.05 | 1.04 | 1.07 | 1.05 | 0.43 |
| C9 | 1.06 | 1.05 | 1.06 | 1.06 | 1.09 | 1.06 | 0.48 |
| C10 | 1.07 | 1.05 | 1.08 | 1.10 | 1.07 | 1.07 | 0.49 |
| H1 | 1.01 | 1.03 | 0.94 | 0.97 | 1.10 | 1.01 | 0.50 |
| H2 | 0.99 | 1.03 | 0.95 | 0.98 | 1.06 | 1.00 | 0.44 |
| H3 | 0.99 | 1.05 | 0.95 | 0.98 | 1.07 | 1.01 | 0.42 |
| H4 | 0.98 | 1.05 | 1.01 | 1.00 | 1.09 | 1.03 | 0.40 |
| H5 | 0.99 | 1.06 | 1.04 | 1.00 | 1.12 | 1.04 | 0.49 |
© 2019 by the authors. Licensee MDPI, Basel, Switzerland. This article is an open access article distributed under the terms and conditions of the Creative Commons Attribution (CC BY) license (http://creativecommons.org/licenses/by/4.0/).
Share and Cite
Ameen, A.; Choonya, G.; Cehlin, M. Experimental Evaluation of the Ventilation Effectiveness of Corner Stratum Ventilation in an Office Environment. Buildings 2019, 9, 169. https://doi.org/10.3390/buildings9070169
Ameen A, Choonya G, Cehlin M. Experimental Evaluation of the Ventilation Effectiveness of Corner Stratum Ventilation in an Office Environment. Buildings. 2019; 9(7):169. https://doi.org/10.3390/buildings9070169
Chicago/Turabian StyleAmeen, Arman, Gasper Choonya, and Mathias Cehlin. 2019. "Experimental Evaluation of the Ventilation Effectiveness of Corner Stratum Ventilation in an Office Environment" Buildings 9, no. 7: 169. https://doi.org/10.3390/buildings9070169
APA StyleAmeen, A., Choonya, G., & Cehlin, M. (2019). Experimental Evaluation of the Ventilation Effectiveness of Corner Stratum Ventilation in an Office Environment. Buildings, 9(7), 169. https://doi.org/10.3390/buildings9070169