1. Introduction
Heating, ventilation and air-conditioning (HVAC) systems are the main causes of high-electric energy consumption in buildings in the world [
1,
2]. In order to reduce this energy consumption, the application of thermal insulation on the envelope is an efficient strategy to avoid thermal exchanges with the external environment, thereby increasing the energy efficiency of buildings. The concept of energy efficiency in buildings refers to providing thermal comfort for the occupants with low energy consumption.
Therefore, the design of an energy-efficient building should take into account the external environmental conditions such as geographic location, position, and the climate of the region. In addition, other internal factors are of great importance, such as the purpose of the building, periods of use, and activities of the occupants. Besides these conditions, the materials used on the envelope play a crucial role in the thermal performance of the buildings. In this context, the choice of the best insulation is difficult due to the various parameters that should be analyzed such as performance, cost, uncertainties related to hygrothermal properties, sustainability issues, etc. In this line of research, Adamczyk and Dylewski [
3] proposed a methodology for assessing the environmental and economic benefits of thermal insulation. The results indicated that this investment is beneficial for ecological and economic reasons. Soares et al. [
4] provided a survey of the main methods to measure the thermal transmittance and thermal behavior of construction elements such as the insulation materials.
In order to promote the most adequate choice, other scientific works found in the literature can also be cited. Firstly, a literature review on determining the optimal thickness of the thermal insulation material in a building envelope and its effect on energy consumption has been carried out by Kaynakli [
5]. Kaynakli [
6] also investigated some parameters that affect the optimal insulation thickness, such as inflation and discount rates, lifetime, energy costs, the heating/cooling loads, and the properties of the insulation material. The optimal thickness and payback period was determined through an economic model based on life-cycle cost analysis. Akyüz et al. [
7] analyzed the application of thermal insulation on the walls and roof of an airport terminal from energy, environment, and cost aspects. The optimal insulation thickness was also calculated and by applying thermal insulation on the walls and roof of the terminal building, a reduction of heat loss of 48% and 56% was observed, respectively.
Lin et al. [
8] implemented a multi-linear regression model and an artificial neural network model to predict the building thermal load and the number of discomfort degree hours considering the variable thermal mass, insulation, absorptance of solar radiation, and glazing ratio. The models were coupled with a multi-objective genetic optimization algorithm to minimize the building thermal load and to improve the thermal comfort for a green building in China. An extensive review of the optimization methods and their application in energy-efficient architectural building design can also be found in Kheiri [
9]. In addition, decision-making approaches were discussed for multi-objective optimizations.
Dubrow and Krarti [
10] presented a simulation–optimization tool that couples a genetic algorithm to a whole-building energy simulation engine to select optimal values of some parameters associated with the envelope to minimize energy use for residential buildings. Different building shapes were investigated and some features were considered in the optimization analysis including wall and roof constructions, foundation types, insulation levels, and window types and areas. Alsayed and Tayeh [
11] determined an optimal insulation thickness, which considers climatic conditions, wall structure, type and cost of insulation, cost of energy, and other economic parameters using an economic model, based on life-cycle cost analysis over a building lifetime of 20 years. Energy savings and payback periods analysis were performed for expanded polystyrene (EPS) and polyurethane foam (PU) and the results showed better performance of polyurethane foam for the cases studied.
Grygierek and Grygierek [
12] presented a multi-objective optimization of the selected design parameters in a single-family building in temperate climate conditions with natural ventilation. The influence of four types of windows, their size, building orientation, insulation of external wall, roof and ground floor, and infiltration on the life-cycle costs and thermal comfort were analyzed. A controller was proposed, with the task of imitating occupants in controlling the natural ventilation airflow. Baniassadi et al. [
13] carried out studies of economic optimization of thermal insulation thickness and phase-change material (PCM) layer using ENERGYPLUS software coupled to a genetic algorithm. Results showed that the optimal PCM thickness was zero for all cases and the optimum insulation thickness varied significantly by climatic regions of the country studied, Iran.
Gelegenis and Axaopoulos [
14] developed a complete work in order to indicate the optimal insulation thicknesses of walls’ insulation. A multi-parametric mathematical analytical approach is presented incorporating the existence of glazing at the wall, the thermal absorptance of the wall, the base temperature of the heated space, the thermal characteristics, and the heat and solar gains of the heated space. Other relevant work was undertaken by Rosasco and Perini [
15] who investigated which factors are considered by a panel of experts in the fields of design and architecture for the selection of a building roof solution. Results of the study identified their priority and through a sustainability-based multicriteria analysis, the role played by each one in the decision process. Different approaches in the analysis of roof insulation can also be verified in literature. Taylor et al. [
16] examined the thermal losses from various roof systems in terms of the economic cost of lost insulation due to thermal bridging. Gürlich et al. [
17] analyzed the daylight usage in buildings and quantified the daylight and energy performance of a complex multi-layer textile membrane roof. In this work a genetic algorithm (GA) was been chosen as the optimization tool. The ability of the GA to search simultaneously different regions of a solution space makes it possible to find a diverse set of solutions for difficult problems with non-convex, discontinuous, and multi-modal solution spaces [
18]. In building area, Caldas and Norford [
19] can be cited as one of the first authors who used the GA applied as a generative and search procedure to look for optimized design solutions in terms of thermal and lighting performance in a building. Although the literature contains works [
20] that evaluated the building properties by combining life-cycle assessment methodology and genetic algorithm, this work applied a multi-criteria selection to obtain the best insulation for an industrial shed roof.
In some emerging countries like Brazil, the application of a regulation for energy efficiency in buildings is not yet mandatory and also most industrial buildings do not have air-conditioning systems. Moreover, thermal comfort is not taken into account at the design stage, and the use of a simple insulated roof could improve the well-being and productivity of the occupants. Thus, this work focused on a simple and objective method that can directly contribute to the best choice of thermal insulation in industrial buildings. In this study, four different insulation materials (polyurethane foam—PU, expanded polystyrene—EPS, rockwool and glass wool) with a thickness range from 0.5 cm to 5 cm were considered in order to verify the thermal confort indexes [
21]. Beyond the thermal comfort and cost of the insulation, some hygrothermic properties such as water vapor diffusion resistance factor, and thermal diffusivity have also been analysed to obtain the best insulation option. To implement this optimization technique, thermo-energetic simulations of an industrial shed were performed using Domus software [
22]. The climate of Curitiba, Brazil (Lat: −25.43 and Long: −49.27) was investigated due to the high daily thermal amplitude presented. Recife, Brazil (Lat: −8.05, Lon: −34.88) was also verified due to its tropical climate. Climatic archive test reference year (TRY) was used in the simulations [
23].
This study is in line with the work presented by Civic and Vucijak [
24] that used a case study and also proposed the VIKOR method (
VlseKriterijumska Optimizacija I Kompromisno Resenje in Serbian) for multi-criteria optimization of insulation. However, in this work the focus is directed to the thermal comfort (higher weight in the objective finction) in which it is one of the most important aspects of the indoor environmental quality due to its effects on well-being of the people and building energy saving, while [
24] focused on the emissions aspect of avoiding carbon dioxide emissions during fabrication of insulant materials. The VIKOR method also relies on a fixed dimensionless matrix to evaluates the objective function. On the other hand, GA uses the coefficients and it is more flexible, additionally, GA prevails when non-linearities are involved, because of the genetic operations that can overcome rough transitions.
2. Problem Description
In order to promote the optimal selection of insulation material in the range of the Brazilian market applied to the roof of an industrial shed, the decision criterion has been based in four parameters that should be maximized or minimized:
Cost of insulation ($/cm), criteria to be minimized,
Predicted percentage dissatisfied (PPD) thermal comfort index (%), criteria to be minimized,
Water vapour diffusion resistance factor, criteria to be maximized,
Thermal diffusivity (m2/s), criteria to be minimized.
Insulation costs vary according to the density and an average cost of the materials has been adopted to simplify the optimization methodology, as described in
Table 1.
The PPD index, created for predicting the general thermal sensation and degree of discomfort, was elaborated by Fanger [
21] using heat-balance equations applied to the body human. Environmental parameters as air temperature, mean radiant temperature, air velocity and relative humidity are taken into account for the thermal sensation calculation as well as the clothing insulation and human metabolic rate.
The water vapor diffusion resistance factor is the ratio of the water vapor permeability of the air to the water vapor permeability of the material. The water vapor permeability is the quantity of water vapor transmitted per unit time through a unit area of the material per unit of vapor pressure. Therefore, this parameter is important for the prediction of mold growth and durability of the insulation. On the other hand, the thermal diffusivity measures the ability of a material to conduct thermal energy relative to its ability to store. The internal temperature of buildings with the envelope formed by materials with small thermal diffusivity varies more slowly in response to external climatic conditions.
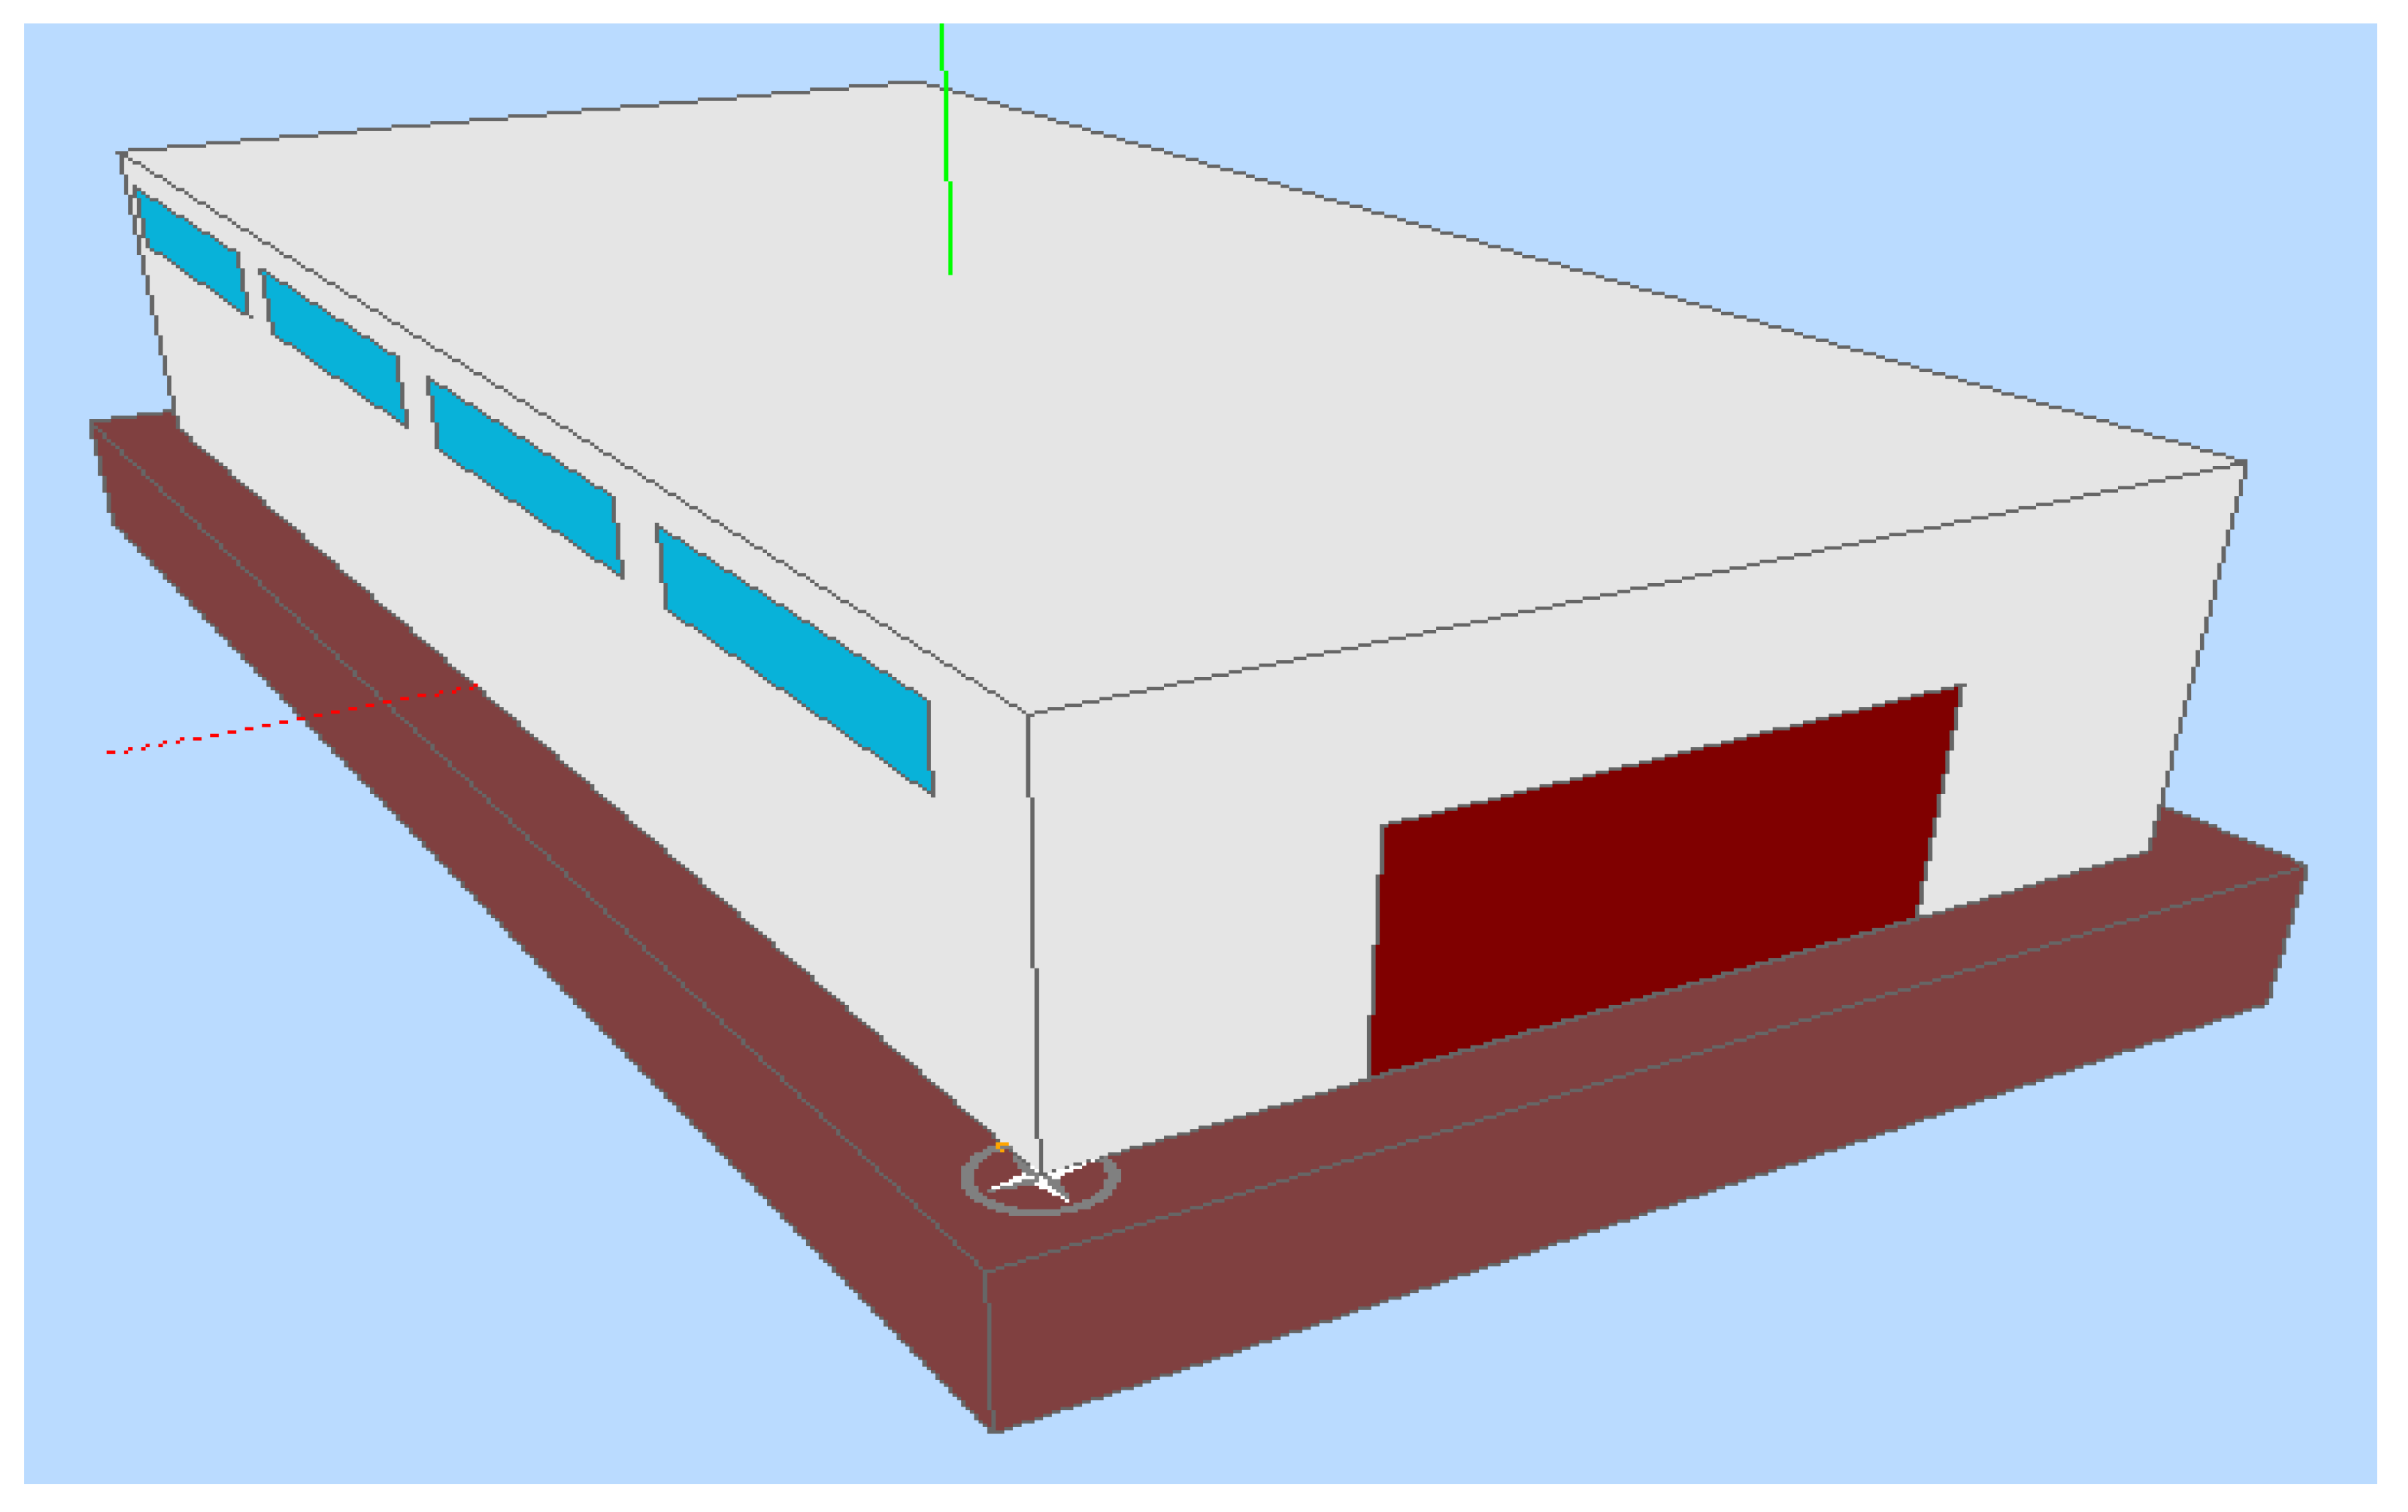
To simulate the thermal comfort index PPD, an industrial shed with area of 300 m
2 (
Figure 1) has been modeled in the Domus software [
22] developed for the simulation of multizone buildings and analysis of both thermal comfort and energy use. Two cities were considered in the simulations: Curitiba, Brazil (subtropical climate) and Recife, Brazil (tropical climate).
Table 2 presents the data that was considered for the thermal-load simulation of the building model.
Simulations were performed using four types of resistive insulation material. Ten thickness ranging from 0.5 cm to 5 cm were considered, for the purpose of obtaining different thermal comfort indexes (PPD).
Table 3 shows the hygrothermal properties of insulations.
Internal thermal gains (equipment and lighting) have not been considered in order to ensure that the thermal load can be attributed only to the external climatic conditions. In the evaluation of thermal comfort indexes, a person performing a moderate activity was considered, with metabolic rate of 1.6 met. A clothing thermal resistance of 0.691 clo (1 clo = 0.155 m2K/W) and air velocity of 0.01 m/s have been adopted.
In the optimization procedure, MATLAB software [
26] was chosen to implement the GA. This evolutionary computing technique operates on a population of candidates in parallel. Different areas of the solution space can be searched, allocating an appropriate number of candidate solutions for the search in various regions. Thus, after the objective function is implemented in the GA, the generation, crossing and mutation operations provide the result of the best insulator for the criteria and coefficients applied. For this analysis, the multicriteria decision analysis method (MCDA) was used to perform the classification. MCDA is a common human dilemma that involves decision making strategy different outcomes and different solutions for the same problems. In many cases, the best output it is not explicit and some variables are difficult to quantify. In these complex cases, such as the selection of material for insulation a common option is to select methods of optimization to elucidate the answer. In this case, before implementing the GA, the input data was set, after being normalized, and a weighting factor was arbitrarily attributed to each parameter.
In order to define the objective function, the equation must be associated with the unsatisfied people index (PPD) minimization, insulation cost minimization, vapor diffusion resistance factor maximization and thermal diffusivity minimization, as described by Equation (1):
where µ is the vapor diffusion resistance factor, L, the insulation thickness and α, the thermal diffusivity. A mathematical optimization problem is one in which some function is either maximized or minimized relative to a given set of alternatives. The function to be minimized or maximized is called the objective function and the set of alternatives is called the feasible region or constraint region. In this normalized function (Equation (1)), where the sum of the weighting factor is equal to 1, a factor of 0.6 has been considered for the PPD index, 0.25 for the insulation cost, 0.1 for the vapor-diffusion resistance factor and 0.05, for the thermal diffusivity. These weighting factors can be chosen arbitrarily according to user needs. The cost factor, for example, in underdeveloped countries is more important than in developed countries. On the other hand, the factor associated to vapor diffusion resistance is more important in humid regions than in dry regions.
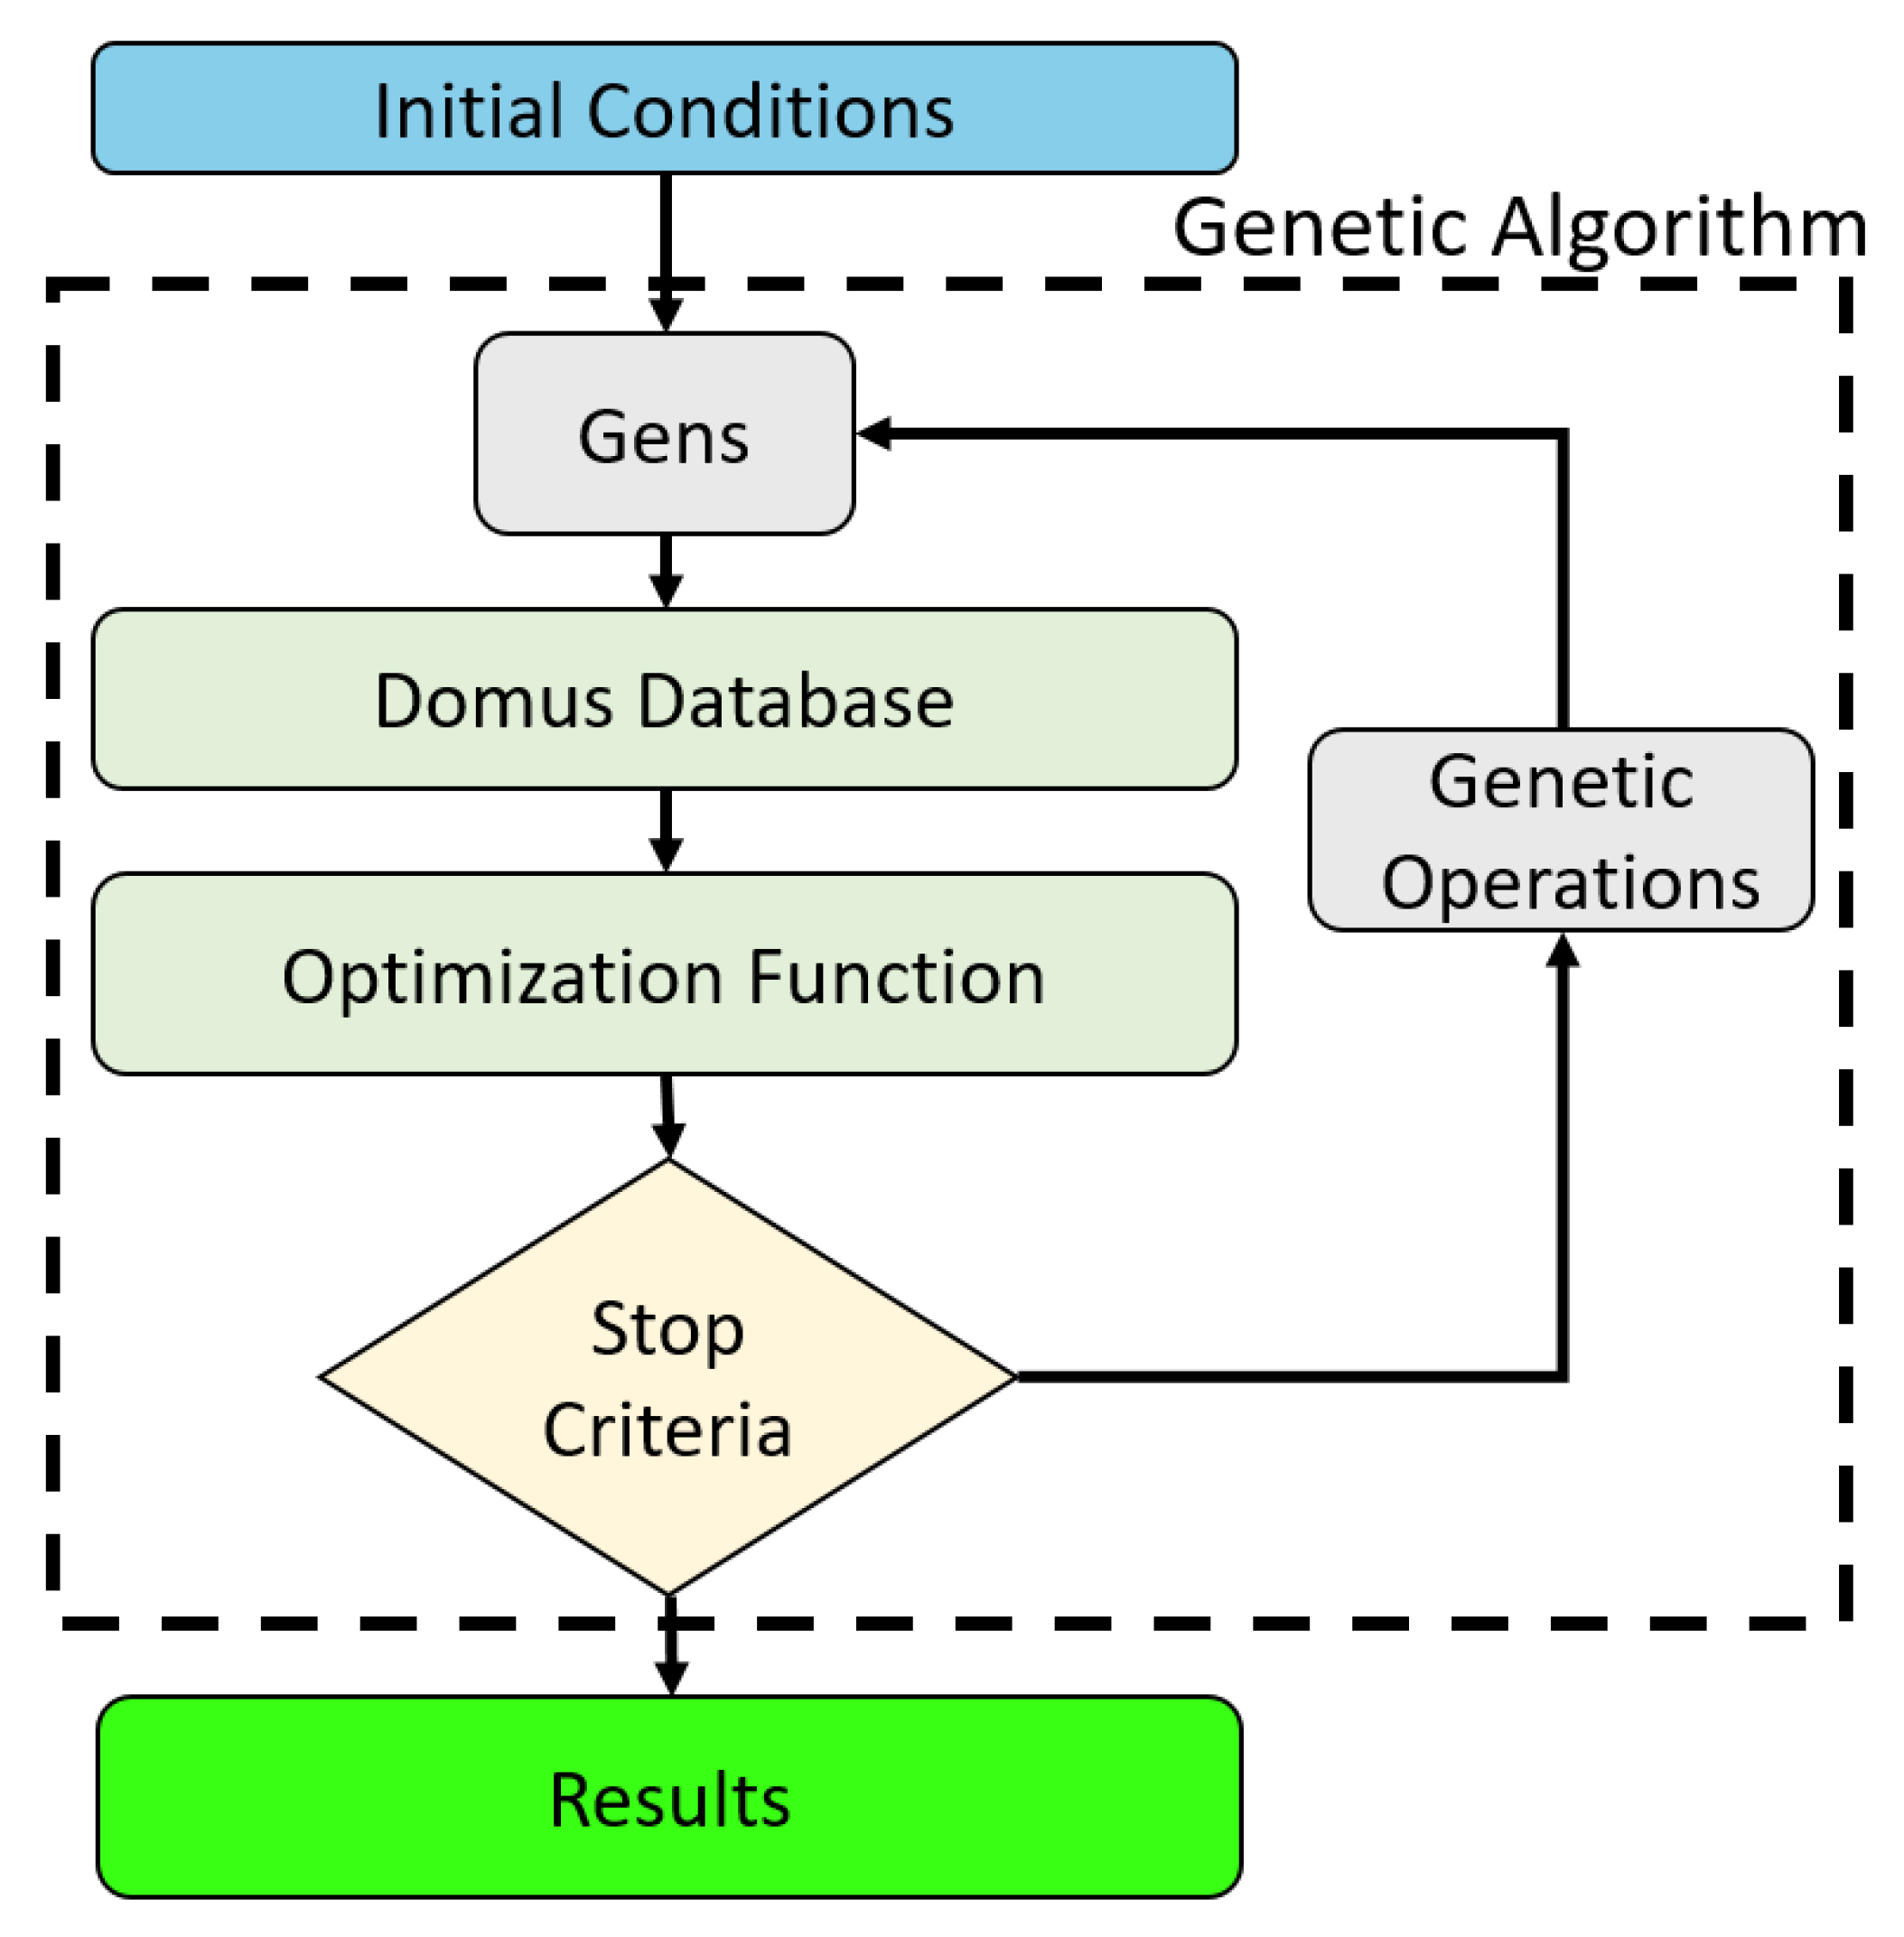
In
Figure 2, the flowchart for obtaining the optimal parameters is presented. Initial conditions are random in the algorithm, generating the initial gens. Consequently, the Domus database returns to the objective function that will check the stop criteria and repeat the operation.
For the variables input in the objective function, normalization has been performed, in which the variables were divided by the maximum value of each criteria. After, the normalizad PPD values (daily average) were grouped in 4 matrices corresponding to the different insulation materials (12 × 10), defined by 12 months and 10 different thicknesses. As the maximum number of population generated is 40 individuals, which refers to the combination of 4 materials and 10 thicknesses, individuals were randomly selected to repeat and compose the initial population. In order to ensure the convergence of the method and adopt parameters suitable for small samples for numerical simulations, the following parameters were defined: a mutation factor of 1% of the individuals; 5% for the survival factor; and 94% for the species’ crossover. According to [
27,
28,
29,
30], these parameters are appropriate for a problem similar to that considered in this paper.
3. Results and Discussions
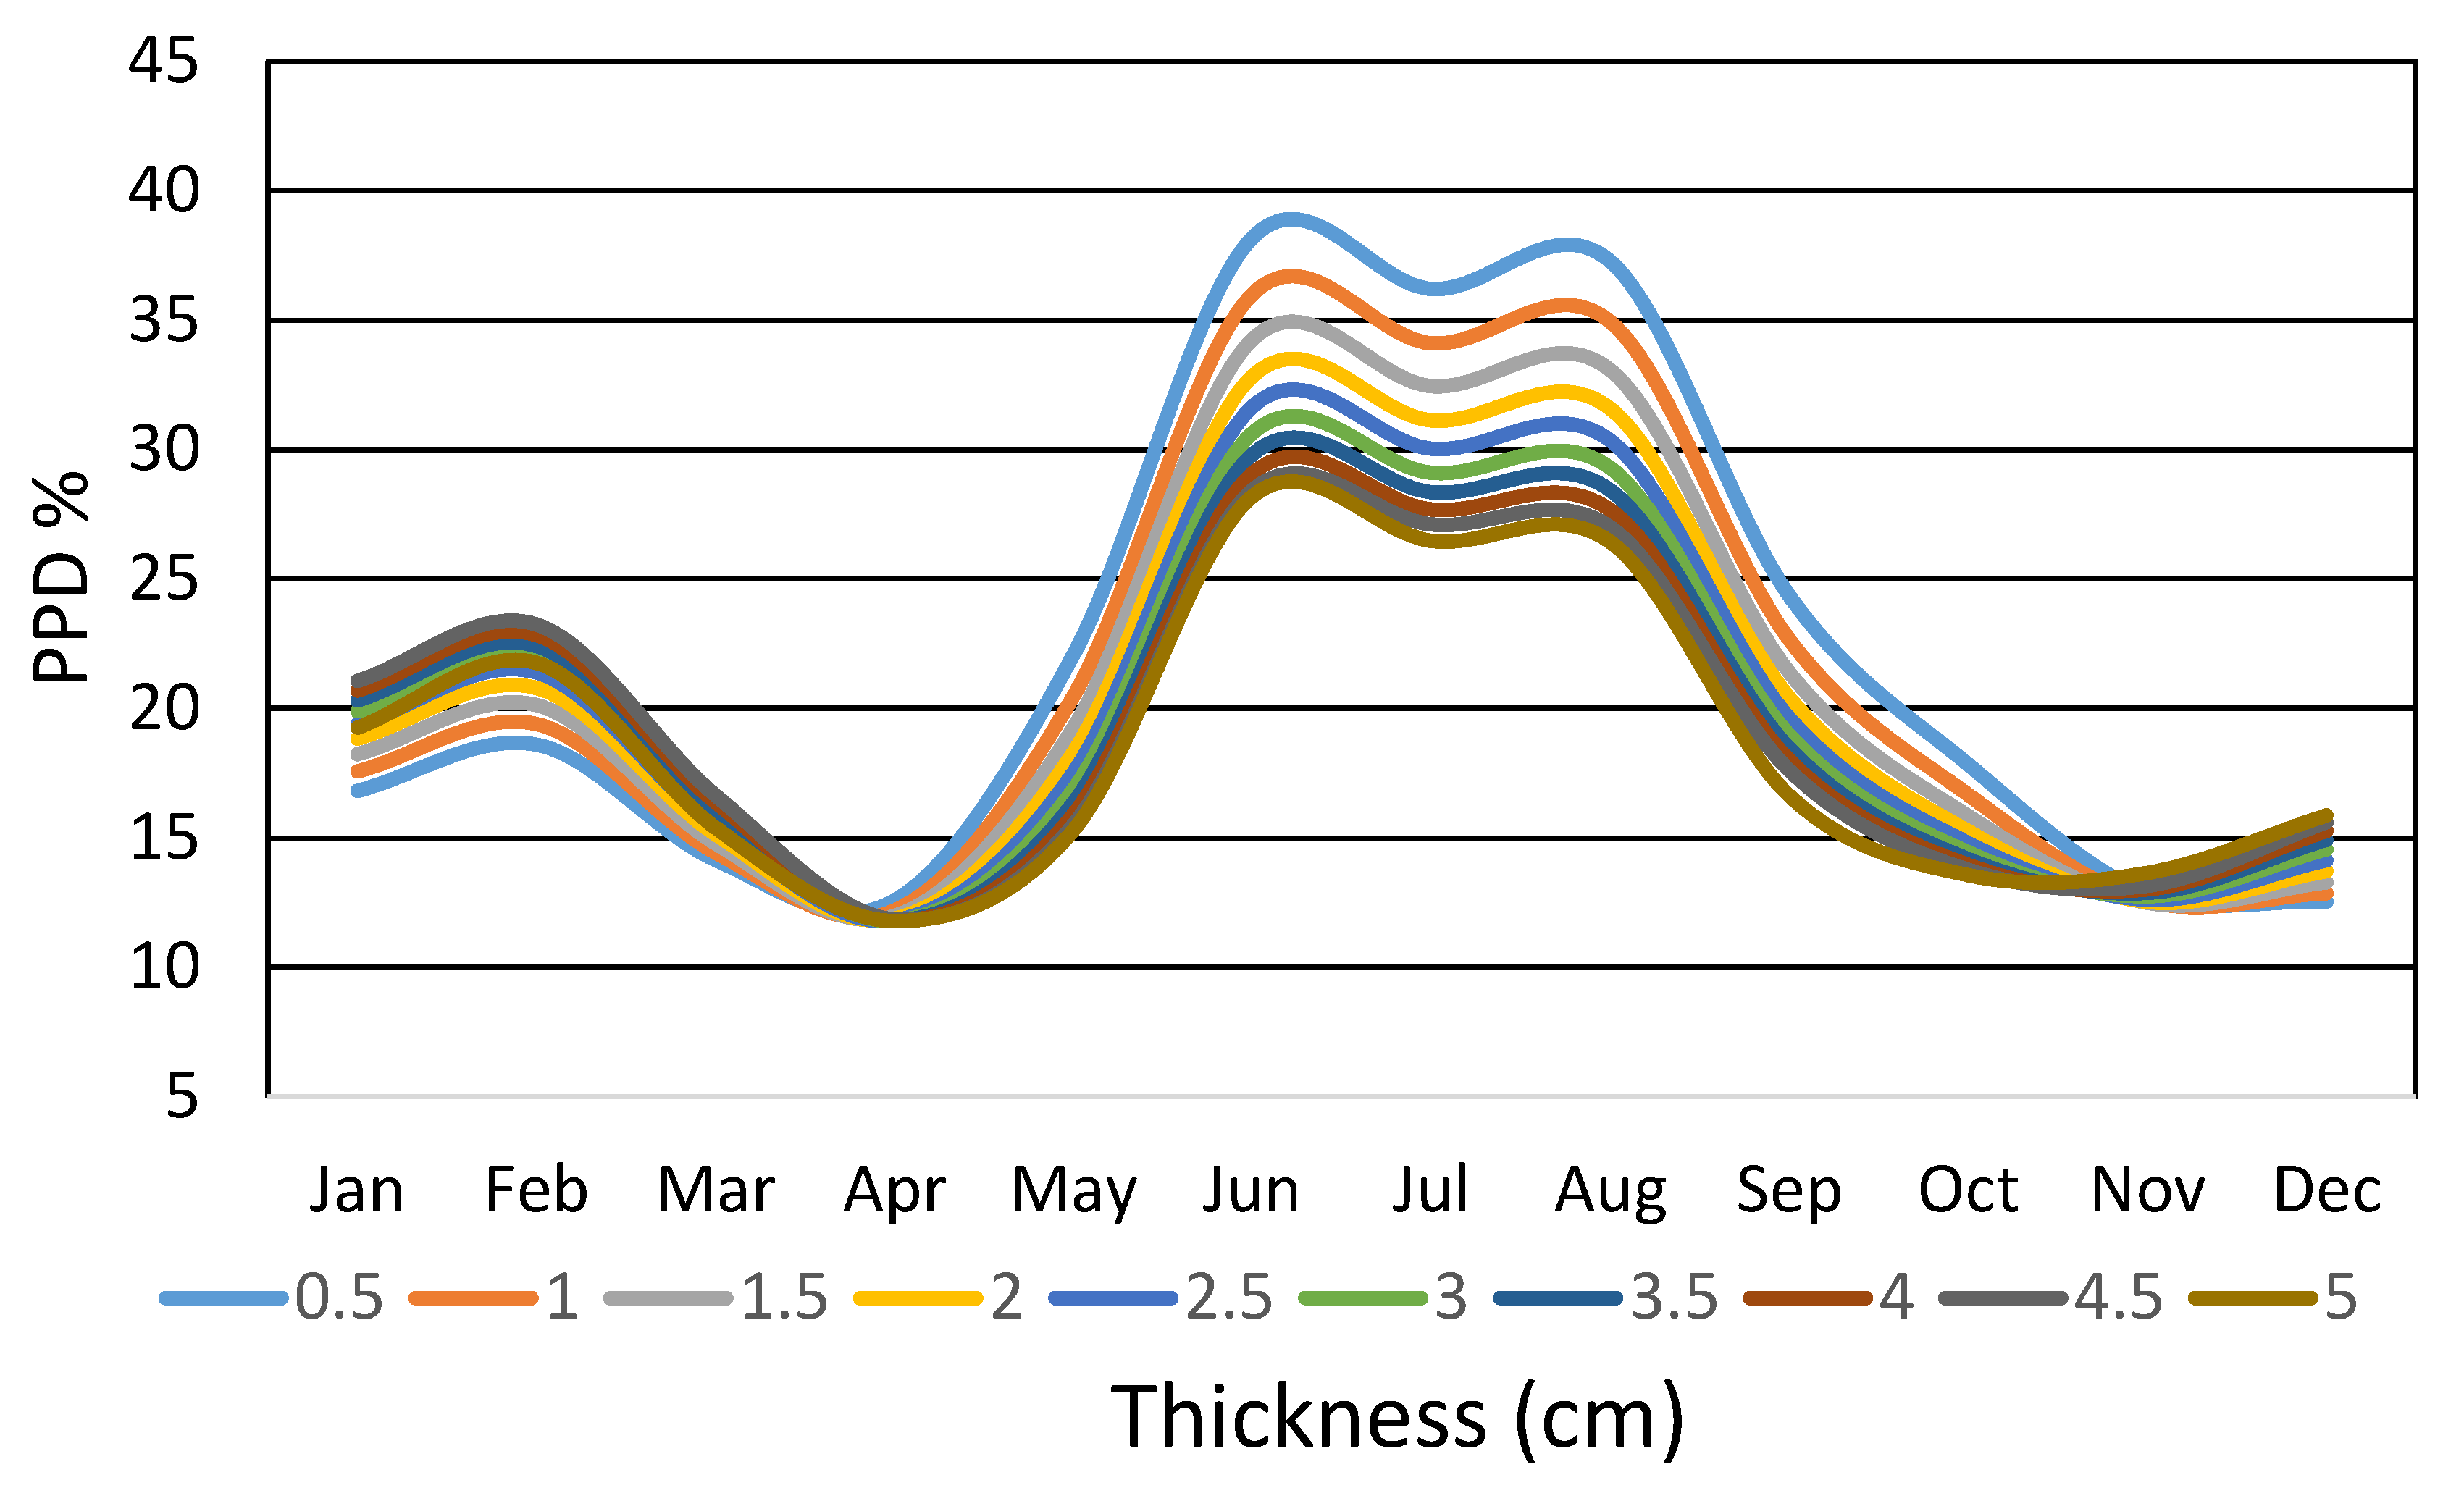
Figure 3 presents the results of the daily mean values of PPD for different thicknesses of the PU insulation, using the Curitiba, Brazil, climatic archive (TRY [
23]).
In the months of June to August, the results showed the worst performance, with values between 26% and 39% of PPD. April and November showed the best thermal comfort index, with PPD values varying between 12% and 13%. In relation to the thickness effect, a behavior inversely proportional to the PPD values to the months of winter and summer was observed. In the case of PU insulation, the increase in thickness from 0.5 cm to 5 cm resulted in a maximum reduction of 14% in PPD (from 39% to 26%) in the winter months (South hemisphere) and an increase of 5% in the summer (from 18% to 23%). This effect can be attributed to the mild cold climate of Curitiba, Brazil, and the daily average used, where the nocturnal PPD values have a significant influence on the results. Other insulations had similar behavior to the PU (not shown) due to similar thermal diffusivity.
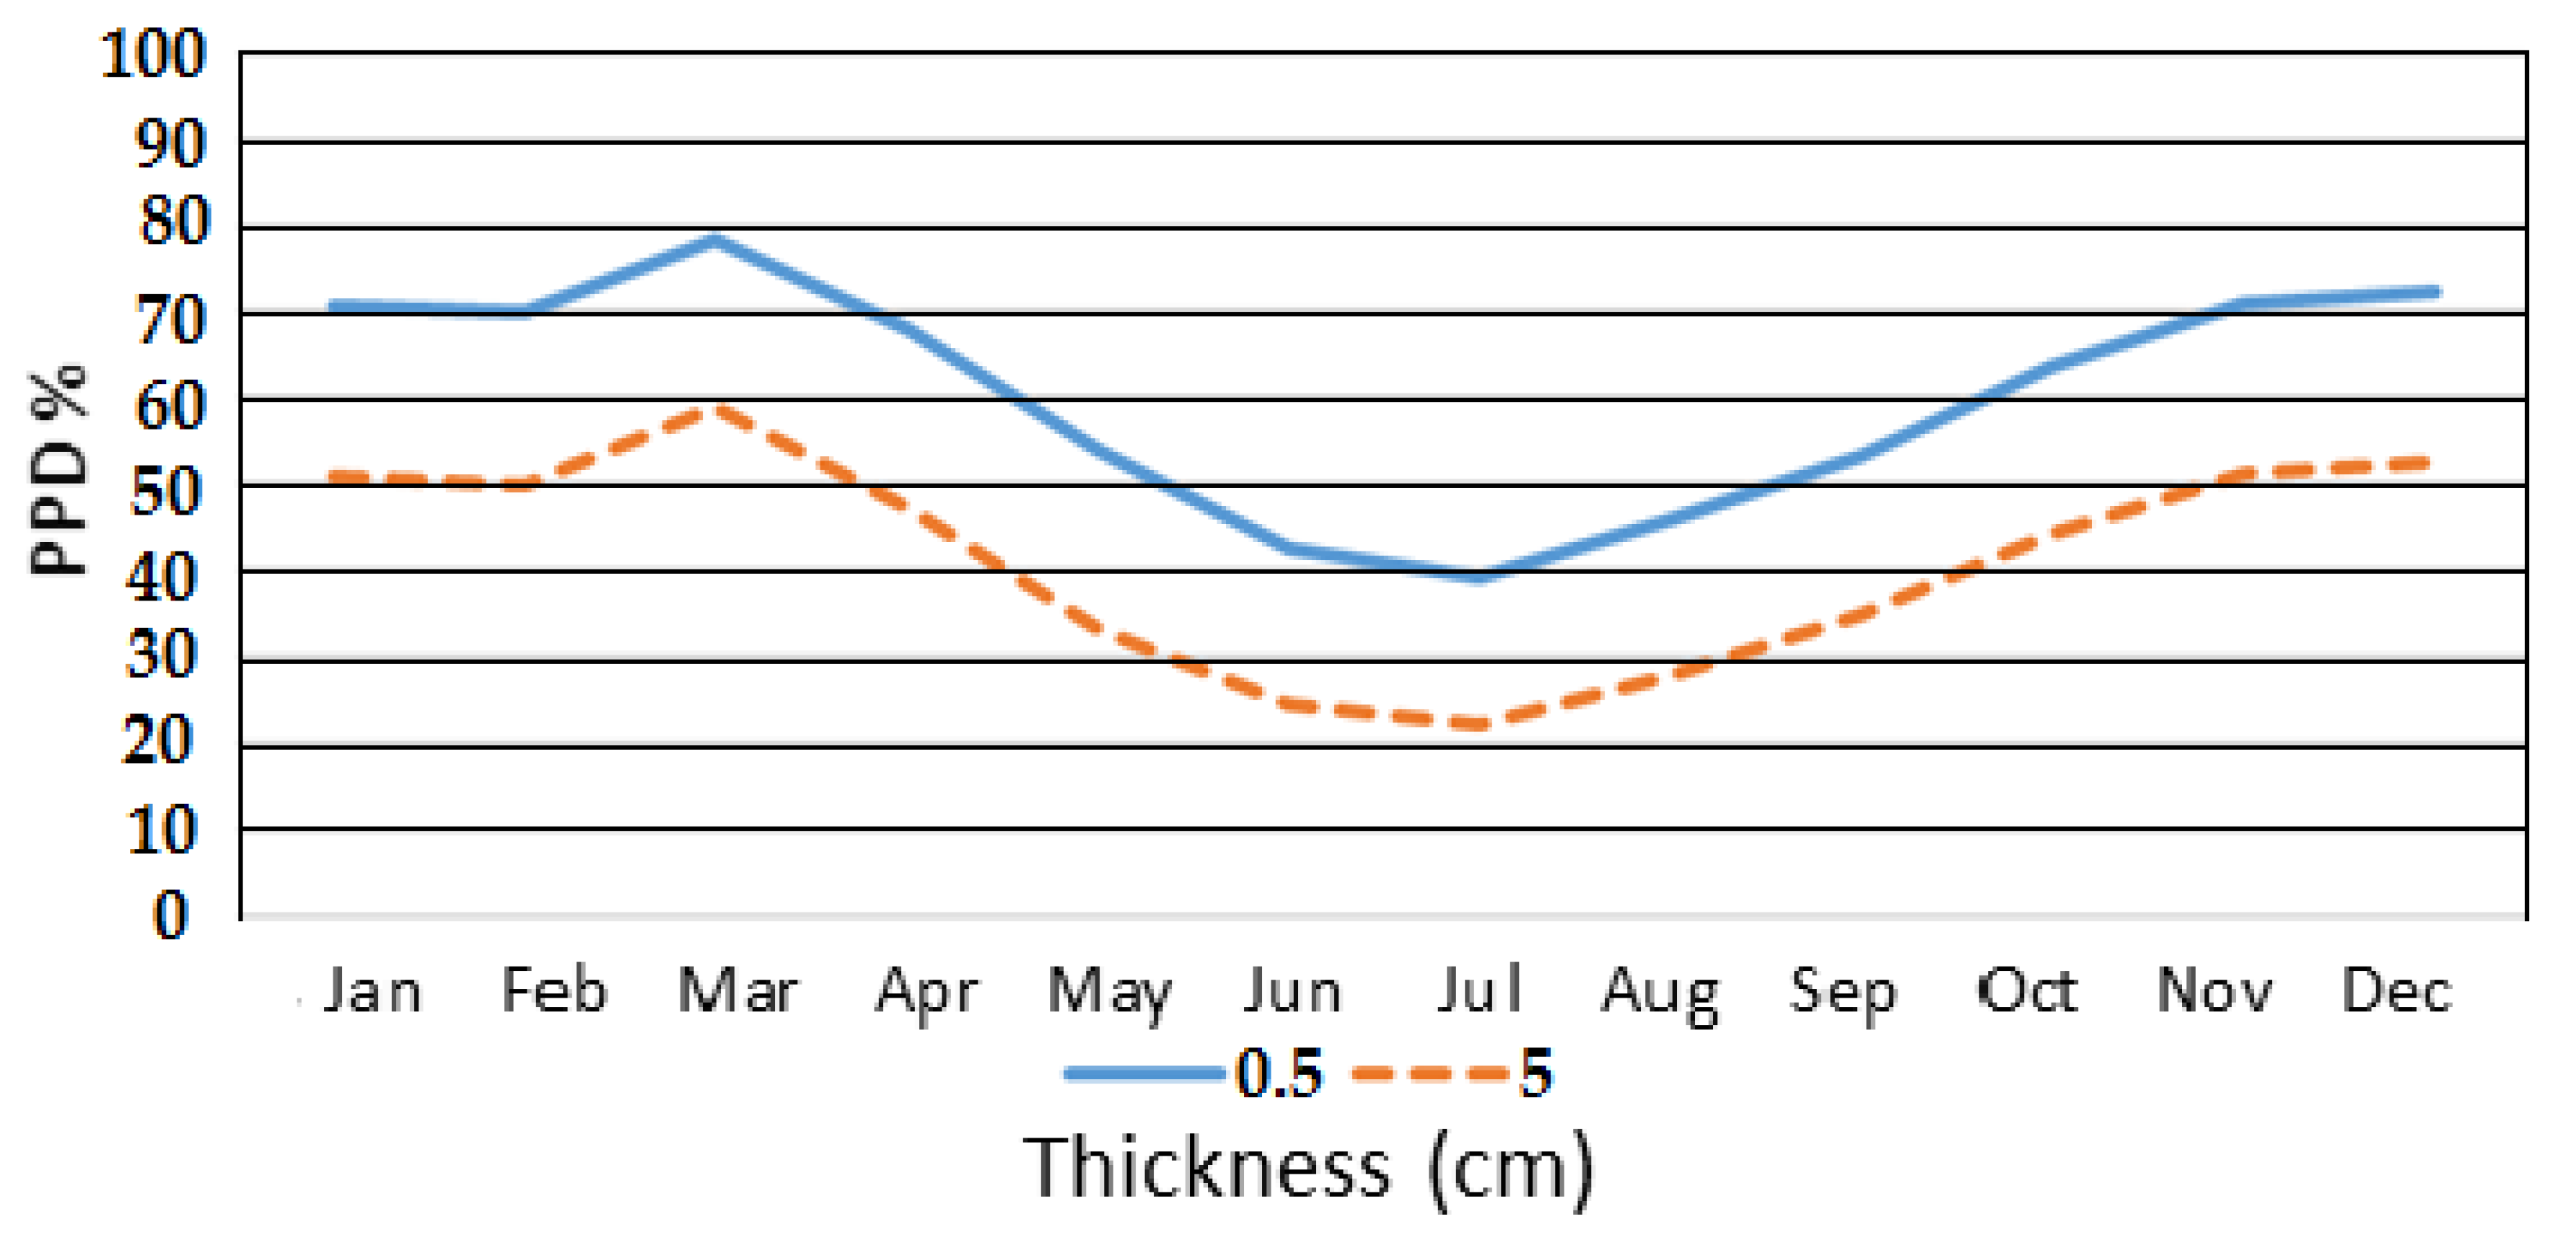
In order to verify the effect of the insulation for a city with a hot climate (tropical),
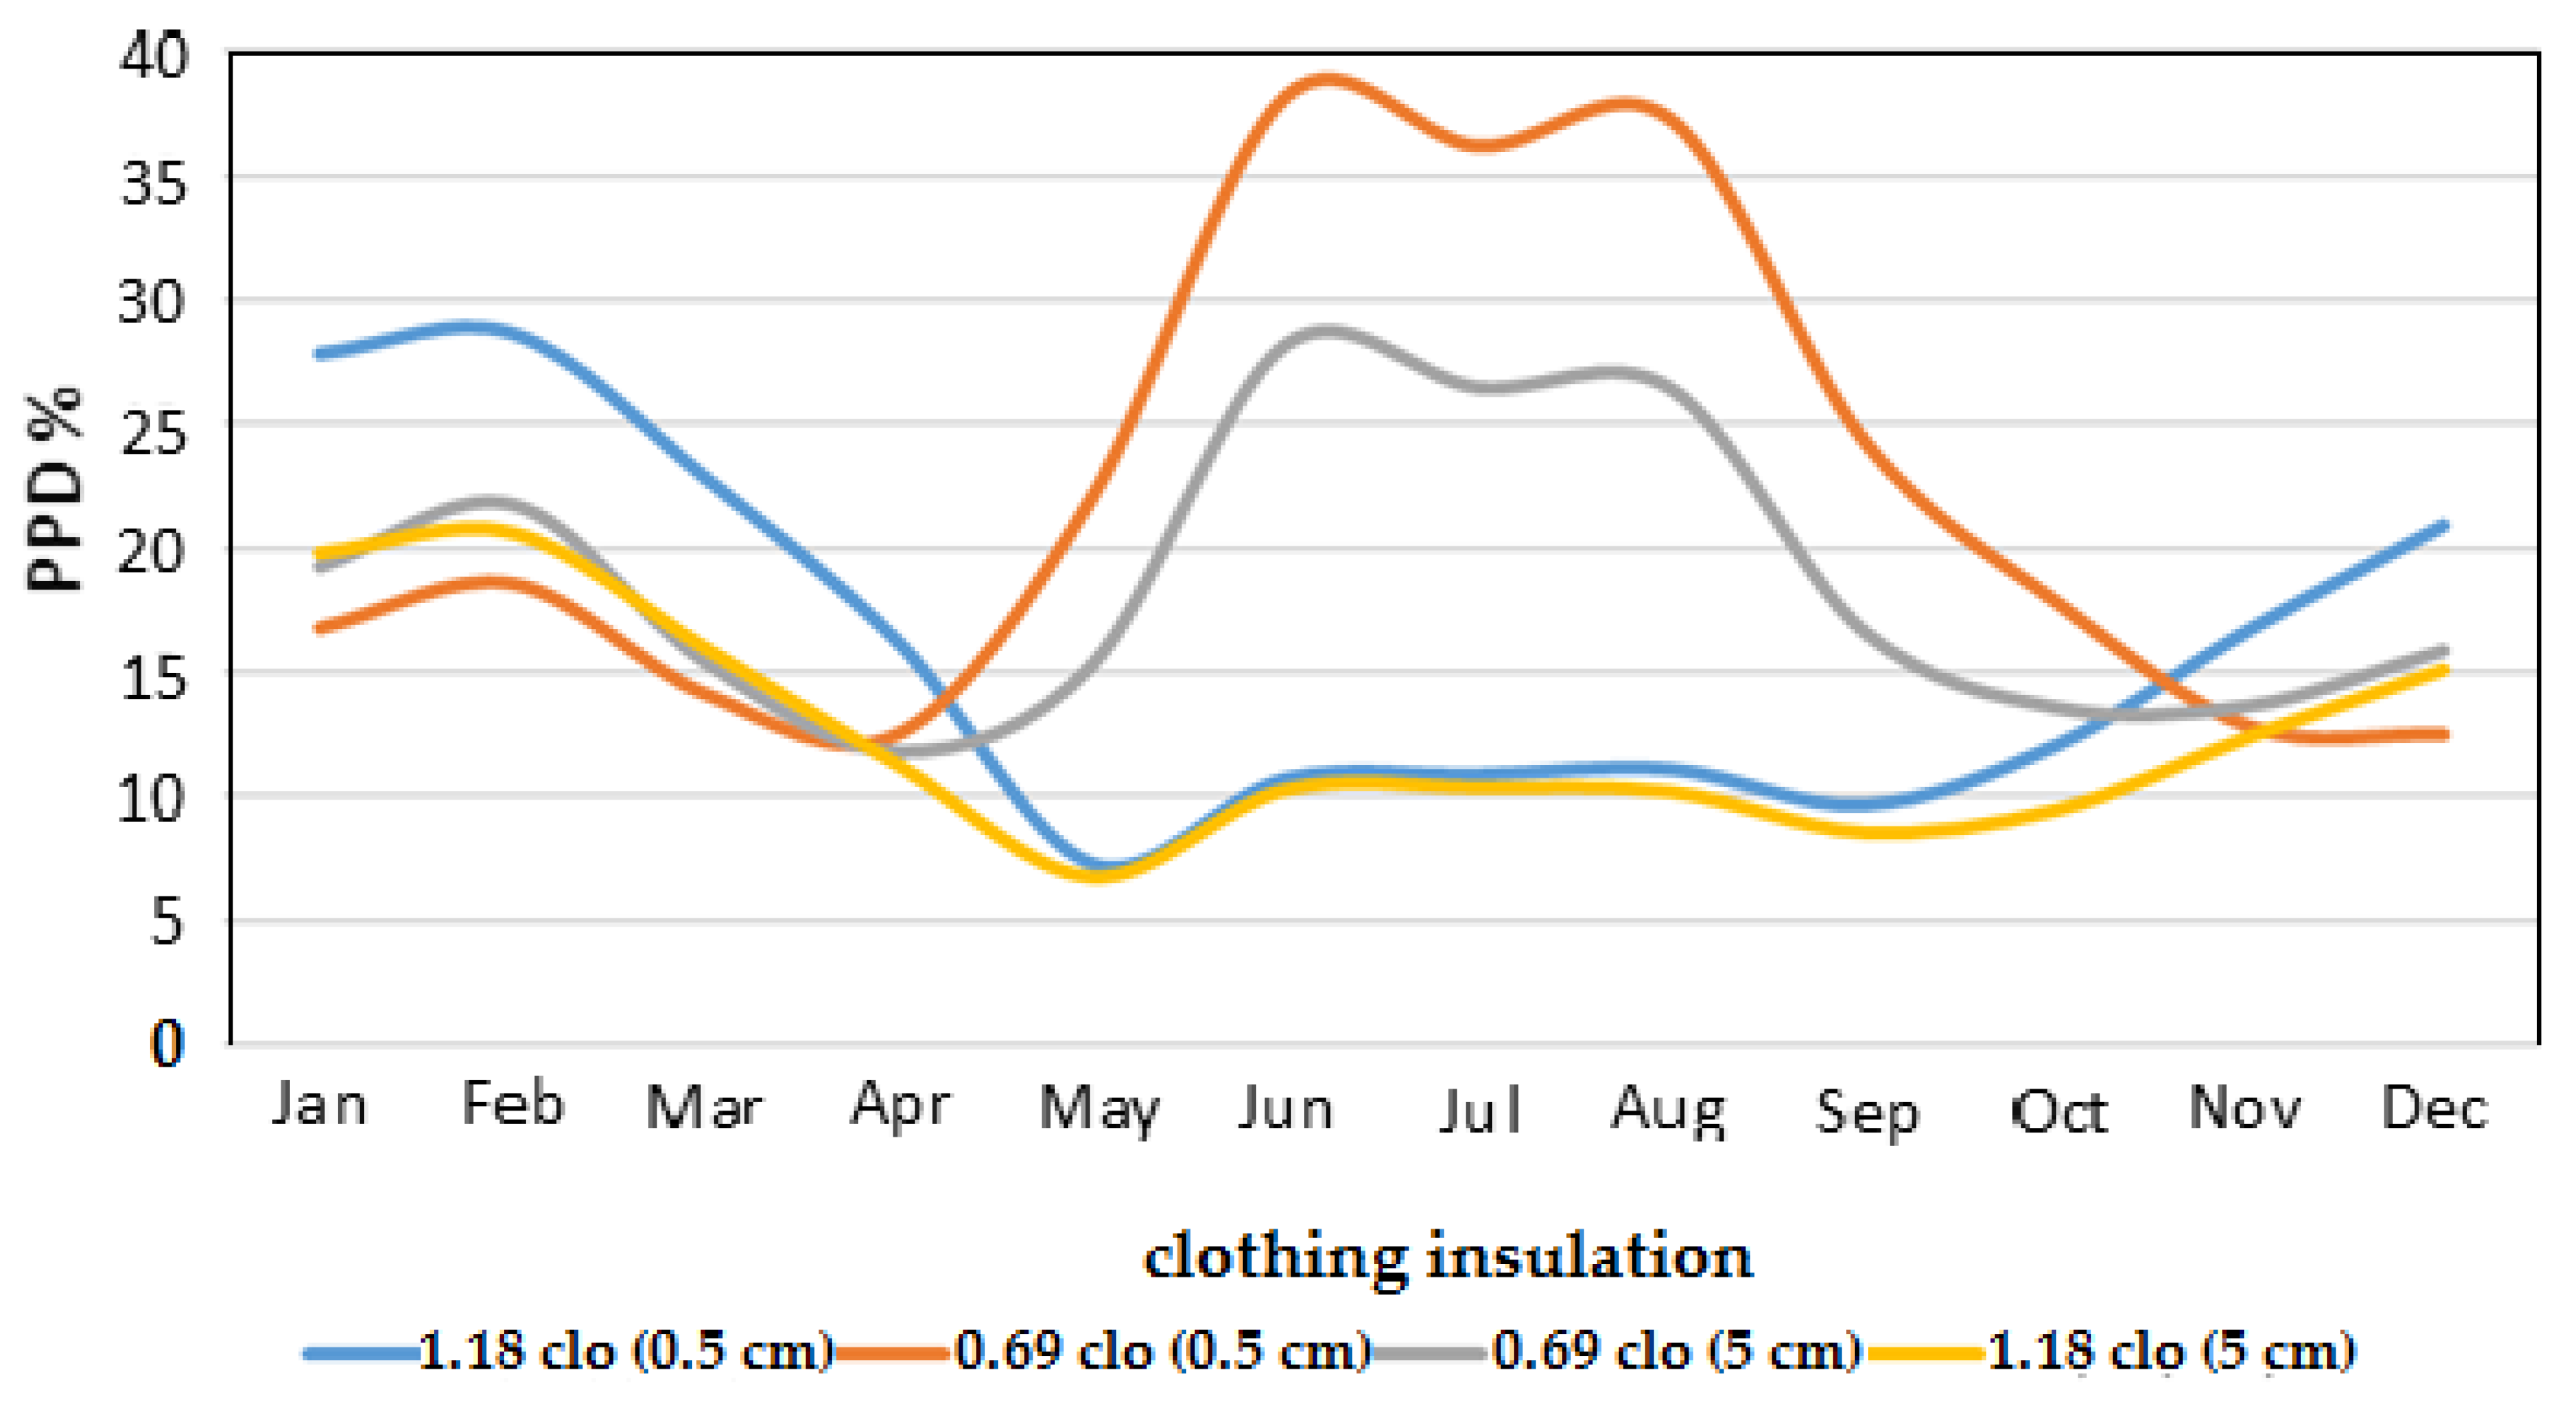
Figure 4 shows the PPD (%), using the PU insulation (0.5 cm and 5 cm) to the city of Recife, Brazil. Unlike Curitiba, Recife presents less oscillatory results, with a significant improvement of thermal comfort over the year. To verify the clothing effect in the PPD index, PU was used (0.5 cm and 5 cm) on the roof and the Curitiba climatic archive was considered in the simulations. Clothing insulation of 0.69 clo and 1.18 clo also were utilized in the analysis.
Figure 5 shows that when a high clothing insulation (1.18 clo) is adopted, the effect of the insulation on the roof is not significant in the winter months for the PPD values. However, for a low clothing insulation (0.69 clo) in this period, PPD showed a reduction of 10% with increasing insulation thickness on the roof. For the summer, the increase in thickness of the insulation decreased the PPD by 8% (1.18 clo). In the case of low clothing insulation, the opposite behavior was observed, suggesting the need for an increase in the thermal load for a PPD reduction.
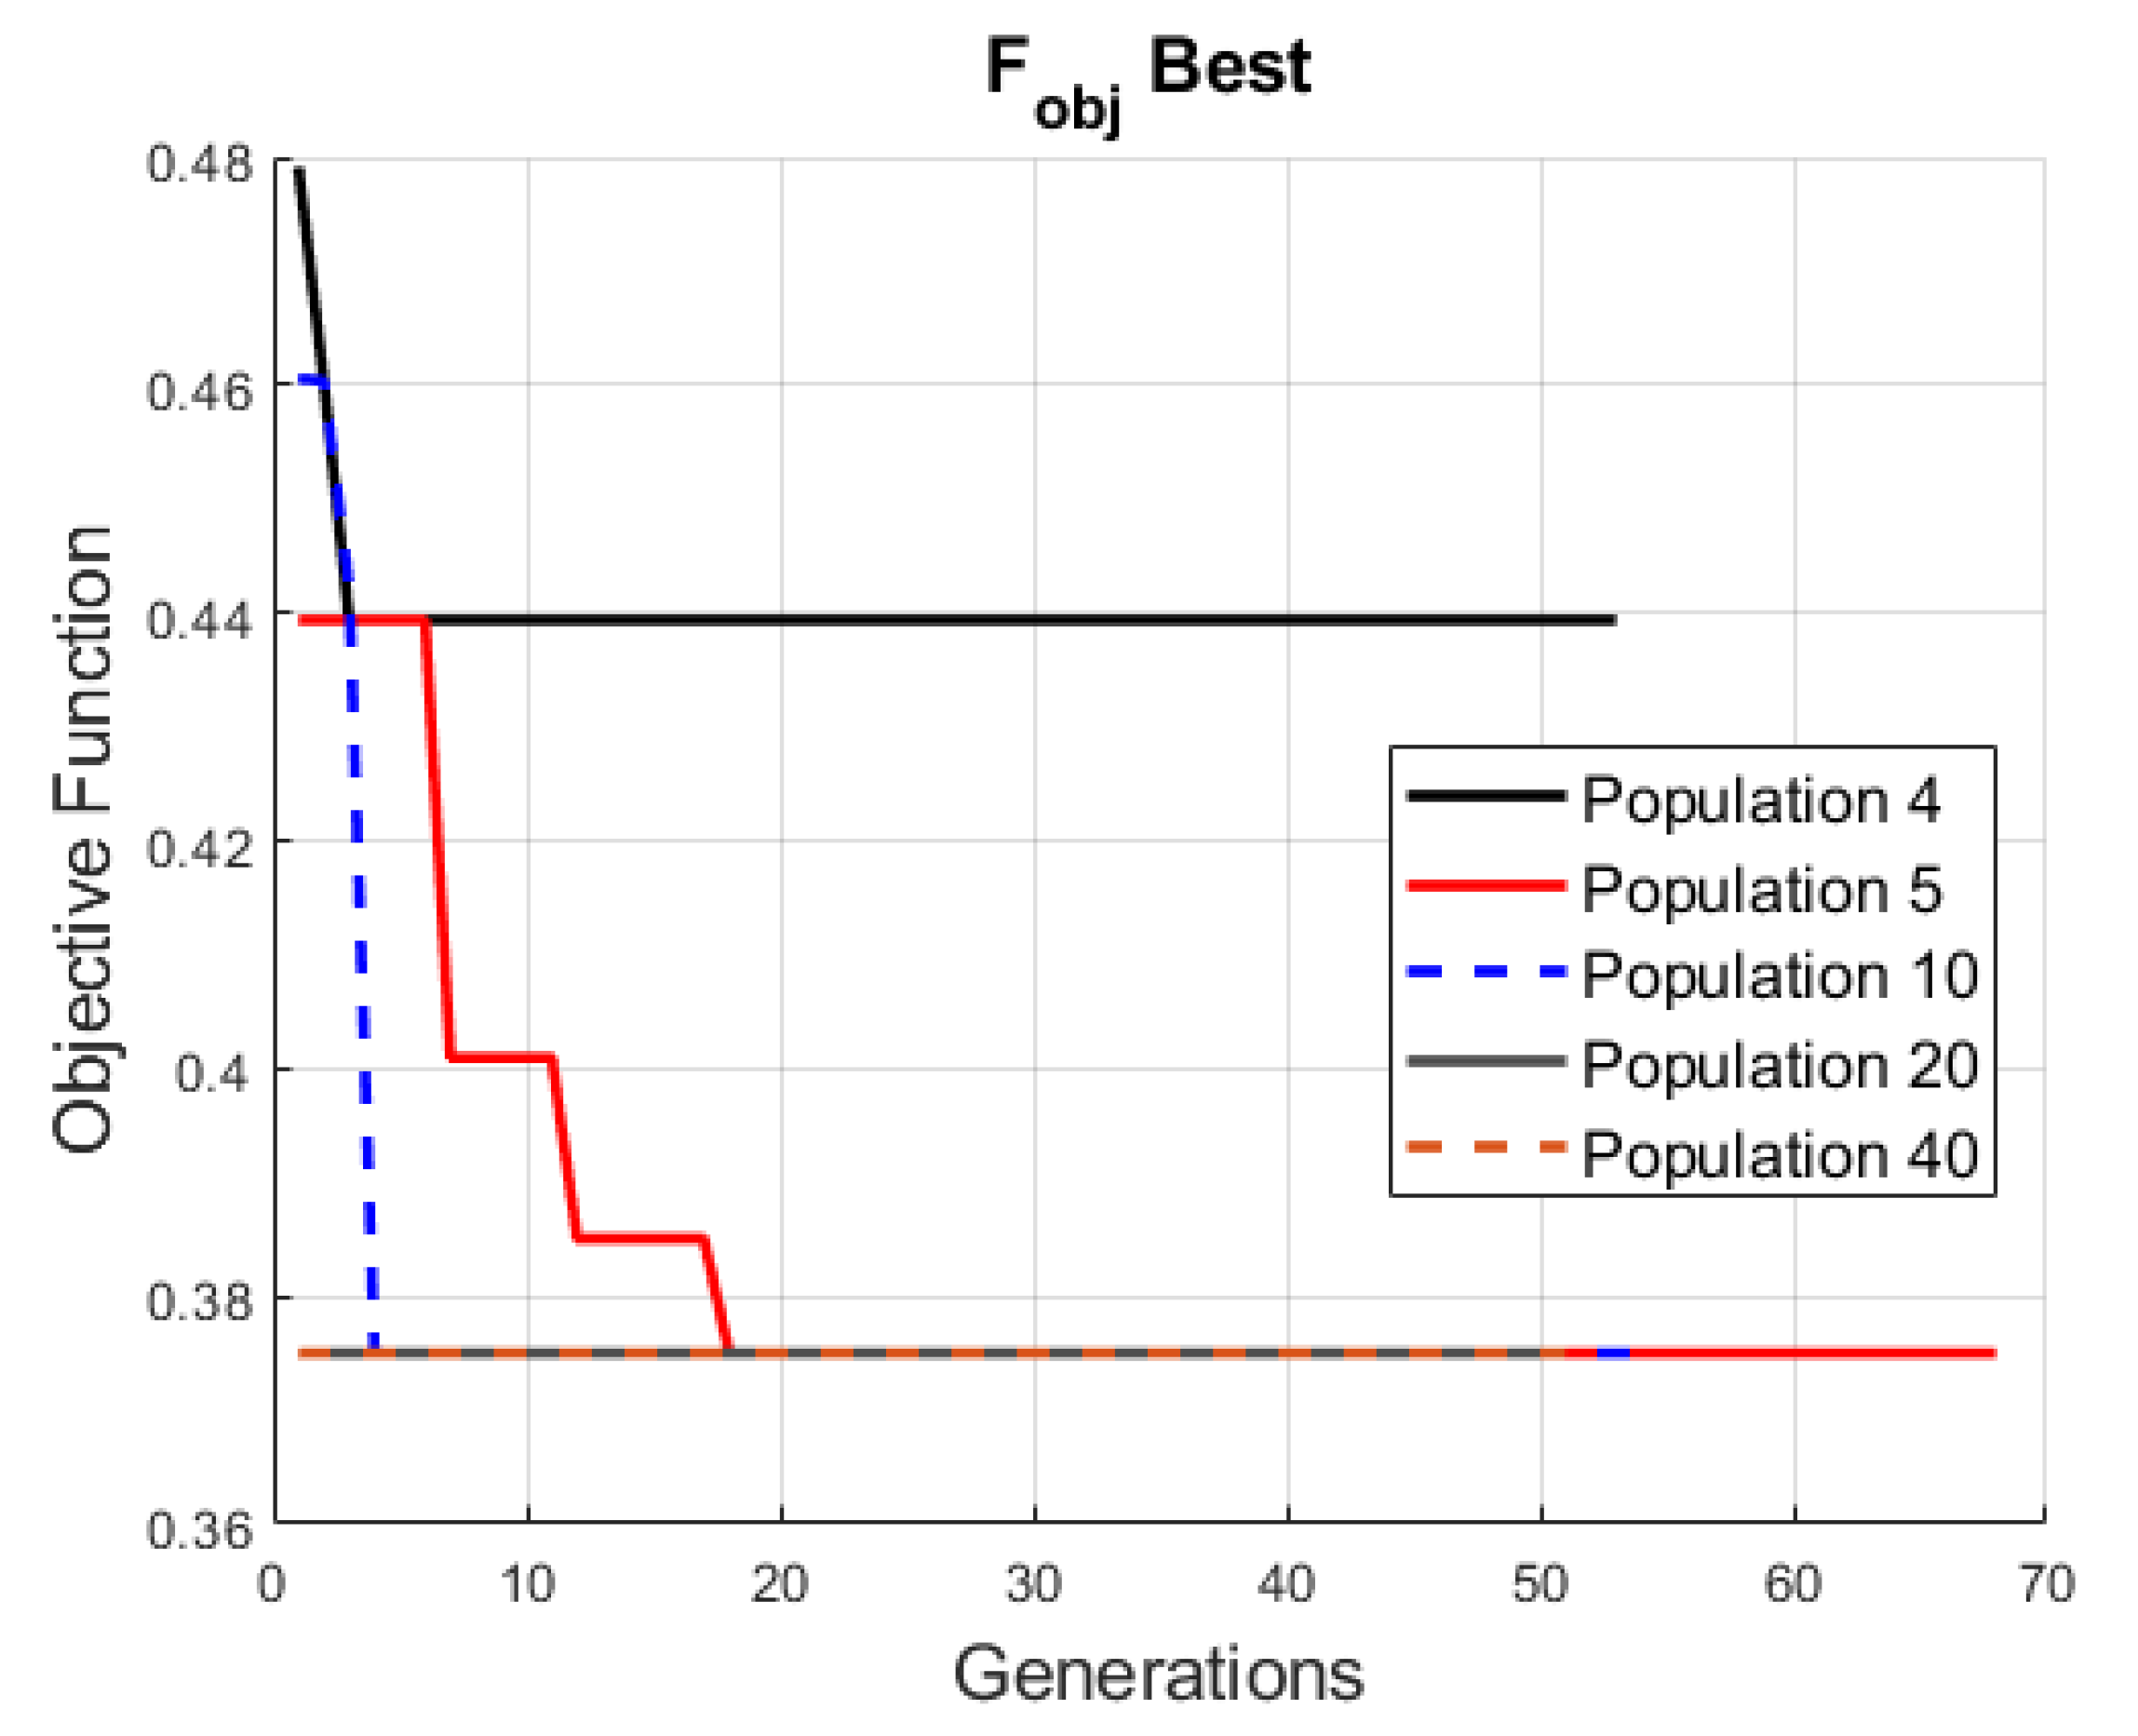
In the optimization process, a minimal population was analyzed, shown in
Figure 6.
As shown in
Figure 6, after 4 generations there was not much improvement from the initial conditions and the local best prevail. The minimum requirement for convergence was 5 population that allowed the population to have genetic operations along the generations to improve the results.
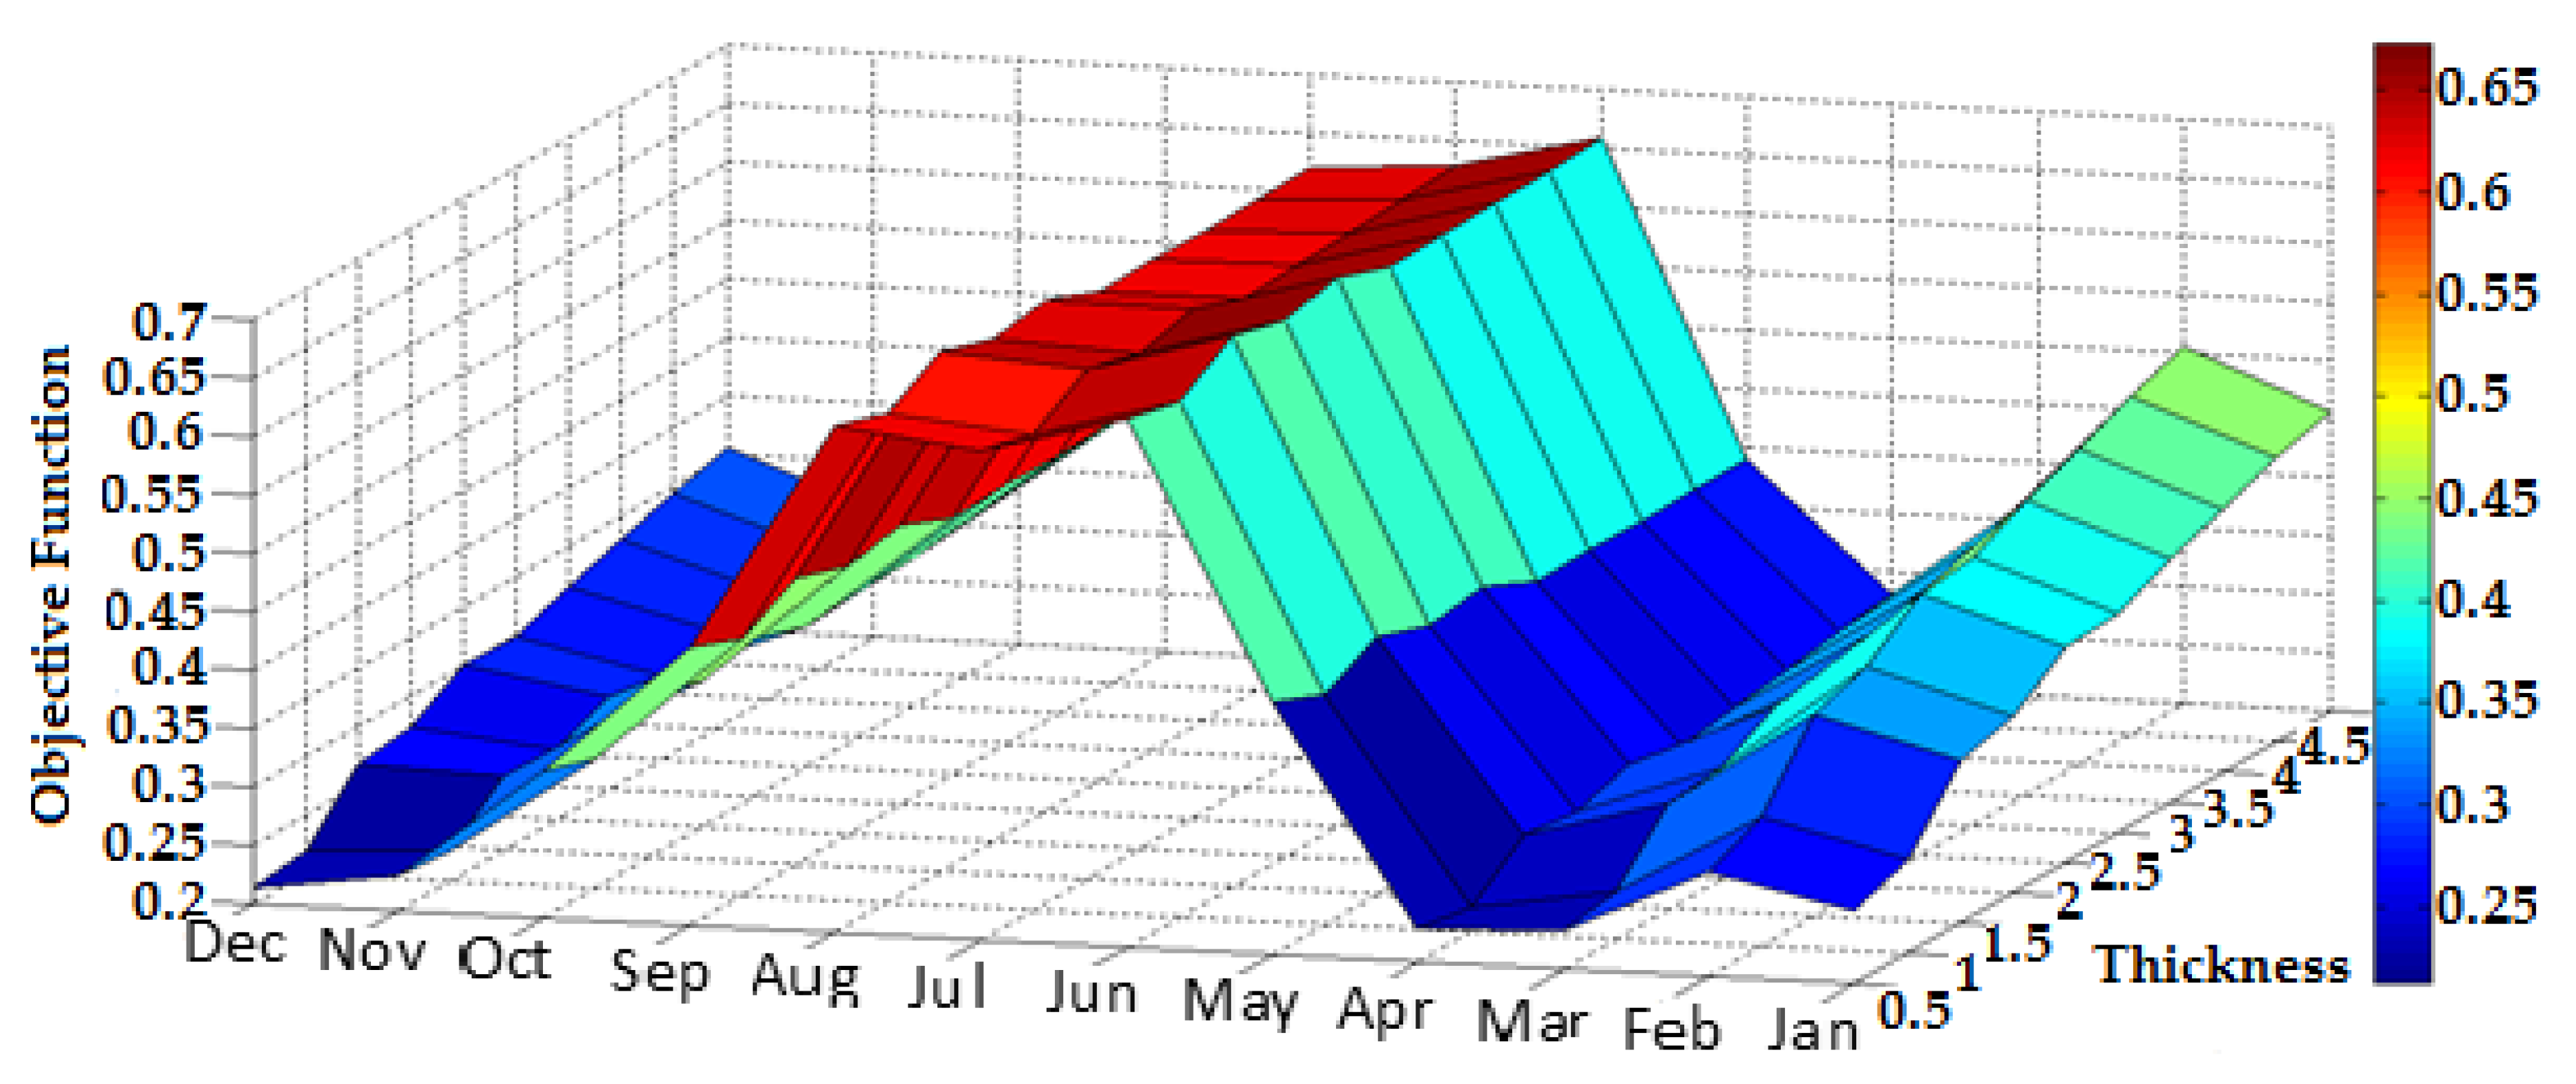
The objective function had the best result when its value tended to a minimum. In the PU case (
Figure 7), the best values were found between March and April, for thicknesses of 0.5 cm to 1.0 cm, and in December, for the same thicknesses. From June to August, the objective function values presented the worst results, with behavior similar to the PPD values, shown in
Figure 3. This characteristic was expected due to the PPD weight of 60% attributed in the objective function.
Table 4 presents the maximum and minimum values obtained in the objective function for all insulations. According to the results, PU and the rock wool had the lowest values for the objective function. However, taking into account the other proposed criteria and following the convergence criteria, it is possible to establish a ranking of the insulators with the respective thickness.
Table 5 shows that the PU insulation with a thickness of 1 cm presented the lowest value of the objective function. In sequence, the rock wool presented the best results (some thicknesses), followed by fiber glass and EPS, respectively.
NBR 15220 (Brazilian Standard [
25]) establishes an overall heat transfer coefficient lower than 2 W/m
2K for the roof.
Table 6 presents the approximate thickness of each insulation obtained through the equivalent thermal resistance.
Through the ranking presented in
Table 5, the position and the classification for each insulation is shown in
Table 7. In the choice, the nearest and lowest thickness has been considered. As observed in
Table 7, the rock wool (2 cm) is the best choice for the application in an industrial shed roof, considering the criteria of selection, building configuration and climate conditions.
4. Summary and Conclusions
This work aimed to provide an optimization tool able to assist in the choice of the best thermal insulation to be applied on the roof of an industrial shed. Beyond thermal comfort and costs, the vapor diffusion resistance factor and thermal diffusivity were also considered in the insulation selection.
Thermal comfort indexes (PPD) have been obtained through thermo-energetic simulations using the Domus software. In the analysis, 4 thermal insulations (polyurethane (PU), expanded polystyrene (EPS), rock wool and glass wool) were considered and 10 different thicknesses (0.5 to 5 cm) were verified. The best choice was obtained using the genetic algorithm (GA) technique applied to the multicriteria selection. The optimization results showed that the polyurethane (PU) insulation applied at a thickness of 1 cm was the best option for installation on the roof, considering the functional parameters of the building, occupant metabolic activity, clothing insulation and climate conditions.
Taking into account the Brazilian standard (NBR 15220) which establishes an overall heat-transfer coefficient lower than 2 W/m2K for insulated roofs, a rock wool insulation with 2 cm of thickness presented the best classification.
The ranking of the insulations was obtained through the weighting factors chosen arbitrarily for the objective function. Other weighting factors could lead to a different ranking. For example, in underdeveloped countries, the term cost would have a greater weight in objective function. On the other hand, in humid regions, the vapor diffusion resistance factor could be more significant. In addition, other clothing insulation or human metabolic rates used to calculate the PPD could modify the results presented. However, the use of the genetic algorithm proved to be capable of generating a diverse set of solutions and is able to capture extreme solutions to any objective function. For future work, analysis of an adaptive thermal comfort model in the choice of the best insulation is suggested. Other parameters of a building also can be analyzed in order to increase the energy efficiency of buildings, such as: building orientation, window area and localization, paint color and finishes, among others.


