Abstract
This paper aims at highlighting the main mechanical parameters controlling the behavior of the so-called ‘acceleration-sensitive’ non-structural components (NSCs). The first reports a short review of the current state of knowledge and the critical issues dealing with the prediction of the seismic response of NSCs. Then, the paper presents the results of a numerical parametric analysis intended to capture the key features of the coupled dynamic response of a two-degree-of-freedom (2DOF) system supposed to be representative of both main structure and ‘non-structural’ component (NSC). The main parameters controlling the dynamic response of NSCs emerge from this study, which could pave the way towards formulating more mechanically consistent relationships for evaluating the peak accelerations induced by seismic shakings on NSCs in buildings.
1. Introduction
Significant research efforts have been produced in recent decades with the aim to formulate sound criteria for the design of structures in seismic areas resulting in the current generation of seismic codes and guidelines [1]. Such codes provide designers with consistent performance-based approaches for designing and assessing structures against earthquake-induced actions, although more comprehensive and reliability-based approaches [2] could be implemented in future evolutions. However, a series of critical issues, not completely addressed by the current codes, emerge by analyzing damage suffered from existing structures in recent earthquake events [3]. Specifically, inaccurate predictions of the seismic response of “non-structural components” (NSCs) [4,5,6] have emerged, for instance, in the aftermath of the event occurred in Emilia Region, Italy [7], where several precast buildings mainly suffered damage related to inadequate design of connections between structural members and NSCs [8,9]. Therefore, predicting the seismic response of NSCs is perceived as one of the most important challenges of the seismic engineering research community [10,11].
Several definitions for the very wide class of ‘objects’ often referred to as NSCs are available both in the scientific literature and in recent seismic codes [2]. Generally, any ‘object’ that does not contribute to support both gravity and seismic actions in the model considered in structural analysis is considered a ‘non-structural’ or ‘secondary’ element. As matter of fact, masonry infill, partitions, finishing, suspended ceilings, as well as dedicated equipment needed for the specific purpose of the construction under consideration are the most common NSCs in buildings.
Moreover, recent scientific research and technical codes introduced further definitions and classifications of NSCs: a review of these definitions is available in the literature [12]. Generally, they are based on different aspects, such as the component’s purpose or function, the way in which it is actually connected to the main structure and the sensitivity to particular aspects (acceleration, displacement, and so on) of the dynamic response.
Over the classification of NSCs, the main objective of various seismic codes in force in earthquake-prone countries (e.g., [1,13,14,15,16]) is to evaluate the maximum acceleration, and thus the maximum inertial force, on NSC induced by the expected seismic shaking. However, rules and relationships provided with this purpose are generally simple (not to say simplistic) and disregard fundamental parameters which could significantly affect the dynamic response of NSCs.
As matter of principle, rules and relationships currently provided involve few parameters dealing with the intensity of expected earthquakes, the elastic parameters of both main structure and NSC and the position in elevation of the NSCs as part of the main structure. A thorough discussion about the limitation of code formulations has been recently proposed [12]; specifically, it emerges that the analyzed code-provisions either disregard or not explicitly consider the nonlinear behavior of the main structure that may clearly affect the excitation of the NSCs by filtering the input seismic signal [17].
Therefore, this paper presents a wide parametric analysis based on a two-degree-of-freedom (2DOF) system used for simulating the dynamic response of a general structure with generic “acceleration-sensitive” NSCs [18]. It should be intended as a further development of previous study [12]. In fact, the latter mainly proposed a wide state-of-the-art report about the historical evolution of code provisions for “acceleration-sensitive” NSCs; then, it presented a preliminary parametric analysis demonstrating that the current EC8 [1] formula fails in predicting the maximum seismic-induced acceleration on those components, as it misses considering some relevant parameters. Therefore, the present paper is characterized by the following novel elements:
- -
- it recalls the definition of two alternative response parameters for describing the response of “acceleration-sensitive” NSCs;
- -
- it shows the how several mechanical properties, currently neglected or disregarded by code provisions, actually affect the average value of the maximum inertial force acting on NSCs;
- -
- it proposes some preliminary considerations about how the record-to-record variability of the generic “acceleration-sensitive” NSCs under consideration.
Section 2 summarizes the main features of a 2DOF system intended at simulating the interaction between “acceleration-sensitive” NSCs and main structure: the model is utilized for executing a parametric analysis intended at covering a wide set of natural seismic records and structures characterized by variable values of the relevant parameters. The most relevant results of the proposed parametric analysis are summarized in Section 3: they mainly aim at revealing the relevant parameters affecting the maximum seismic-induced accelerations on NSCs. It is worth highlighting that this study does not cover the case of “deformation-sensitive” NSCs (such as the in-plane behavior of masonry infills and partition walls) [18], whose mechanical interaction with the main structure needs to be described through different parameters [19].
2. Parametric Investigation
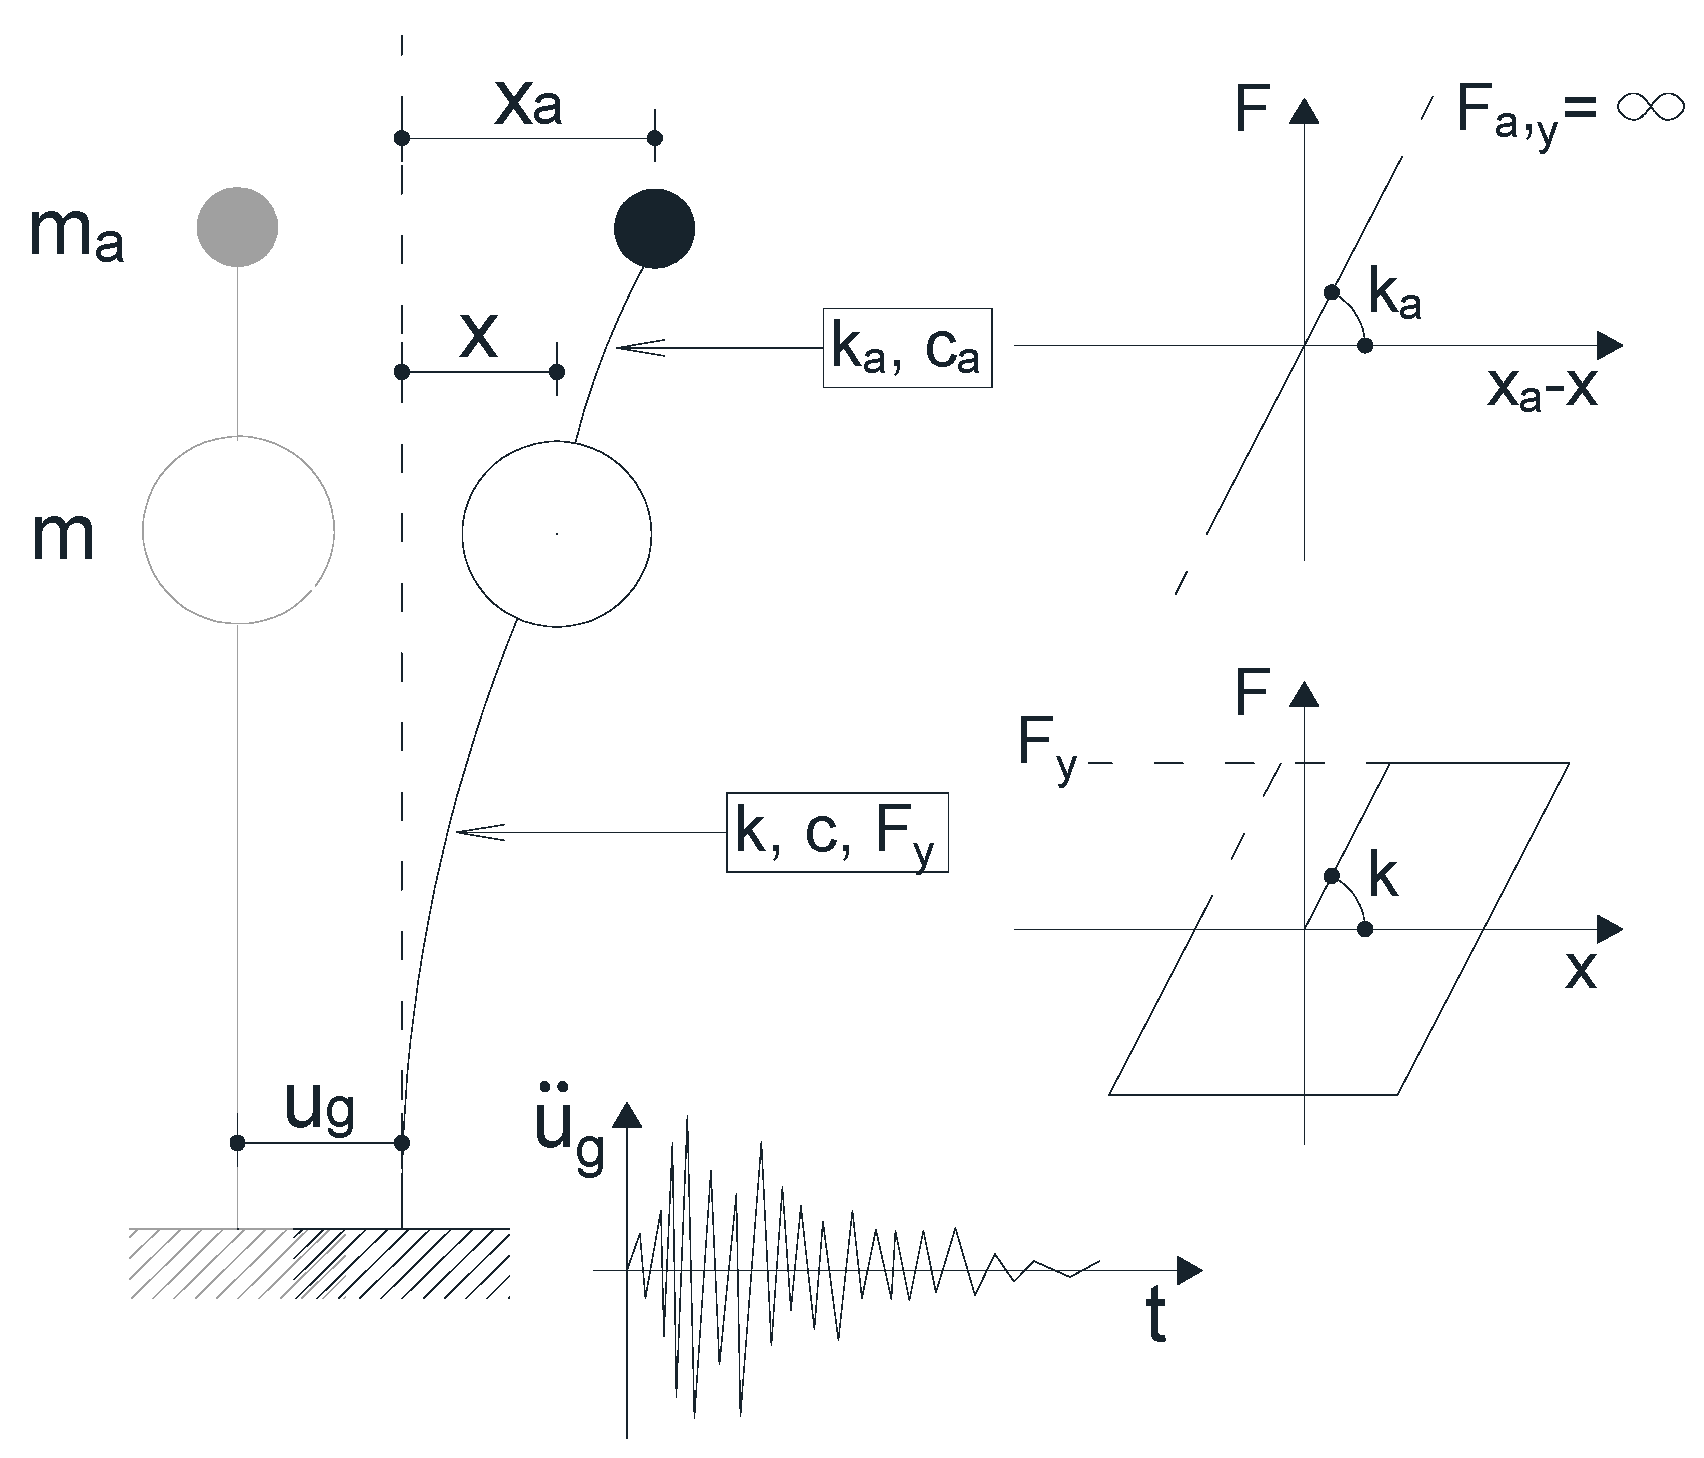
The interaction affecting the dynamic response of the main structure and the NSC connected to it is investigated by defining a two-degree-of-freedom (2DOF) system, which is considered as the simplest possible representation of the dynamic problem under consideration: Figure 1 represents such a system as it is utilized in the present study.
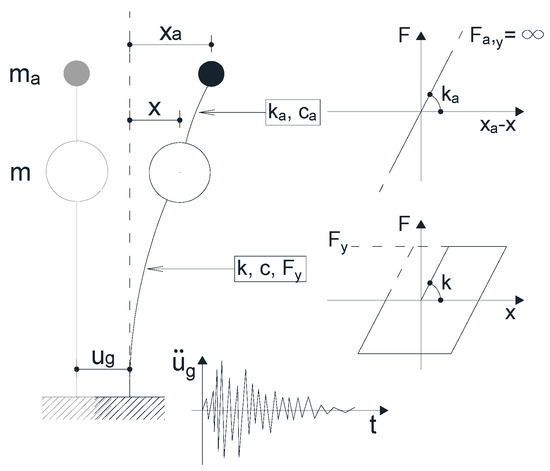
Figure 1.
2DOF system for nonlinear dynamic (time-history) analyses.
An elastic-perfectly-plastic behavior is supposed for the main structure. It is characterized by elastic stiffness k, mass m, viscous damping c and yielding force Fy (Figure 1). The parameters x and denote the relative displacement and velocity of the main structure with respect to the ground, respectively. The NSC is represented by its mass ma and it is connected to the main structure by an elastic element with stiffness ka. The relative displacement of the NSC with respect to the ground is denoted with xa. The viscous damping coefficient ca, which relates the viscous force with the relative velocity of the NSC with respect to the ground, completes the description of the 2DOF system under investigation.
However, nonlinear behavior is not considered for the NSC in this study, since it is mainly devoted to evaluating the maximum forces induced on secondary components without covering aspects related to displacements.
The system represented in Figure 1 allows to consider the coupled behavior of the main structure and NSC and can result more appropriate than systems generally adopted in similar studies which are often based on the dynamic analysis of two uncoupled single-degree-of-freedom (SDOF) systems in series [20,21]. As matter of fact, the latter systems are based on the simulation of a SDOF system representing the main structure whose response is, subsequently, considered as the ground motion for the secondary SDOF system which simulates the NSC. Such a study can result in accurate prediction if the NSC-to-structure mass ratio is quite small (i.e., ma/m→0) and thus the mass ma does not influence the dynamic response of the main structure. For sake of generality, the present study does not consider this approximation and a system of coupled equilibrium equations is actually solved by means of a piecewise approach based on the Newmark-beta numerical algorithm [22]. This algorithm is used in order to handle nonlinearities in the dynamic response of the system
In Equation (1) the reaction Fr(x,k,Fy) is the unique nonlinear part which includes both the relative displacement x of the main structure and its stiffness k and yielding force Fy (Figure 1).
A set collecting 264 natural seismic records has been employed as ground motion in the nonlinear time-history analyses of the 2DOF system described above carrying out a very wide parametric analysis. This set collects natural records considered in a significant study devoted to investigating the nonlinear response of SDOF systems [23].
The main parameters that govern the dynamic response of the 2SDOF system representing the main structure and NSC (Figure 1) can be easily derived from Equation (1). As matter of fact, the mass ratio ma/m, as well as other parameters usually considered for simulating the response of SDOF systems can be identified as key parameters controlling the response of both the main structure and the NSC:
The elastic period T and the damping ratio ξ [22] defined in eqs. (2) and (3) for the main structure and the NSC, respectively, completely control the response of the 2DOF system in the linear-elastic range. Thus, a linear time-history analysis performed for a given seismic record the allows to evaluate both the maximum inertial force on the main structure Fel and the one induced on NSC Fa,el. Then, the elastic threshold Fy denoting the yielding of the main structure (Figure 1) can be easily defined as a further quantity of relevance in this parametric analysis as it corresponds, in principle, to a certain value of the force reduction factor R,
However, the yielding force of the NSCs could be defined in a similar way, but it is omitted in this study as the response of the NSC is kept in the linear range. Finally, the parameters defined above have been changed within the range of variation defined below:
- mass ratio ma/m ∈ {0.01; 0.001};
- main structure period T1 ∈ [0.2 s; 2.0 s];
- secondary period Ta ∈ [0.1 s; 5.0 s];
- force-reduction factor R ∈ [1; 6].
Otherwise, both damping ratios ξ and ξa referred to the main structure and NSC have been assumed constant and equal to 0.05. As one can see, the considered mass ratios refer to a class of NSCs (such as systems, ceilings, etc.) whose mass is significantly lower (and fairly negligible) with respect to the structural one. The values of period T1 are intended to cover the whole range of low-medium rise buildings, either made of steel or concrete, meanwhile, the values assumed for Ta are intended to cover a wide spectrum of NSCs and their connections to the main structures, ranging from very stiff (and rigidly connected) components to fairly soft (or flexibly connected) ones. Finally, the values of R range from non-dissipative structures (R = 1) up to highly dissipative ones (R = 6, simulating high ductility steel frames).
3. Results of the Parametric Analysis
The parametric analysis has been performed considering the 264 accelerograms [23] and the range of variation of the relevant parameters listed in Section 2. Consequently, 142560 nonlinear dynamic analyses have been run on 2DOF systems considering five values of T1 (ranging between 0.2 s and 2.0 s) and nine for Ta (between 0.1 s e 5.0 s). Two mass ratios (0.01 and 0.001) and six values of R (from 1 to 6) have been also considered.
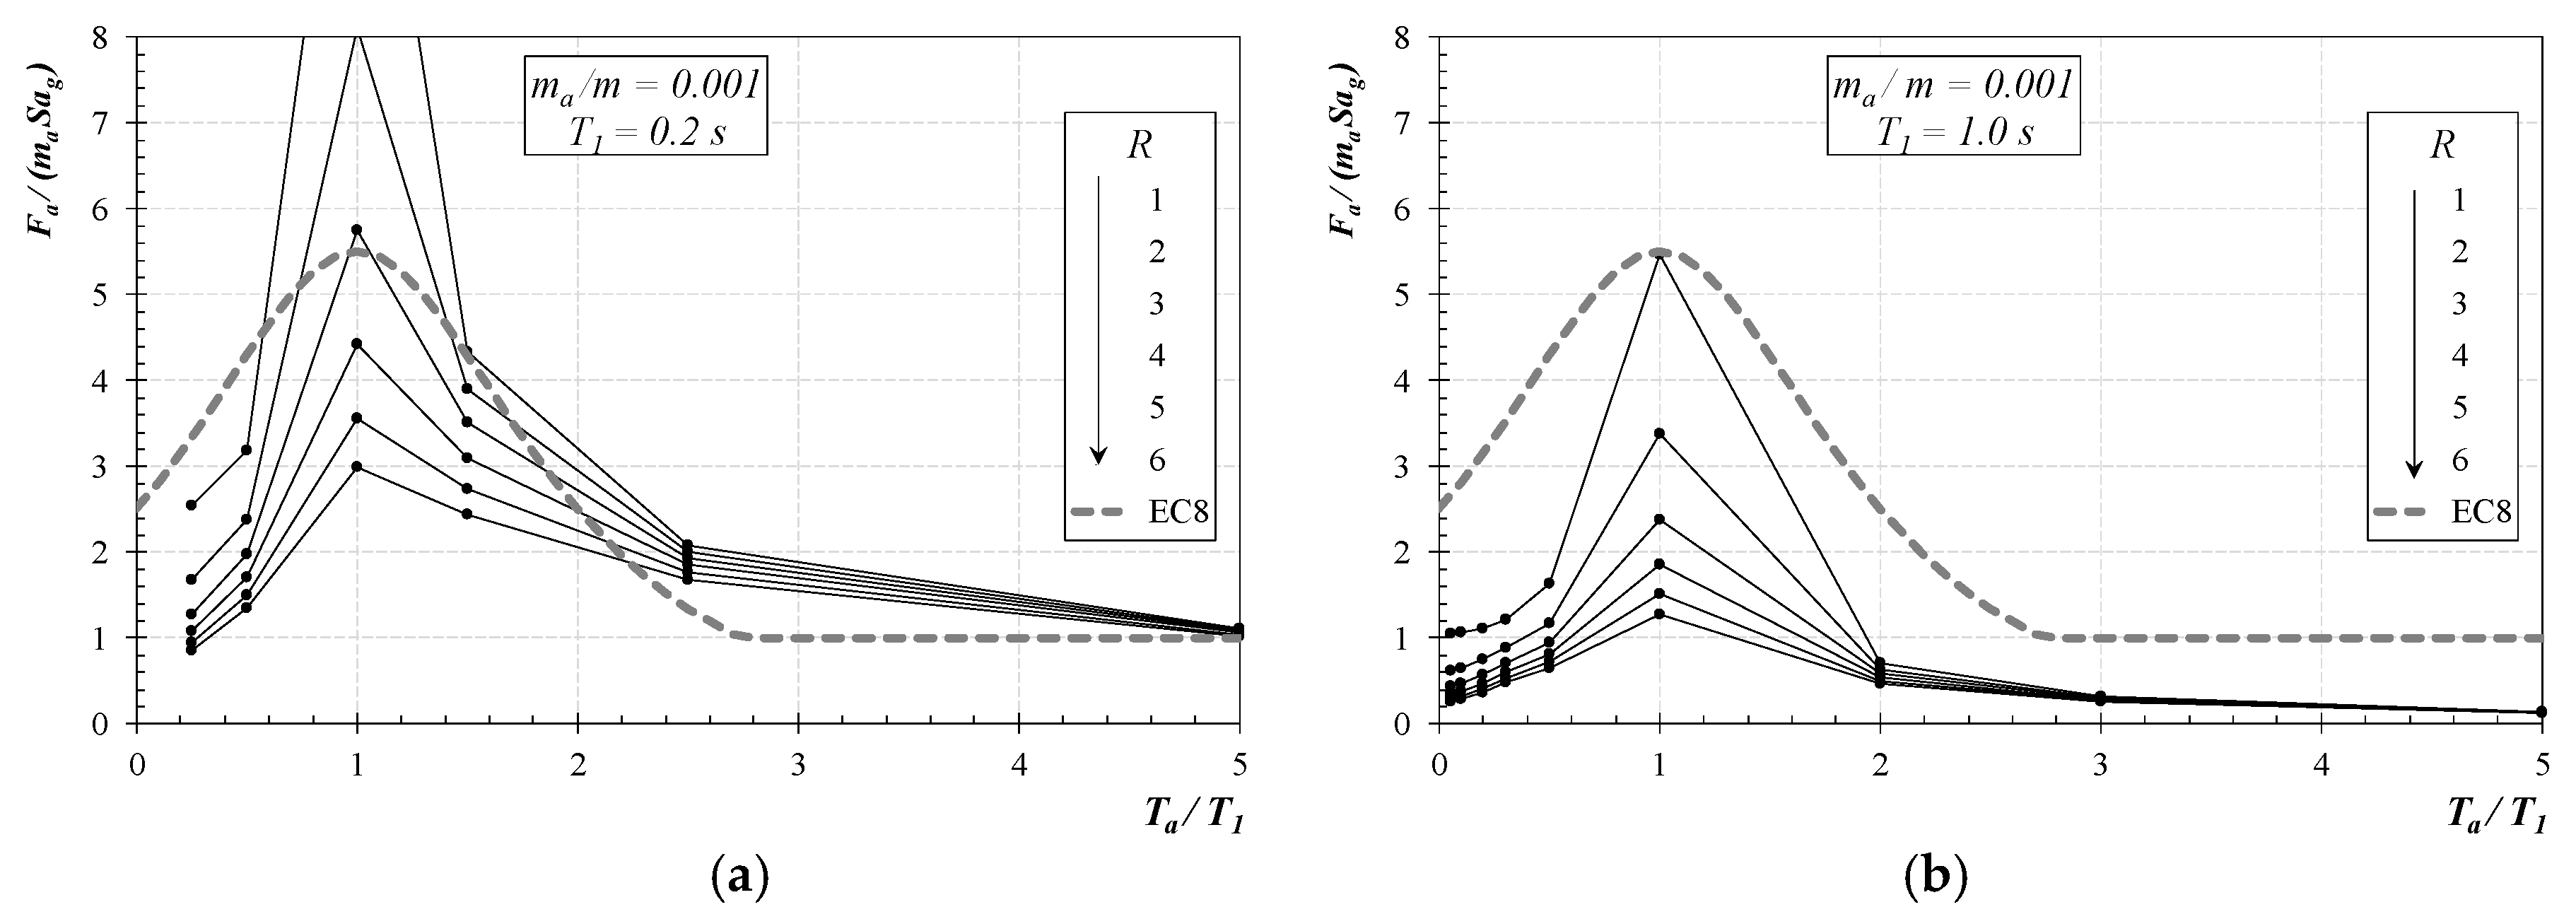
Figure 2 depicts the behavior of the ratio between the maximum absolute acceleration Fa/ma of NSC and the corresponding peak ground acceleration (PGA = S·ag = α·Sg) against the period ratio Ta/T1.
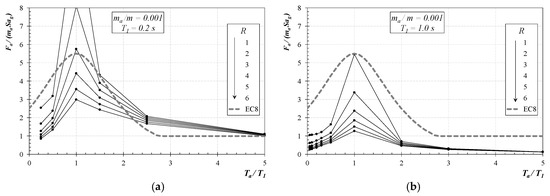
Figure 2.
Peak absolute acceleration on the NSCs: T1 = 0.2 s (a) and T1 = 1.0 s (b).
The reduction factor R ranges from 1 to 6 and each point is the average of the results obtained from the 264 seismic signals considered in the parametric study. Furthermore, the response of the code provision reported in EC8 [1] is also depicted resulting in a unique trend as such code formulation does not depends from the inelastic behavior of the main structure which is simulated by R in this study. Specifically, Figure 2a refers to the case of main structures characterized by short period of vibration (T = 0.2 s) and demonstrates that the force reduction factor R significantly affect the maximum ratios Fa/ma·S·ag corresponding to the resonance condition (Ta = T1), while the effect of R results less important for long periods of NSC (Ta/T1 > 2). Moreover, the simplified code provision reported in EC8 [1] miss this effect resulting in good agreement with numerical experiments only in the case of R ≈ 3 ÷ 4, that is close to the values generally adopted in the seismic design of new RC structures.
A similar response is observed in Figure 2b in which the case of a medium-to-long-period of the main structure is represented. Furthermore, the maximum values of the ratio Fa/ma·S·ag, obtained for medium-to-long period structures (Figure 2b) are lower than the corresponding ones evaluated for short-period structures represented in Figure 2a. This effect is due to the reduction in the acceleration induced on the main structure for long periods. However, the R factor still affects significantly the dynamic response of the NSC for systems with Ta/T1 < 2, while the prediction based on EC8 [1] results too conservative especially for high values of R.
Moreover, the results obtained for the mass ratio ma/m = 0.01 overlap the ones obtained for ma/m = 0.001, pointing out that, in this range of values, the mass ratio has a negligible influence on the resulting response. Therefore, the results for ma/m = 0.01 are omitted hereinafter for sake of brevity.
As a final remark, as it can be easily understood through elementary mechanical intuition, Figure 2 shows that the two parameters T1 and R play a fundamental role in determining the peak absolute acceleration Sa of NSCs. Therefore, this couple of parameters should be considered as the most influential ones in order to improve the relationships currently available for evaluating the dynamic response of non-structural components [1] which generally does not take into account the effect of the force reduction factor R.
3.1. Definition of Relevant Response Parameters
The results reported Figure 2 and, specifically, the comparison with the simplified formula adopted in EC8 [1] point out the significant lack of predictive capability affecting the aforementioned seismic code. As matter of fact, a wider number of parameters should be considered with the aim of enhancing the accuracy of formulations currently available. Moreover, more consistent response parameters can also be defined for describing the dynamic response of NSCs. For this purpose, [20,21] defined the following two parameters
AF is the ratio of the peak total acceleration of the NSC evaluated for an inelastic main structure and the corresponding one derived by considering an elastic behavior of the latter, whereas RF is the ratio between the maximum total acceleration of the NSC and the maximum value of the total acceleration in the main structure.
In the following two subsections, the variation of the aforementioned parameters is deeply analyzed against the properties which fully describe the dynamic response of the system.
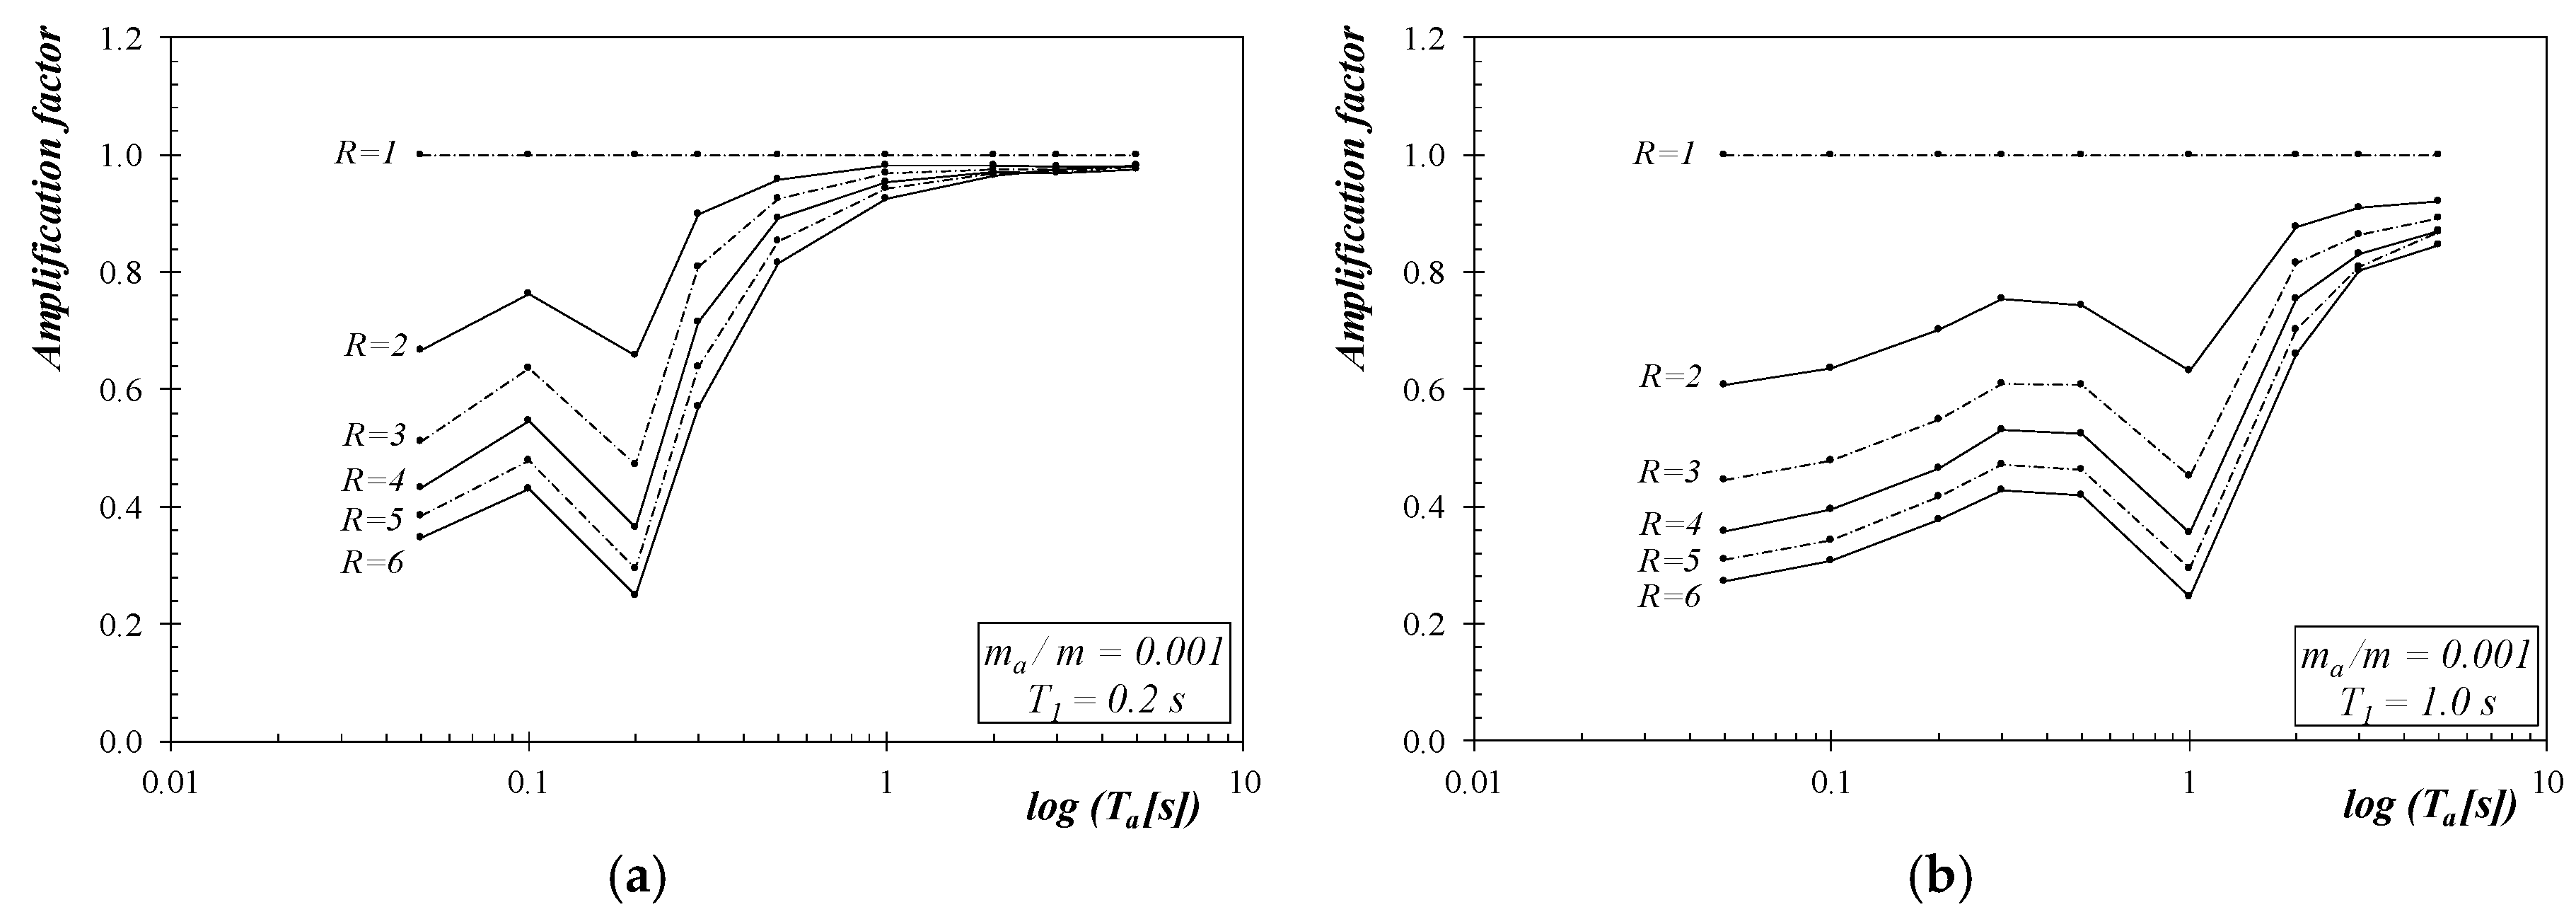
3.1.1. Amplification Factor
The amplification factor (AF) is analyzed and plotted against the period of the NSC for values of the factor R ranging from 1 to 6 and a given period T1. Specifically, Figure 3 reports this diagram for the case of ma/m=0.001 for two values of T1 (namely, 0.2 and 1.0 s) and confirms the non-monotonic shape of the curves already described in the literature [21]. Moreover, it highlights once again the important role played by R (especially when NSCs have low period of vibration) that is completely neglected by the current code formulations.

Figure 3.
Amplification factor vs. the Ta: T1 = 0.2 s (a) and T1 = 1.0 s (b).
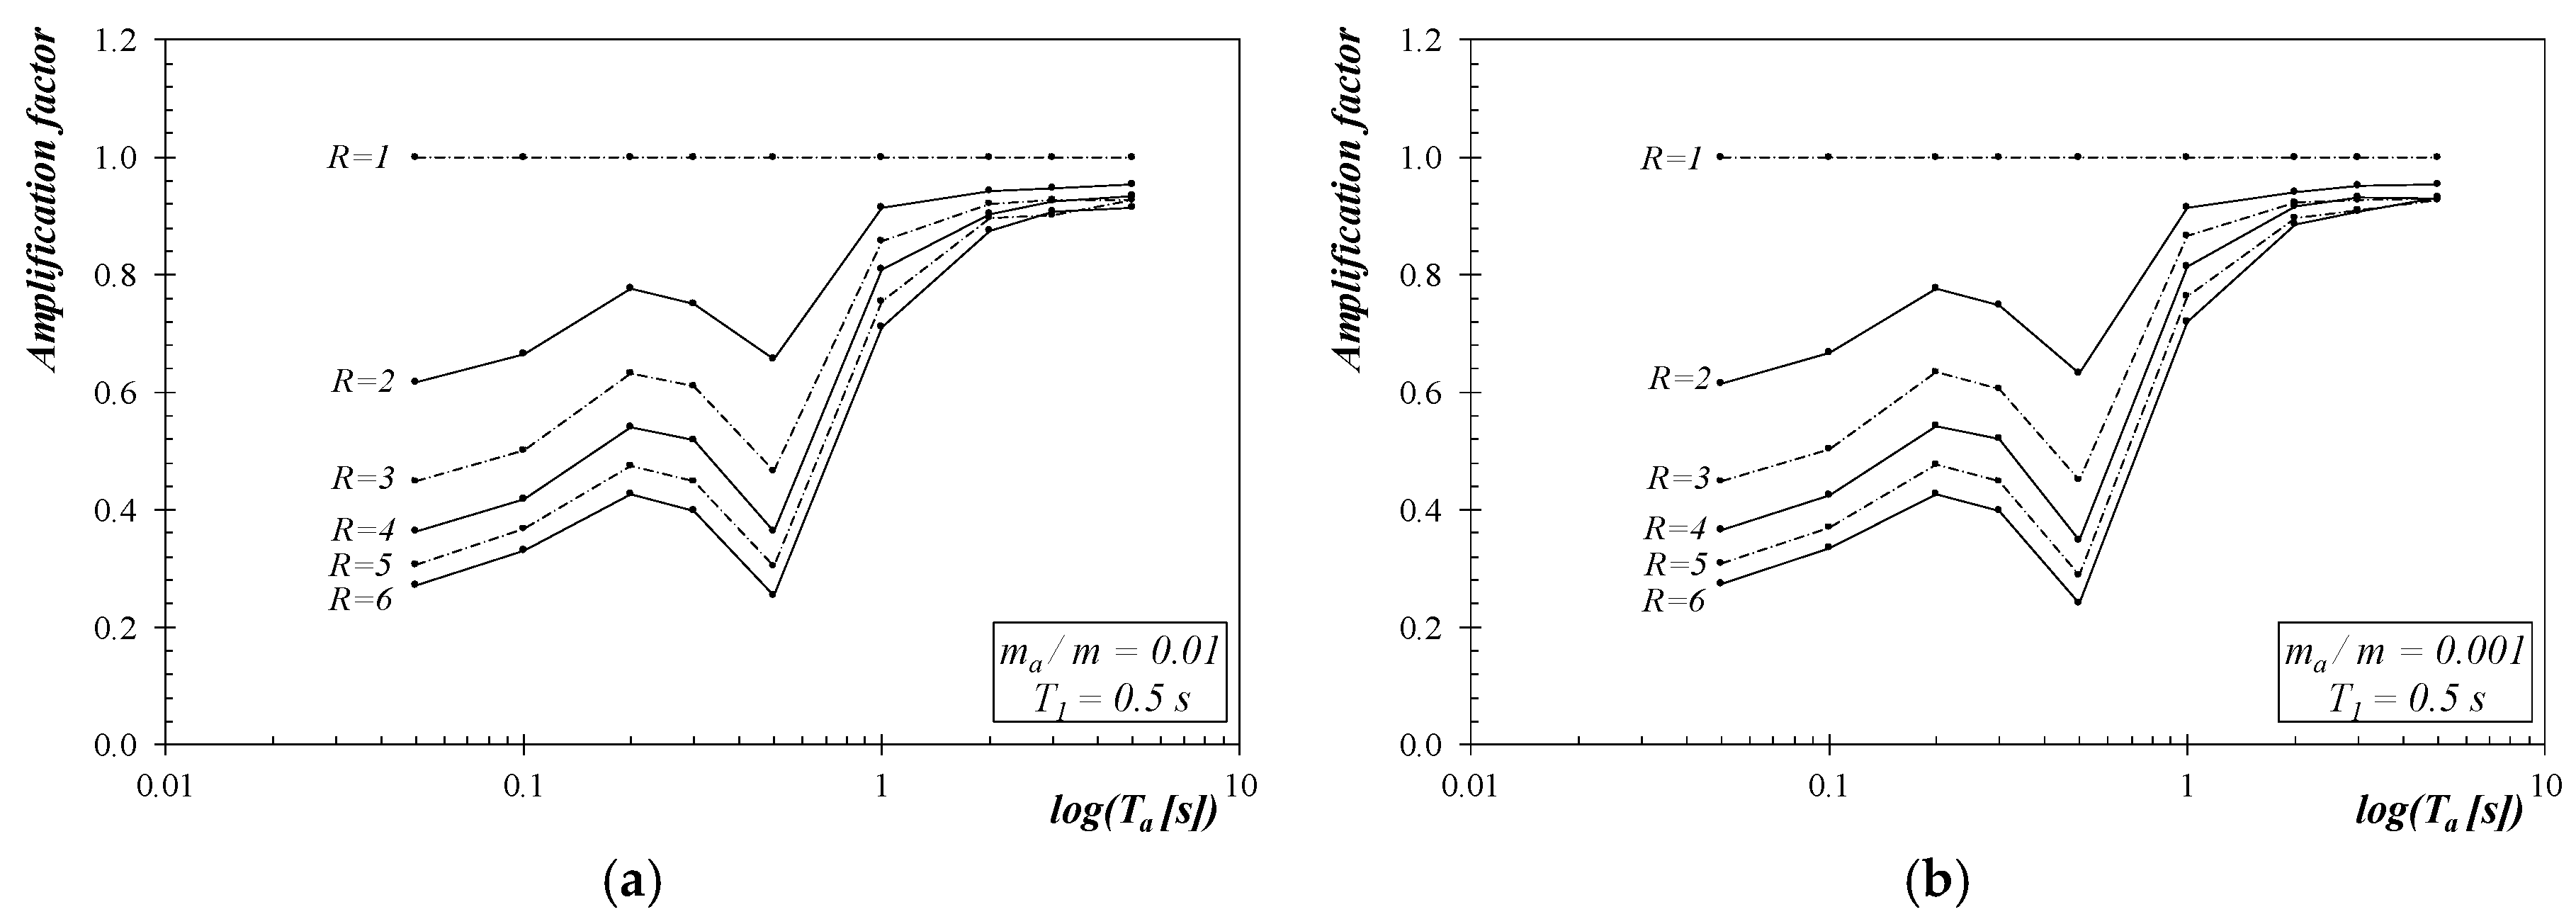
Moreover, Figure 4 consists of two diagrams reporting AF for the same fundamental period T1 = 0.5 s and two different mass ratio ma/m. It confirms that mass ratio is almost irrelevant for the resulting response, at least if it is kept lower than 0.01.
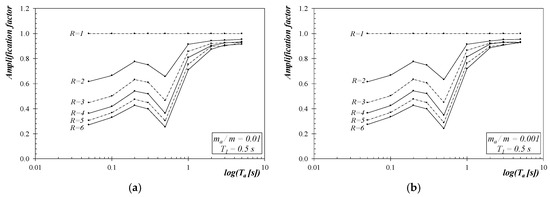
Figure 4.
Amplification factor vs. the Ta: (a) ma/m = 0.01 and (b) ma/m = 0.001.
3.1.2. Resonance Factor
The resonance factor (RF) can obtain a more compact and representative representation of the huge amount of numerical results obtained in the parametric analysis herein performed. As shown in Equation (6), the denominator of RF is clearly related to the elastic spectral pseudo-acceleration of the main structure for the period T1 and the damping ratio ξ, thus the possible analytical description of RF in terms of the other relevant parameters would straightforwardly lead to the quantification of Fa which is the numerator in Equation (6).
The following figures report the trend obtained for RF by the NLTH analyses. It is worth noting that each point represents the average of 264 values derived by considering the set of seismic signals considered.
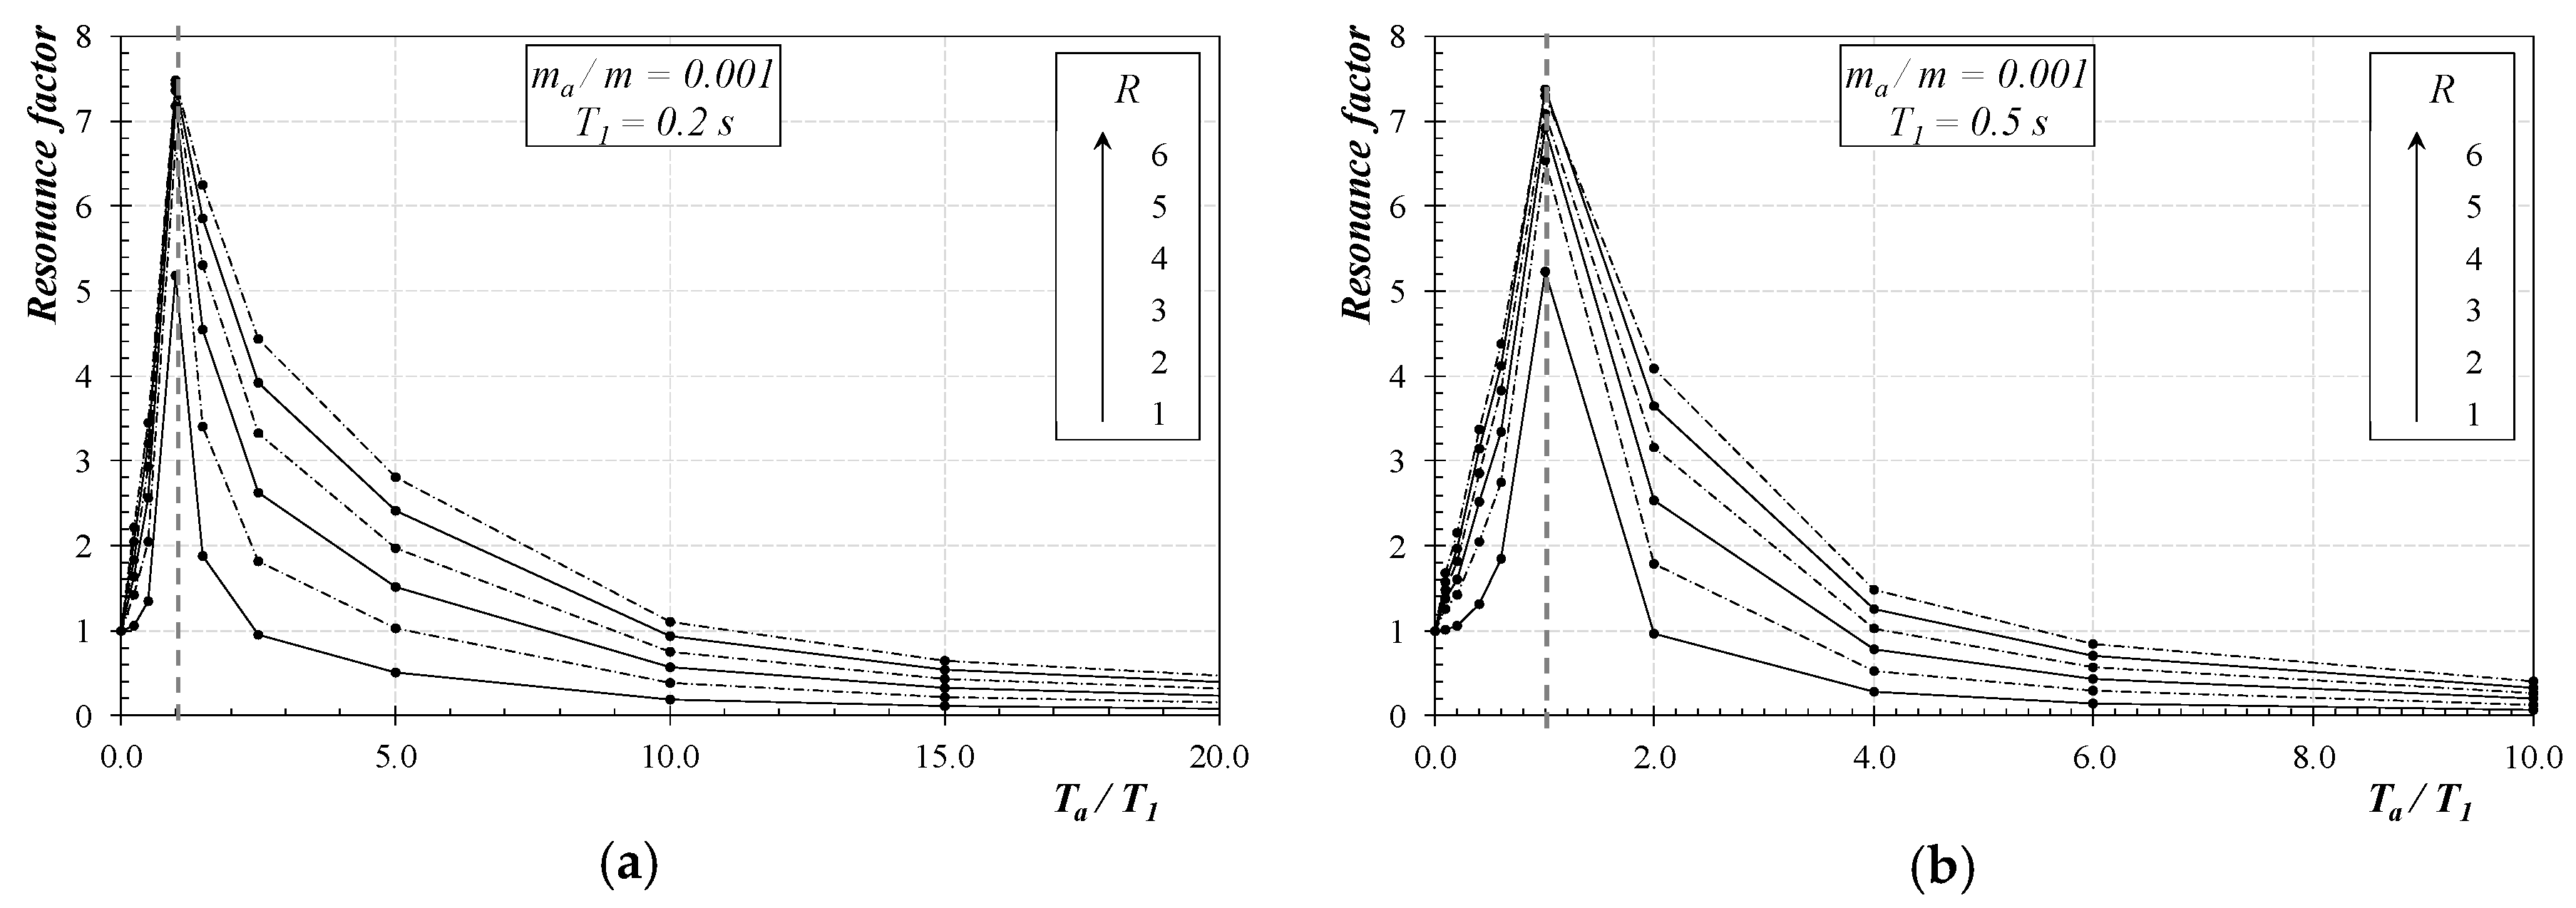
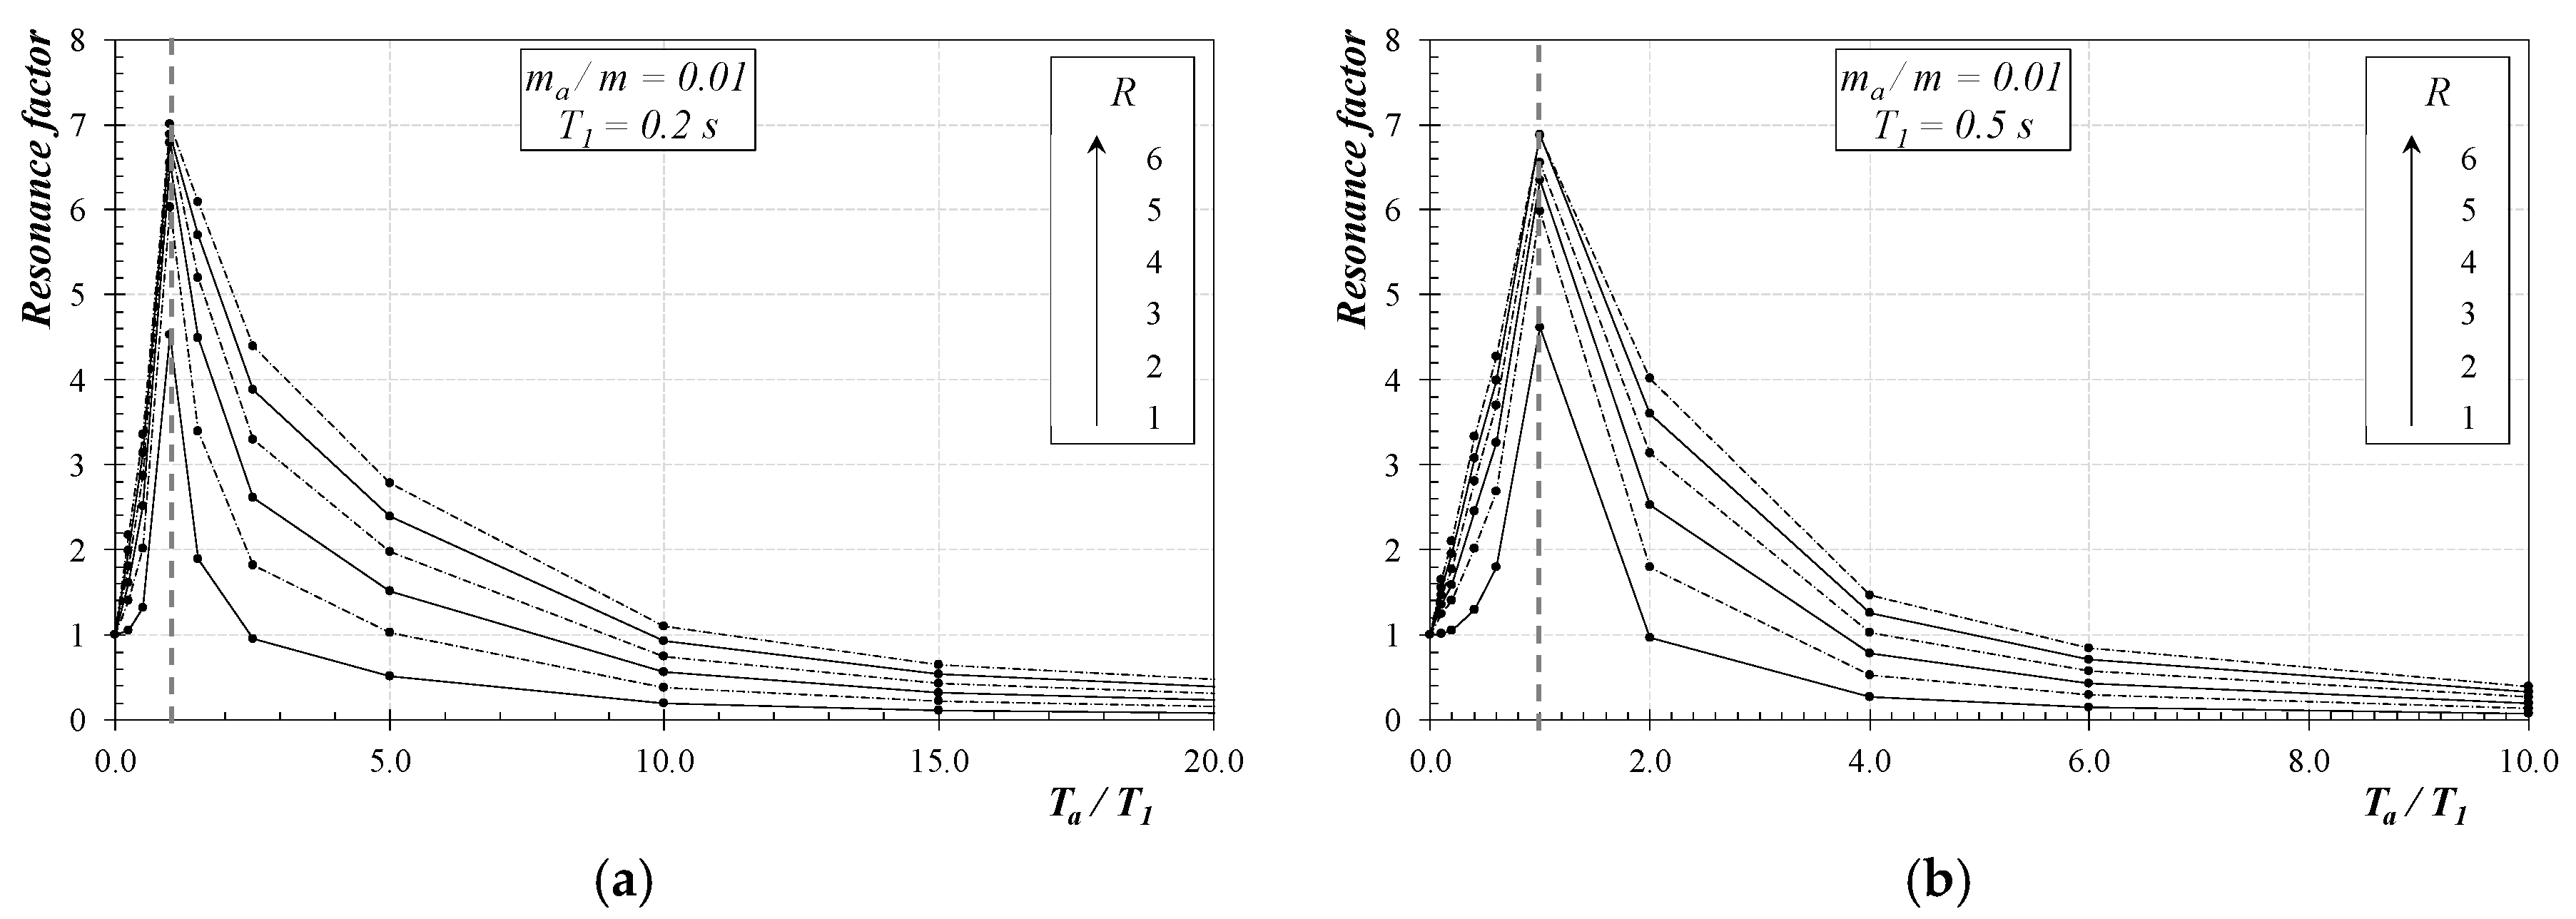
Figure 5 reports the (mean) values of RF for the cases of T1 ∈ {0.2 s; 0.5 s} and mass ratio equal to 0.001: Ta/T1 ratio ranges up to significantly high values, owing to the short period of the main structure and the assumed range of variation of the secondary system periods (Section 2). Therefore, the curves (one for each value of the R factor) clearly highlight the following “properties” of RF:
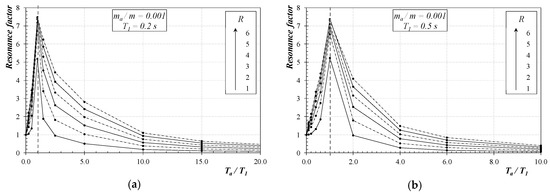
Figure 5.
Mean value of RF vs. period ratio Ta/T1 for ma/m = 0.001: (a) T1 = 0.2 s and (b) T1 = 0.5 s.
- all the curves departs from 1 at Ta/T1 = 0, which is a direct consequence of the resonance factor’s definition (Equation 5);
- an almost linear branch connects 1 on the y-axis with the maximum value of RF (hereafter referred to as RFmax, in the following) that is due to a resonance between the two masses and is almost unaffected by R (at least for R > 2);
- RF tends to vanishes as Ta/T1→∞.
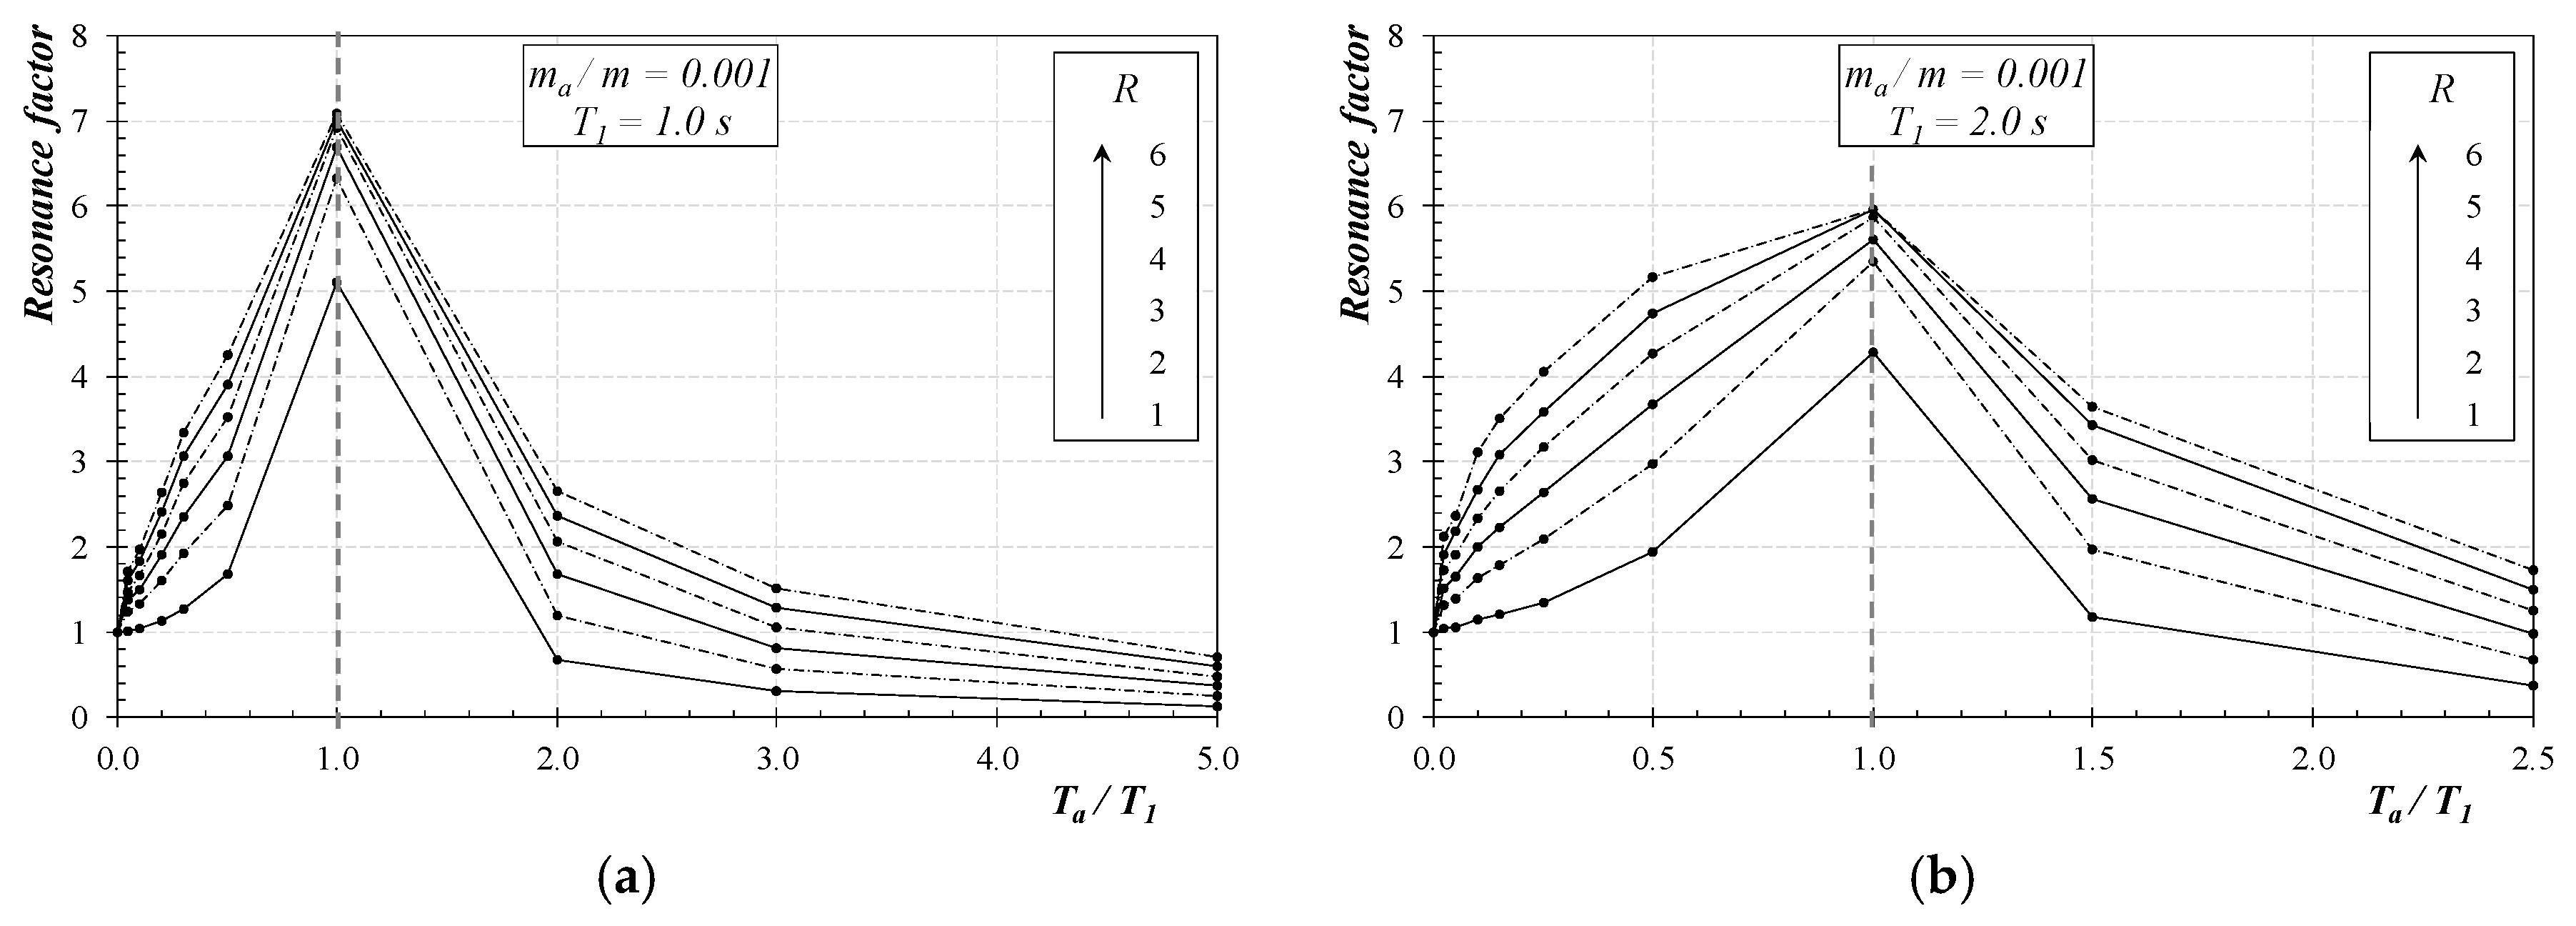
Similar shapes are represented in Figure 6 for longer periods and in Figure 7 and Figure 8 that report the same results for the higher mass ratio ma/m = 0.01.

Figure 6.
Mean RF vs. Ta/T1 for ma/m = 0.001: (a) T1 = 1.0 s and (b) T1 = 2.0 s.

Figure 7.
Mean RF vs. Ta/T1 for ma/m = 0.01: (a) T1 = 0.2 s and (b) T1 = 0.5 s.
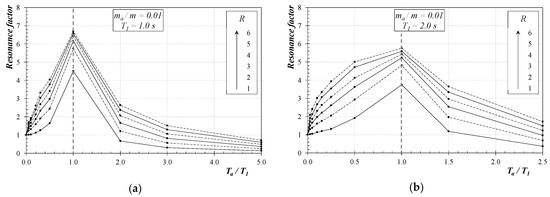
Figure 8.
Mean RF vs. Ta/T1 for ma/m = 0.01: (a) T1 = 1.0 s and (b) T1 = 2.0 s.
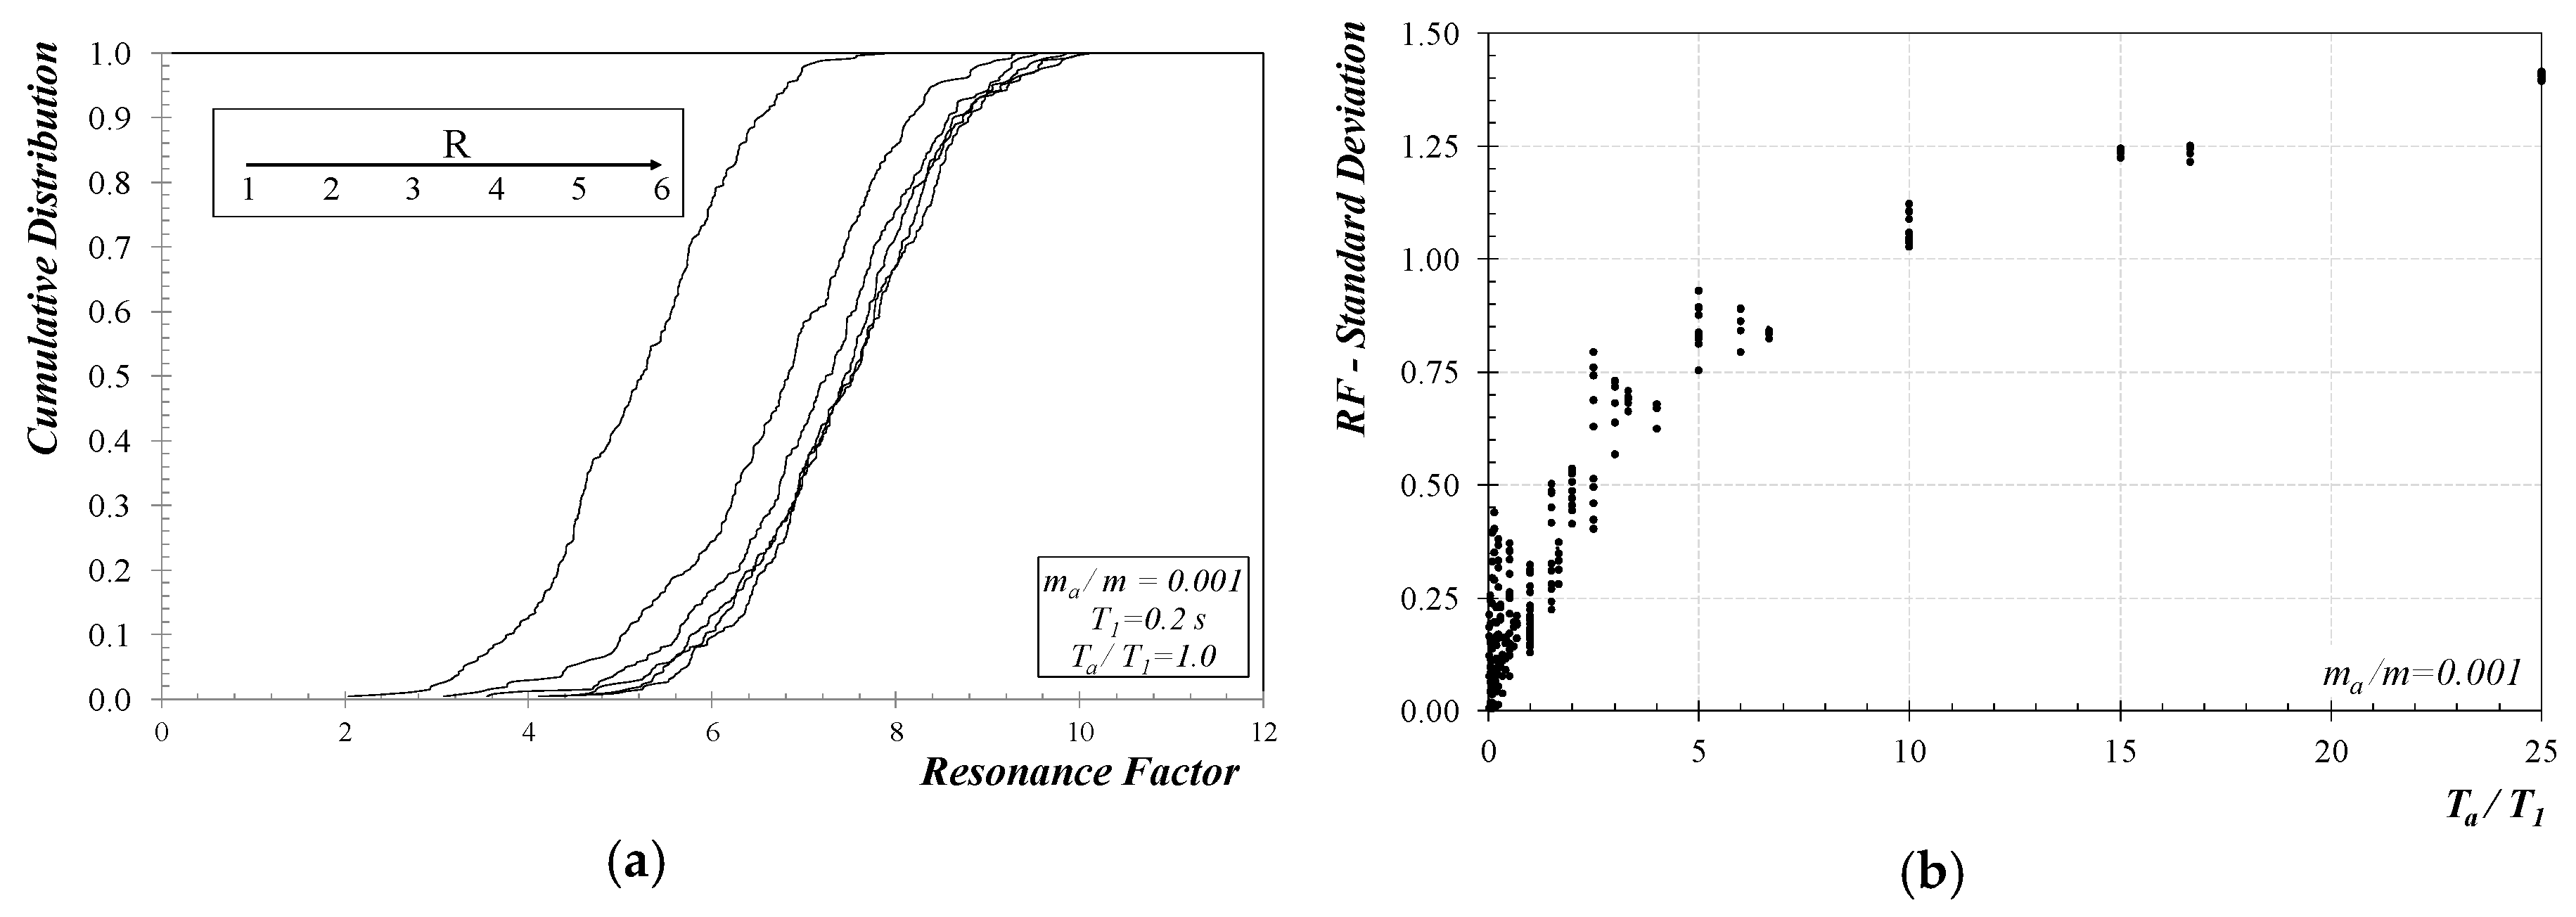
Finally, since only the mean values of the main numerical results have been represented in the previous figures, further aspects dealing with the record-to-record variability of the RF need to be addressed. Therefore, Figure 9 reports both cumulative distribution and standard deviation of the RF obtained for the structural systems analyzed in this study. As for the former, the curves (conforming to a lognormal distribution) plotted in Figure 9 show that the R only influences the median value of RF. As for the latter, the standard deviation is mainly controlled by the period ratio Ta/T1.
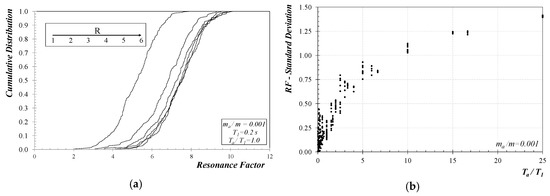
Figure 9.
Record-to-record variability of the Resonance Factor: (a) Cumulative Distribution and (b) Standard deviation.
4. Concluding Remarks
This paper dealt with simulating the seismic response of “acceleration-sensitive” NSCs and determining the peak accelerations induced by the seismic shaking at the base of the main structure. The results of the wide parametric analysis reported in Section 3 can be summarized as follows:
- as already demonstrated in a recent paper [12], the available code provisions often neglect relevant parameters that, in fact, play a relevant role in controlling the response of “acceleration-sensitive” NSCs;
- specifically, the nonlinear behavior of the main structure, yet neglected in the current code provisions, plays a major role in modifying the actual seismic input on NSCs and, hence, determining its peak acceleration (and force) values;
- the definition of the resonance factor (RF) is a key step in quantifying the maximum seismic-induced actions;
- RF is clearly related with the other relevant parameters; specifically, the period T1 of the main structure, the Ta/T1 ratio and the reduction factor R play a significant role in influencing the average value of RF determined from the nonlinear analyses;
- the standard deviation of the Resonance Factor RF is strictly correlated with by the period ratio Ta/T1: higher dispersion affects the response of NSCs when they are (relatively) flexible.
Although further and more accurate calibrations might be proposed in the future, in the authors’ opinion, relating the non-structural response to the structural one is the key conceptual contribution of this study.
Author Contributions
Conceptualization, E.M.; Methodology, E.M.; Software, E.M.; Validation, C.L.; Formal Analysis, E.M.; Investigation, C.L.; Resources, E.M.; Data Curation, C.L.; Writing—Original Draft Preparation, C.L. & E.M.; Writing—Review & Editing, C.L. & E.M.; Visualization, C.L.; Supervision, E.M.; Project Administration, E.M.; Funding Acquisition, E.M.
Funding
This study is part of the DPC-ReLUIS 2014–2018 Research Project whose financial support is gratefully acknowledged.
Acknowledgments
The Author wishes to acknowledge the contribution of Claudio Malangone who worked on the numerical analyses reported in this paper within the framework of his M.Sc. Thesis in Civil Engineering at the University of Salerno.
Conflicts of Interest
The authors declare no conflict of interest.
References
- Comité Européen de Normalisation. EN 1998-1 (2005). Eurocode 8—Design of Structures for Earthquake Resistance. Part 1: General Rules, Seismic Actions and Rules for Buildings; Comité Européen de Normalisation: Brussels, Belgium, 2005. [Google Scholar]
- Castaldo, P.; Palazzo, B.; Alfano, G.; Palumbo, M.F. Seismic reliability-based ductility demand for hardening and softening structures isolated by friction pendulum bearings. Struct. Control Health Monit. 2018, 25, e2256. [Google Scholar] [CrossRef]
- Verderame, G.M.; Iervolino, I.; Ricci, P. Report on the Damages on Buildings Following the Seismic Event of 6th April 2009 time 1:32 (UTC)—L’Aquila M = 5.8. ReLUIS Report 2009. Available online: www.reluis.it (accessed on 28 February 2018).
- Earthquake Engineering Research Institute. Nonstructural Issues of Seismic Design and Construction; EERI: Berkeley, CA, USA, 1984. [Google Scholar]
- National Institute for Educational Policy Research. Educational Facilities Research Center. EFRC (2005)—Case Studies of Seismic Nonstructural Retrofitting in School Facilities; National Institute for Educational Policy Research: Tokyo, Japan, 2005.
- De Sortis, A.; Di Pasquale, G.; Dolce, M.; Gregolo, S.; Papa, S.; Rettore, G.F. Linee guida per la riduzione della vulnerabilità di elementi non strutturali arredi e impianti. Presidenza del Consiglio dei Ministri Dipartimento della Protezione Civile, 2009. Available online: http://www.reluis.it/doc/pdf/LG_NS_finale_web.pdf (accessed on 10 November 2018). (In Italian).
- Parisi, F.; De Luca, F.; Petruzzelli, F.; De Risi, R.; Chioccarelli, E.; Iervolino, I. Field Inspection after the May 20th and 29th 2012 Emilia-Romagna Earthquakes. 2012. Available online: www.reluis.it (accessed on 28 February 2018).
- Magliulo, G.; Ercolino, M.; Petrone, C.; Coppola, O.; Manfredi, G. The Emilia Earthquake: Seismic Performance of Precast RC Buildings. Earthq. Spectra 2018, 30, 891–912. [Google Scholar] [CrossRef]
- Belleri, A.; Brunesi, E.; Nascimbene, R.; Pagani, M.; Riva, P. Seismic performance of precast industrial facilities following major earthquakes in the Italian territory. ASCE J. Perform. Construct. Facil. 2015, 29, 04014135. [Google Scholar] [CrossRef]
- Sullivan, T.J.; Calvi, P.M.; Nascimbene, R. Towards improved floor spectra estimates for seismic design. Earthq. Struct. 2013, 4, 109–132. [Google Scholar] [CrossRef]
- Filiatrault, A.; Sullivan, T. Performance-based Seismic Design of Nonstructural Building Components: The Next Frontier of Earthquake Engineering. Earthq. Eng. Eng. Vib. 2014, 13, 17–46. [Google Scholar] [CrossRef]
- Martinelli, E.; Faella, C. An overview of the current code provisions on the seismic response non-structural components in buildings. Appl. Mech. Mater. 2015, 847, 273–280. [Google Scholar] [CrossRef]
- Swiss Society of Engineers and Architects 261. SIA (2003)—Actions on Structures; Swiss Society of Engineers and Architects: Zurich, Switzerland, 2003. [Google Scholar]
- International Code Council. International Building Code (IBC). 2006. Available online: http://bechtel.colorado.edu/~willam/4830%202006%20IBC.pdf (accessed on 10 November 2018).
- NRC. National Building Code of Canada; National Research Council of Canada: Montreal, ON, Canada, 2005.
- NZS. Code of Practice for General Structural Design and Design Loading for Buildings, Volume 1: Code of Practice; Standards Association of New Zealand: Wellington, New Zealand, 1992.
- Villaverde, R.; Chauduri, S.R. Effect of Building Nonlinearity on Seismic Response of Nonstructural Components: A Parametric Study. ASCE J. Struct. Eng. 2008, 134, 661–670. [Google Scholar]
- Kaynia, A. Guidelines for Deriving Seismic Fragility Functions of Elements at Risk: Buildings, Lifelines, Transportation Networks and Critical Facilities. SYNER-G Reference Report 4. Publications Office of the European Union, Joint Research Centre. Available online: http://www.vce.at/SYNER-G/pdf/deliverables/D8.10_RR4-LB-NA-25880-EN-N.pdf (accessed on 14 December 2018).
- Sousa, L.; Monteiro, R. Seismic retrofit options for non-structural building partition walls: Impact on loss estimation and cost-benefit analysis. Eng. Struct. 2018, 161, 8–27. [Google Scholar] [CrossRef]
- Oropeza, M.; Favez, P.; Lestuzzi, P. Seismic response of nonstructural components in case of nonlinear structures based on floor response spectra method. Bull. Earthq. Eng. 2010, 8, 387–400. [Google Scholar] [CrossRef]
- Lin, J.; Mahin, S.A. Seismic Response of Light Subsystems on Inelastic Structures. ASCE J. Struct. Eng. 1985, 111, 400–417. [Google Scholar] [CrossRef]
- Clough, R.W.; Penzien, J. Dynamics of Structures, 2nd ed.; McGraw-Hill Book Co.: Singapore, 1993. [Google Scholar]
- Miranda, E. Inelastic Displacement Ratios for Structures on Firm Sites. ASCE J. Struct. Eng. 2000, 126, 1150–1158. [Google Scholar] [CrossRef]

© 2018 by the authors. Licensee MDPI, Basel, Switzerland. This article is an open access article distributed under the terms and conditions of the Creative Commons Attribution (CC BY) license (http://creativecommons.org/licenses/by/4.0/).