1. Introduction
Global warming, climate change, and greenhouse effects are rising trends and issues during the last decades. Buildings, commercial and residential types, are a major contributor, in fact the largest, in terms of energy consumption and, thus, in its impact on the environment [
1]. Energy consumption in buildings significantly increases on a yearly basis due to the increased human comfort needs and services [
2]. Residential and commercial buildings use a high percentage of the US’s primary energy. This portion can reach as high as 40%. Half this amount of energy consumed is by the ventilation and air-conditioning systems of the building [
3]. HVAC (Heating, Ventilation, and Air-conditioning) equipment demand in the world has increased from 50 billion US dollars in 2004 to more than 90 billion US dollars in 2014. This increase for the US market increased from almost 11 billion to 19 billion US dollars over the same period [
4].
Energy consumed to run AC systems for cooling purposes in buildings is dependent on many factors such as the wall structure, window to wall ratio, building orientation, and exposure in addition to weather conditions [
5]. A buildings’ energy consumption account for a relatively large proportion of global energy consumption [
6]. The construction and operation of buildings and the associated systems have a significant impact on the usage of the world’s resources such as water and energy [
7]. However, it should be pointed out that when considering improvements for energy conservation it is important to note the differences between traditional or current buildings and new ones. Current or old buildings that require renovation and modification to achieve good energy conservation levels might have moisture trapped within the building materials, condensation within unheated areas, and condensation in the corners and the under-loaded ventilation units that are unable to remove moisture from the building [
8].
In recent years, there has been a growing interest in analyzing the thermal characteristics of building envelopes to reduce energy consumption. Walls are a predominant fraction of a building envelope. Walls with thermal insulation can have higher chances of surface condensation when the air has a relative humidity higher than 80% and when the convective and radiative heat transfer coefficients of the exterior walls are small [
9]. Sadineni et al. [
9] summarized the available wall types that are used in building structures. Walls can be classified as wood-based walls, metal-based walls, and masonry-based walls. Some other types of walls include passive solar walls, lightweight concrete (LWC) walls, ventilated or double skin walls, and walls with latent heat storage. Passive solar walls are usually used in a cold climate and can trap and transmit the solar energy efficiently into the building. A glazing is usually used as an outer covering of the wall to provide the greenhouse effect. LWC walls are the walls that have a density that is less than 2000 kg/m
3, whereas thermal insulation walls have a density that is less than 1450 kg/m
3. Double skin walls or cavity walls have an air gap between two layers of masonry walls. Lastly, walls with latent heat storage are lightweight walls with phase change materials incorporated in it [
9].
The proper design and selection of external wall materials in buildings can help in saving 50–60% of the buildings’ energy consumption used for cooling and heating purposes. Wall insulation is a major contributor to energy savings for the heating of buildings in winter seasons [
10]. Internal thermal insulation installed inside external walls has the advantages of low cost, flexible operation, and ease of construction. It can partially help in energy savings, reducing house heating costs and helping in heating rooms in a short period of time [
10]. Another study for heating energy requirements also concluded that the building envelope’s integrated thermal insulation is essential for energy savings in the buildings [
5].
Effects of thermal insulation on air-conditioning energy loads during summer seasons in China was experimentally investigated using two testing chambers. One chamber representing the basic case was constructed according to general design codes for residential buildings in the 1980s and 1990s, whereas the second chamber was constructed using a thermal insulation system with the external wall. The comparison results of the two chambers showed that the thermally insulated chamber was less affected by outdoor environments and consumed less energy than the basic chamber did for cooling purposes [
11].
A study by Friess and Rakhshan [
12] showed that the proper orientation and thermal insulation could save 20% of residential buildings’ cooling energy bills [
12]. They also showed that proper glazing can contribute to higher savings of cooling loads reaching up to 55%.
Ahn et al. [
13] investigated the impact of changing lights inside a building on the cooling and heating loads. Heat generated from the internal lights were experimentally investigated, whereas the associated cooling and heating loads and the energy savings were investigated through simulation. Heat generated by LED lights is conducted through the ceiling since LED lights are usually installed on the ceiling. This would reduce some of the emitted energy by the lights into the room, thus reducing the energy consumed for cooling. On the other hand, it is possible in winter to recover part of the lighting heat loss by supplying air to pass through the heat sink before being supplied to the indoor space. Although the savings in the direct energy consumed by LED lights were reduced by 5.9%, the energy demand for cooling and heating was reduced by 18.4% and 3.3%, respectively [
13].
Visual comfort and building energy demands resulting from shading strategies for a mockup room and a scale model were investigated by means of the quantitative evaluation of the illuminance and a qualitative analysis of the glare using the HDR captured images taken in real scene and simulation (DIVA-for-Rhino). The building energy consumption was simulated, after validation using the mockup room and the scale model, using three different orientations and 10 control strategies for lighting and shading. It was found that a blind slat of 30°-inclination, if to be kept fixed, or a dynamic shading is the best for an energy efficient and anti-glare control strategy [
14].
Ghaddar and Bsat [
15] conducted a study on buildings in Lebanon (middle east region) and indicated that solar gain, wall conduction, and lighting loads had the greatest impact on energy use in buildings in both summer and winter seasons [
15].
Wu et al. [
16] conducted a simulation study to investigate the effect of exterior walls, windows, and shading on the building by adjacent objects on the cooling loads and life cycle cost in low latitude and hot humid climates in China. Low-latitude and hot-humid areas are different from the continental climate areas. The study used Energy Plus simulation software to investigate the cooling loads of different building structures. The specifications and details of the exterior walls, shading on the building, and window structures were done using life cycle assessment. Different envelope parameters (wall material, window structure, and shading) were used while keeping the lighting, equipment used, personnel density, and other conditions fixed as per national standards in China. It was found that walls have a significant contribution to the cooling load savings. In addition to that, wall insulations beyond a thickness of 30 were was found not to have any significant additional effects on the cooling load. The impact of the windows and building shading varied depending on the orientation of the building [
16].
Window to wall ratio was shown by many studies to be a major key factor in affecting the cooling load of buildings. One of the most effective actions for reduction of energy loss from buildings in winter and optimize solar gains in summer is by optimizing the thermal performance, area and localization of the transparent components in the façade of the building [
17]. A strong correlation exists between the windows’ area and the cooling load of a building [
18]. When optimizing window glazing, the beneficial effects of incident solar radiation and a reduced demand for heating and artificial lighting should be taken into consideration in addition to savings in cooling and heating demands [
17].
Sadrzadehrafiei et al. [
19] examined the benefits and potential savings associated with triple glazing windows on energy consumption used for cooling buildings in Malaysia. The study compared single versus triple glazed windows and two types of triple glazed windows each with different air gap thicknesses, 15 mm and 16 mm, respectively. The results showed that the energy consumption for cooling the building was reduced by 6.3% when using the triple glazed windows over single clear glass. On the other hand, the two types of triple glazed windows with different air gap thicknesses offered insignificant differences in the buildings energy consumption used for cooling.
The thermal performance of double and triple glazed windows was compared by Shakouri [
20] by considering different window sizes and orientations in summer and winter. The annual energy consumption for triple glazing was less than that for double glazed windows, irrespective of orientations and window-to-floor ratios. This was due to the fact that double glazed windows allow more heat gain in summer than a triple glazed window system. Additionally, since triple glazed windows have more layers, then the thermal conductivity is less than that for double windows. This makes triple-glazed the best option compared to double glazed in both summer and winter as it reduces heat gains in summer and heat loss in winter. Another study in Europe on building glazing showed that triple glazing provides the best performance [
21] for both cooling and heating purposes.
The energy performance for several window configurations was assessed considering coupled effects of incident solar radiation and thermal transmission heat losses in winter and the effects of varying thermal transmittance values in connection with solar heat gain coefficients in summer. Three different rating methods were used: (1) ISO 18292:2011 (Energy performance of fenestration systems for residential buildings—calculation procedure), (2) the useful heat gain method (proposed by Grynning et al. [
17] where a defined useful gains factor was studied), and (3) the effect on the combined cooling and heating demand of the building. The study found that each rating method provided a different energy-saving rate in both summer and winter. The study also concluded that windows can outperform opaque walls for cooling and heating demands [
17].
Although windows are responsible for 20–40% of the wasted energy in residential buildings used for space heating [
22], cooling demands are the main factor to look into when considering window glazing and shading [
23]. A simulation was done by Grynning et al. [
23] for a number of shading strategies for the south and north-facing office cubicles in cold climate areas having varying floor areas, window sizes, and window parameters. The simulation looked into heating, cooling, lighting, and ventilation fans effects in addition to the shading system which can lower the thermal transmittance value (U-value) through the windows. It was found that automatically controlled shading systems used on the south side of the small office cubicles can reduce the energy demands but the authors did not recommend installing them for other buildings, offices, or detached houses till after a thorough energy simulation is done for each case as energy demands were found to increase if the shading was applied improperly [
23].
A comprehensive analysis of the effects of window glazing and shading designs on office building envelope in cooling-dominant climates was investigated using a series of simulation studies. Both the thermal performance of the window and the daylighting were considered. The results showed that low-emission glazing windows achieved the best performance, whereas double glazing was among the worst cases. The study also recommended using windows on the east and west sides in hot-climate areas and noted that as the latitude of the building location increases, the performance of window designs on the south side of the building improves [
24].
The buildings’ envelope geometry and its effects on cooling and heating demands were investigated by Lavafpour & Sharples [
25]. It has been argued that super-insulated homes are vulnerable to excessive heating in summer especially in cities where heat islands are more present. Large façade areas on the South side of the building are desirable in winter as it helps decrease the heating load. However, in summer this might cause overheating. To overcome this issue, the authors investigated cooling load demands for inclined walls with 50% façade areas on the south side of buildings in Ebbw Vale and London (both in the UK) and compared it to a simple cube shape building having the same façade area. The simulation indicated that the wall inclination has a noticeable impact on summer cooling up to an inclination angle of 115° from the horizontal [
25].
A case study for several building types in Jordan was conducted by Bataineh and Alrabee [
26]. The study looked into energy savings in mild winter and hot, usually dry, summer conditions. The study considered 3 levels of energy retrofit programs for traditional family houses, apartments, and two-story villas. The 3-energy retrofit levels were Level 1 (no cost and low-cost measures), Level 2 (medium cost measures), and Level 3 (included implementation of capital-intensive measures). It was concluded that the return on investment for all different levels were acceptable, except for traditional houses. It was also shown that Level 3 retrofit could save 43% of the annual electrical consumption.
A study by Kurnitski et al. [
27] investigated cost-optimal and nearly zero energy building (nZEB) energy performance levels for a detached house. The study investigated energy savings associated with heating for various building envelope components based on specific heat loss coefficients. A systematic and robust procedure was developed and tested on Estonian reference buildings and the results for a detached house were reported to check on the developed procedure. The procedure included 7-steps as follows: (1) selecting the reference building, (2) defining the building envelope construction details, (3) specifying the technical systems in the building, (4) performing energy simulations, (5) analysis of the results to check on the pre- and post-energy consumption, (6) performing an economic analysis and checking the net present value of the simulated case, and (7) performing sensitivity analyses considering interest and inflation rates. The nearly zero energy building (nZEB) technical definition as set by REHVA Task Force was used to calculate the optimal cost and nearly zero energy buildings’ energy performance calculations. Model calculations for Estonian detached reference house with heated net floor area of 171.1 m
2 was conducted. The results showed that cost-optimal primary energy use can be calculated with a limited number of energy simulations. The simulation results for the reference Estonian detached house showed that the cost-optimal primary energy was approximately 110 kWh/m
2 when using a ground source heat pump or gas heating which was equivalent to the rates of a passive house in Central Europe. However, this value provided approximately 40% of savings when compared to a business-as-usual construction house [
27].
Tronchin et al. [
28] investigated the best energy efficiency measures for buildings in Italy based on the cost-optimal level for an energy-retrofit building. The energy performance index (EP
i) was evaluated following Italian standard UNITS 11300. Inflation rates and energy costs and tariff for natural gas and electricity were used based on the Italian Regulatory Authority for Electricity and Gas. A case study was considered for a 3-level villa having a surface area of 160.25 m
2, but the retrofit was done for half of the building. This makes the surface area comparable to the 2-level house considered in this paper. The external walls were made of 28 cm and 12 cm brick walls, roof made of lightweight concrete and brick, windows had a single 4 mm glass with wooden frames, and a traditional boiler for heating and domestic hot water that runs on natural gas. For the base case study, which was designed to meet the new minimum code requirements, the roof and walls were provided with 10 cm polystyrene expanses, wool insulation was added to the walls, window frames replaced with PVC frames and the glazing was replaced with low emission glass. The traditional boiler was also replaced with a condensing boiler that runs on natural gas. In addition to the base case, three other cases were investigated as separate changes and, when combined, made the total cases under investigation to be 5 cases. The cases investigated energy consumption for heating and cooling due to changes in thermal insulation of roofs, walls, and basements, changes in window glazing, changes in heat pumps and condensing boilers, and due to the usage of renewable energy sources. The best cases were seen when combining multiple changes/cases together. The case when using a 12 cm polystyrene expanse for roof and walls insulation, triple glass for windows, replacing the traditional boiler with a condensing boiler that runs on natural gas, and adding 2.5 m
2 of solar collectors (1727.78 kWh/year) provided the best cooling and heating loads and thus the best EP
i. The improvements associated with these changes provided a 12% reduction in annual cooling load energy requirements, a 14.4% reduction per year for heating energy requirements, and a 72.75% reduction in the energy performance index (EP
i). However, this was associated with a 9.5% increase in initial cost compared to the base case.
Energy modelling for energy consumption in buildings can help analyze different energy efficiency measures and allow better energy strategy investments. Energy modelling for a commercial building was done considering a base case (based on the American Society for Heating Refrigeration and Air-conditioning code: ASHRAE 90.1 2007 standards for parameters such as the building envelope, electrical and lighting loads). Various energy conservation measures were simulated using the VisualDOE software. The simulation included the following changes to the baseline case: (1) walls with insulation, (2) glass with higher insulating properties, (3) higher reflective roofs, (4) reduction in light power density, (5) higher coefficient of performance (COP) chiller units, (6) use of recovery wheel, (7) reduction in fan power, and (8) higher pump efficiencies. An initial orientation was considered for the base case and then the building was simulated for four different orientations 90° apart. The study showed that individual cases can save between 1% to 13% and this saving can be enhanced and increased to 20% when using multiple or combined savings measures [
29].
Another simulation study was conducted by Hamid et al. [
30] for a 7-story commercial building. A baseline case study was done assessing energy usage in the building by cooling demands, equipment, lighting, fans, heating and pumps. Improvement cases were done considering changes in the glass, walls structure, wall insulation, lighting, infiltration rates, and roof structures. It was found that the maximum improvement in energy used for cooling can reach up to 36.5% [
30].
A study surveying energy usage in 300 residential buildings was done by Kazzora et al. [
31] to identify correlations between energy use and the physical and thermal properties of buildings. The study checked on the buildings’ location, orientation, year of construction, any alterations, materials of construction, external finish, the type of glazing and window frames used, internal floor finish, and roof and ceiling materials. Based on the outcomes, the authors generated a list of Energy Conservation Measures (ECMs) that can be studied in the future to advance energy-saving research in buildings.
Therefore, it is important to work on the energy-savings awareness on all levels which can help protect the environment and improve the health of mankind [
32]. Additionally, it is noted how powerful simulation for energy use is in predicting the building energy usage and how helpful it is for designers.
3. Methodology
A 200 m
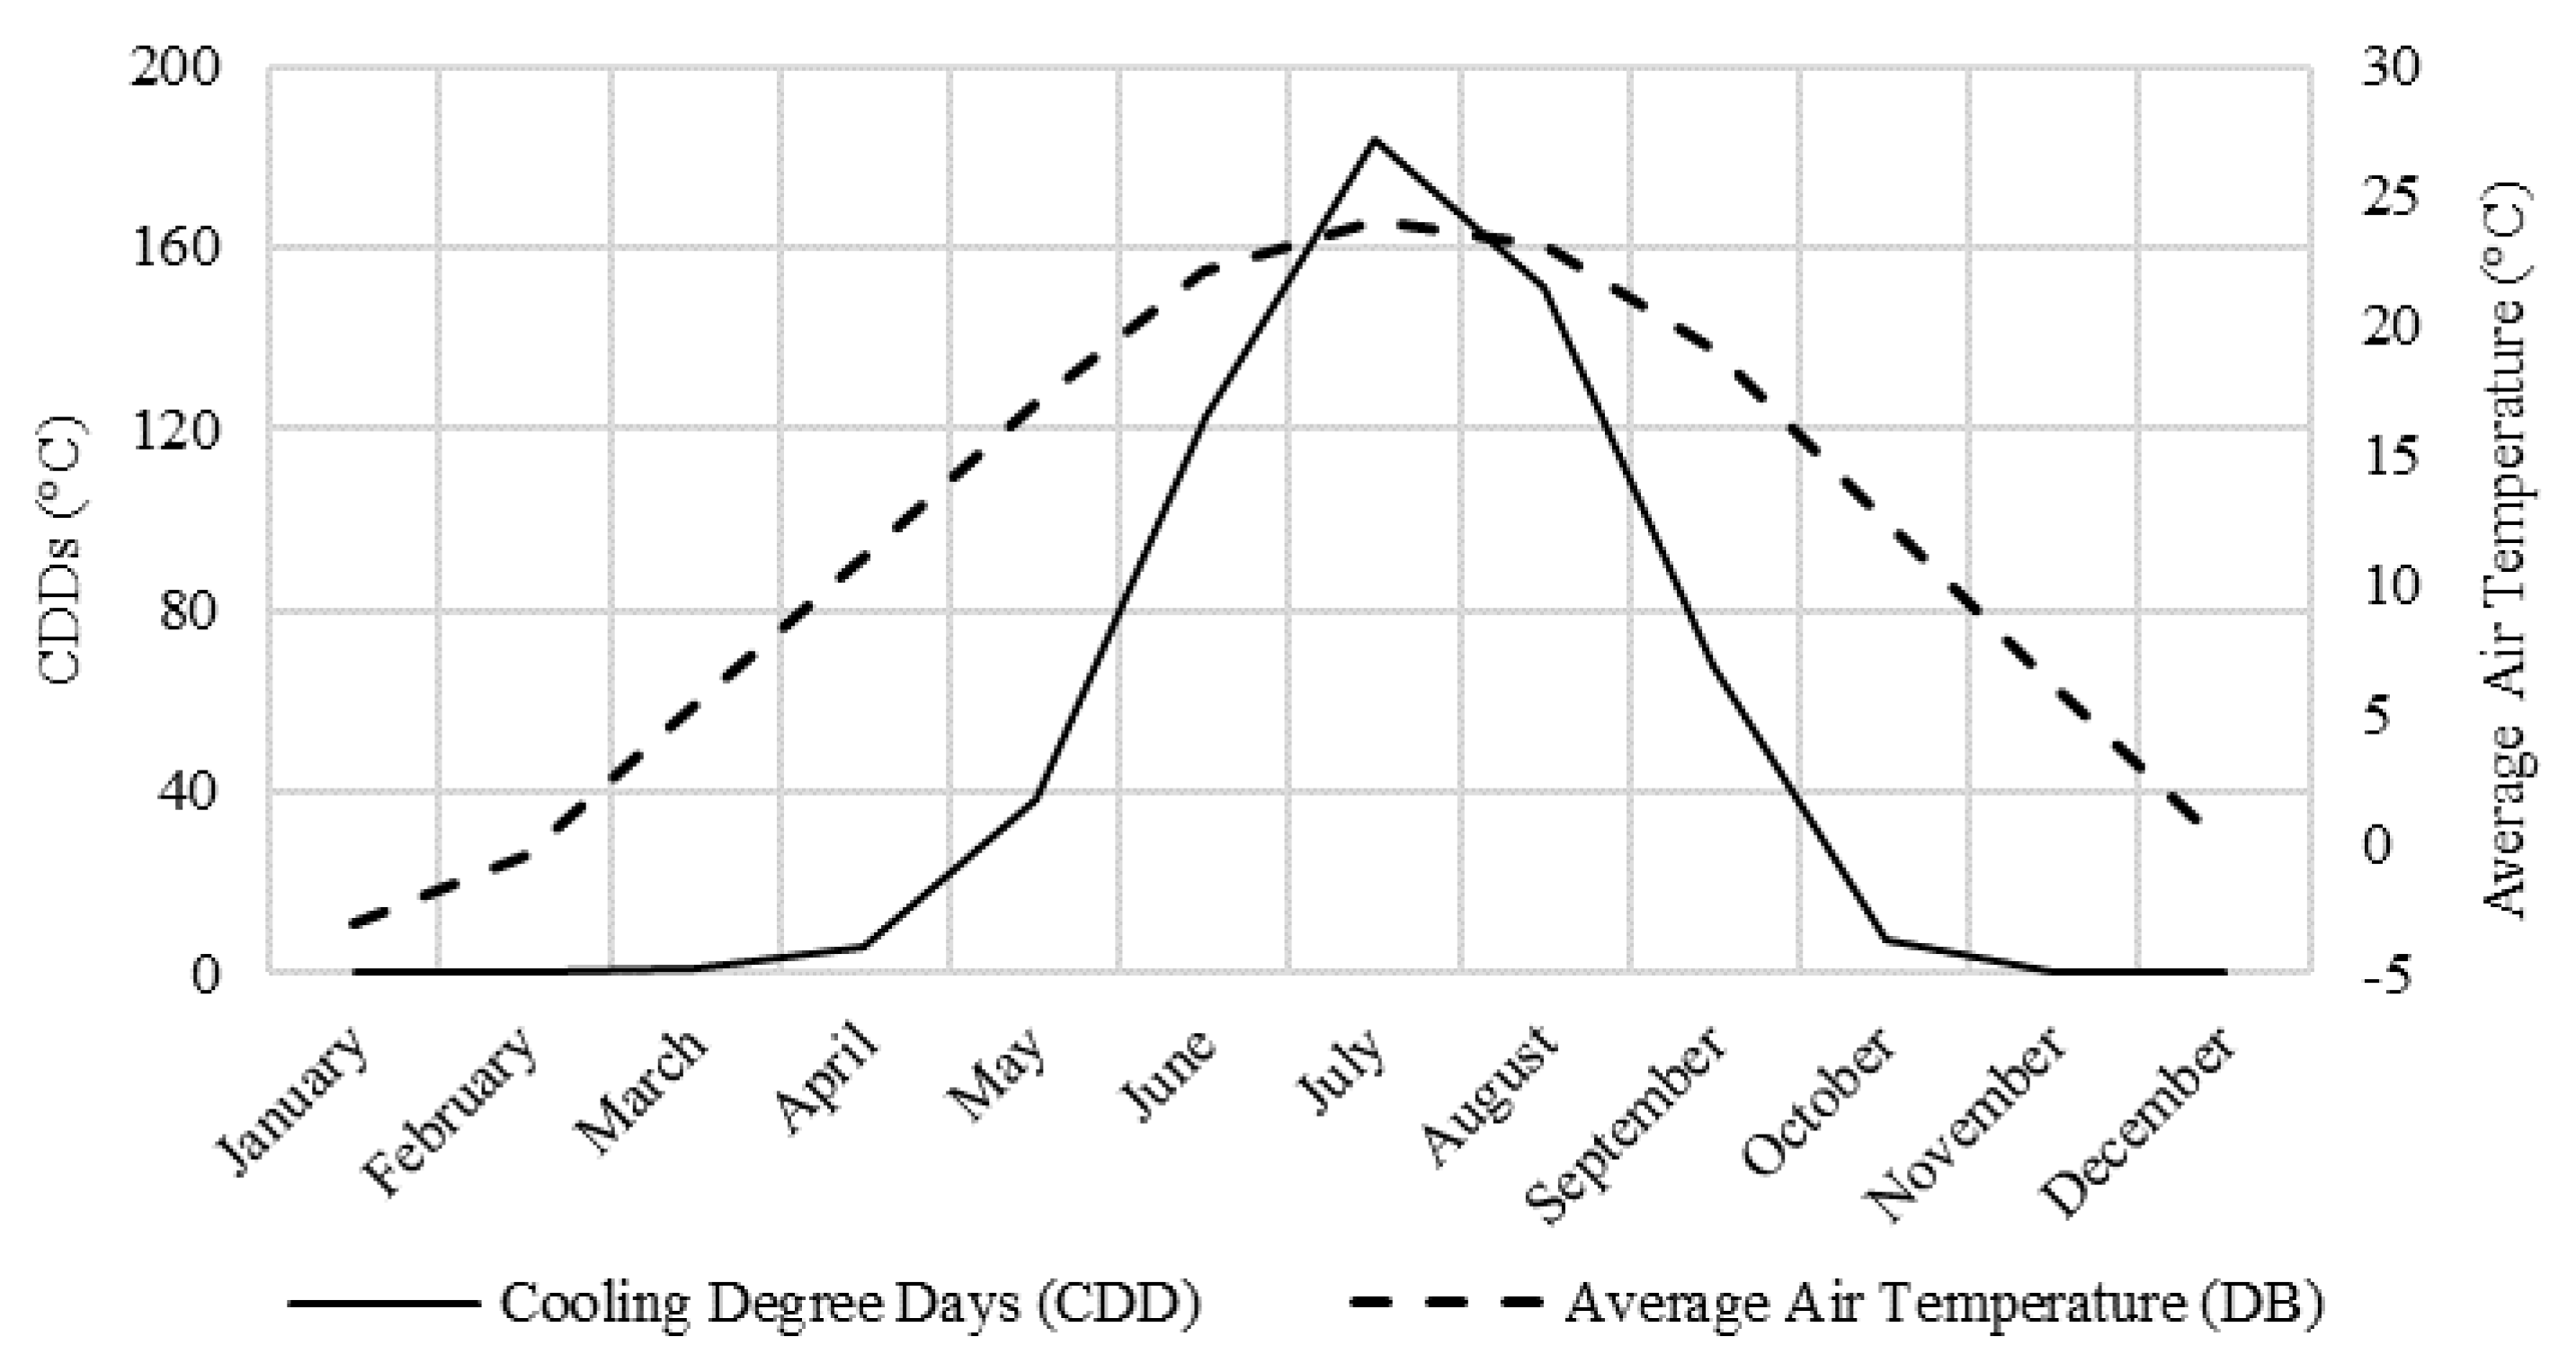
2 two-floor house located in Kokomo City, Indiana, in the US was considered. Indiana has cooling degree days and the average dry air temperature as shown in
Figure 1 [
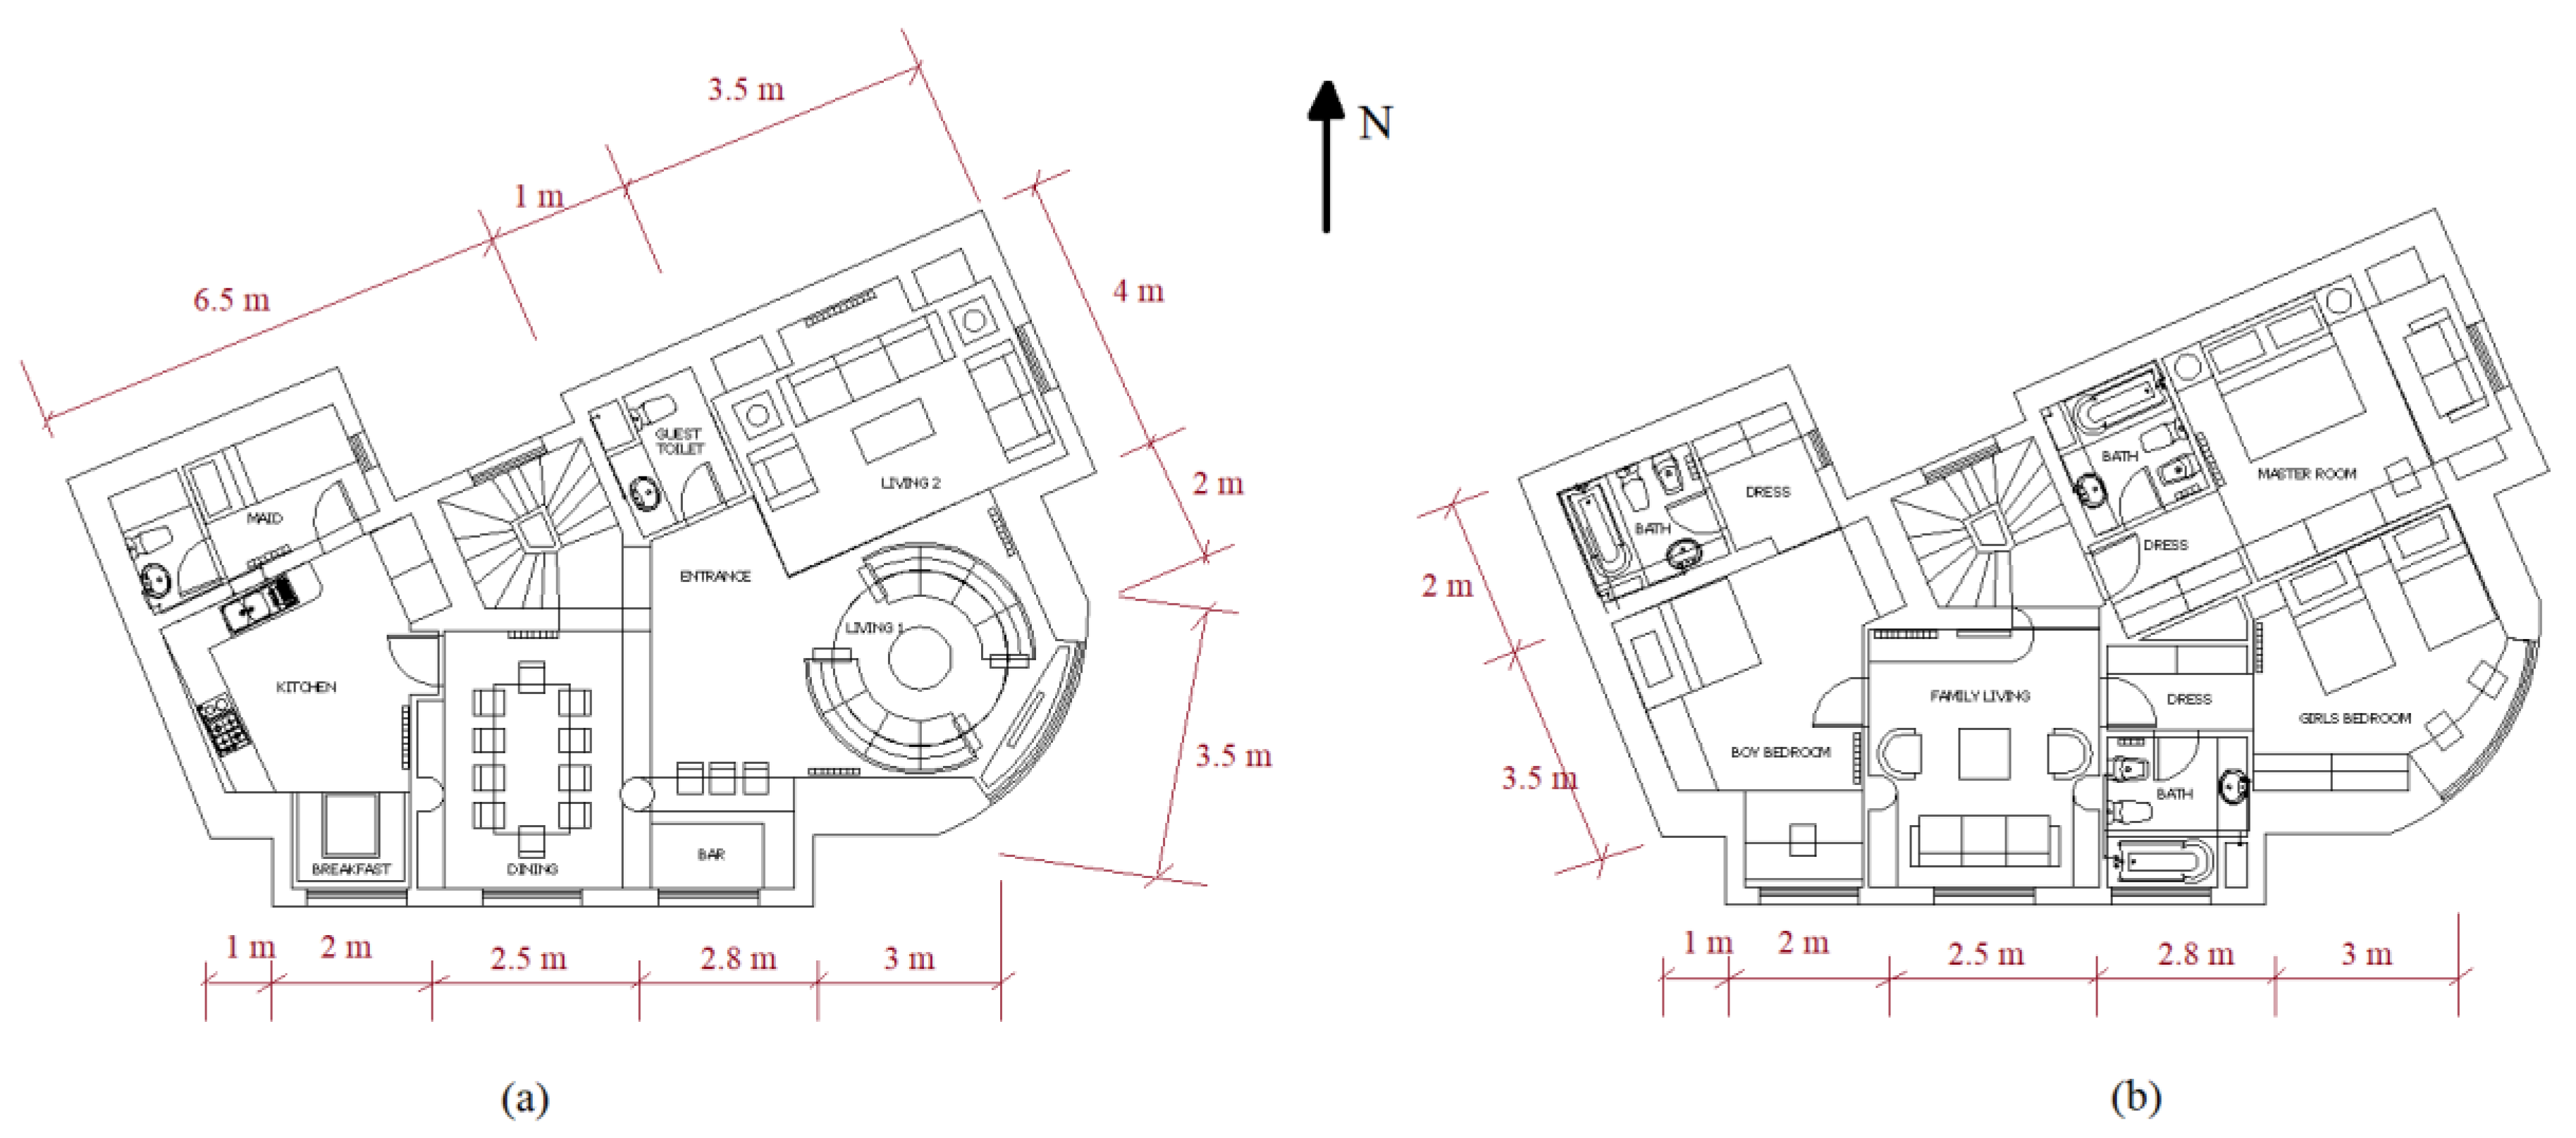
33]. The peak cooling load demand and energy consumption were checked under various building material assemblies considering summer conditions for the period from June till September. The house was composed of two floors as shown in
Figure 2. A base case was identified and the parameters used are shown in
Table 1. The first floor of the house included two living areas, a kitchen, dining room and a bar in addition to a maid room. The second floor included a master bedroom, two smaller bedrooms and a family sitting area. The house details are provided in
Table 1 and other information, such as walls and window areas, could be extracted by measuring to scale from
Figure 2. The literature review showed that solar gains through walls and windows have a significant contribution to the cooling demand and energy use of buildings [
15]. Thus, this study considered various cases for single and combined wall structures, different glass types and models, and lights as well. No investigation was considered to check on the effect of human detection and presence, alternative lighting, etc. The main focus was on the building envelope and the associated lighting that developers and builders use.
Infiltration through the building structures such as windows, doors, electric plugs, etc. was used as per ASHRAE codes, but it was set to a fixed value throughout the cases. The various options that this study considered are listed below:
- (a)
Hollow concrete blocks in four standard thicknesses. Single and double skin walls were considered with an air gap in between, rock wool or polystyrene expanse insulation.
- (b)
Single-pane glass in three standard types of (6 mm thickness)
- (c)
Double-pane glass in three standard types: clear regular, heat absorbing out, and reflective glass types.
- (d)
Insulation for the double skin wall structures included:
- (e)
As for lighting, fluorescent and economic fluorescent bulbs were considered each in separate cases.
To investigate the energy conservation for the building, multiple changes were considered. There were single and multiple case changes. In single-case changes, a single parameter was changed while keeping the other parameters fixed as defined in
Table 1. In multiple case changes, a combination of parameters was changed. These cases are defined and summarized in
Table 2. The parameters defined in
Table 1 are identified as the Base Case (BC) for later comparisons. All other cases were of the single change investigation type, except for the V1 through V5 cases that combined other single cases together. One parameter change is a technique used by many researchers while keeping other parameters fixed. This one-factor approach usually provides advantages only under a specific condition [
34]. The multiple case scenarios would give the designer a sense of the savings that could be achieved while doing multiple changes in his design instead of one parameter change at a time.
Cooling loads were estimated for each case using a Carrier commercial software, Hourly Analysis Program (HAP) [
35]. Any variables that were not defined in
Table 1 or
Figure 2 were set to be constant in the simulation for all cases such as light and people schedules which would give the same base comparison for all cases when held constant.
To estimate the investment cost of each case, the US market was surveyed for some common building material prices. The survey summary is listed in
Table 3.
4. Results and Discussion
The cooling load for each case was simulated with the same variables as defined for the base case in
Table 1 plus any changes as defined for each case in
Table 2. Then, based on the cooling load requirements, the electrical load was estimated using Equation (1) for an average coefficient of performance of the cycle (COP = 2). The estimated value for the COP was based on the industry values for sizes of the chillers similar to those obtained in this study.
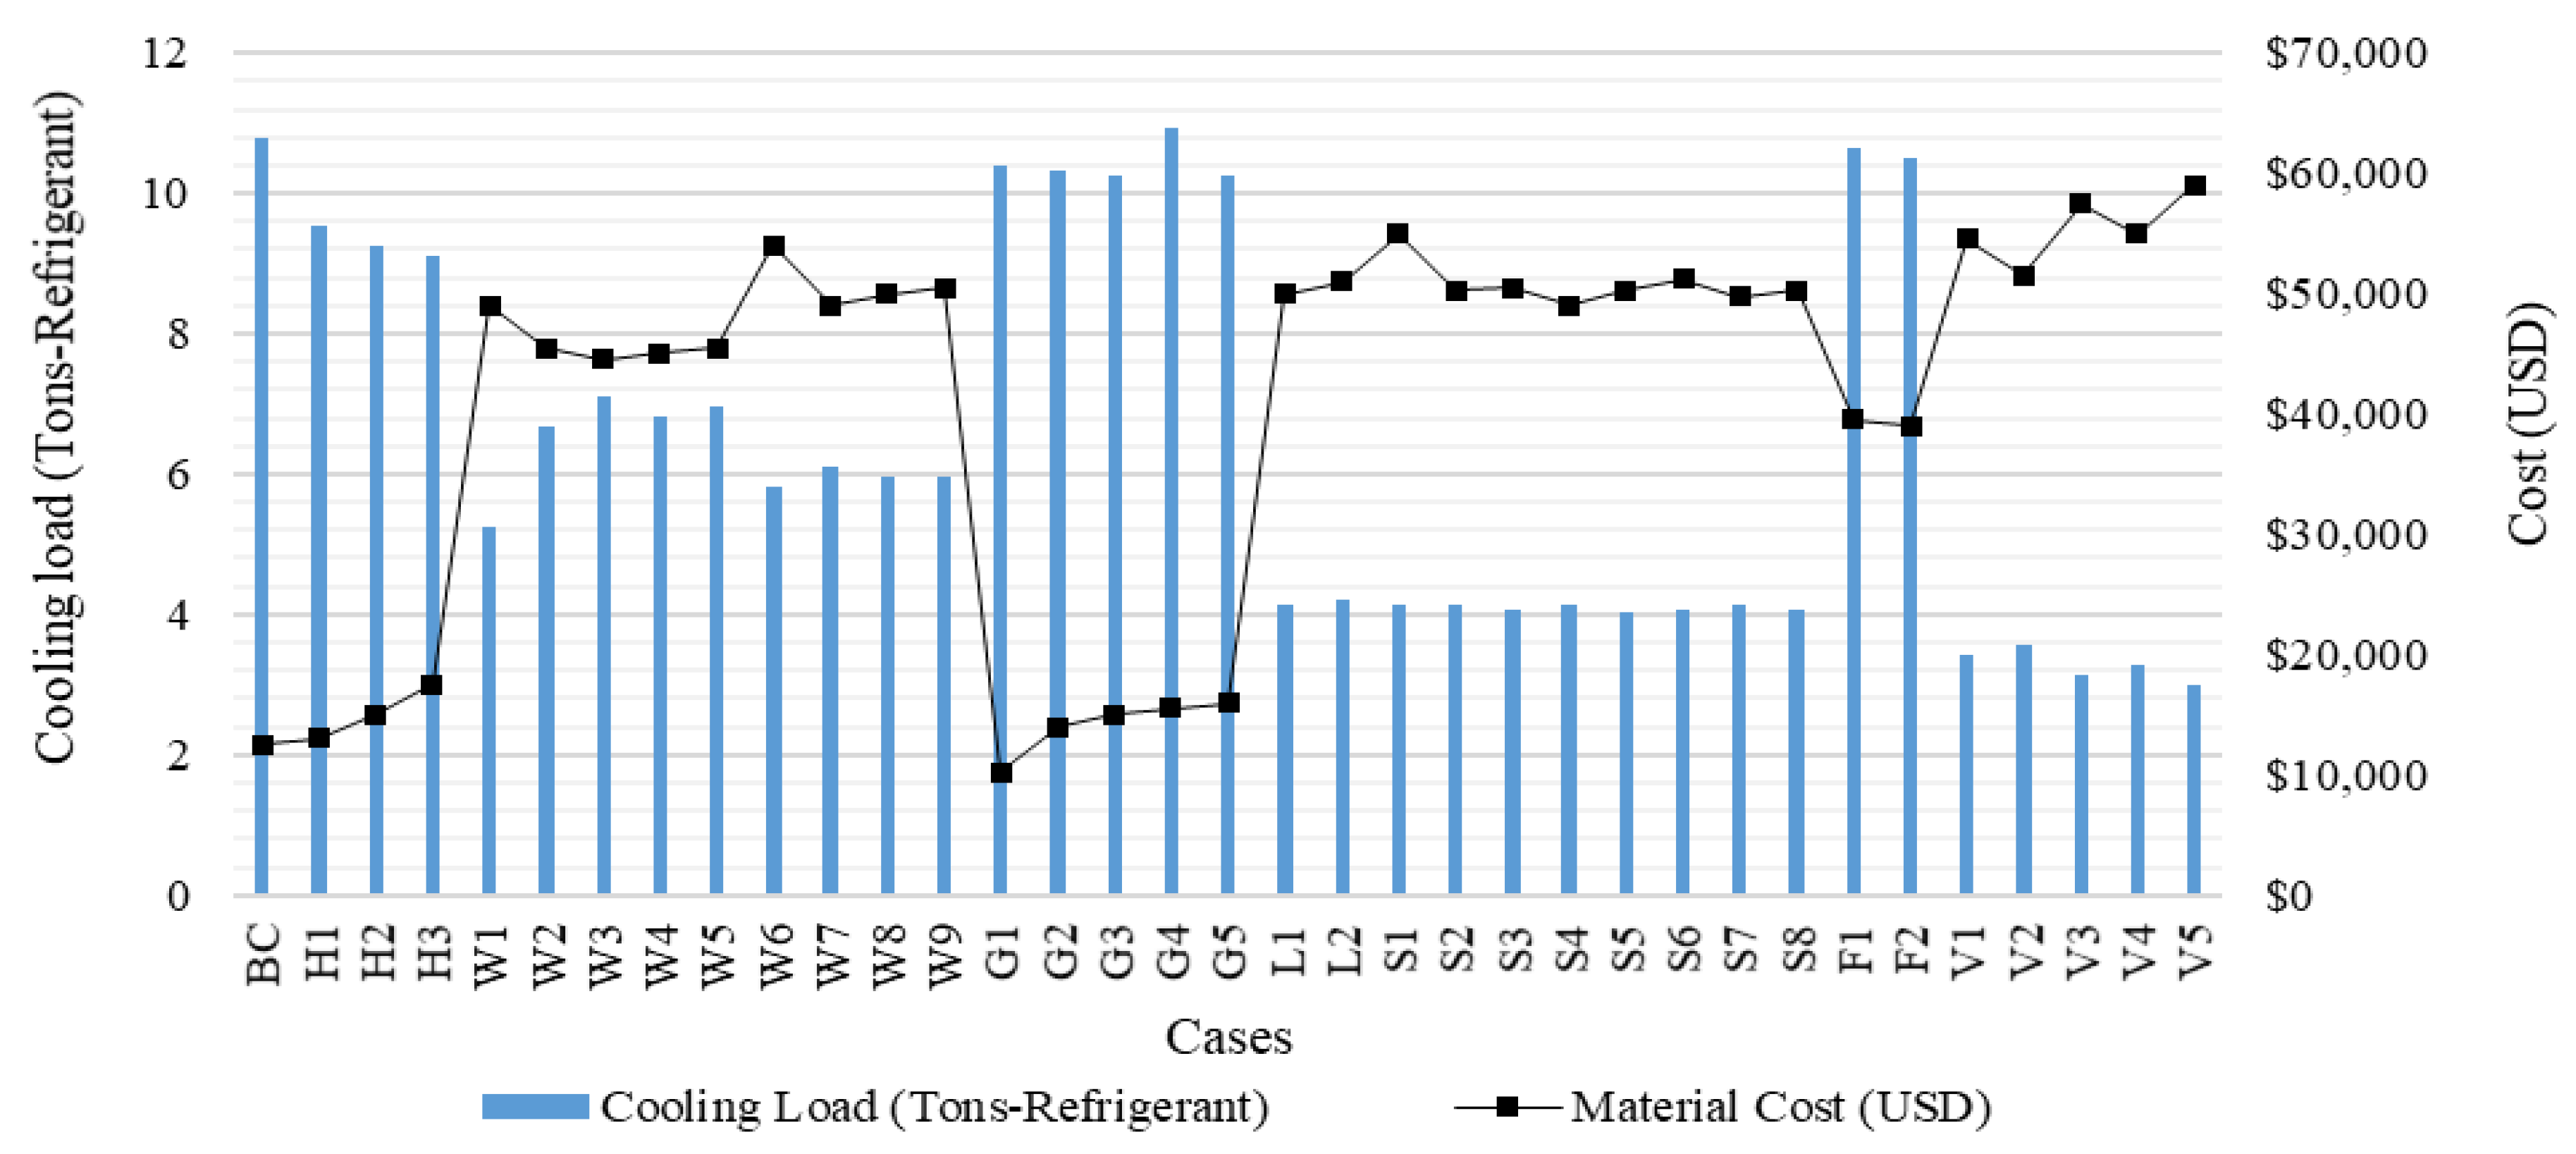
Equation (1) was used while neglecting any losses in the unit such as mechanical or electrical losses. Other loads such as infiltration, miscellaneous, slab, warm up, and the factor of safety were set fixed in all cases. The peak cooling load in tons-refrigerant (TR) is shown in
Figure 3 for all considered cases. The material costs for the building envelope, glazing, insulation and other building materials used for each case were estimated based on a survey for the US market. The costs are plotted along with the cooling load in
Figure 3.
As expected, the lower the cooling load, the higher the initial cost for the material needed. In other words, the higher the investment, the higher the savings will be. From
Figure 3, it was observed that changing the wall from 10 cm to a higher thickness decreased the cooling load by approximately 10%, 16%, and 18% for 12, 15, and 20 cm (HCB) blocks, respectively. Thus, there is not much of a savings increase beyond the 15 cm blocks, especially when considering the material cost. Less efficient results were achieved with glass changes when standing alone with no other changes considered. Cooling load demands were slightly decreased for case G1 through G5 than it was for the base case “BC” load. Again, taking the materials cost into consideration, G1 was the best case among the 5-glass cases. Similarly, the roof insulation cases did not offer much cooling load reductions. On the other hand, the composite wall cases were more efficient than single walls. Cases W1 through W9, when an air gap was used between double skin hollow block walls, offered more savings for the cooling loads than H1 through H3. Higher cooling load reductions were achieved in double skin walls with 5 cm rock wool or 5 cm expanded polystyrene insulation, new light cases, and other multiple combined cases. It was clear that air gap insulation was less efficient than wool and polystyrene insulation.
However, decisions regarding the best material building envelope should not be solely made based on cooling load reductions and material cost. Operating costs to run the AC unit, chillers for example, and reductions in the size and cost of the unit that reflects the real estate value should be used along with the cooling load reductions and the return on investments to decide on the best design. Another parameter might be the available usage area of the spaces inside the buildings. When using double skin walls, for example, the area of the used space would be less than a single wall and ultimately the cost of the space would decrease since it is based on the available area to be used. An optimum correlation should take all of these parameters into consideration.
Design cases that give lower cooling loads reflect good choices in building materials, but that should not be the final parameter in deciding the optimum envelope structure. Optimization was done by looking into the annual operating cost, initial cost, and payback period. Operating costs were evaluated using the kWh usage rates shown in
Table 4.
In addition to the tariff rates shown in
Table 4, there are some additional rates, such as fuel and coal costs, environmental compliance, transmission and distribution, reliability, federally mandated cost, and renewable energy costs. These miscellaneous costs sum every month to approximately
$0.04766 per kWh.
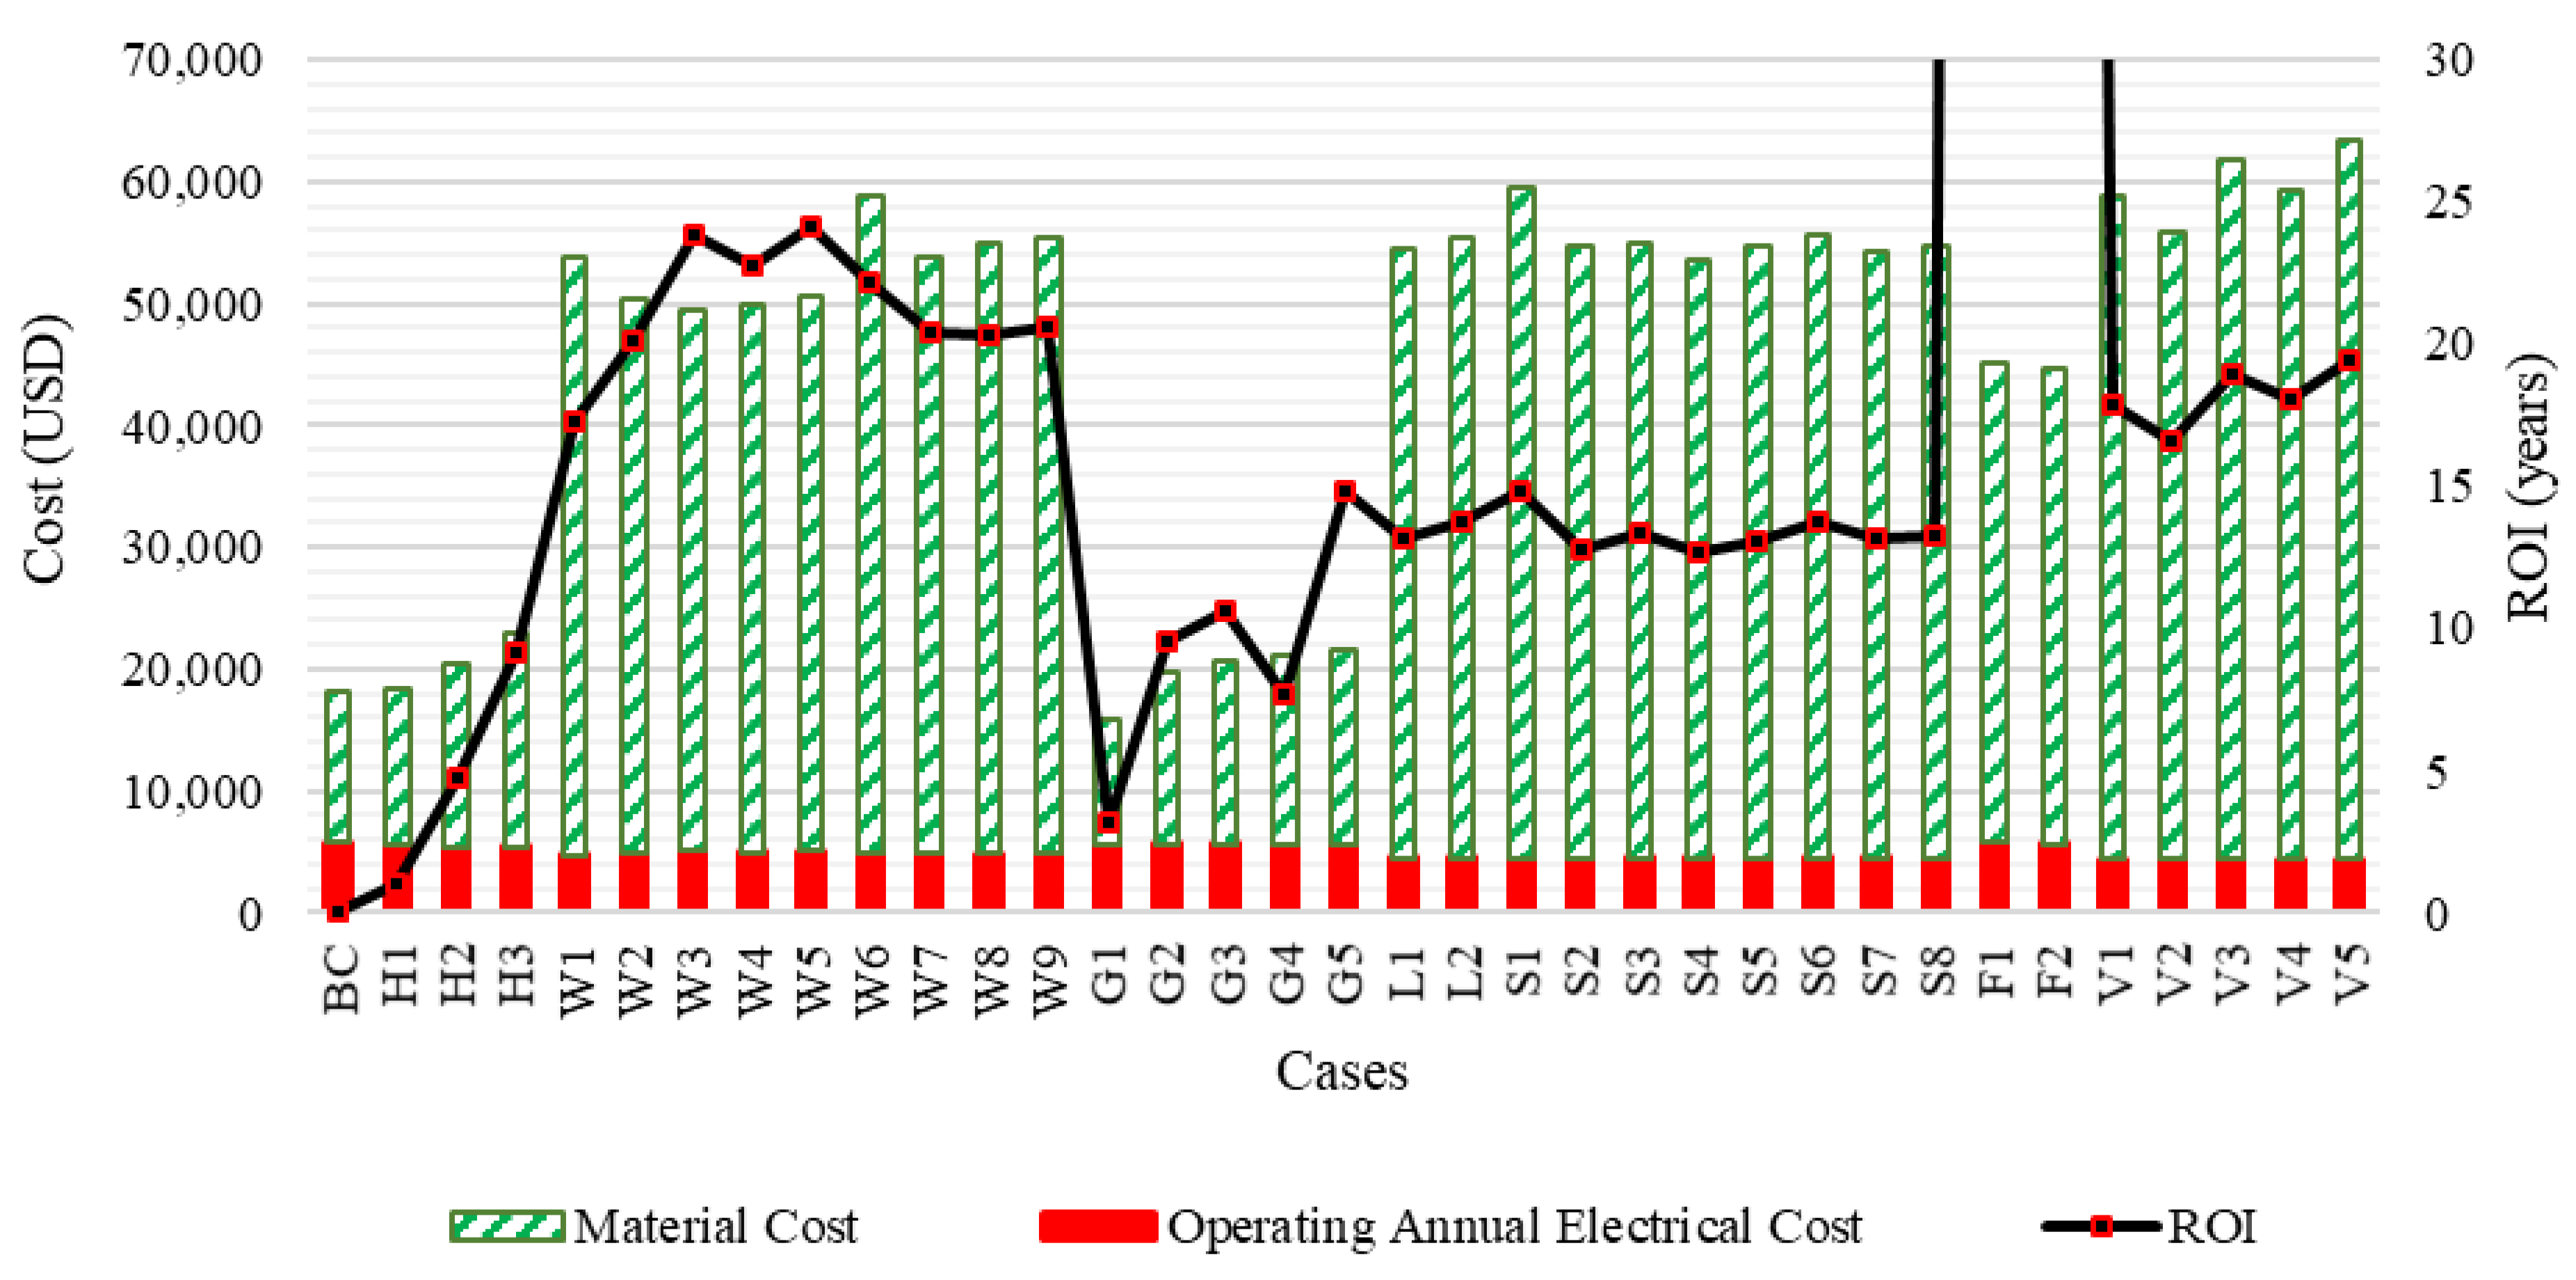
The material or initial investment cost, the electrical operating costs, and the payback period are shown in
Figure 4. The operating costs are much lower than the initial investment costs. Single hollow blocks and single glass cases have much cheaper initial investment rates than lights, compound walls, and combined cases. However, the cooling load savings were insignificant for these cheaper initial investments compared to other more expensive cases. The relationship between initial capital investment and the monthly savings from the lower operating expenses determines the payback period or the return on investment (ROI). The ROI of each case was estimated using Equation (2).
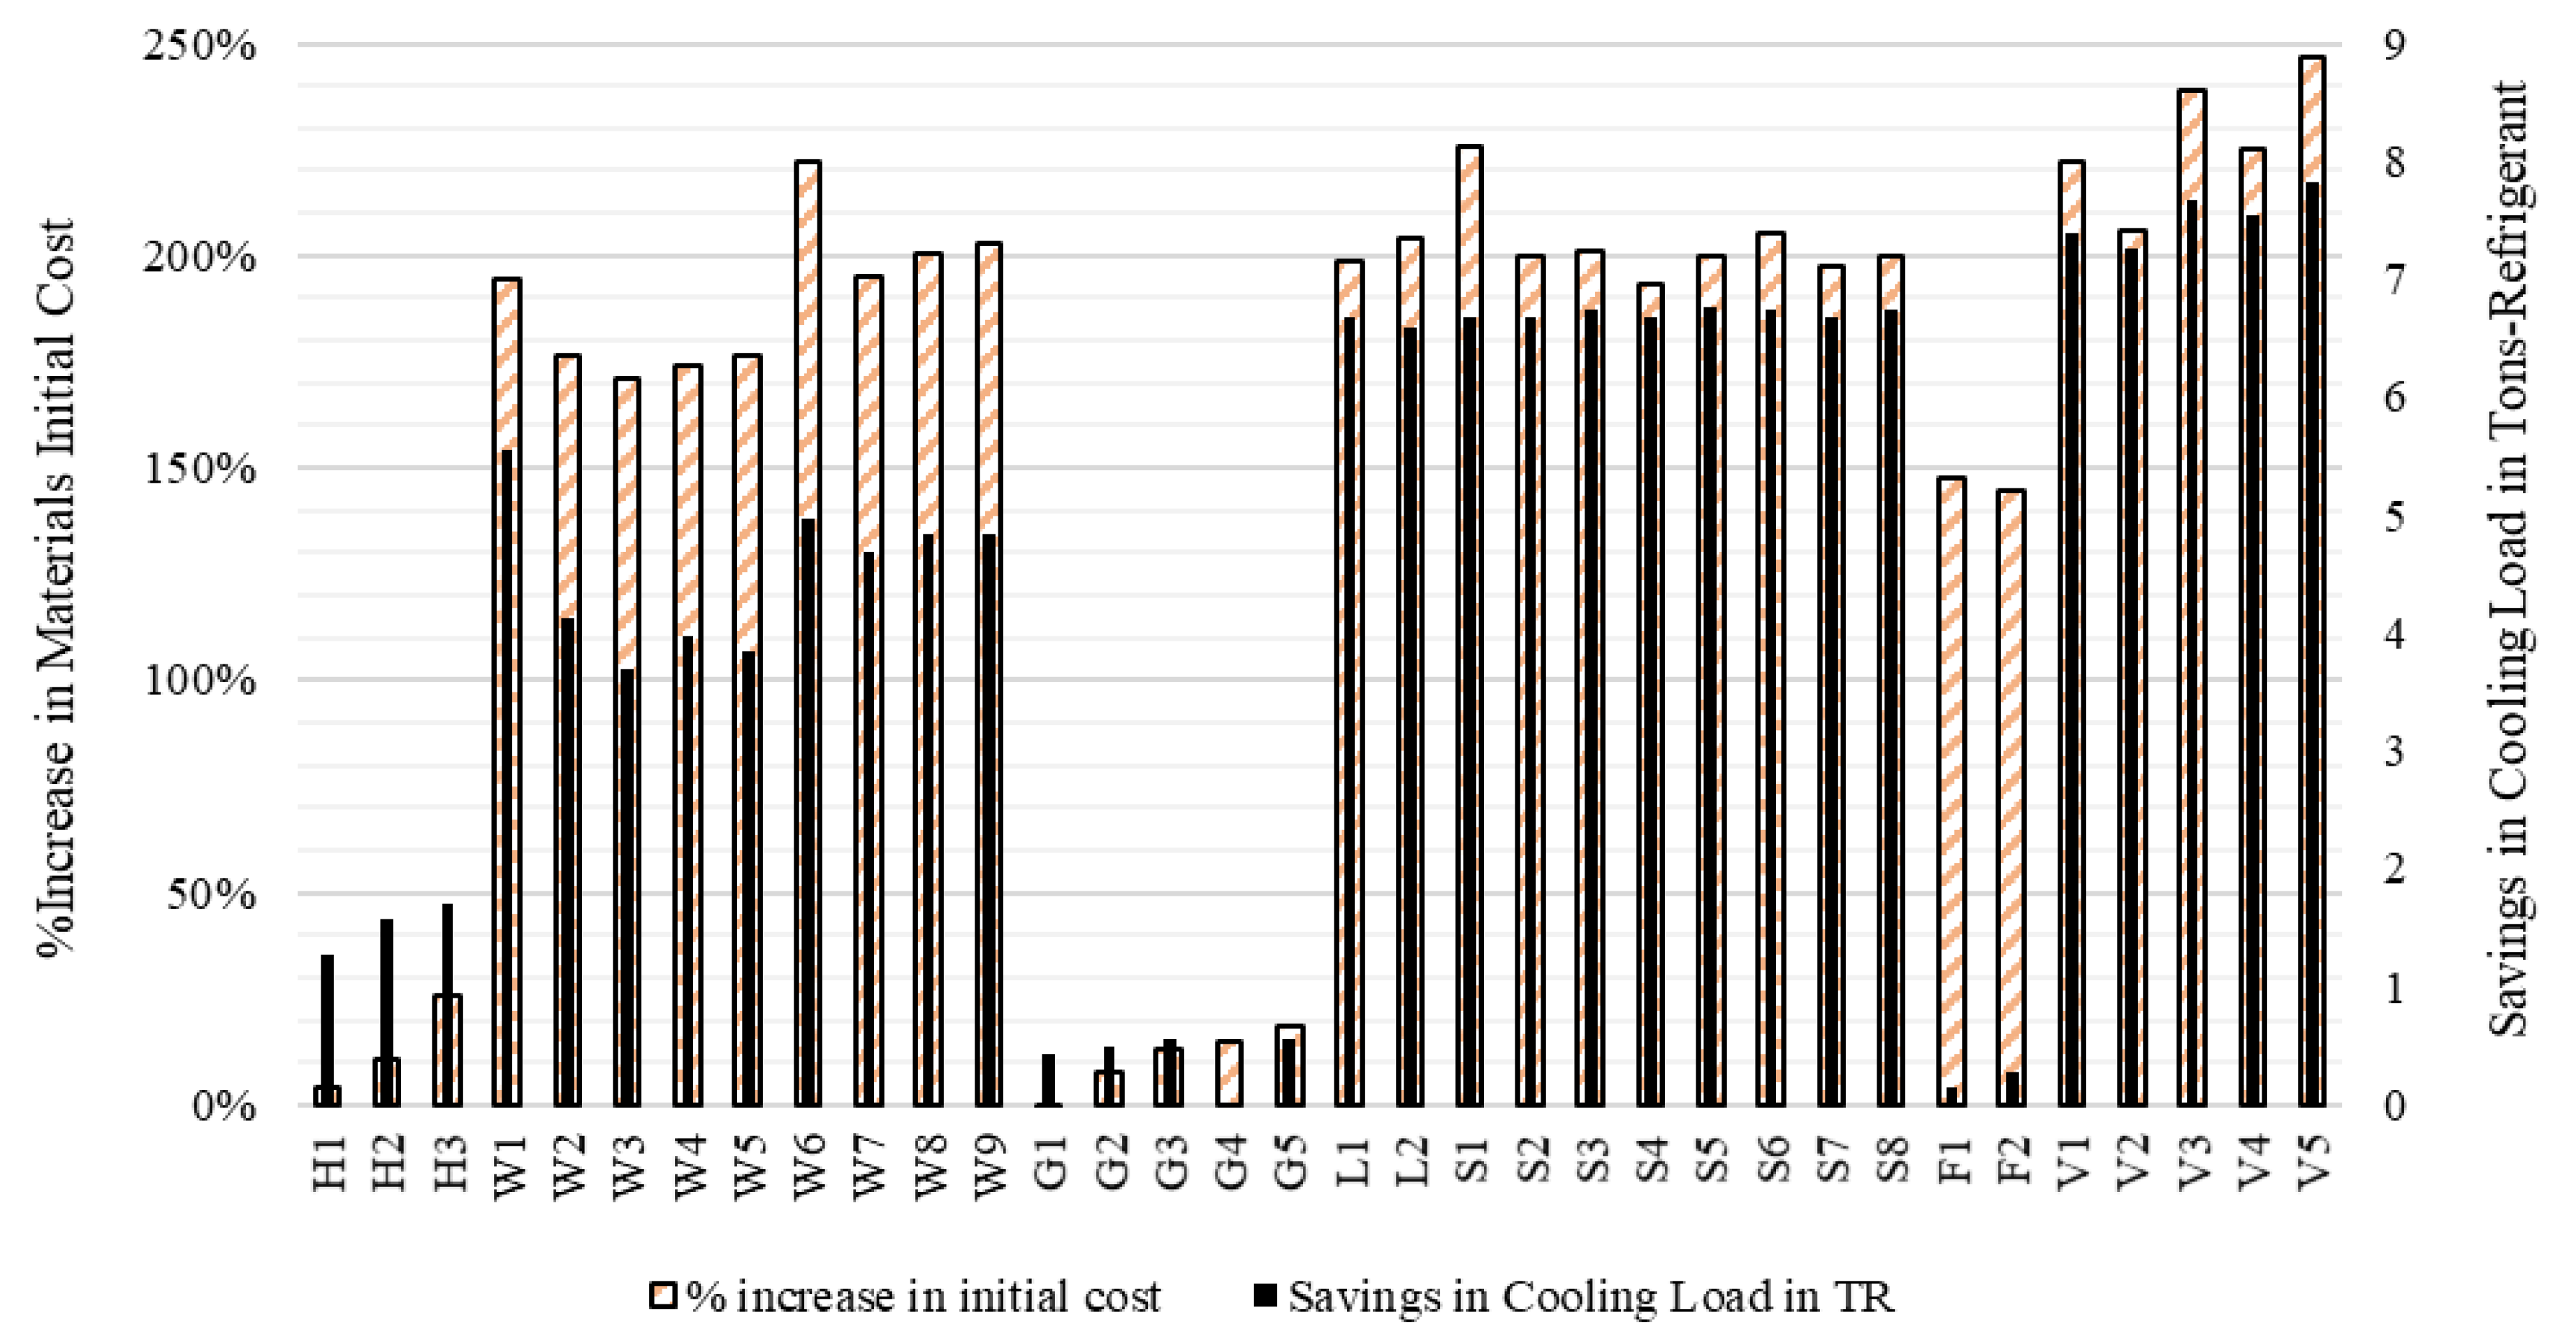
A deeper analysis for a better comparison and more robust conclusions was done investigating the savings in the cooling load demands with respect to “BC”. The savings for each case w.r.t. the “BC” are plotted along with the associated percent increase in material or initial costs in
Figure 5. From
Figure 5, the glass cases almost had the lowest initial costs, but the highest cooling loads. For the cases when single walls were changed or when only the glass was changed, the return on investment was less than all other cases. However, the initial investment does not take into consideration the drop in the equipment price, such as the chiller size and other associated prices. For example, for other cases when the cooling load is reduced by 5 times, the required chiller to supply the new lower cooling load would ultimately be much cheaper. Other cases where no significant effects were obtained were for roof insulation. However, unlike with glass and single wall change cases, the initial costs for roof insulation cases were much higher and, thus, the ROI was so high. The ROI for the F1 and F2 cases are not plotted in
Figure 4 as the values were much higher than other cases and the scale would not be readable by the readers.
For insulation optimization, most of the cases with wool or polystyrene insulation returned a payback period of 13–14 years. The air gap between double skin block walls was much less efficient with ROIs reaching up to 24 years. If it was to use a single case, then L1 for lights “fluorescent lights” or S4 (10 cm double skin wall with 5 cm polystyrene insulation) would be the best options. These decisions were made based on the data and results presented in
Figure 4 and
Figure 5. Changes in single walls or glass as separate cases are short-term investments, but for the long-term, S4 or L1 are more promising.
The best case in terms of combined cases is V2 as it has the lowest ROI among V1 through V5 cases, and the least percent increase in initial cost as shown in
Figure 5. If a design case is to be chosen based on the lowest cooling load only, then the combined case V5 would be the best. However, V2 has a comparatively acceptable cooling load reduction with respect to V5, has a much simpler wall structure, and thus has the lowest initial cost among the five combined cases V1 through V5. It should be noted that V2 has double pane heat-absorbing glass, fluorescent lights and 20 cm single HCB walls. Double pane heat-absorbing glass was among the best-combined cases whereas it was among the worst cases when used by itself. This gives a glimpse of the power of this comparison study. The V2 case offers approximately 16 years to pay back the initial investment. If a lower payback period is desired, then L1, S2 or S4 could be implemented with more preference towards S4 as it offers more usage area as will be discussed.
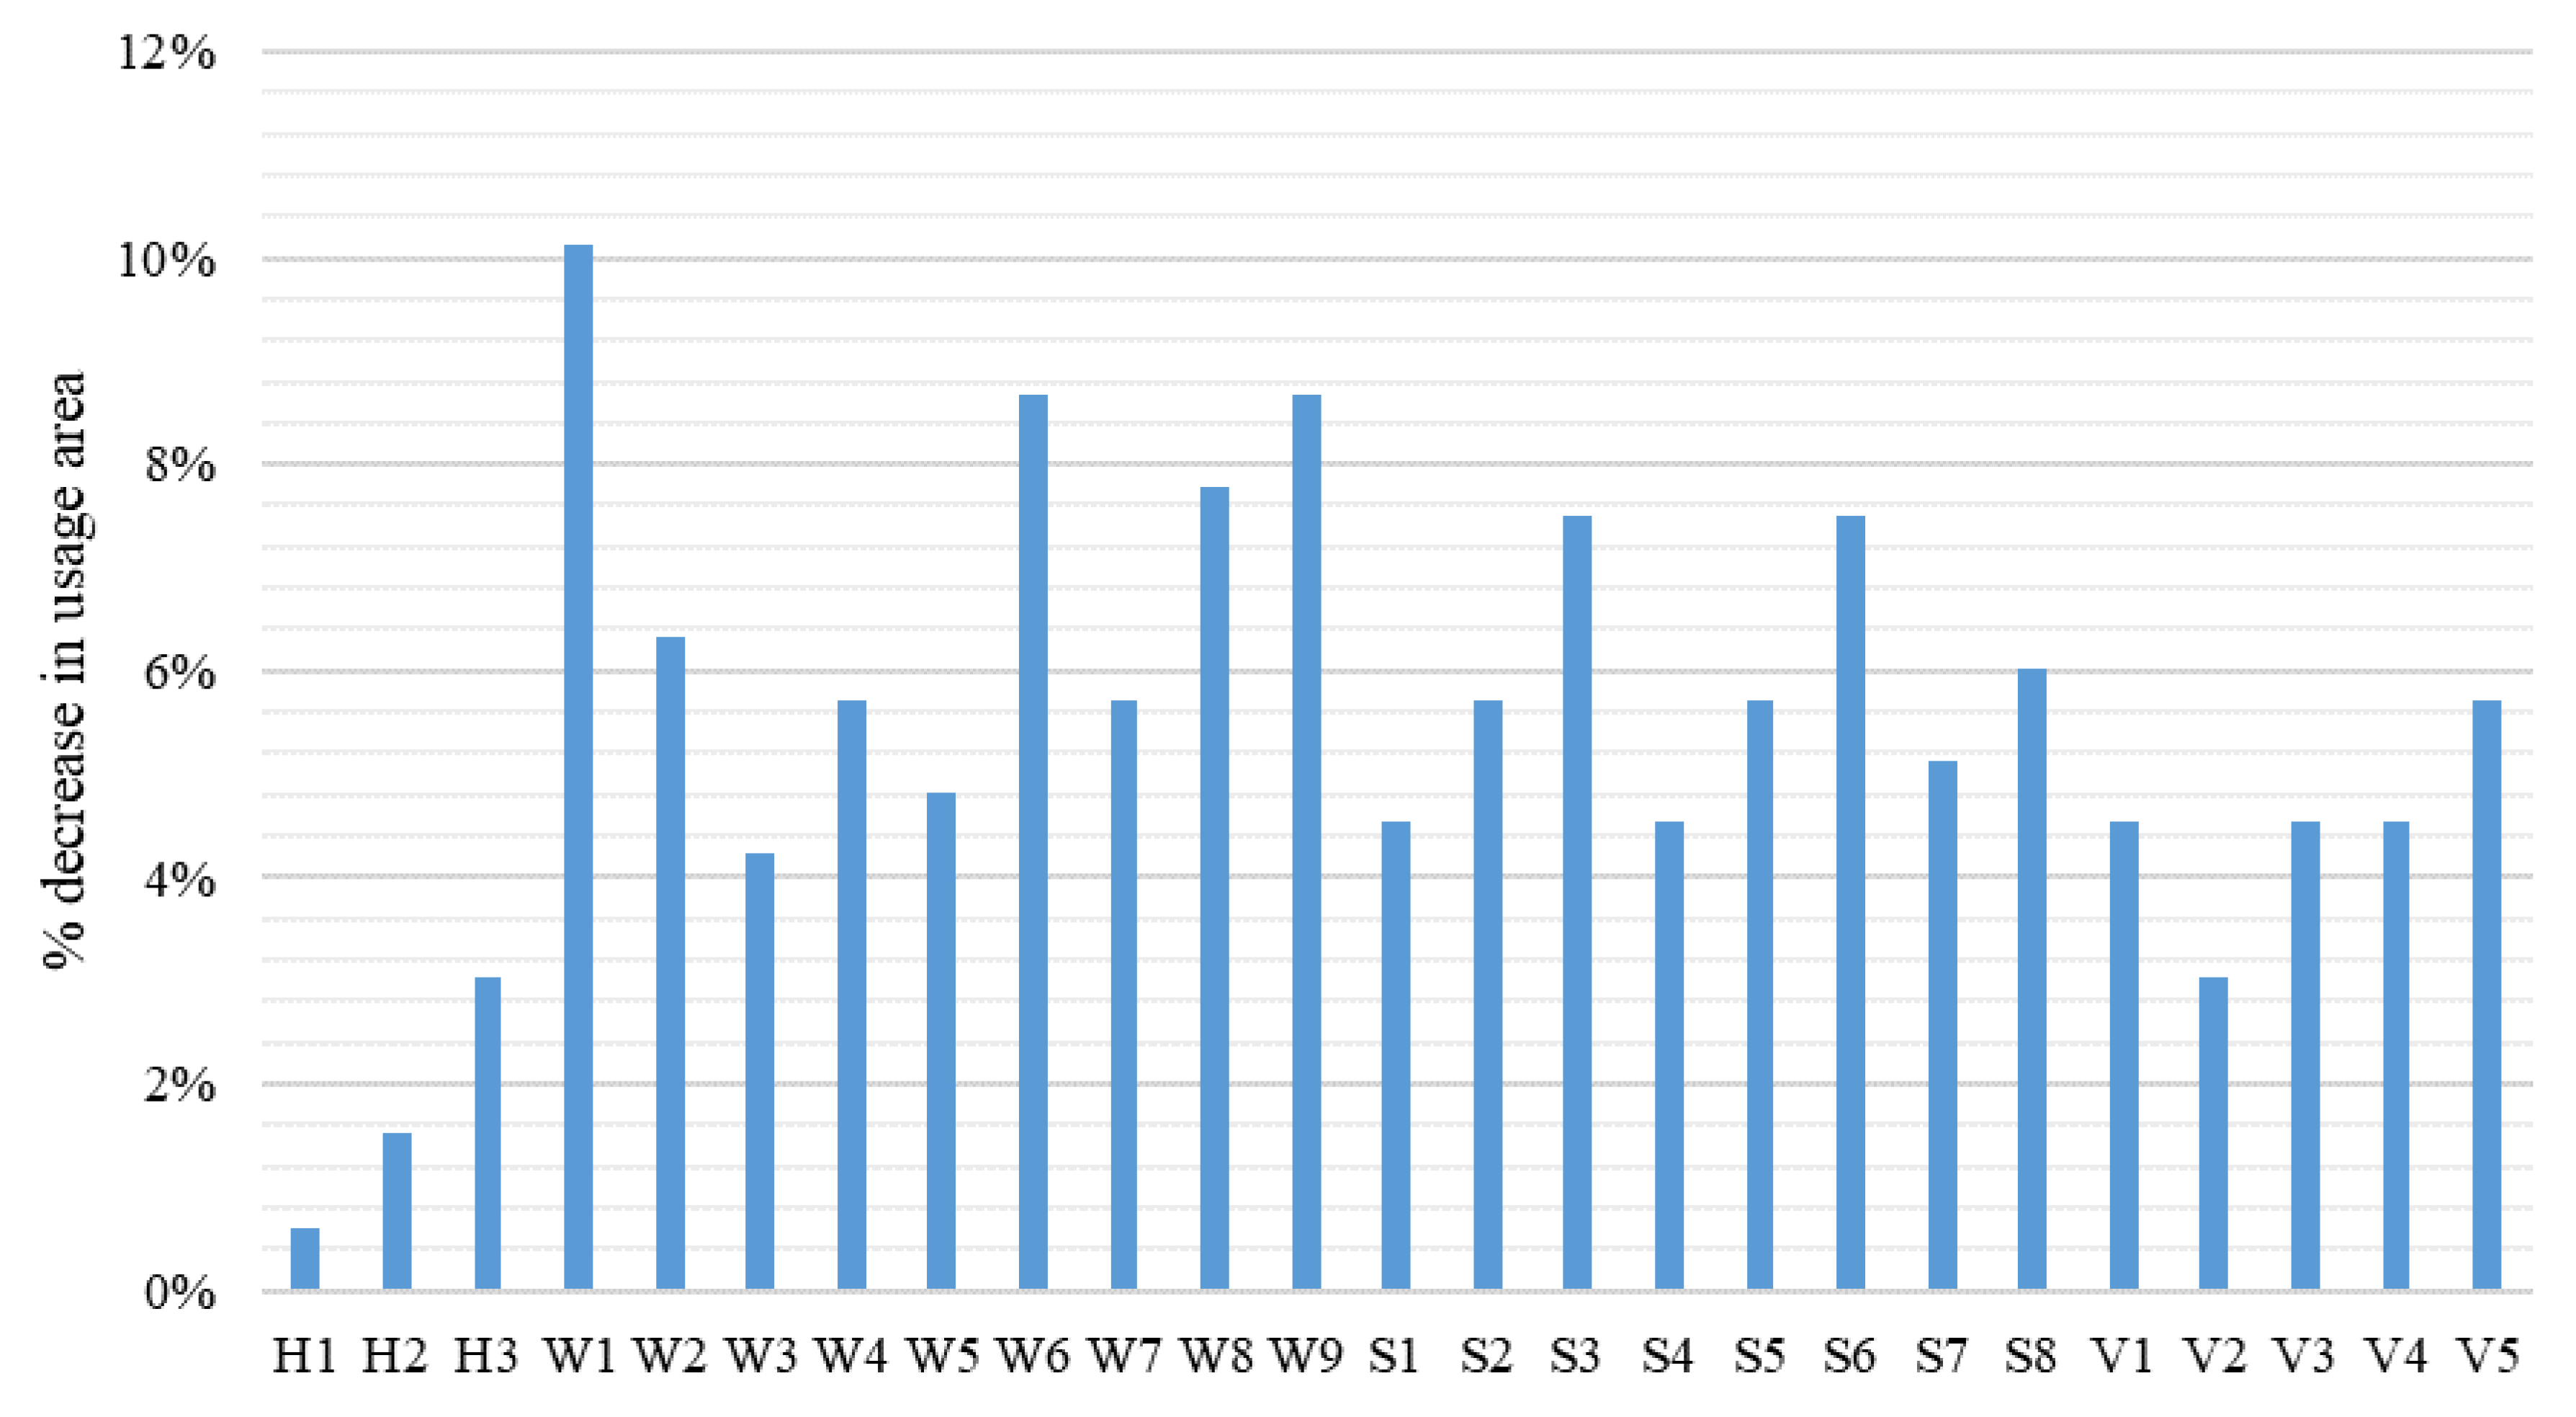
The above ROI comparison should not be blindly used without other considerations. Many data and results that are used can widely vary by location, from supplier to supplier, and by design conditions as well. For example, the chillers and AHUs (Air Handling Units) depend on the options and specifications that each supplier provides. Since each designer works with a specific supplier, suggesting a price for a specific unit can mislead the results of this study and, thus, the selection made by the designer. Other parameters that need to be integrated with the ROI calculations are the maintenance costs, which are comparably fixed for any case, reduction in the equipment initial cost since the cooling load is reduced, and another indirect parameter which is the reduction in usage area of the space. For example, a usage area with a 20 cm hollow block is smaller than that with a 10 cm hollow block wall. This loss in usage area price depends on the square-meter rental rate that depends on the location (city, state and country) of the project and, again, cannot be predicted in this study, otherwise, it will provide inaccurate results. The best way to illustrate this is to consider a simple calculation for the loss in internal usage area of a 10-floor building, consisting of 4-apartments in each floor with an area of 200 m
2 each. Taking the wall thickness, the insulation, and other building material sizes into consideration showed that the loss can be as low as 1% for the H1 case (12 cm HCB) and can reach up to more than 10% for the W1 case (20 cm HCB, 4 cm air gap, 20 cm HCB). Reduction in the usage area for all cases that have a wall thickness that is different than BC are plotted
Figure 6. Therefore, the loss in the area price of the building should be taken into consideration along with the cooling load’s reduction and ROI for more accurate results before deciding on the final design of the building. For example, it can be seen that V2 offers more usage area than S2 or S4; this helps in deciding between S2, S4, or V2, which were all compared against each other in the previous section.
For comparison purposes, the results of the study done by Tronchin et al. [
28] are presented here. More details about the base case and other changes done to the building are provided in the introduction section. The considered area of the investigated buildings was comparable to the surface area of this paper. The simulation of the upgraded house was done to meet the minimum current codes and was labeled as the “Base Case”. In addition to the base case, three single scenarios and two other combined ones were investigated. Only the cases that offered the highest cooling load reductions and the best energy-efficiency-retrofits are summarized here. Both cases were combined cases from previous single change scenarios. The changes from the base case are presented in
Table 5 and the improvements in cooling load, EP
i, initial cost, and global financial cost are presented in
Table 6.
The combined case “Case 1+2” was the best scenario based on the energy-efficiency retrofit measure in terms of the cost efficiency. There were other cases but were not presented here as they did not offer the best results. Interested readers can visit the reference [
28] for more details. “Case 1+2” and “Case 1+2+3” offered the same reduction in the cooling and heating loads but “Case 1+2” offered more reductions in global financial costs and, thus, higher cost efficiency. Changes in “Case 1+2” over the base case included changing the thickness of the polystyrene expanse insulation to 12 cm in roofs and walls, changing the single low emission glass window to triple glazing (4-12-4-12-4), replacing the traditional boiler with a condensing boiler that runs on natural gas, and adding 2.5 m
2 of solar collectors that provide 1727.78 kWh per year.
5. Conclusions
The peak cooling load is a direct parameter for the level of energy consumption in buildings. Reducing the load demand would reduce the operating electrical consumption and would promote energy savings. However, it is a very tedious process to determine the best savings for each design as it depends on the location, orientation, window to wall ratio, type of lighting, and people density schedules. Optimization should always be done for each considered change. For example, increasing the façade area to reduce the lighting load would increase the solar gains and thus would increase the cooling load requirements. The optimization will depend on the exposure or orientation of the building and the geographical location. Thus, this optimization procedure should be applied to each case before deciding on the best envelope. However, cases that share the same air average temperatures and the same cooling degree days as presented in
Figure 1 can follow the below recommendations.
There were many single-case changes that provided promising results, such as (1) L1 (changing BC lighting to a fluorescent light) which was the best case among the single change cases, (2) compound walls with rock wool (S2), or (3) expanded polystyrene insulation (S4). Combining the single-case changes together seems to be a norm for designers, but figuring out the best combination to achieve the best cooling load with an optimum budget is an art that this paper tries to achieve. The use of a single layer of HCB walls with a specific glazing system and lights provided very promising results as shown for case V2 that combines 20 cm HCB walls, double pane heat-absorbing glass, and fluorescent lights. This suggests that single-walled buildings are able to achieve significant cooling load reductions and, thus, energy consumption savings by installing fluorescent lights, properly optimizing the shading to the windows, or an efficient glazing system. This agreed with the literature recommendations where multiple change scenarios in the building envelope were recommended for the best energy efficiency for both cooling and heating.
This would be an opportunity for all existing buildings that are lacking energy conservation measures to start optimizing the energy bills through the implementation of feasible changes without having to change the exterior walls.
There is no single case that works for every designer and application. There are many contributing factors that the designers can use to decide on their designs or building modifications. For example,
- -
For walls, cases H1, H2, and H3 are the minimum acceptable cases. If only single walls are to be used with no other changes, 12 cm HCBs are more than enough as the increase in the initial cost for the other two cases, H2 and H3, is not justified when considering the reduction in the cooling load.
- -
For glass, case G1 is the best among the glass cases G1 through G5. It had the lowest ROI and the lowest initial cost.
- -
For internally insulated double skin walls, 10 cm or 12 cm HCB with insulation are good choices. To be more specific, S2 (12 cm double skin HCB wall with 5 cm rock wool insulation) or S4 (double skin 10 cm HCB wall with 5 cm exp. Polys. insulation) are good choices. Considering the results presented in
Figure 6, S4 is more convenient than S2 as it allows more usage area.
- -
Roof insulation is not recommended for such a cooling degree days project as the reduction in cooling demand was much lower than the associated increase in the initial cost for the roof modifications. Additionally, the ROI for both cases F1 and F2 were so high that they were not shown on the same figure (
Figure 4) to ensure the other payback values can be easily seen and interpreted.
Finally, the building designer or owner who decides to upgrade his building towards a more energy efficient building has to conduct a similar investment analysis before deciding on the best case. Each designer has to check the local cost rates for building materials and follow a similar analysis to decide on the best option. Additionally, the actual chiller size and cost and any savings have to be accommodated for; for example, a 10-tons chiller price can vary widely in price from supplier to supplier. Another final piece that the designer should consider is the actual available area or the real estate rates which can change from one building envelope structure to another. Thus, the final decisions should be an optimization between the chillers, AHU and other equipment costs, operating and maintenance costs, return on investments, and the available usage area.


