1. Introduction
Over the years, there has been an increasing realization of the need to design buildings that are both cost and environmentally friendly [
1]. The environmental implications of such designs include reduction in carbon dioxide emission to the environment [
2,
3], embodied energy in buildings [
4,
5] and improvement of indoor air quality [
6]. In order to meet design objectives, designers are usually faced with the challenge of selecting the most suitable material from different material options or alternatives. This decision becomes more complicated when each material option can be supplied by different suppliers. Additionally, each supplier’s ratings may have different contributions towards the budgetary and environmental requirements of the project in terms of measures or criteria such as price, quality of material and service. Building materials have been known to account for about 50% of the total construction cost [
7,
8,
9]. Studies have also shown that this cost is highly influenced by supplier selection criteria [
10,
11]. This is analogous to green construction projects which are also characterized by criteria such as proximity to site and sustainable materials [
12,
13]. However, little has been done to understand how the weight of these criteria can affect decision making in material selection. Furthermore, studies have shown that without supplier involvement, decision making might be far from optimal [
14,
15,
16].
Research on supplier selection has evolved from a cost only criterion to a multi-criteria problem. Depending on the level of importance of each criteria to the designer, the budgetary and environmental impacts of a project could be affected. For example, if the quality of a material is of more importance to the designer, the cost of the material and the project will be higher, and if the supplier is selected for low cost, other criteria such as material quality, distance and environmental considerations may be dissatisfying. The later may result in an increase in the projects total carbon emission and transportation costs. Although, existing studies on material selection have based their cost and carbon emission computations on data sources such as RS Means [
17] and inventory of carbon and energy [
18]. These approaches do not adequately reflect the probable cost and environmental requirements of the project. Contracting firms keep a database of suppliers’ performance evaluations over a period of time. The most suitable supplier will typically be selected based on an evaluation of criteria or factors, whose individual weights may affect the cost and environmental considerations of each material option.
In addressing material selection problems, a number of studies have been conducted using different approaches such as ranking methods and optimization techniques. Castro-Lacouture,
et al. [
19] proposed a mixed integer linear programming for material selection using a Leadership in Energy and Environmental Design (LEED) rating. Florez and Castro-Lacouture [
20] utilized the same optimization model but considered objective and subjective factors. Zhou,
et al. [
21] developed a multi-objective optimization model for sustainable material selection that includes factors such as process, cost, mechanical properties, performance and environmental impact. Chan and Tong [
22] proposed a multi-objective optimization model that uses grey relational analysis to simulate all design criteria and requirements. Rao [
23] proposed an improved compromised ranking method for material selection considering material attributes and their relative importance. Jee and Kang [
24] utilized a ranking method to rank materials according to their level of fulfillment of several requirements. Chatterjee,
et al. [
25] explored the capability of complex proportional assessment and evaluation of mixed data methods for ranking alternative materials according to their capability of meeting predefined design requirements. However, there is no study on how supplier selection criteria weights may influence the budget and environmental considerations during decision making in material selections.
This article proposes a decision support system that integrates building information models (BIM), a modified harmony search optimization algorithm and supplier rating for improving sustainable construction decision making through the selection of materials. The proposed system adopts two LEED requirements pertaining to material selection. The modified harmony search optimization algorithm considers the effect of supplier rating and the criteria weights on the cost and carbon emission of building projects. To illustrate the functionality of the system, a case study of an office building project in Michigan is discussed. This article is organized as follows:
Section 2 describes the key elements of the framework including the information flow and the formulation of the modified harmony search optimization algorithm.
Section 3 addresses the case study of a building in Michigan, describing the data sources used and the implementation of the framework.
Section 4 presents preliminary results of the case study. Finally,
Section 5 highlights the limitations of the developed system and concludes the paper.
2. Decision Support System for Material Selection
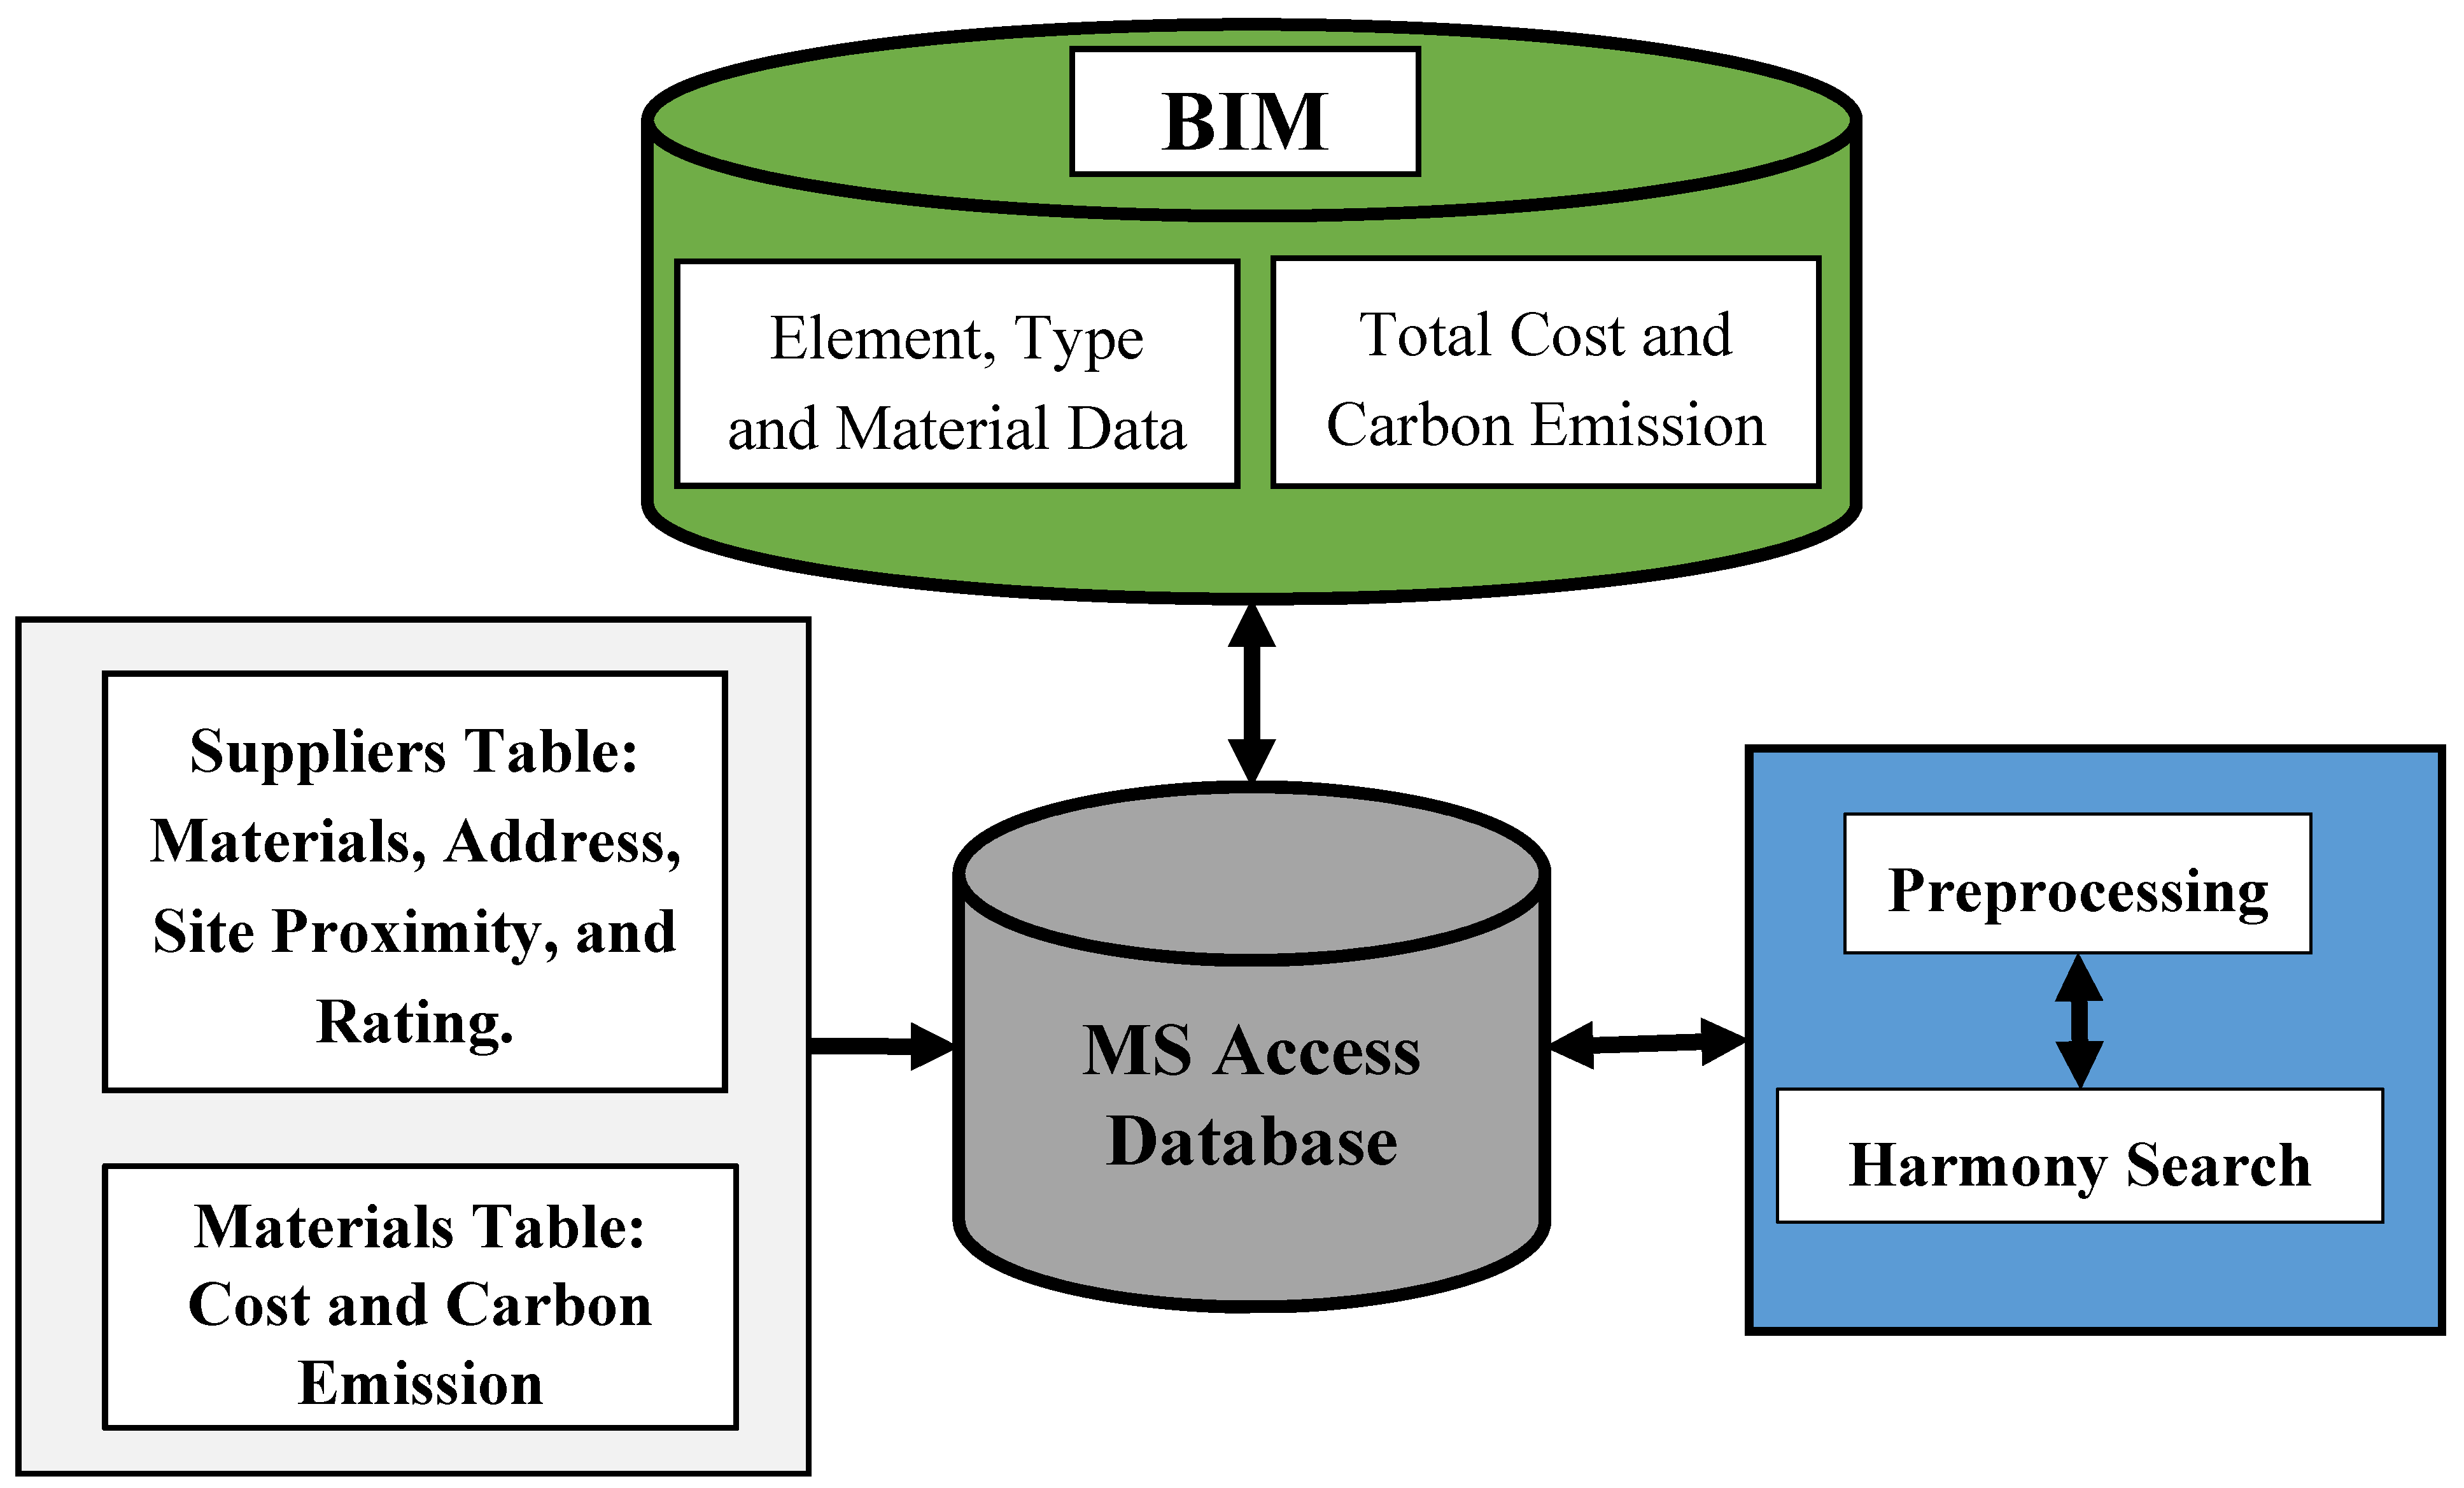
This section presents the architecture of the decision support system for material selection. The system architecture (
Figure 1) consists of an integration of BIM, Microsoft database and a modified harmony search algorithm.
Figure 1.
System architecture for material selection.
Figure 1.
System architecture for material selection.
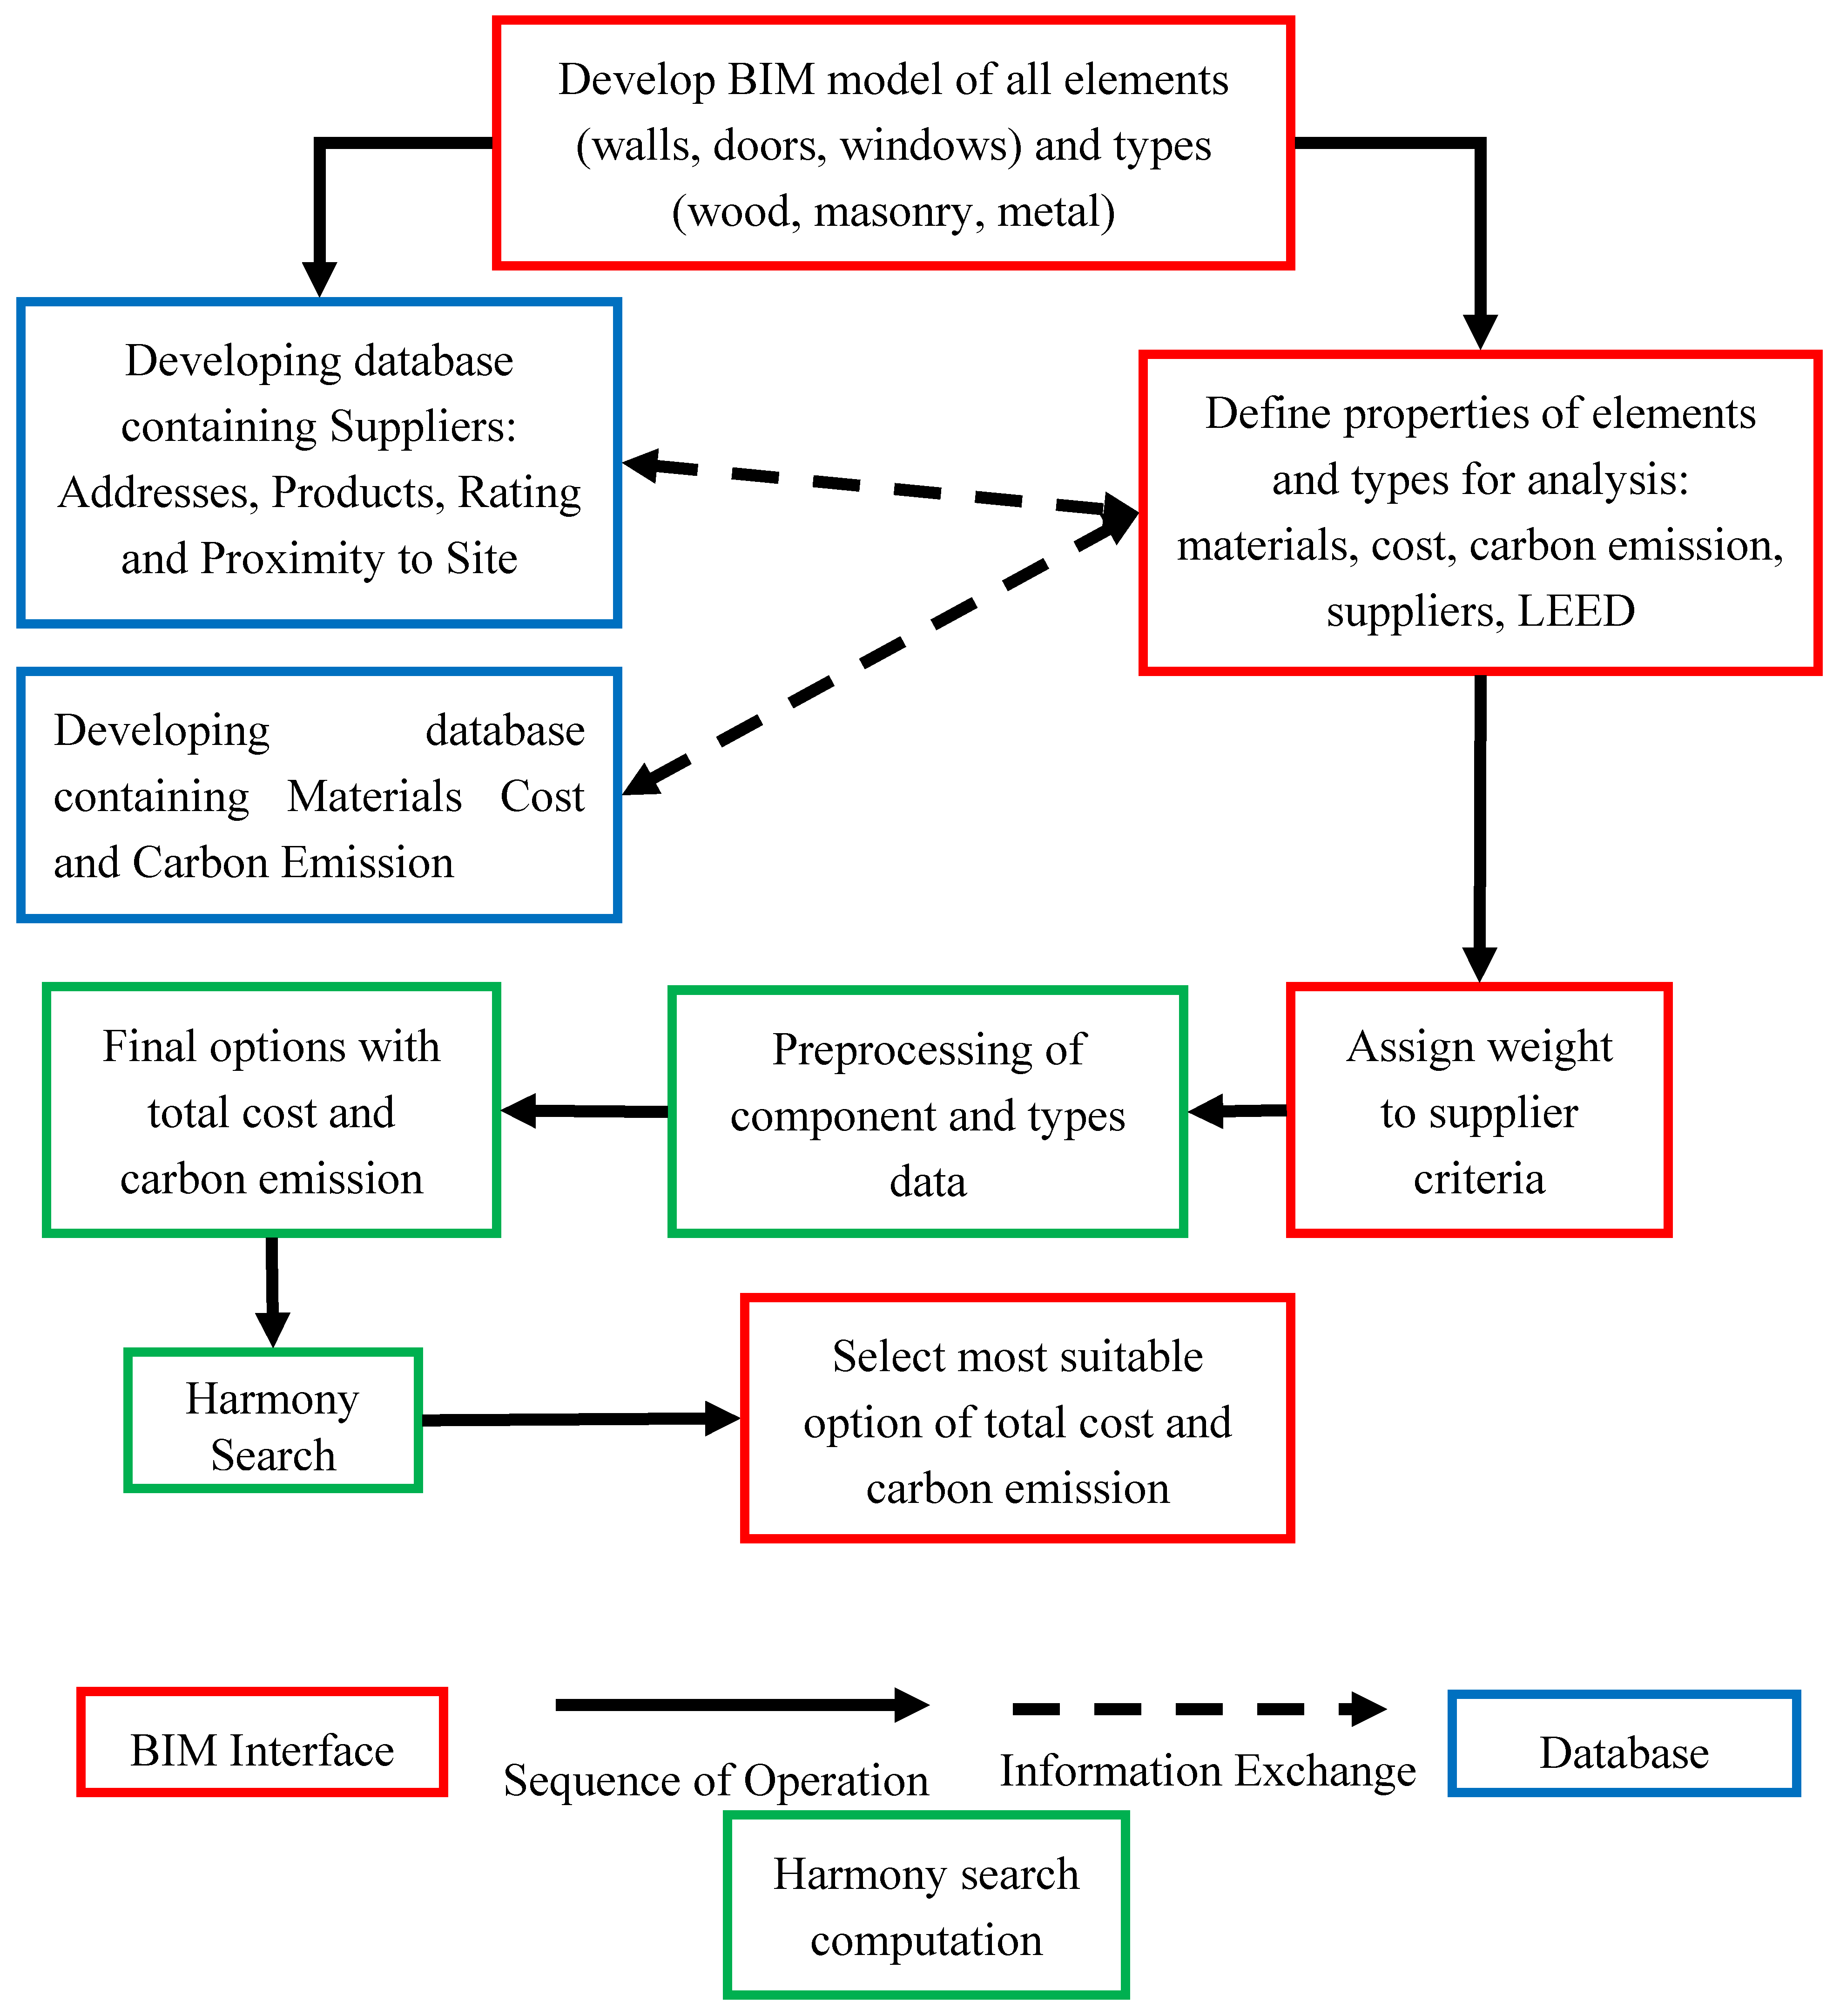
The overview of the information flow among the various applications in the proposed framework is shown in
Figure 2. The steps of the model and role of the applications are explained below:
Figure 2.
Information flow in decision support system.
Figure 2.
Information flow in decision support system.
2.1. Step 1: BIM Module: Definition of Building Elements and Properties
The building elements are defined at this stage and the type of each element is determined based on the materials. Other properties defined at this stage include the alternatives of each material, the elements to be included in the simulation and the elements to be considered for LEED analysis. Any BIM tool can enable definition of element and material within design models. In Autodesk Revit architecture, when building elements are defined, materials can also be defined as part of the element properties. However, since the designer may be interested in understanding the total cost and carbon emission of multiple materials, the material alternatives can be embedded in the element properties as separate parameters; this is illustrated in the case study.
Another element property to be defined is LEED. The use of local and recycled building materials has been argued to offer the advantage of reducing carbon emissions, producing healthier buildings, in addition to strengthening the local economy [
26]. Two credits (
Table 1) in the “Material and Resources” category of the LEED rating system are considered in this study. One of the credits related to this stage is the “Credit 5: the regional materials.” The credit is implemented for each material option by checking the LEED property (within BIM) for the suppliers in 500 miles range around the project’s location.
Table 1.
Leadership in energy and environmental design (LEED) credits considered in this research.
Table 1.
Leadership in energy and environmental design (LEED) credits considered in this research.
| Credit | Number of Points | Intent | Requirements |
|---|
| Credit 4: recycled content | 1 point | To increase demand for building products that incorporate recycled content materials, thereby reducing impacts resulting from extraction and processing of virgin materials | Minimum percentage materials recycled for each point threshold = 10% of the total value based on cost |
| 2 points | Minimum percentage materials recycled for each point threshold = 20% of the total value based on cost |
| Credit 5: regional materials | 1 point | To increase demand for building materials and products that are extracted and manufactured within the region, thereby supporting the use of indigenous resources and reducing the environmental impacts resulting from transportation | Minimum percentage regional materials for each point threshold = 10% of the total value based on cost |
| 2 points | Minimum percentage regional materials for each point threshold = 20% of the total value based on cost |
2.2. Step 2: BIM-Microsoft Access Database
As shown in
Figure 1 and
Figure 2, the list of materials and their cost, carbon emissions and the supplier information are contained in two separate tables within a Microsoft access database. Contractors typically keep records of supplier information such as addresses, materials they supply and performance ratings. Alongside this information, the supplier information table will also contain the proximity of each supplier to the construction site. The proximity is obtained by computing the driving distance between each supplier’s address and the construction site using web location mapping systems such as Google Maps. The second table contains a list of building materials, their cost and carbon emission. The later can be obtained from published inventories such as the inventory of carbon and energy [
18]. The contents of the database and the inputs defined in stage 1 will be the inputs to the harmony search optimization. It is important to filter and arrange these inputs in such a way that the harmony search algorithm can utilize it. This can be done using plugins. Most BIM software have software development kits that enable developers integrate BIM tools with external applications. Plugins can be developed to extract the inputs defined in stage 1 and the database. Some commercial plugins such as 1st Pricing integrate BIM tools with online resources. The plugin provides quotes of windows and doors from online resources. In relation to this research, a plugin was developed within BIM that enables extraction of supplier data from the supplier database. If a material is to be considered in the analysis, it is checked within the properties.
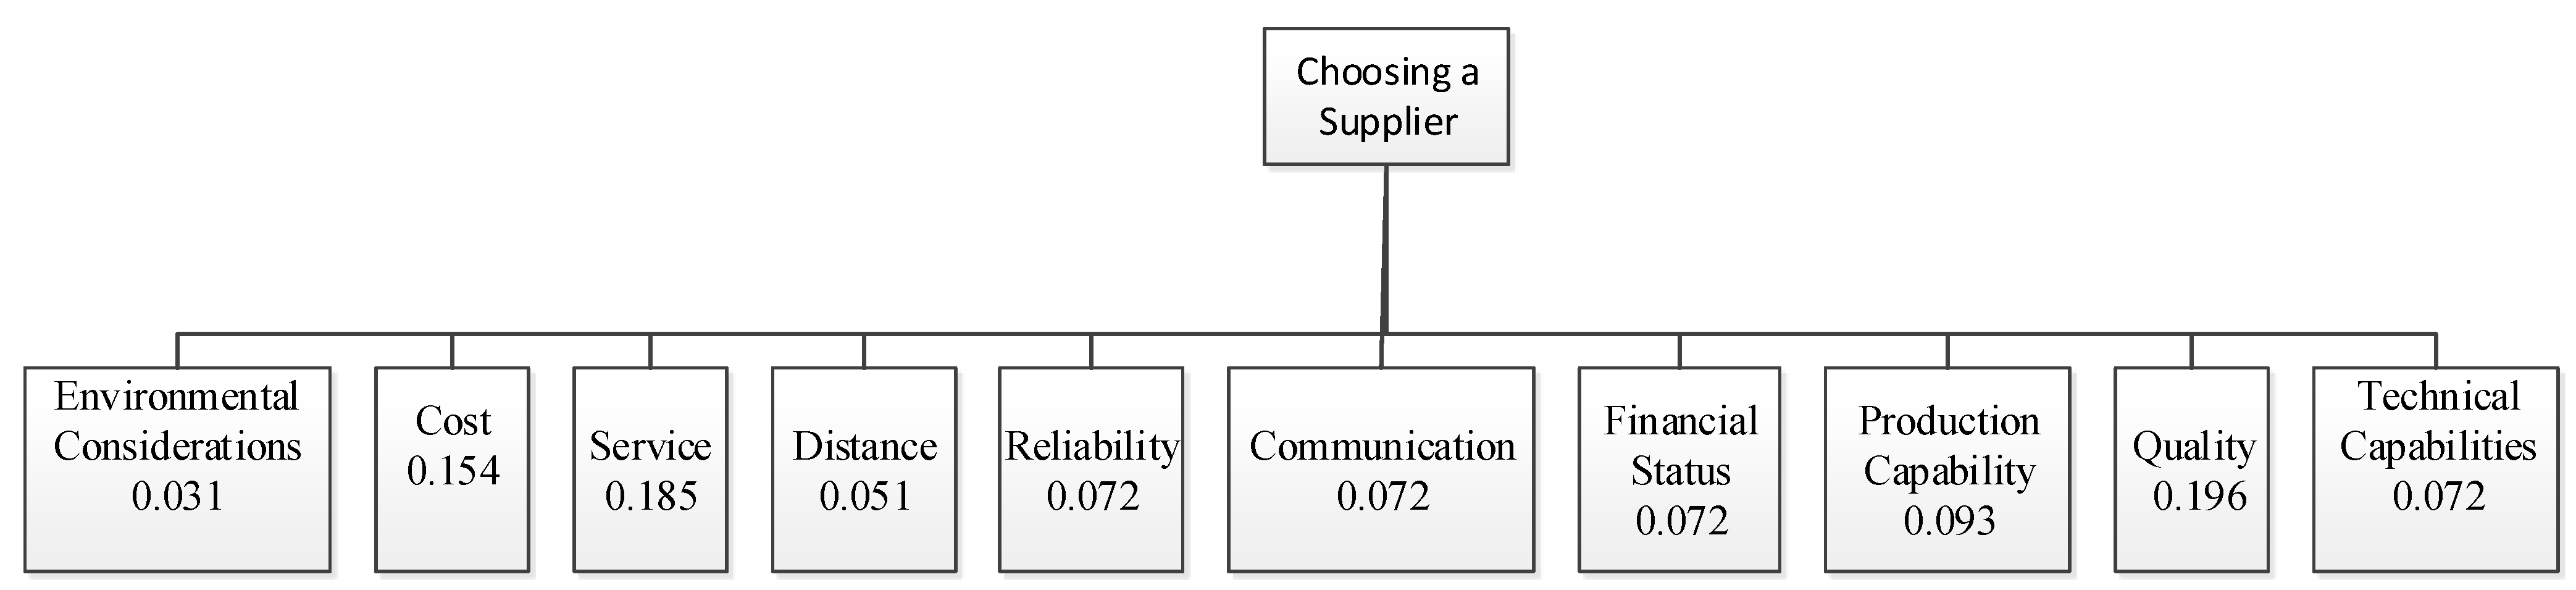
In order to determine the most suitable supplier (from the supplier table) of each material alternative, it is important to evaluate and rate the suppliers. To do this, a set of criterions were established to compare the suppliers. A review of 36 articles on supplier selection criteria from 1996 to 2014 was conducted to determine the most influential supplier criterions. The result of the review is represented in
Figure 3. The figure shows that the most popular criterion is quality, followed by service and cost, while distance and environmental considerations have the lowest percentages. This shows the need to change the typical construction practices that rely on cost as a dominated factor for selection of materials and suppliers. These four criterion are selected to be considered in the analysis. Designers can rate suppliers according to their degree of satisfaction with these criterions: cost, distance, quality and environmental considerations. Cost refers to the piece-part prices of the type/material of a component as determined by the supplier; distance refers to the distance between the supplier and the jobsite. This affects freight charges, in addition to contributing to the overall carbon emissions of a project. Quality relates to the quality control tool used, defect rates, quality certifications and quality control inspection methods of the supplier. Environmental considerations: This criteria determines whether the materials offered by the supplier contains recycled or reused content, or whether the supplier has any other environmental certificates for his materials [
27]. This is the second LEED credit (as shown in
Table 1) utilized in this framework (Credit 4: Recycled content).
Figure 3.
Supplier selection criterion.
Figure 3.
Supplier selection criterion.
Likert scale was used as the rating system. Likert scale is based on a 1–5 scale, where 1 means “not preferred”, and 5 means “mostly preferred” (
Table 2). This rating system has previously been adopted by other authors [
28,
29]. For each supplier, each criterion is assigned a rate in the range of 1 and 5 based on the designer’s degree of satisfaction. Furthermore, depending on the designer’s needs, the final score of a supplier is determined by assigning each criterion a weight between 0 and 1.
The plugin extracts element properties from BIM, and the material and supply information from the database for use in the harmony search optimization. The plugin also extracts the supplier information from the database and displays this on the Revit interface so that the designer can assign suppliers to each material. After assigning suppliers to each material, the plugin extracts these information for the next step.
Table 2.
Guideline for supplier rates [
28].
Table 2.
Guideline for supplier rates [28].
| Point | Grade | Description |
|---|
| 5 | Exceptional | Demonstrates substantially excellent performance, and has been in the excellence category for last 12 months |
| 4 | Excellence | Exceeds company’s and customer’s expectations, demonstrates extra effort and is superior to vast majority of suppliers |
| 3 | Good | Meets the company’s expectations |
| 2 | Acceptable | Meets company’s minimum requirements |
| 1 | Poor | Does not meet the company’s and customer’s minimum acceptable level |
2.3. Step 3: Harmony Search Optimization
This section presents a proposed harmony search (HS) model for material selection considering the rating of the suppliers. Harmony search algorithm is an optimization method for solving both discrete and continuous variable problems. HS algorithm is inspired by the behavior of musicians where each player searches for a better state of harmony. This is similar to jazz improvisation which seeks to find a musically pleasing harmony, as the optimization process tries to find a global solution as determined by an objective function [
30]. Furthermore, the aesthetic quality is determined by the pitch of each musician’s instrument just as the objective function is determined by the set of values assigned to each design variable. Also, the quality of the sound is improved by constant practice just as the value of the objective function is improved by an increase in the number of iterations. HS algorithm requires only few parameters and can be easily implemented. HS has been successfully applied to a variety of practical or real-world optimization on problems, thus, offering more advantages than traditional optimization techniques. These advantages includes utilizing less mathematical requirements, engaging in random or stochastic search, and generating a new solution vector after considering previous vectors. These advantages demonstrate the flexibility of the HS algorithm and potential for producing better solutions. The HS model consists of two stages: the preprocessing and harmony search stage. These are described below:
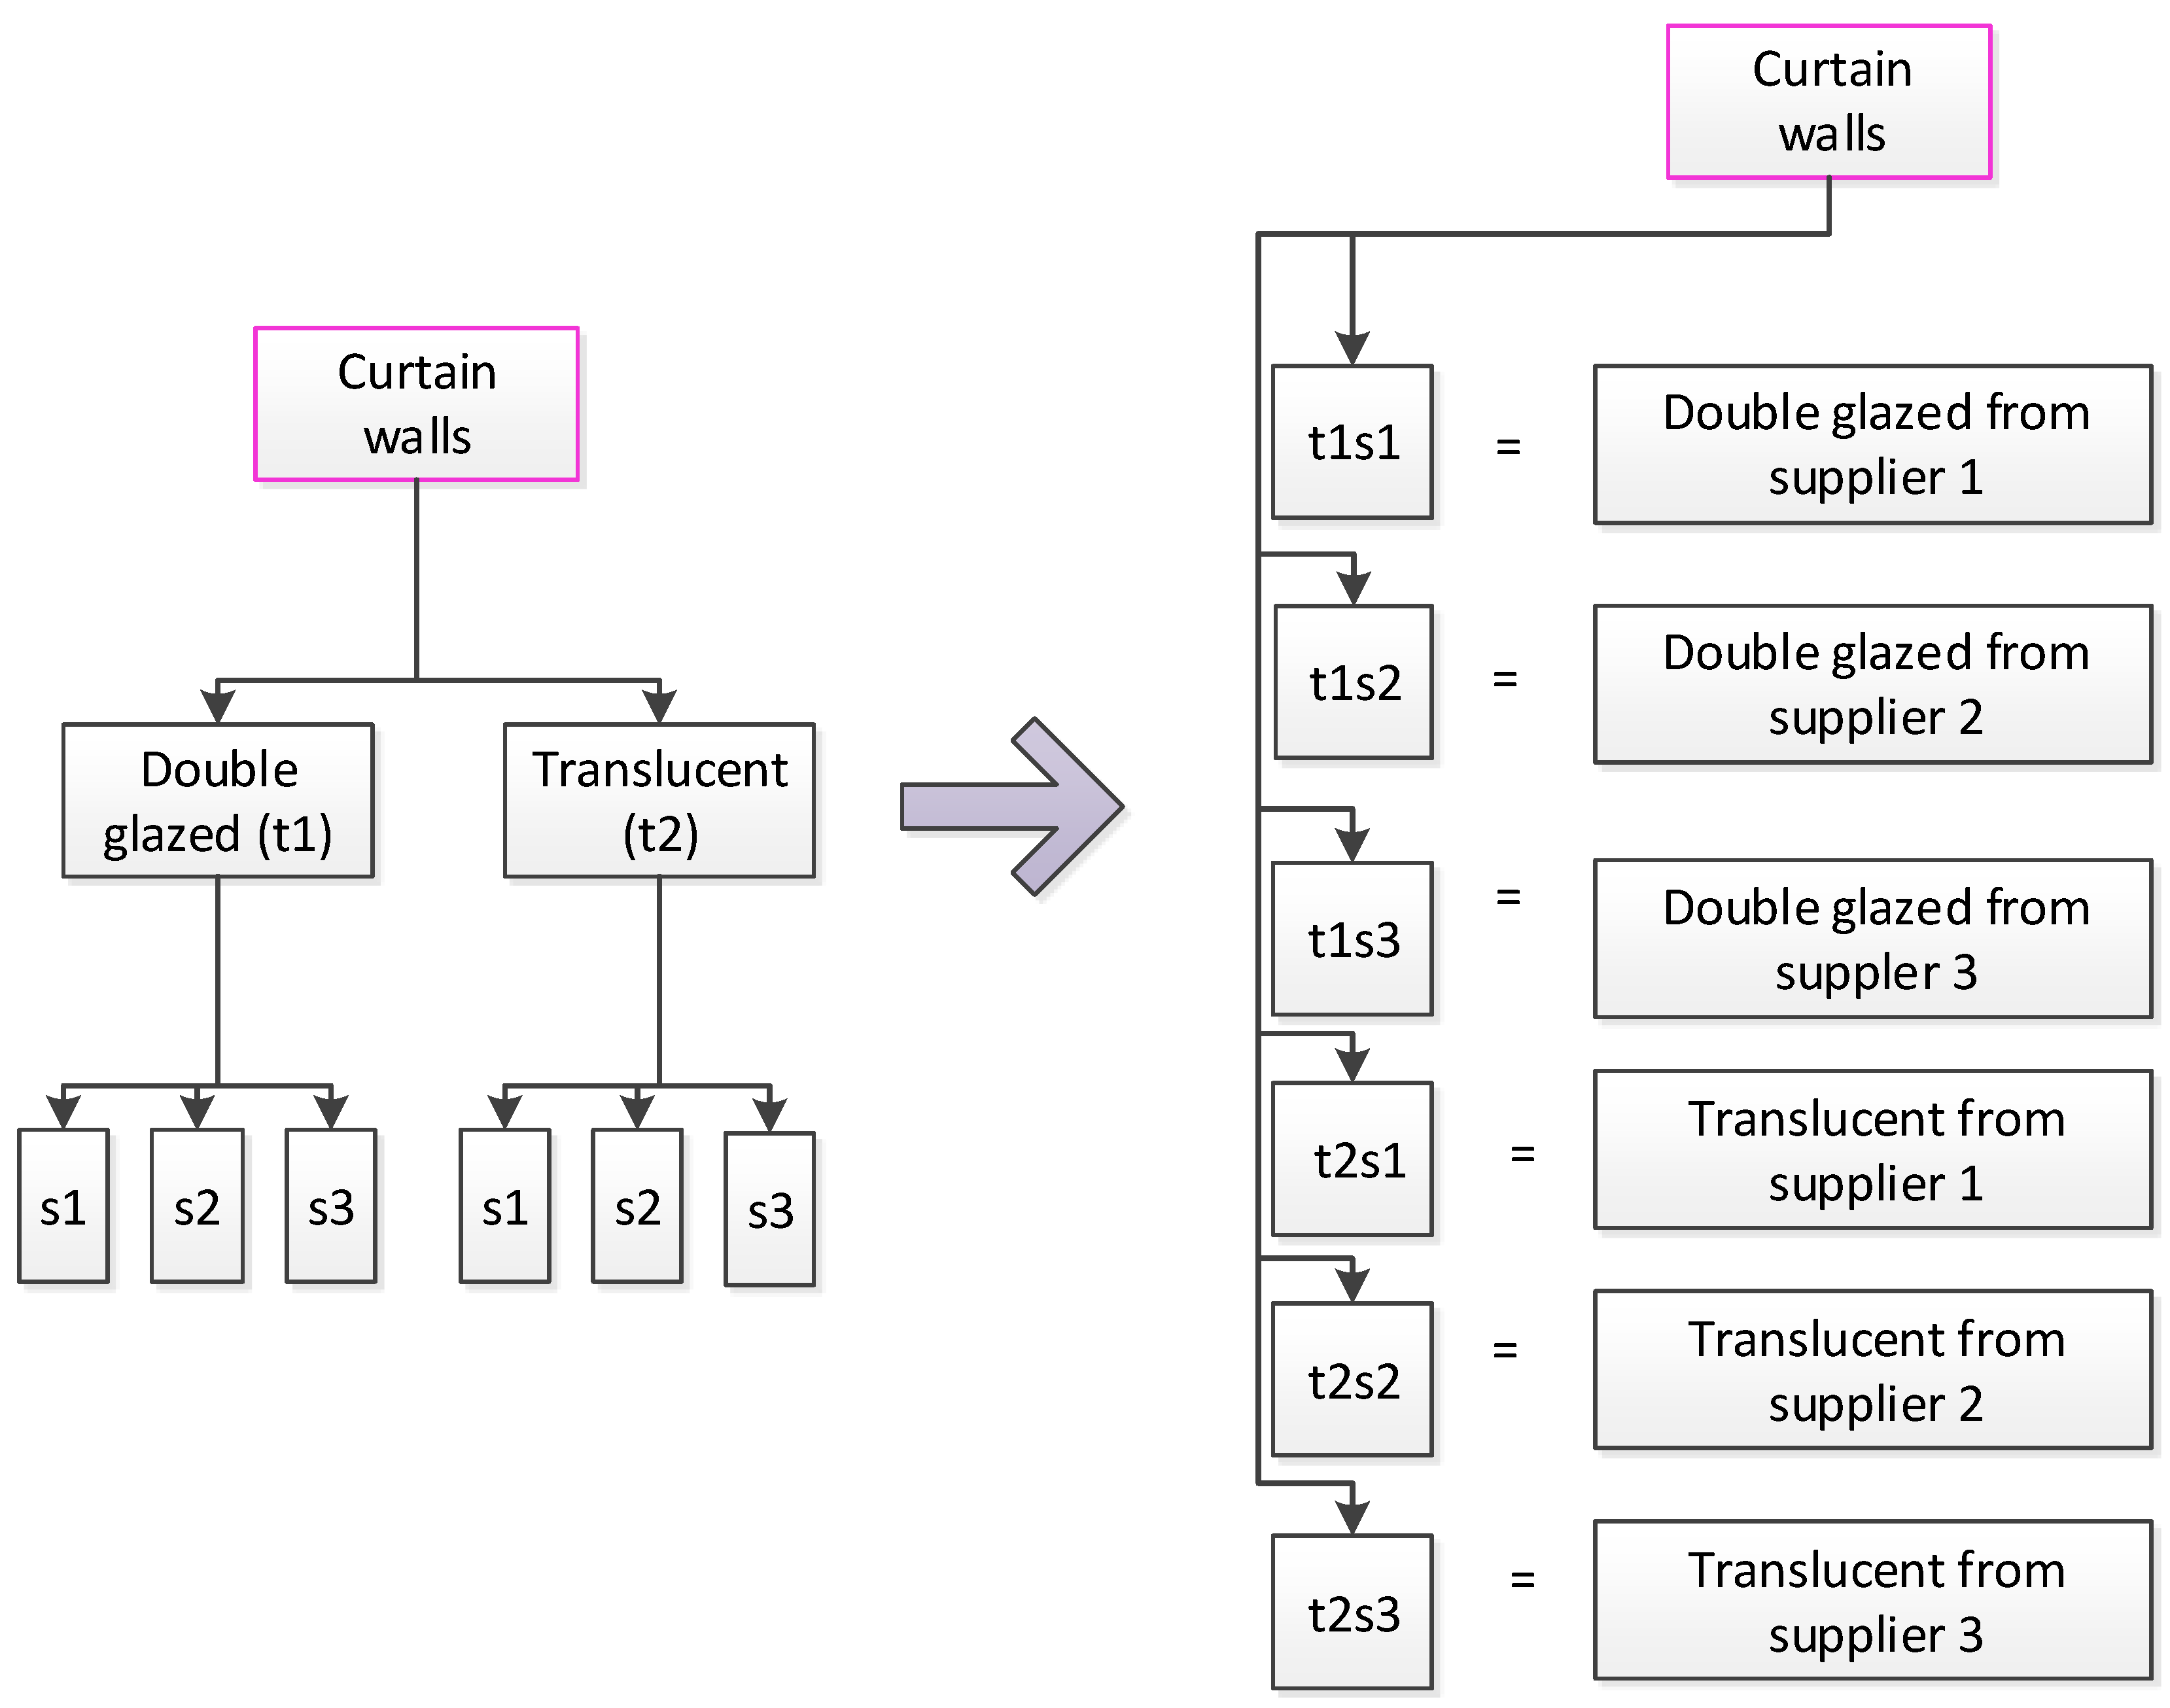
2.3.1. Preprocessing Stage
The preprocessing stage serves two purposes. First, the options of each component are organized in an acceptable way to the harmony search stage. This is done by finding the enumerated combinations between each type/material of a component and suppliers.
Figure 4 illustrates the preprocessing process using curtain walls as an example. In this example, the designer has the option of selecting from two types of curtain walls and each curtain wall can be supplied by three suppliers. Second, the preprocessing stage computes the cost and carbon emissions for each generated option in a way that incorporates the suppliers’ scores using Equations (3) and (4). The results of Equations (3) and (4) are utilized in the HS stage for optimization.
Figure 4.
Preprocessing with an example of curtain walls.
Figure 4.
Preprocessing with an example of curtain walls.
Computations of Total Cost and Carbon Emission: Materials make contributions towards cost and carbon emissions throughout the lifecycle of buildings. In computing the cost and carbon emission of buildings, the following phases need to be considered: preconstruction, construction, operations and end of life. Based on these phases, the total cost per unit of a material (TC) can be estimated as:
where,
C1,
C2,
C3, and
C4 are the unit cost of a material in the preconstruction, construction, maintenance and demolition phases respectively.
Likewise the total carbon emissions per unit of a material (TCE) can be estimated as below:
where,
E1,
E2,
E3 and
E4 are the unit carbon emissions of a material in the preconstruction, construction, maintenance and demolition phases respectively.
Computations of Modified Total Cost and Carbon Emission: To account for the effect of the supplier rating and selection, Equations (1) and (2) are modified to Equations (3) and (4). These equations can be constructed as a weighted sum of the partial cost/carbon emissions and are based on the following logics:
Dividing the initial cost by the cost criterion rate: This means that when a supplier has a good price, the score will be high. This will decrease the initial cost and in turn, reduce the total value. Thus, making this material more probable to be chosen as an optimal solution;
Dividing the transportation cost by the distance criterion rate: The transportation cost is directly related to the distance of supplier from the jobsite. In the same way, if the supplier is close, he will get a higher rate, which will decrease the transportation cost and make the material more probable to be chosen as an optimal solution;
Dividing the total cost by the quality criterion rate: The quality of a material affects the cost. If a material has a good quality, it will probably have a higher cost;
Dividing the initial carbon emissions by the environmental considerations criterion rate: There is a difference in initial carbon emissions between the virgin and recycled/reused materials. As such, if the supplier provides products with recycled/reused materials, he will get a high score and that will reduce the initial carbon emissions. Hence, this material will probably be selected as an optimal solution.
Equations (3) and (4) represent components with only one material. Where Ci is the initial cost of the material, Co = C2 + C3 + C4 and (Ct*distance) is the transportation cost. wc, wd, wq and we are the weights assigned to the cost, distance, quality and environmental consideration criteria respectively. scc, scd, scq and sce are the scores given to a supplier for the cost, distance, quality and environmental consideration criteria respectively. Ei is the initial carbon emissions of a material, Eo= E2 + E3 + E4 and (Et*distance) is the carbon emission from transportation of a material.
In the case of components such as metal studs which consist of multiple materials, Equations (3) and (4) becomes Equations (5) and (6):
where
m is the number of materials constituting a type of component.
2.3.2. Harmony Search Stage
The harmony search stage is briefly illustrated in the pseudo-code shown in
Table 3. The objective function of the search process is to minimize the lifecycle cost and carbon emission of a building as shown in Equations (7) and (8), respectively. This objective function is evaluated by simulating random values which are initially assigned to the design variables. Depending on the results of the simulation, the design variables are re-assigned new values and another simulation is performed to evaluate the objectives of the new design. These new values are either selected randomly or obtained from the best values, stored in the harmony memory. If the new solution is better than the worst solution (available in the harmony memory), the worst solution is replaced by the new solution. As the optimization process proceeds, the solutions in harmony memory becomes better and gradually approaches the optimum solution. The process continues until the predefined maximum number of iterations is reached.
where,
n = number of variables,
and
are the total cost and carbon emissions of the chosen alternative of a specific variable respectively.
Table 3.
Pseudo-code of the harmony search (HS) algorithm.
Table 3.
Pseudo-code of the harmony search (HS) algorithm.
| Step Harmony Search |
| Initiate_parameters() |
| Initialize_HM() |
| do{ |
| for (I = 1 to number of decision variables N) |
| if (rand() < PHMCR)/* (memory consideration) */ |
| X[I] will be randomly chosen from the HM |
| If (rand()< PPAR)/* (adjust pitch) */ |
| X[I] = X[I] ± Δ |
| end if |
| else/* (select randomly) */ |
| X[I] = XLB[I] + rand() * (XUB[I] − XLB[I]) |
| end if |
| end for |
| /* evaluate the fitness of each vector */ |
| fitness_X = evaluate_fitness(X) |
| update_memory (X , fitness_X)/ * update HM if applicable */ |
| }while(not_termination) |
| print_solution() |
| End Step |
2.4. Step 4: BIM Module: Selecting Most Suitable Option
The objective of this BIM module is to present to the designer, different designs options and the values of their cost and carbon emissions. Each design will have different combinations of materials. The designer can visualize the different options of total cost and carbon emissions. The selected option is typically the preferred design. However, in order to enable the designer understand the effect of different contributing weights on the supplier criteria, five scenarios were developed. Each scenario represents different weight criterions assigned to each of the supplier selection criteria. The details of the scenarios are shown in
Table 4. In this stage, the designer can vary the weights assigned to each criterion depending on the objectives of the design. For example, from scenario 1, the designer can assign equal weights (
i.e., 0.25) to each criterion or from scenario 2, he can assign 0.7 to cost and 0.1 to the other criteria. After the harmony search optimization, the designer can select from multiple options of total cost and carbon emissions.
Table 4.
Weights assigned to each criterion.
Table 4.
Weights assigned to each criterion.
| Scenarios | Weights |
|---|
| 1 | Equal weights of 0.25 |
| 2 | Cost is assigned a higher weight of 0.7, other criterions were given a weight of 0.1 |
| 3 | Quality was given a higher weight of 0.7, other criterions were given a weight of 0.1 |
| 4 | Environmental Considerations was given a higher weight of 0.7, other criterions were given a weight of 0.1 |
| 5 | Distance was given a higher weight of 0.7, other criterions were given a weight of 0.1 |
3. Case Study
An office building design in Kalamazoo, Michigan is used as a case study. The building ,which has a total floor area of 34,132 m2, consists of exterior masonry walls, double glazed curtain walls, precast plank with a concrete topping floor, double glazed curtain walls, exterior doors, hard board wood interior doors, fixed wood framed windows and metal stud-plaster board interior walls. The building was modeled using Autodesk Revit Architecture 2014. Any other BIM tool that allows parametric modeling can also be used. A Microsoft access database was developed. The database consists of two tables: One contains a list of building materials, their cost and carbon emission; the other table contains a list of suppliers, their addresses, materials they supply and their proximity to site. A plugin interface was developed to enable interaction between the building components, the database and a harmony search optimization algorithm. Autodesk Revit has a .NET framework application programming interface (API) that enables the development of plugins using programming languages such as C#, VB.NET and F#. The plugin was developed in C#.
After developing the BIM model, the designer selects elements to be included in the analysis by checking the “Analysis” property of the elements. The following elements were considered in this analysis: walls, doors, floors, windows, plumbing pipes and heating, ventilation and air conditioning (HVAC) ducts.
Table 5 shows the list of elements, their types and associated materials. As part of the properties, alternative materials are assigned to each element (
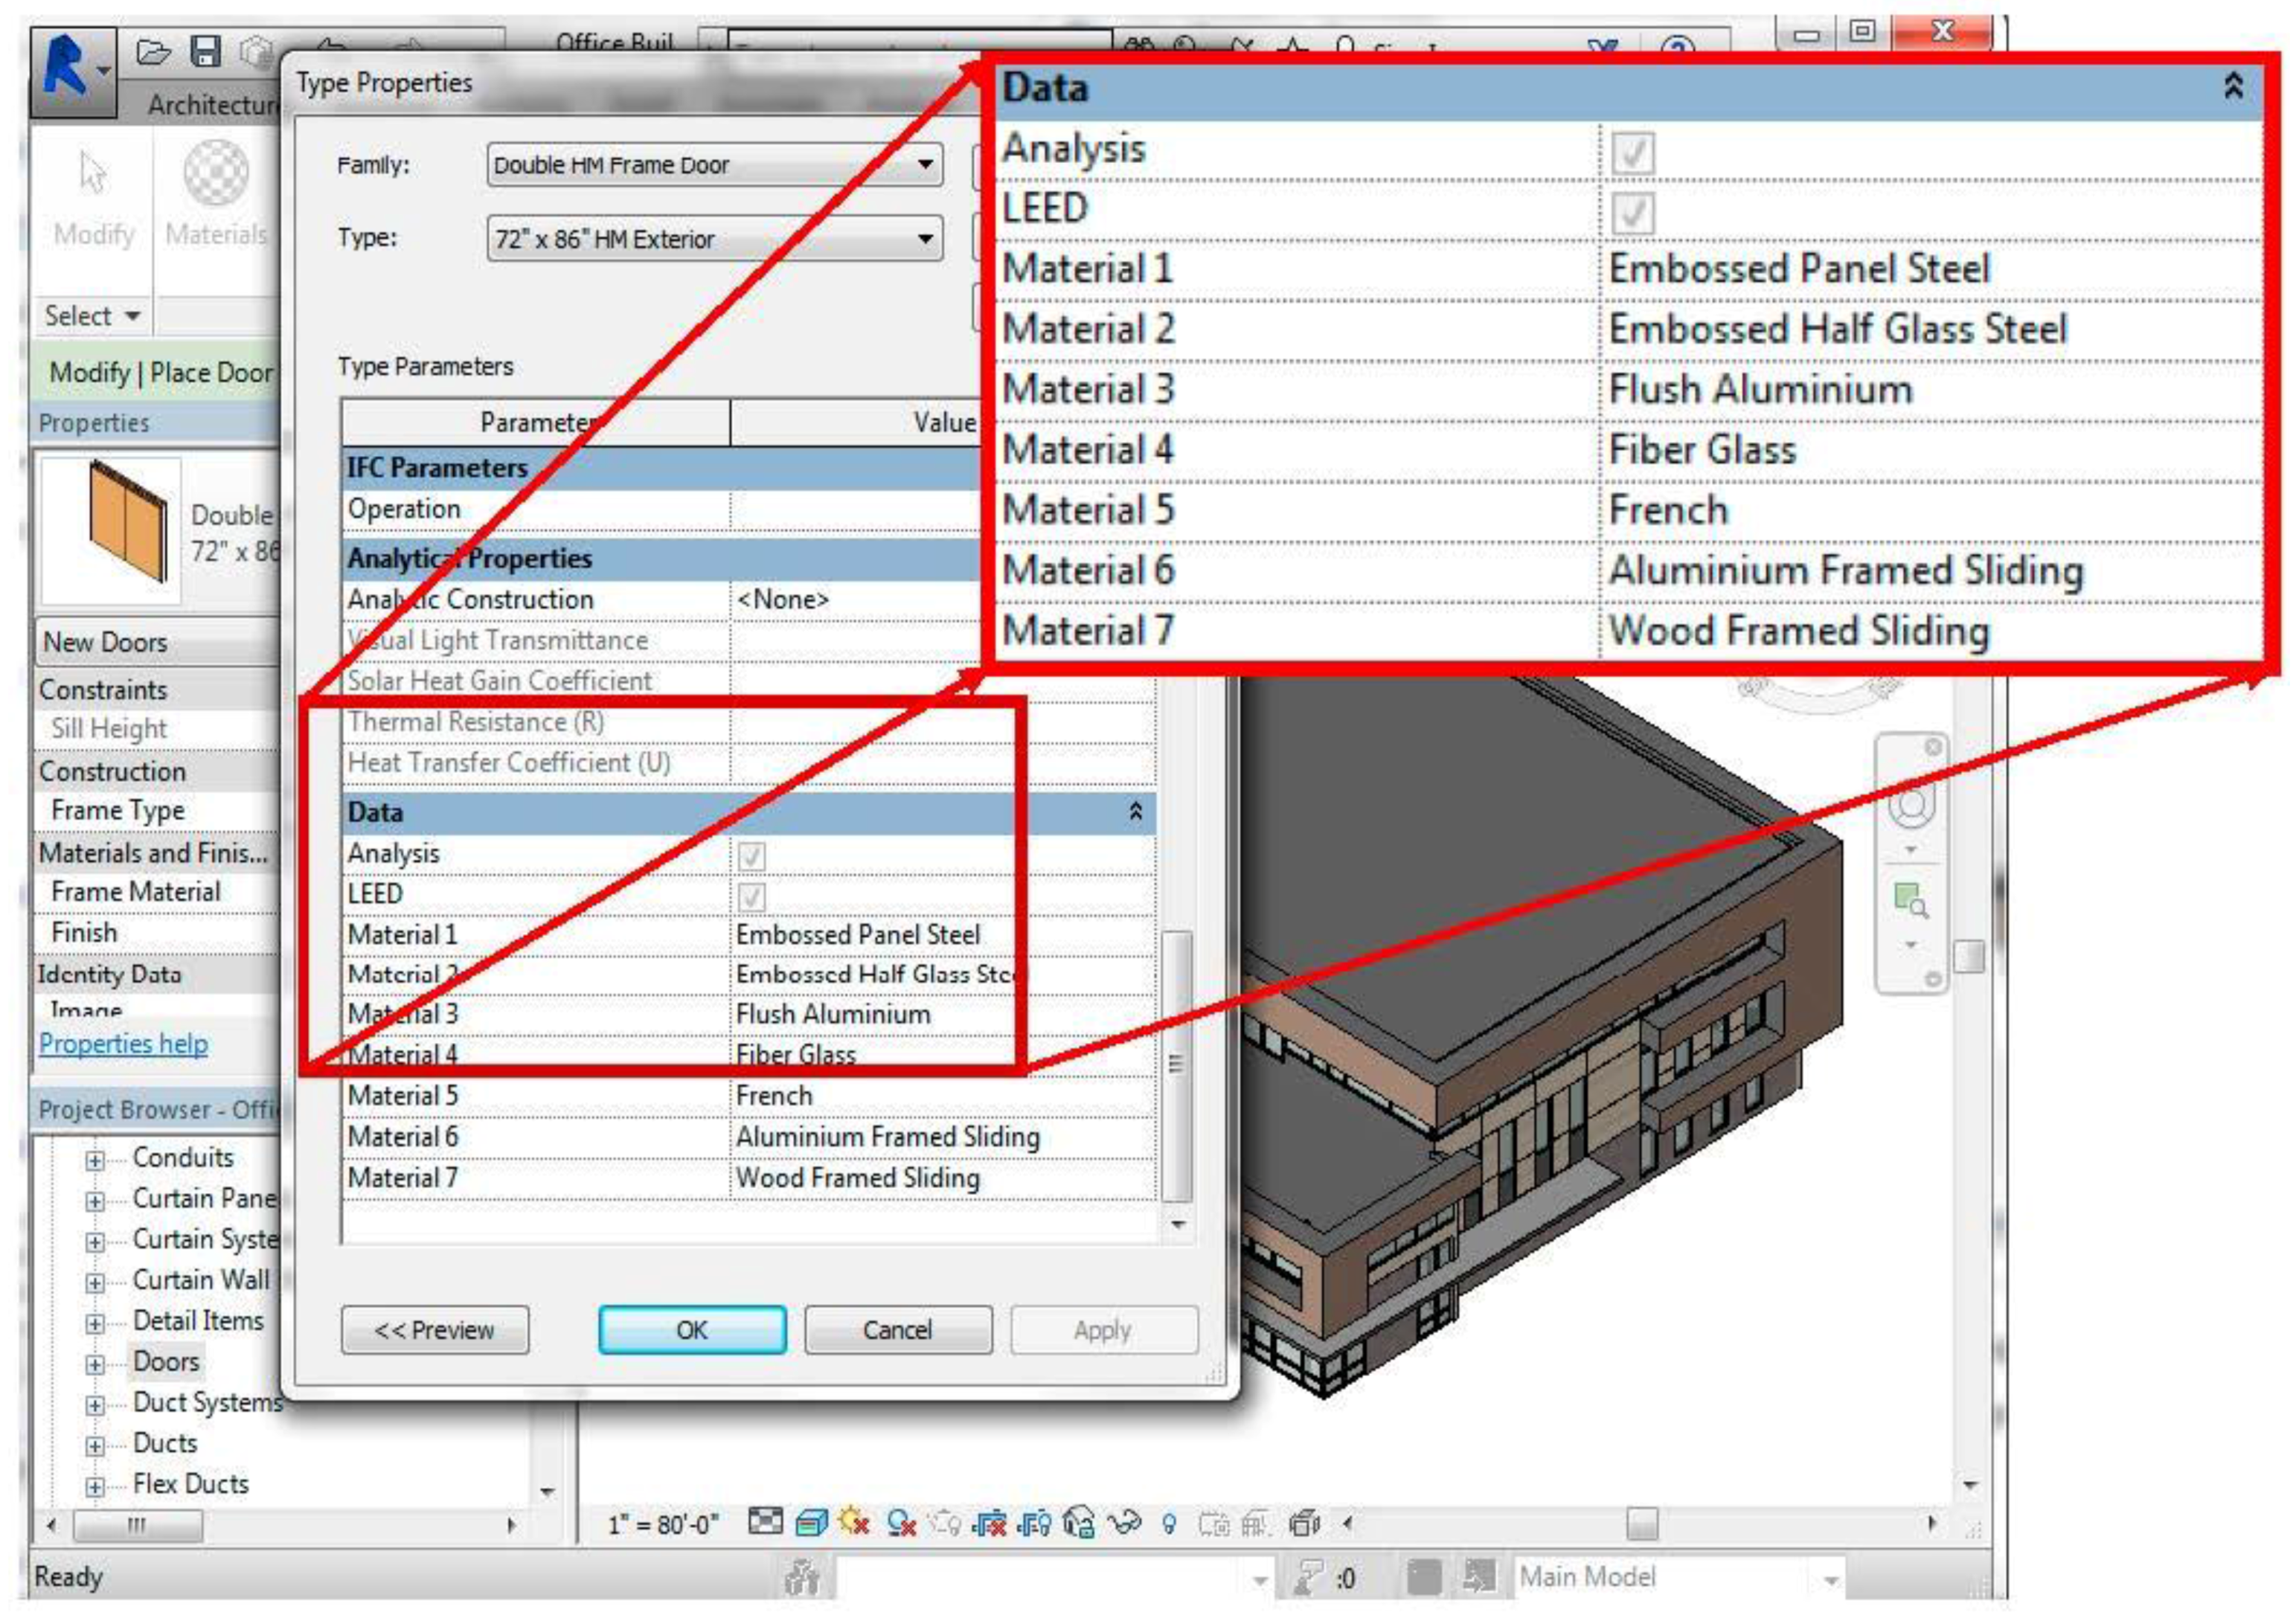
Table 5) in the BIM model. If the project is to be considered for LEED certification, the “LEED” property of each element is also checked.
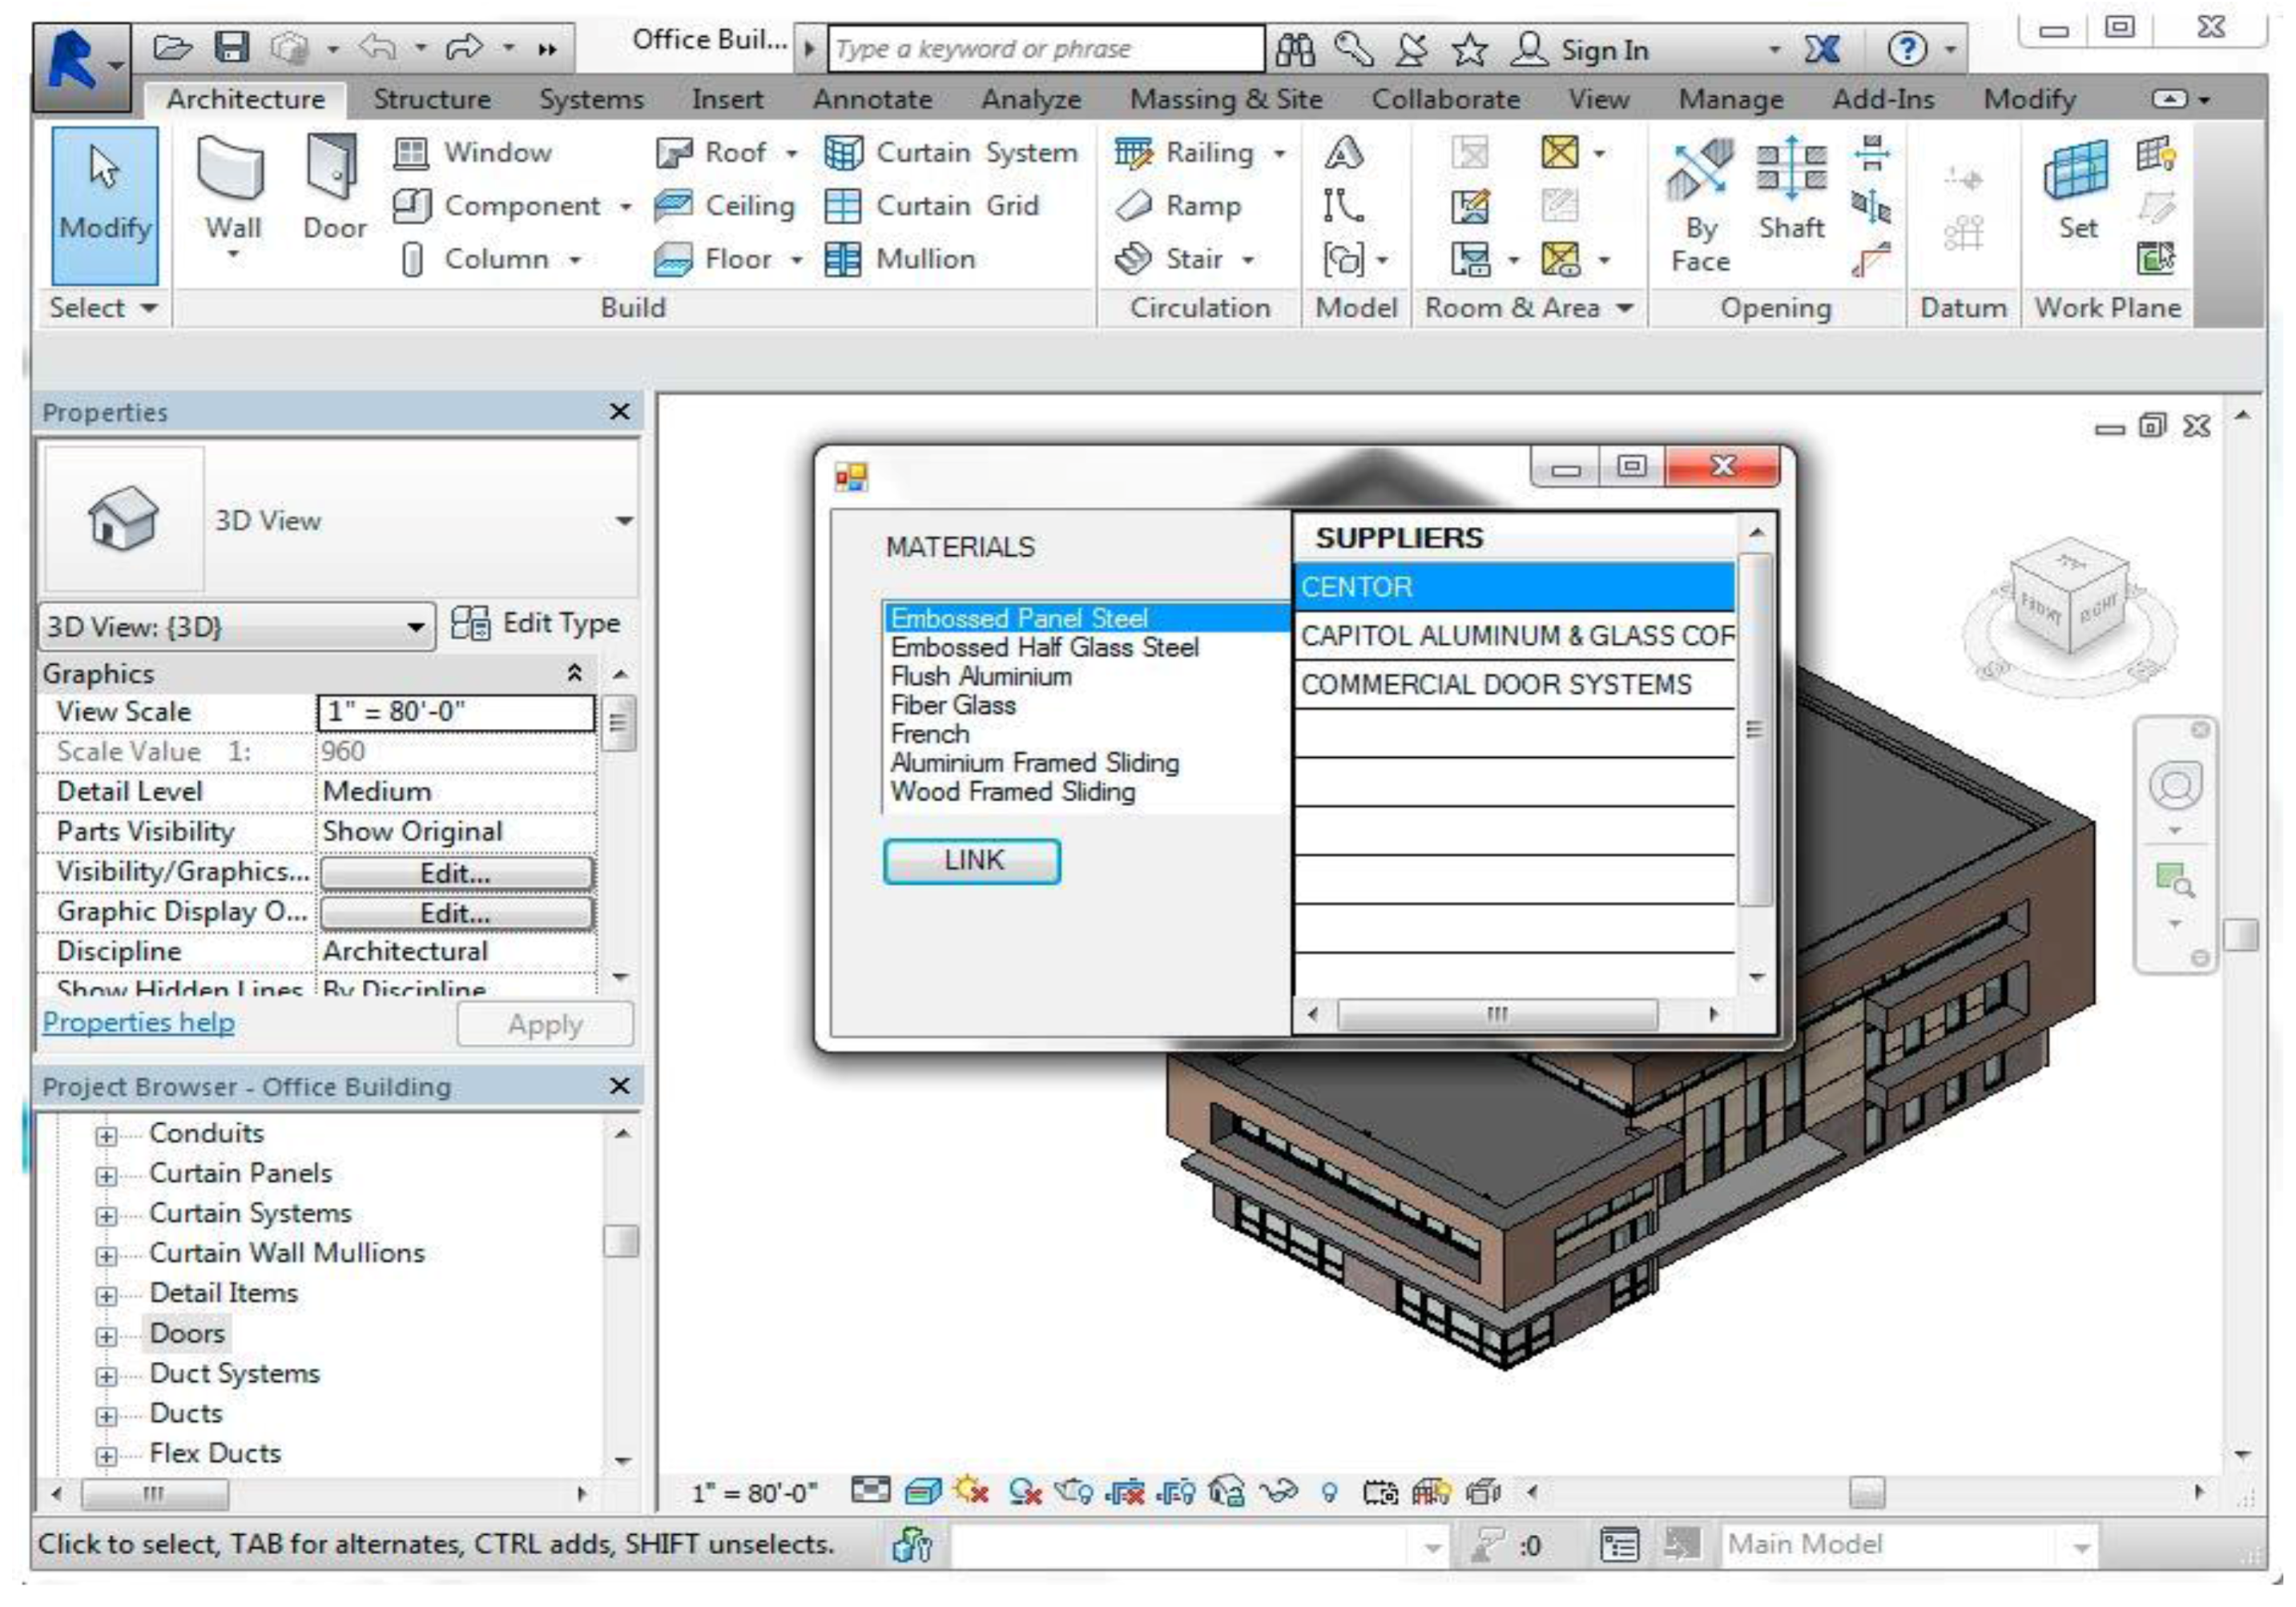
Figure 5 shows the model interface and properties of a door element. The developed plugin is then loaded from the “add-in” menu of the BIM model. On loading the plugin, the designer selects any model element (
Table 5) under the project elements and a list of associated materials (from the properties) are populated in a “listbox” on the model interface as shown in
Figure 6. On selecting any of the materials, the corresponding suppliers (from the database) are also populated on the model interface. The designer can select the potential suppliers of the materials. As each element, material and suppliers are selected from the model, the plugin will upload this information in a new table (in the database) alongside the cost and carbon emission data of the materials.
On selecting the suppliers, it is important to rate them according to their performance in respect to a set of criteria defined in
Section 2. The scores were assigned randomly, since this information cannot be obtained from the supplier’s website. Suppliers whose products consider LEED were assigned the highest score of 5 for environmental considerations, while suppliers whose products have any other environmental certificates were assigned a lower score of 4. However, suppliers whose products have no environmental certificate were assigned the lowest score of 1. Suppliers whose location was closer to the project site were assigned a high distance score of 5 and vice versa.
Table 5.
List of Components, Types and Materials.
Table 5.
List of Components, Types and Materials.
| Components | Types | Materials |
|---|
| X1 = Exterior walls | Wood stud 1 | Wood stud + plywood sheathing + alum. Veneer |
| Wood stud 2 | Wood stud + plywood sheathing + steel veneer |
| Wood stud 3 | Wood stud+ plywood sheathing + brick veneer |
| Wood stud 4 | Wood stud + plywood sheathing +stone veneer |
| Masonry 1 | Brick blocks + plywood sheathing+ alum. Veneer |
| Masonry 2 | Brick blocks + plywood sheathing+ steel veneer |
| Masonry 3 | Brick blocks + plywood sheathing+ brick veneer |
| Masonry 4 | Brick blocks + plywood sheathing+ stone veneer |
| Masonry 5 | CMU blocks + plywood sheathing+ alum. Veneer |
| Masonry 6 | CMU blocks + plywood sheathing+ steel veneer |
| Masonry 7 | CMU blocks + plywood sheathing+ brick veneer |
| Masonry 8 | CMU blocks + plywood sheathing+ stone veneer |
| Metal stud 1 | Metal stud + plywood + alum. Veneer |
| Metal stud 2 | Metal stud + plywood + steel veneer |
| Metal stud 3 | Metal stud + plywood + brick veneer |
| Metal stud 4 | Metal stud + plywood + stone veneer |
| Precast panels |
| Cast in place 1 | Concrete + ply wood sheathing + alum. Veneer |
| Cast in place 2 | Concrete + ply wood sheathing + steel veneer |
| Cast in place 3 | Concrete + ply wood sheathing + brick veneer |
| Cast in place 4 | Concrete + ply wood sheathing + stone veneer |
| X2 = Interior walls | Interior 1 | 0.5 in. regular GB + wood stud |
| Interior 2 | 0.5 in. fire resistant GB + wood stud |
| Interior 3 | 0.5 in. regular GB + metal stud |
| Interior 4 | 0.5 in. fire resistant GB + metal stud |
| Interior 5 | 5/8 in. regular GB + wood stud |
| Interior 6 | 5/8 in. fire resistant GB + wood stud |
| Interior 7 | 5/8 in. regular GB +metal stud |
| Interior 8 | 0.5 in. fire resistant GB + metal stud |
| X3 = Curtain walls | Single glazed |
| Double glazed |
| Storefront |
| Translucent |
| X4 = Floor | Wood framed 1 | Wood beam+ plywood sheathing + bamboo flooring |
| Wood framed 2 | Wood beam+ plywood sheathing + brick flooring |
| Wood framed 3 | Wood beam+ plywood sheathing + stone flooring |
| Wood framed 4 | Wood beam+ plywood sheathing + parquet flooring |
| Wood truss 1 | Wood truss + plywood sheathing + bamboo flooring |
| Wood truss 2 | Wood truss + plywood sheathing + brick flooring |
| Wood truss 3 | Wood truss + plywood sheathing + stone flooring |
| Wood truss 4 | Wood truss + plywood sheathing + parquet flooring |
| Metal truss | Metal Truss + metal Deck + concrete Topping |
| Concrete deck | Concrete deck + plywood sheathing + bamboo flooring |
| Concrete deck | Concrete deck + plywood sheathing + brick flooring |
| Concrete deck | Concrete deck + plywood sheathing + stone flooring |
| Concrete deck | Concrete deck + plywood sheathing + parquet flooring |
| Precast plank | Precast Plank + concrete Topping |
| Wide flange beam | Wide flange beam + metal deck + concrete topping |
| X5 = Exterior doors | Embossed panel steel |
| embossed half glass steel |
| Flush Aluminum |
| Fiber glass |
| French |
| Aluminum framed sliding |
| Wood framed sliding |
| X6 = Interior doors | Metal bi-fold |
| Wood bi-fold |
| Wood hard board hollow core |
| Wood lauan hollow core |
| X7 = Windows | Aluminum casement |
| Aluminum single hung |
| Aluminum sliding |
| Steel double hung |
| Wood awning |
| Wood casement |
| Wood double hung |
| Plastic vinyl single hung |
| Plastic vinyl double hung |
| Vinyl casement |
| Fiberglass single hung |
| X8 = Plumbing pipes | 0.5 in. brass |
| 0.5 in. plastic |
| 0.5 in. steel |
| 0.5 in. stainless steel |
| 0.5 in. copper |
| 2 in. cast iron |
| X9 = HVAC ducts | Aluminum alloy under 100 lb |
| Galvanized steel under 200 lb |
| Stainless steel under 100 lb |
| Fibrous-glass 1” thick |
Figure 5.
Model interface showing inputs assigned to a door element.
Figure 5.
Model interface showing inputs assigned to a door element.
After rating the suppliers, depending on the objective of the design, the designer assigns different weights to each criterion. The criteria and weights are shown in
Table 4. The analysis commences by executing the preprocessing stage. In this stage, the cost and carbon emission of each material are computed using Equations (5) and (6) from
Section 2. The HS optimization uses the materials cost and emission data to search for the optimal solutions. The parameters of the HS algorithm utilized in this analysis are presented in
Table 6. The objective functions are shown in Equations (1) and (2). The variables, X1–X9, represent different types of building components and their types. These are shown in
Table 5. Also, from
Table 6, X3 represents curtain walls and the different types of curtain walls are assigned numbers from 615 to 626. The pitch adjustment (PAR) and harmony memory consideration rates (HMCR) helps the algorithm search for a better solution than the worst individual in the harmony memory [
30]. The HMCR is the rate of choosing a solution from the harmony memory and this varies between 0 and 1. For HMCR values closer to 1, the algorithm tends to quickly converge and reach the optimal solution. Yang [
31] suggested values between 0.7 and 0.95. As such, a HMCR of 0.8 was adopted. The number of solutions stored in the harmony memory is defined by the HMS. Ayachi,
et al. [
32] studied the influence of different HMS, ranging from 20 to 125, on the behavior of algorithms. The study concluded that the higher the HMS, the better the value of the fitness function. A HMS value of 100 was adopted in this study. This research adopted the improved harmony search algorithm which utilizes two values of PAR,
i.e., a maximum and a minimum. The improved harmony search algorithm performs better with maximum PAR as 0.99 and minimum PAR between 0.35 and 0.45. The maximum and minimum PAR were set as 0.9 and 0.4, respectively. As for the maximum number of iterations, this was set as 10,000 to ensure that a global solution is attained. The higher the maximum number of iterations, the more accurate the harmony search result will be and this provides the assurance of attaining an optimal solution that is global rather than local.
Figure 6.
Model interface showing list of suppliers and building elements.
Figure 6.
Model interface showing list of suppliers and building elements.
Table 6.
Harmony Search Parameters.
Table 6.
Harmony Search Parameters.
| Type of Parameter | Value |
|---|
| Number of objective functions | 2 |
| Number of variables | 9 |
| Max PAR (Pitch Adjustment Rate) | 0.9 |
| Min PAR (Pitch Adjustment Rate) | 0.4 |
| Harmony Memory Consideration Rate | 0.8 |
| Harmony Memory Size (HMS) | 80 |
| Iteration number | 10,000 |
| Ranges of the Variables | X1 | 0–543 |
| X2 | 544–614 |
| X3 | 615–626 |
| X4 | 627–1,013 |
| X5 | 1,014–1,034 |
| X6 | 1,035–1,045 |
| X7 | 1,046–1,078 |
| X8 | 1,079–1,096 |
| X9 | 1,097–1,108 |
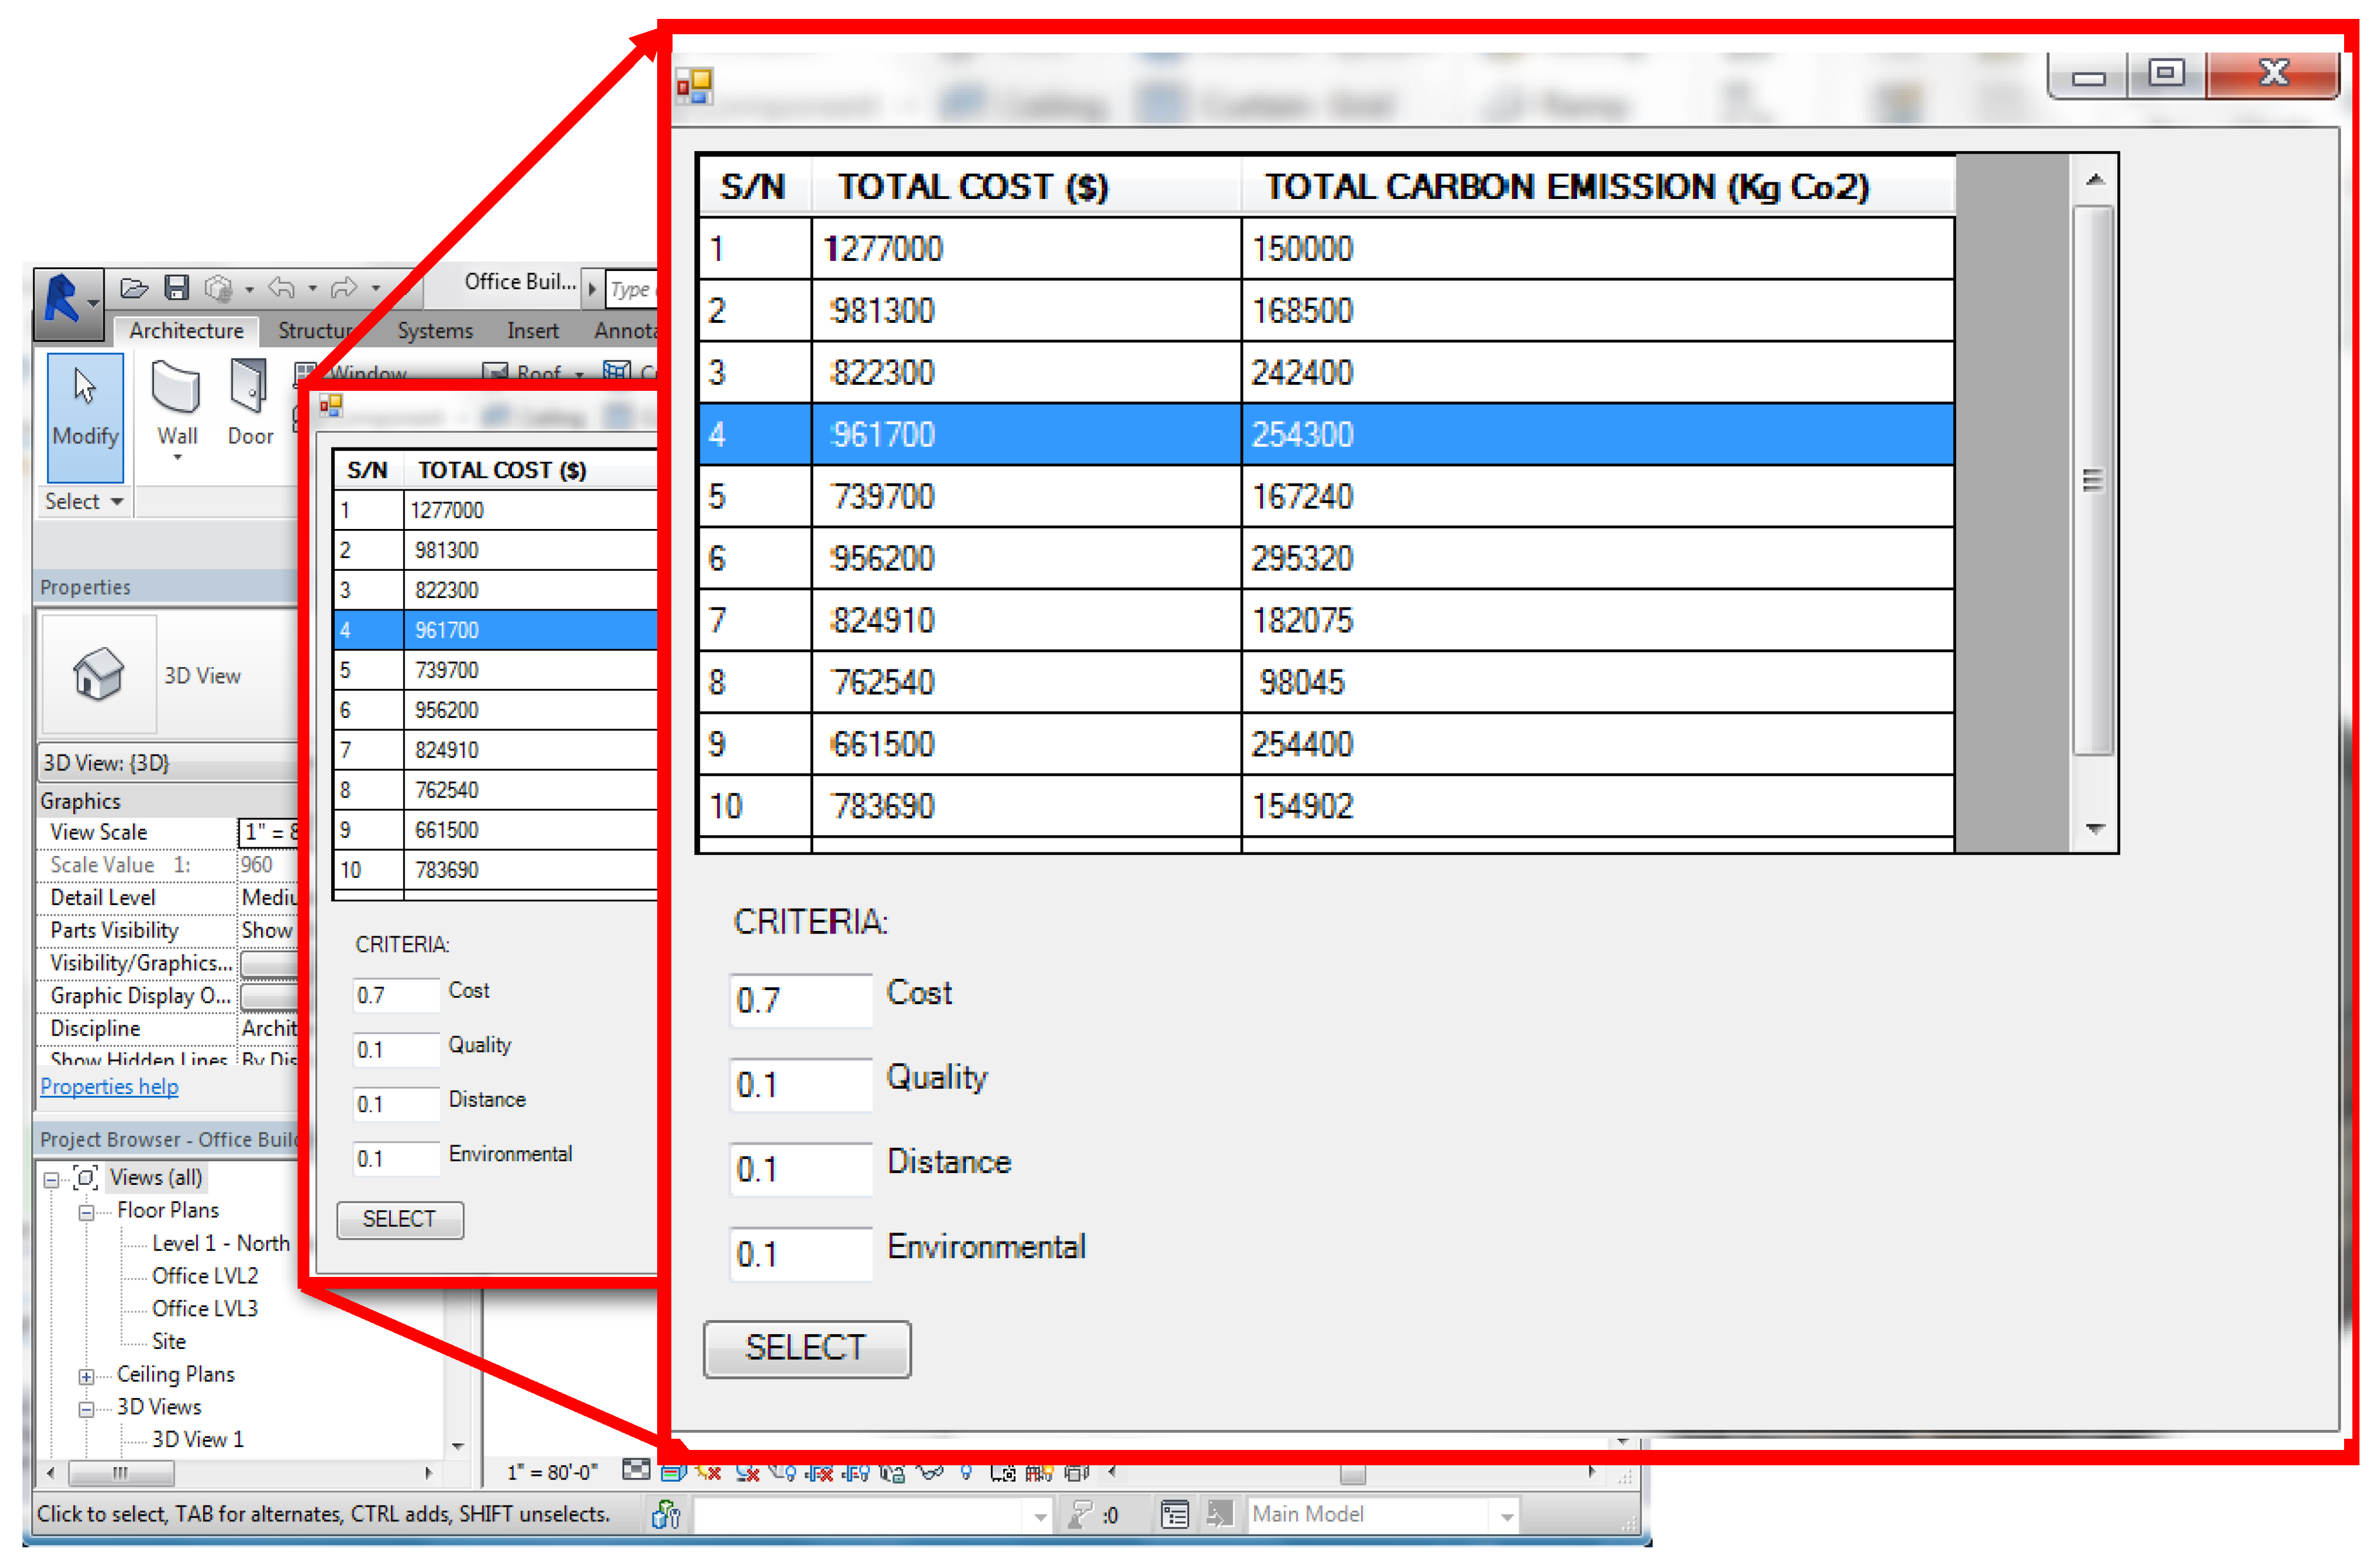
For each of the scenarios in
Table 4, the plugin can display the total cost and carbon emission of the project on the interface of the model as shown in
Figure 7. This figure shows the total cost and carbon emission of the case study project (consisting of selected elements from
Table 5) for scenario 2 (from
Table 4) where cost is assigned a weight of 0.7 and the other criteria are assigned equal weights of 0.1.
Figure 7.
Model Interface showing results.
Figure 7.
Model Interface showing results.
4. Results
This section presents the results of the harmony search optimization.
Table 7,
Table 8,
Table 9,
Table 10 and
Table 11 shows the optimal solutions for the case-study described in
Section 3, considering each of the scenarios in
Table 4. Four points have been selected from the optimal solutions of each scenario. Point 1 represents the solution with the highest cost but lowest carbon emission, point 4 represents the solution with lowest cost but highest carbon emission and points 2 and 3 are randomly selected intermediate points. Point 1 can be regarded as the optimal solution for situations where suppliers are selected solely based on cost. The same applies to point 4, which is obtained only when minimizations of carbon emissions is carried out.
Table 7 shows the optimal solution for scenario 1. Assigning equal weights to each of the supplier selection criteria tends to result in a design with the low cost and high carbon emission, compared with the other solutions. This is because suppliers selected in the category typically supply low cost materials with average quality which tends to have limited environmental impact. This is analogous to situations where more emphasis or weight is attributed to suppliers with low cost (
Table 8). This can produce solutions with low cost, reduced quality and high carbon emission. However, from
Table 9, selecting suppliers based on quality criteria is shown to have resulted in a design with slightly higher total cost. This can be attributed to the fact that emphasis is placed on suppliers with high quality materials. This is because high quality materials are typically more expensive, and this will be reflective of the supplier quotes. Scenario 4 requires awarding high weights to environmental performance; as such the design cost tends to be high as shown in
Table 10. In addition, the total carbon emission is high across all points. This means that the suppliers may have a historical performance in supplying environmental materials but also supply non-environmental materials. Availability of sustainable materials can also influence the design cost. From
Table 11, selecting suppliers that are closer to the site, is expected to result in designs with low carbon emission. Since the suppliers are closer to the project site, transportation cost will be reduced and this can be responsible for the sum of $547,546.95 at point 1 and average carbon emission of 83,621 kg.
5. Limitations of the Developed System
In-spite of the potential of the developed system to provide the cost and carbon emissions of a building design, there are some limitations in the development and application. The goal of the decision support system in providing building designs with different total cost and carbon emission requires inputting significant amount of data into the BIM model. Some of these data are manually computed and embedded in the database for use by the optimization tool. One of such data is the list of suppliers within a predefined proximity to the project site. This is significant for projects seeking LEED certification; specifically LEED points allotted to regional materials. Thus, this decision support system could benefit from an integration of the BIM tool with ArcGIS or Google map so that suppliers within a predefined proximity from the site can be automatically captured. In order to integrate BIM and ArcGIS or Google map, future work could focus on interoperability at the semantic level. As the developed tool requires a lot of data, a possible way to integrate these into the BIM model is to add the data to Industry Foundation Classes (IFC) based products. Another significant input is the alternative materials of each building element. Presently, each building element can only be assigned one material within Autodesk Revit Architecture. However, in the developed tool, the materials were inputted as part of the properties of the elements. Future versions of proprietary BIM tools could provide room for multiple materials per building element. This will enable designers easily assign materials to building elements. Opportunities exist for using collaborative filtering techniques to learn from designers’ selection patterns and present them with their interests such as alternative materials of building elements and possible suppliers of materials. Furthermore, a BIM tool with design authoring and cost estimation capability will be more suited for this application. The more recent versions of Autodesk Revit Architecture no longer has the cost estimation capability.
Table 7.
Optimal Solutions based on Scenario 1.
Table 7.
Optimal Solutions based on Scenario 1.
| Variable | Point 1 | Point 2 | Point 3 | Point 4 |
|---|
| Numeric Value | Type | Numeric Value | Type | Numeric Value | Type | Numeric Value | Type |
|---|
| X1 | 350 | Metal Stud 1 | 350 | Metal Stud 1 | 363 | Metal Stud 2 | 350 | Metal Stud 1 |
| X2 | 608 | Interior 8 | 563 | Interior 3 | 599 | Interior 7 | 563 | Interior 3 |
| X3 | 623 | Store Front | 622 | Store Front | 623 | Store Front | 622 | Store Front |
| X4 | 665 | Wood Framed 2 | 665 | Wood Framed 2 | 665 | Wood Framed 2 | 665 | Wood Framed 2 |
| X5 | 1,018 | Embossed Half Glass Steel | 1,014 | Embossed Panel Steel | 1,014 | Embossed Panel Steel | 1,024 | Fiber Glass |
| X6 | 1,039 | Wood Bi-Fold | 1,039 | Wood Bi-Fold | 1,041 | Wood Hard Board | 1,041 | Wood Hard Board |
| X7 | 1,059 | Wood Casement | 1,059 | Wood Casement | 1,060 | Wood Casement | 1,060 | Wood Casement |
| X8 | 1,084 | Plastic | 1,084 | Plastic | 1,084 | Plastic | 1,084 | Plastic |
| X9 | 1,106 | Fiber Glass | 1,106 | Fiber Glass | 1,106 | Fiber Glass | 1,107 | Fiber Glass |
| Total Cost ($) | 550,019.97 | 540,049.17 | 547,431.96 | 539,893.17 |
| Total Carbon Emissions (kg) | 90,041.45 | 123,776.51 | 88,252.81 | 123,706.61 |
Table 8.
Optimal Solutions based on Scenario 2.
Table 8.
Optimal Solutions based on Scenario 2.
| Variable | Point 1 | Point 2 | Point 3 | Point 4 |
|---|
| Numeric Value | Type | Numeric Value | Type | Numeric Value | Type | Numeric Value | Type |
|---|
| X1 | 351 | Metal Stud 2 | 370 | Metal Stud 2 | 370 | Metal Stud 2 | 370 | Metal Stud 2 |
| X2 | 578 | Interior 4 | 601 | Interior 7 | 578 | Interior 4 | 578 | Interior 4 |
| X3 | 626 | Translucent | 623 | Store Front | 623 | Store Front | 623 | Store Front |
| X4 | 696 | Wood Framed 3 | 711 | Wood Framed 4 | 725 | Wood Framed 4 | 712 | Wood Framed 4 |
| X5 | 1,017 | Embossed Half Glass Steel | 1,014 | Embossed Panel Steel | 1,014 | Embossed Panel Steel | 1,024 | Fiber Glass |
| X6 | 1,039 | Wood Bi-Fold | 1,039 | Wood Bi-Fold | 1,041 | Wood Hard Board | 1,041 | Wood Hard Board |
| X7 | 1,059 | Wood Casement | 1,059 | Wood Casement | 1,060 | Wood Casement | 1,060 | Wood Casement |
| X8 | 1,083 | Plastic | 1,084 | Plastic | 1,084 | Plastic | 1,091 | Copper |
| X9 | 1,106 | Fiber Glass | 1,106 | Fiber Glass | 1,106 | Fiber Glass | 1,107 | Fiber Glass |
| Total Cost ($) | 813,363.43 | 625,603.83 | 532,633.47 | 625,616.78 |
| Total Carbon Emissions (kg) | 66,222.52 | 65,228.04 | 64,773.9 | 54,994.95 |
Table 9.
Optimal Solutions based on Scenario 3.
Table 9.
Optimal Solutions based on Scenario 3.
| Variable | Point 1 | Point 2 | Point 3 | Point 4 |
|---|
| Numeric Value | Type | Numeric Value | Type | Numeric Value | Type | Numeric Value | Type |
|---|
| X1 | 361 | Metal Stud 2 | 369 | Metal Stud 2 | 369 | Metal Stud 2 | 344 | Metal Stud 1 |
| X2 | 562 | Interior 3 | 562 | Interior 3 | 599 | Interior 7 | 589 | Interior 6 |
| X3 | 623 | Store Front | 623 | Store Front | 623 | Store Front | 623 | Store Front |
| X4 | 671 | Wood Framed 2 | 718 | Wood Framed 4 | 671 | Wood Framed 2 | 671 | Wood Framed 2 |
| X5 | 1,017 | Embossed Half Glass Steel | 1,014 | Embossed Panel Steel | 1,014 | Embossed Panel Steel | 1,024 | Fiber Glass |
| X6 | 1,039 | Wood Bi-Fold | 1,039 | Wood Bi-Fold | 1,041 | Wood Hard Board | 1,041 | Wood Hard Board |
| X7 | 1,059 | Wood Casement | 1,059 | Wood Casement | 1,060 | Wood Casement | 1,060 | Wood Casement |
| X8 | 1,084 | Plastic | 1,084 | Plastic | 1,084 | Plastic | 1,084 | Plastic |
| X9 | 1,106 | Fiber Glass | 1,106 | Fiber Glass | 1,107 | Fiber Glass | 1,106 | Fiber Glass |
| Total Cost ($) | 538,010.08 | 616,067.04 | 547,431.96 | 543,327.36 |
| Total Carbon Emissions (kg) | 122,855.39 | 99,917.81 | 88,252.84 | 91,465.16 |
Table 10.
Optimal Solutions based on Scenario 4.
Table 10.
Optimal Solutions based on Scenario 4.
| Variable | Point 1 | Point 2 | Point 3 | Point 4 |
|---|
| Numeric Value | Type | Numeric Value | Type | Numeric Value | Type | Numeric Value | Type |
|---|
| X1 | 227 | Masonry 5 | 261 | Masonry 6 | 261 | Masonry 6 | 261 | Masonry 6 |
| X2 | 569 | Interior 3 | 565 | Interior 3 | 565 | Interior 3 | 544 | Interior 1 |
| X3 | 623 | Store Front | 623 | Store Front | 623 | Store Front | 623 | Store Front |
| X4 | 720 | Wood Framed 4 | 718 | Wood Framed 4 | 719 | Wood Framed 4 | 659 | Wood Framed 2 |
| X5 | 1,018 | Embossed Half Glass Steel | 1,014 | Embossed Panel Steel | 1,024 | Fiber Glass | 1,024 | Fiber Glass |
| X6 | 1,039 | Wood Bi-Fold | 1,039 | Wood Bi-Fold | 1,039 | Wood Bi-Fold | 1,041 | Wood Hard Board |
| X7 | 1,059 | Wood Casement | 1,060 | Wood Casement | 1,060 | Wood Casement | 1,060 | Wood Casement |
| X8 | 1,084 | Plastic | 1,091 | Copper | 1,084 | Plastic | 1,084 | Plastic |
| X9 | 1,106 | Fiber Glass | 1,106 | Fiber Glass | 1,106 | Fiber Glass | 1,107 | Fiber Glass |
| Total Cost ($) | 669,440.49 | 567,259.39 | 667,142.4 | 591,509.83 |
| Total Carbon Emissions (kg) | 111,506.76 | 106,789.15 | 110,624.5 | 97,667.07 |
Table 11.
Optimal Solutions based on Scenario 5.
Table 11.
Optimal Solutions based on Scenario 5.
| Variable | Point 1 | Point 2 | Point 3 | Point 4 |
|---|
| Numeric Value | Type | Numeric Value | Type | Numeric Value | Type | Numeric Value | Type |
|---|
| X1 | 360 | Metal Stud 2 | 367 | Metal Stud 2 | 369 | Metal Stud 2 | 369 | Metal Stud 2 |
| X2 | 598 | Interior 7 | 598 | Interior 7 | 544 | Interior 1 | 544 | Interior 1 |
| X3 | 623 | Store Front | 623 | Store Front | 623 | Store Front | 623 | Store Front |
| X4 | 668 | Wood Framed 2 | 668 | Wood Framed 2 | 668 | Wood Framed 2 | 668 | Wood Framed 2 |
| X5 | 1,017 | Embossed Half Glass Steel | 1,014 | Embossed Panel Steel | 1,014 | Embossed Panel Steel | 1,024 | Fiber Glass |
| X6 | 1,039 | Wood Bi-Fold | 1,039 | Wood Bi-Fold | 1,041 | Wood Hard Board | 1,041 | Wood Hard Board |
| X7 | 1,059 | Wood Casement | 1,059 | Wood Casement | 1,060 | Wood Casement | 1,060 | Wood Casement |
| X8 | 1,091 | Copper | 1,091 | Copper | 1,091 | Copper | 1,091 | Copper |
| X9 | 1,106 | Fiber Glass | 1,106 | Fiber Glass | 1,107 | Fiber Glass | 1,106 | Fiber Glass |
| Total Cost ($) | 547,546.95 | 537,480.95 | 540,483.46 | 540,317.46 |
| Total Carbon Emissions (kg) | 84,238.44 | 84,294.79 | 83,011.87 | 82,941.97 |


