
Dynamic Simulation of the Green Roofs Impact on Building Energy Performance, Case Study of Antananarivo, Madagascar

Abstract
:
1. Introduction


2. Method
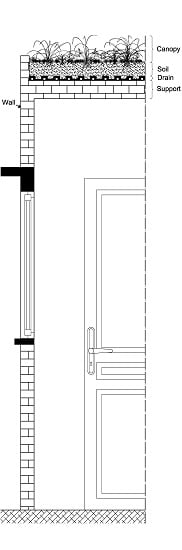
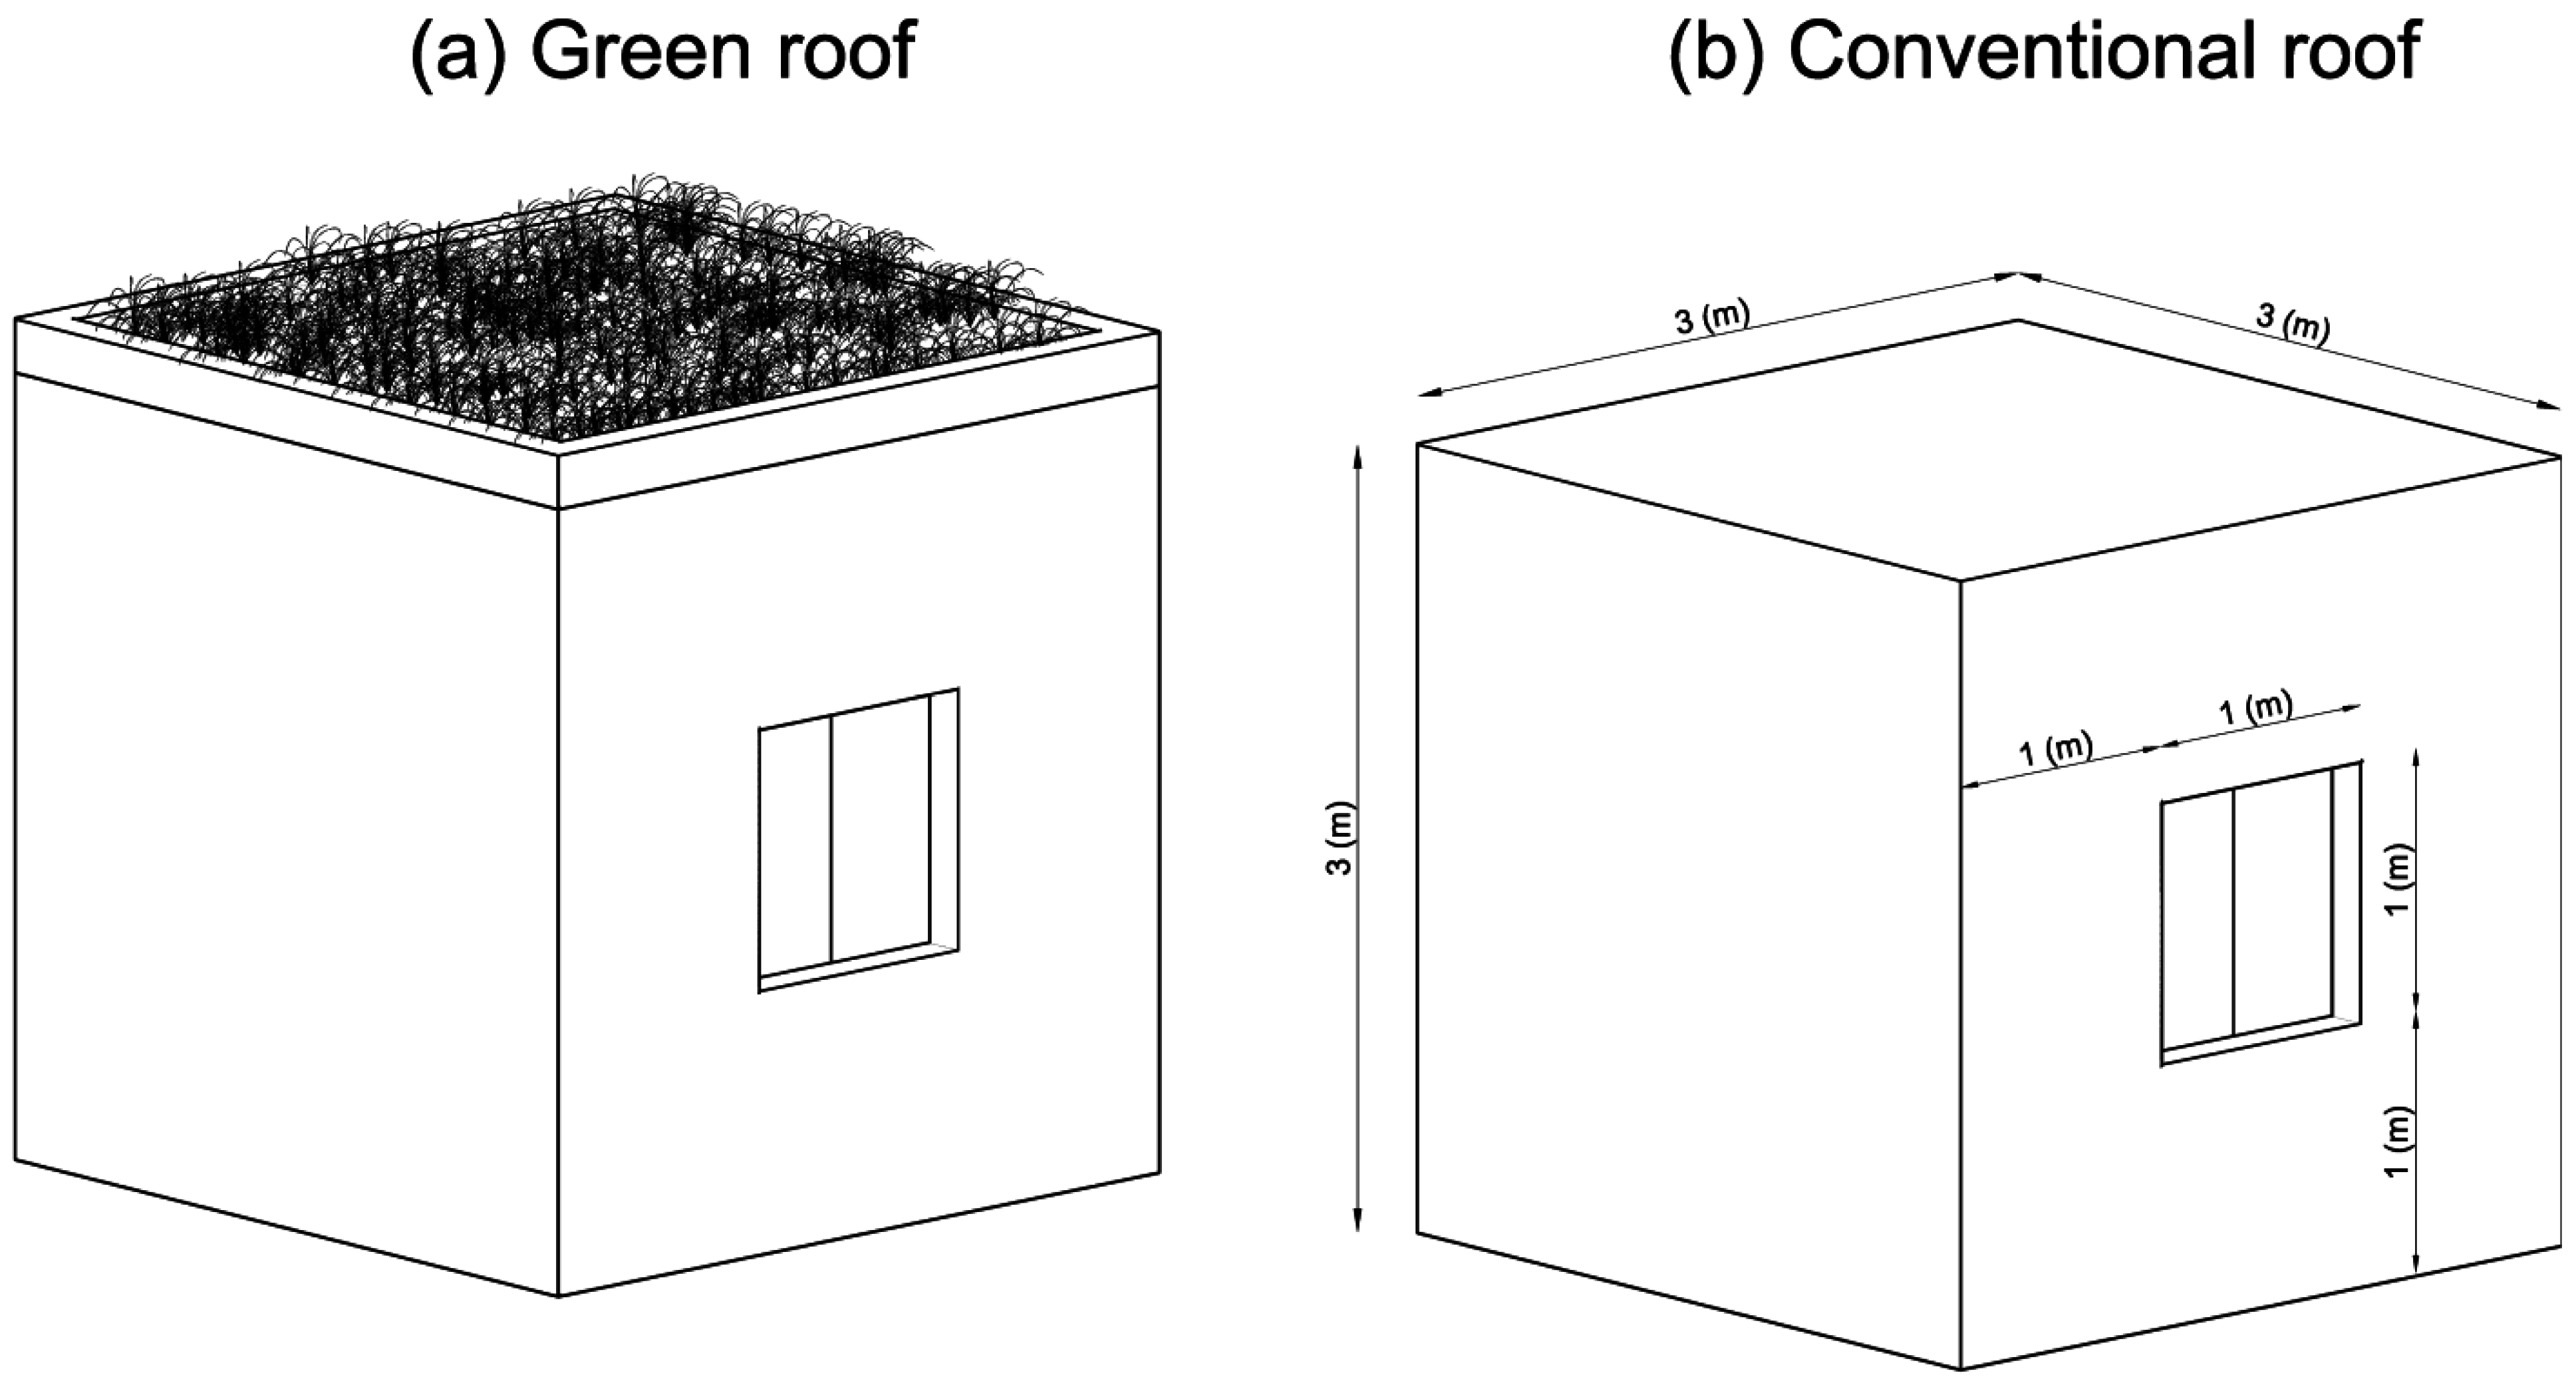
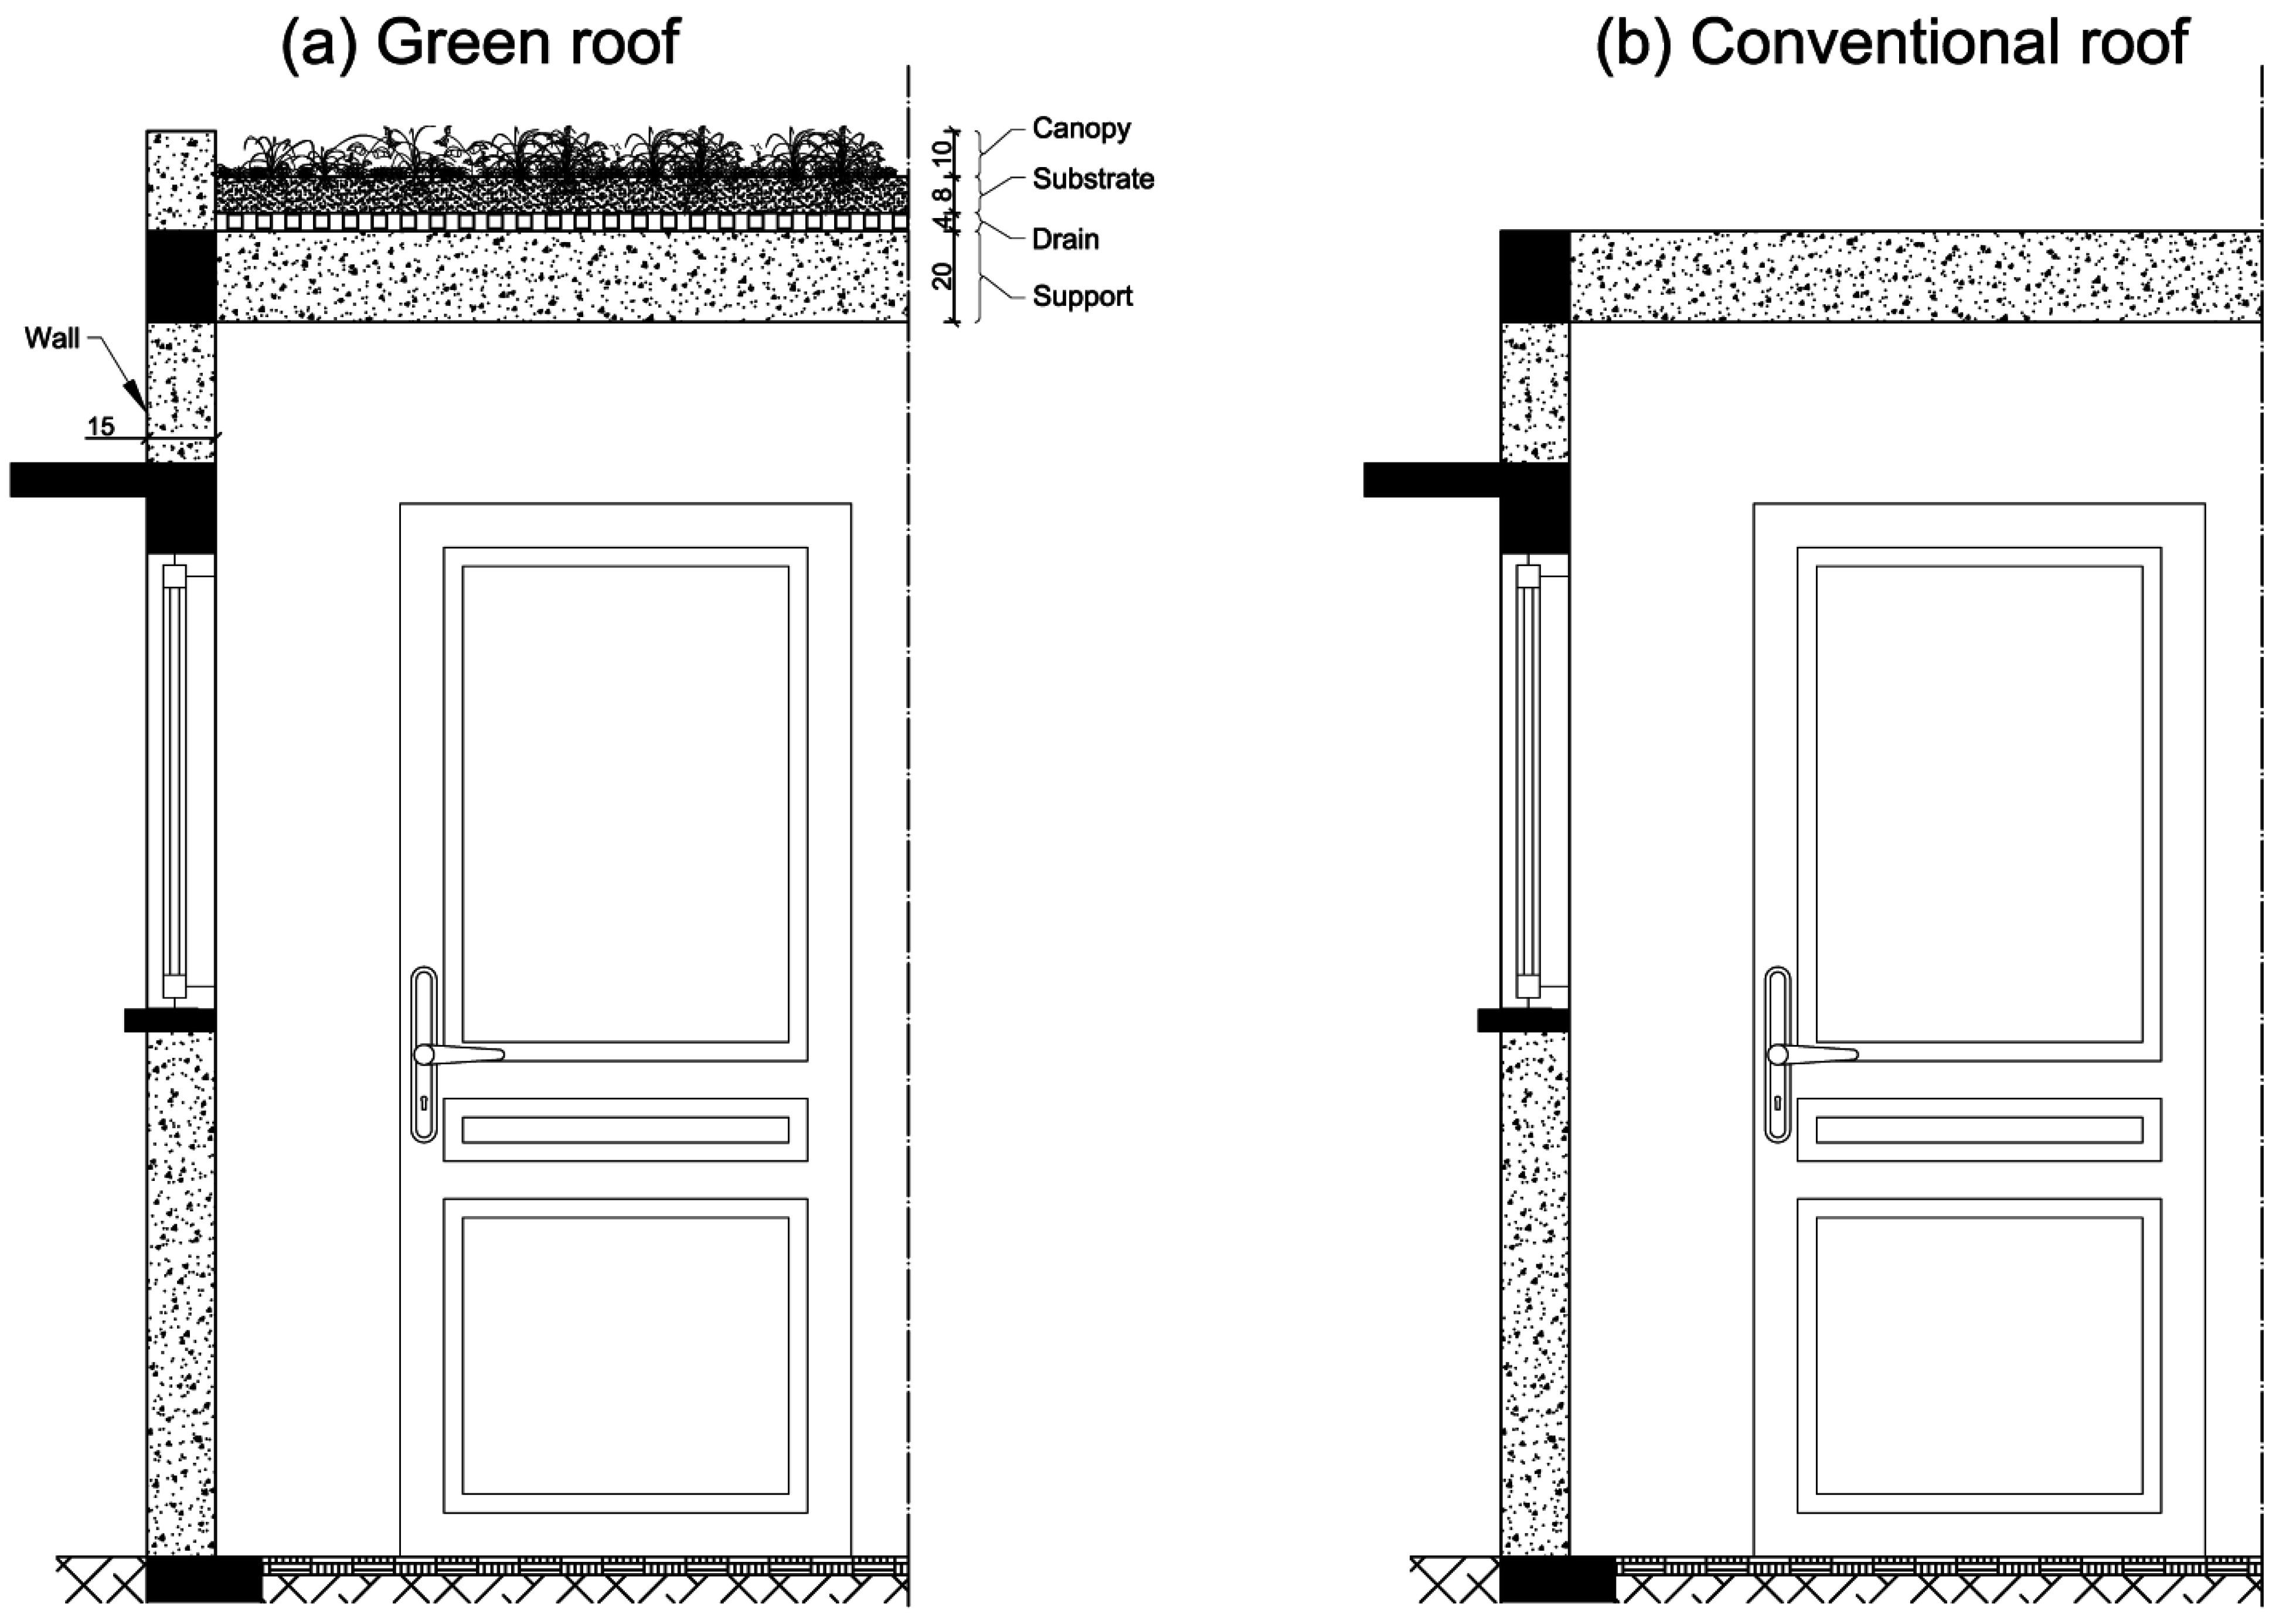
2.1. Description of the Studied Roofs

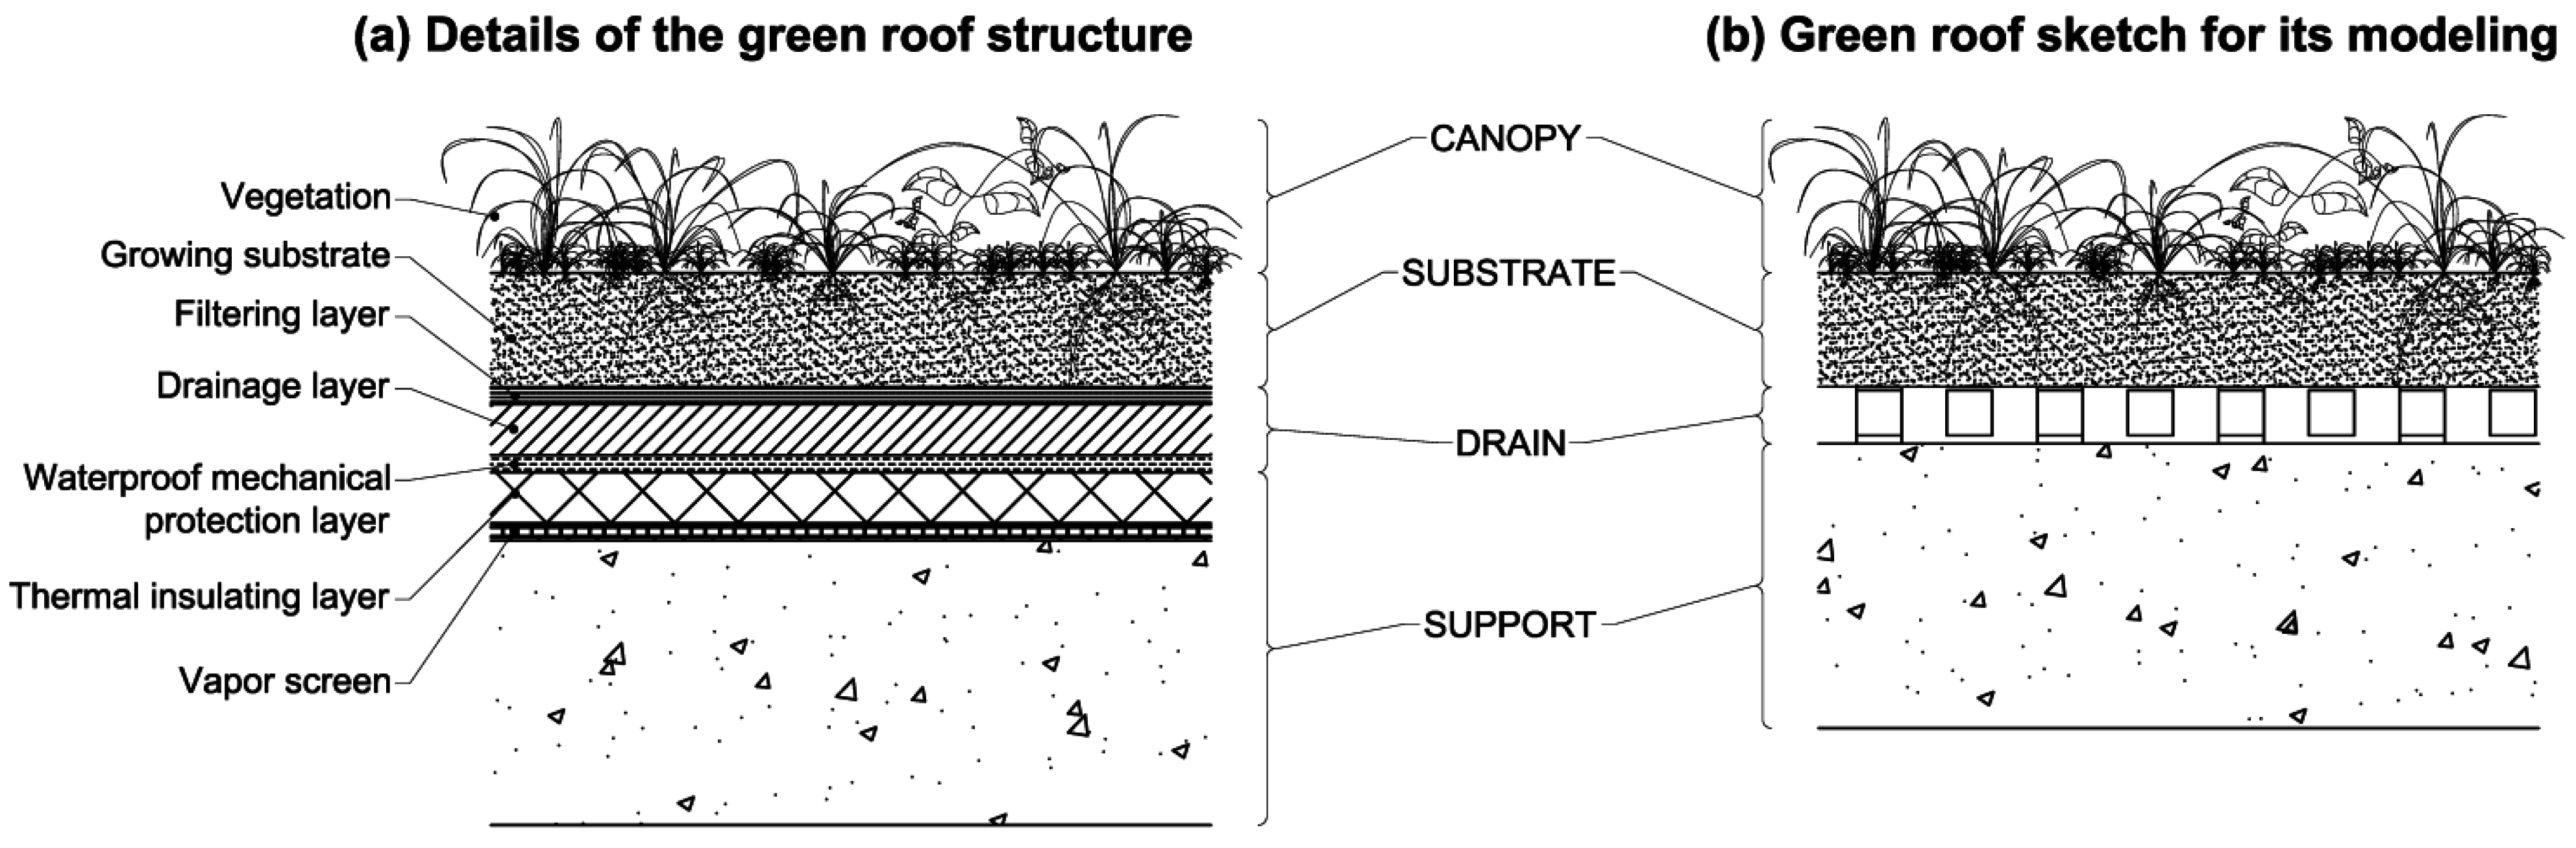
2.2. Green Roof Model
- (i)
- The plants, the soil and the drain are supposed to be horizontally homogeneous and the problem is one-dimensional;
- (ii)
- The temperatures of the canopy foliage and canopy air are considered uniform;
- (iii)
- The moisture contents of the soil substrate and drainage layers are time dependent, but constant in space;
- (iv)
- The soil and canopy layers are mulch free;
- (v)
- The plants are healthy and there is growth over time;
- (vi)
- The heat transfer by conduction in the plants is negligible.
2.2.1. Thermal Balance
2.2.2. Mass Balance
2.3. Conventional Roof Model
2.4. Building Thermal Model
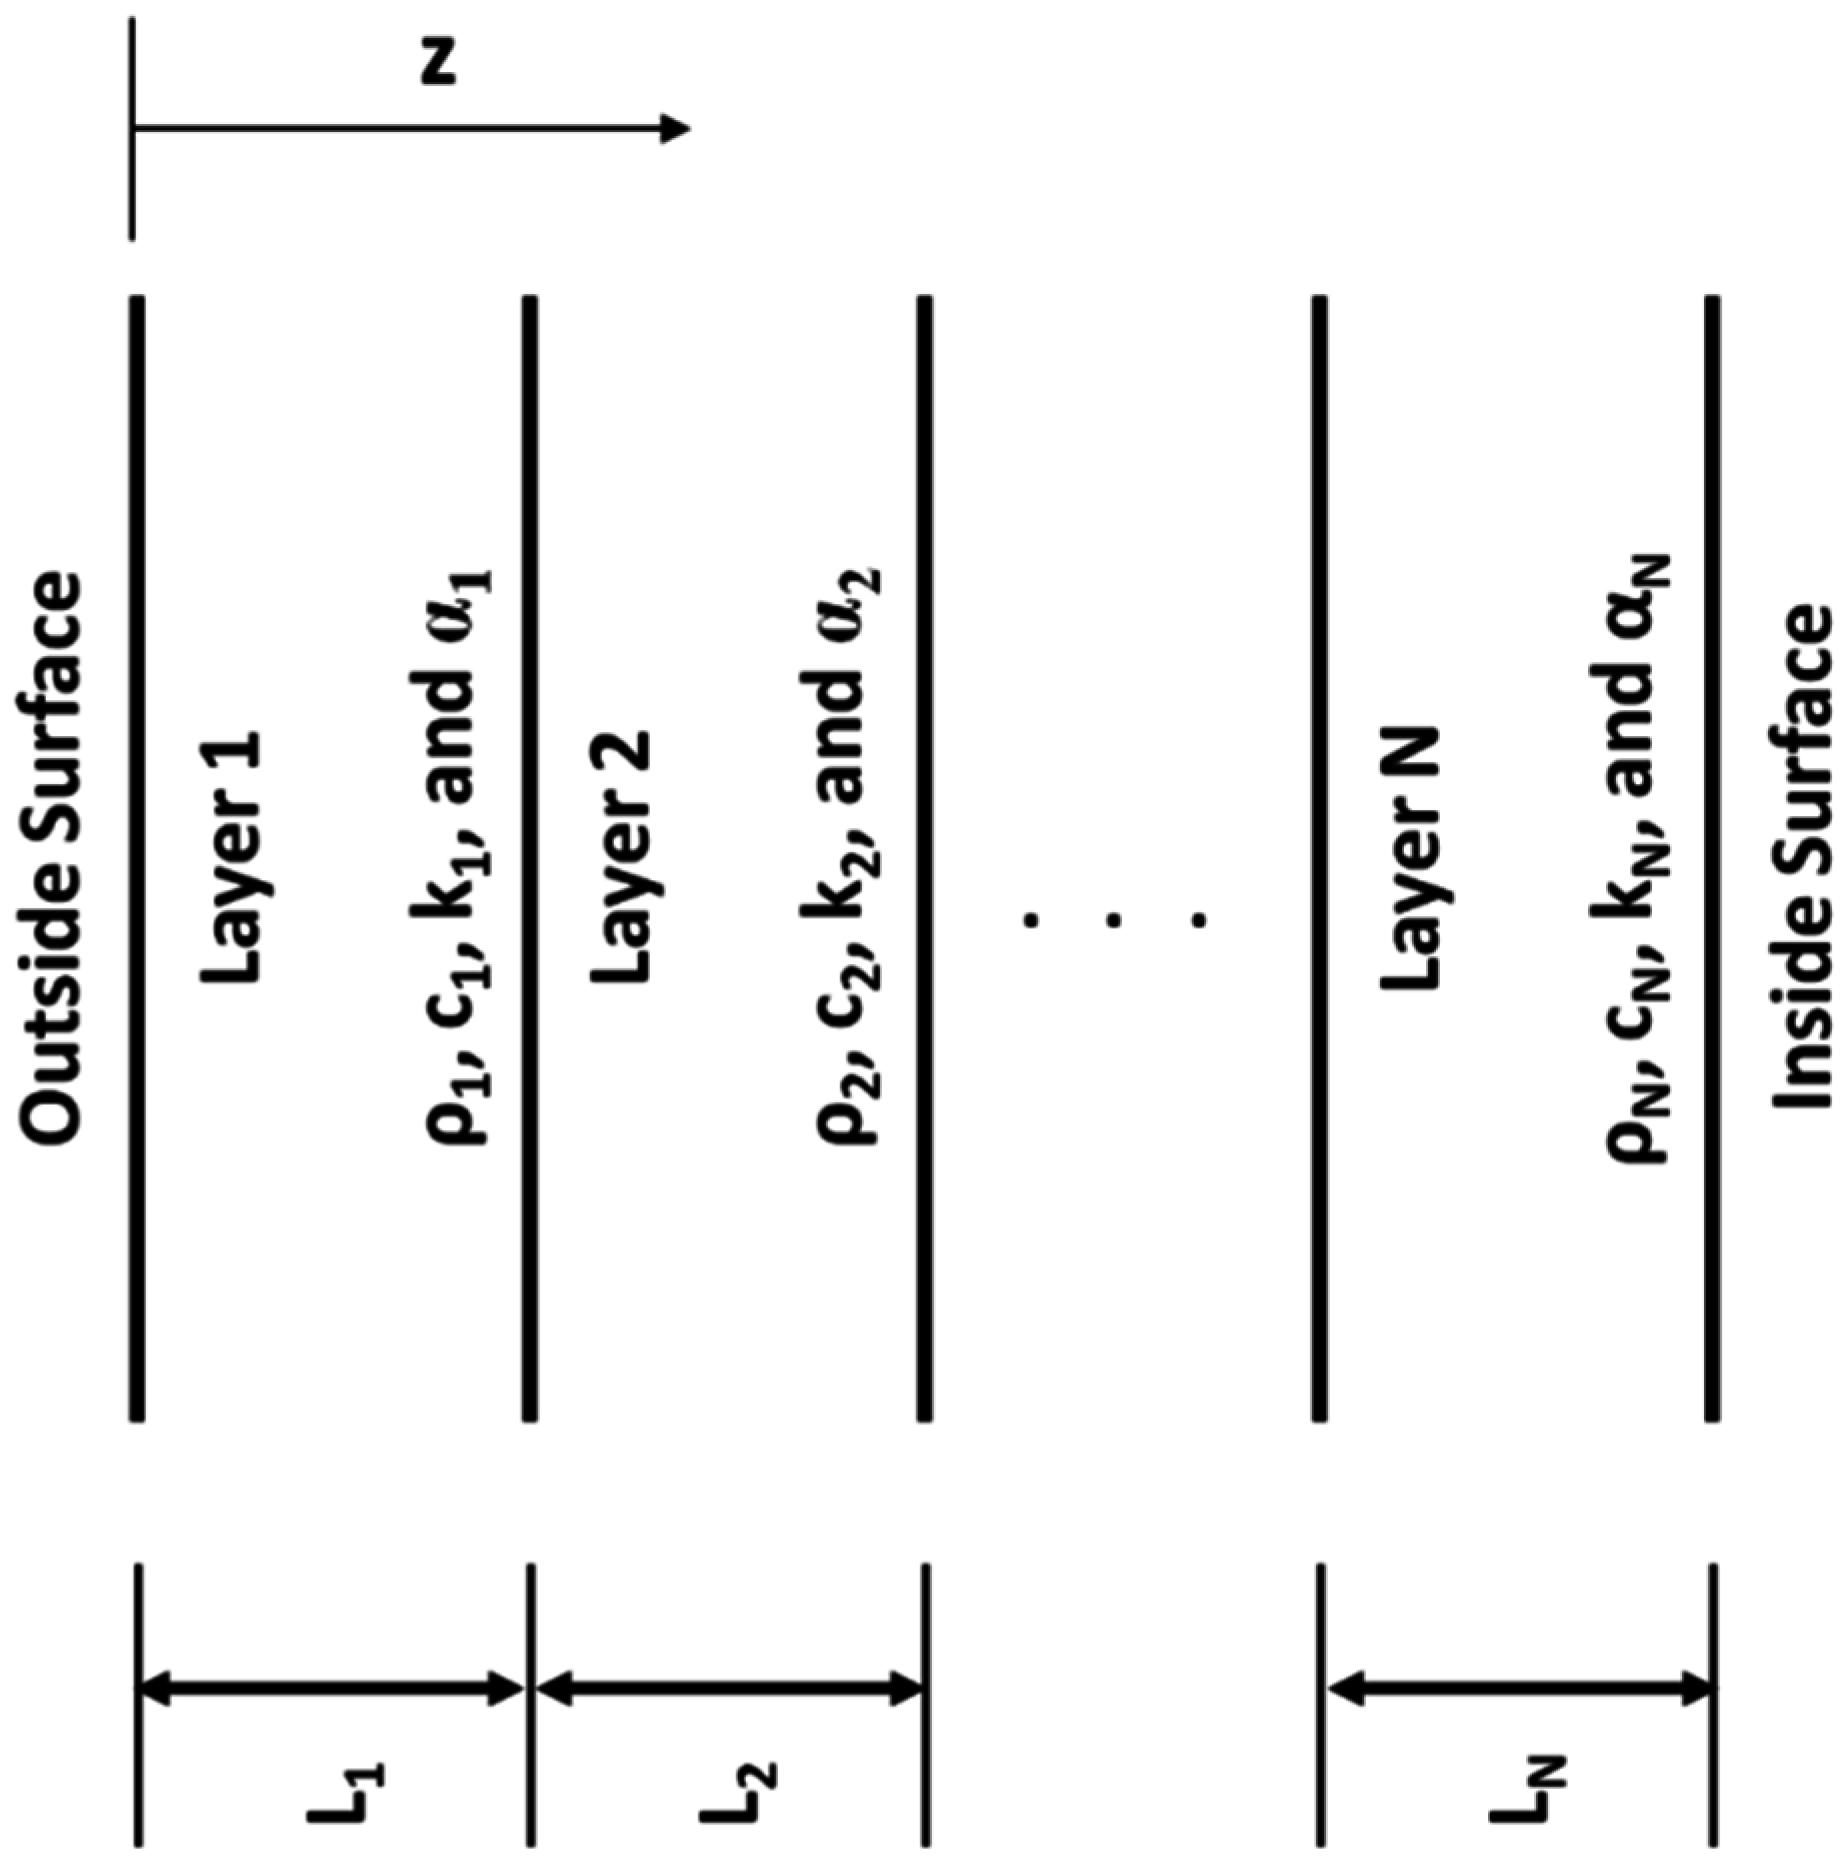
2.4.1. Hypotheses
- (i)
- The layers are in good contact; hence the interface resistance is negligible;
- (ii)
- There is no heat source;
- (iii)
- The variation of thermal properties is negligible;
- (iv)
- The thickness of the composite elements is small compared to the other dimensions. Hence, a one-dimensional temperature variation is assumed.
- -
- the heat balance of the indoor air volume; and
- -
- the assessments of internal and external surfaces of each wall.
2.4.2. Indoor Air Volume Heat Balance Equation
2.4.3. Walls Thermal Balance Equations
- (i)
- Boundary conditions at the inside surface i (x = 0):
- To simplify the model (avoiding the factor form calculation), we will not consider the exchange of long wave radiation (GLO) between the inside surfaces of the local. Thus, we have the following relation:
- The inside-surface heat transfer coefficient hCI,i is expressed as a function of the inclination pi (rd) of the wall [34]:
- (ii)
- Boundary conditions at the outside surface (x = L):
- The outside-surface heat transfer coefficient hCE,i is expressed as a function of wind speed v (m.s−1) [24]
- The expressions of the radiation exchanges are given by:with
2.5. Numerical Solutions
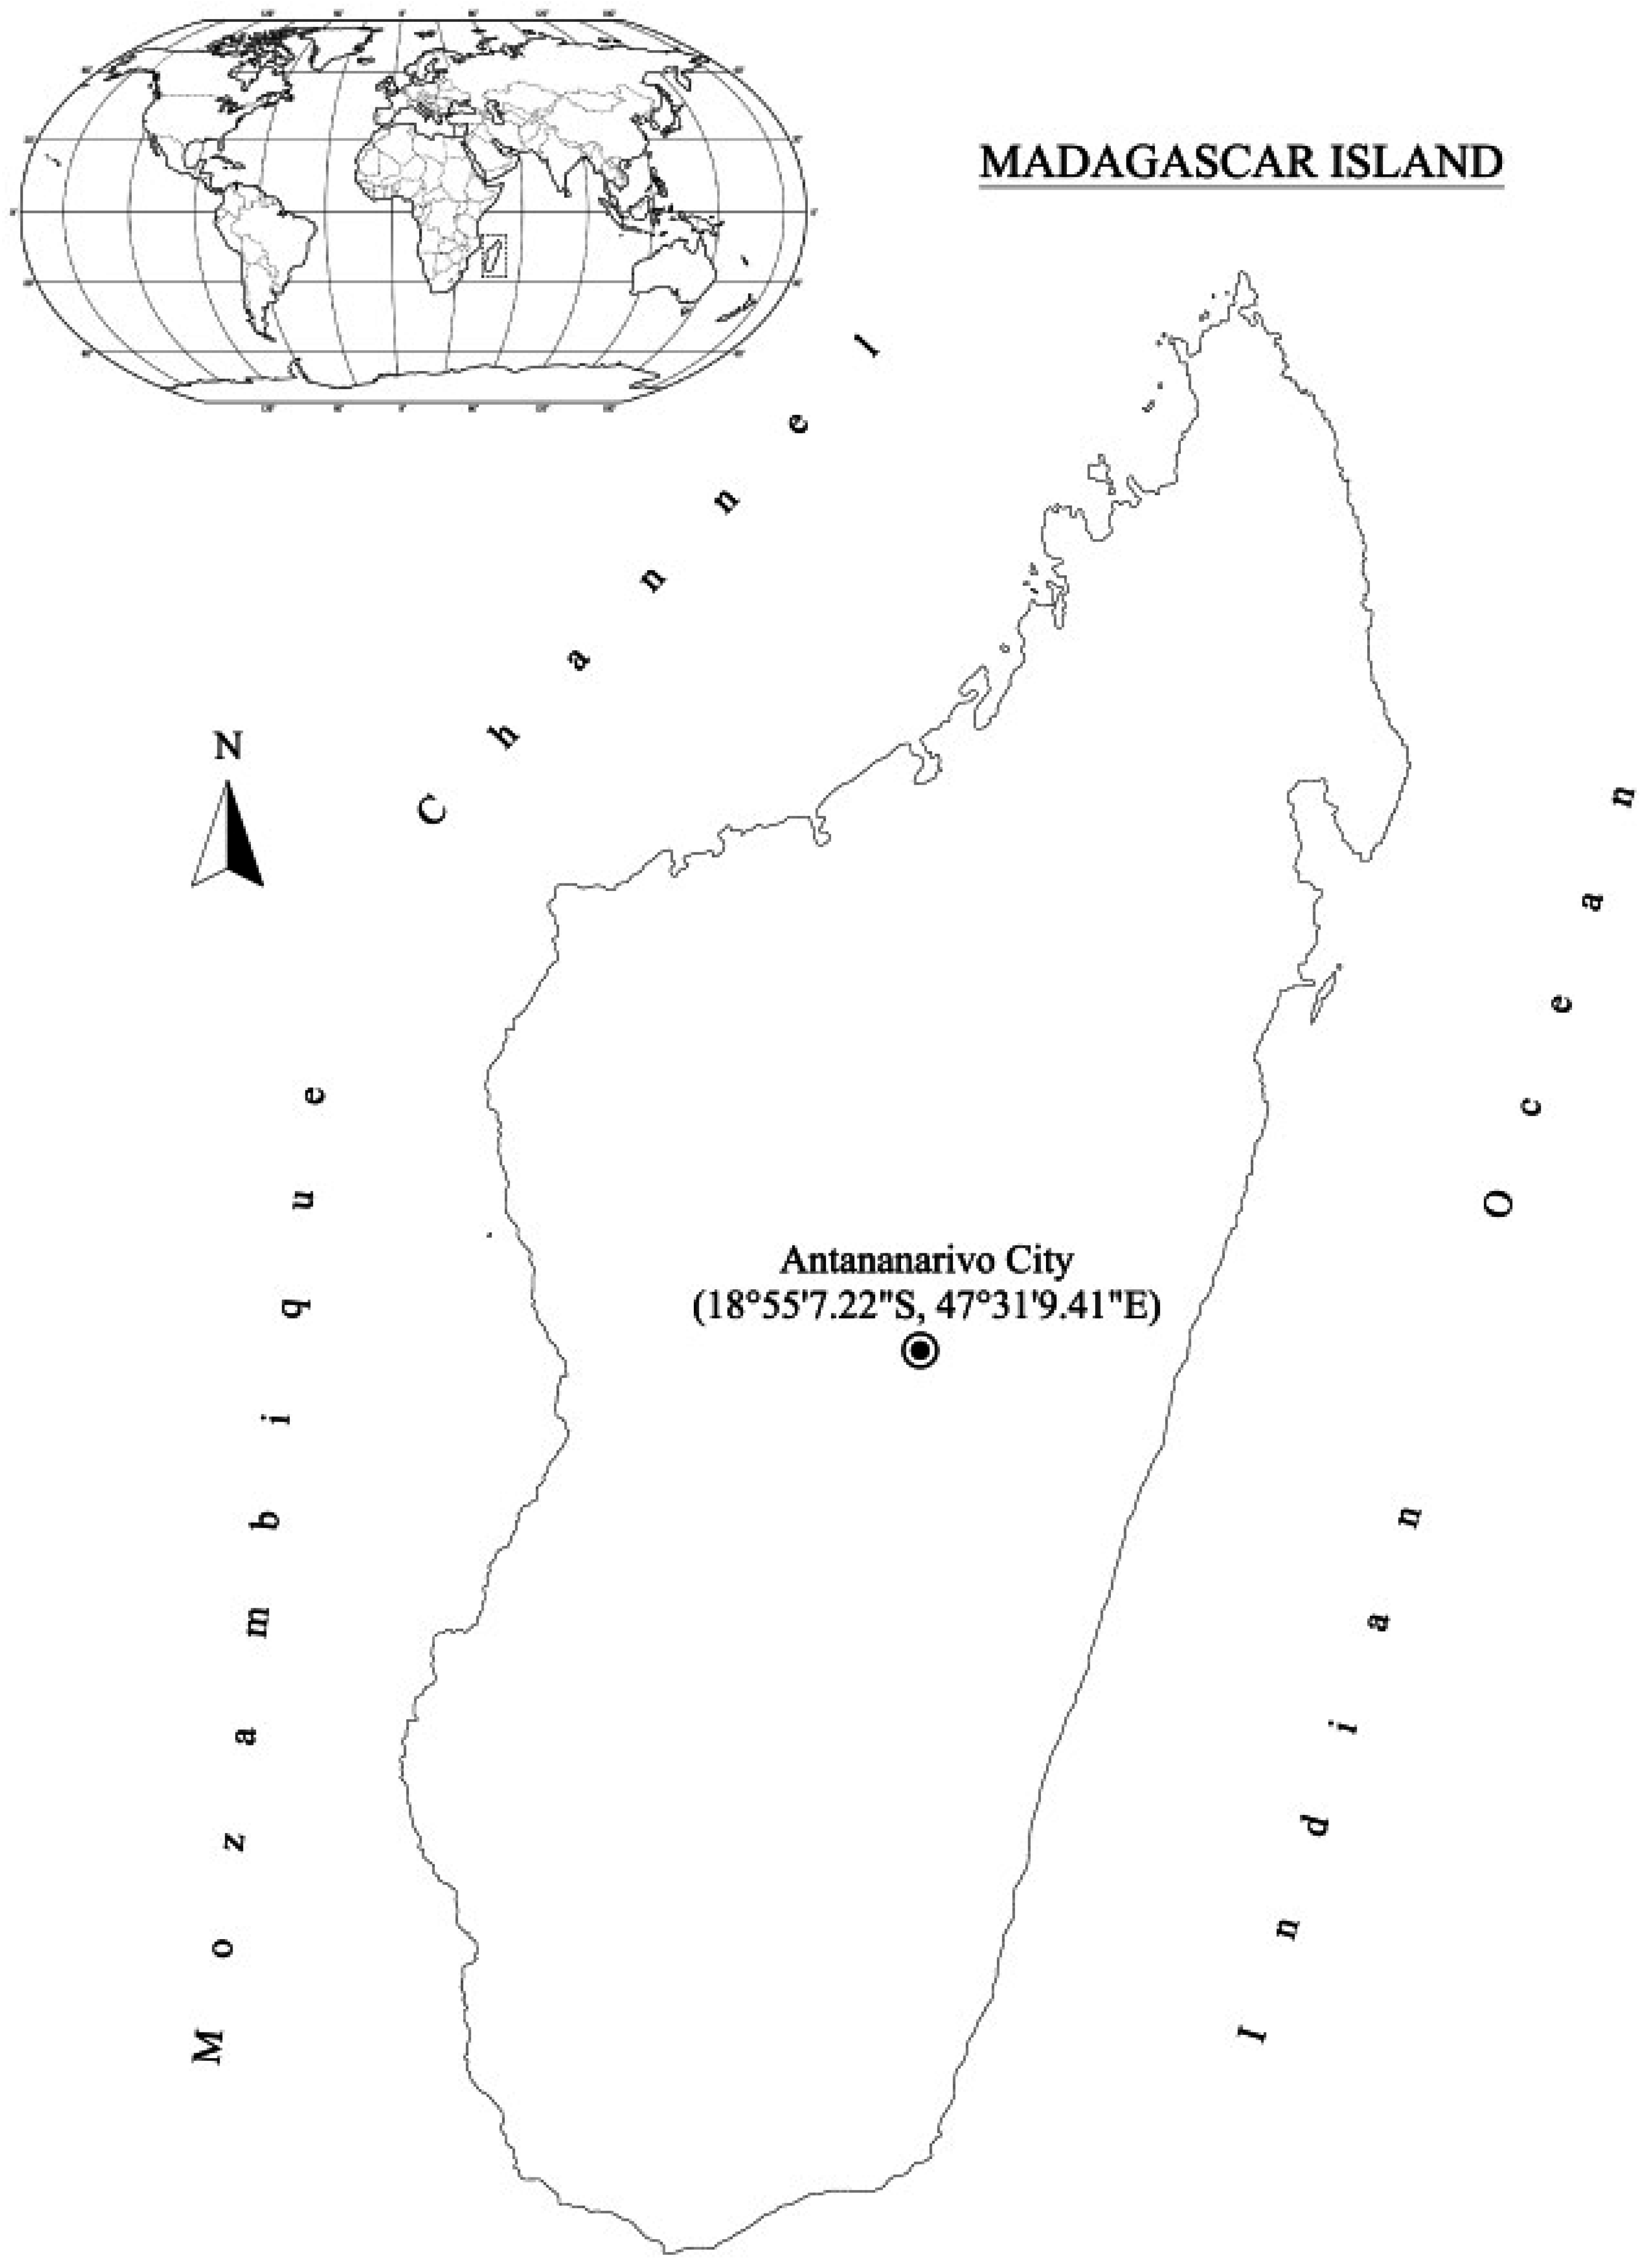
3. Case Study: Building Located in Antananarivo
3.1. Roof and Wall Structure and Thermal Properties

| Canopy | Substrate | Drain | Support (concrete) | Walls and floor |
|---|---|---|---|---|
| LAI = 3 | ρg = 1250 kg·m−3 | ρd = 1150 kg·m−3 | ρ = 2243 kg·m−3 | Concrete layer |
| σf = 80% | wg = 40% | Ld = 0.04 m | cp = 920 J·kg−1·K−1 | ρ = 2243 kg·m−3 |
| df = 0.001 m | Lg = 0.08 m | λ = 1.73 W·m−1·K−1 | cp = 920 J·kg−1·K−1 | |
| f =1.1 | L = 0.20 m | λ = 1.73 W·m−1·K−1 | ||
| k1 = 0.8 | L = 0.15 m | |||
| ρ∞ = 0.2 | Insulating layer | |||
| τ1 = 0.2 | ρ = 300 kg·m−3 | |||
| Lc = 0.1 m | cp = 837 J·kg−1·K−1 | |||
| λ = 0.08 W·m−1·K−1 | ||||
| L = 0.04 m |
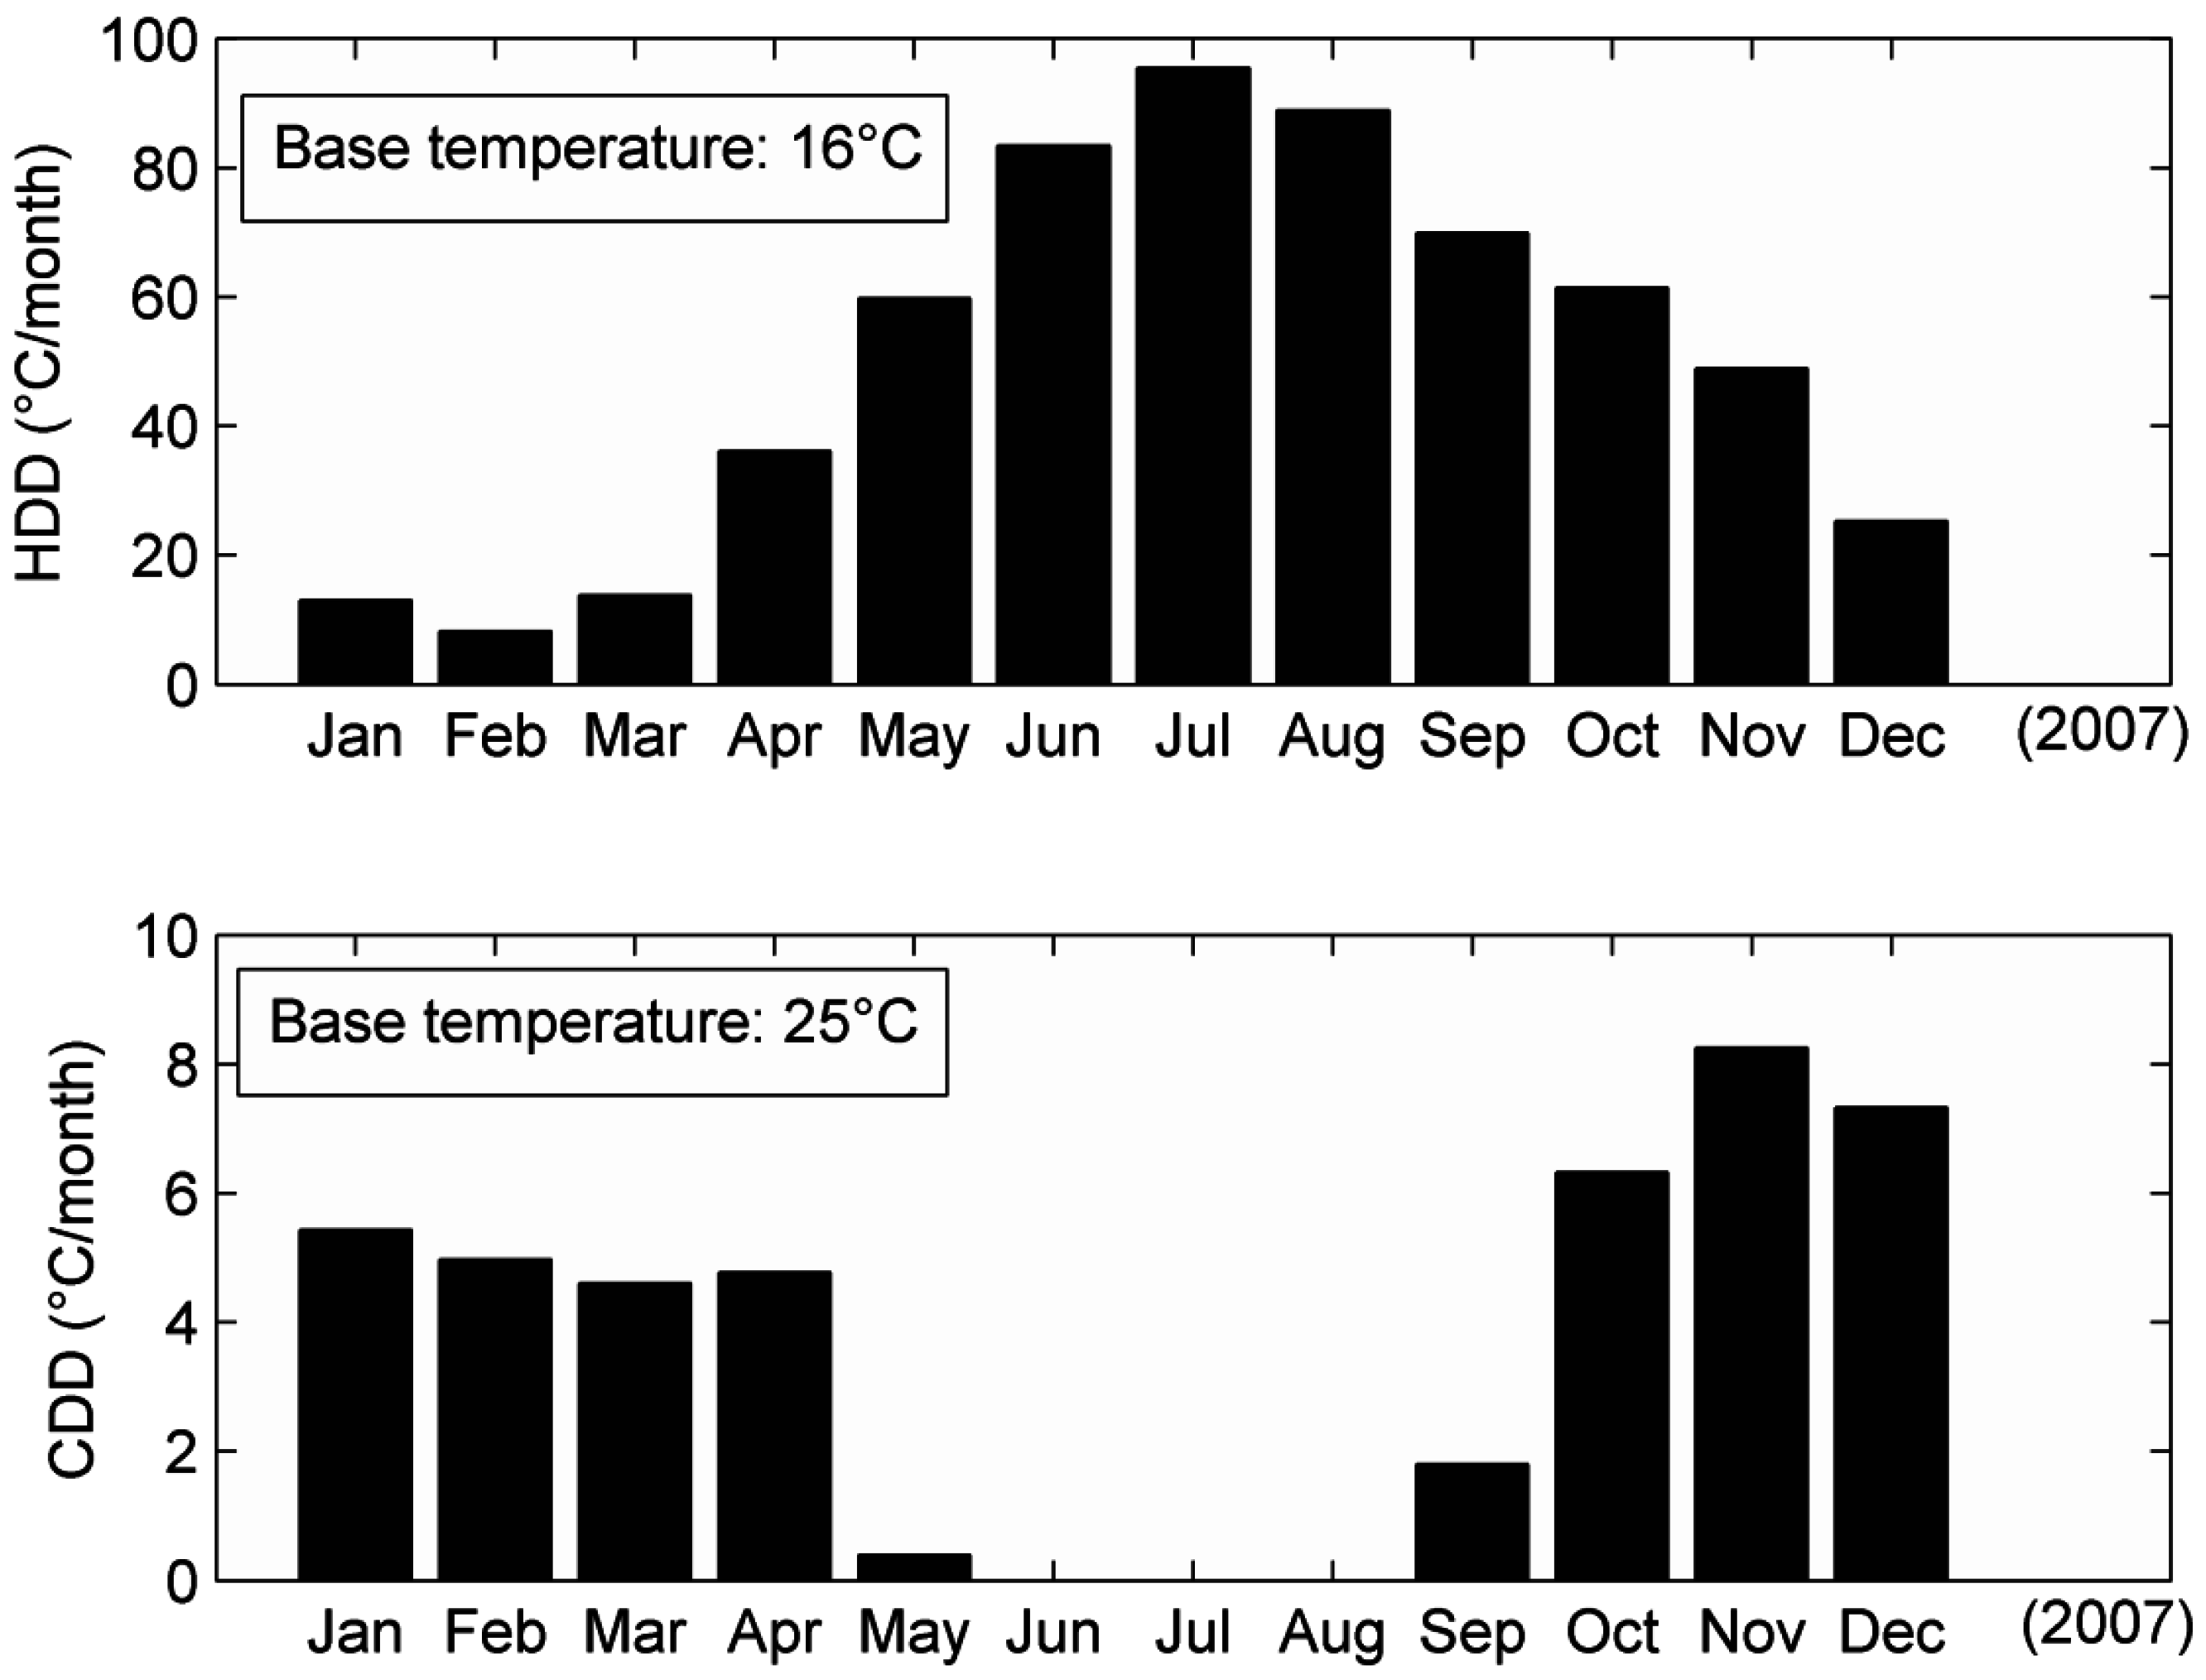
3.2. Weather Data
- -
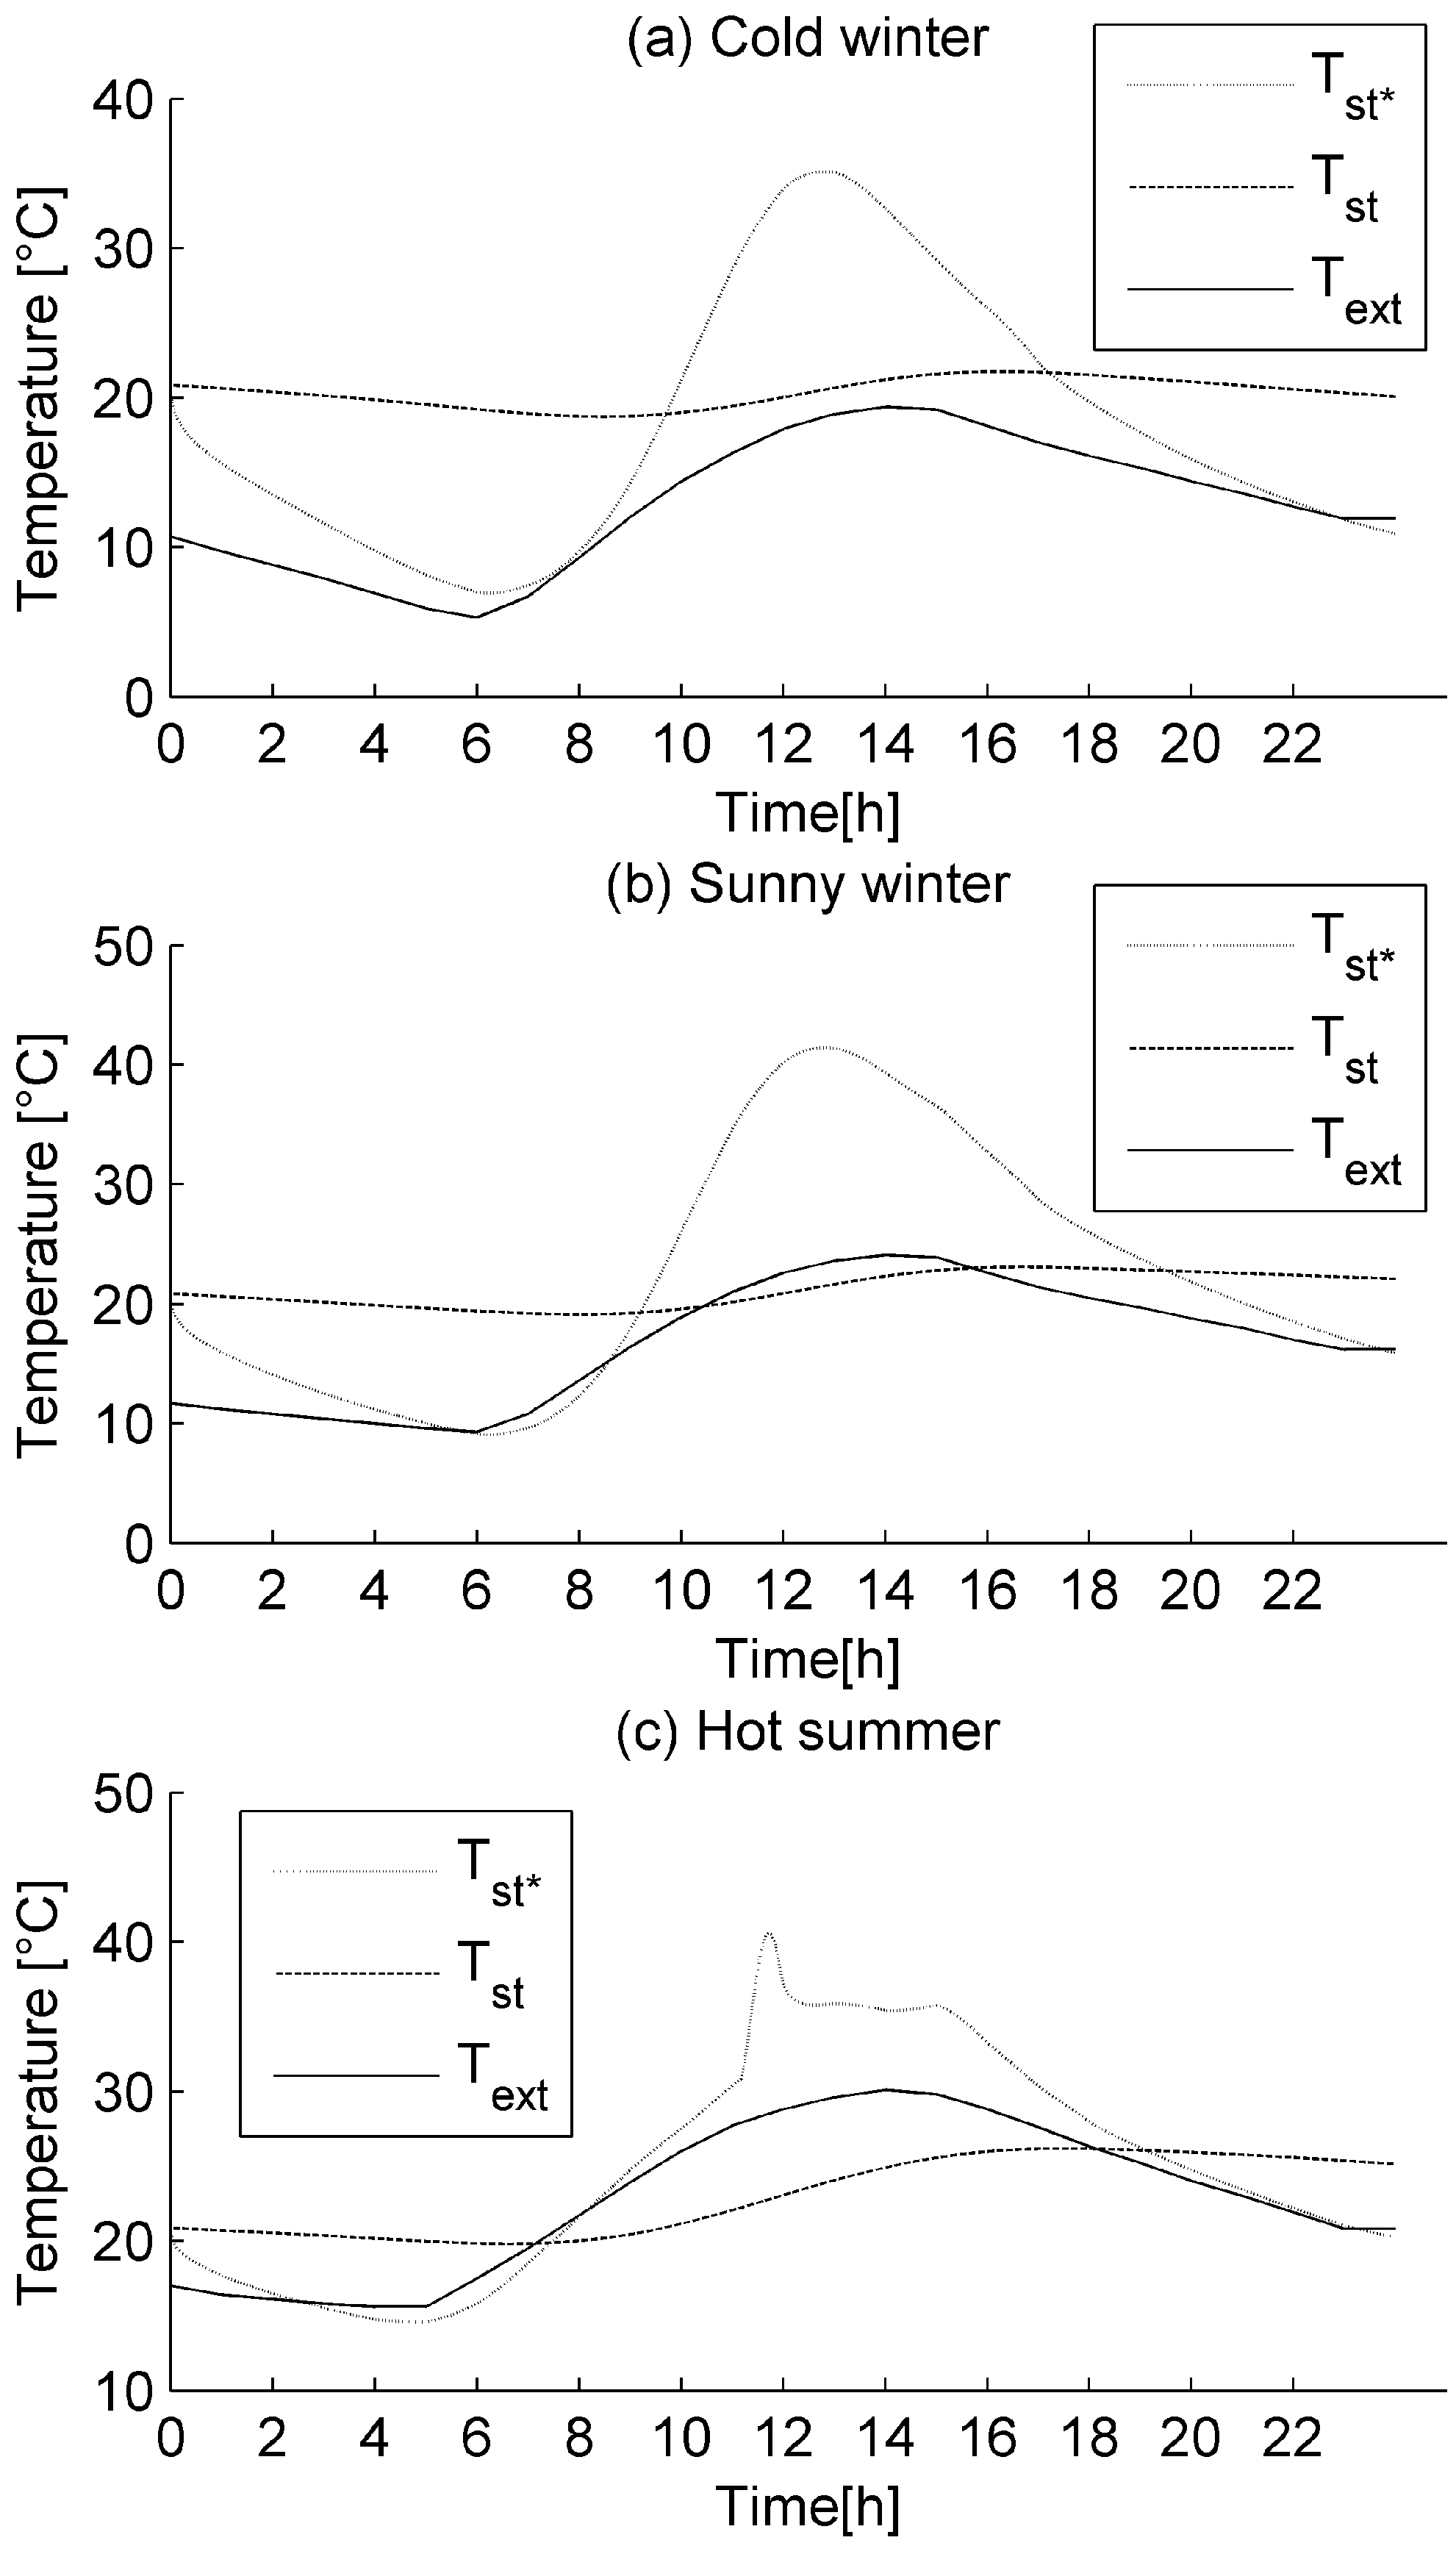
- top face temperature of the roof support Tst;
- -
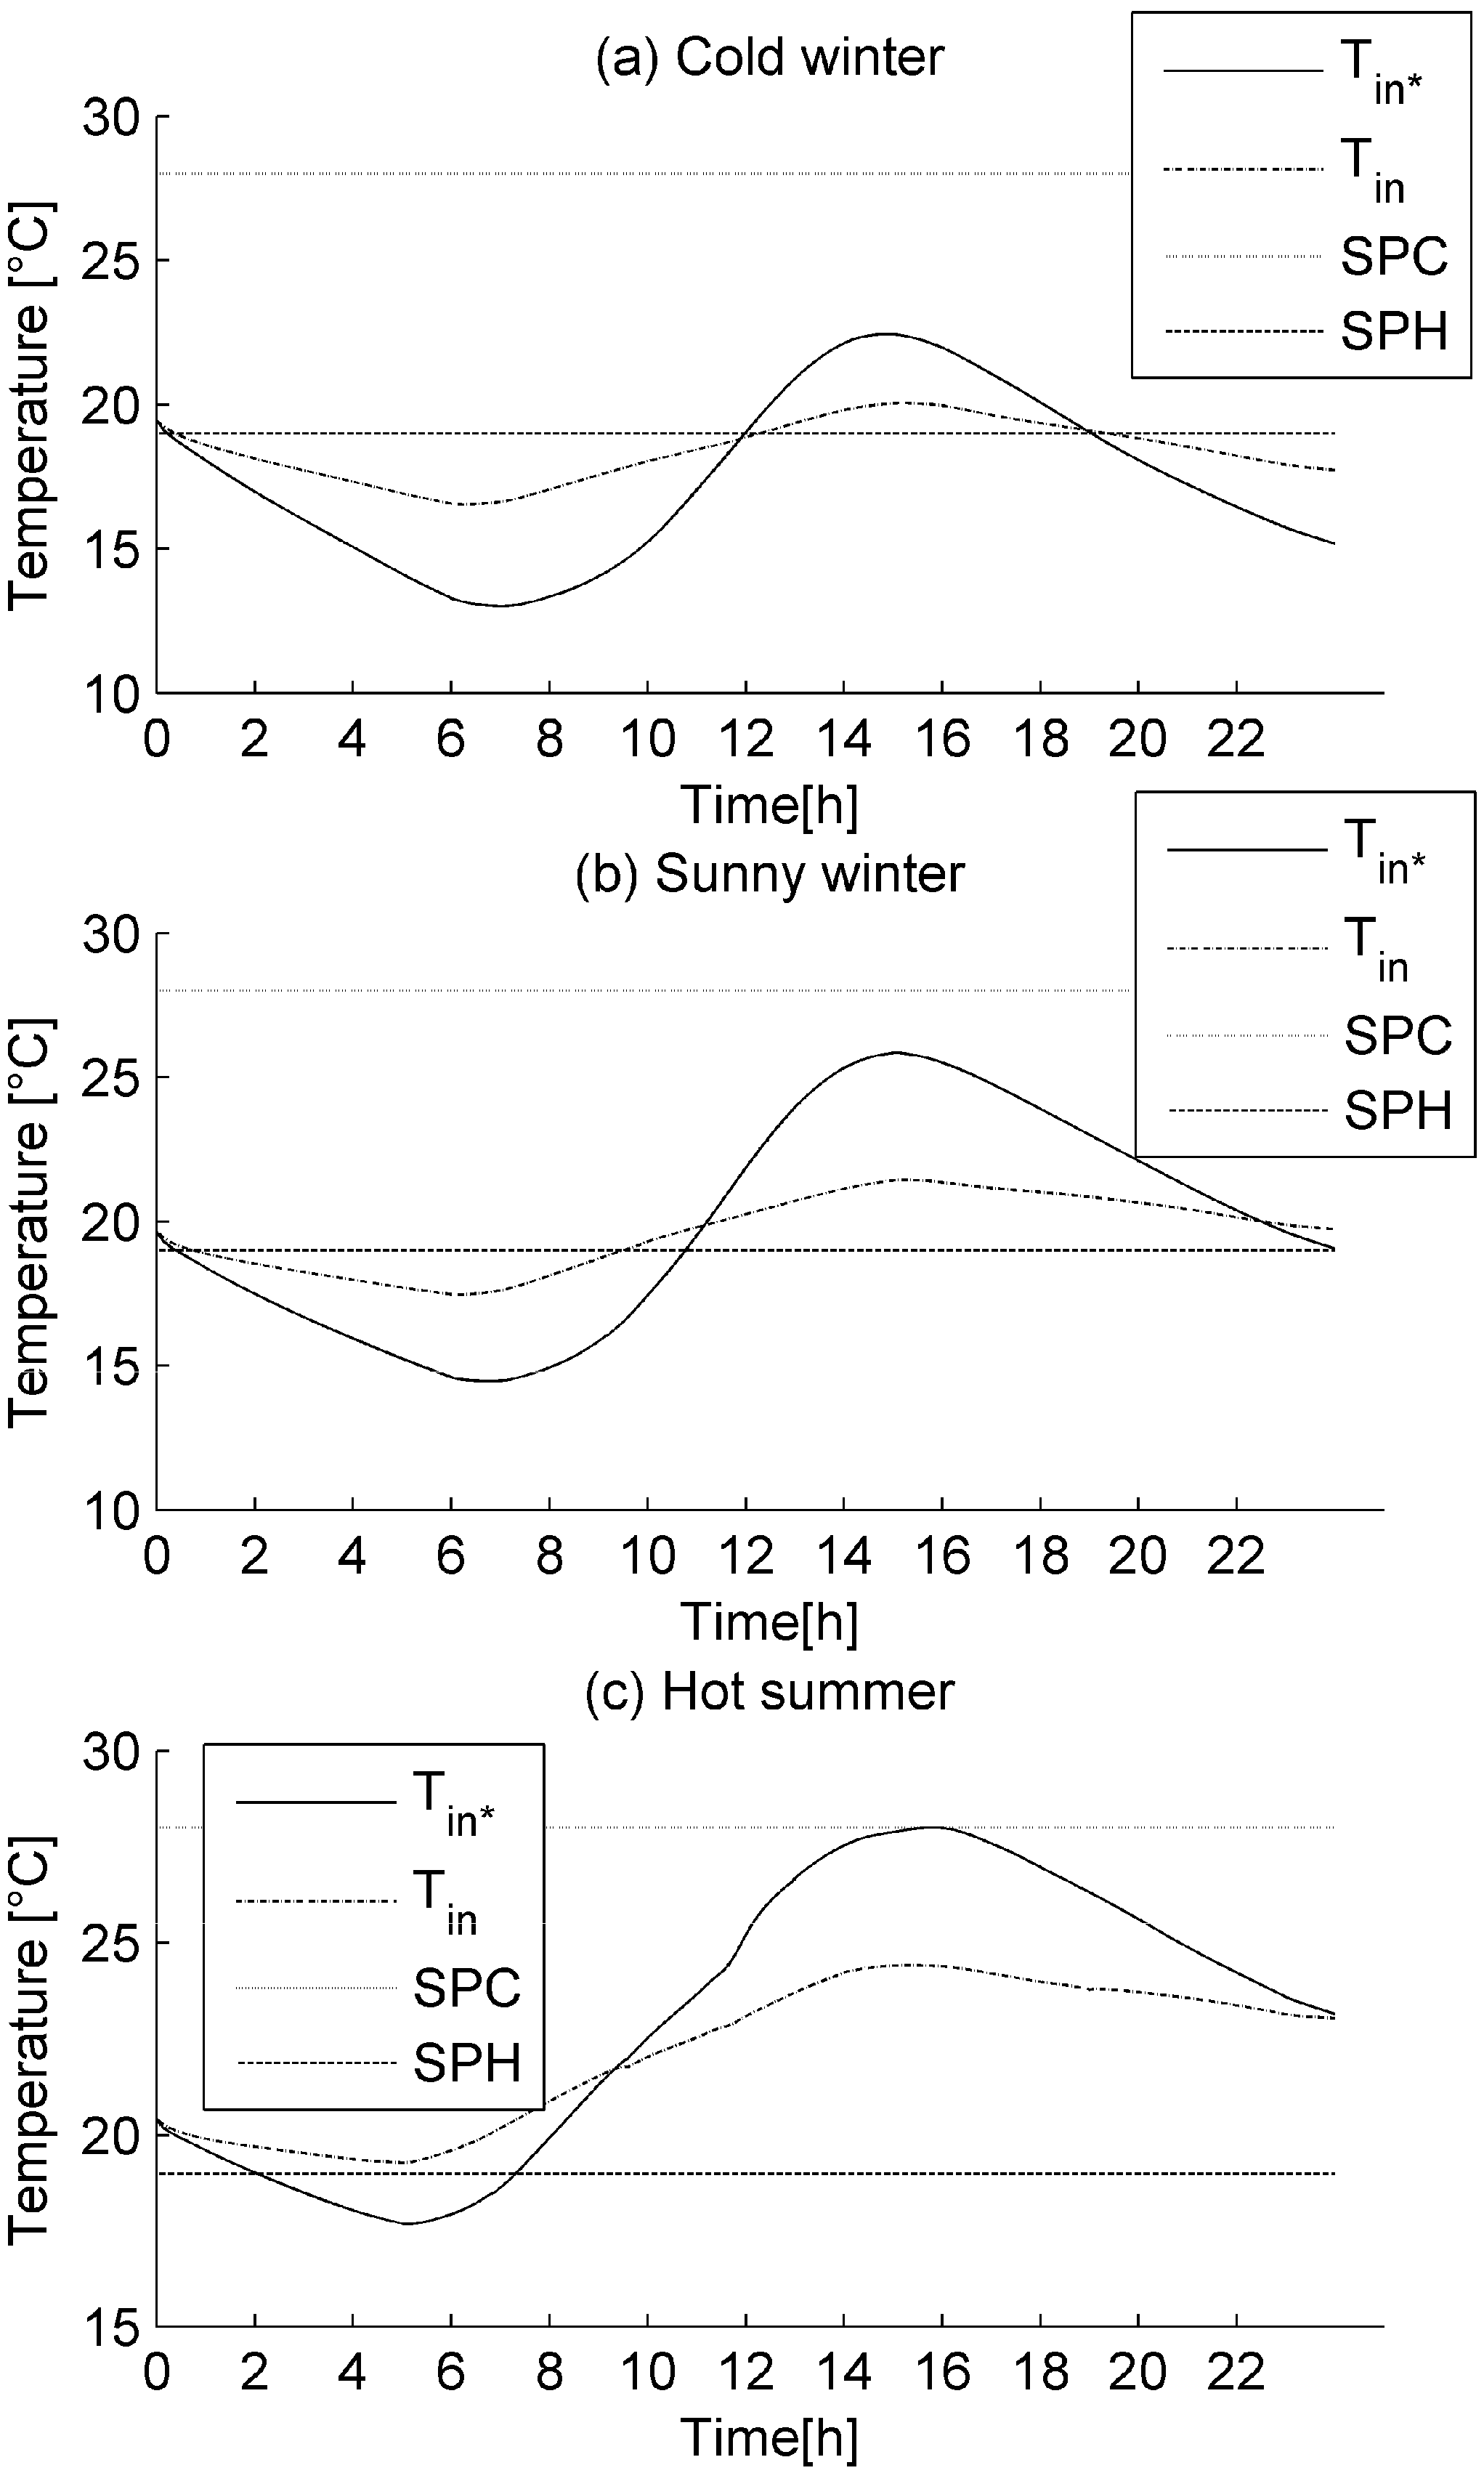
- indoor air temperature Tin; and
- -
- energy demand.
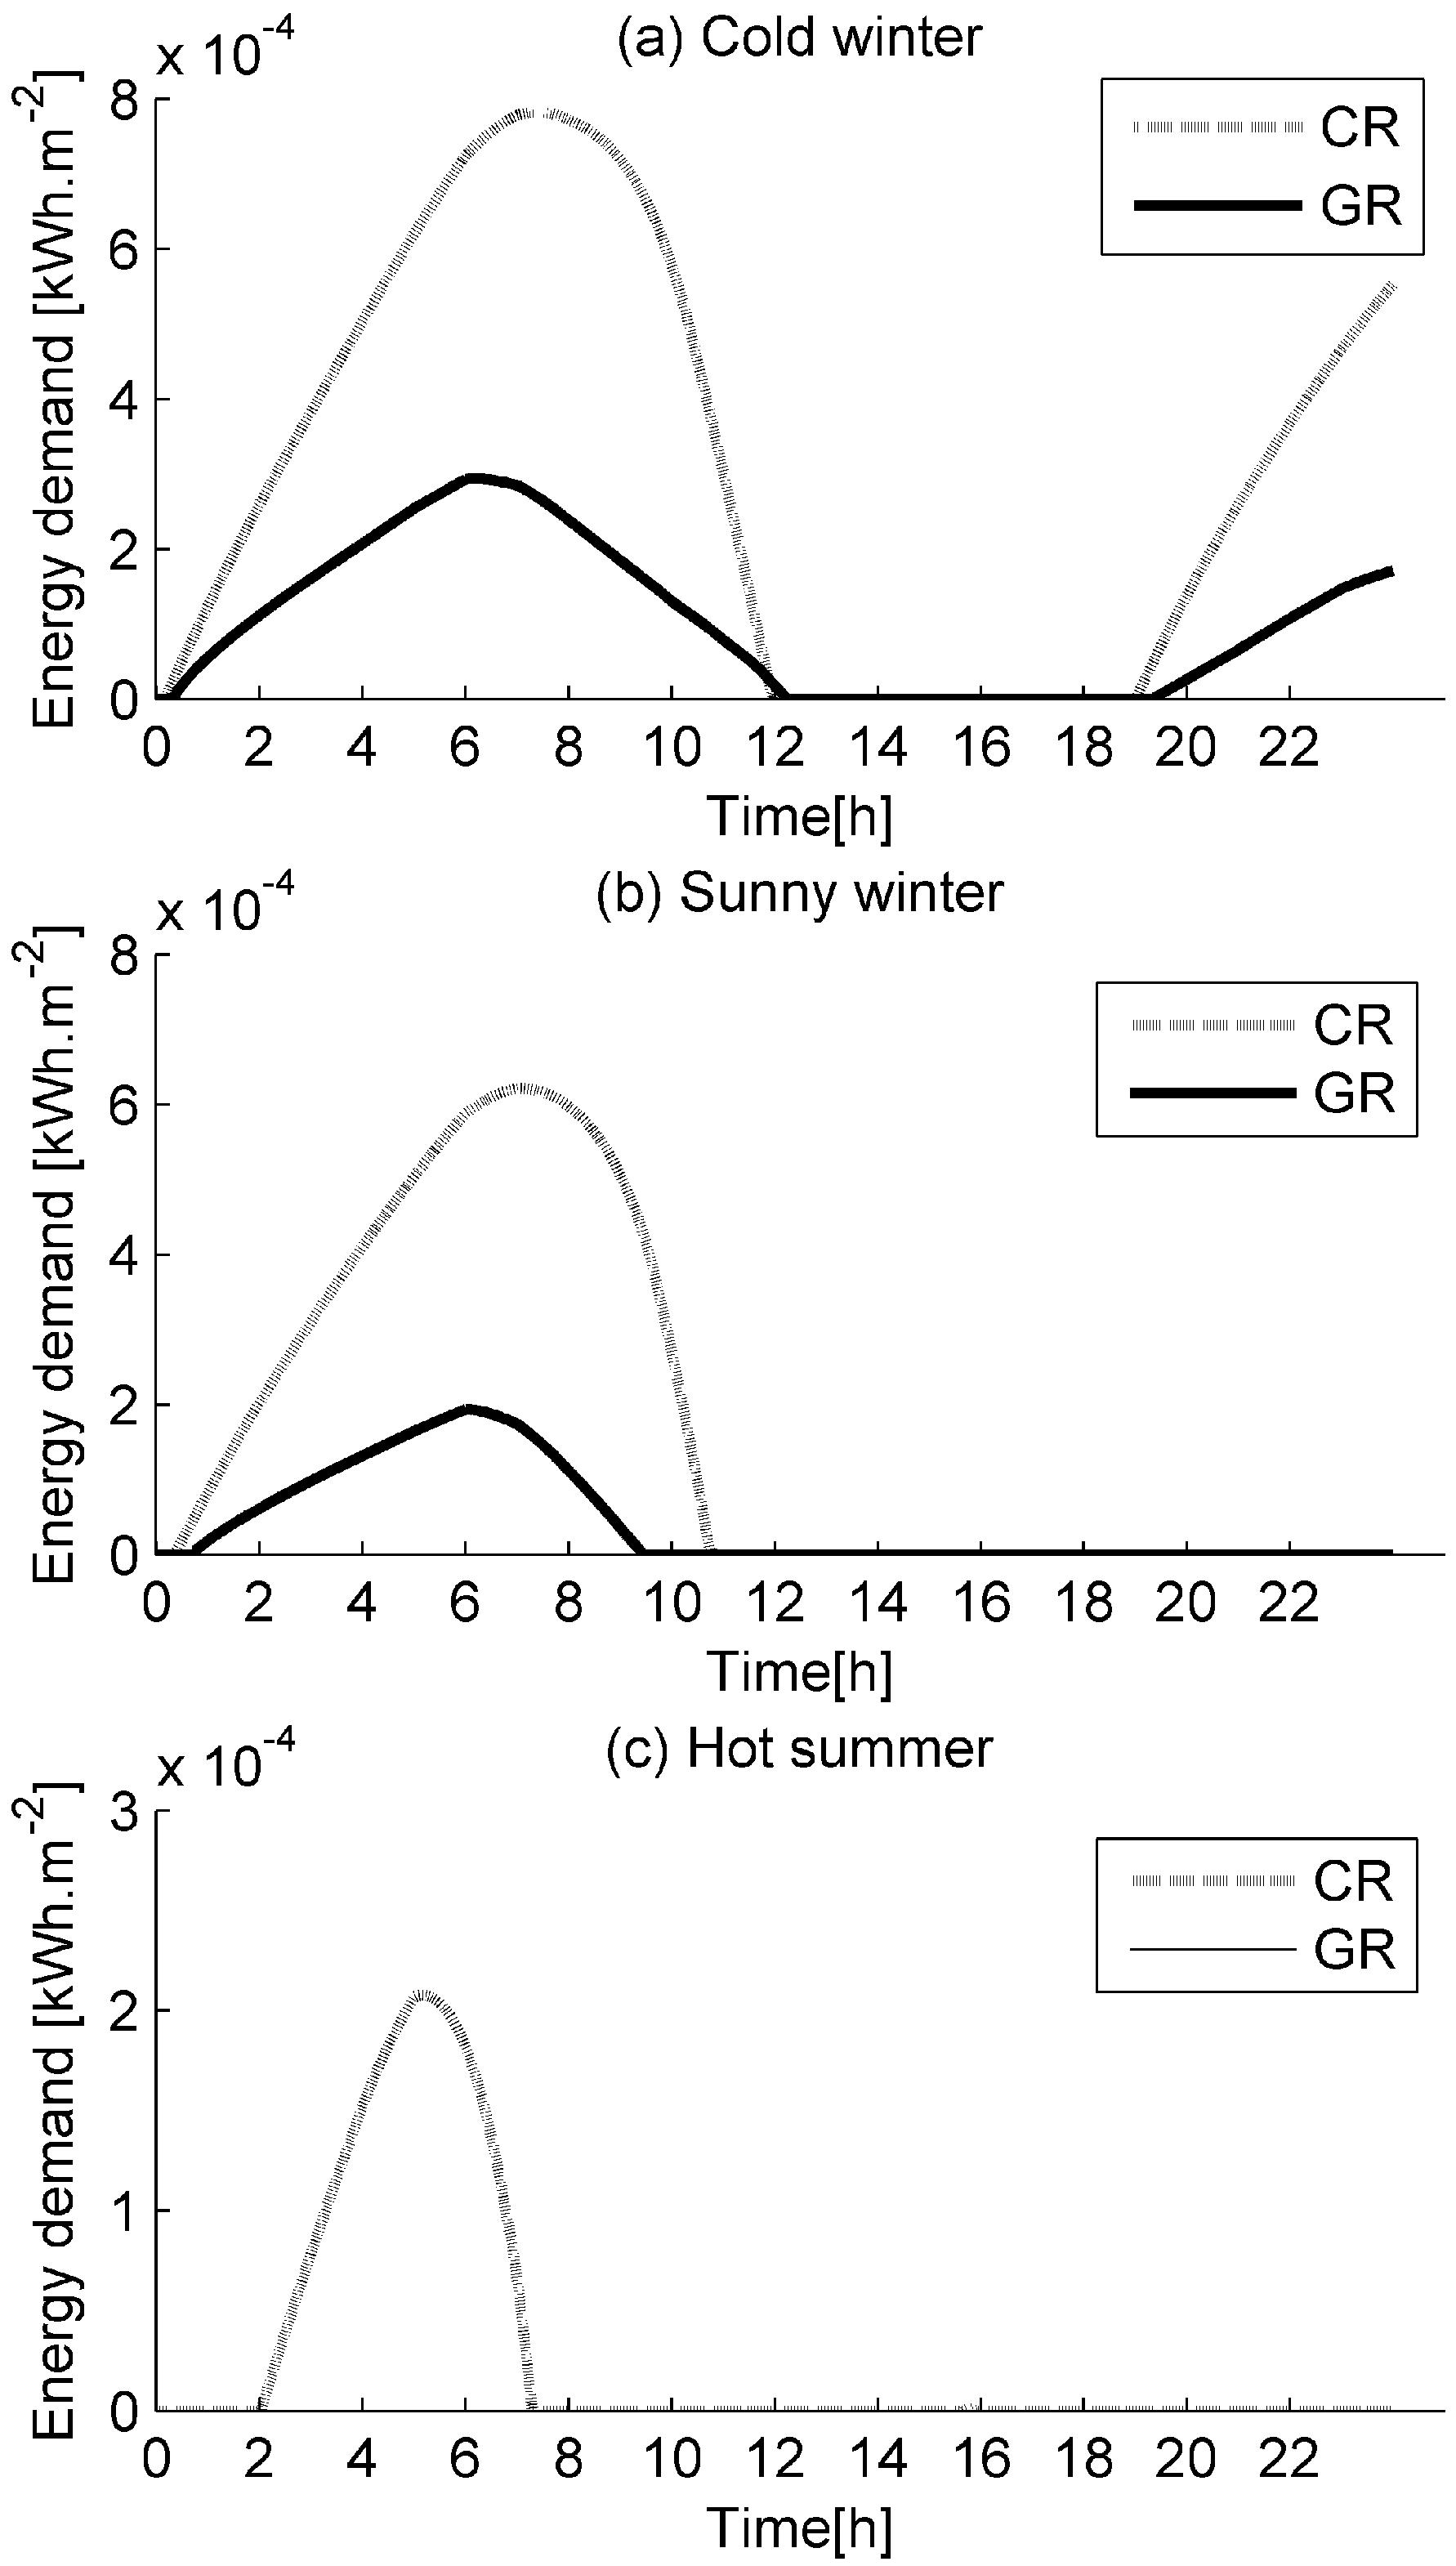
4. Results and Discussion
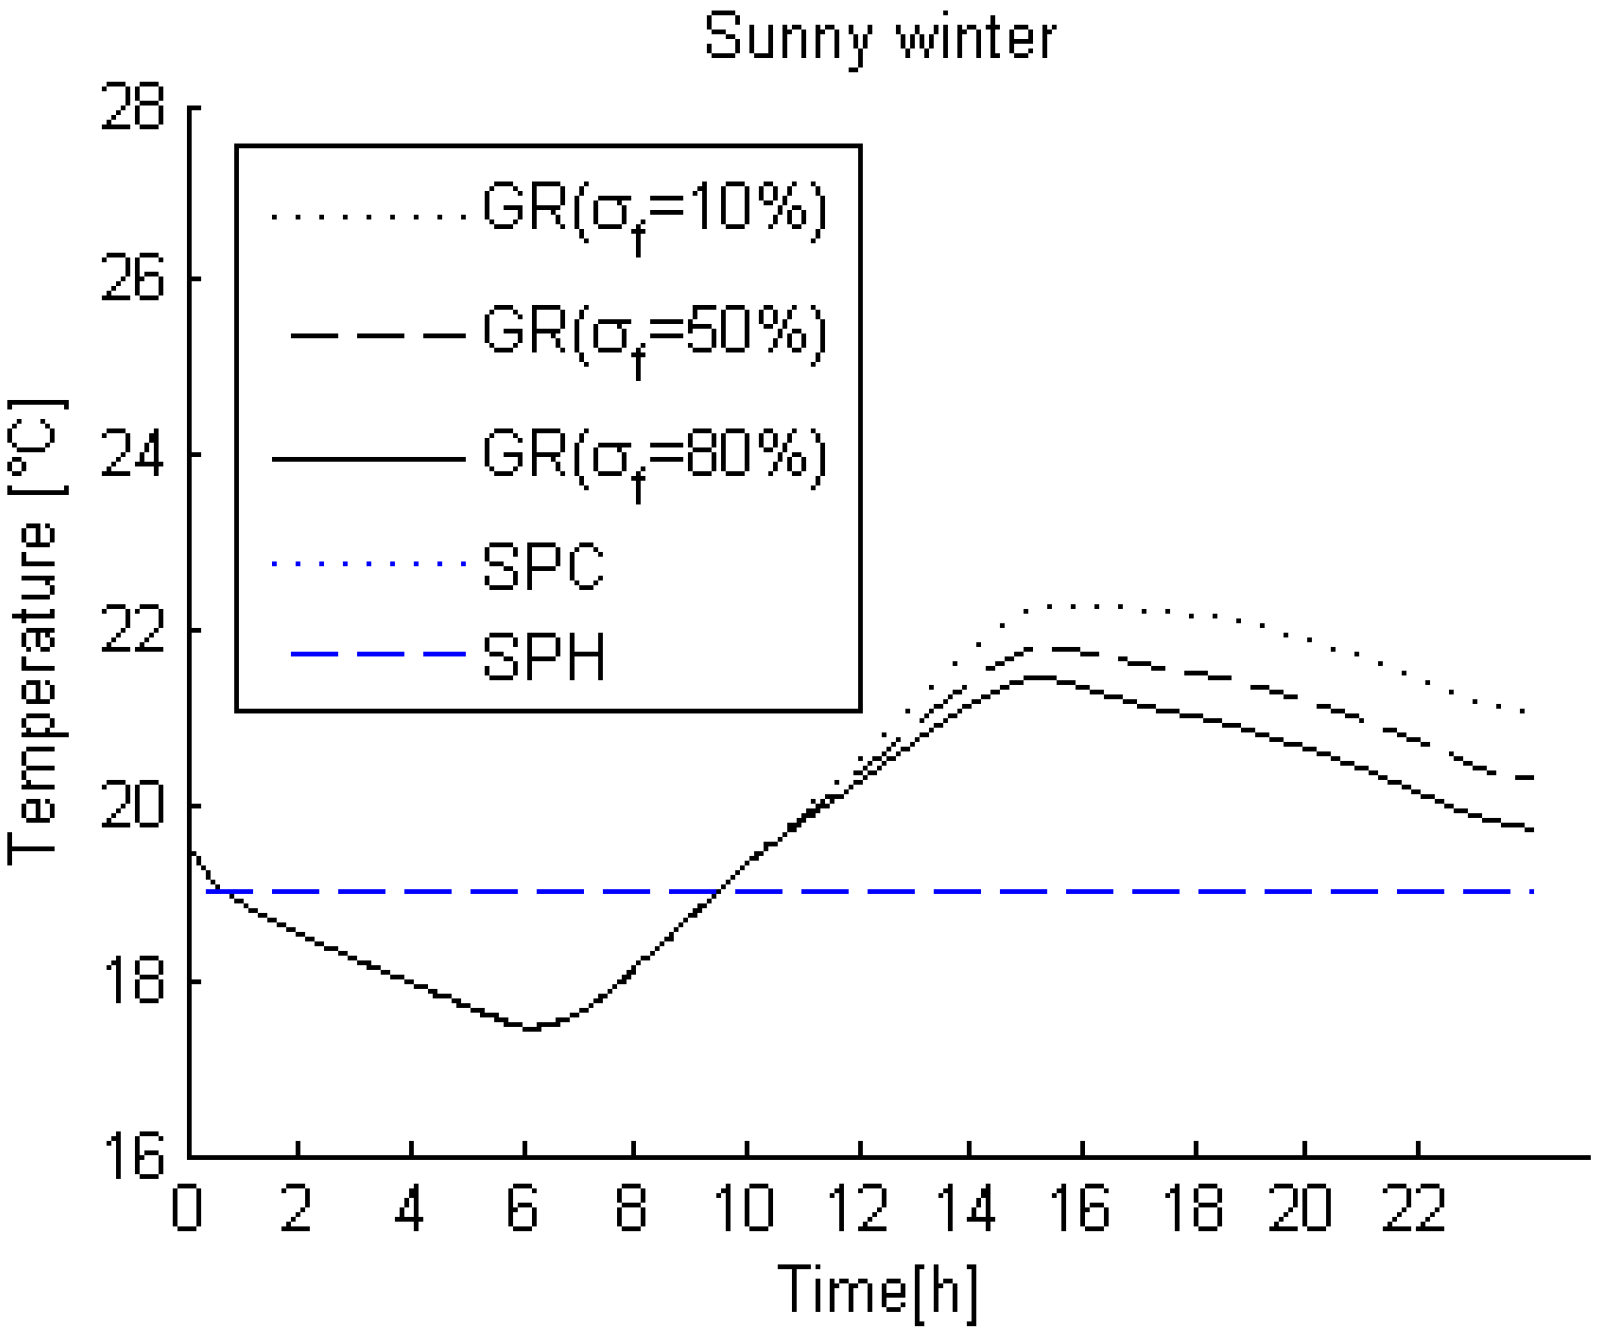
4.1. Comparison between Green and Conventional Roof Results
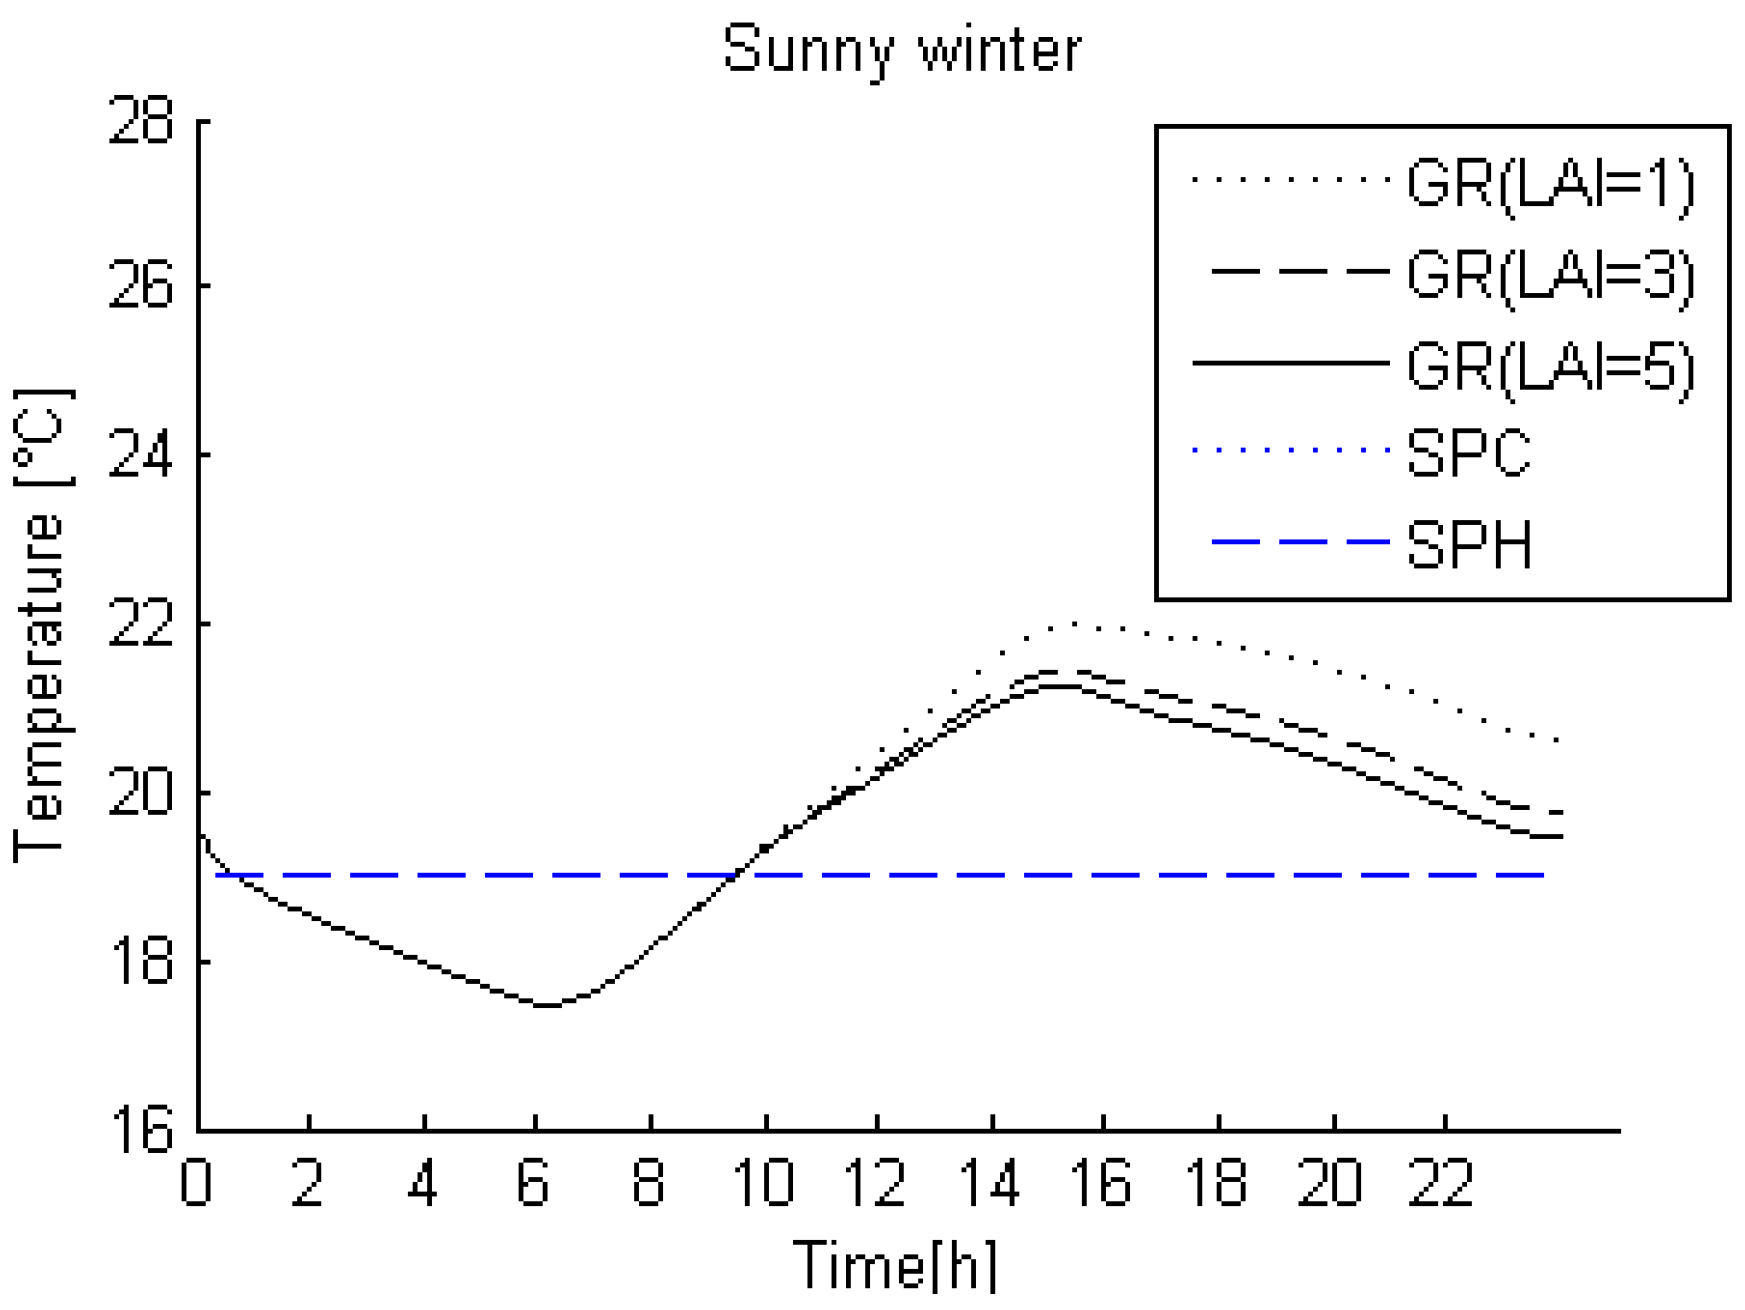
4.2. Influences of Parameters on the Indoor Air Temperature of the Building
4.2.1. Influence of the Leaf Area Index (LAI)

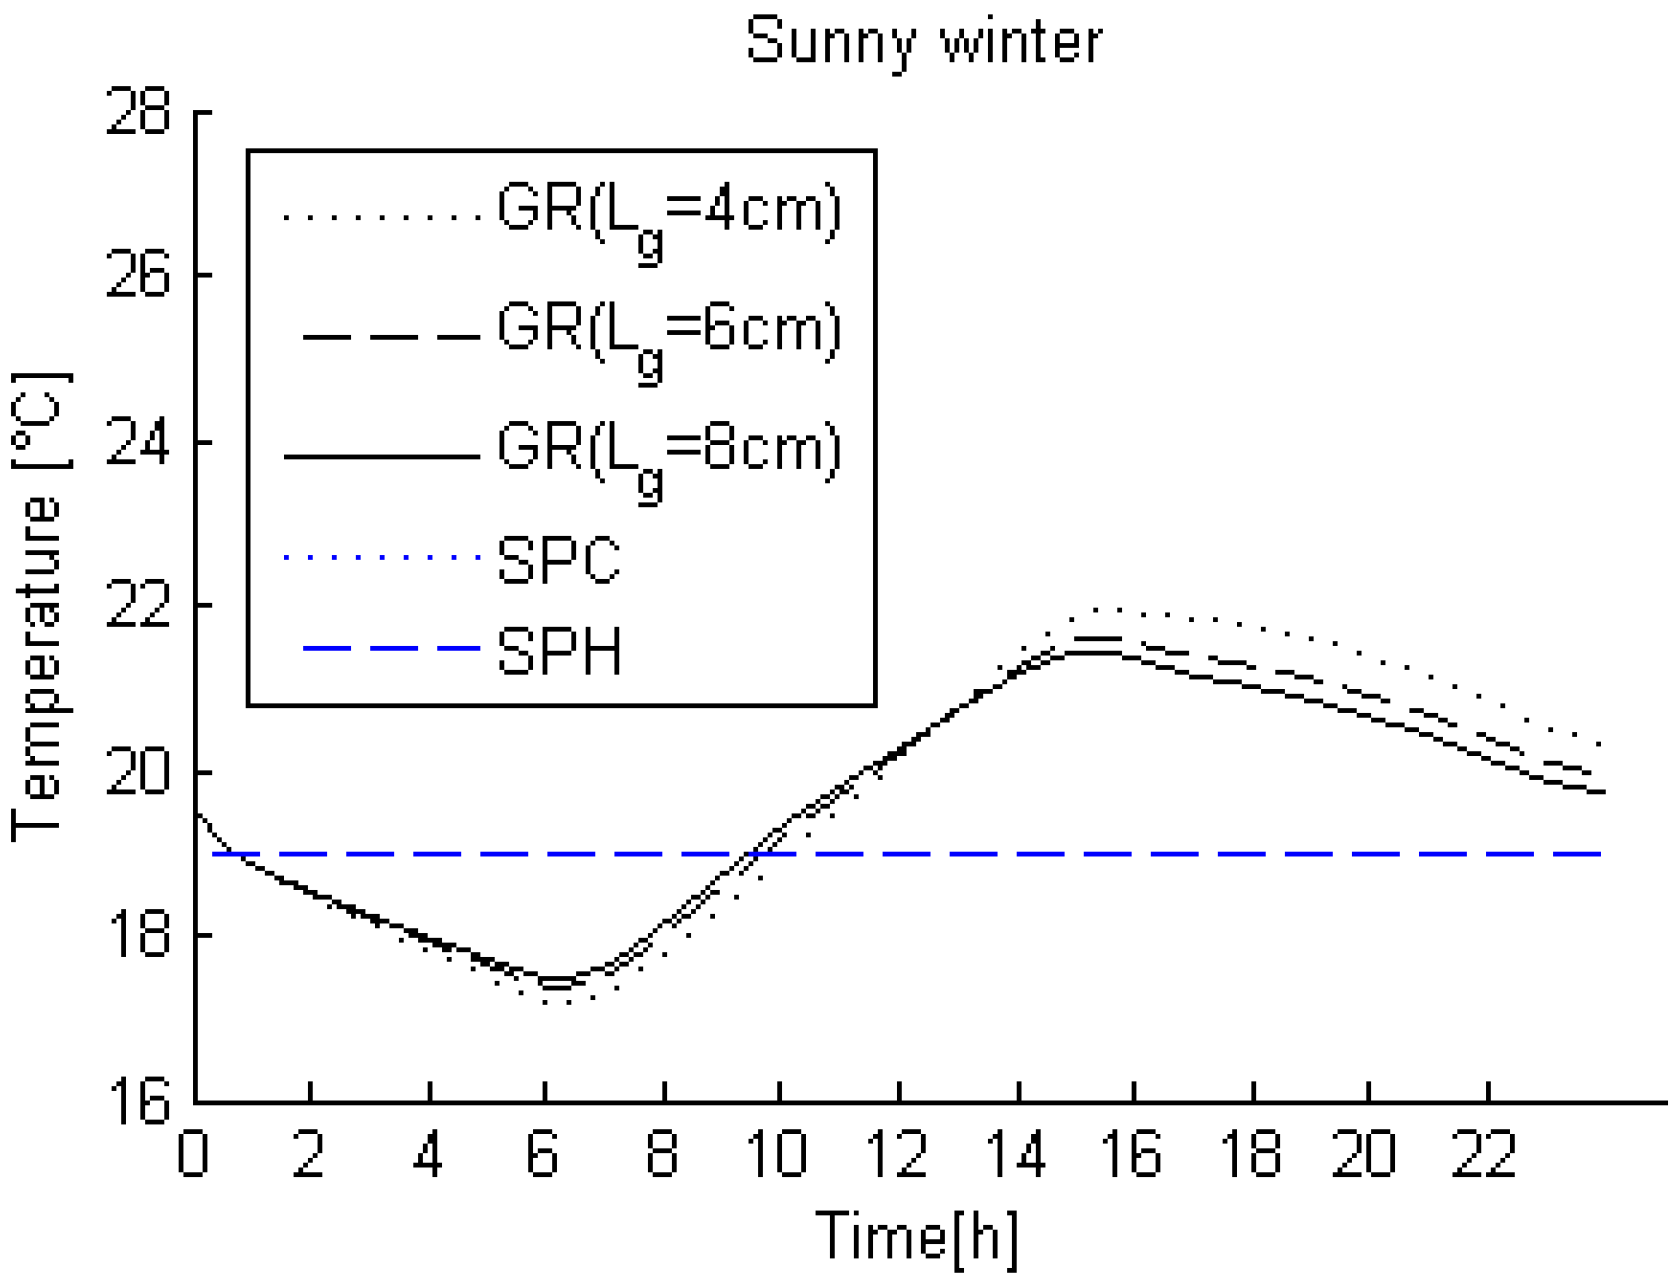
4.2.2. Influence of the Substrate Thickness (Lg)

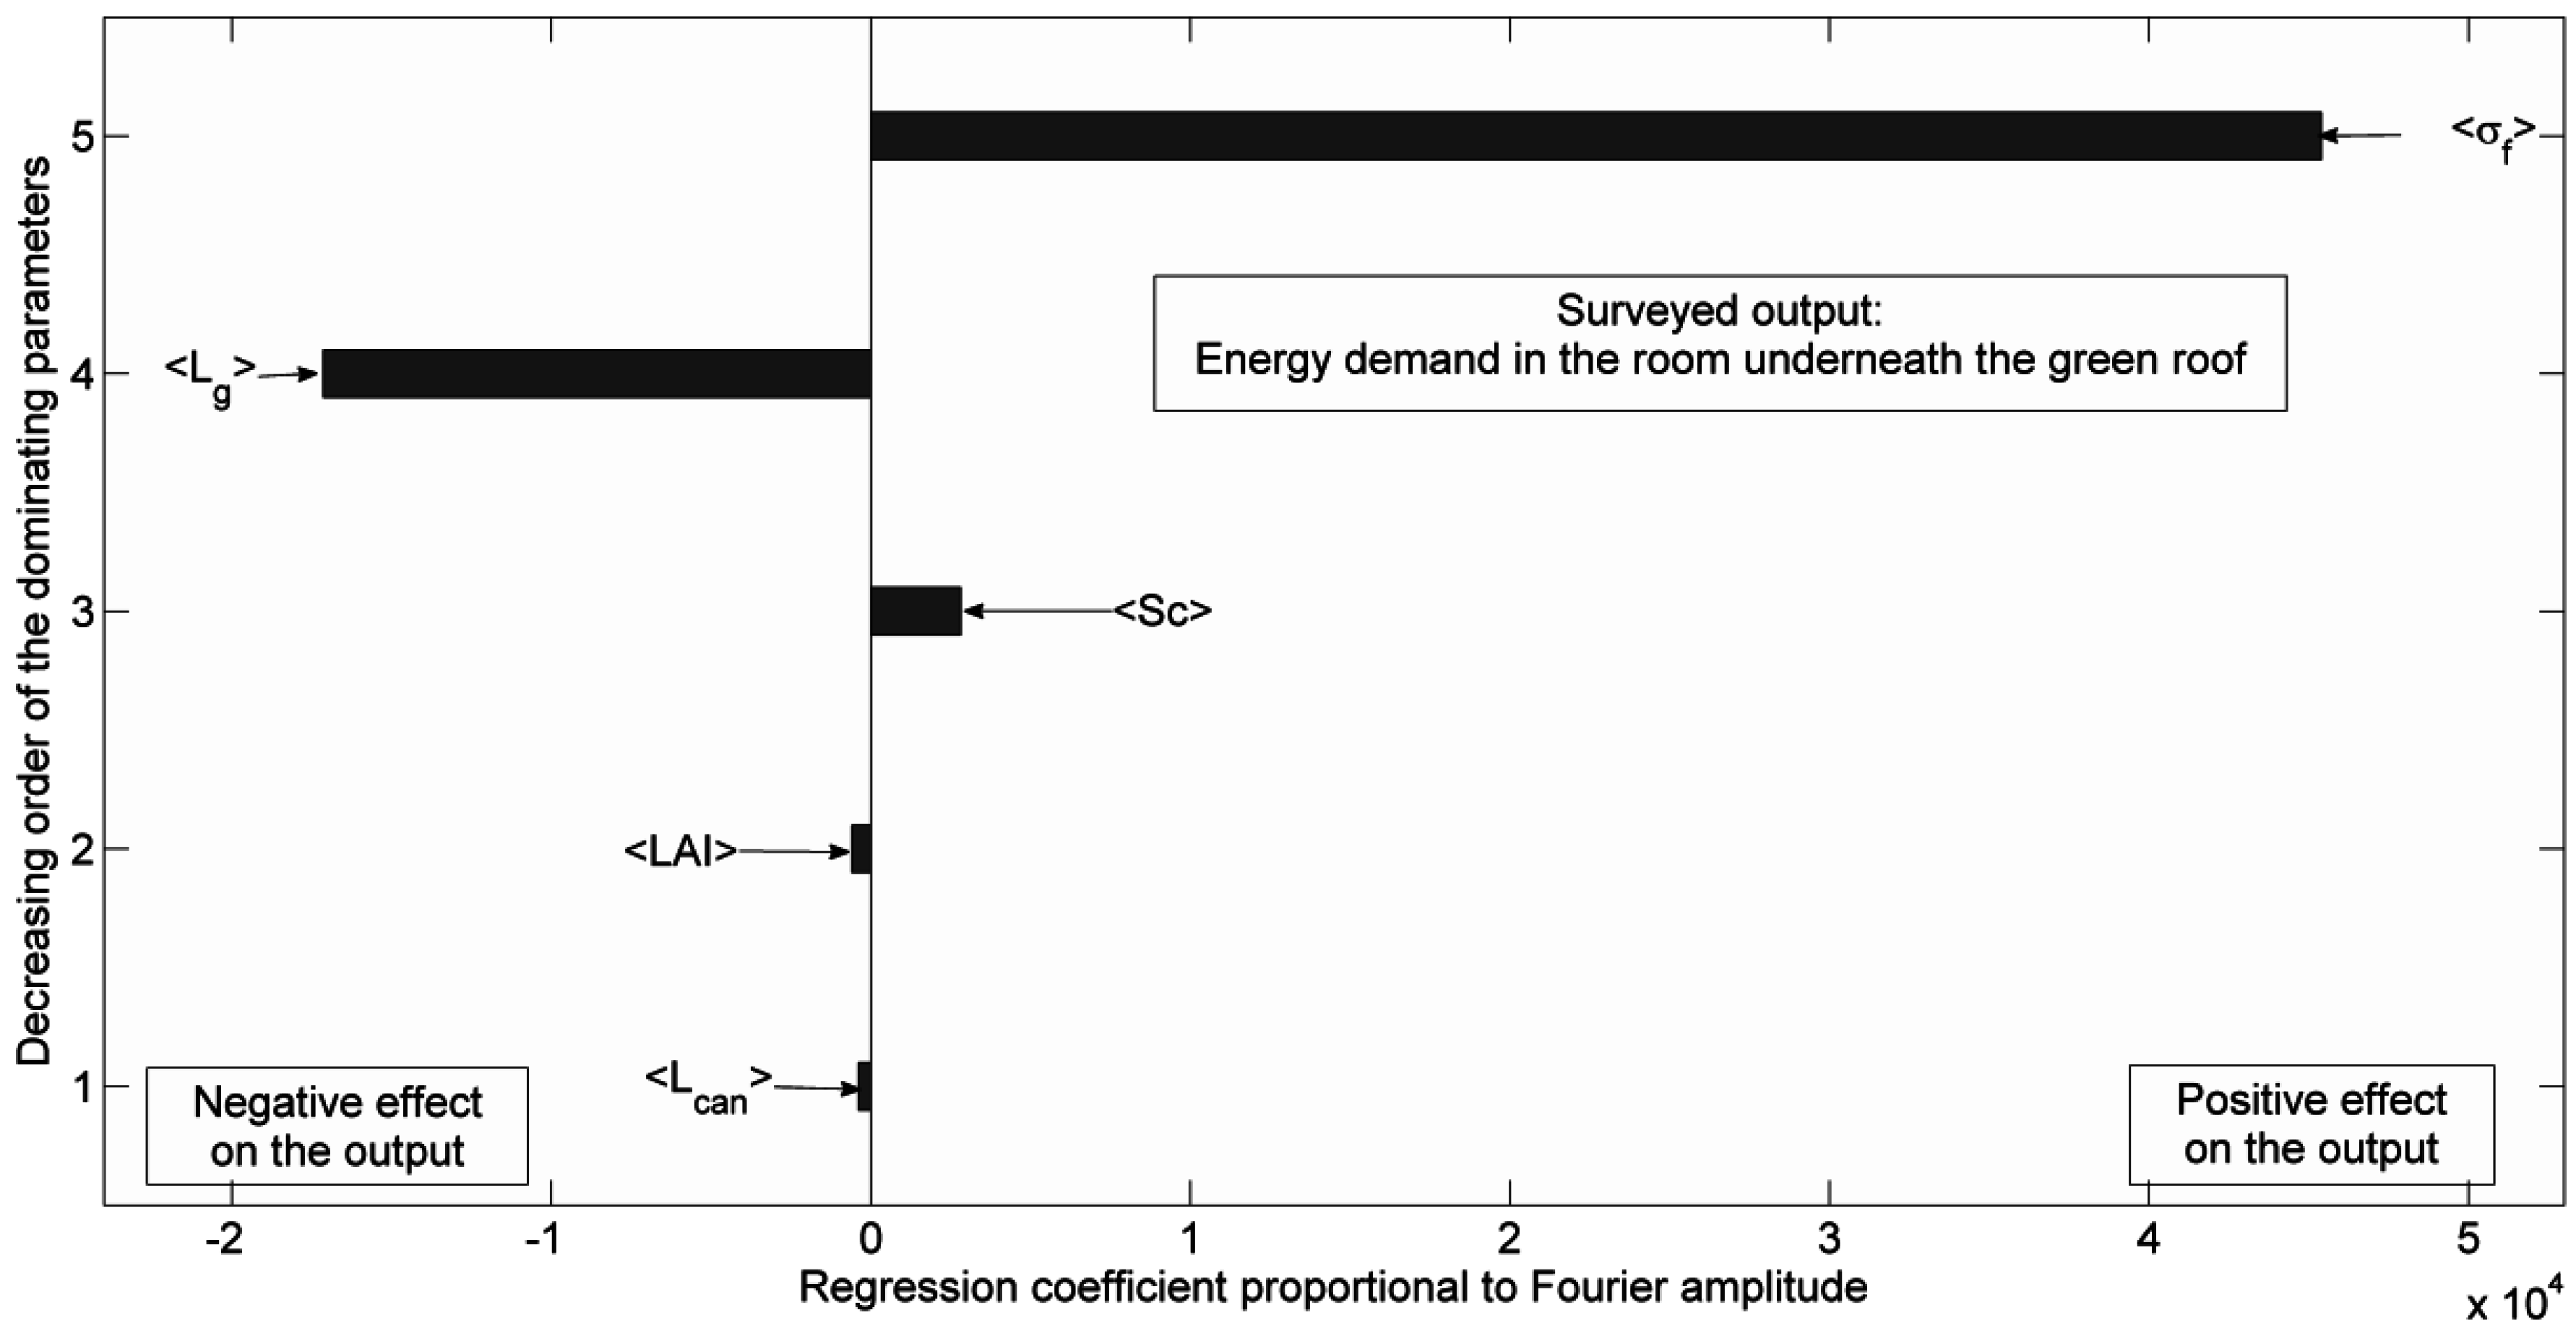
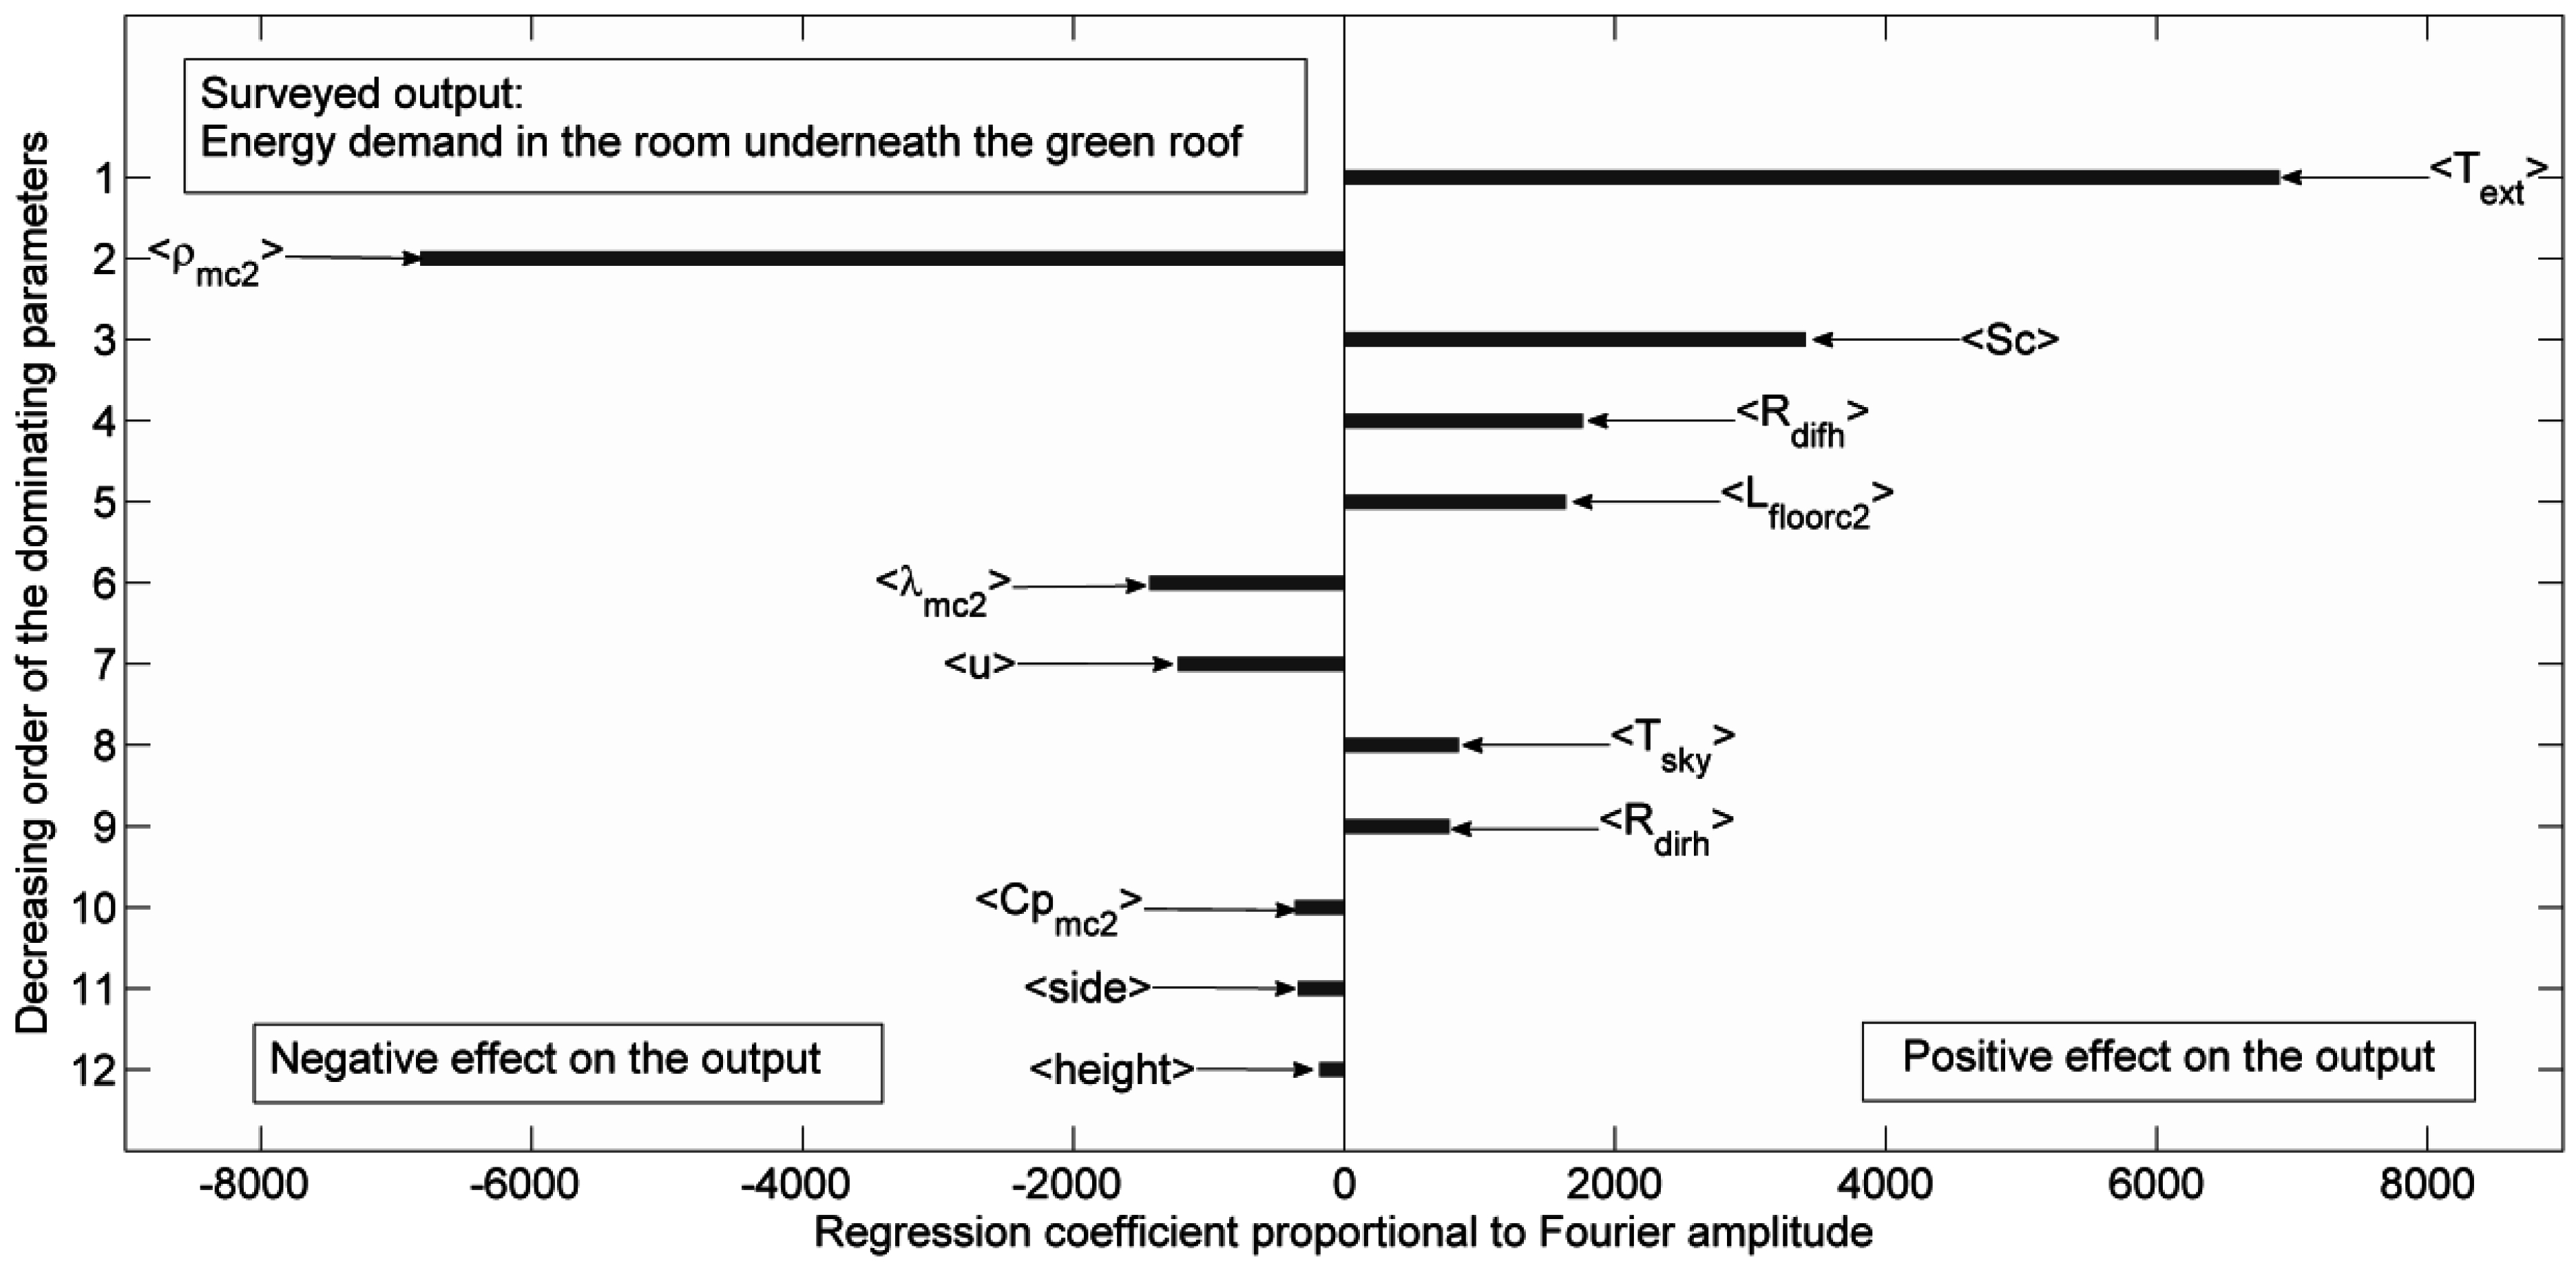
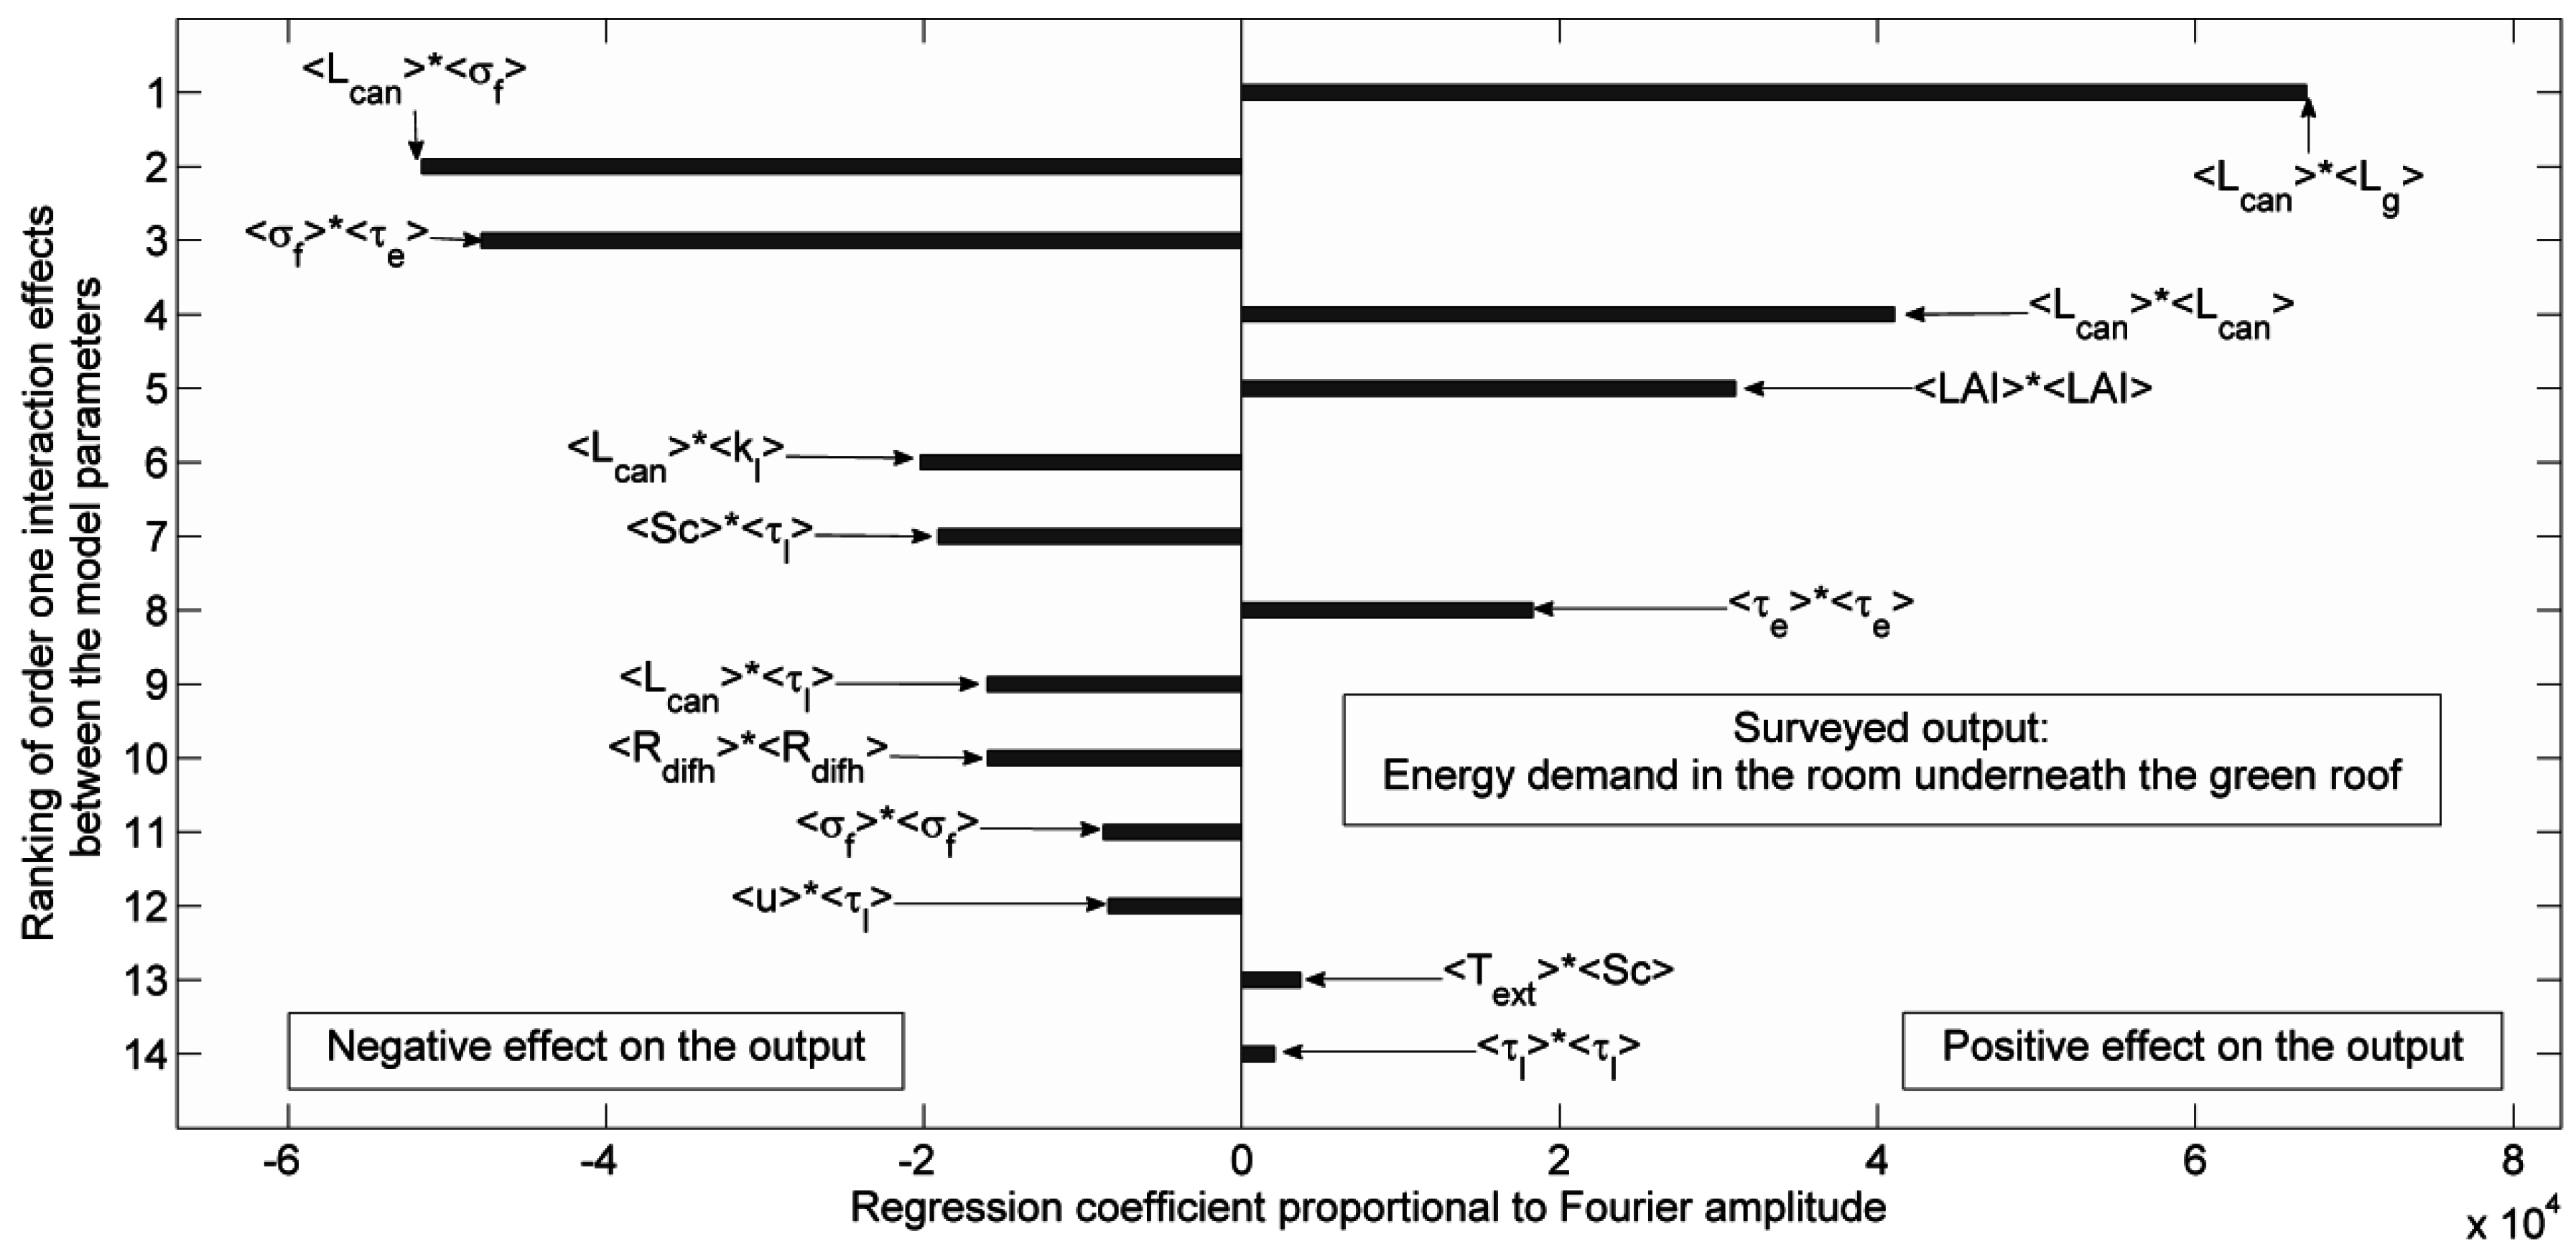
4.3. Results of the Global Sensitivity Analysis of the Surveyed Model
4.3.1. Global Sensitivity Analysis of an Insulated Green Roofed Building Model
4.3.2. Global Sensitivity Analysis of a Non-Insulated Green Roofed Building
5. Conclusions
Author Contributions
Nomenclature
| A | coefficient matrix |
| Ar | watering (kg·m−2·s−1) |
| B | column vector containing the right sides of equations |
| Cair | air specific heat (J·kg−1·K−1) |
| cj | specific heat of the wall layer j (j = 1, 2, …, N) (J·kg−1·K−1) |
| cp | specific heat (J·kg−1·K−1) |
| CDD | cooling degree days (°C·month−1) |
| CR | conventional roof |
| (ρcp)i | specific heat capacity of the subcomponent i (J·m−3·K−1) |
| df | average leaves thickness (m) |
| Dr | drainage (kg·m−2·s−1) |
| ECLO,i | interior face shortwave radiation intensity after multiple reflections (W·m−2) |
| ECLOE,i | exterior face shortwave radiation intensity after multiple reflections (W·m−2) |
| (ei-ea) | partial vapor pressure deficit between the subcomponent i and the canopy air (Pa) |
| FA | temperature fluctuation amplitude (°C) |
| GR | green roof |
| hCIj | convective exchange coefficient of the inside face of the element j (W·m−2·K−1) |
| HDD | cooling degree days (°C·month−1) |
| hg | convective coefficient between the soil top face and the canopy air (W·m−2·K−1) |
| hin | convective coefficient between the support bottom face and the indoor air (W·m−2·K−1) |
| hout | convective coefficient between the support top face and the outdoor air (W·m−2·K−1) |
| kj | thermal conductivity of the wall layer j (j = 1, 2, …, N) |
| kl | foliage extinction coefficient for longwave radiation (-) |
| L | building material thickness (m) |
| LAI | leaf area index ( ) |
| Li | thickness of the subcomponent i (m) |
| N | total number of zone and (N+1) denoting the exterior |
| NTP(i) | total number of interior walls at zone i |
| Pc | convective power dissipated at the zone i by the internal thermal loads (W·m−2) |
| pi | inclination of the wall i (rd) |
| Pr | precipitation (kg·m−2·s−1) |
| Qmass(i,n) | mass flow from the zone i to the zone n |
| Rdirh | beam solar radiation received per unit area of horizontal surface (W·m−2) |
| Rdifh | diffuse solar radiation received per unit area of horizontal surface (W·m−2) |
| re | canopy external resistance (s·m−1) |
| rs | bulk stomatal resistance(s·m−1) |
| Sc | shading coefficient of glazing (-) |
| Sj | surface of the element j (roof, walls or floor) (m2) |
| t | time variable (s) |
| Text | ambient air temperature (K) |
| Ti | temperature of the subcomponent i (K) |
| T(i) | temperatures of the air in the zone i (K) |
| Tin | nude indoor air temperature of the building with green roof (K) |
| Tin* | nude indoor air temperature of the building with conventional roof (K) |
| Tin(i) | indoor air temperature or the temperature of the zone i (K) |
| T(n) | temperatures of the air in the zone n (K) |
| Tsb* | nude support bottom face temperature (K) |
| TSI,j | inside face temperature of the element j (roof, walls or floor) (K) |
| Tst* | nude support top face temperature (K) |
| u | wind speed (m·s−1) |
| Vair(i) | indoor air volume of the zone i (m3) |
| wg | volumetric moisture content of the green roof soil or the growing substrate (m3·m−3) |
| X | column vector of the unknown variables to be determined |
| z | spatial variable (m) |
Greek letters
| αCLOE,i | shortwave radiation absorptivity of the outside face (-) |
| αCLO,i | shortwave radiation absorptivity of the inside face (-) |
| αGLOE,i | longwave radiation absorptivity of the outside face (-) |
| αj | absorptivity of the wall layer j (j = 1, 2, …, N) |
| γ | thermodynamic psychrometric constant (Pa·K−1) |
| εi | emissivity of the subcomponent i (-) |
| εst | emissivity of the support top face (-) |
| λ | thermal conductivity (W·m−1·K−1) |
| λi | thermal conductivity of the subcomponent i (i = p,g,s) (W·m−1·K−1) |
| λSE,i | thermal conductivity of the nearest layer of the outside surface (W·m−1·K−1) |
| λSI,i | thermal conductivity of the nearest layer of the inside surface (W·m−1·K−1) |
| Λ(Ti) | latent heat of vaporization at the temperature Ti (J·kg−1) |
| ρ | density (kg·m−3) |
| ρa | air density (kg·m−3) |
| ρg | reflectance of the soil (-) |
| ρi | density of subcomponent i (kg·m−3) |
| ρ∞ | reflectance of a dense canopy (-) |
| τe | air change rates within the canopy (s−1) |
| τl | transmittance of the leaf tissue (-) |
| τs | canopy shortwave transmittance (-) |
| σ | Stefan-Boltzmann Constant (5.67 × 10⁻⁸ W·m−2·K−4) |
| σf | vegetation coverage ratio (%) |
| φCLOE,i | shortwave radiation exchanged with the outside face (W·m−2) |
| φCLOI,i | shortwave radiation exchanged with the inside face (W·m−2) |
| φGLOE,i | longwave radiation exchanged with the outside face (W·m−2) |
| φs | solar shortwave irradiance at the top of the canopy (W·m−2) |
Subscripts
| a | canopy air |
| c, can | canopy |
| d | drain (dt for its top face) |
| g | green roof soil (gt for its top face) |
| in | indoor air |
| i | index related to the green roof subcomponents such that i = g, p, s, d |
| j | index of layers such that j = 1, 2, …, N |
| m | outdoor ambient air |
| mc2 | insulating layer material |
| p | canopy leaves |
| s | support (sb for its bottom face and st for its top face) |
| sky | sky vault |
Conflicts of Interest
References
- Eisenman, T. Raising the bar on green roof design. Landsc. Archit. 2006, 96, 22–29. [Google Scholar]
- Berardi, U.; GhaffarianHoseini, A.; GhaffarianHoseini, A. State-of-the-art analysis of the environmental benefits of green roofs. Appl. Energy 2014, 115, 411–428. [Google Scholar] [CrossRef]
- Mentens, J.; Raes, D.; Hermy, M. Green roofs as a tool for solving the rainwater runoff problem in the urbanized 21st century? Landsc. Urban Plan. 2006, 77, 217–226. [Google Scholar] [CrossRef]
- Fioretti, R.; Palla, A.; Lanza, L.G.; Principi, P. Green roof energy and water related performance in the Mediterranean climate. Build. Environ. 2010, 45, 1890–1904. [Google Scholar] [CrossRef]
- Yang, J.; Yu, Q.; Gong, P. Quantifying air pollution removal by green roofs in Chicago. Atmos. Environ. 2008, 42, 7266–7273. [Google Scholar] [CrossRef]
- Li, J.F.; Wai, O.W.H.; Li, Y.S.; Zhan, J.M.; Ho, Y.A.; Li, J.; Lam, E. Effect of green roof on ambient CO2 concentration. Build. Environ. 2010, 45, 2644–2651. [Google Scholar] [CrossRef]
- Van Renterghem, T.; Botteldooren, D. In-situ measurements of sound propagating over extensive green roofs. Build. Environ. 2011, 46, 729–738. [Google Scholar]
- Schrader, S.; Böning, M. Soil formation on green roofs and its contribution to urban biodiversity with emphasis on Collembolans. Pedobiologia 2006, 50, 347–356. [Google Scholar] [CrossRef]
- Brenneisen, S. Space for urban wildlife: Designing green roofs as Habitats in Switzerland. Urban Habitat. 2006, 4, 27–36. [Google Scholar]
- Feng, C.; Meng, Q.; Zhang, Y. Theoretical and experimental analysis of the energy balance of extensive green roofs. Energy Build. 2010, 42, 959–965. [Google Scholar] [CrossRef]
- Liu, K.; Minor, J. Performance Evaluation of an Extensive Green Roof. In Proceedings of Green Rooftops for Sustainable Communities, Washington, DC, USA, 5–6 May 2005; pp. 1–11.
- Ghaffarian Hoseini, A.; Dahlan, N.D.; Berardi, U.; Ghaffarian Hoseini, A.; Makaremi, N.; Ghaffarian Hoseini, M. Sustainable energy performances of green buildings: A review of current theories, implementations and challenges. Renew. Sustain. Energy Rev. 2013, 25, 1–17. [Google Scholar] [CrossRef]
- Coutts, A.; Daly, E.; Beringer, J.; Tapper, N.J. Assessing practical measures to reduce urban heat: Green and cool roofs. Build. Environ. 2013, 70, 266–276. [Google Scholar] [CrossRef]
- Alexandri, E.; Jones, P. Temperature decreases in an urban canyon due to green walls and green roofs in diverse climates. Build. Environ. 2008, 43, 480–493. [Google Scholar] [CrossRef]
- Castleton, H.F.; Stovin, V.; Beck, S.B.M.; Davison, J.B. Green roofs; building energy savings and the potential for retrofit. Energy Build. 2010, 42, 1582–1591. [Google Scholar] [CrossRef]
- Getter, K.L.; Rowe, D.B.; Cregg, B.M. Solar radiation intensity influences extensive green roof plant communities. Urban For. Urban Green. 2009, 8, 269–281. [Google Scholar] [CrossRef]
- ROOFSOL. Building in ROOFSOL: Roof Solutions for Natural Cooling; Contract No. JOR3CT960074; Commission of the European Communities, DG XII, Science, Research and Development: Brussels, Belgium, 1998. [Google Scholar]
- Niachou, A.; Papakonstantinou, K.; Santamouris, M.; Tsangrassoulis, A.; Mihalakakou, G. Analysis of the green roof thermal properties and investigation of its energy performance. Energy Build. 2001, 33, 719–729. [Google Scholar] [CrossRef]
- Spala, A.; Bagiorgas, H.S.; Assimakopoulos, M.N.; Kalavrouziotis, J.; Matthopoulos, D.; Mihalakakou, G. On the green roof system. Selection, state of art and energy potential investigation of a system installed in an office building in Athens, Greece. Renew. Energy 2008, 33, 173–177. [Google Scholar] [CrossRef]
- Cappelli, M.; Cianfrini, C.; Corcicone, M. Effects of vegetation roof on indoor temperatures. Heat Environ. 1998, 16, 85–90. [Google Scholar]
- Del Barrio, E.P. Roof components models simplification via statistical linearization and model reduction techniques. Energy Build. 1999, 29, 259–281. [Google Scholar] [CrossRef]
- Good, W. Factors in planted roof design. Constr. Specif. 1990, 43, 132. [Google Scholar]
- Wong, N.H.; Cheong, D.K.W.; Yan, H.; Soh, J.; Ong, C.L.; Sia, A. The effect of rooftop gardens on energy consumption of a commercial building in Singapore. Energy Build. 2003, 35, 353–364. [Google Scholar] [CrossRef]
- Wong, N.H.; Chen, Y.; Ong, C.L.; Sia, A. Investigation of thermal benefits of rooftop garden in the tropical environment. Build. Environ. 2003, 38, 261–270. [Google Scholar] [CrossRef]
- Williams, N.S.G.; Rayner, J.P.; Raynor, K.J. Green roofs for a wide brown land: Opportunities and barriers for rooftop greening in Australia. Urban For. Urban Green. 2010, 9, 245–251. [Google Scholar] [CrossRef]
- La Roche, P.; Berardi, U. Comfort and energy savings with active green roofs. Energy Build. 2014, 82, 492–504. [Google Scholar] [CrossRef]
- Lazzarin, R.M.; Castellotti, F.; Busato, F. Experimental measurements and numerical modelling of a green roof. Energy Build. 2005, 37, 1260–1267. [Google Scholar] [CrossRef]
- Sailor, D.J.; Elley, T.B.; Gibson, M. Exploring the building energy impacts of greenroof design decisions—A modeling study of buildings in four distinct climates. J. Build. Phys. 2011, 35, 372–391. [Google Scholar] [CrossRef]
- Del Barrio, E.P. Analysis of the green roofs cooling potential in buildings. Energy Build. 1998, 27, 179–193. [Google Scholar] [CrossRef]
- Sailor, D.J. A green roof model for building energy simulation programs. Energy Build. 2008, 40, 1466–1478. [Google Scholar] [CrossRef]
- Alexandri, E.; Jones, P. Developing a one-dimensional heat and mass transfer algorithm for describing the effect of green roof on the built environment: Comparison with experimental results. Build. Environ. 2007, 42, 2835–2849. [Google Scholar] [CrossRef]
- Djedjig, R.; Ouldboukhitine, S.; Bélarbi, R.; Bozonnet, E. Development and validation of a coupled heat and mass transfer model for green roofs. Int. Commun. Heat Mass Transf. 2012, 39, 752–761. [Google Scholar] [CrossRef]
- Morau, D.; Rakotondramiarana, H.T.; Ranaivoarisoa, T.F.; Andriamamonjy, A.L. Thermal behavior of green roof in Reunion Island: Contribution towards a net zero building. Energy Proced. 2014, 57, 1908–1921. [Google Scholar] [CrossRef]
- Rakotondramiarana, H.T. Etude théorique du séchage thermique et de la digestion anaérobie des boues des stations d'épuration-Mise au point des dispositifs pilotes de laboratoires pour la caractérisation expérimentale liée au séchage et à la méthanisation des boues. In PhD Dissertation; University of Antananarivo: Antananarivo, Madagascar, January 2004. Available online: http://theses.recherches.gov.mg/pdfs/rakotondramiaranaherytiana_pc_doc3_04.pdf (accessed on 7 January 2015). [Google Scholar]
- Matlab R2010a. High-performance Numerical Computation and Visualization Software, The Mathworks, Inc.: Natick, MA, USA, 2010.
- Deardorff, J.W. Efficient prediction of ground surface temperature and moisture, with inclusion of a layer of vegetation. J. Geophys. Res. 1978, 83, 1889–1903. [Google Scholar] [CrossRef]
- Rakotondramiarana, H.T.; Andriamamonjy, A.L. Matlab automation algorithm for performing global sensitivity analysis of complex system models with a derived FAST method. J. Comput. Model. 2013, 3, 17–56. [Google Scholar]
- Jaffal, I.; Ouldboukhitine, S.; Belarbi, R. A comprehensive study of the impact of green roofs on building energy performance. Renew. Energy 2012, 43, 157–164. [Google Scholar] [CrossRef]
- Kotsiris, G.; Androutsopoulos, A.; Polychroni, E.; Nektarios, P.A. Dynamic U-value estimation and energy simulation for green roofs. Energy Build. 2012, 45, 240–249. [Google Scholar] [CrossRef]
© 2015 by the authors; licensee MDPI, Basel, Switzerland. This article is an open access article distributed under the terms and conditions of the Creative Commons Attribution license (http://creativecommons.org/licenses/by/4.0/).
Share and Cite
Rakotondramiarana, H.T.; Ranaivoarisoa, T.F.; Morau, D. Dynamic Simulation of the Green Roofs Impact on Building Energy Performance, Case Study of Antananarivo, Madagascar. Buildings 2015, 5, 497-520. https://doi.org/10.3390/buildings5020497
Rakotondramiarana HT, Ranaivoarisoa TF, Morau D. Dynamic Simulation of the Green Roofs Impact on Building Energy Performance, Case Study of Antananarivo, Madagascar. Buildings. 2015; 5(2):497-520. https://doi.org/10.3390/buildings5020497
Chicago/Turabian StyleRakotondramiarana, Hery Tiana, Tojo Fanomezana Ranaivoarisoa, and Dominique Morau. 2015. "Dynamic Simulation of the Green Roofs Impact on Building Energy Performance, Case Study of Antananarivo, Madagascar" Buildings 5, no. 2: 497-520. https://doi.org/10.3390/buildings5020497
APA StyleRakotondramiarana, H. T., Ranaivoarisoa, T. F., & Morau, D. (2015). Dynamic Simulation of the Green Roofs Impact on Building Energy Performance, Case Study of Antananarivo, Madagascar. Buildings, 5(2), 497-520. https://doi.org/10.3390/buildings5020497