
The Design and Simulation of Natural Personalised Ventilation (NPV) System for Multi-Bed Hospital Wards


Abstract
:1. Introduction
1.1. Performance of Displacement Ventilation in Clinical Spaces
1.2. Personalised Ventilation (PV): Mechanical and Passive Options for Mixing Regime

2. Materials and Methods
2.1. The CFD Application and Its Governing Equations
2.2. Indoor Air Quality Metrics
2.3. Boundary Conditions for CFD Models
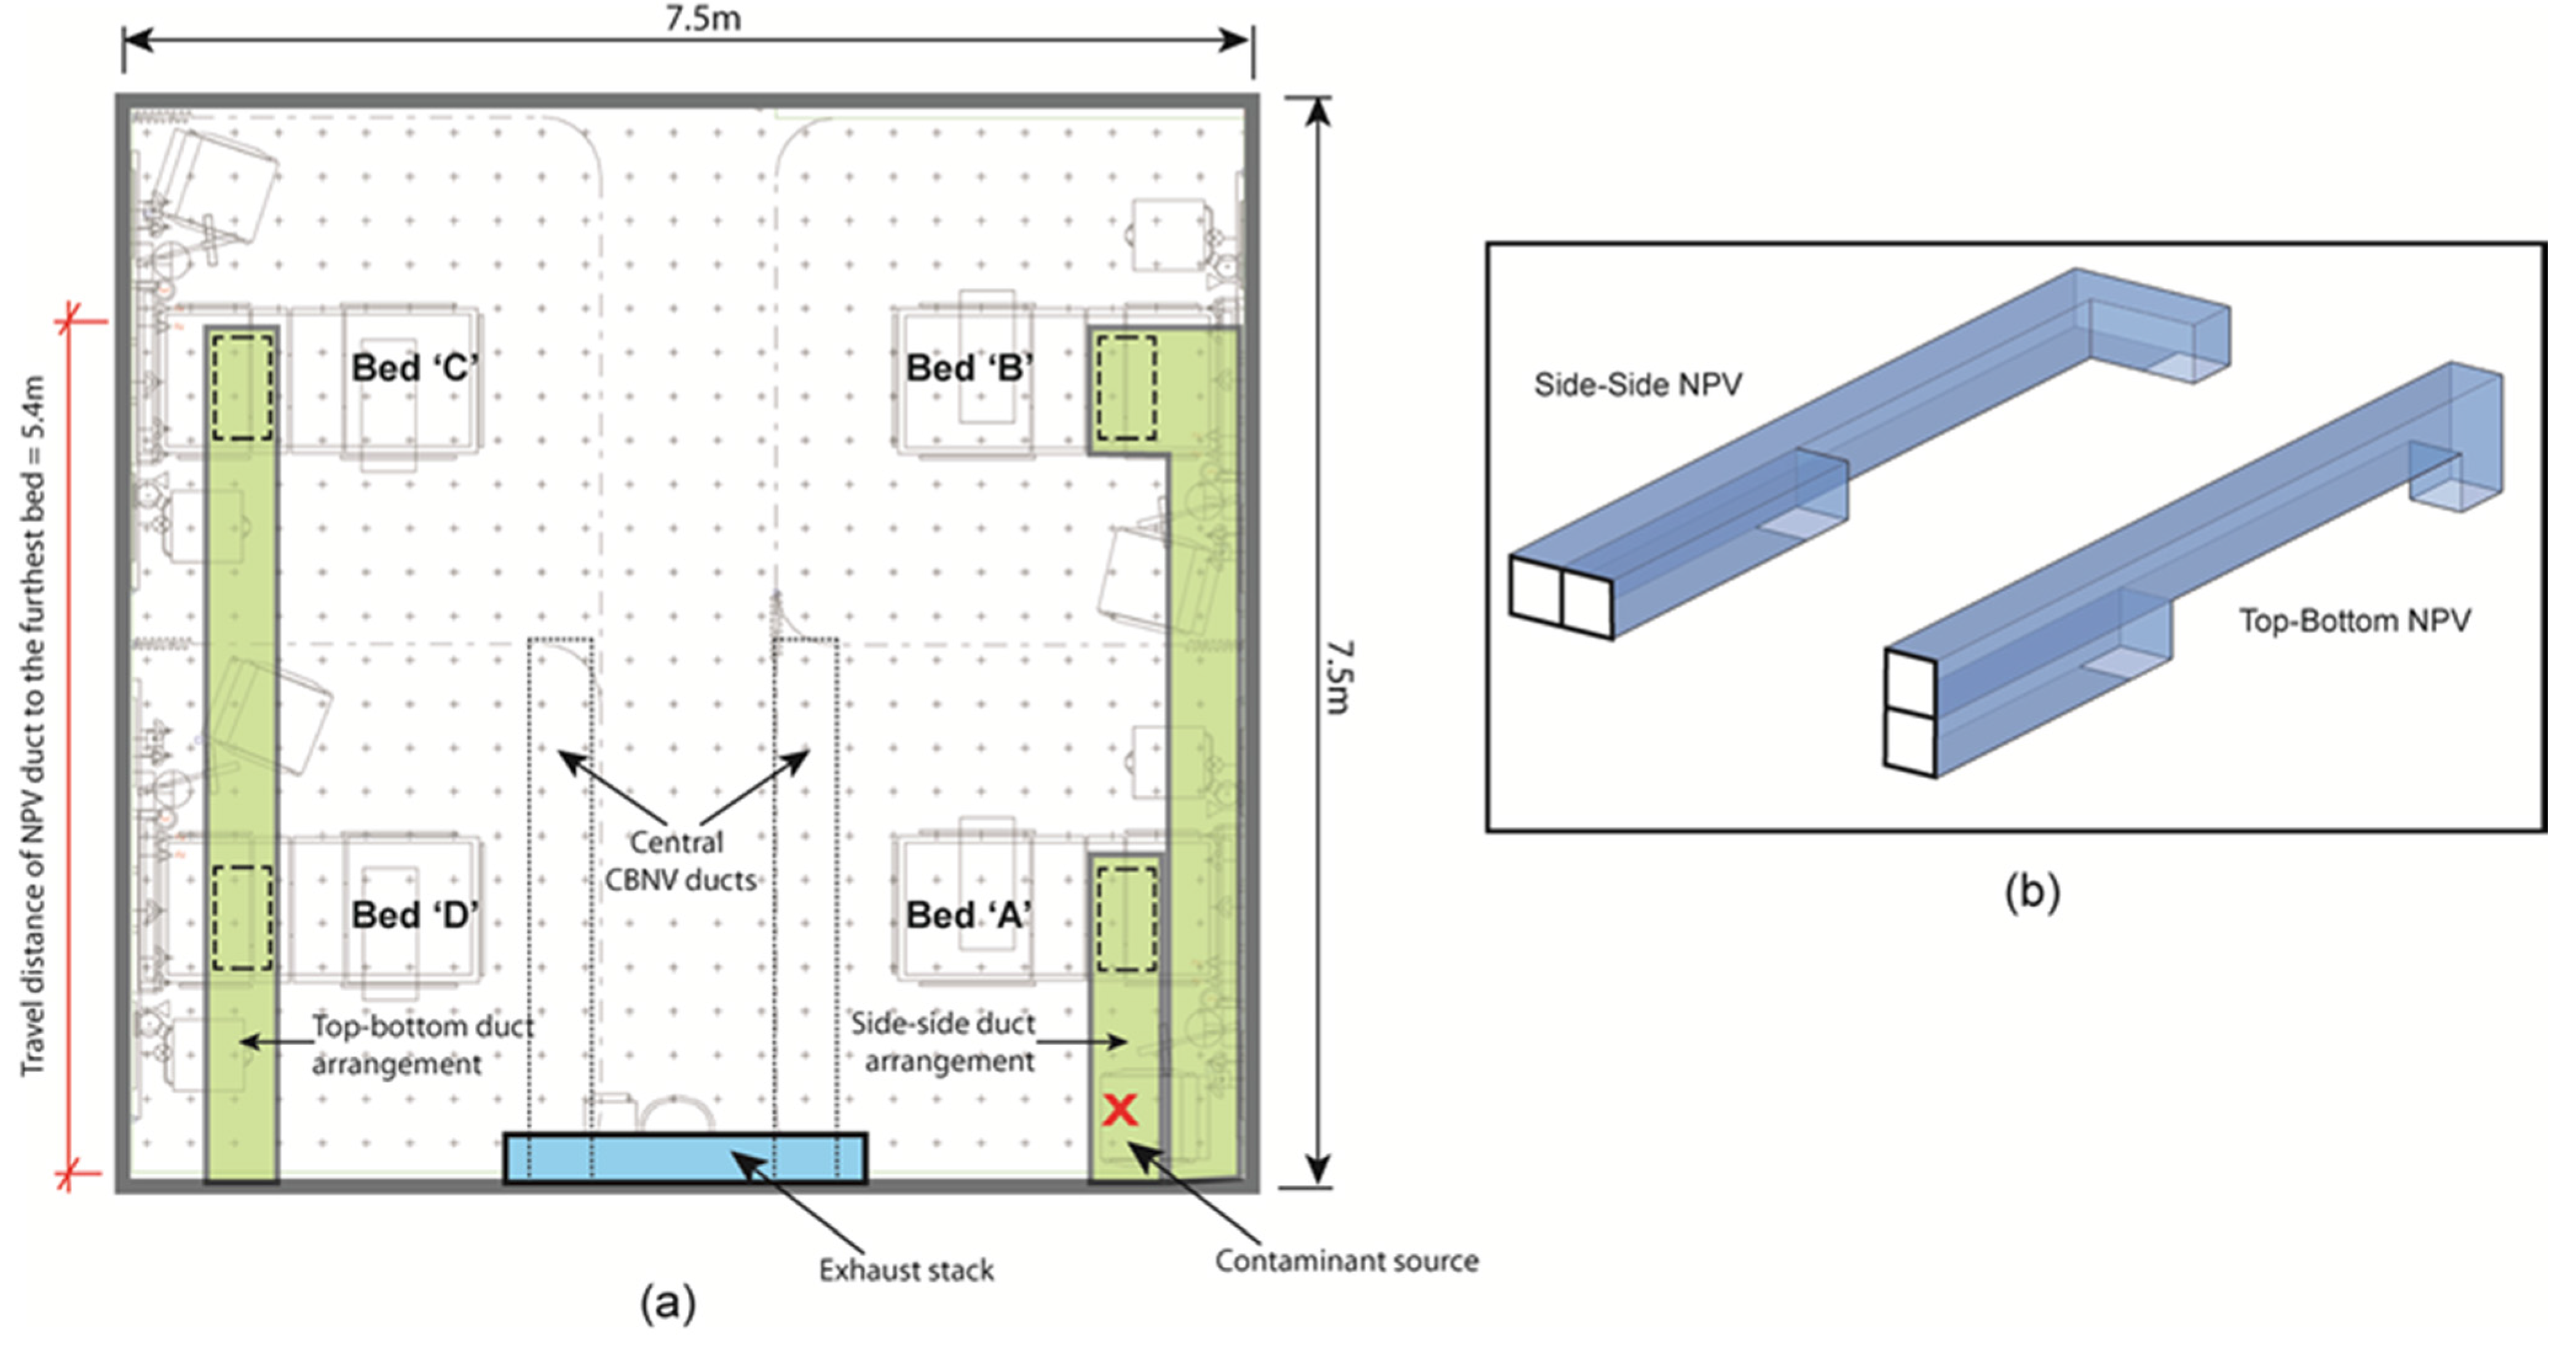
3. Study 1: The ADB Ward
3.1. Architectural Considerations, Materials and Methods

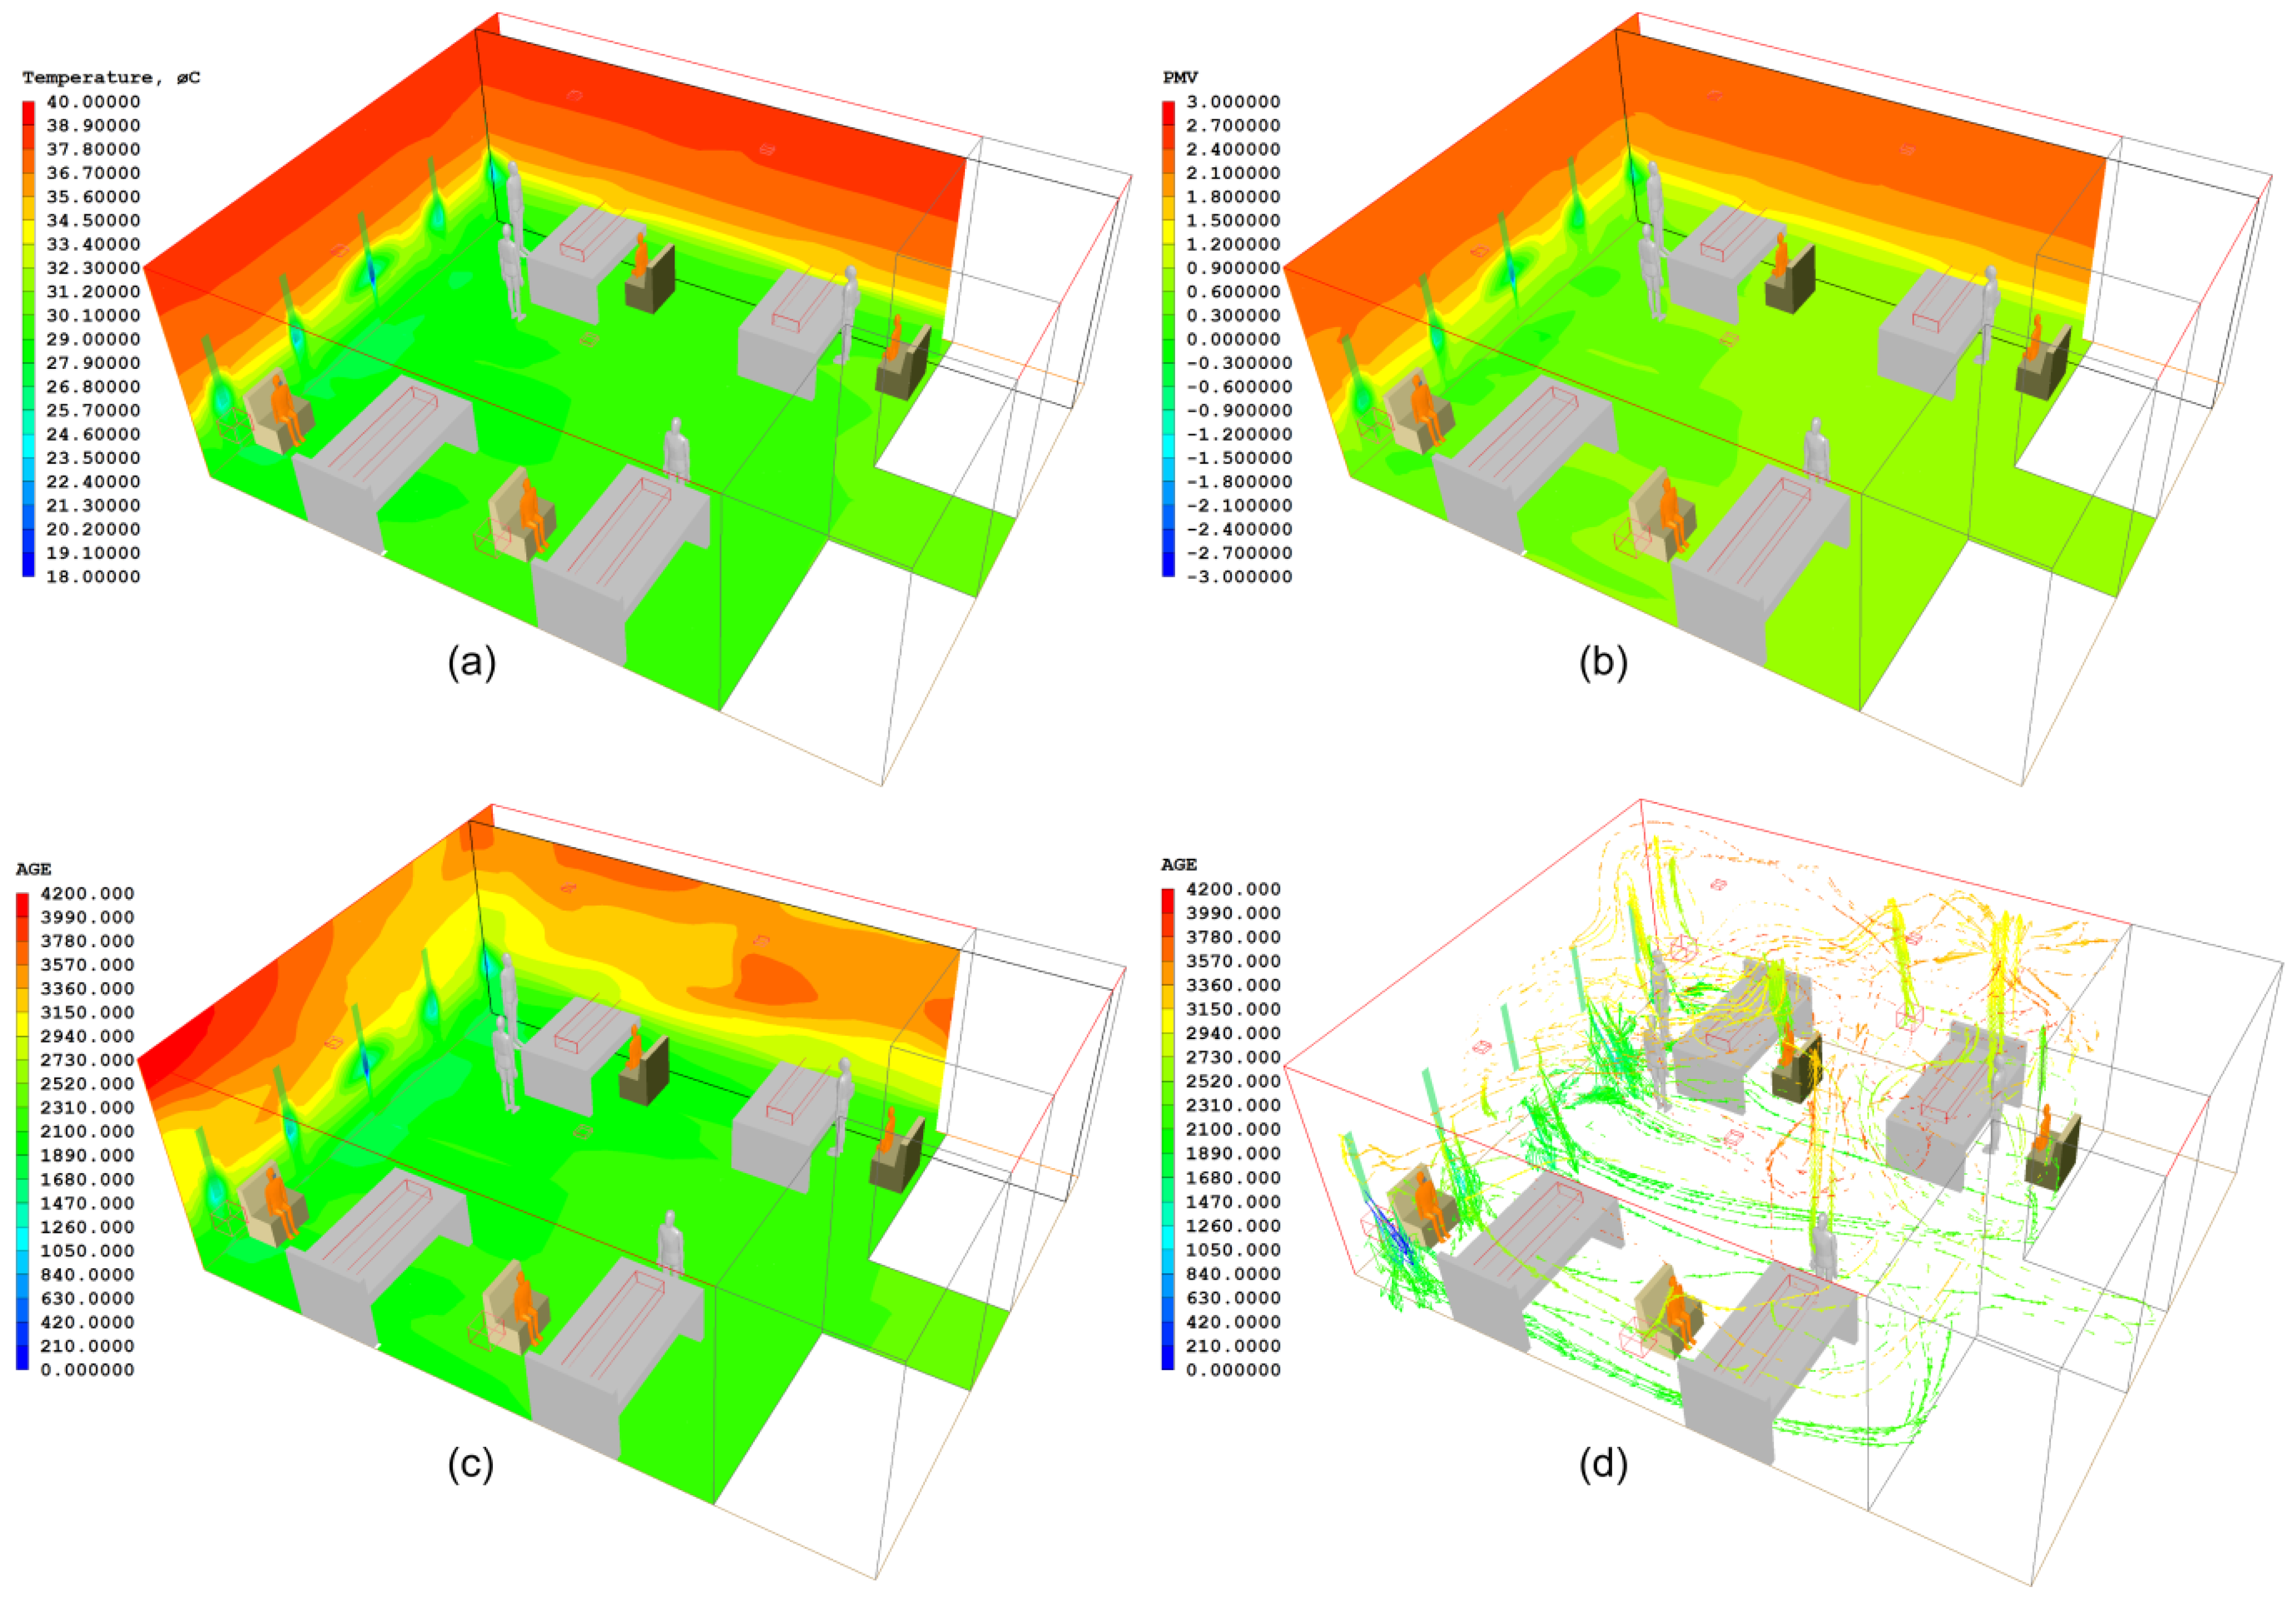
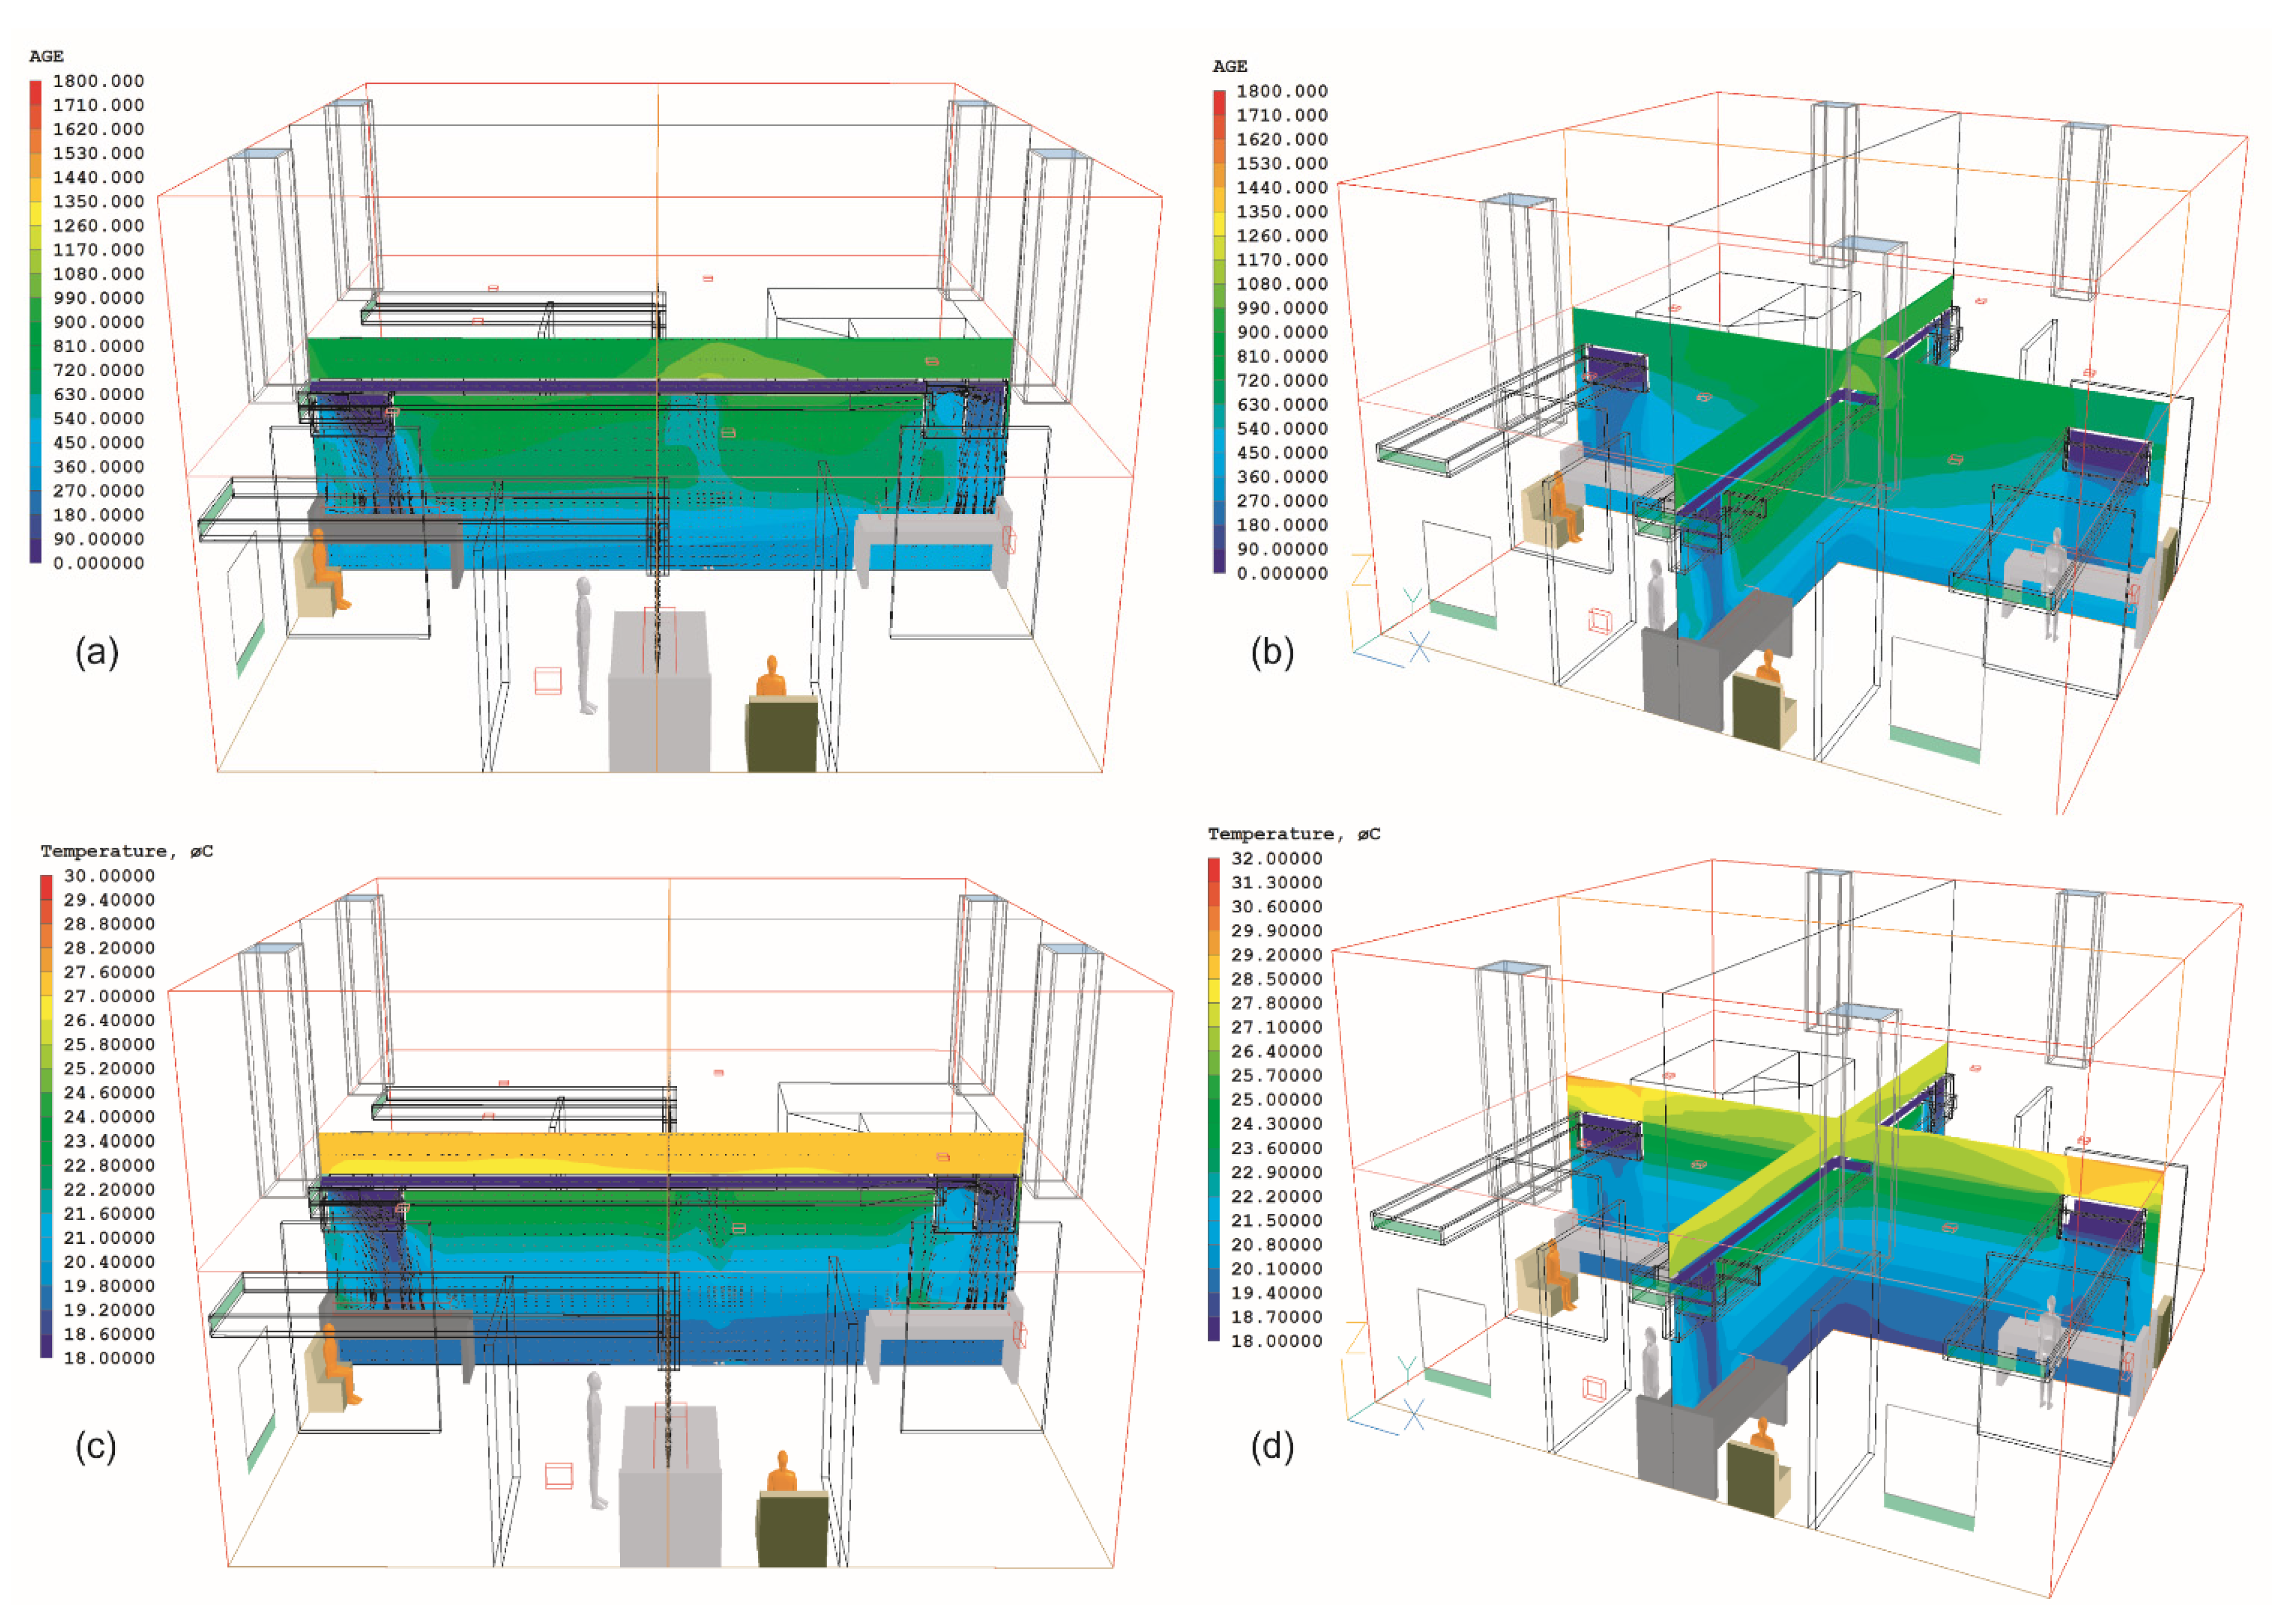
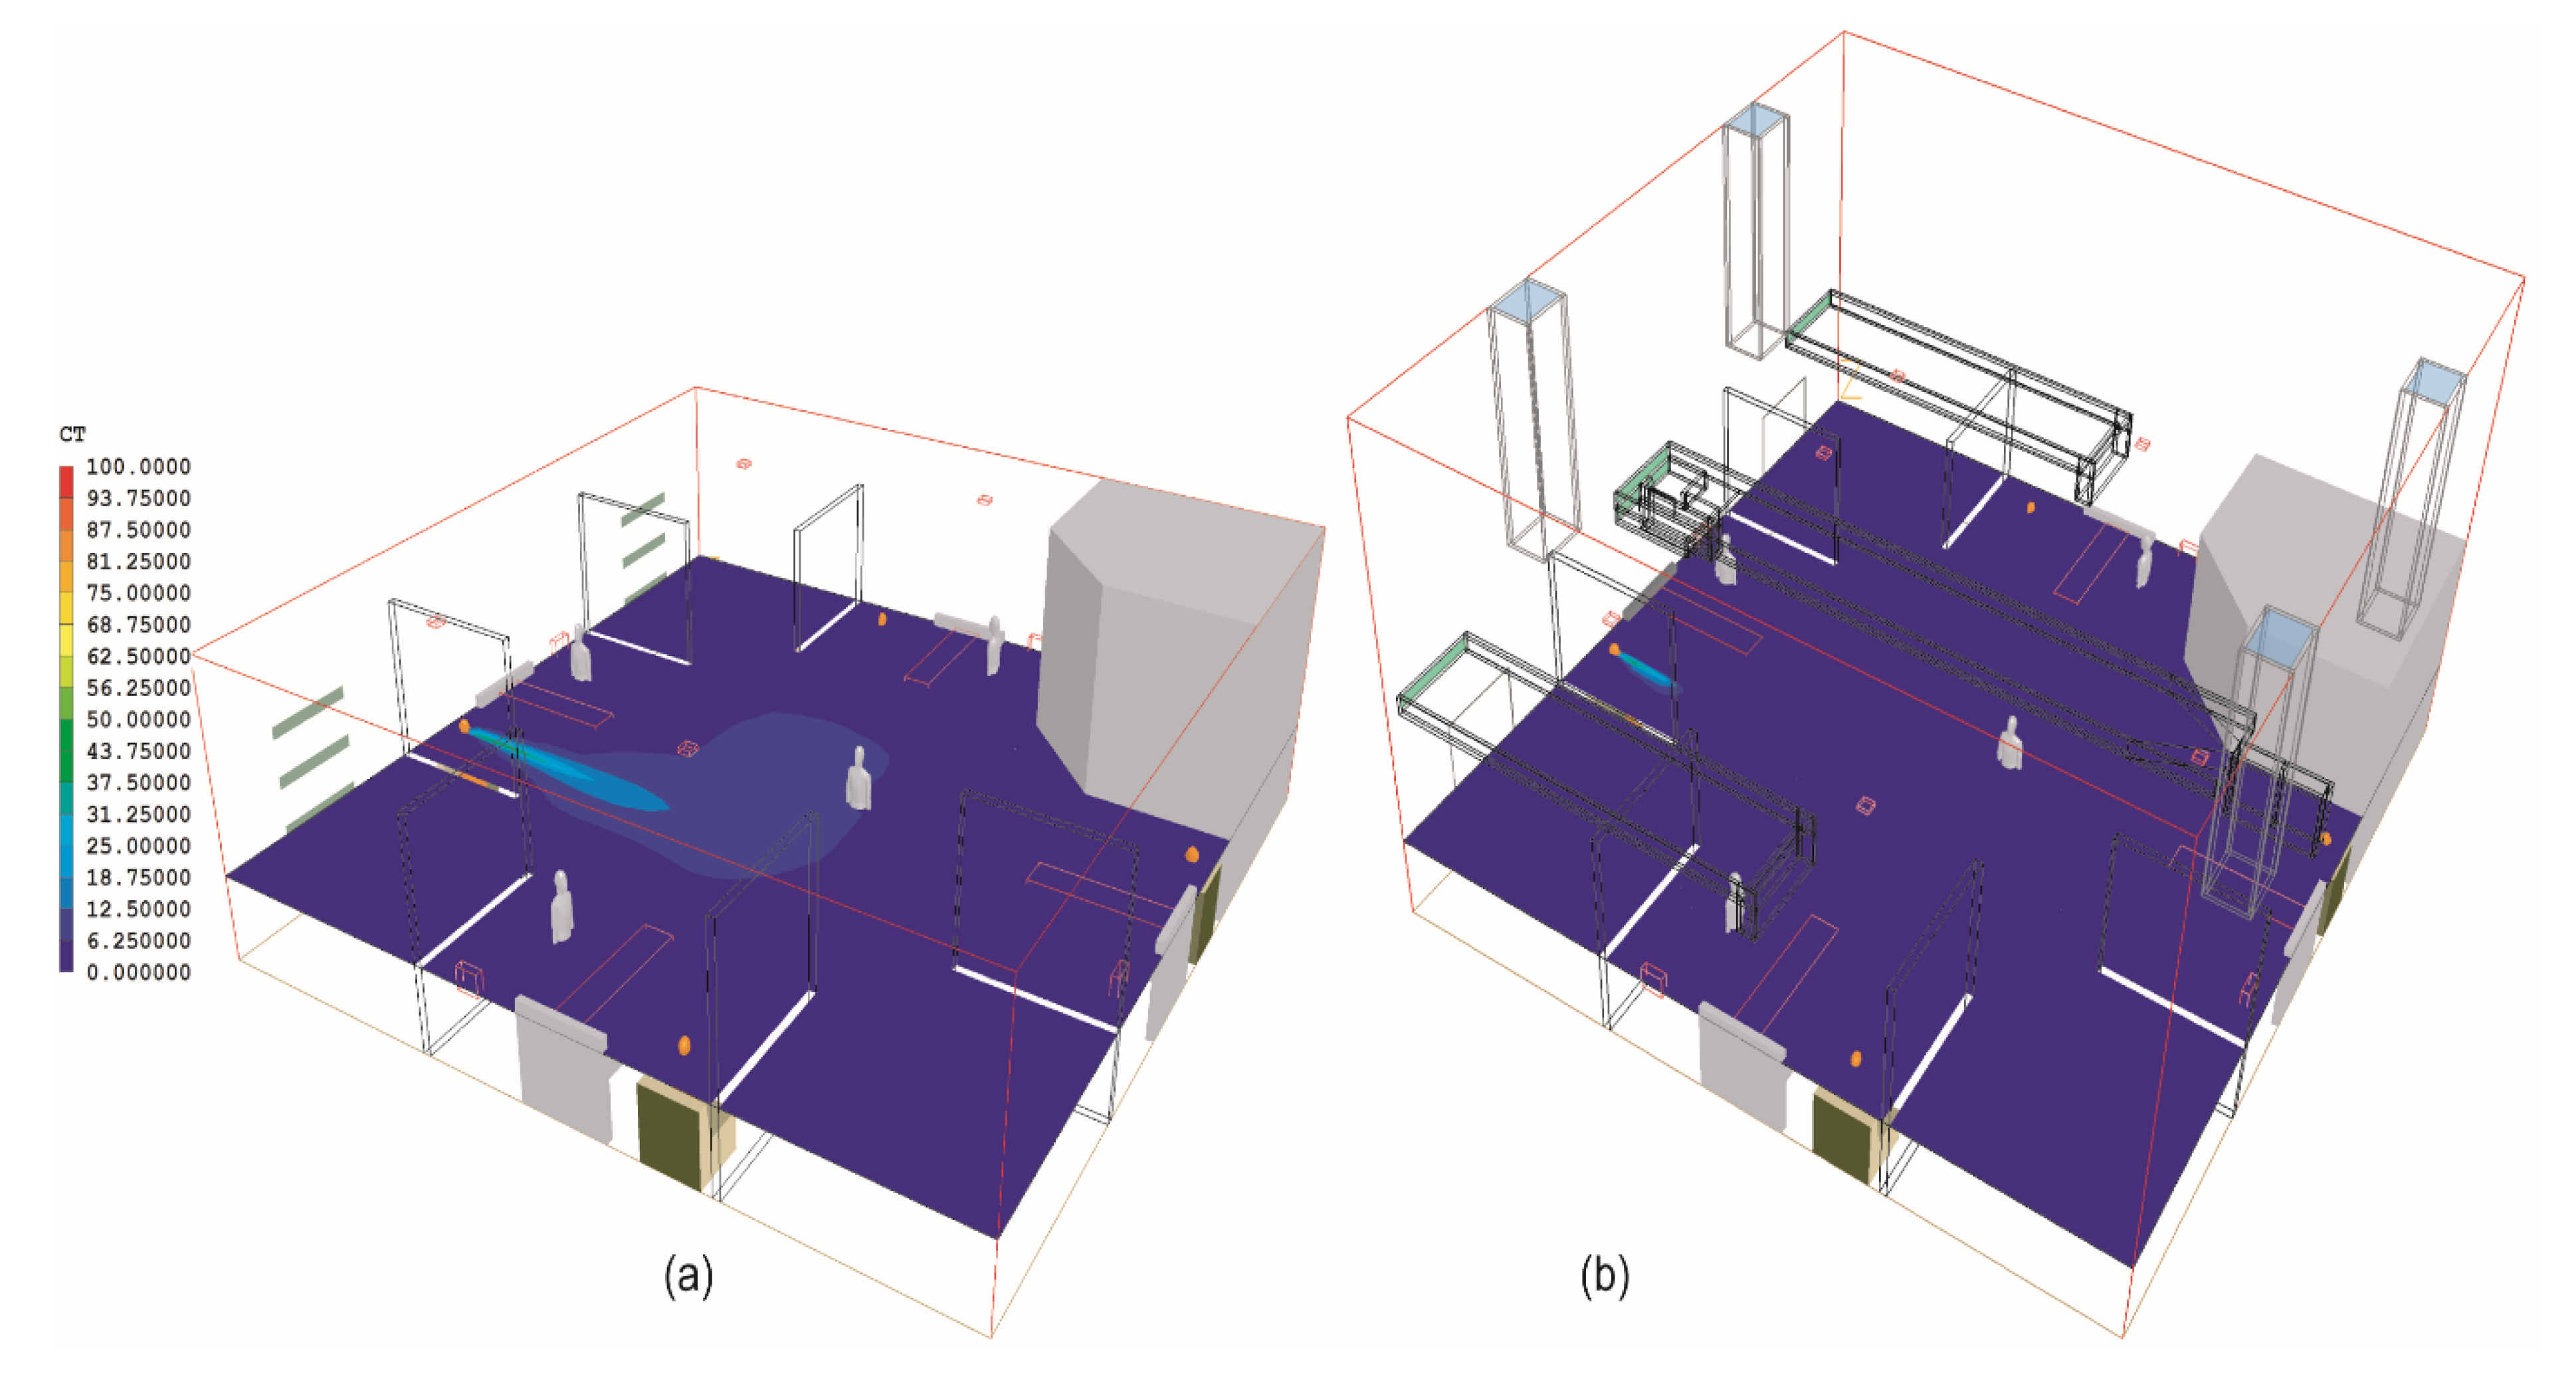
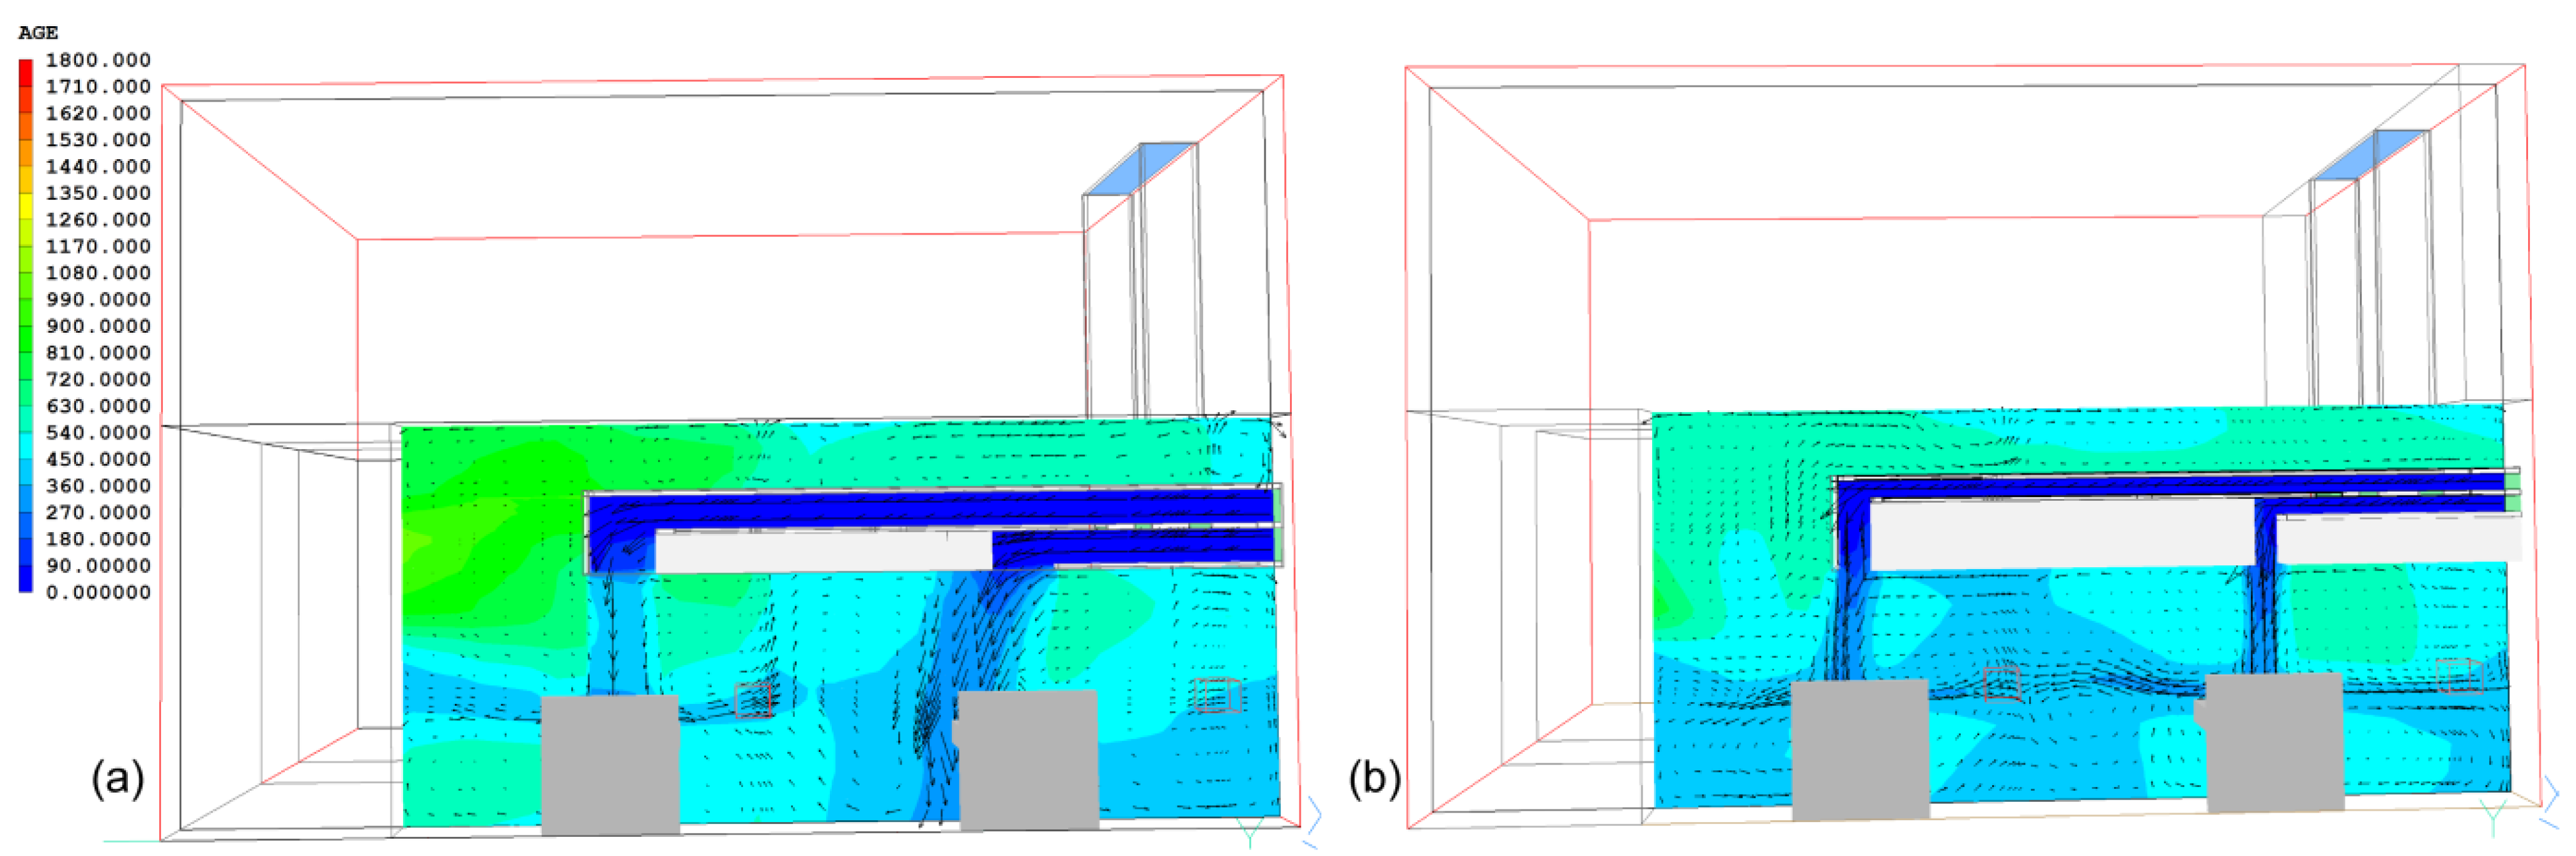
3.2. Results of the ADB Ward


| Cases | Bed-A | Bed-B | Bed-C | Bed-D | Ward Centre |
|---|---|---|---|---|---|
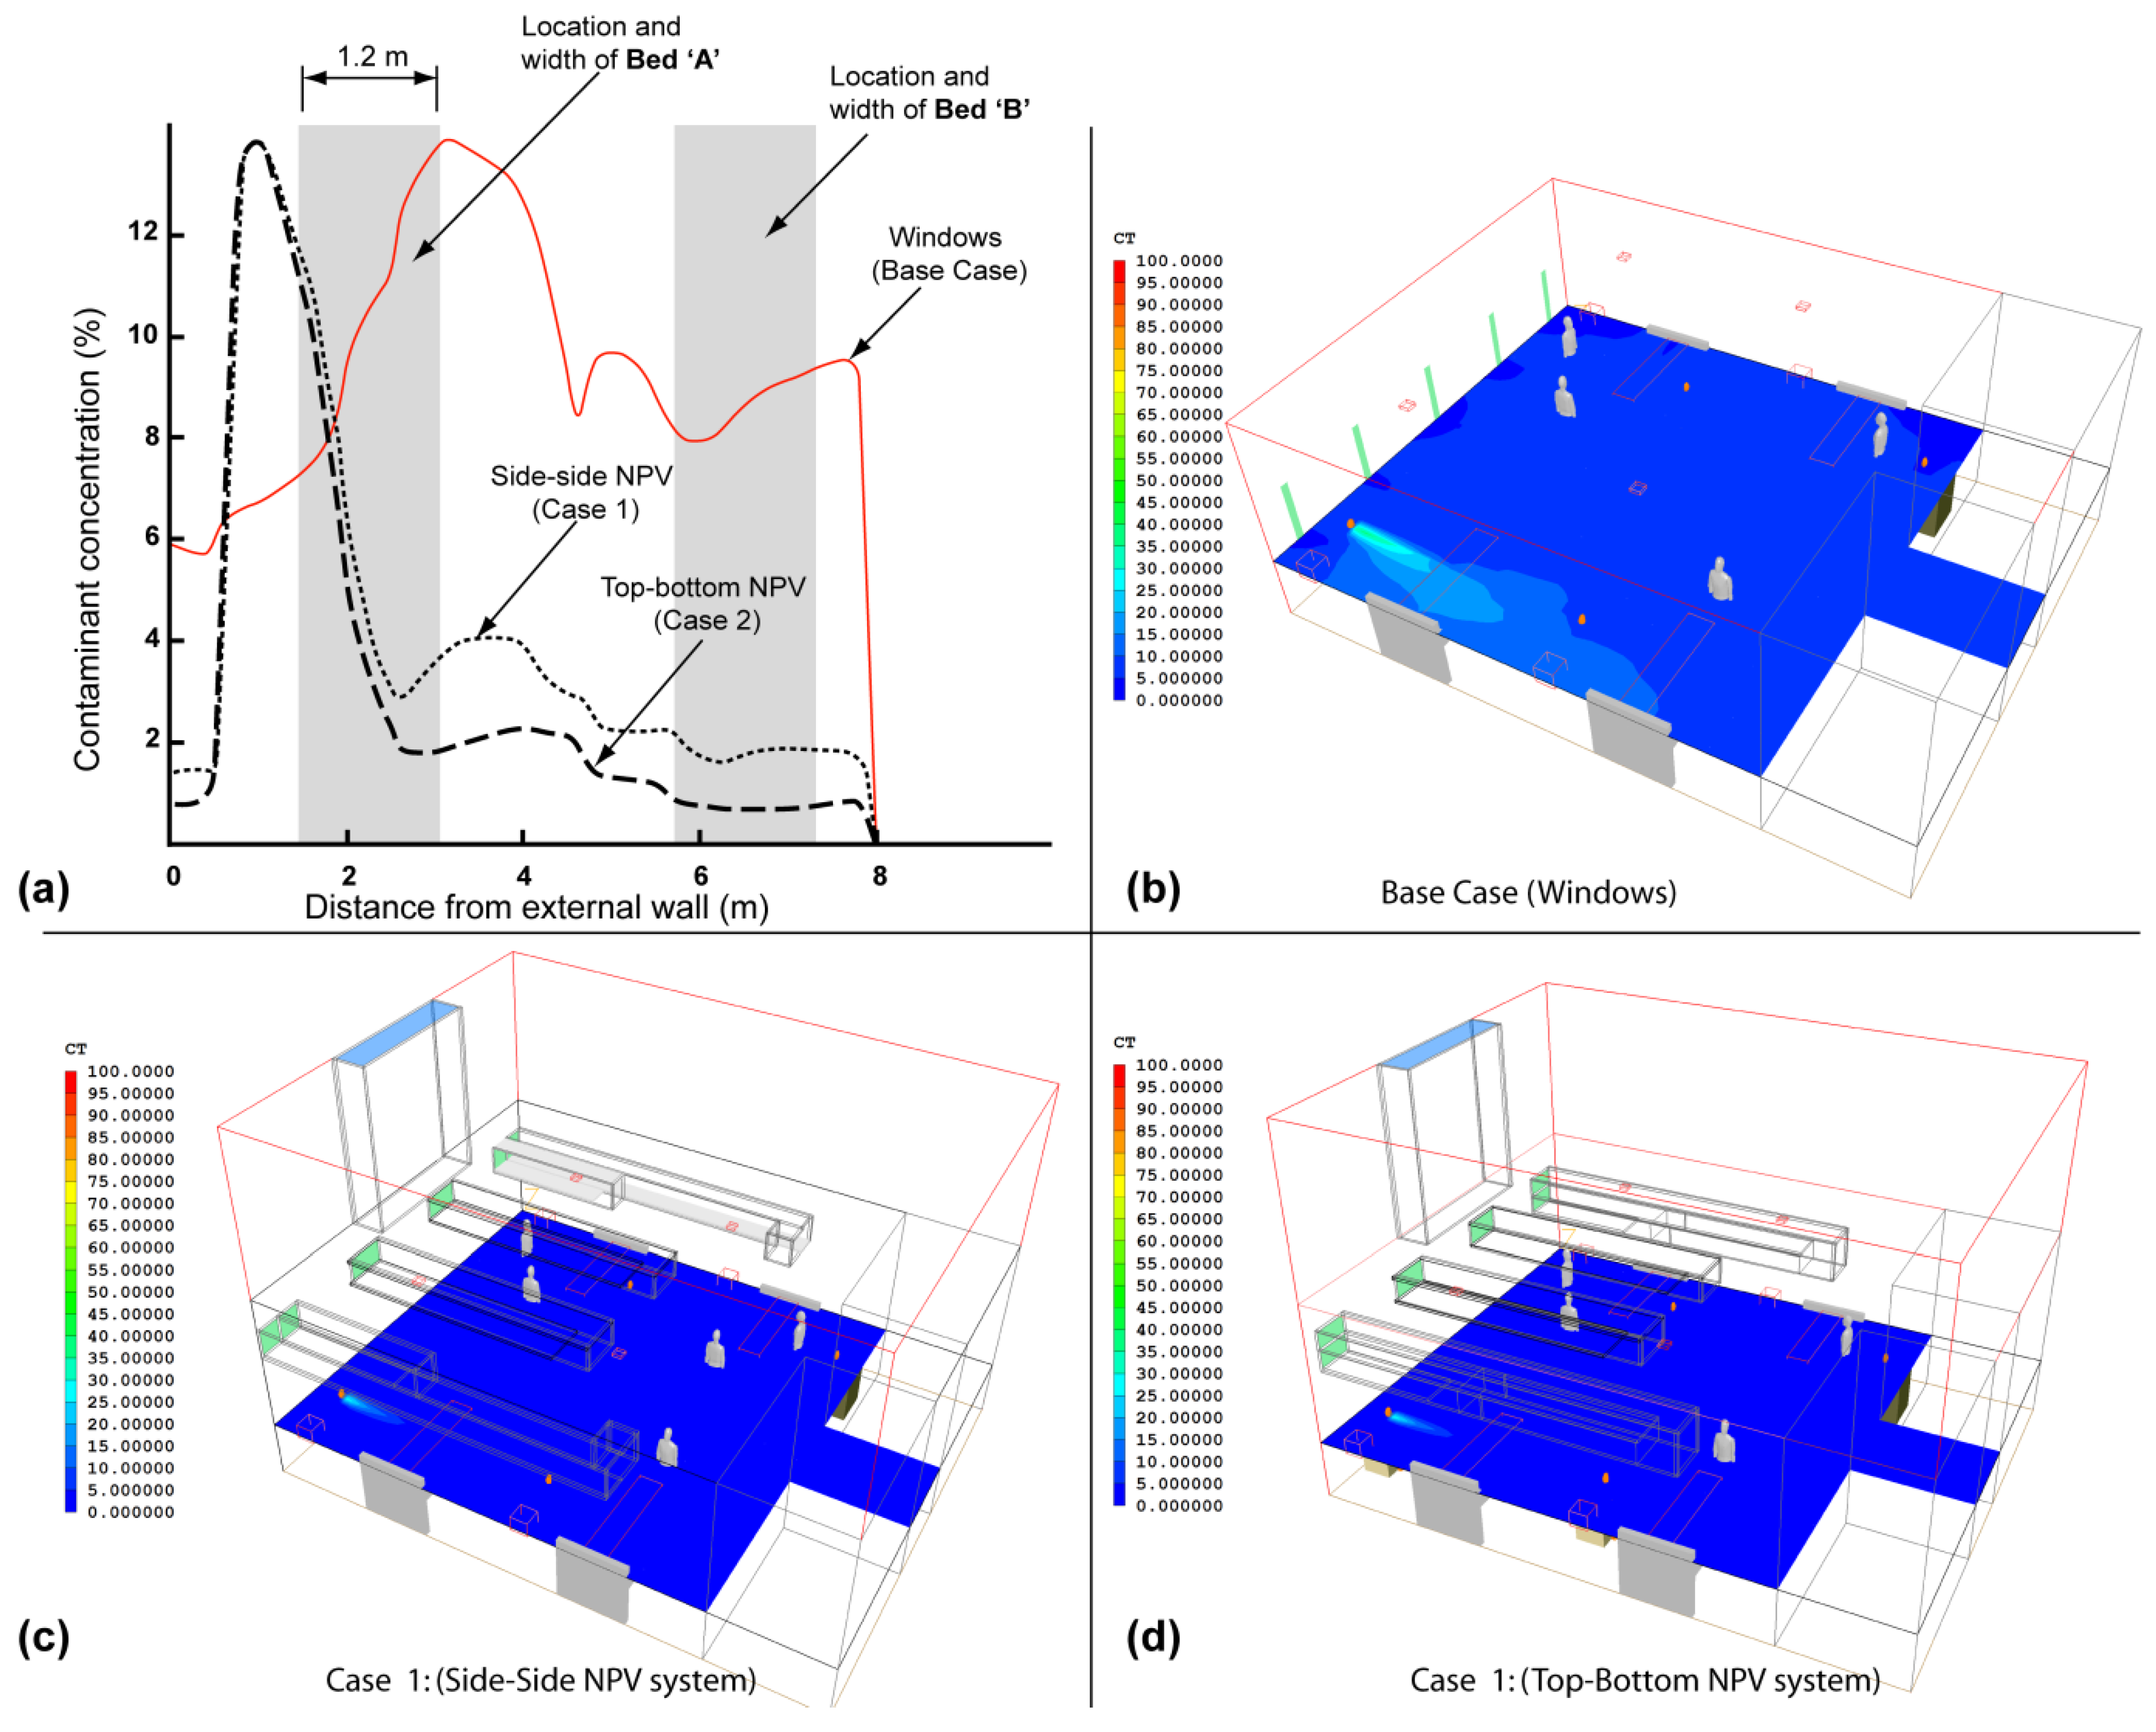
| Windows (Base Case) | 0.73 | 0.57 | 0.32 | 0.30 | 0.40 |
| Side–Side NPV (Case 1) | 0.34 | 0.24 | 0.21 | 0.09 | 0.20 |
| Top–Bottom NPV (Case 2) | 0.30 | 0.18 | 0.13 | 0.06 | 0.16 |
| Difference between Base Case and Case 1 | 53.4% | 57.9% | 34.4% | 70.0% | 50.0% |
| Difference between Base Case and Case 2 | 58.9% | 68.4% | 59.4% | 80.0% | 60.0% |

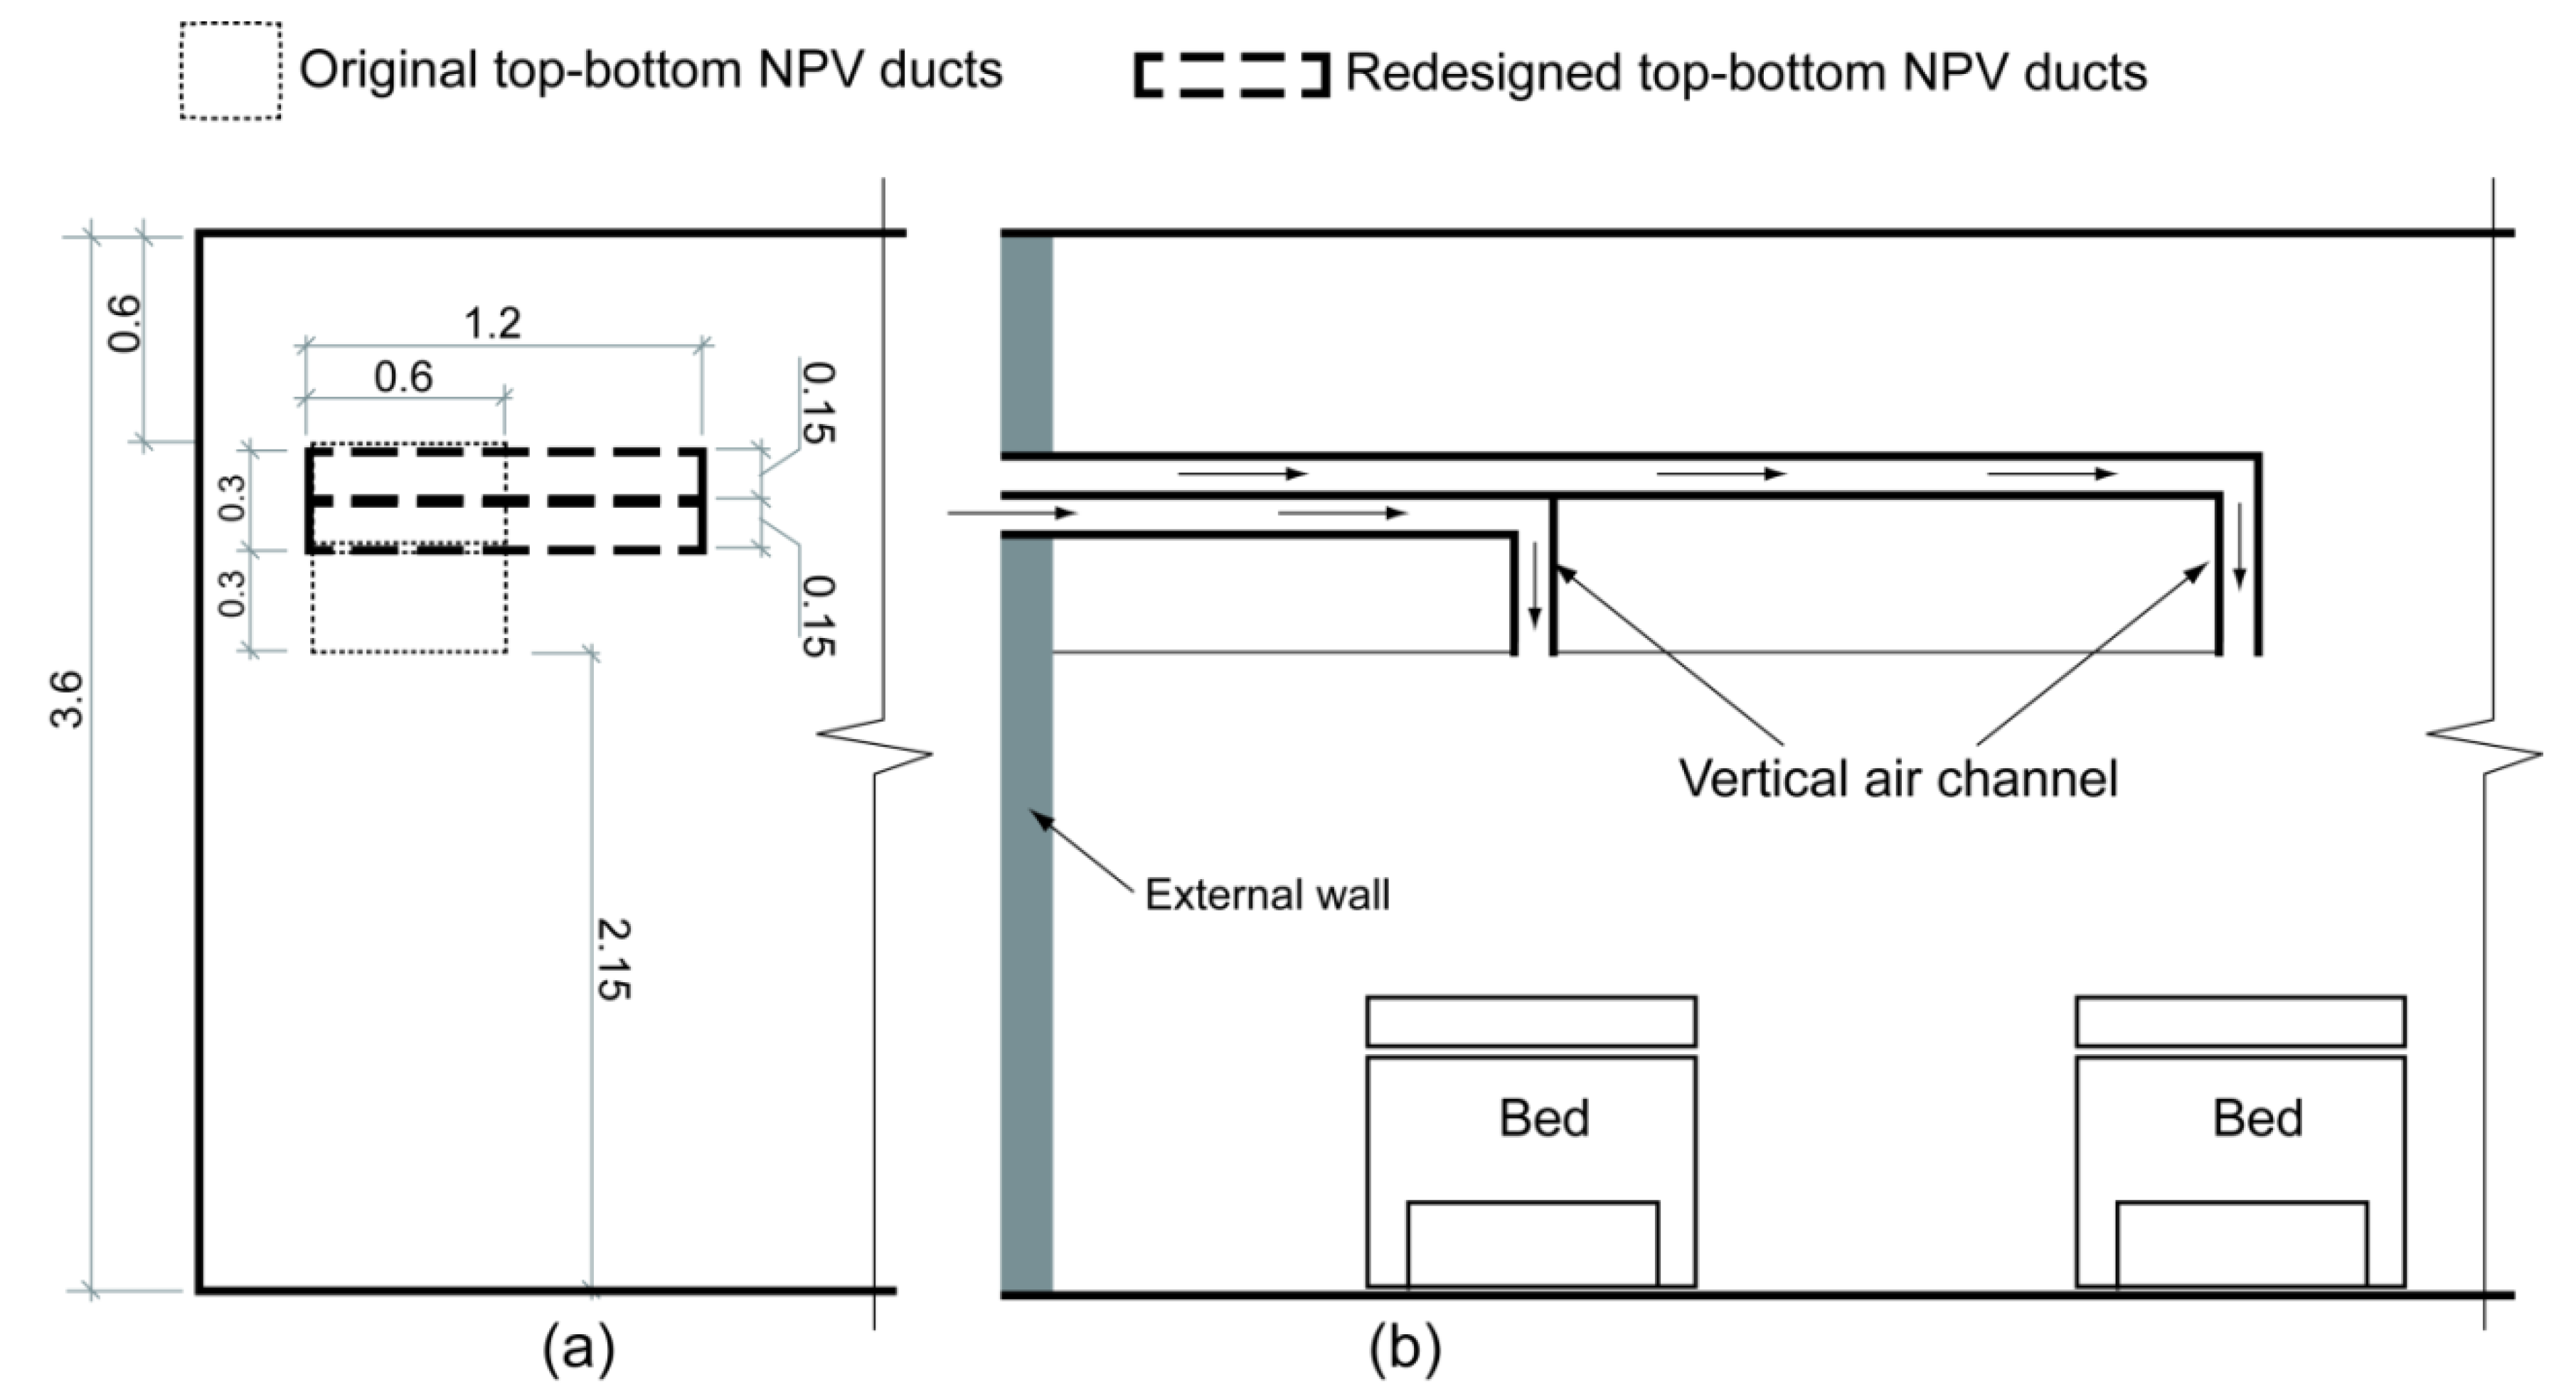
3.3. Improved Design of NPV Duct Using Vertical Air Channels
4. Study 2: The Nightingale Cruciform Ward
4.1. Architectural Considerations, Materials and Methods
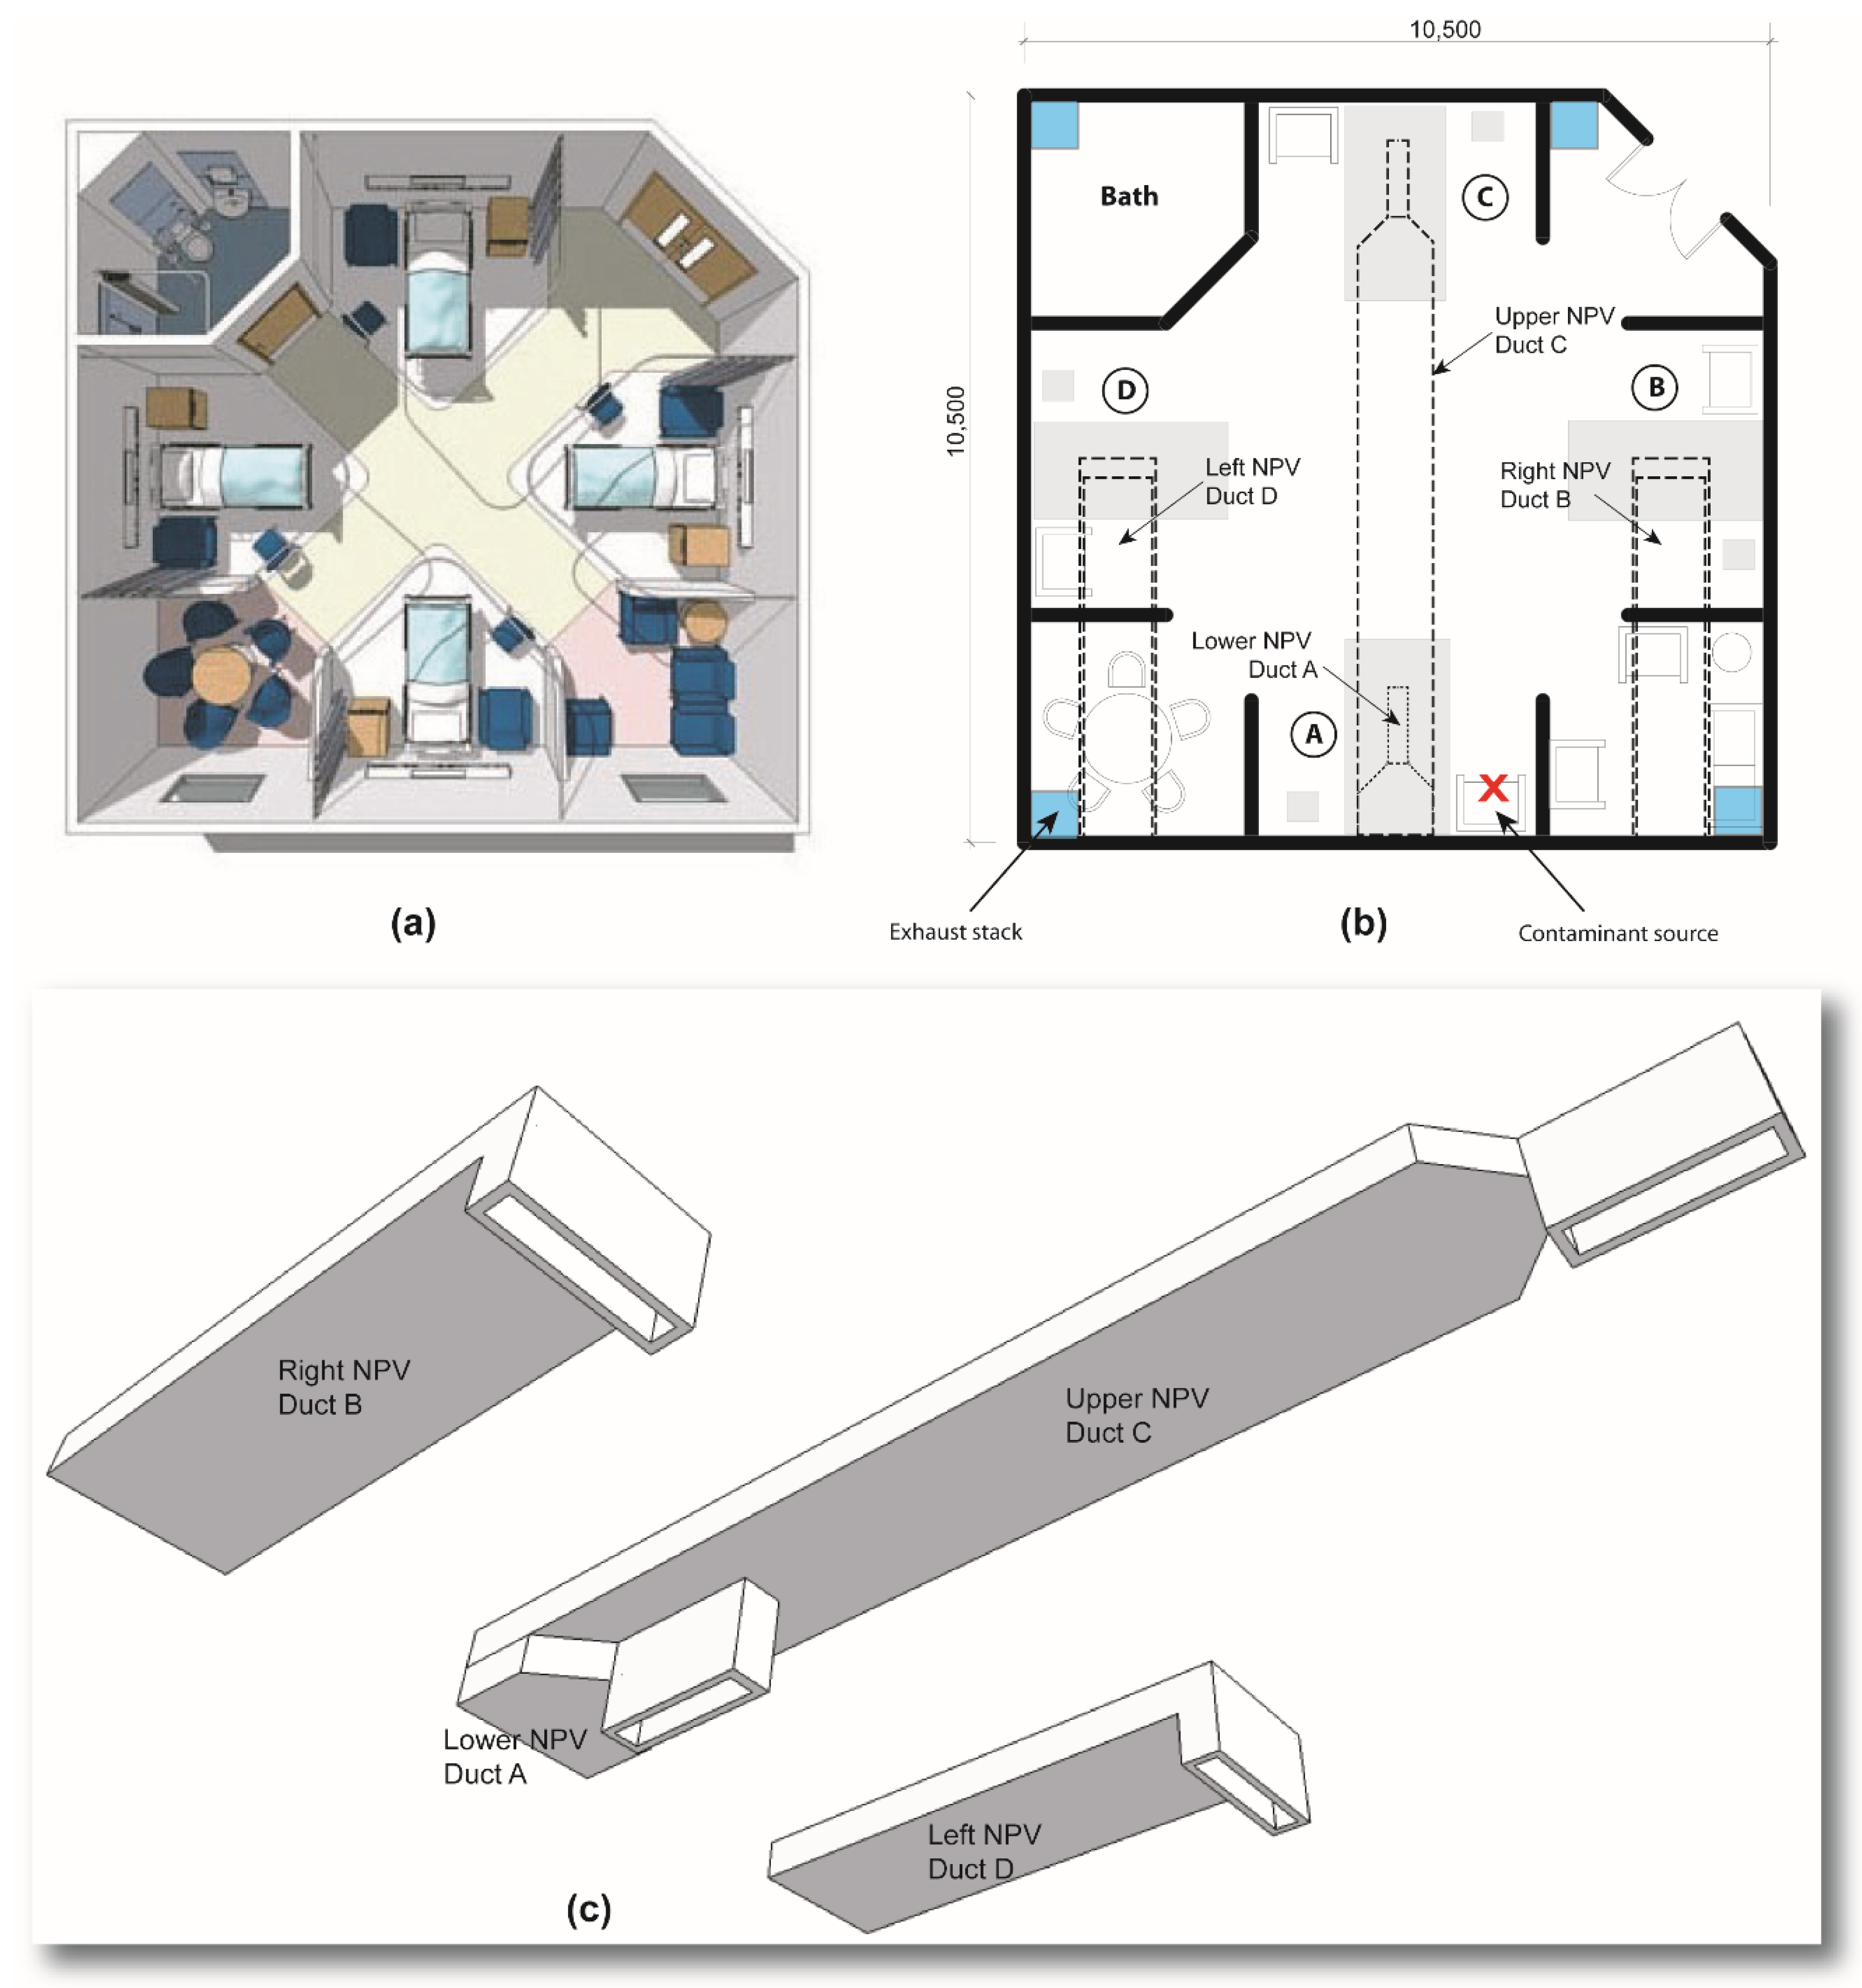
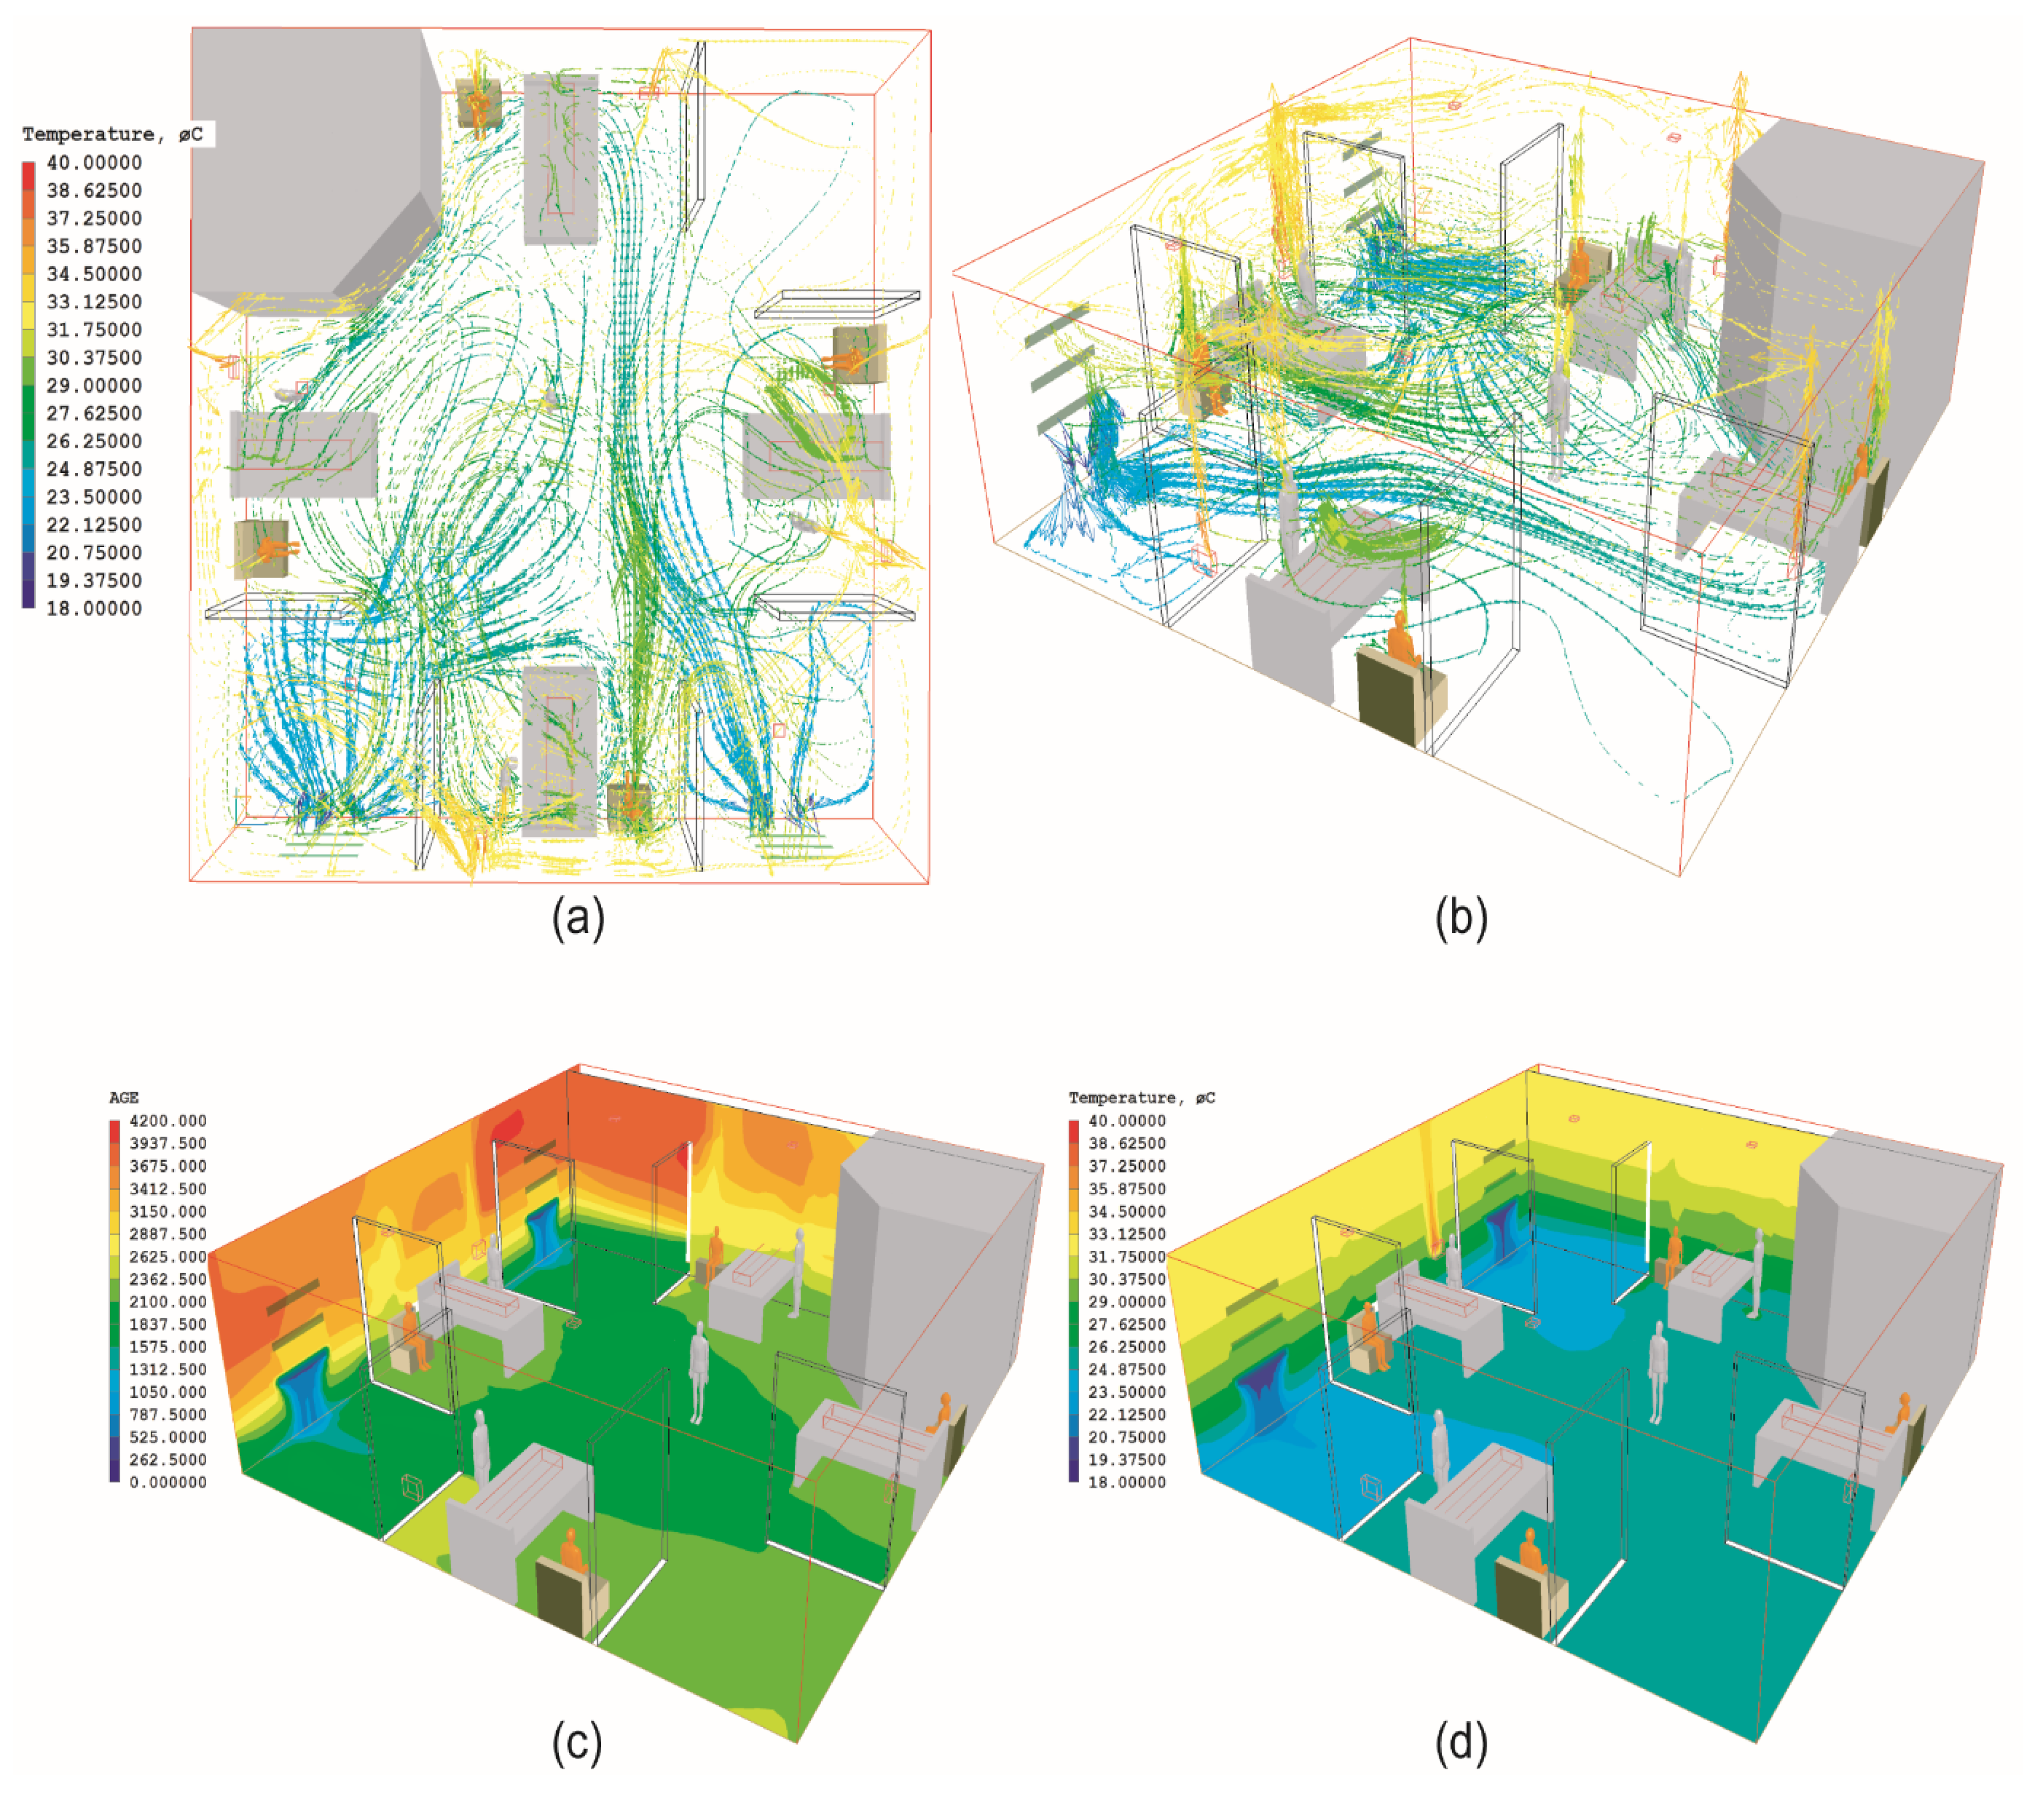
4.2. Results of the Nightingale Cruciform Ward


| Cases | Bed A | Bed B | Bed C | Bed D | Ward Centre |
|---|---|---|---|---|---|
| Cruciform Windows (Case A) | 0.81 | 0.35 | 0.43 | 0.37 | 0.65 |
| Cruciform NPV (Case B) | 0.23 | 0.06 | 0.03 | 0.05 | 0.10 |
| Difference between Window and NPV Cases | 71.6% | 82.9% | 93% | 86.5% | 84.6% |
5. Assessment of Thermal Comfort Levels in All Wards
| Cases | Temperature | Air Velocity (m/s) | PMV * | PPDR (%) | ||||||||||||
|---|---|---|---|---|---|---|---|---|---|---|---|---|---|---|---|---|
| Bed A | Bed B | Bed C | Bed D | Bed A | Bed B | Bed C | Bed D | Bed A | Bed B | Bed C | Bed D | Bed A | Bed B | Bed C | Bed D | |
| ADB: Windows | 27.4 | 27.8 | 27.2 | 27.1 | 0.02 | 0.01 | 0.01 | 0.02 | 1.22 | 1.41 | 1.44 | 1.27 | 0.0 | 0.0 | 0.0 | 0.0 |
| ADB: Side–Side NPV | 20.3 | 22.1 | 22.3 | 20.1 | 0.13 | 0.07 | 0.08 | 0.12 | −1.72 | −1.06 | −1.1 | −1.81 | 24.0 | 15.4 | 15.8 | 24.2 |
| ADB: Top–Bottom NPV | 21.9 | 20.3 | 20.3 | 21.8 | 0.18 | 0.21 | 0.23 | 0.18 | −1.03 | −1.34 | −1.23 | −1.05 | 11.3 | 15.8 | 15.9 | 11.8 |
| ADB: Modified Top–Bottom | 19.4 | 19.5 | 19.4 | 19.4 | 0.3 | 0.32 | 0.31 | 0.3 | −1.32 | −1.35 | −1.31 | −1.33 | 24.8 | 24.8 | 24.8 | 24.9 |
| Cruciform: Windows | 24.4 | 24.7 | 25.4 | 24.6 | 0.02 | 0.01 | 0.01 | 0.02 | 0.62 | 0.67 | 0.71 | 0.65 | 0.0 | 0.0 | 0.0 | 0.0 |
| Cruciform: NPV | 18.5 | 19.2 | 19.4 | 19.1 | 0.1 | 0.09 | 0.06 | 0.09 | −2.25 | −1.68 | −1.63 | −1.71 | 35.9 | 22.5 | 21.2 | 22.3 |
6. Discussion
7. Conclusions
7.1. Limitations of Study
7.2. Further Work
Author Contributions
Conflicts of Interest
References and Notes
- Department of Health (NHS Estates). Health Technical Memorandum 07-02: EnCO2de-, Making Energy Work in Healthcare, Environment and Sustainability; Department of Health Estates and Facilities Division, The Stationary Office: London, UK, 2006. [Google Scholar]
- Short, C.A.; Cook, M.; Cropper, P.C.; Al-Maiyah, S. Low-energy refurbishment strategies for health buildings. J. Build. Perform. Simul. 2010, 3, 197–216. [Google Scholar] [CrossRef]
- Qian, H.; Li, Y.; Seto, W.H.; Ching, P.; Ching, W.H.; Sun, H.Q. Natural ventilation for reducing airborne infection in hospitals. Build. Environ. 2010, 45, 559–565. [Google Scholar] [CrossRef]
- Escombe, A.R.; Oeser, C.C.; Gilman, R.H.; Navincopa, M.; Ticona, E.; Pan, W.; Martínez, C.; Chacaltana, J.; Rodríguez, R.; Moore, D.A.J.; et al. Natural ventilation for the prevention of airborne contagion. PLoS Med. 2007, 4, 309–317. [Google Scholar]
- Department of Health (NHS Estates). Health Technical Memorandum HTM 55 (Building Components) Windows; The Stationery Office: London, UK, 1998. [Google Scholar]
- Department of Health (NHS Estates). Health Building Note 00-10 Part D: Windows and Associated Hardware; Department of Health: London, UK, 2013. Available online: http://www.dhsspsni.gov.uk/hbn00-01-partd.pdf (accessed on 12 January 2014).
- Gilkeson, C.A.; Camargo-Valero, M.A.; Pickin, L.E.; Noakes, C.J. Measurement of ventilation and airborne infection risk in large naturally ventilated hospital wards. Build. Environ. 2013, 65, 35–48. [Google Scholar] [CrossRef]
- Giridharan, R.; Lomas, K.J.; Short, C.A.; Fair, A.J. Performance of hospital spaces in summer: A case study of a “Nucleus”-type hospital in the UK Midlands. Energy Build. 2013, 66, 315–328. [Google Scholar] [CrossRef]
- Lomas, K.J. Architectural design of an advanced naturally ventilated building form. Energy Build. 2007, 39, 166–181. [Google Scholar] [CrossRef]
- Awbi, H.B. Ventilation of Buildings, 2nd ed.; Spon Press: London, UK, 2003. [Google Scholar]
- Moodie, T.B. Gravity currents. J. Comput. Appl. Math. 2002, 144, 49–83. [Google Scholar] [CrossRef]
- Chen, C.; Zhu, J.; Qu, Z.; Lin, C.-H.; Jiang, Z.; Chen, Q. Systematic study of person-to-person contaminant transport in mechanically ventilated spaces. HVAC&R Res. 2014, 20, 80–91. [Google Scholar] [CrossRef]
- Gao, N.; He, Q.; Niu, J. Numerical study of the lock-up phenomenon of human exhaled droplets under a displacement ventilated room. Build. Simul. 2012, 5, 51–60. [Google Scholar] [CrossRef]
- Li, Y.; Nielsen, P.V.; Sandberg, M. Displacement ventilation in hospital environments. ASHRAE J. 2011, 53, 86–88. [Google Scholar]
- Beggs, C.B.; Kerr, K.G.; Noakes, C.J.; Hathway, E.A.; Sleigh, P.A. The ventilation of multiple-bed hospital wards: Review and analysis. Am. J. Infect. Control 2008, 36, 250–259. [Google Scholar] [CrossRef] [PubMed]
- Qian, H.; Li, Y.; Nielsen, P.V.; Hyldgaard, C.E.; Wong, T.W.; Chwang, A.T.Y. Dispersion of exhaled droplet nuclei in a two-bed hospital ward with three different ventilation systems. Indoor Air 2006, 16, 111–128. [Google Scholar] [CrossRef] [PubMed]
- Olmedo, I.; Nielsen, P.V.; Ruiz de Adana, M.; Jensen, R.L.; Grzelecki, P. Distribution of exhaled contaminants and personal exposure in a room using three different air distribution strategies. Indoor Air 2012, 22, 64–76. [Google Scholar] [CrossRef] [PubMed]
- Melikov, A. Personalized ventilation. Indoor Air 2004, 14, 157–167. [Google Scholar] [CrossRef] [PubMed]
- Yang, B.; Sekhar, C.; Melikov, A.K. Ceiling mounted personalized ventilation system in hot and humid climate—An energy analysis. Energy Build. 2010, 42, 2304–2308. [Google Scholar] [CrossRef]
- Melikov, A.; Ivanova, T.; Stefanova, G. Seat headrest-incorporated personalized ventilation: Thermal comfort and inhaled air quality. Build. Environ. 2012, 47, 100–108. [Google Scholar] [CrossRef]
- Cermak, R.; Melikov, A. Protection of occupants from exhaled infectious agents and floor material emissions in rooms with personalized and underfloor ventilation. HVAC&R Res. 2007, 13, 23–38. [Google Scholar] [CrossRef]
- Cermak, R.; Melikov, A.K.; Forejt, L.; Kovar, O. Performance of personalized ventilation in conjunction with mixing and displacement ventilation. HVAC&R Res. 2006, 12, 295–311. [Google Scholar] [CrossRef]
- Adamu, Z.A.; Cook, M.J.; Price, A.D.F. Natural personalised ventilation: A novel approach. Int. J. Ventil. 2011, 10, 263–275. [Google Scholar]
- Todd, S.P.; Adamu, Z.A.; Cook, M.J.; Price, A.D.F. Natural Personalised Ventilation for Hospital Wards: Experimental Validation. In Proceedings of the 4th CIBSE ASHRAE Technical Symposium, Dublin, Ireland, 3–4 April 2014.
- Koestel, A. Paths of horizontally projected heated and chilled air jets. Trans. ASHAF 1955, 61, 231–232. [Google Scholar]
- Li, Y.; Nielsen, P.V. CFD and ventilation research. Indoor Air 2011, 21, 442–453. [Google Scholar] [CrossRef] [PubMed]
- Chen, Q. Ventilation performance prediction for buildings: A method overview and recent applications. Build. Environ. 2009, 44, 848–858. [Google Scholar] [CrossRef]
- Chen, Q. Using computational tools to factor wind into architectural environment design. Energy Build. 2004, 36, 1197–1209. [Google Scholar] [CrossRef]
- CHAM. Phoenics version 2009. Cham Co. Ltd.: Wimbledon, UK, 2014. Available online: http://www.cham.co.uk/ (accessed on 5 July 2013).
- Yakhot, V.; Orszag, S.A. Renormalization group analysis of turbulence. J. Sci. Comput. 1986, 1, 3–51. [Google Scholar] [CrossRef]
- Mundt, M.; Mathisen, H.M.; Moser, M.; Nielsen, P.V. REHVA Ventilation Effectiveness Guide; Federation of European Heating, Ventilation and Air-Conditioning Association: Brussels, Belgium, 2004. Available online: http://www.rehva.eu/publications-and-resources/guidebooks-shop/ (accessed on 8 August 2012).
- Cheong, K.W.D.; Phua, S.Y. Development of ventilation design strategy for effective removal of pollutant in the isolation room of a hospital. Build. Environ. 2006, 41, 1161–1170. [Google Scholar] [CrossRef]
- Olesen, B.W. The philosophy behind EN 15251: Indoor environmental criteria for design and calculation of energy performance of buildings. Energy Build. 2007, 39, 740–749. [Google Scholar] [CrossRef]
- The Chartered Institution of Building Services Engineers (CIBSE). Guide A: Environmental Design; CIBSE: London, UK, 2006. [Google Scholar]
- Jiang, Y.; Zhao, B.; Li, X.; Yang, X.; Zhang, Z.; Zhang, Y. Investigating a safe ventilation rate for the prevention of indoor SARS transmission: An attempt based on simulation approach. Build. Simul. 2009, 2, 281–289. [Google Scholar] [CrossRef]
- Morawska, L. Droplet fate in indoor environments, or can we prevent the spread of infection? Indoor Air 2006, 16, 335–347. [Google Scholar] [CrossRef] [PubMed]
- Cox, C.S.; Wathes, C.M. Bioaerosols Handbook; Lewis Publishers: Boca Raton, FL, USA, 1995; p. 17. [Google Scholar]
- Gupta, J.; Lin, C.-H.; Chen, Q. Flow dynamics and characterization of a cough. Indoor Air 2009, 19, 517–525. [Google Scholar] [CrossRef] [PubMed]
- Des Prez, R.M.; Heim, C.R. Mycobacterium Tuberculosis. In Principles and Practices of Infectious Diseases; Mandell, G.L., Douglas, R.G., Jr., Bennett, J.E., Eds.; Churchill Livingston: New York, NY, USA, 1990; pp. 1877–1906. [Google Scholar]
- Lomas, K.J.; Ji, Y. Resilience of naturally ventilated buildings to climate change: Advanced natural ventilation and hospital wards. Energy Build. 2009, 41, 629–653. [Google Scholar] [CrossRef]
- Paradise, C. Innovative Patient Accommodation. Proceedings of International Academy for Design and Health 7th World Congress and Exhibition, Boston, MA, USA, 6–10 July 2011; Available online: http://www.designandhealth.com/uploaded/documents/Awards-and-events/WCDH2011/Presentations/Friday/Session-8/CarolineParadise.pdf (accessed on 5 January 2013).
- Atkinson, J.; Chartier, Y.; Pessoa-Silva, C.L.; Jensen, P.; Li, Y.; Seto, W.-H. (Eds.) Natural Ventilation for Infection Control in Health-Care Settings; WHO: Geneva, Switzerland, 2009. Available online: http://www.who.int/water_sanitation_health/publications/natural_ventilation.pdf (accessed on 18 May 2012).
- Li, Y.; Leung, M.K.H.; Seto, W.H.; Yeun, P.L.; Leung, J.; Kwan, J.K.; Yu, S.C.T. Factors affecting ventilation effectiveness in SARS wards. Hong Kong Med. J. 2008, 14, 33–36. [Google Scholar]
- Kierat, W.; Bolashikov, Z.D.; Melikov, A.K.; Popiołek, Z.; Brand, M. Exposure to Coughed Airborne Pathogens in a Double Bed Hospital Patient Room: Impact of Posture of Coughing Patient and Location of Doctor. In Proceedings of the ASHRAE IAQ Conference, Kuala Lumpur, Malaysia, 10–12 November 2010. paper 128.
© 2015 by the authors; licensee MDPI, Basel, Switzerland. This article is an open access article distributed under the terms and conditions of the Creative Commons Attribution license (http://creativecommons.org/licenses/by/4.0/).
Share and Cite
Adamu, Z.A.; Price, A. The Design and Simulation of Natural Personalised Ventilation (NPV) System for Multi-Bed Hospital Wards. Buildings 2015, 5, 381-404. https://doi.org/10.3390/buildings5020381
Adamu ZA, Price A. The Design and Simulation of Natural Personalised Ventilation (NPV) System for Multi-Bed Hospital Wards. Buildings. 2015; 5(2):381-404. https://doi.org/10.3390/buildings5020381
Chicago/Turabian StyleAdamu, Zulfikar A., and Andrew Price. 2015. "The Design and Simulation of Natural Personalised Ventilation (NPV) System for Multi-Bed Hospital Wards" Buildings 5, no. 2: 381-404. https://doi.org/10.3390/buildings5020381
APA StyleAdamu, Z. A., & Price, A. (2015). The Design and Simulation of Natural Personalised Ventilation (NPV) System for Multi-Bed Hospital Wards. Buildings, 5(2), 381-404. https://doi.org/10.3390/buildings5020381