
Measuring the Weathertight Performance of Flashings

Abstract
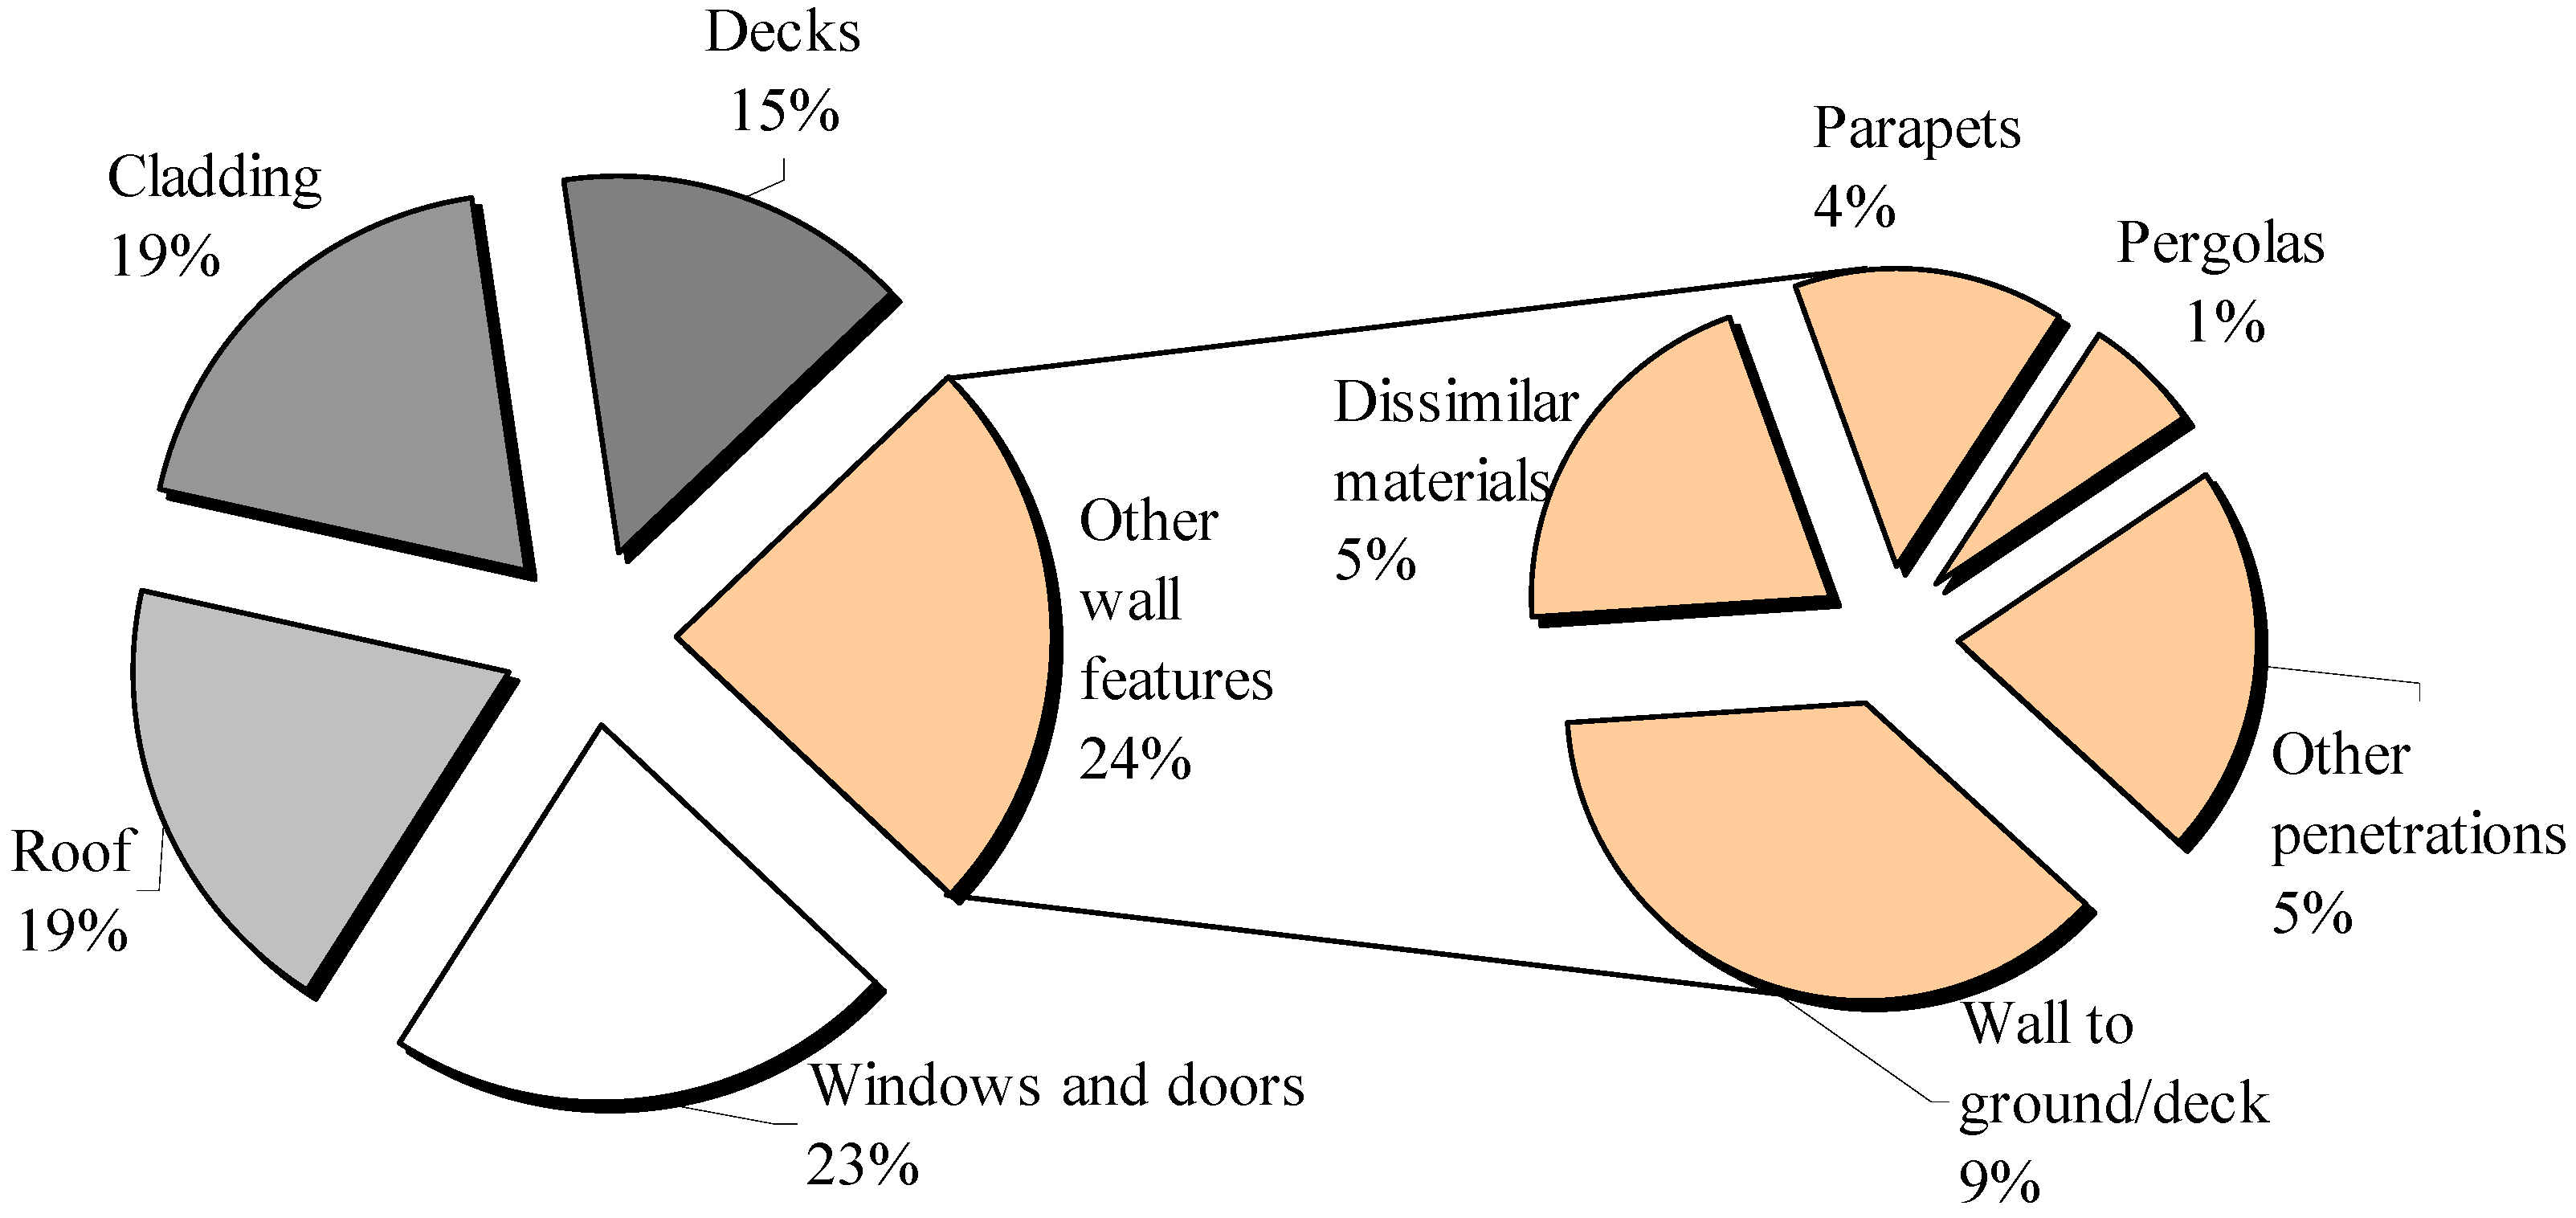
:1. Introduction
- Water should not systematically reach the dry side of the cavity during any of the tests (including above the upstand on horizontal flashings above cavity closers);
- The first test in E2/VM1 is a static and cyclic pressure test of the complete wall system;
- The second test introduces defects in the cladding around flashings to confirm that water is successfully controlled by drainage paths including the back of the cladding and flashings at junctions between components or different claddings;
- Finally, the “wetwall test” applies 50 Pa pressure difference across the cladding and checks that water leaks through the cladding are confined to the drainage paths and do not bridge the cavity.
- The flashing forms part of the drainage path for water on the back of the cladding;
- The flashing must rainscreen the joint and prevent water from reaching the underlay with a rain intensity of at least 3 L/m2·min and a 50 Pa air pressure difference between the wetwall and the cavity.
- How far should the flashing upstand extend upwards behind the cladding to deal with wind driven rain?
- Do the upstand heights of flashings need to be adjusted to cope with rain bouncing of a roof—particularly important for apron flashings between roof and wall?
- Do cavity closers have a role in managing air and water entry through the joint?
- How should cladding to flashing clearances be sized to control runoff?
- Do hems folded into metal flashings improve the weathertight performance of flashings?
2. Measured Rain Leakage Characteristics

3. Typical Flashed Joints Seen in Residential Buildings
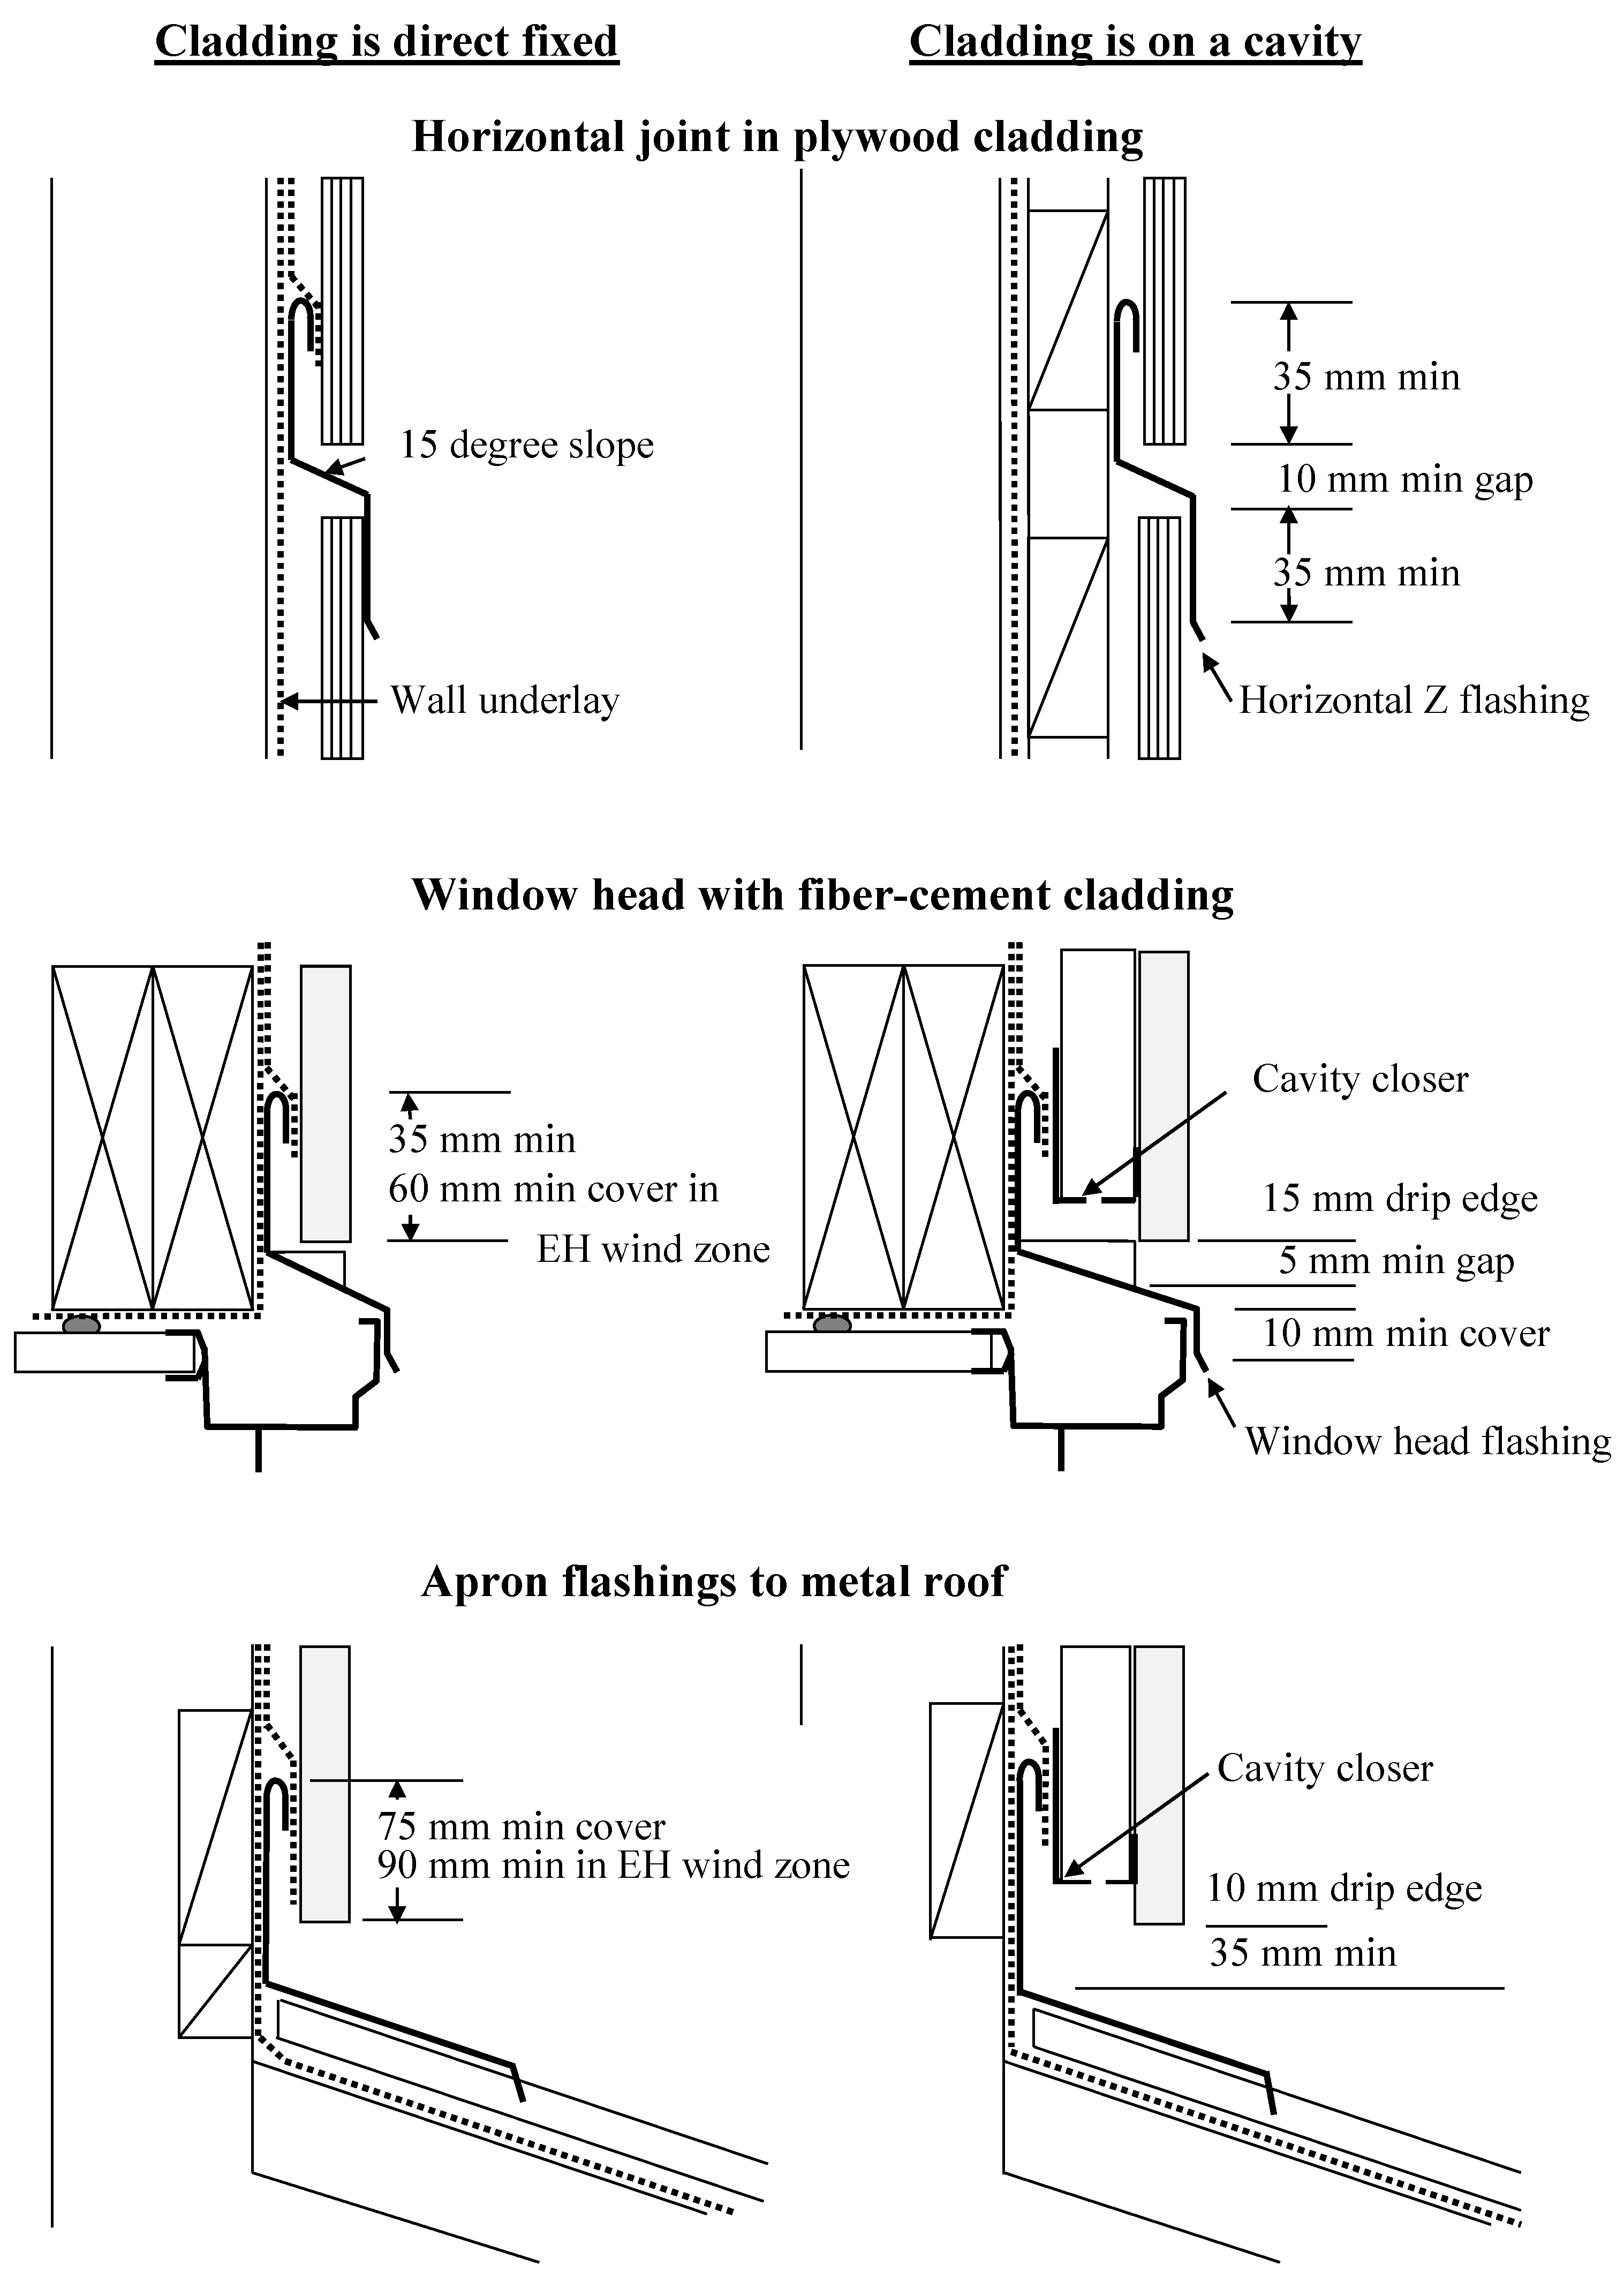
- A Z jointer between direct fixed plywoodwall panels;
- A window head flashing in a cavity wall;
- An apron flashing between a roof and a higher section of cavity wall.
4. Leakage Characteristics of a Horizontal Cladding Jointer
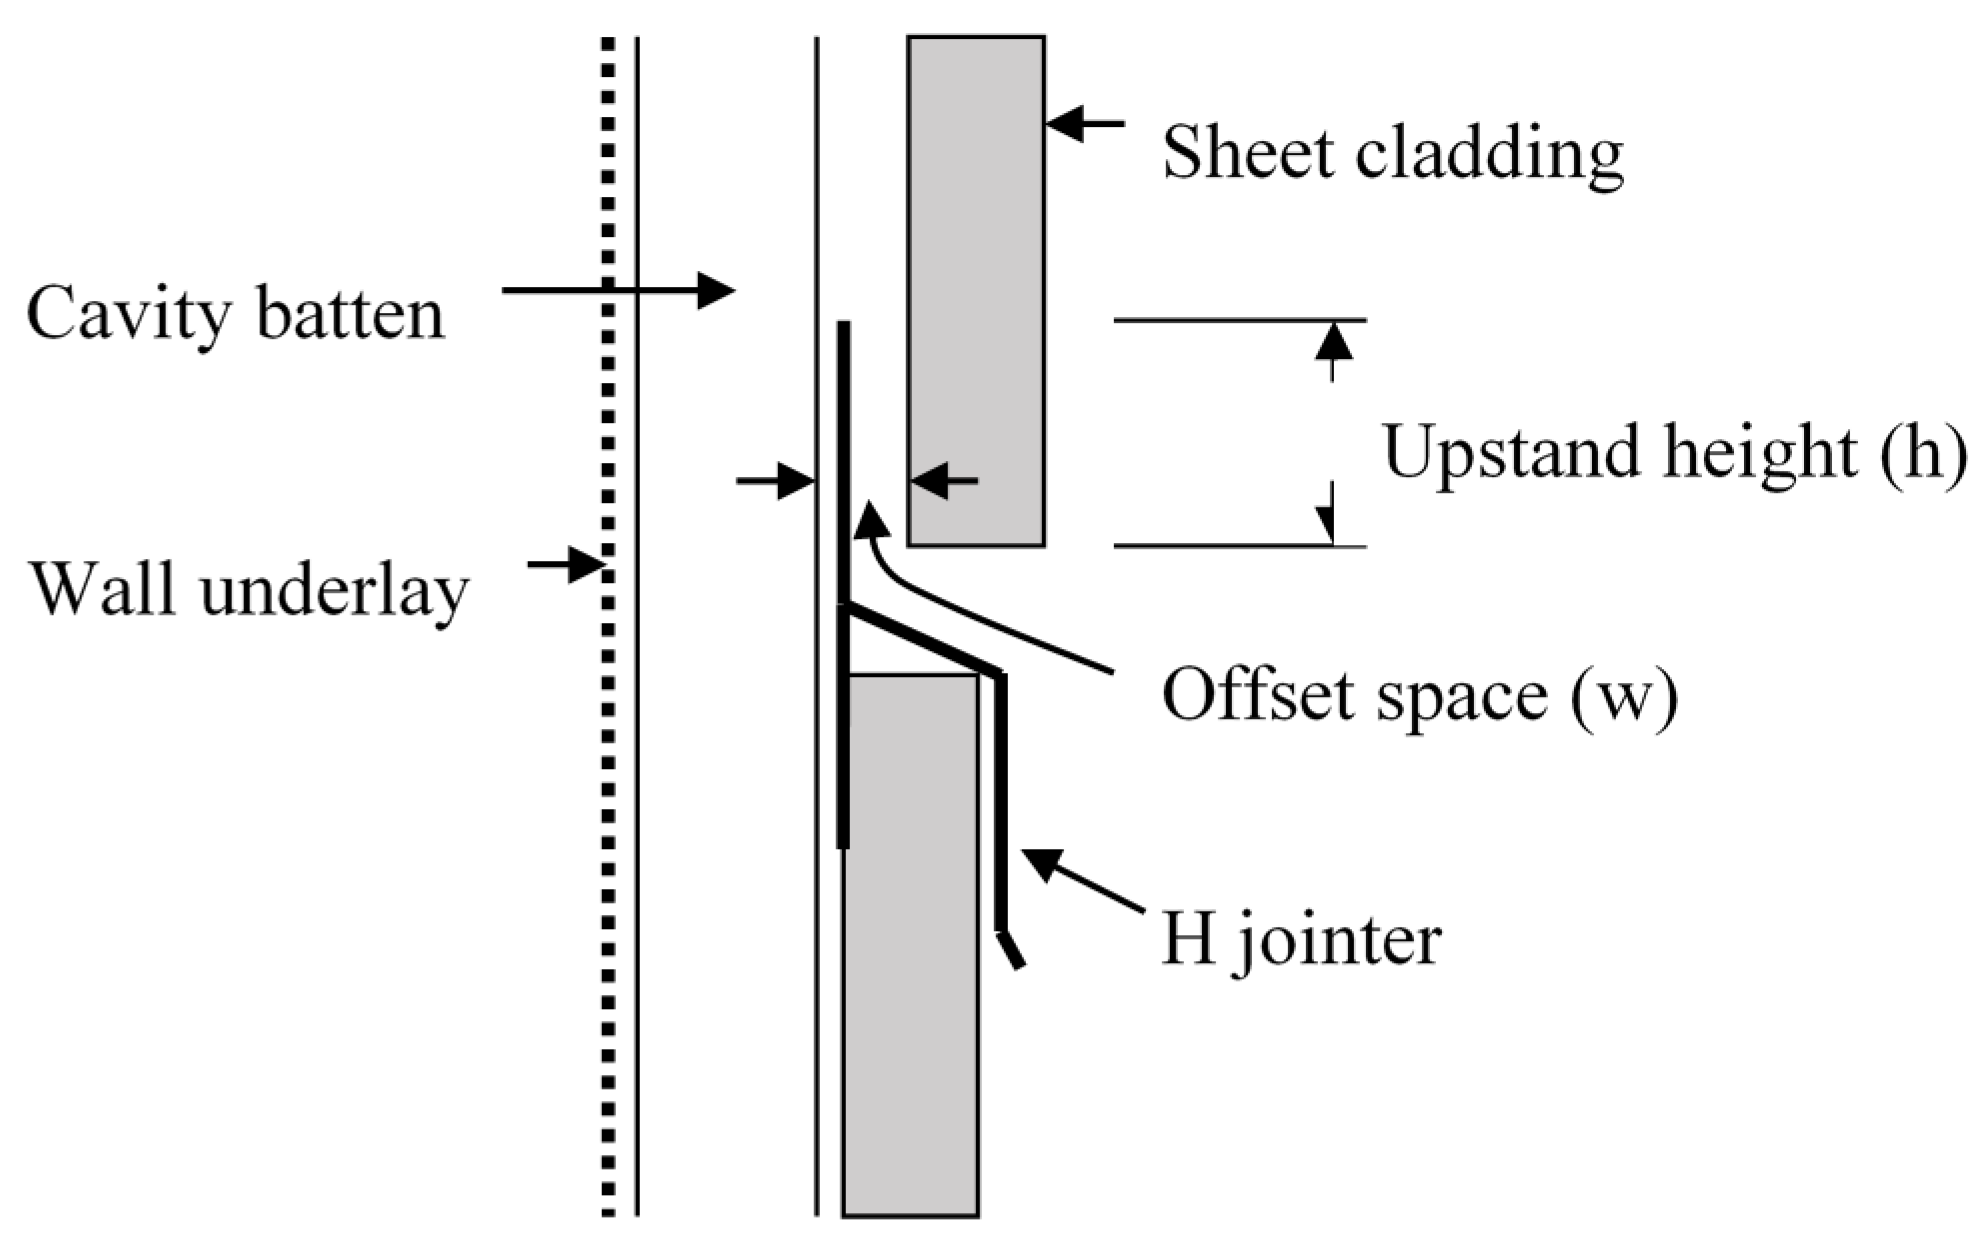
- Leakage between the up-turned leg of the jointer and the cladding. In particular the significance of the offset space width (w), the height of the upstand and the presence or absence of a hem folded into the upstanding leg;
- Leakage over the top of the lower cladding past the lower legs of the H jointer—not investigated here.
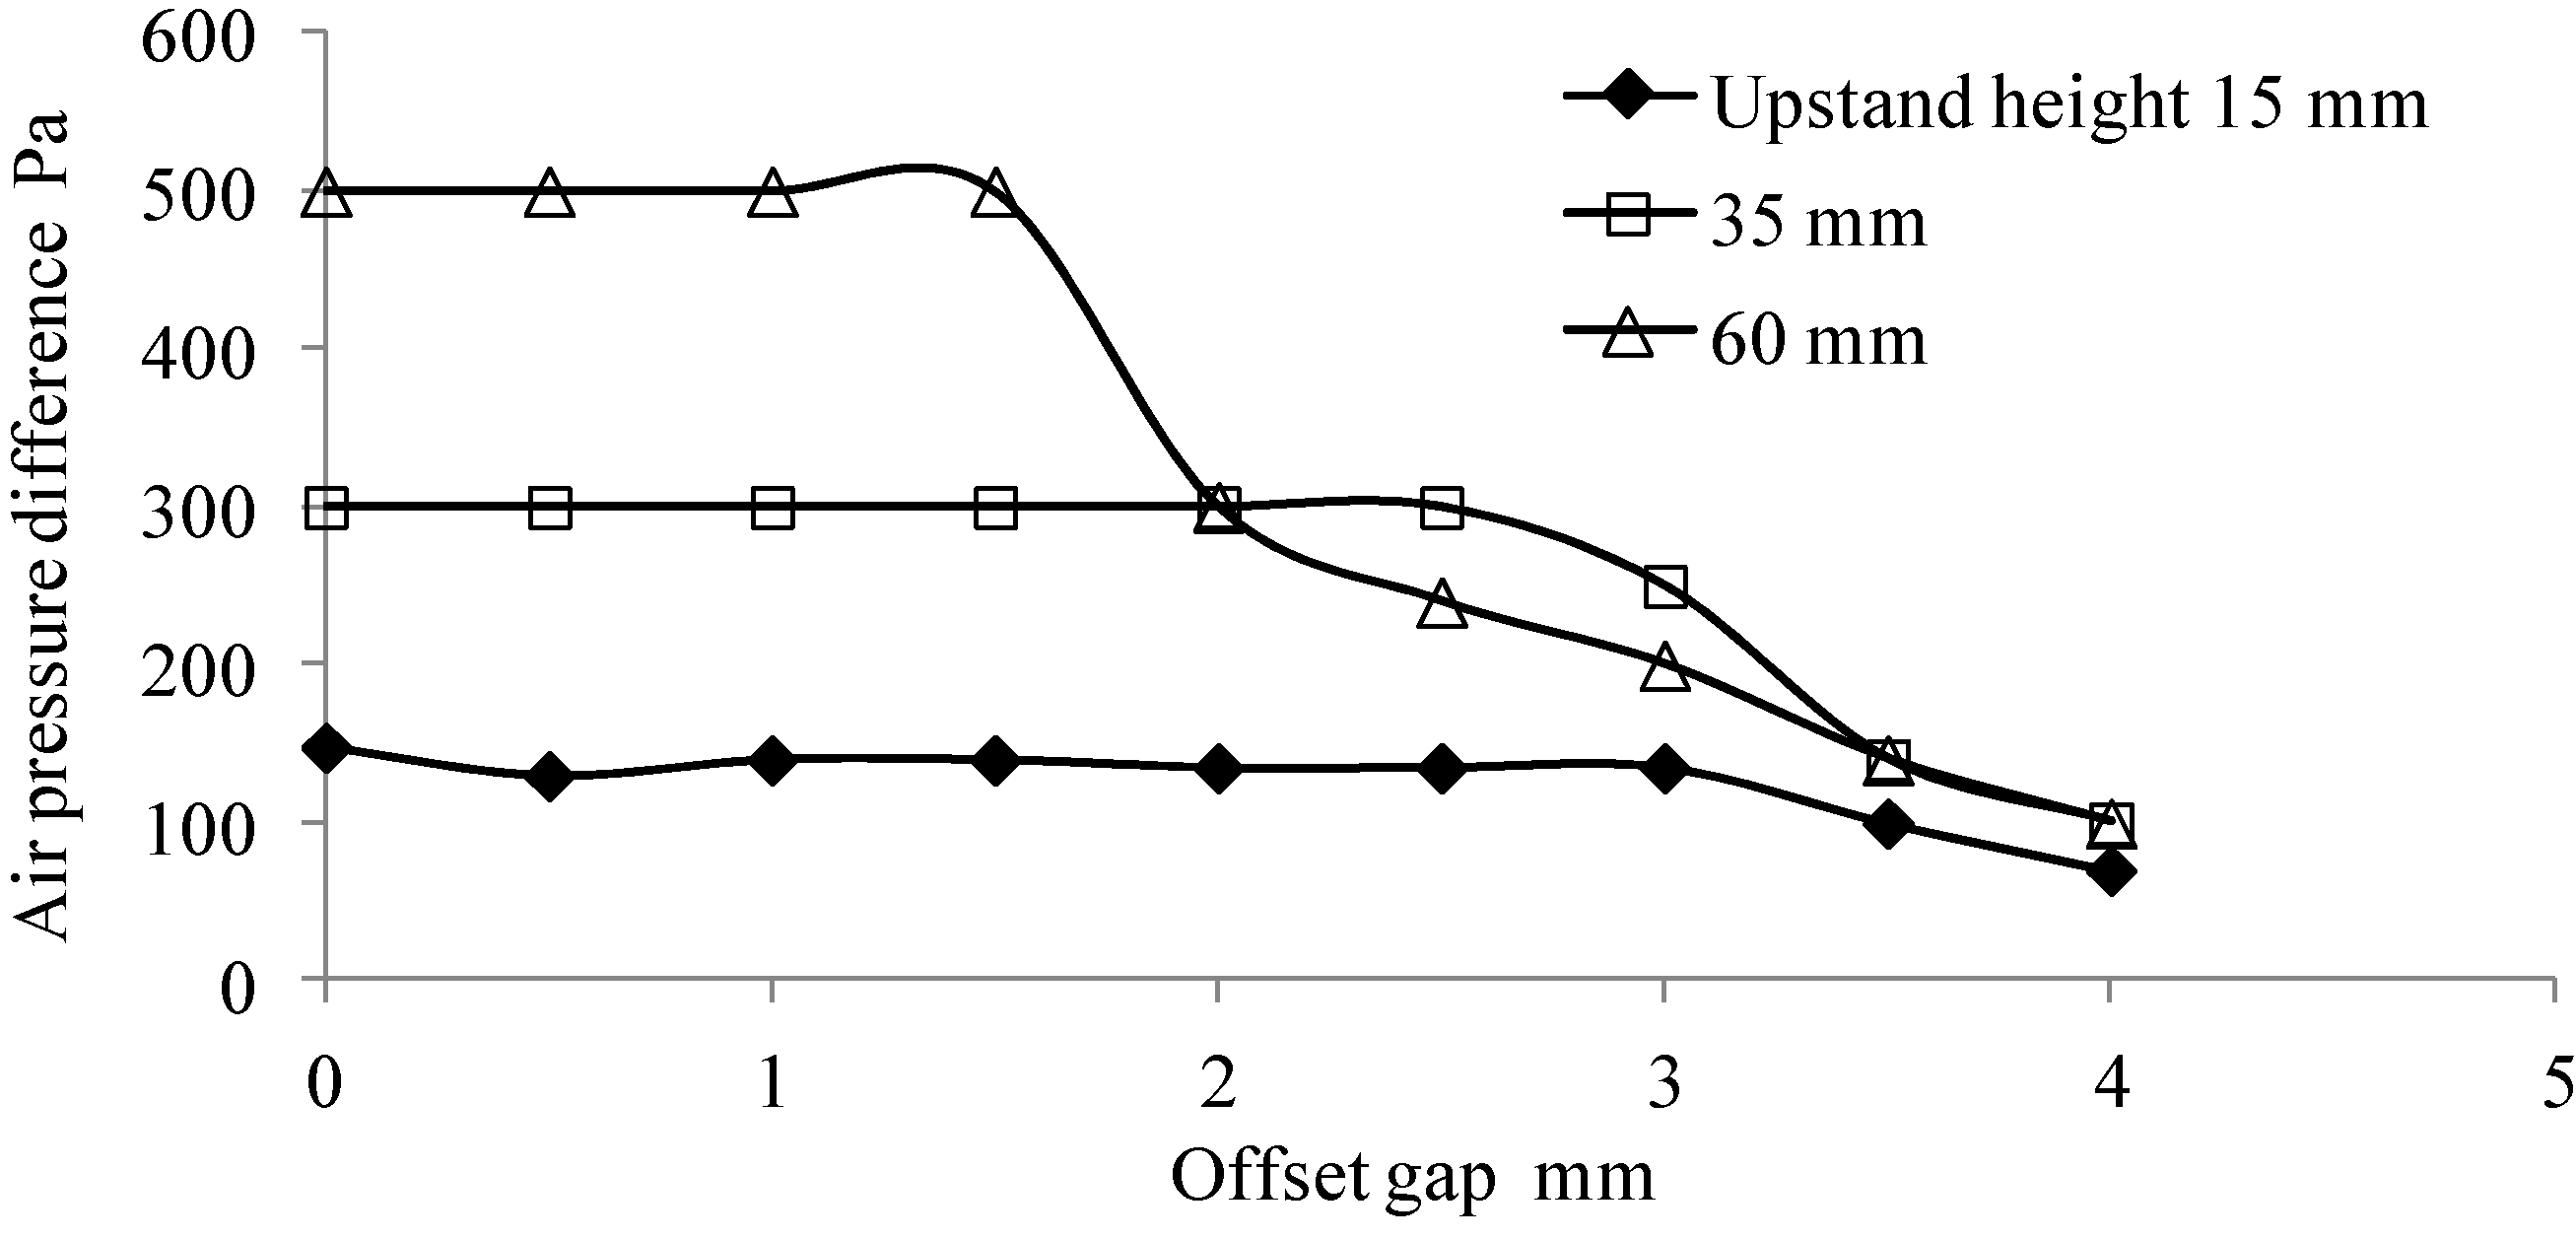
4.1. Significance of Offset (Air Gaps) between the Jointer and the Cladding

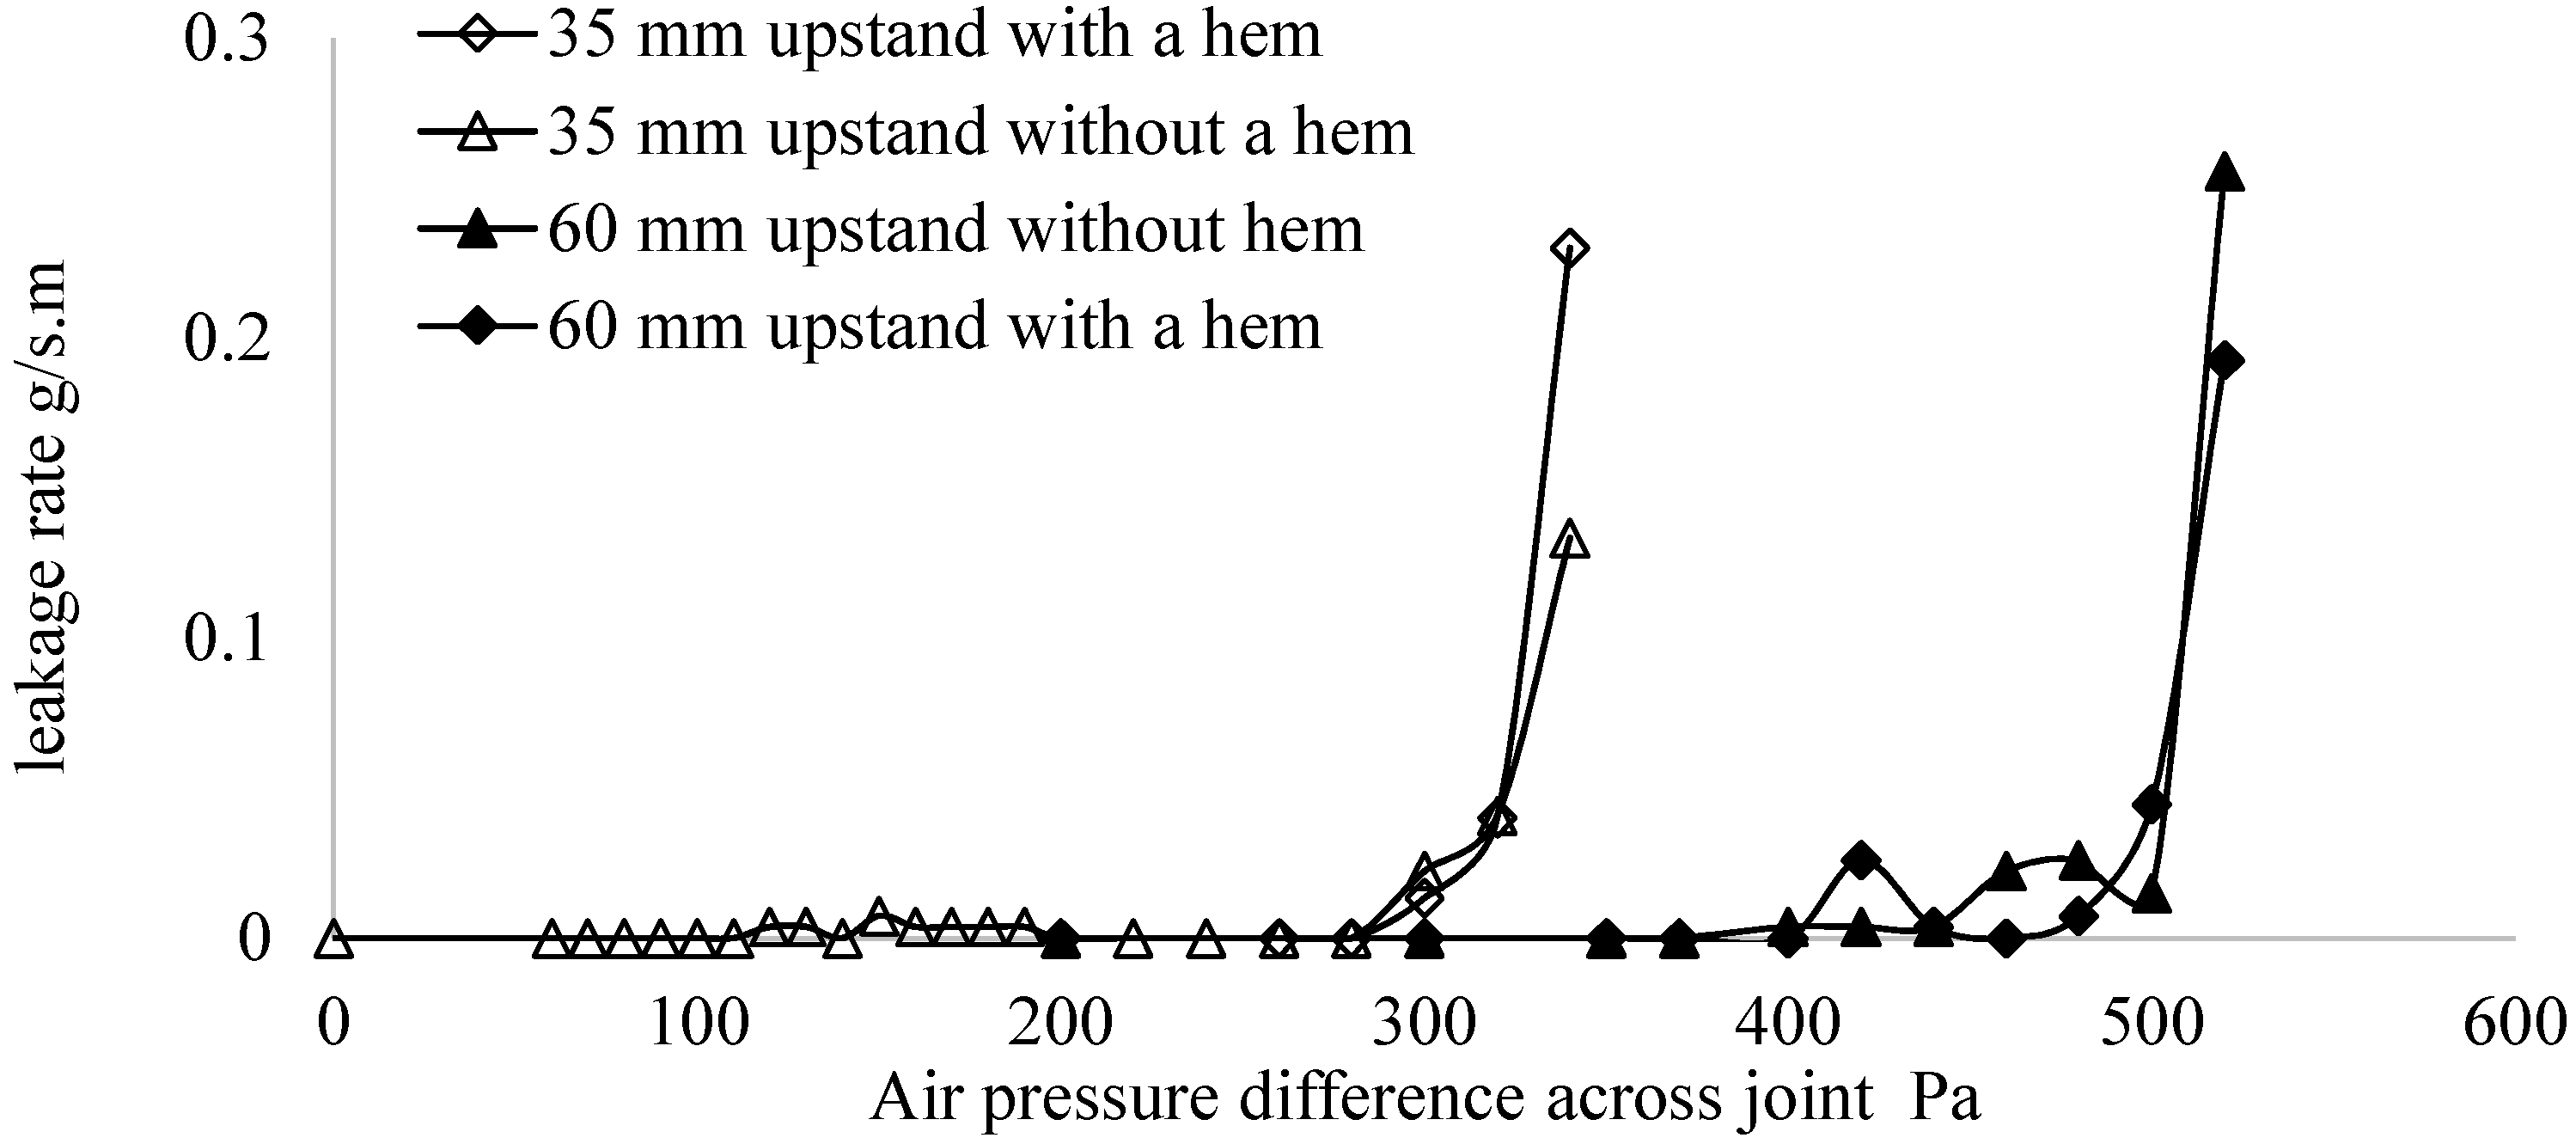
4.2. Significance of a Hem on the Upstand of the Jointer

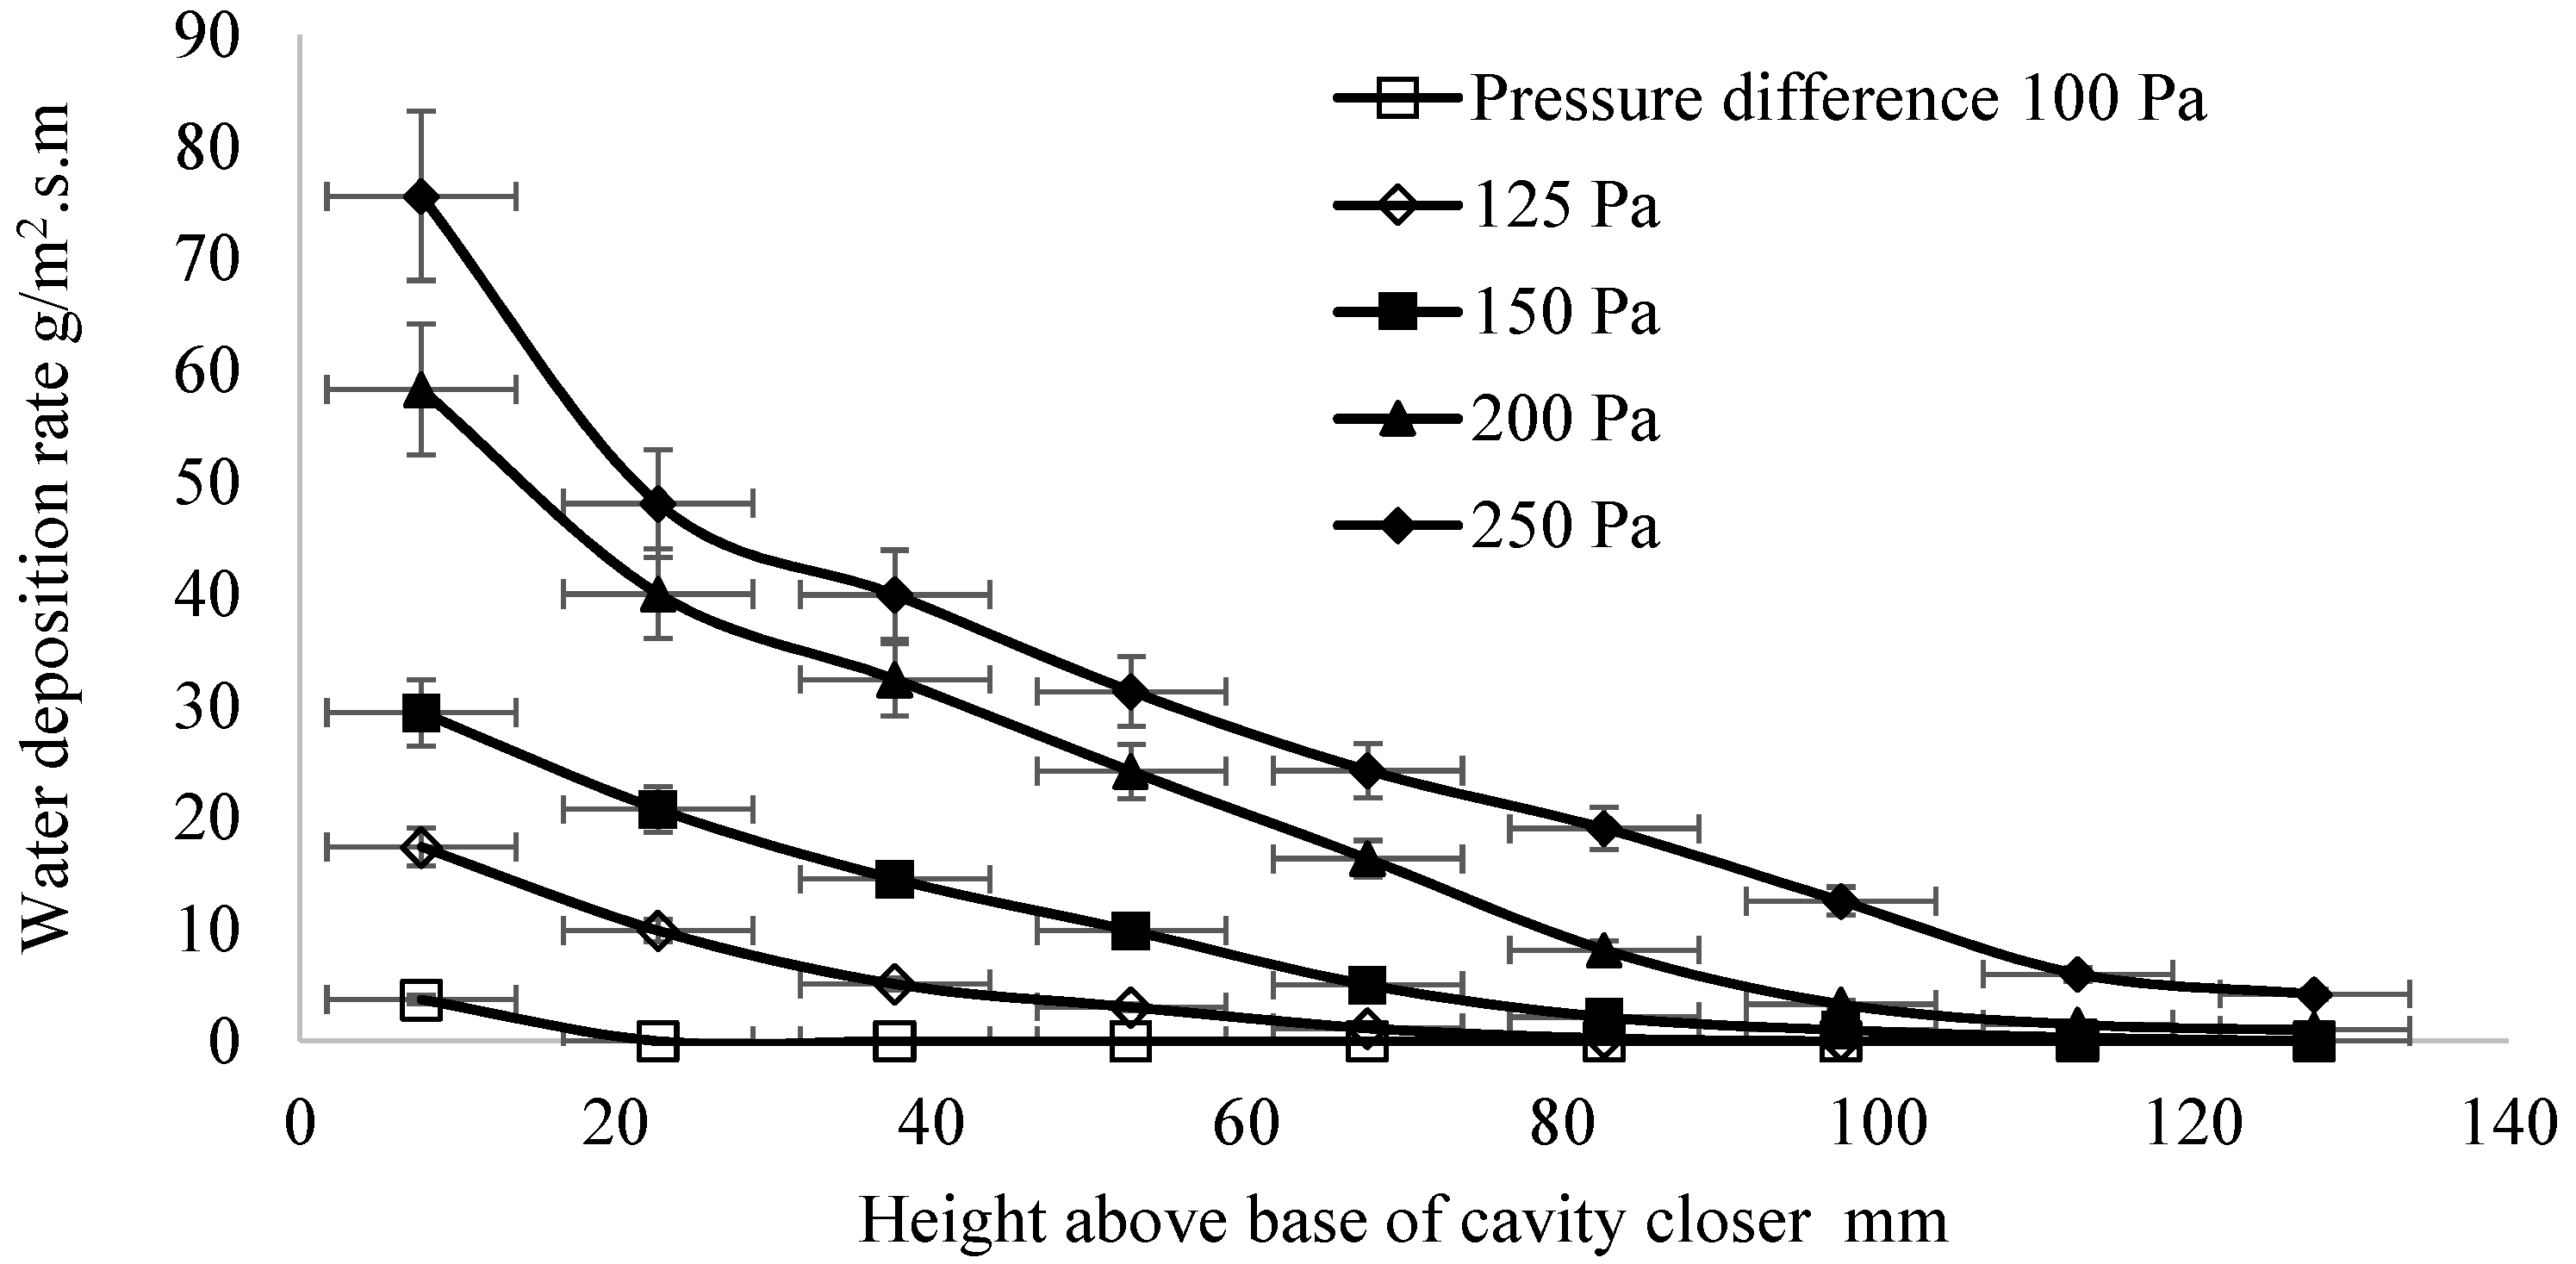
5. Leakage Characteristics of Cavity Closer in a Window Head Joint
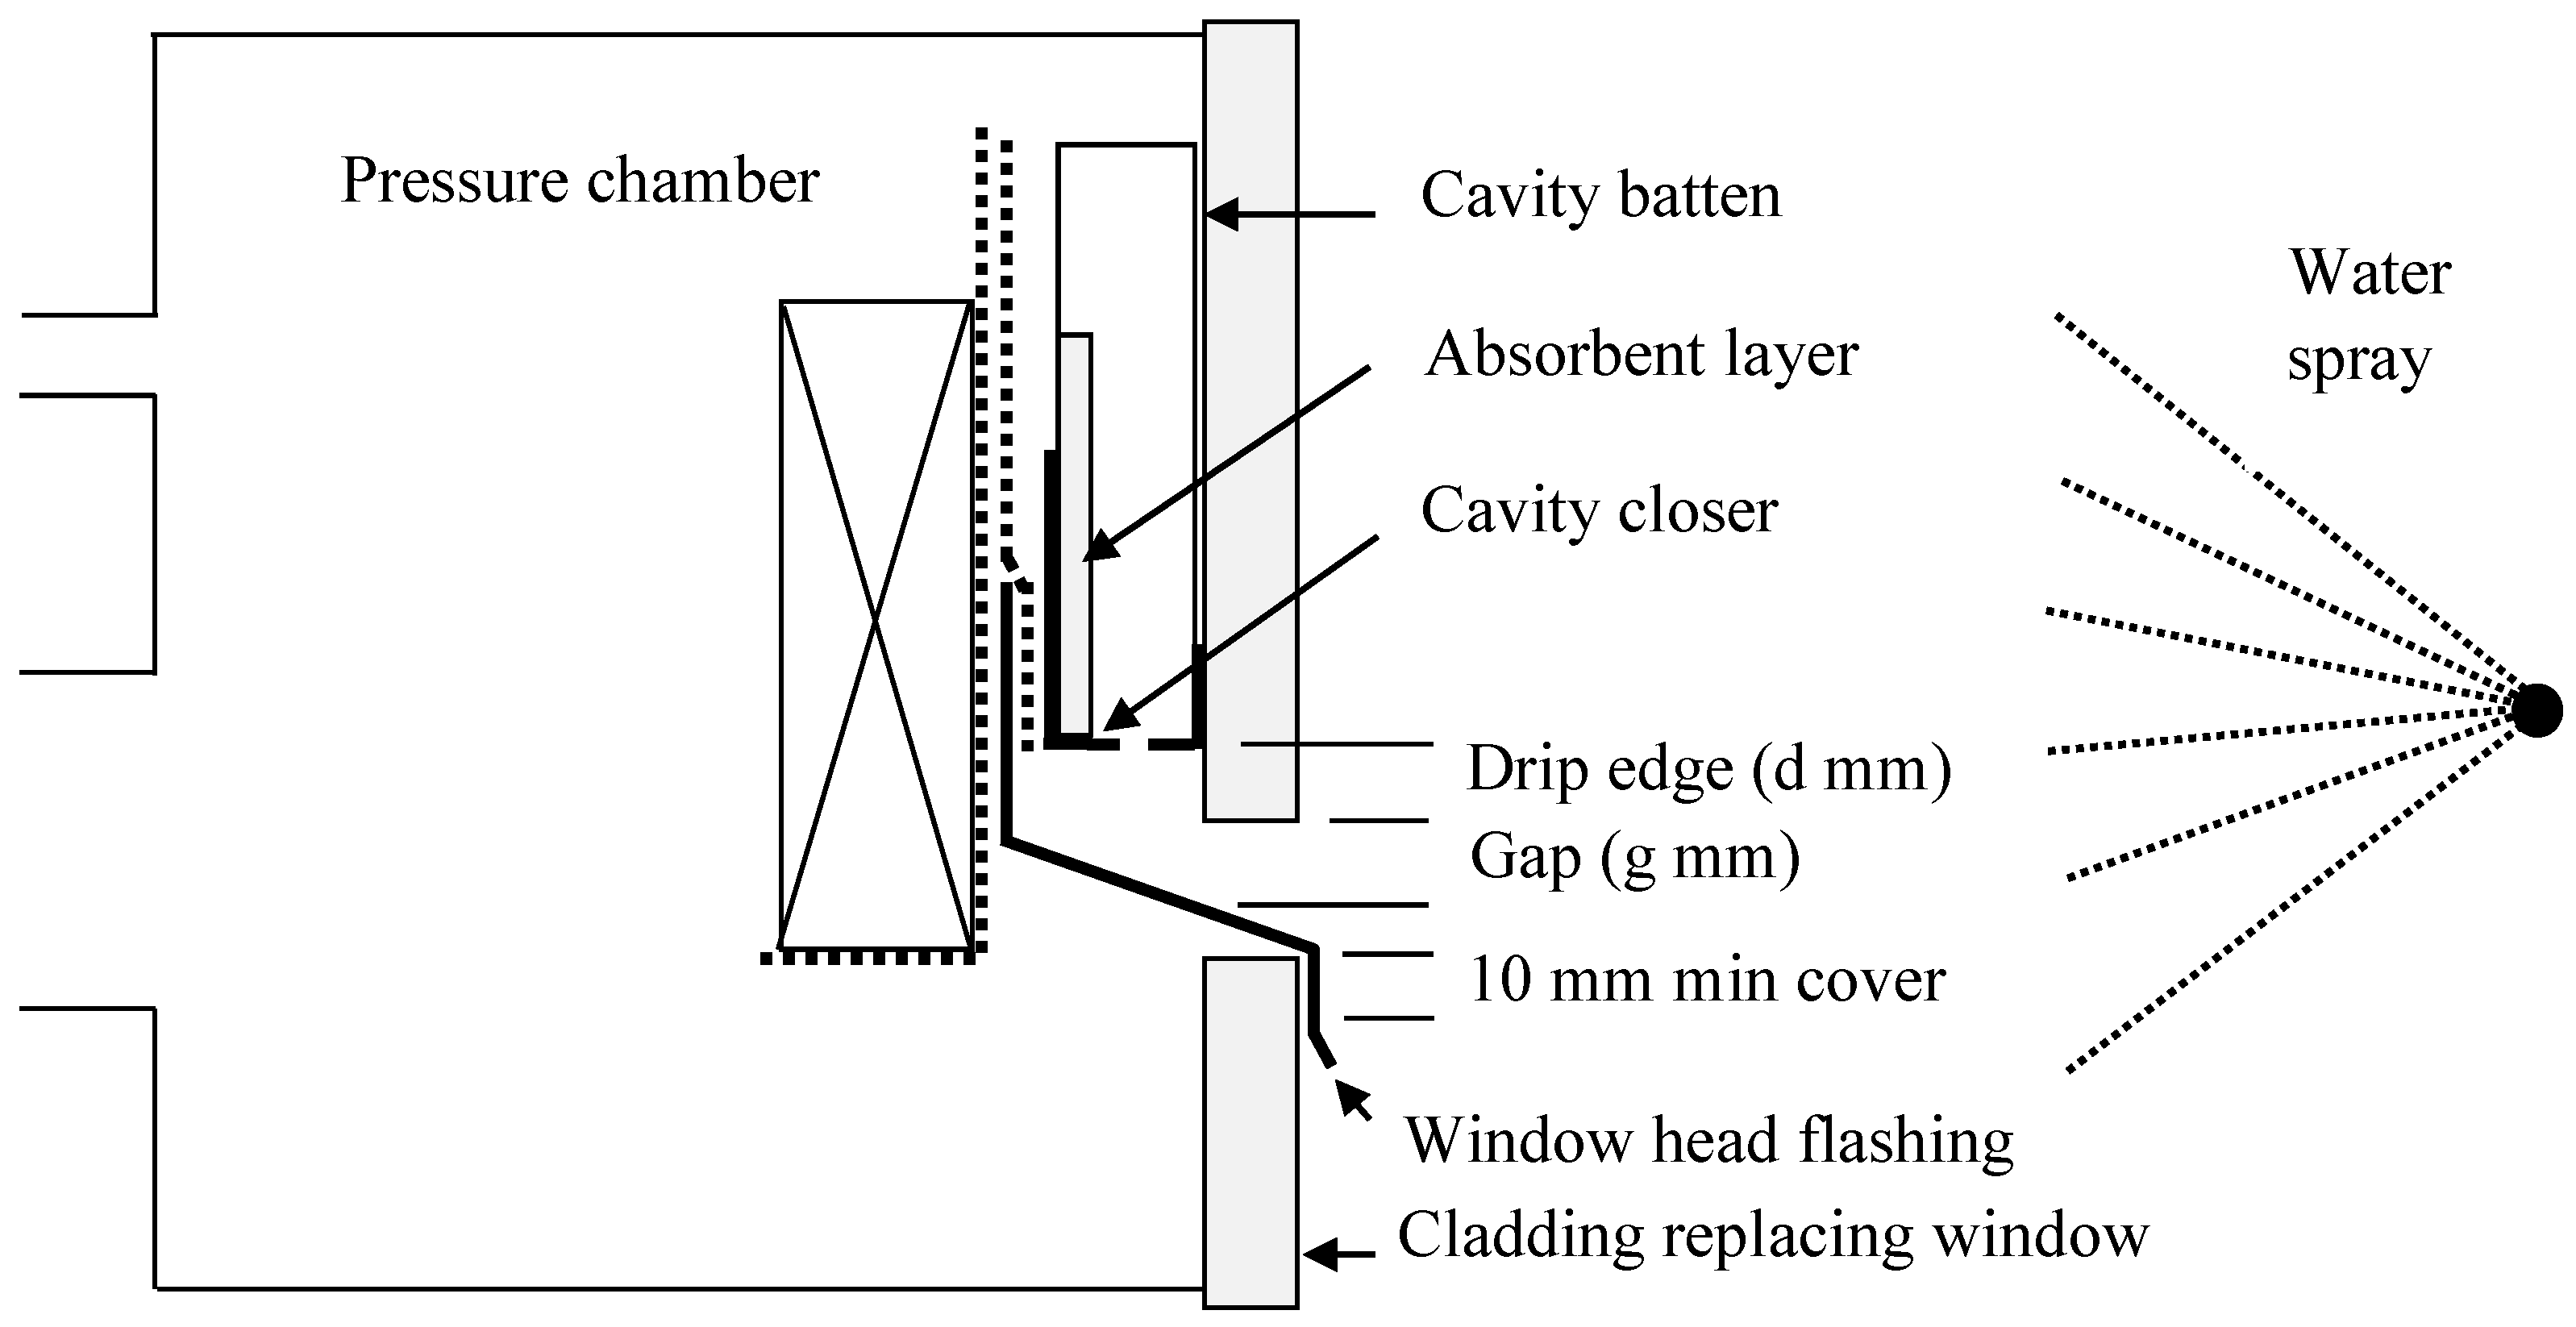
- Between the head flashing upstand and the cavity closer which is similar to the leakage path examined earlier;
- Up through vent openings in the cavity closer as examined here;
- Past the stop ends on the head flashing—not dealt with here;
- Under the flashing over the lower cladding (or window head—not dealt with here).
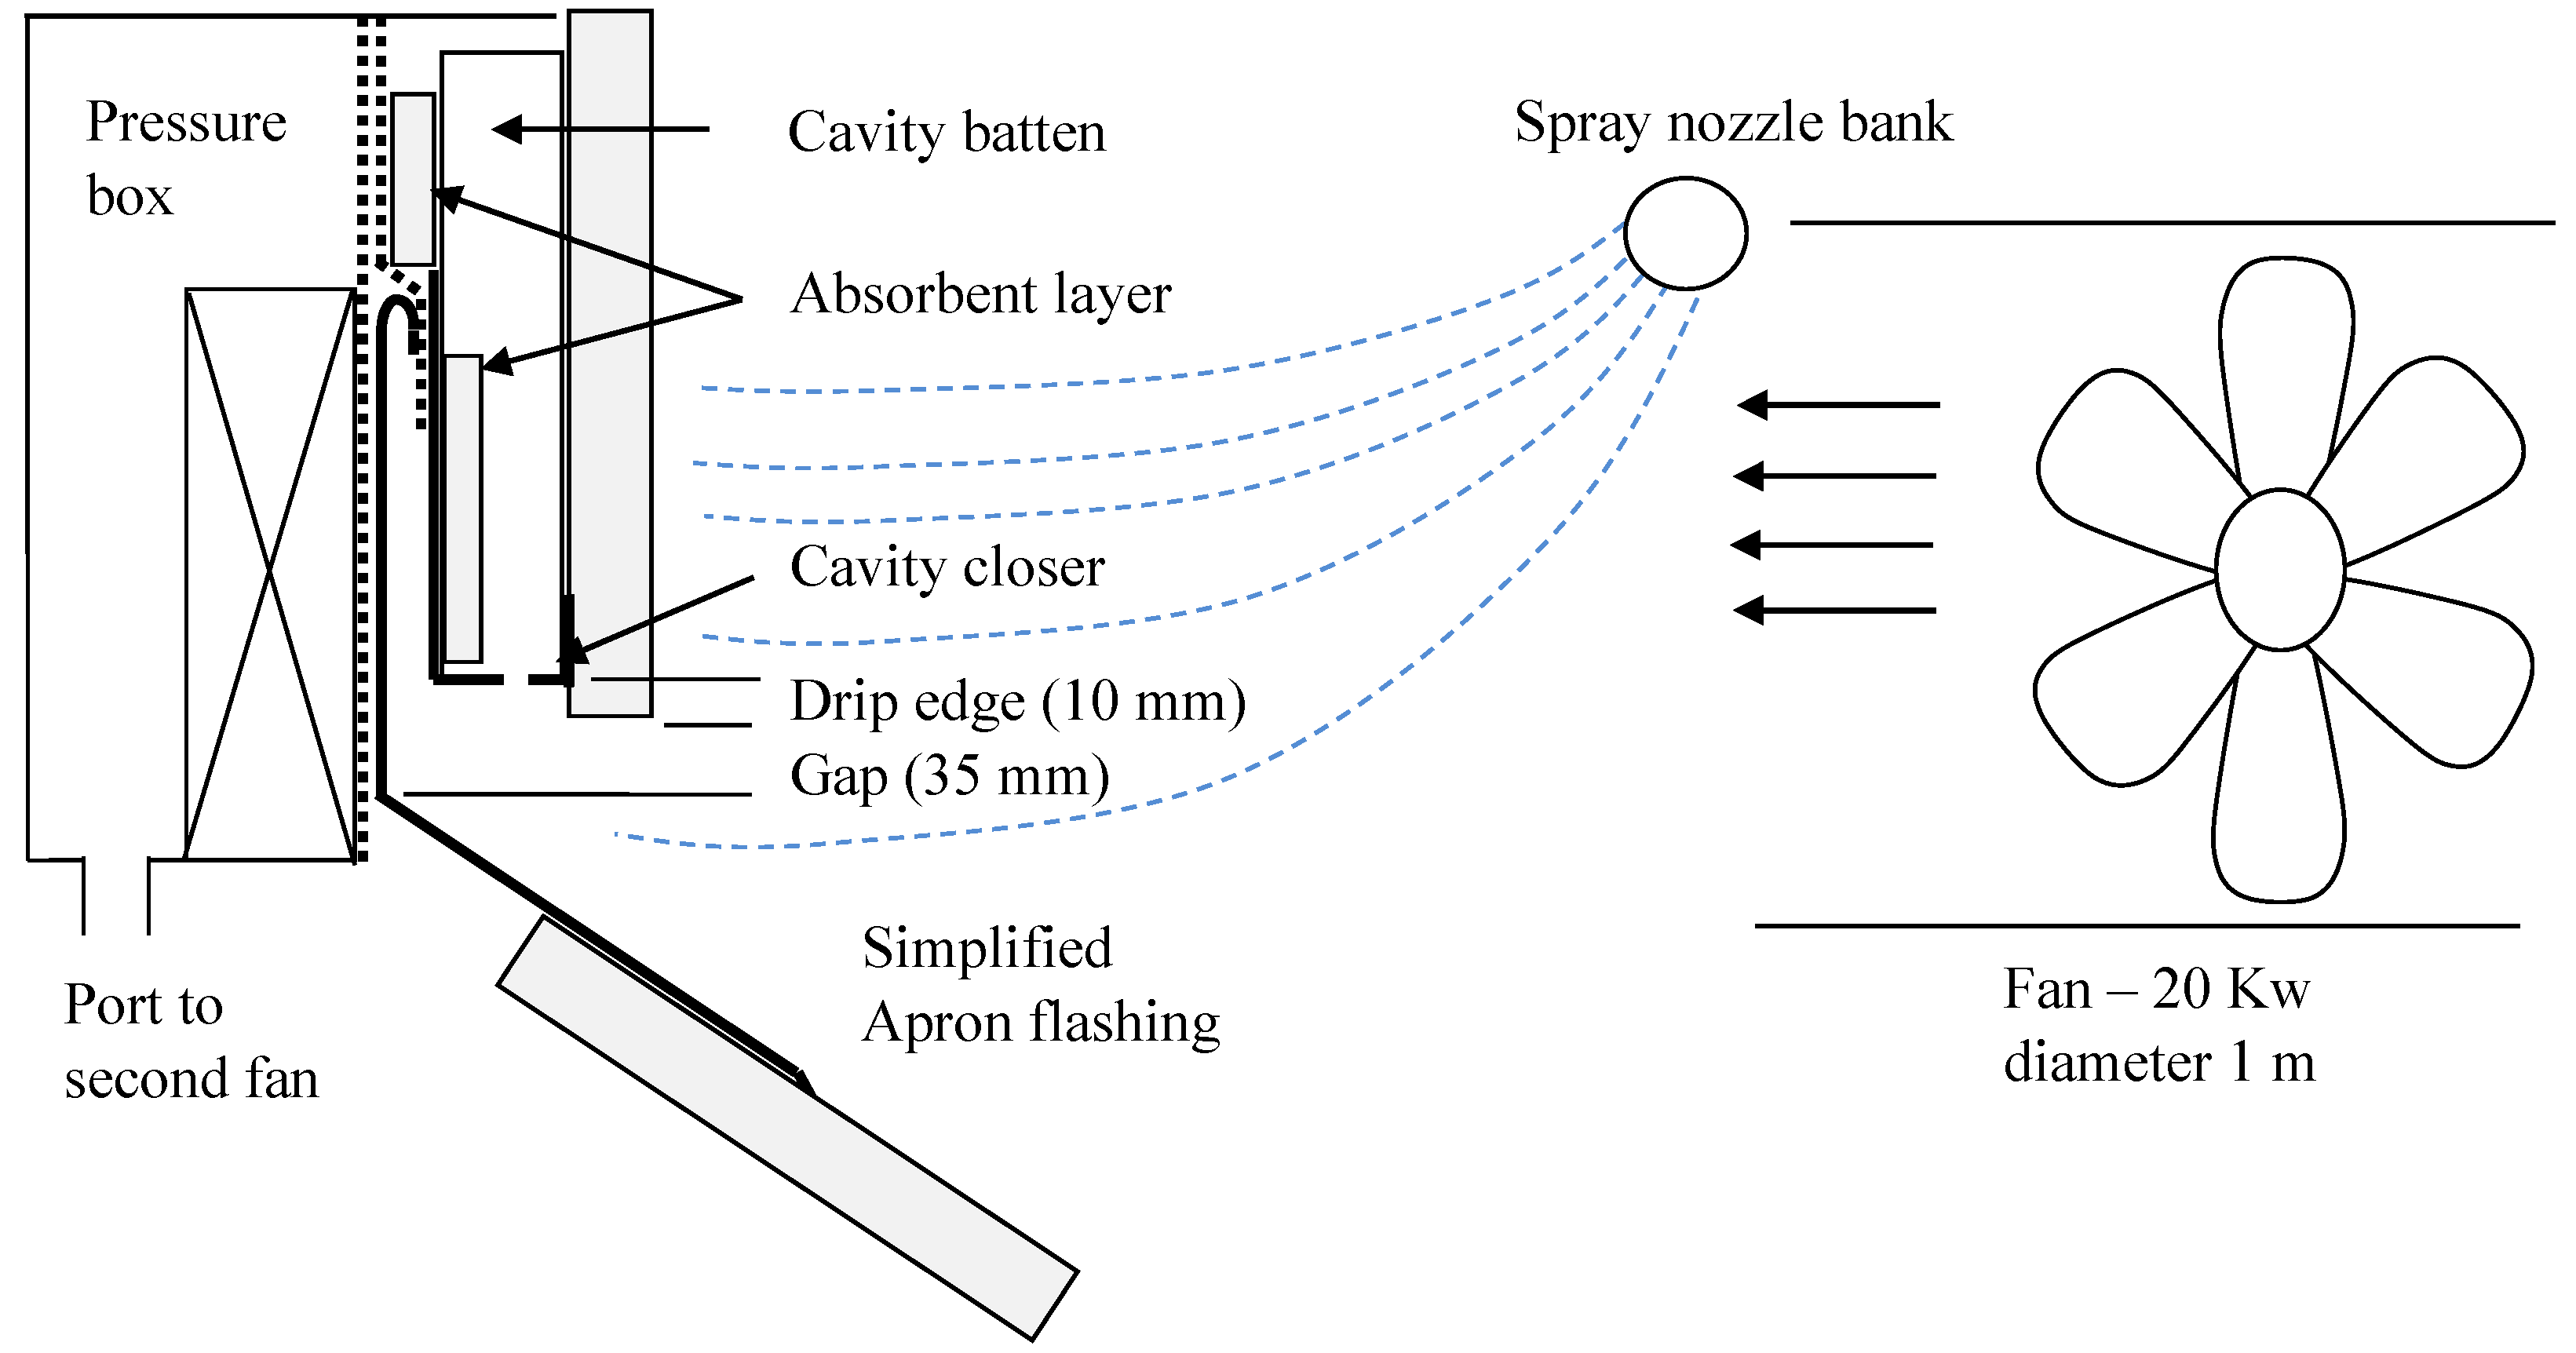
- Dependency on runoff rate over the joint achieved with a range of water spray nozzles;
- The gap between cladding and flashing (g);
- Whether the pressure was applied statically or dynamically.

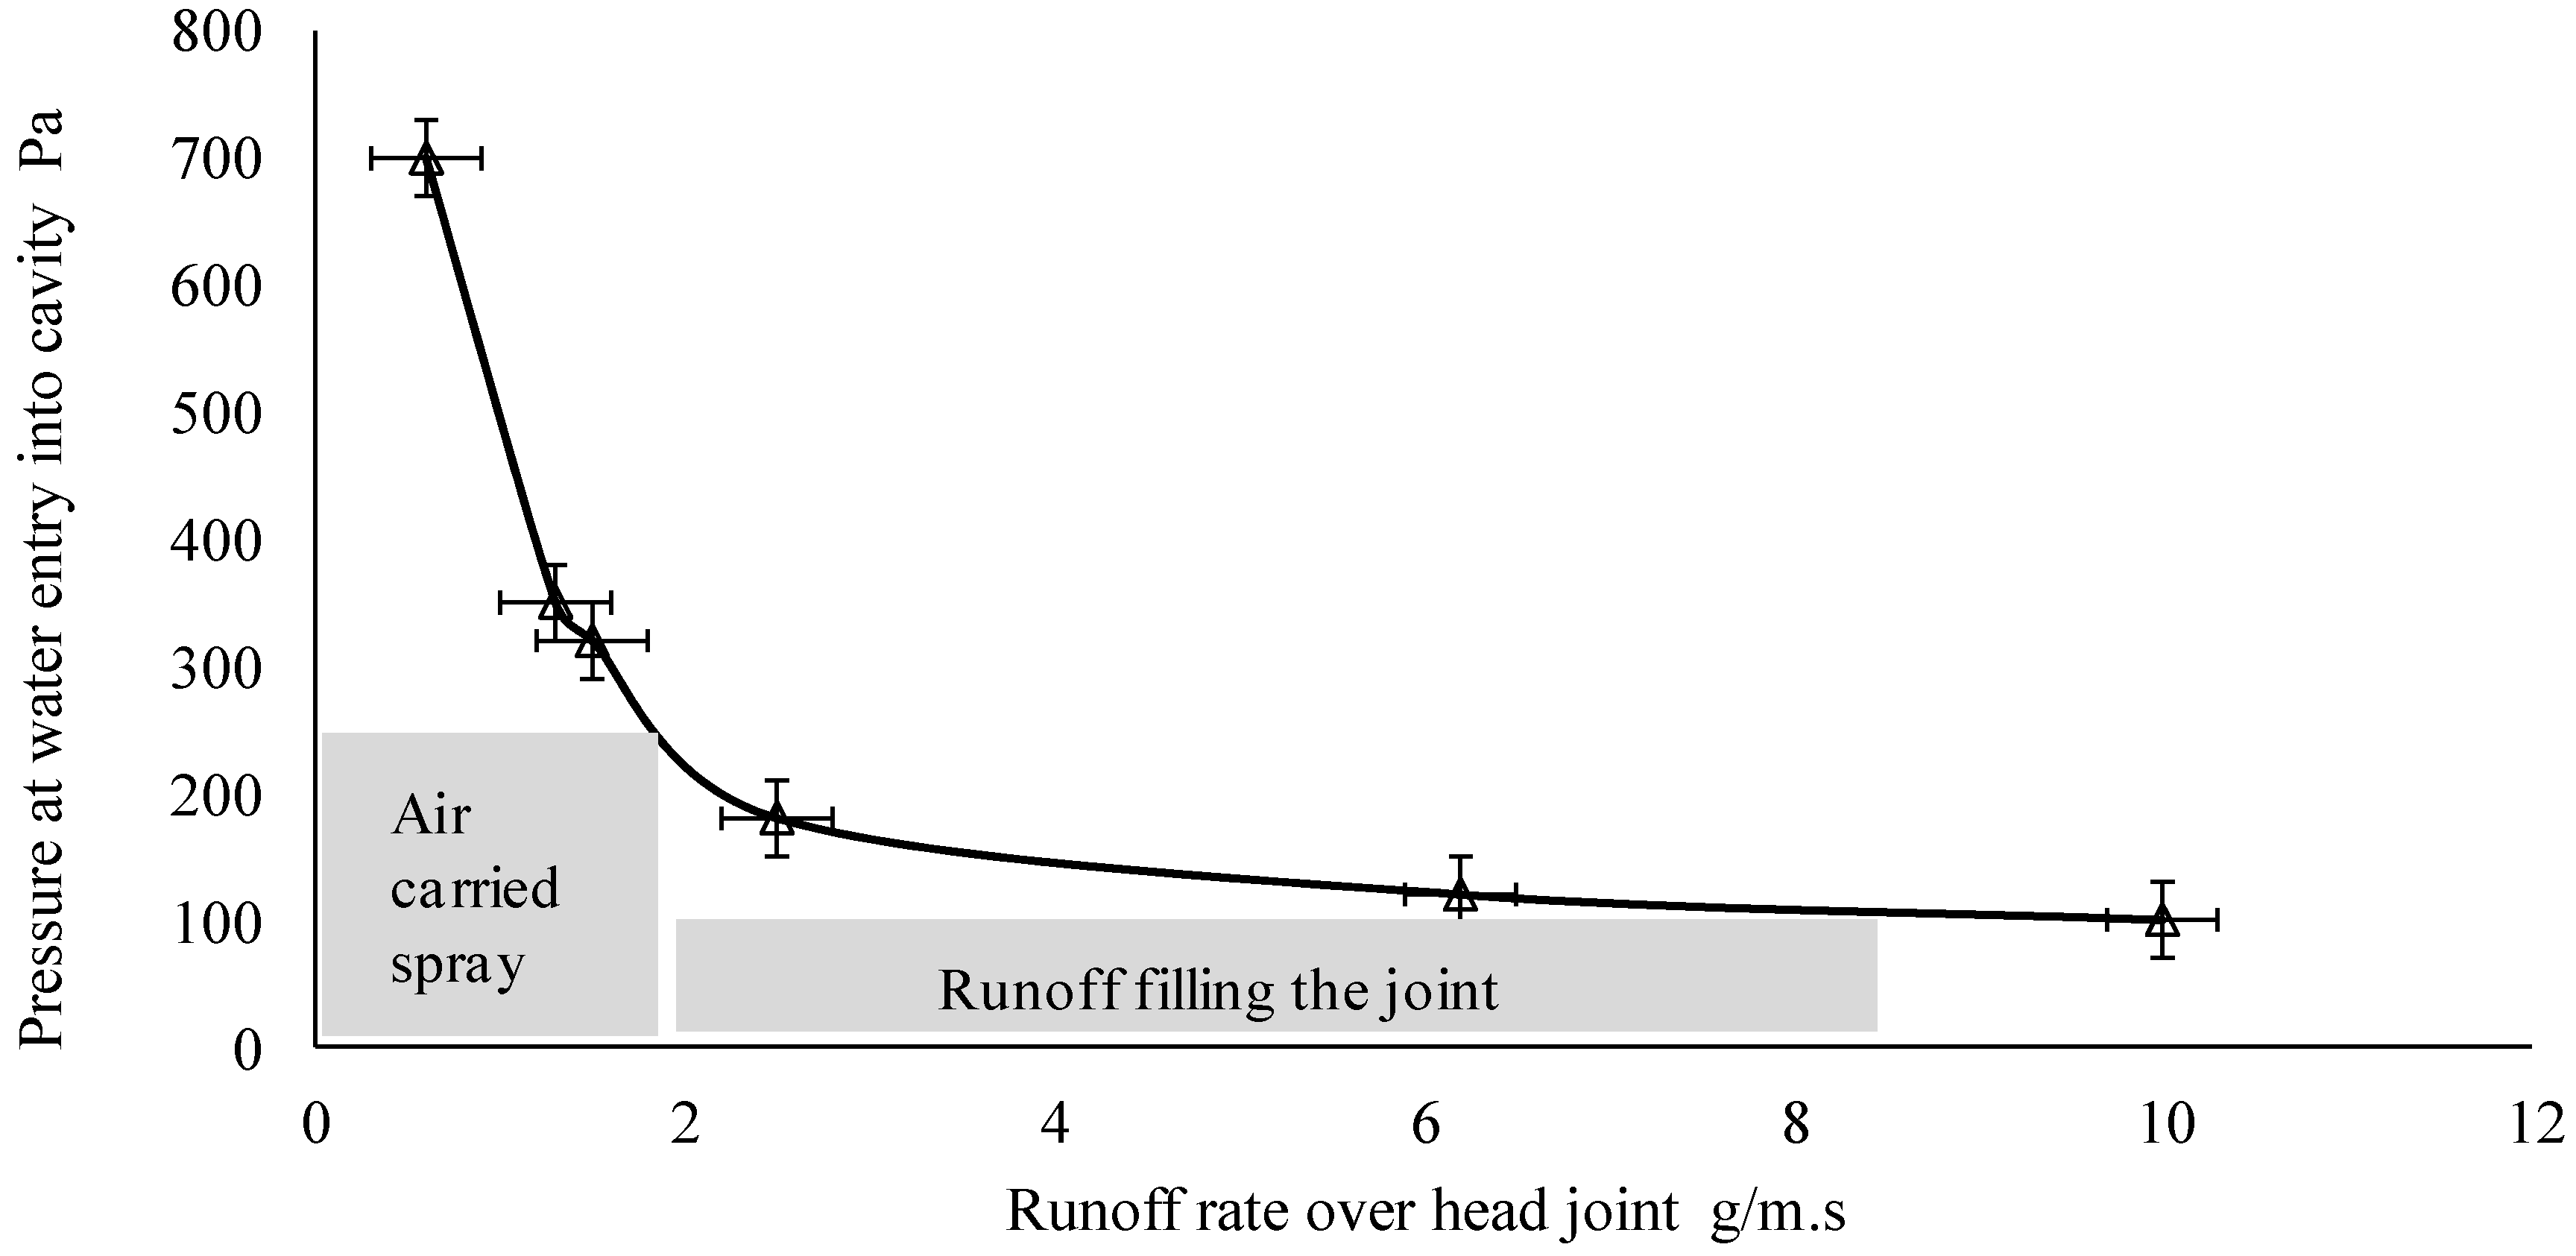
5.1. Dependency of Onset Leakage Pressures on Runoff Rate
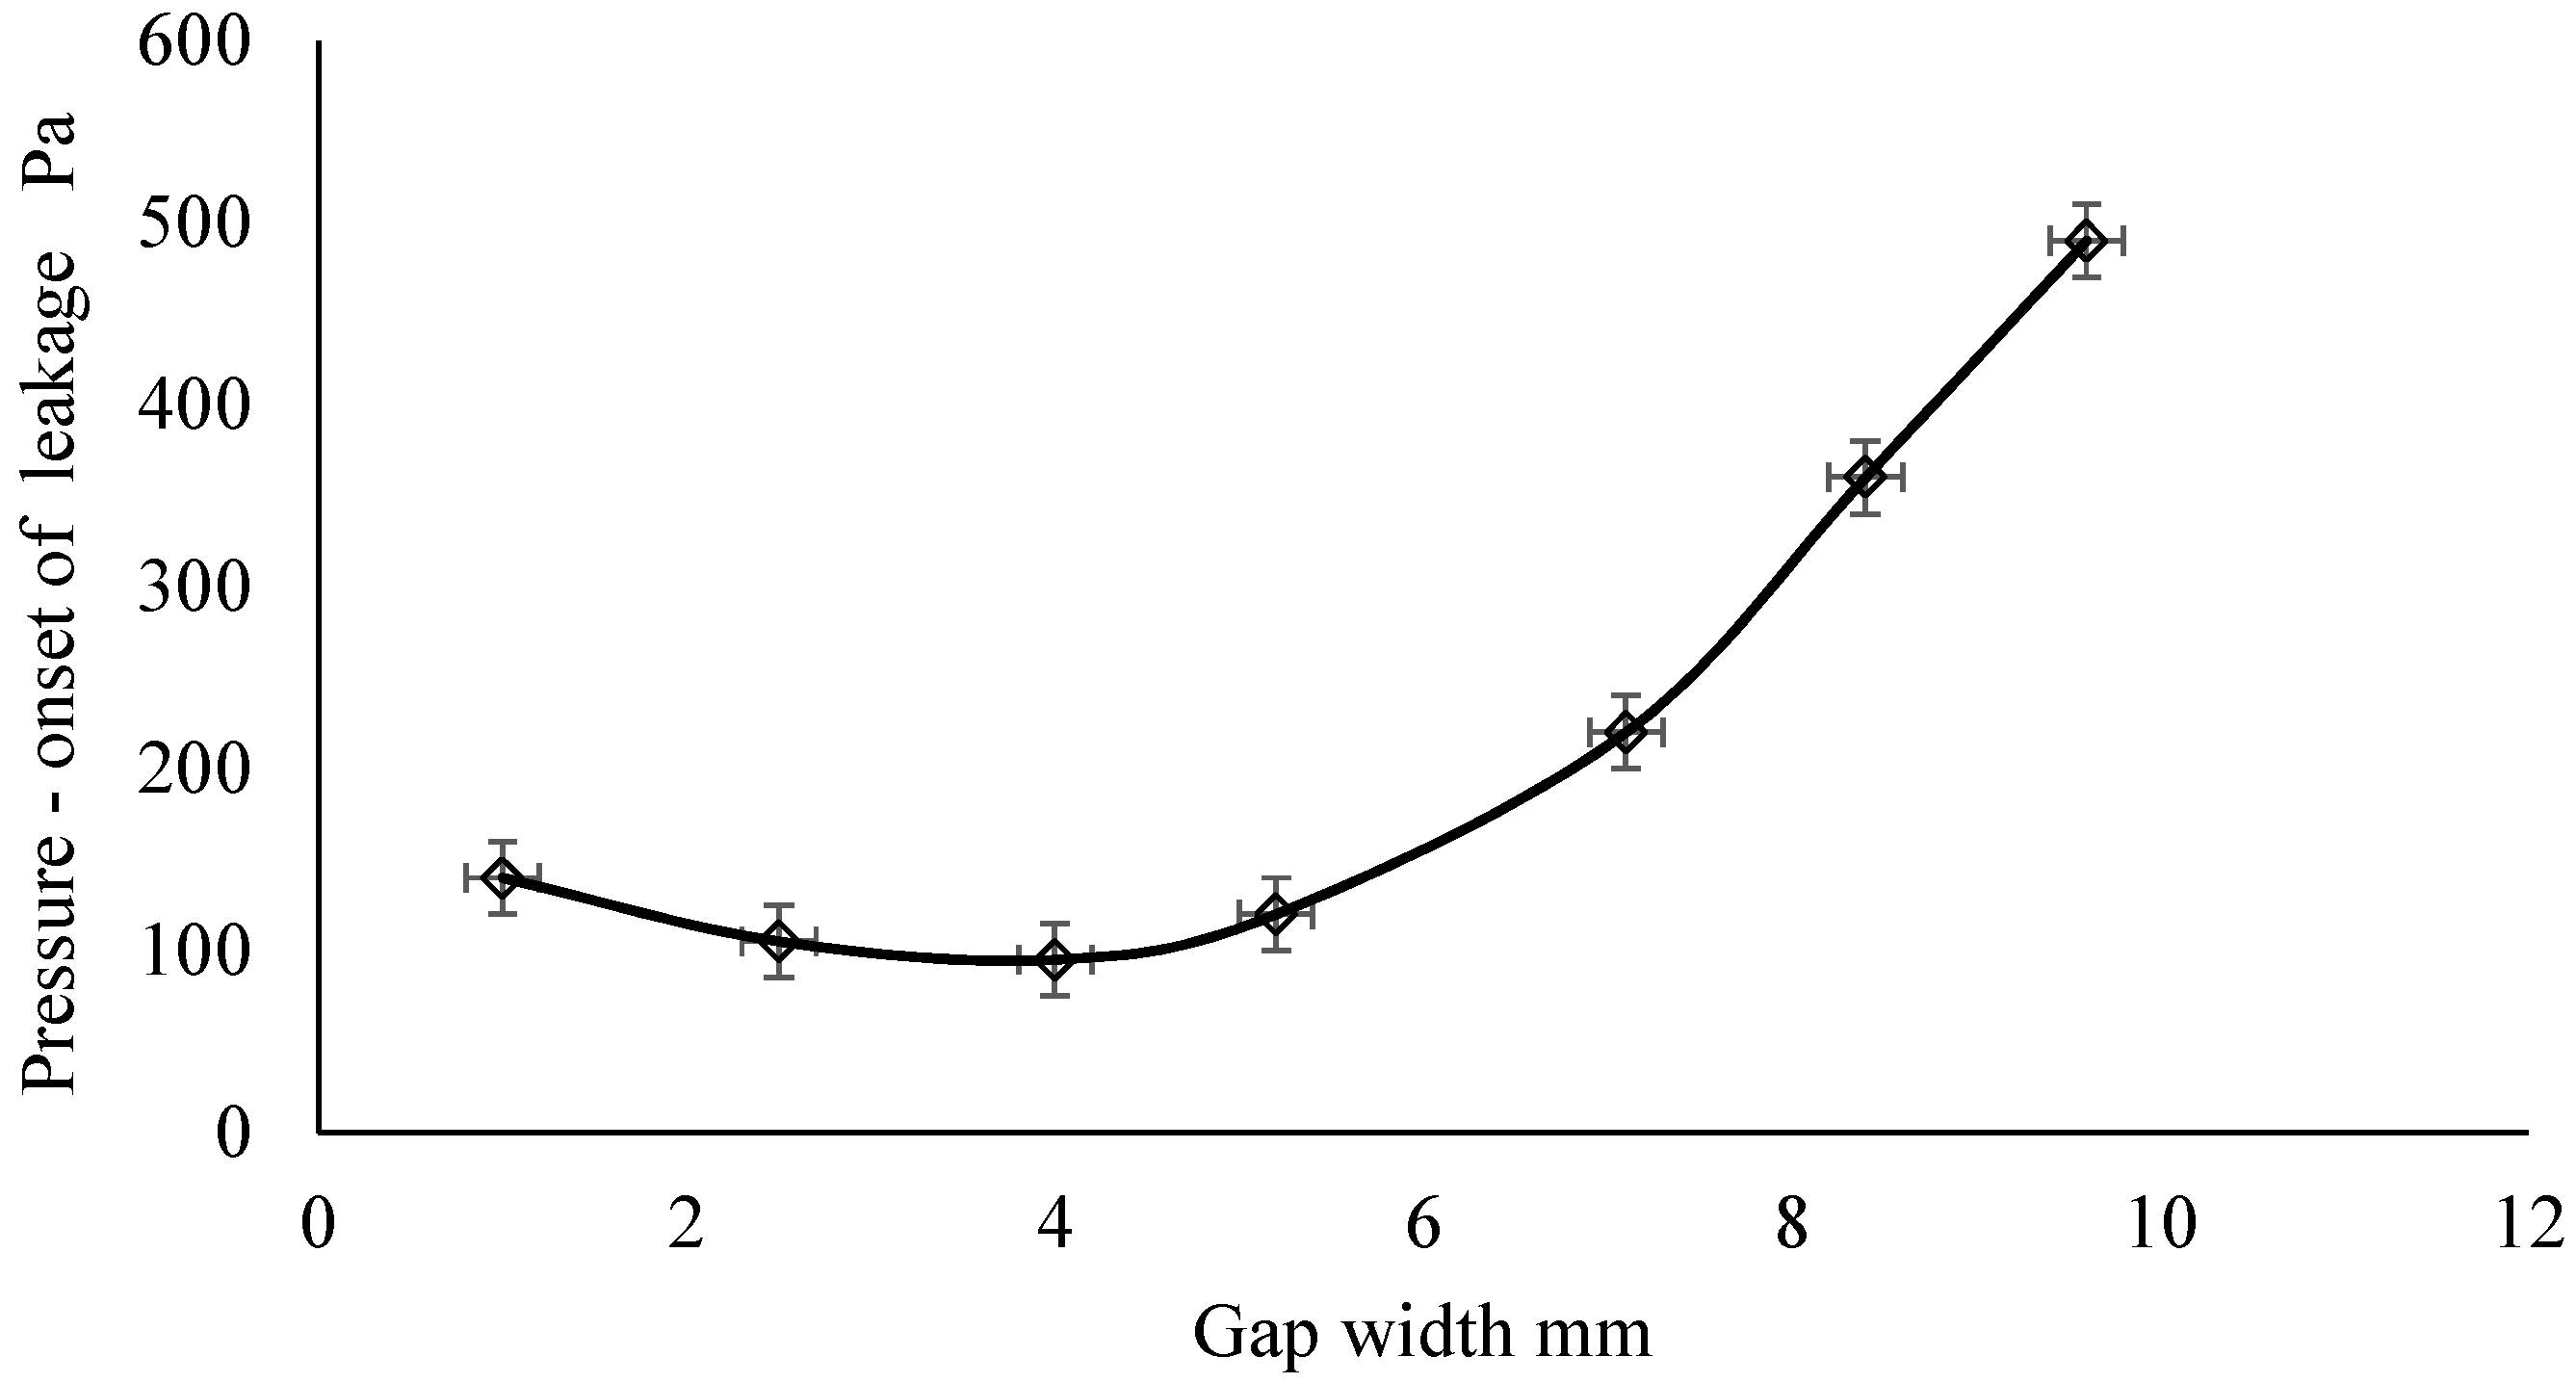
5.2. Dependency of Onset Leakage Pressures on Gap between Cladding and Head Flashing


| Case | Water Leakage Description |
|---|---|
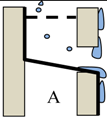 | Case A: Gap width (g) = 5 mm and the run-off rate is less than 2 g/m·s. The gap is not significantly occluded by run-off, and the flashing drains out effectively. Above a wind pressure of 200–300 Pa, air flow through the joint entrains small droplets, which pass through into the cavity. |
 | Case B: Gap width (g) = 5 mm and the run-off rate is larger than 2 g/m·s. The gap is now occluded by run-off, and sufficient wind pressure is supported at the outer joint to drag water into the joint. Higher air velocities through the occluded opening drag water past the cavity closer at pressure differences around 100 Pa. |
 | Case C: Gap width increased to (g) = 8 mm and the run-off rate is the same as Case A (below 2 g/m·s). The gap is no longer occluded by run-off, and the flashing drains out effectively. Beyond a wind pressure of 350 Pa, air flow through the joint entrains small droplets with leakage rates (0.015 g/m·s at 360 Pa). |
 | Case D: Gap width decreased to (g) = 3 mm and the run-off rate is unchanged at 2 g/m·s. Now the gap is almost entirely occluded by run-off, and the flashing does not drain until both the wind pressure and run-off rate relax. Water leakage past the cavity closer is initially low but increases rapidly when the pressure difference exceeds the hydrostatic head distance (d) to the cavity closer. |
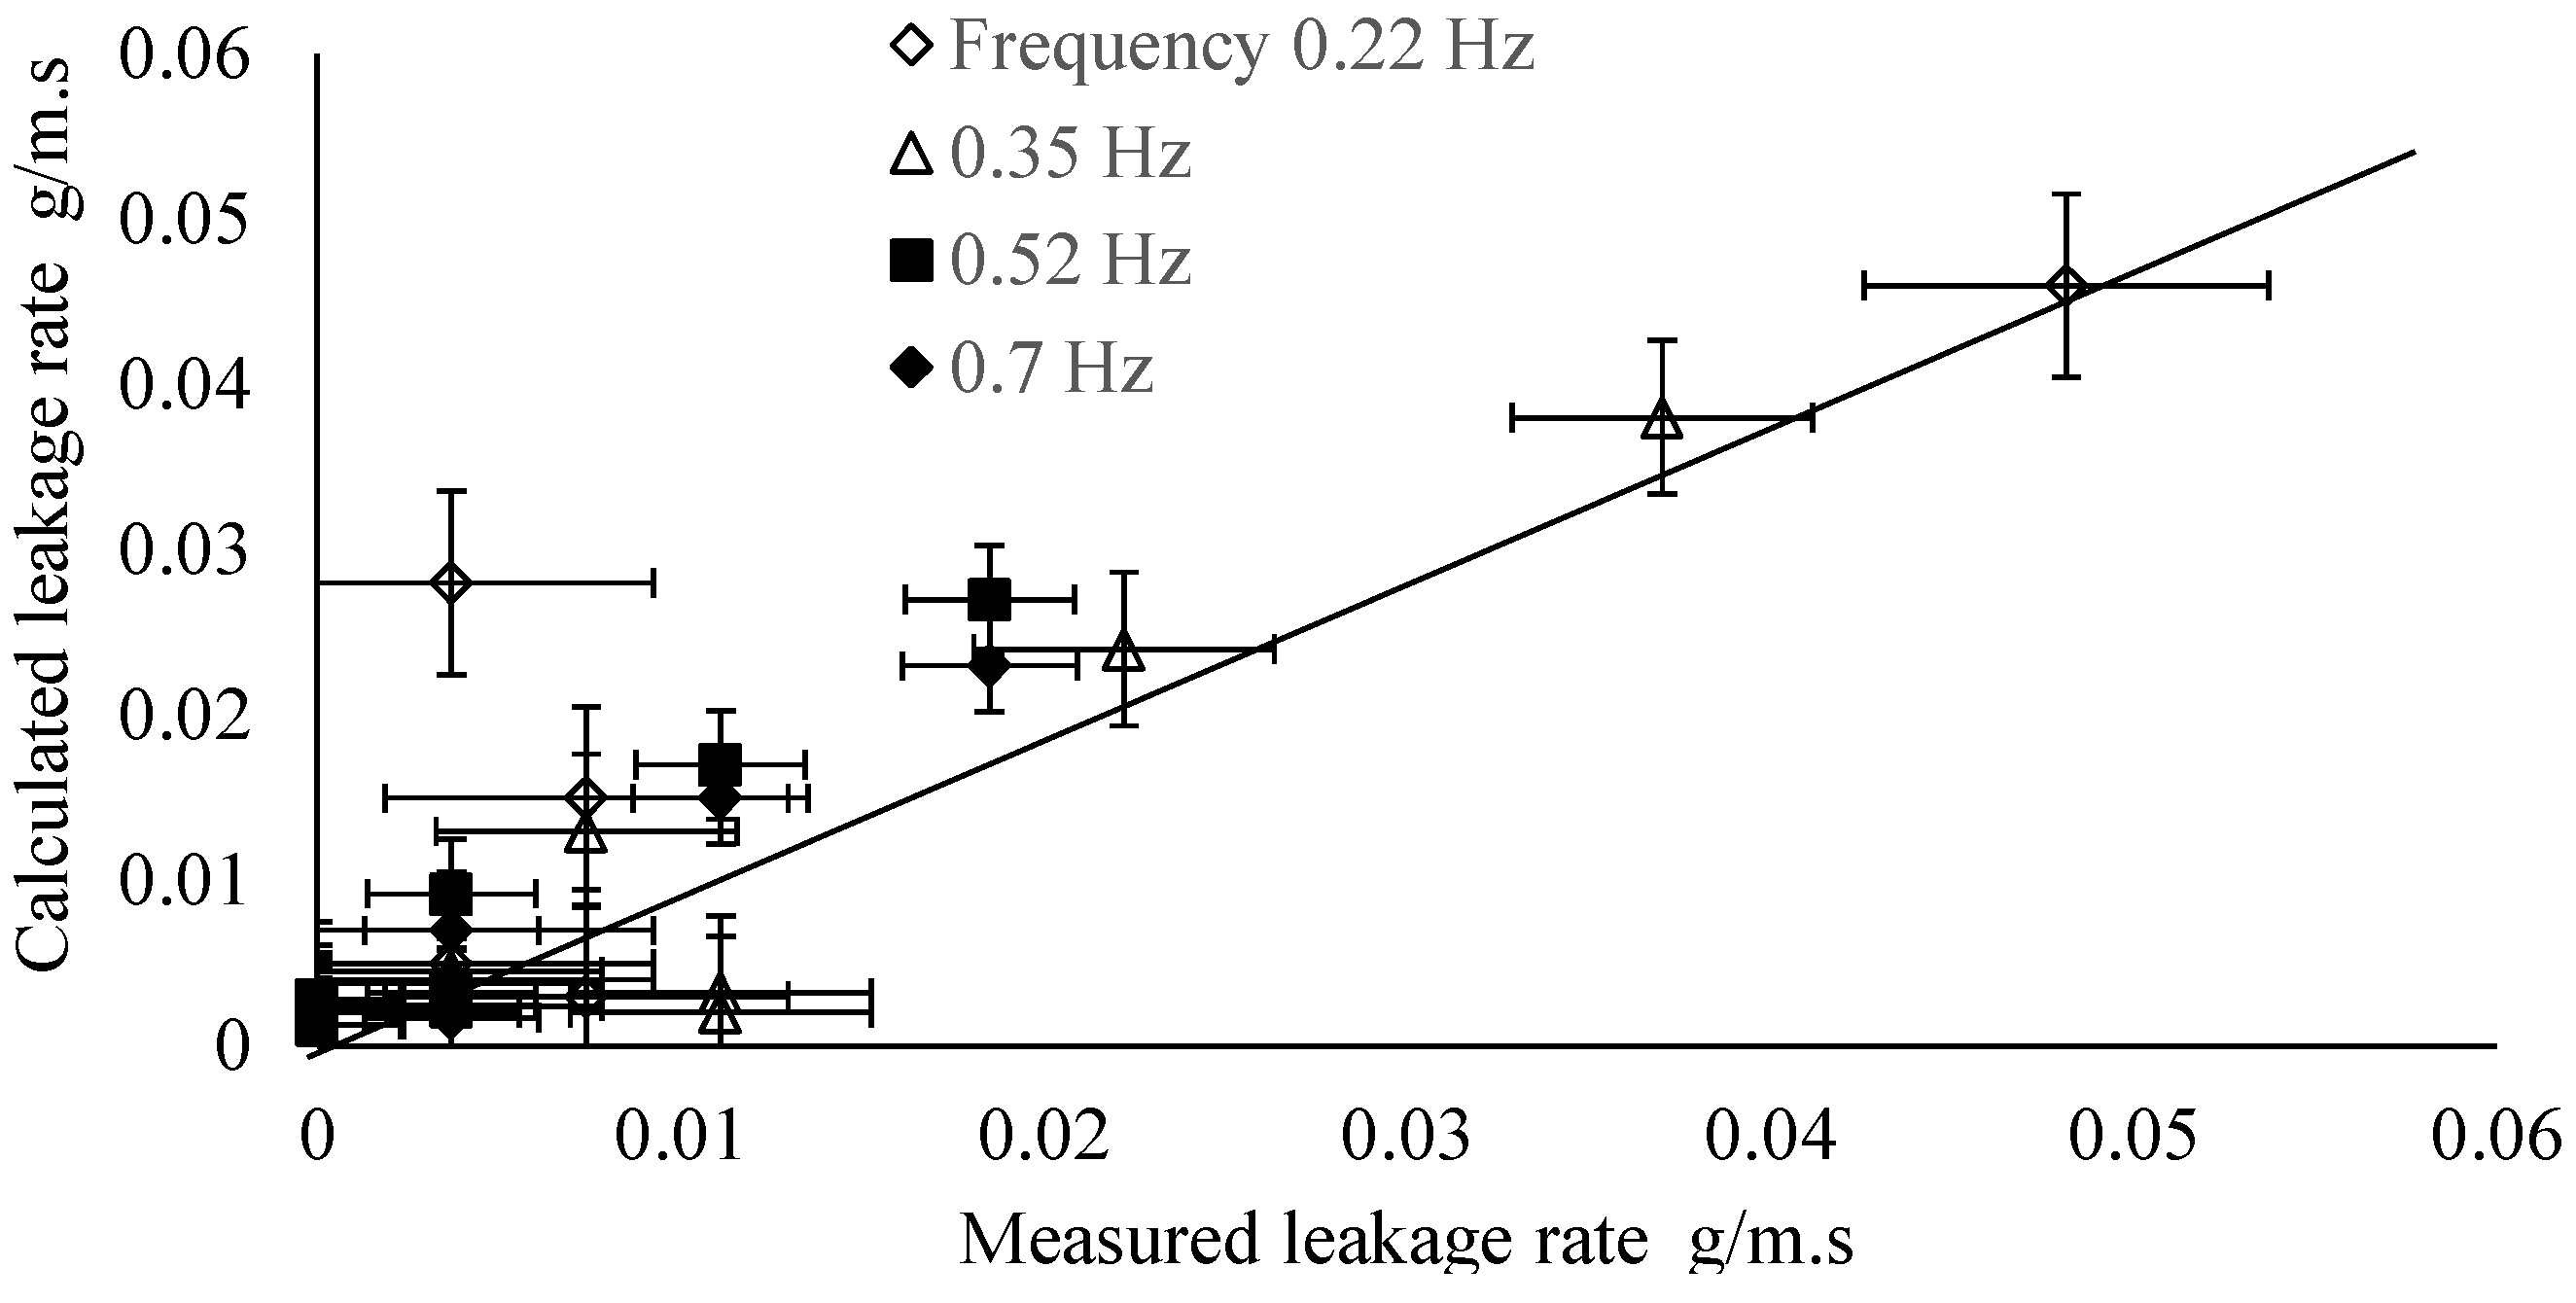
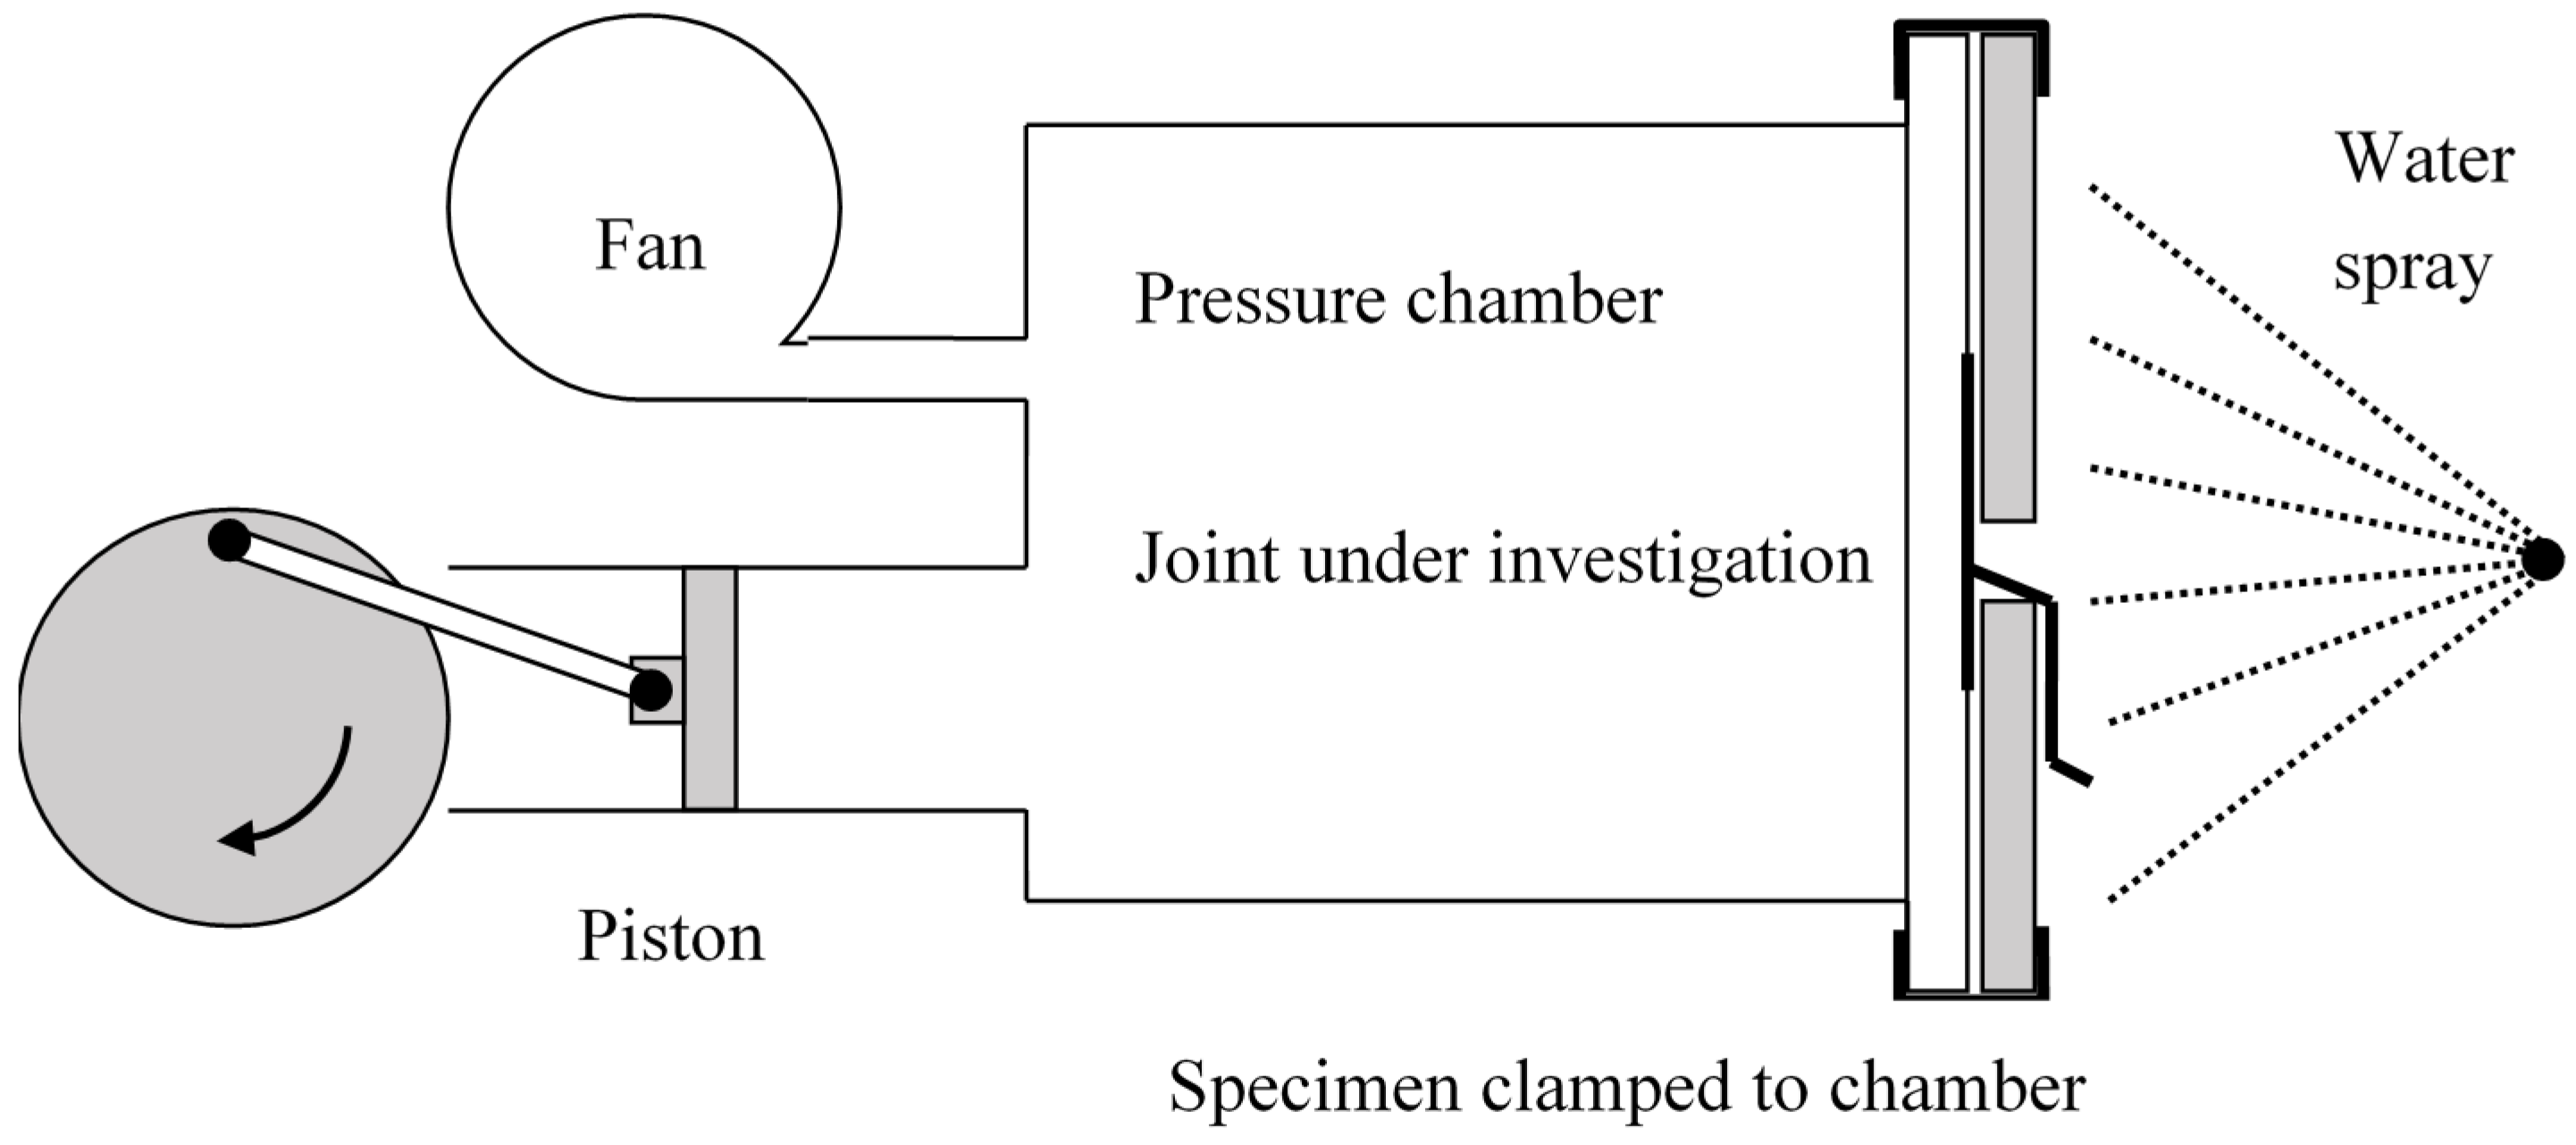
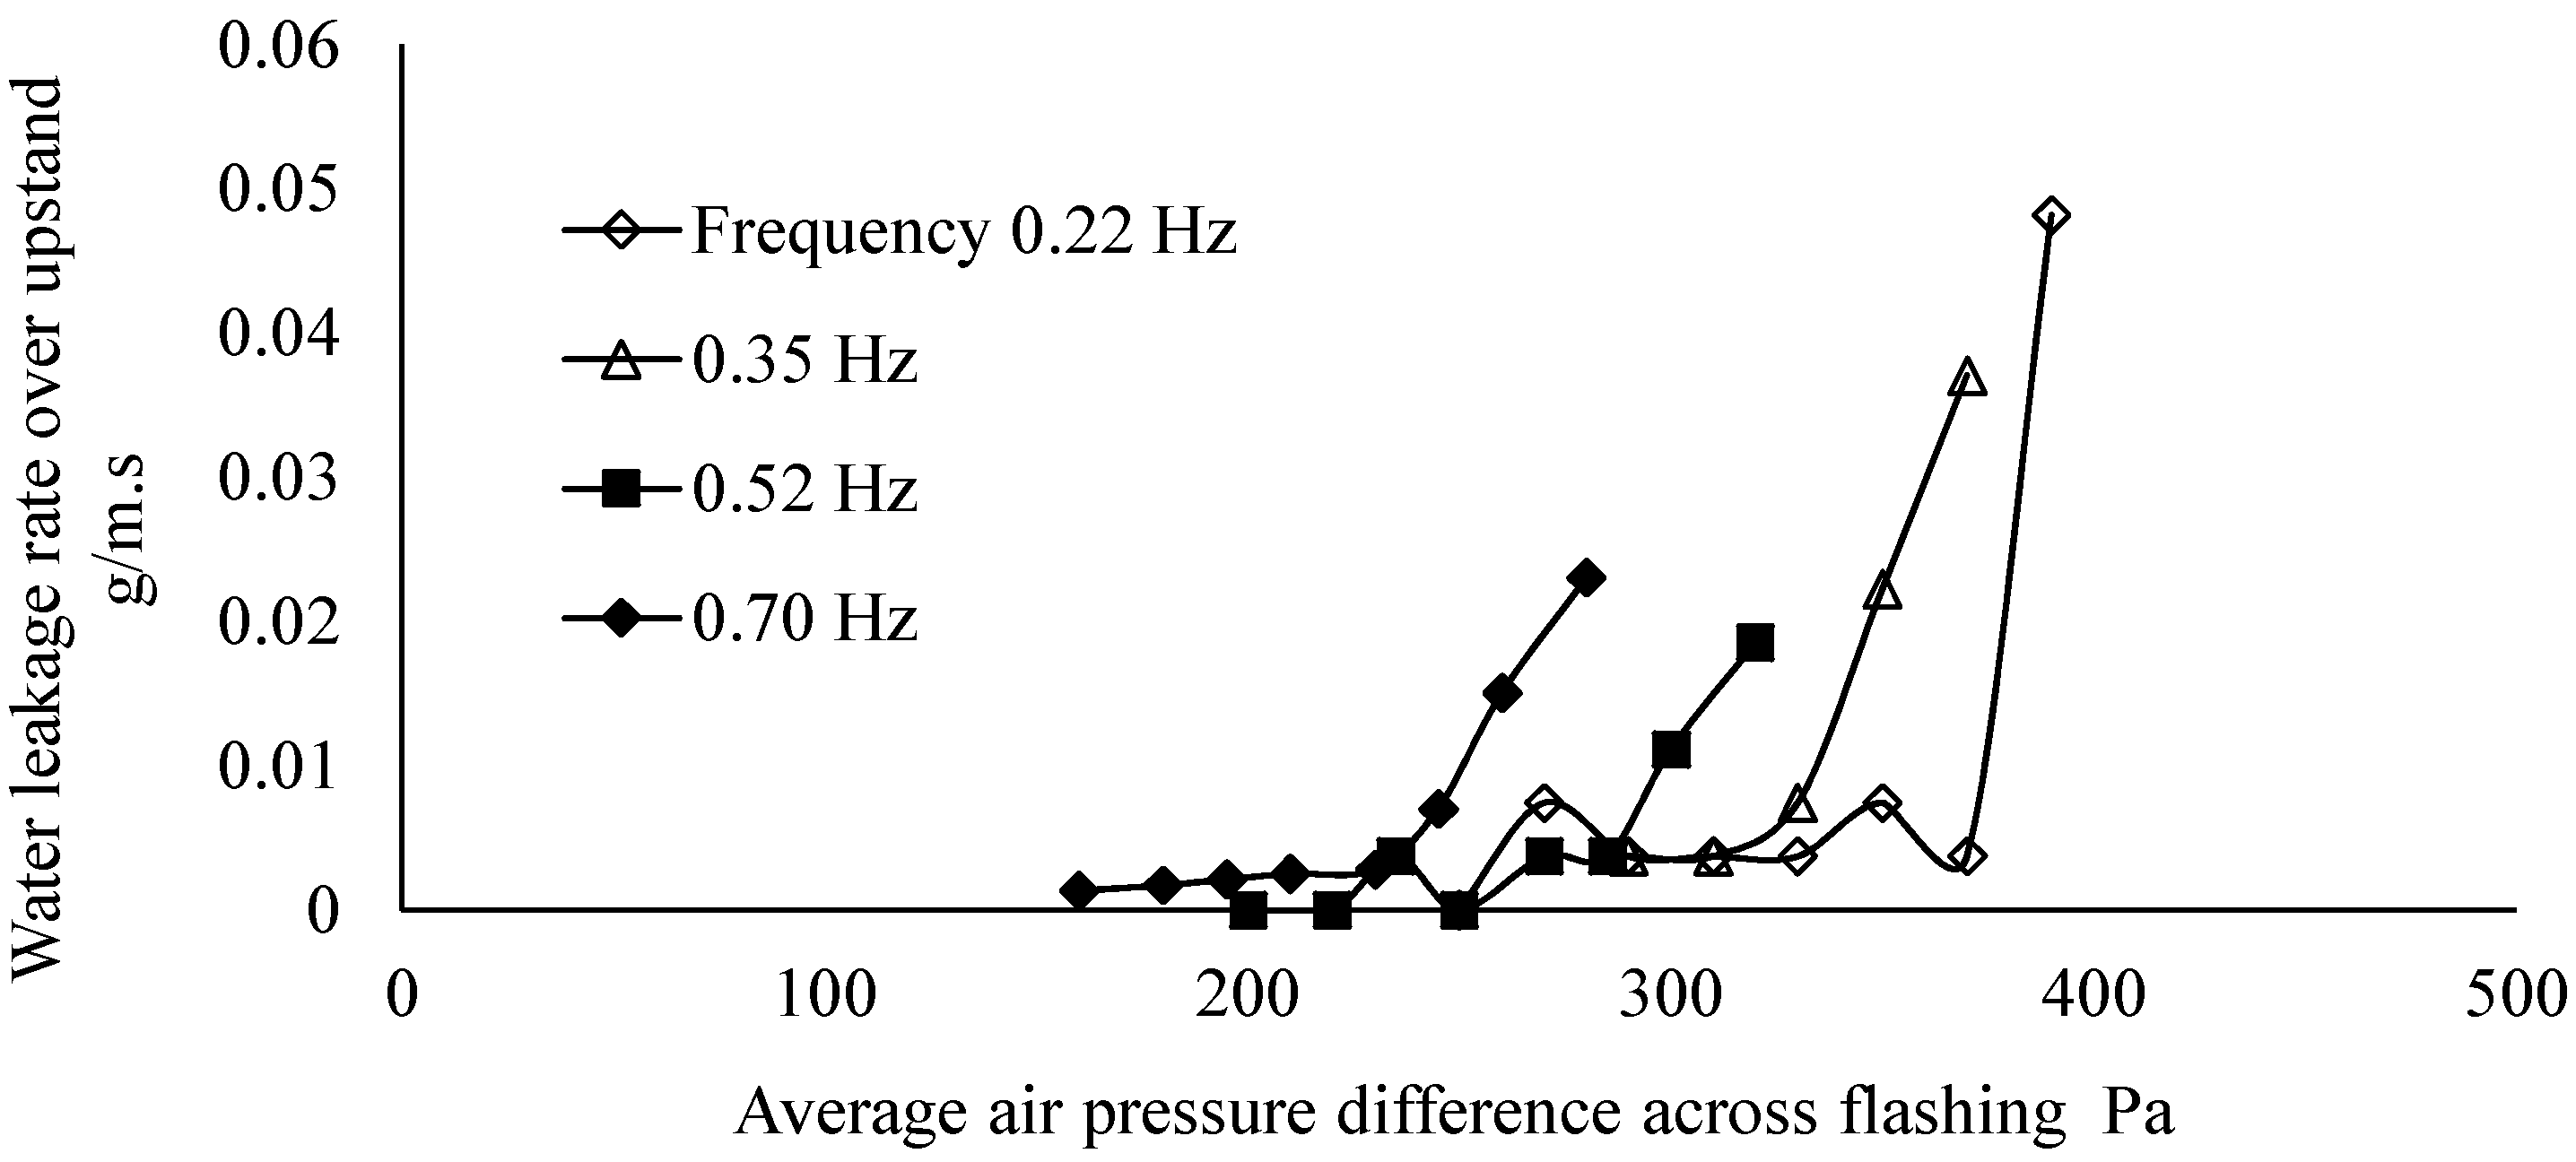
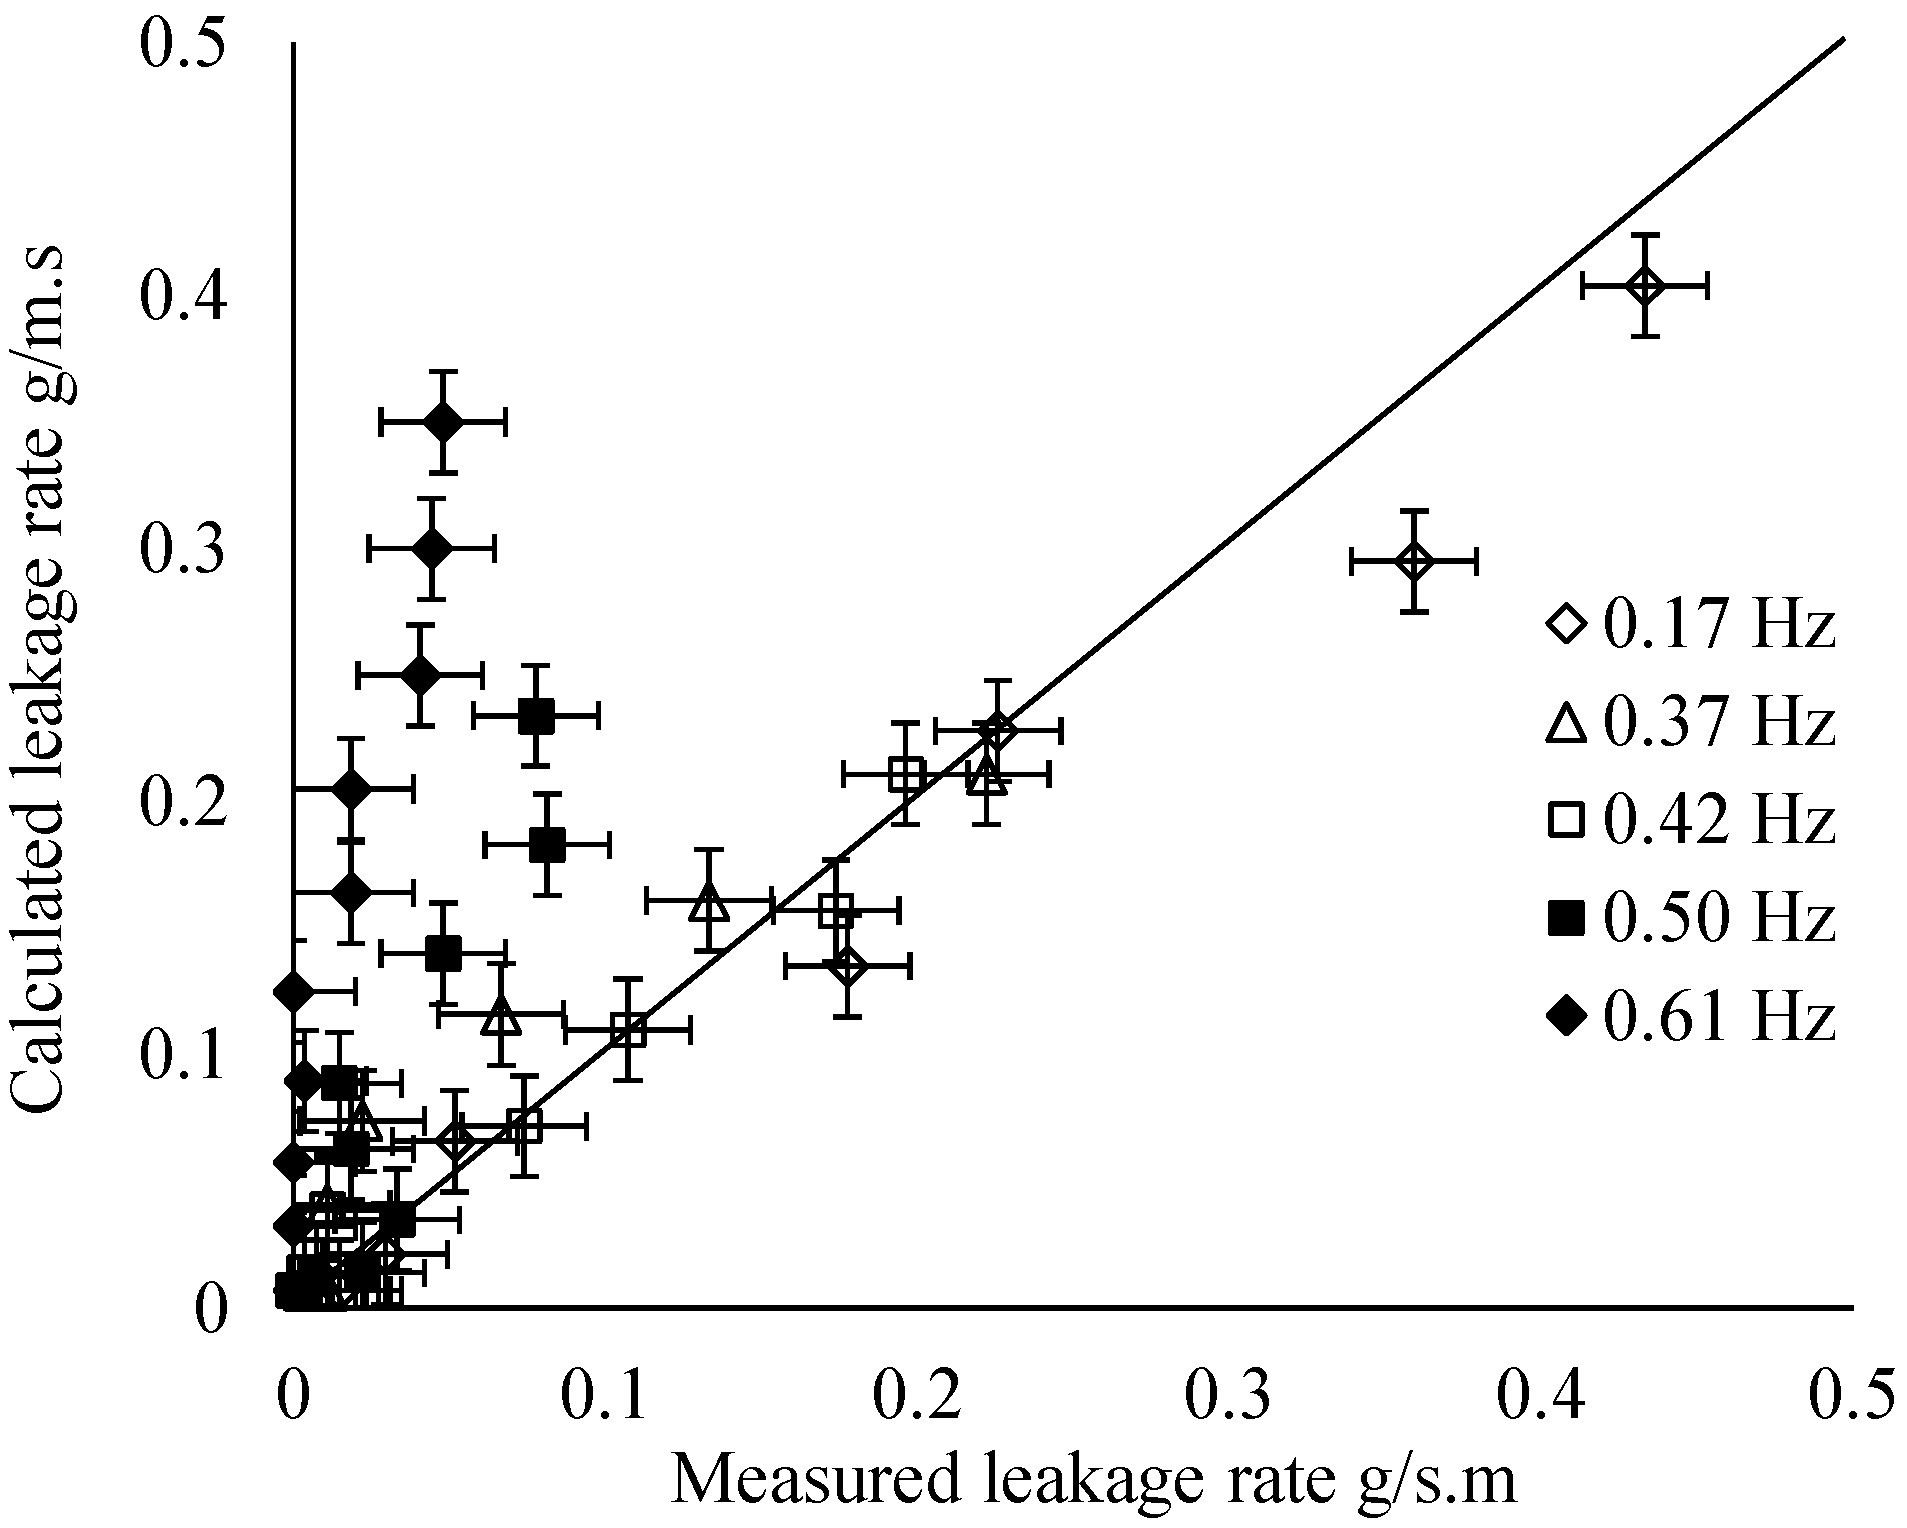
6. Leakage with Dynamic Applied Wind Pressures

7. Leakage Characteristics of an Apron Flashing to Roof Joint

- Between the flashing upstand and the cavity closer;
- Up through vent openings in the cavity closer;
- Past the ends of the apron flashing—not dealt with here;
- Under the flashing over the roof deck—not dealt with here.
Wind Driven Water Leakage past the Apron Flashing

8. Conclusions
- H jointers between sheets of cladding. With the flashing close fitting, the joint water penetration up to pressures close to the head of water equivalent of the up-stand height. In more realistic building applications where the gap between flashing and cladding might exceed 2–3 mm, air carried water leaks were seen at lower leakage onset pressures (100–300 Pa) with little dependency on up-stand height and the presence of a hem. Water leakage rates through tight-fitting joints were measured with dynamic pressure in the range of 0–0.7 Hz. There was no detectable effect of inertia, with measured water leakage rates agreeing with calculations using static pressure leakage characteristics.
- Window head flashing in a cavity wall. The onset of water leakage through this joint occurred at 100 Pa as a result of air carried leakage through vents in the cavity closer. Leakage past the flashing upstand was much less significant when tightly fitted against the cavity closer. Both onset leakage pressures were much higher than the 50 Pa “Wet Wall” test pressure adopted in E2/VM1. The leakage onset pressure was also found to depend on the runoff rate over the joint and on the gap between the cladding and head flashing. In fact this gap might need to be increased to cope with runoff rates on tall facades. The dynamic leakage characteristics were quite different to those at static pressures, unlike the case for H jointers. Leakage rates at frequencies above 0.4 Hz were over predicted by the simple instantaneous pressure model and will therefore require a model involving the inertia of water in the joint and the filling and drainage time constants.
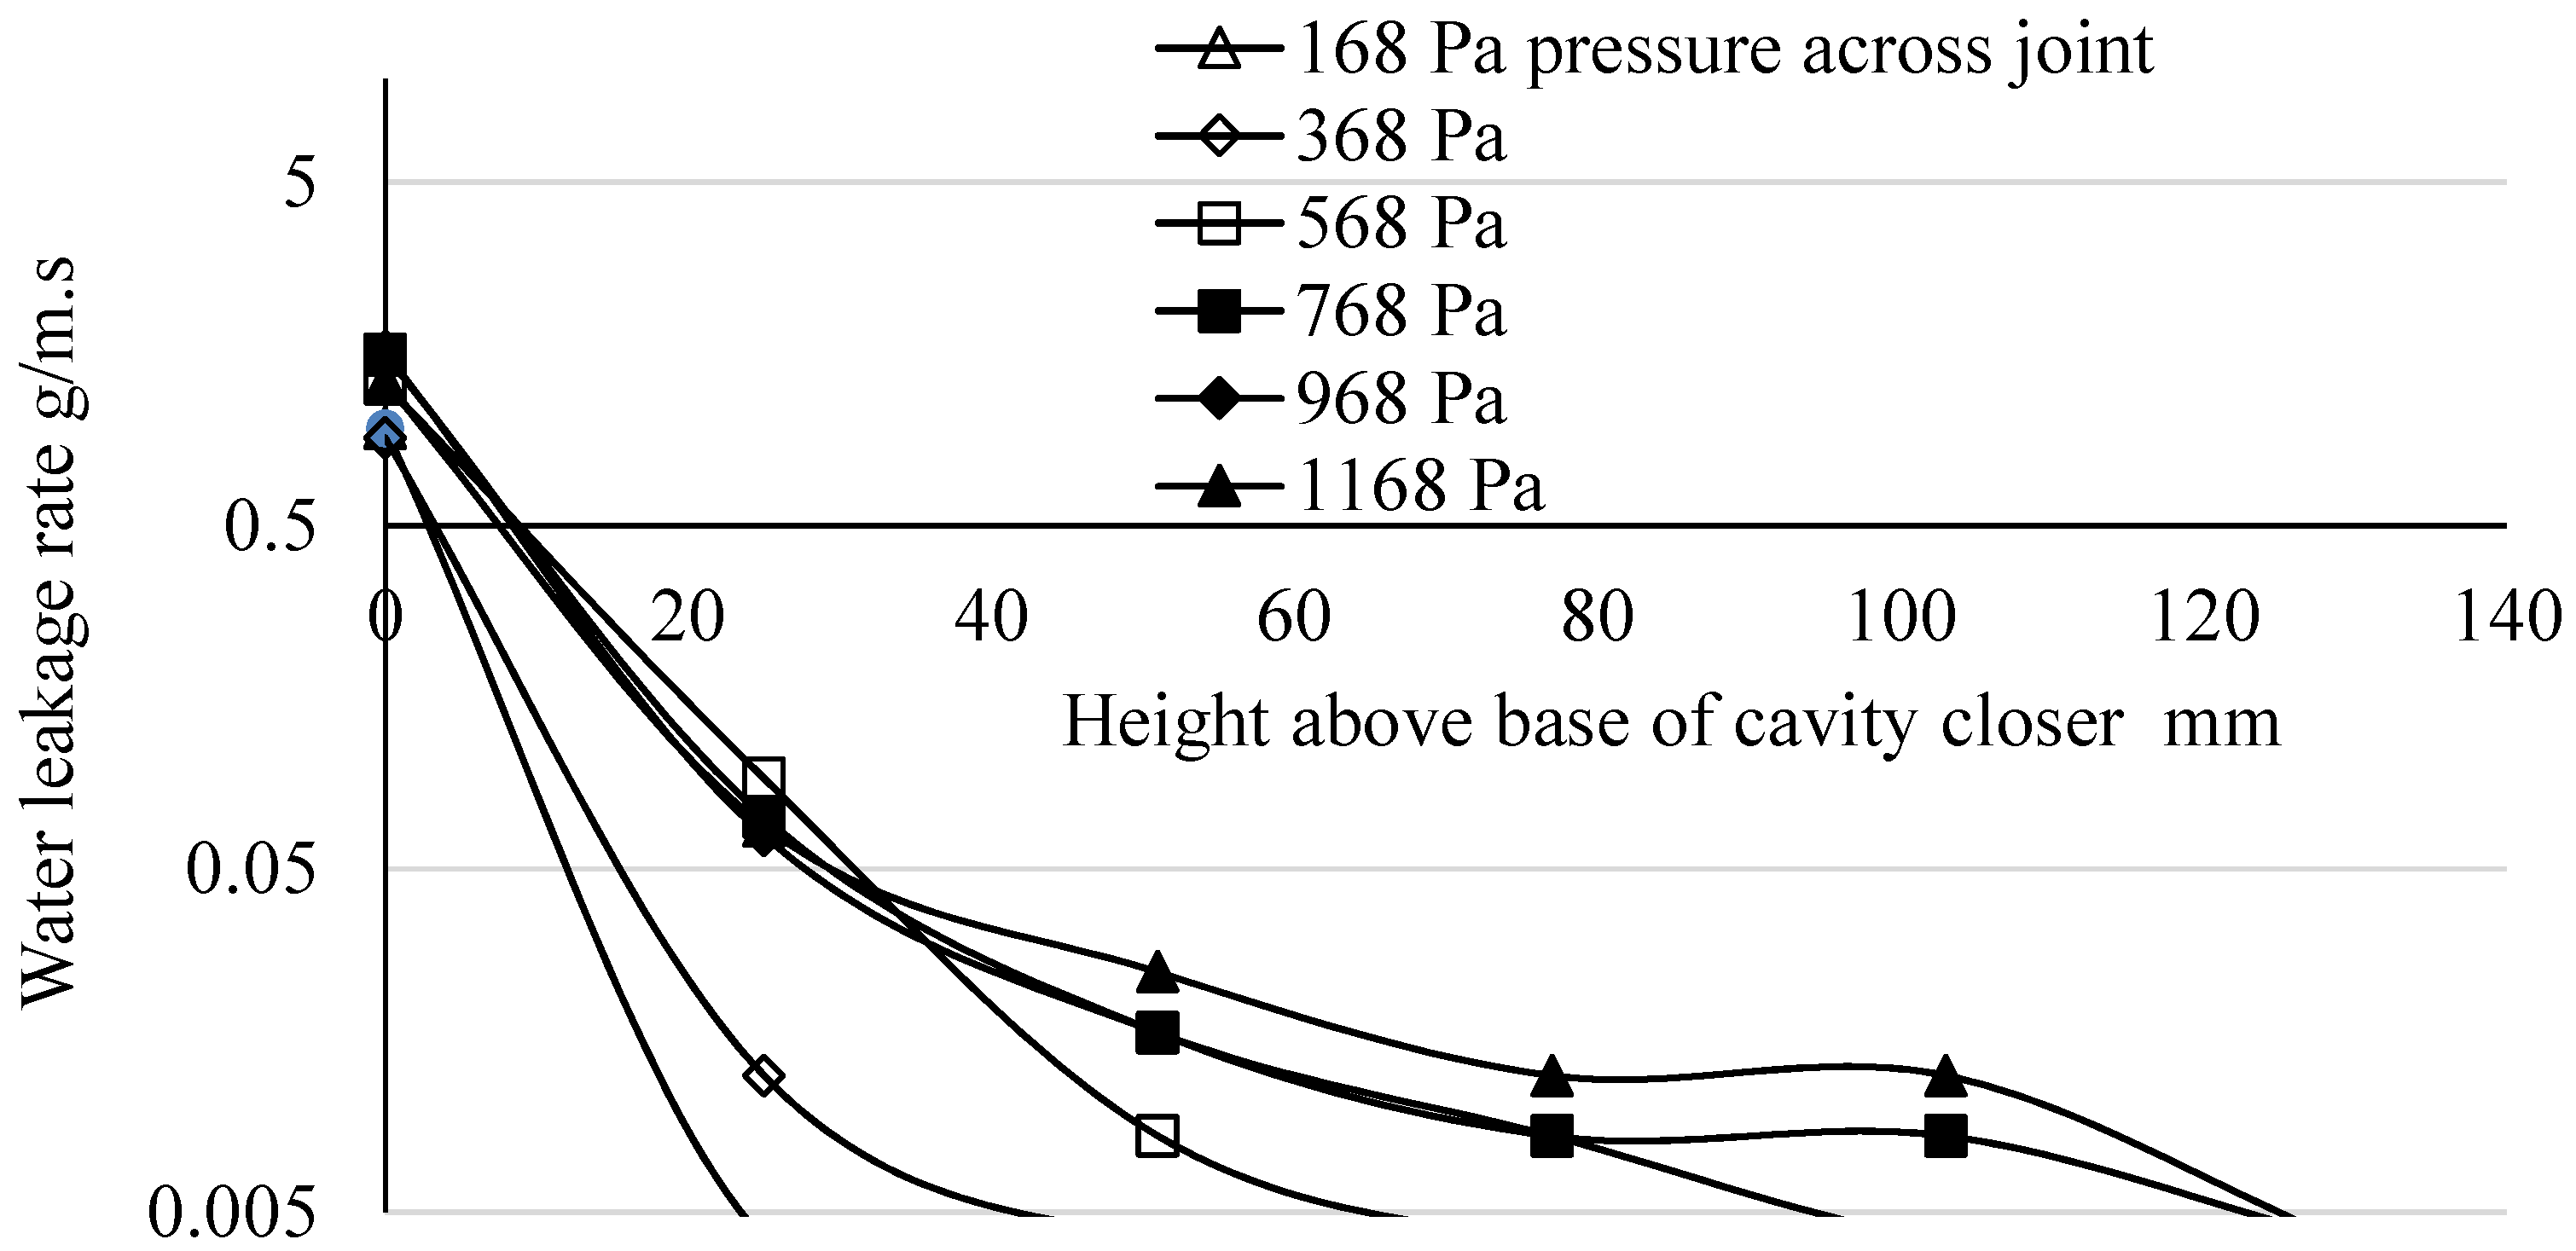
- Apron flashing between wall and roof. The 35 mm gap between the base of the wall cladding and the apron flashing prevented high runoff rates from accumulating water in the space below the cavity closer. As a consequence, only very small air carried water leaks through the cavity closer were detected up to very high air static pressure differences. Leakage rates a hundred times greater were measured with rain driven at the joint by 17 m/s wind speeds. The new water entry process involved large droplets bouncing off the apron and entering the base of the cavity closer where water could be carried deeper into the joint by air flows. No leakage was detected between the apron flashing upstand (75 mm above the base of the cladding) while it fitted tightly against the cavity closer upstand.
Acknowledgments
Author Contributions
Conflicts of Interest
References
- Bassett, M.; Clark, S.; Camilleri, M. Building Weathertightness Failures—Associated Risk Factors. In Proceedings of the BETEC Symposium on Building Science Applications at Syracuse University, New York, NY, USA, 5 September 2006.
- Hershfield, M. Survey of Building Envelope Failures in the Coastal Climate of British Columbia; Report for Canada Mortgage and Housing Corporation; Morrison Hershfield Ltd.: Ottawa, Canada, 1996. [Google Scholar]
- Approved Document E2/AS1 External Moisture; Department of Building and Housing: Wellington, New Zealand, 2005.
- Hazleden, D.G.; Morris, P.I. Designing for Durable Wood Construction: The 4D’s. In Durability of Building Components 8; NRC Research Press: Ottawa, Canada, 1999. [Google Scholar]
- Approved Document E2/VM1 External Moisture; Department of Building and Housing: Wellington, New Zealand, 2005.
- Ishikawa, H. An Experiment on the Mechanism of Rain Penetration through Horizontal Joints in Walls. In Proceedings of the 2nd International CIB/Rilem Symposium on Moisture Problems in Buildings, Paper 2.3.1., Rotterdam, The Netherlands, 10–12 September 1974.
- Herbert, M.R.M. Open-Jointed Rain Screen Claddings; Building Research Establishment Current Paper 89/74; Building Research Establishment (BRE): Watford, UK, 1974. [Google Scholar]
- Herbert, M.R.M.; Harrison, H.W. New Ways with Weatherproof Joints; Building Research Establishment Current Paper 90/74; Building Research Establishment (BRE): Watford, UK, 1974. [Google Scholar]
- Lacasse, M.A.; O’Connor, T.J.; Nunes, S.; Beaulieu, P. Report from Task 6 of MEWS Project Experimental Assessment of Water Penetration and Entry into Wood-Framed Wall Specimens; Research Report IRC-RR-133; Institute for Research in Construction, National Research Council of Canada: Ottawa, Canada, 2003. [Google Scholar]
- Sahal, N.; Lacasse, M.A. Proposed method for calculating water penetration test parameters of wall assemblies as applied to Istanbul, Turkey. Build. Environ. 2008, 43, 1250–1260. [Google Scholar] [CrossRef]
- Bassett, M.; McNeil, S.; Overton, G. WALLDRY-NZ: An Educational Tool for Rain Loads and Ventilation Drying in Cavity Walls. In Proceedings of the 5th International Building Physics Conference, Kyoto, Japan, 28–31 May 2012.
- Kareem, A.; Cermak, J.E. Wind Tunnel Simulation of Wind-Structure Interactions. In International Instrumentation Symposium, 24th, Albuquerque, N. Mex., May 1–5, 1978, Proceedings. Part 2; Instrument Society of America: Pittsburgh, PA, USA, 1978. [Google Scholar]
- Burnett, E.; Straube, J. Vents, Ventilation Drying and Pressure Moderation; Canada Mortgage and Housing Corporation Research Report; Canada Mortgage and Housing Corporation: Ottawa, Canada, 1995. [Google Scholar]
© 2015 by the authors; licensee MDPI, Basel, Switzerland. This article is an open access article distributed under the terms and conditions of the Creative Commons Attribution license (http://creativecommons.org/licenses/by/4.0/).
Share and Cite
Bassett, M.; Overton, G. Measuring the Weathertight Performance of Flashings. Buildings 2015, 5, 130-148. https://doi.org/10.3390/buildings5010130
Bassett M, Overton G. Measuring the Weathertight Performance of Flashings. Buildings. 2015; 5(1):130-148. https://doi.org/10.3390/buildings5010130
Chicago/Turabian StyleBassett, Mark, and Greg Overton. 2015. "Measuring the Weathertight Performance of Flashings" Buildings 5, no. 1: 130-148. https://doi.org/10.3390/buildings5010130
APA StyleBassett, M., & Overton, G. (2015). Measuring the Weathertight Performance of Flashings. Buildings, 5(1), 130-148. https://doi.org/10.3390/buildings5010130