1. Introduction
In recent years, green building construction has significantly increased the demand for Structural Insulated Panels (SIPs). SIPs are usually constructed using two sheets of plywood or oriented strand board (OSB) with a rigid foam insulation core of expanded polystyrene (EPS) or extruded polystyrene (XPS), polyisocyanurate, or polyurethane. Typically, SIPs are used as load bearing prefabricated wall systems. Individual SIP panels are joined together in the field with spline and connection hardware determined by the manufacturer. Although extensive research has been performed on lateral load resistance of wood-frame wall systems, there have been relatively few published experimental parametric studies on SIPs. Furthermore, any tests that have been performed are often undertaken by SIP manufacturers, so the results are typically considered proprietary information and therefore not available to the general public. Limited availability of extensive technical data and background information may deter contractors, engineers, and homeowners from using SIP products, and even more so in seismically active regions.
The primary objective of the pilot study [
1] presented in this paper was to gain a better understanding of how SIPs perform under in-plane lateral loads such as those induced by seismic events or experienced during high wind loading. Parameters such as spline design, connection hardware, hold-down methods and sheathing bearing were evaluated with the use of a full-scale testing program in order to determine their effect on the SIP wall system and subsequent performance under cyclic racking. Two common SIP spline designs were tested while the connection hardware was kept constant. Then, the three most commonly used connection hardware were tested, while the spline design was held constant. This paper presents a brief literature review, explanation of the testing program, description of the specimens, discussion of the test results, and presentation of seismic evaluation of the tested specimens based on ICC-ES guidelines [
2,
3,
4] and NTA procedures [
5,
6].
2. Literature Review
One of the few published full-scale test studies on the performance of SIPs under in-plane shear loading is presented by Jamison [
7] who performed monotonic and cyclic tests on several 2.4 m × 2.4 m SIP specimens. Mosalam and Günay [
8] tested full-scale SIP specimens under cyclic loading while adjusting parameters such as nail spacing, gravity loading, loading protocol (CUREE
vs. Hybrid Simulation), ground motion type and the presence/lack of an analytical substructure. In the APA Report T2006P-33 [
9] Premier Building Systems’ SIPs were tested under racking shear, axial loading, and transverse loading. Kermani and Hairstans [
10] tested SIPs under racking loads and combined bending and axial compression in order to determine the effects size and location of an opening have on the performance of a SIP assembly. Some studies have found that sealants and adhesives have an effect on the performance of SIP and wood frame shear walls [
11]. Manufacturers typically have their own type of sealants and adhesives as well as their own application methods. In order to make sure the results of this research are useful to the industry and compliant with ICC-ES AC04 [
3], the sealants and adhesives were left out. The results will be conservative regardless of the type of manufacturing method used.
Most SIP manufacturers have ICC-ES Reports that document the allowable loads for their products. The ICC-ES Legacy Report for Insulspan [
12] reports the allowable racking load for panels with stapled plywood surface splines and for nailed wood splines. Insulspan’s Technical Bulletin No. 111 [
13], provides the shear strength of SIPs with varying spline designs and nail spacing. The ICC-ES Legacy Report for Intermountain Building Panels L.L.C. [
14] tested panels with metal stud splines connected to the panels with screws. In the R-Control Tech Bulletin [
15], 2.4 m × 2.4 m SIP walls with hold-downs were tested under the Structural Engineering Association of Southern California (SEAOSC) loading protocol [
16]. Architectural Testing, Inc. [
17] followed ICC-ES AC04 [
2] to test Agriboard Industries’ 2.4 m × 2.4 m compressed agricultural fiber sandwich panels under the SEAOSC loading protocol. Johnston
et al. [
18] and Lebeda
et al. [
19] both studied the effects hold-down anchors have on wood shear walls under the CUREE loading protocol.
A common trend amongst the majority of SIP manufacturers listed above is their lack of publicly available information concerning their panel design’s performance under cyclic loading. The monotonic shear strength can be used to determine a material’s reaction to wind loading but it does not directly correlate to the system’s performance under seismic loading. R-Control [
15] and Agriboard Industries [
17] have tested their panels under cyclic loading but their reports lack a parametric analysis of the design methods comparing spline design, connection hardware, or hold-down methods. Johnston
et al. [
18] and Lebeda
et al. [
19] both studied the effects hold-down anchors have on wood shear walls under the CUREE loading protocol.
3. Description of Specimens
Six different SIP specimen configurations and one traditional light-frame wood wall were tested in this study (
Table 1). The SIPs were 114 mm thick with an 89 mm expanded polystyrene core and two 11 mm OSB facings.
Figure 1 shows a perspective view of a typical SIP panel with exposed components of the OSB skin, top and bottom plates, rigid core insulation, and interconnecting splines. The two spline designs examined in this paper include an OSB surface spline and a double 38 mm × 89 mm lumber spline as shown in
Figure 2. In addition to testing the vertical joint configurations, three different types of connection hardware were tested. To mimic current practices, the fasteners included 8 d common nails, No. 6 plywood/particleboard screws, and 16 gauge staples. The fasteners were spaced 152 mm on-center (o.c.).
The base SIP test setup included two 1.2 m × 2.4 m panels joined with a surface spline along the 2.4 m vertical side of the panel. Fasteners spaced at 152 mm o.c. and Spruce Pine Fir of Grade 2 or better were used to frame the 2.4 m × 2.4 m specimen. The top and bottom plates were 38 mm × 89 mm placed within the OSB sheathing of the SIP. An additional 38 mm × 89 mm was placed on the top and bottom of the wall as shown in
Figure 3 to prevent bearing between the sheathing and the test setup. Common practice in the field is for the sheathing to bear directly on the sill plate, but it is conservative to test the walls with non-bearing sheathing. The double end posts were connected to each other and to the top and base plates with 16d common nails spaced at 610 mm o.c. (per 2006 International Building Code [
20]) and 102 mm from each end. USP PHD6 hold-downs were attached to the outside of the SIP as shown in
Figure 3. Refer to
Table 1 for an explanation of the design specifications followed for each wall design. Further explanation of the testing setup and specimens can be found in Terentiuk [
1].
Table 1.
Test matrix of specimens tested.
Table 1.
Test matrix of specimens tested.
| Panel Type | Panel to Panel Connection | Bottom Plate | Top Plate | End Posts | Fastener Hardware | Fastener Spacing o.c. | Bearing | External Hold-down |
|---|
| A1 Includes: A1-1M, A1-1C, A1-2C | 11.1 mm × 76 mm OSB surface spline | (1) 38 mm × 89 mm | (1) 38 mm × 89 mm | (2) 38mm × 89 mm | 8 d common nail (3.3 mm Φ) 63.5 mm long | 152 mm | No | Yes |
| A1 Bearing-3C | 11.1 mm × 76 mm OSB surface spline | (1) 38 mm × 89 mm, (1) 38 mm × 140 mm sill plate | (1) 38 mm × 89 mm, (1) 38 mm × 140 mm top plate | (2) 38mm × 89 mm | 8 d common nail (3.3 mm Φ)63.5 mm long | 152 mm | Yes | Yes |
| A1 Internal-4C | 11.1 × 76 mm OSB surface spline | (1) 38 mm × 89 mm | (1) 38 mm × 89 mm | (2) 38 mm × 89 mm | 8 d common nail (3.3 mm Φ) 63.5 mm long | 152 mm | No | No (internal hold-down) |
| A3 Includes: A3-1M, A3-1C, A3-2C | 11.1 mm × 76 mm OSB surface spline | (1) 38 mm× 89 mm | (1) 38 mm × 89 mm | (2) 38 mm × 89 mm | 16 ga. staple (1.6 mm Φ) 38.1mm long | 152 mm | No | Yes |
| A4 Includes: A4-1M, A4-1C, A4-2C, A4-3C | 11.1 mm × 76 mm OSB surface spline | (1) 38 mm × 89 mm | (1) 38 mm × 89 mm | (2) 38 mm × 89 mm | No. 6 screw (3.5 mm Φ) 31.8 mm long | 152 mm | No | Yes |
| B Includes: B-1M, B-1C, B-2C, B-3C | Double 38 mm × 89 mm spline | (1) 38 mm × 89 mm | (1) 38 mm × 89 mm | (2) 38 mm × 89 mm | 8 d common nail (3.3 mm Φ)63.5 mm long | 152 mm | No | Yes |
| C Includes: C-1M, C-1C, C-2C, C-3C | Built as a 2.4 m × 2.4 m timber wall without a splice | (1) 38 mm × 89 mm | (2) 38 mm × 89 mm | (2) 38 mm × 89 mm | 8 d common nail (3.3 mm Φ) 63.5 mm long | 152 mm ext.304 mm int. | No | Yes |
Figure 1.
Typical SIP panel configuration. Adapted from [
21].
Figure 1.
Typical SIP panel configuration. Adapted from [
21].
Figure 2.
(a) OSB surface spline; (b) Double 38 mm × 89 mm lumber spline.
Figure 2.
(a) OSB surface spline; (b) Double 38 mm × 89 mm lumber spline.
The traditional light-frame wood wall, Specimen C, was sheathed on both sides with 11 mm OSB oriented vertically. The OSB was taken from the same batch used to make the SIP specimens tested in this study. 38 mm × 89 mm Spruce Pine Fir of Grade 2 or better was used for the studs and placed at 406 mm o.c. The specimen had a double 38 mm × 89 mm top plate, single 38 mm × 89 mm base plate and double 38 mm × 89 mm end posts. The sheathing was attached to the framing with 8d common nails spaced 152 mm o.c. edge and 305 mm o.c. field. The nailing patterns outlined in the 2006 IBC [
20] were followed to connect the framing members with 16d common nails. Consistent with the SIP specimens, bearing of the sheathing was prevented with an additional 38 mm × 89 mm on the top and base of the wall and the hold-down anchors were placed on the exterior of the specimen.
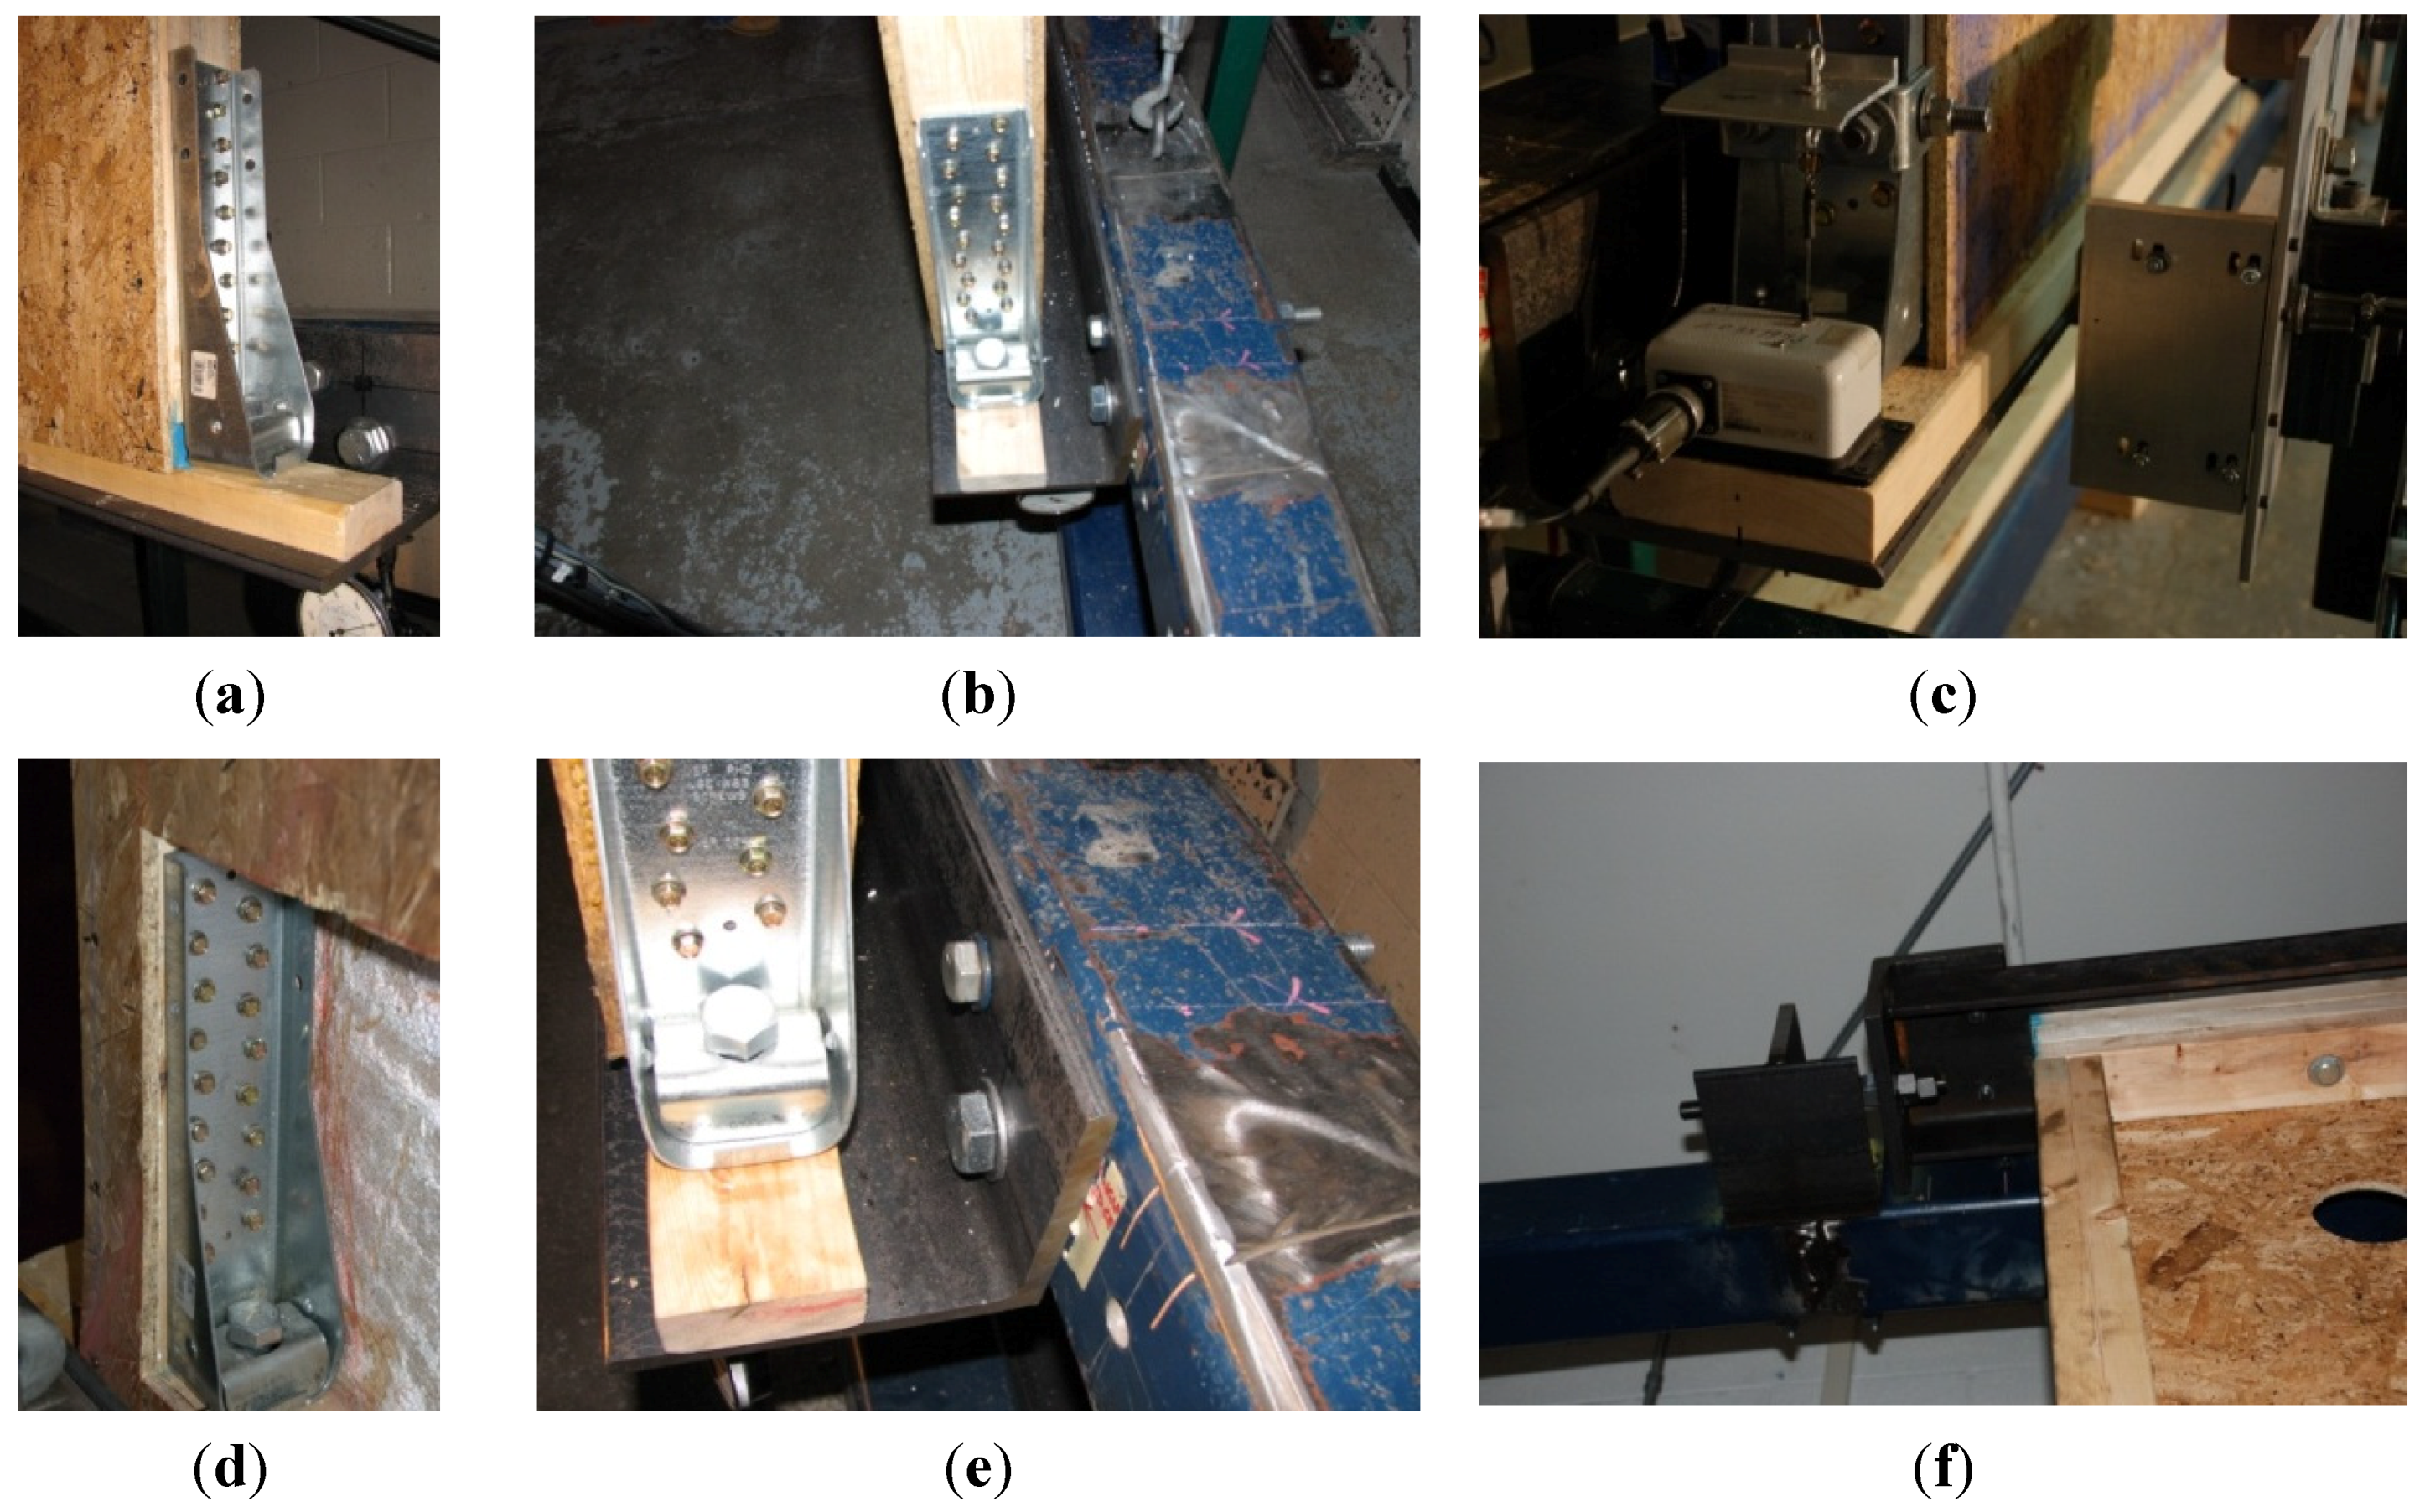
Figure 3.
(a) Extra 38 mm × 89 mm base plate used to prevent friction between sheathing and test facility; (b) USP PHD 6 hold-down anchor located on exterior of panel; (c) 38 mm × 140 mm sill plate used in Specimen A1 Bearing to create sheathing bearing along top and bottom of panels; (d) Interior USP PHD 6 hold-down fit into 342.9 mm × 393.7 mm cut-out in SIP panel of Specimen A1 Internal; (e) 25.4 mm Φ screws used to attach L203 mm × 152 mm × 13 mm to bottom sliding steel tube; (f) MC8×20 attached to top of specimen and sliding connection used for application of load.
5. Experimental Results
5.1. Specimen Test Results
Table 2 describes the failure mode of each of the panels tested. The order in which the specimens are listed in the table and in the following paragraphs is based on increasing load resistance capacity, determined by this study. The initial failure of Specimen A3 occurred along the spline when the staples pulled out and sheared. At that point, the load was transferred to the sheathing connection along the top plate and base plate.
Figure 4a shows the separation of the top plate from the sheathing as the staples sheared along the top and the nails pulled out of the end posts.
Table 2.
Specimen failure modes.
Table 2.
Specimen failure modes.
| Specimen | Failure Mode |
|---|
| A3 Monotonic | Staple withdrawal along base plate and top plate, and tear-out damage to sheathing along spline. |
| A3 Cyclic | Staple shear along spline and subsequent staple shear and withdrawal along base and top plate. |
| A4 Monotonic | Screw shear along spline and subsequent screw shear along top and base plate. |
| A4 Cyclic | Screw shear along spline and subsequent screw shear along top and base plate. Top plate pulled away from sheathing and end posts. |
| A1 Monotonic | Deformation and initial withdrawal of nails. Sheathing damage on inner corners of panels (along spline). |
| A1 Cyclic | Initial nail withdrawal along spline and top and bottom plates. Sheathing damage on inner corners of panels. |
| A1 Bearing Cyclic | Initial nail withdrawal along spline and top and bottom plates. Sheathing failure on inner corners of panels along top plate. |
| A1 Internal Cyclic | Initial nail withdrawal along spline. Sheathing damage along inner corners of panels and along base plate below hold-down cut-out. |
| B Monotonic | Deformation and initial withdrawal of nails along top plate. Sheathing damage on inner corners of panels. Double 38 mm × 89 mm pieces in lumber spline began to split apart from each other. |
| B Cyclic | Double 38 mm × 89 mm pieces in lumber spline began to split apart from each other. Nail withdrawal along base plate and tear-out sheathing failure along top plate. |
| C Monotonic | Initial nail withdrawal along spline and slight sheathing damage on inner corners of panels. |
| C Cyclic | Initial nail withdrawal along spline, base plate and end posts. Sheathing damage on inner corners of panels along top plate. |
Similar to Specimen A3, the failure mode of Specimen A4 occurred in the fastener hardware along the spline. The brittle nature of the screws caused them to shear which resulted in a sudden and brittle failure.
Figure 4b,c show the separation of the SIP panels caused by fastener hardware and subsequent base plate and top plate damage. Nail withdrawal along the spline caused the initial failure in Specimen A1. Rotation of the panels caused damage to the sheathing along the inner corners of the panel, refer to
Figure 4d,e. Due to bearing of the sheathing along the sill plate, Specimen A1 Bearing experienced more extensive damage to the sheathing along the top and base plates than Specimen A1, as seen in
Figure 4f. Placing the hold-down anchor on the interior of the panel in Specimen A1 Internal did not result in a significant difference in the failure mode of the specimen in comparison to Specimen A1.
Figure 4g,h show sheathing damage at the inner corners of the panels and nail pullout along the spline and top plate of Specimen A1Internal. Under cyclic loading, the major failure in Specimen B occurred when the double 38 mm × 89 mm spline split apart vertically along the nailed connection. The 38 mm × 89 mm pieces pulled away from each other and remained relatively connected to the individual SIP sections. As a result, the two panels began to rotate independently of each other as seen in
Figure 4i. The initial signs of failure for Specimen C occurred when the nails withdrew along the spline, base plate and end posts.
Figure 4j,k show the nail withdrawal along the end post of Specimen C after cyclic loading.
Figure 4k also shows the slight damage which occurred to the end posts.
Figure 4.
(a) Specimen A3 staple shear and top plate displacement; (b) Specimen A4 separation of panels along vertical spline; (c) Specimen A4 damage at base plate and screw shear along spline and base plate; (d) Nail withdrawal along spline of Specimen A1; (e) Sheathing damage along base plate of Specimen A1; (f) Pull-out of nails along spline and damage to sheathing along top plate of Specimen A1 Bearing; (g) Sheathing damage at inner corner of panels along base plate of Specimen A1 Internal; (h) Pull-out of nails along spline and top plate of Specimen A1 Internal; (i) Specimen B separation of panels (more extreme than the failure of two other identical walls); (j) Specimen C nail withdrawal along end post; (k) Damage to the end post of Specimen C.
5.2. Fatigue Testing
In this paper, the word “fatigue” refers to repeatedly loading a specimen under the first 37 cycles of the CUREE cyclic loading protocol. After a specimen was loaded under the first set of loading cycles, it was brought back to a displacement of zero. Without repairing the specimen in any way, the wall was run through the first 37 cycles of the CUREE cyclic loading protocol a second time to determine the behavior of the wall under repeated cyclic loading. This process was repeated until the specimen experienced a significant drop in strength. The specimen was not repaired in anyway in between each fatigue loading.
The specimens connected to the framing with 8 d common nails were much stronger and more ductile than any previously reported studies and as a result the capacity of the testing facility was reached before the specimens experienced a 20% drop in peak strength. Specimens A1, B, and C were placed under the first 37 cycles of the CUREE cyclic loading protocol and reached peak loads ranging from 73,840 N to 88,964 N and displacements ranging from 107 mm to 132 mm. Even though the specimens did not experience a drop in peak load, at the end of the initial 37 cycles their drift ratios ranged from 4.4% to 5.4%, which is far beyond the maximum allowable 2.5% drift ratio, stated in ASCE 7-05 [
29].
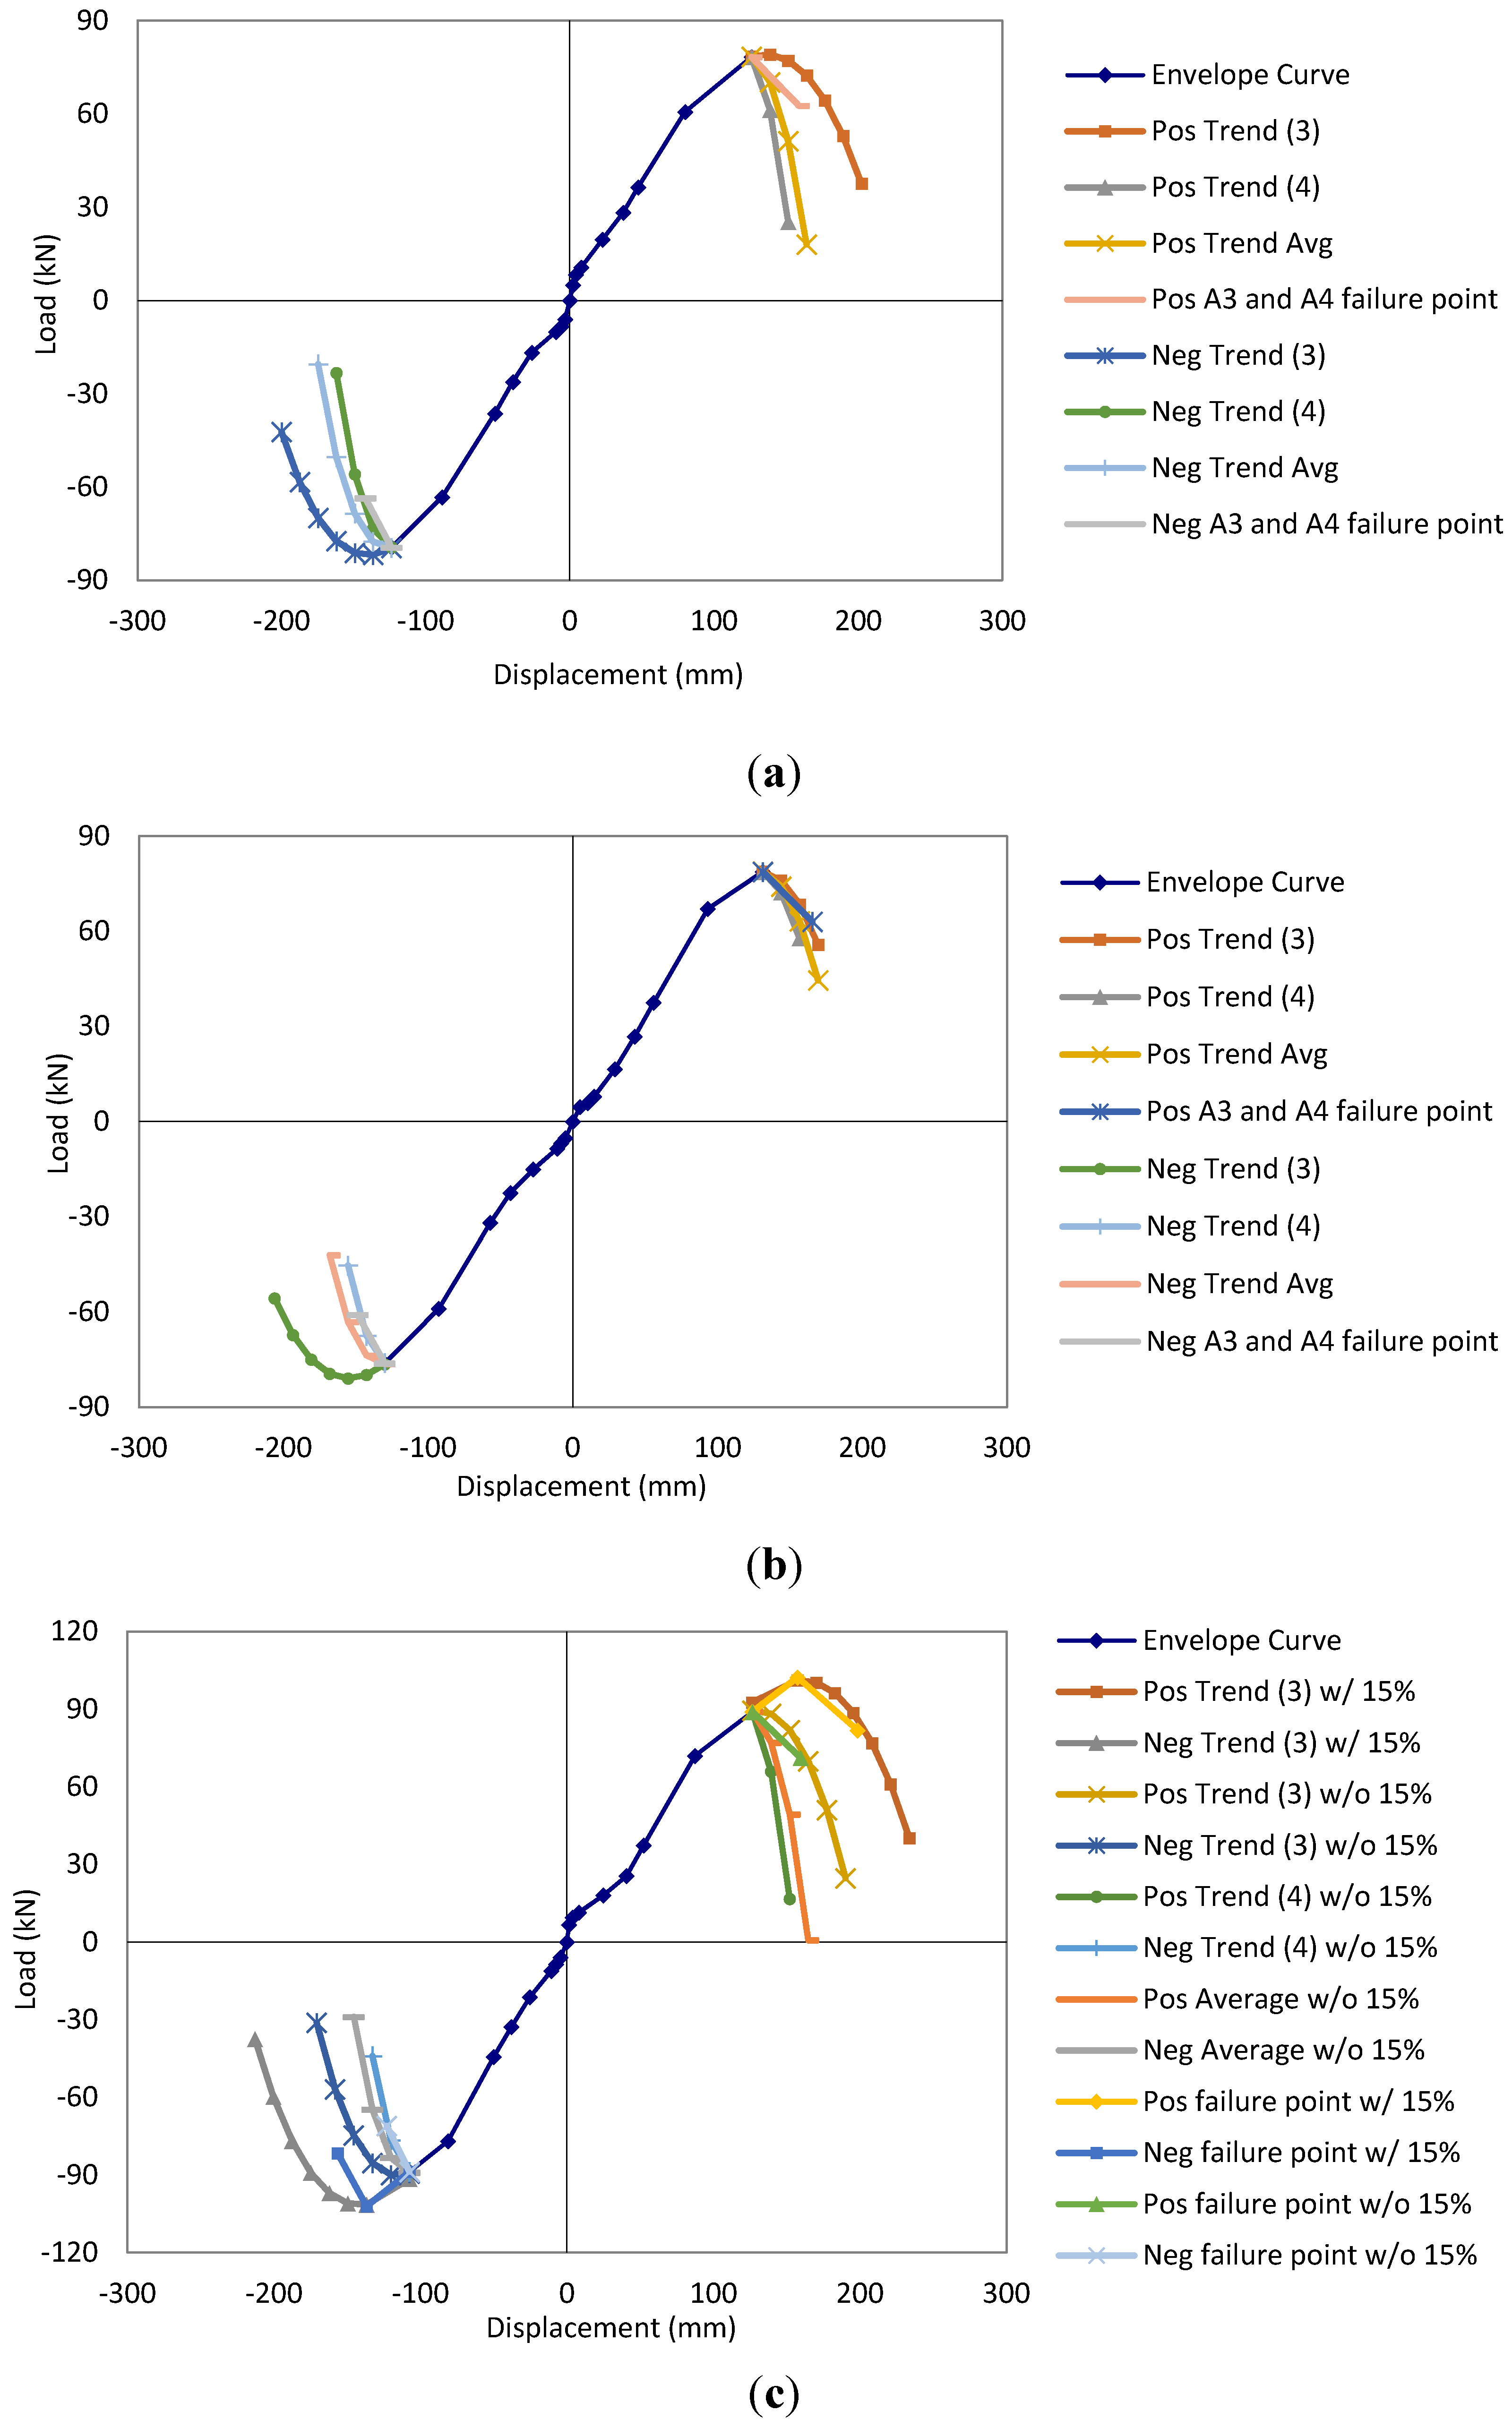
A series of trend lines were used to estimate the failure point (where load resistance drops to 80% of the peak load) of the fatigued specimens. The trend lines used were developed by fitting third and fourth power polynomial curves to the data points already obtained from the testing. The curves made it possible to extend the test data points and predict the failure point. An average of the third and fourth polynomial curves was also plotted. In addition to that, an average of the failure curves of Specimens A3 and A4 was calculated and also plotted on the envelope curve graph. This was determined by finding the percentage that the displacement increased, beyond ∆peak, when Specimens A3 and A4 experienced a 20% drop in peak load. The hysteresis loops for Specimen C did not begin to level off towards the end of the test as they did for Specimens A1 and B. As a result, trend lines were drawn from both the actual peak point of the 37th cycle of the test (similar to Specimens A1 and B) and additionally from a point extended to a load increased by 15%.
The average of the percentage increase in displacement was calculated and that average percentage was applied to the ∆
peak of the specimen to determine ∆
u. All of these trend lines and estimated failure points were then analyzed according to ASTM E2126 [
27,
28] and ICC-ES AC130 [
4] and used to determine the minimum and maximum values of load, displacement, strength, stiffness, and shear modulus needed to describe the specimen’s performance.
Figure 5 shows the load
vs. displacement graphs of the specimens under monotonic and cyclic loading along with the corresponding envelope curve.
Figure 6 shows a representative envelope curve for specimens A1, B and C and the trend lines used to analyze their failure points. Refer to Terentiuk [
1] for a more in depth description of the analysis.
On average, Specimen C had the least amount of loss or change after the first fatigue loading. The shear strength did not change at all and the shear modulus and ductility had less than a 10% decrease in value. The Fatigue 2 test did not have as much of an impact on the specimens as the Fatigue 1 test. Specimen A1 had the least amount of change after Fatigue 2 in comparison to Specimens C and B. Unlike Specimen B, which completely failed after the second fatigue, Specimen A1 was able to withstand a third fatigue test. Specimen C would have been able to withstand a third fatigue test as well but due to the insignificant change between the first two fatigues and the original cyclic loading the specimen was not fatigued for a third time. It was assumed that a third fatigue would produce similar results.
Table 3 and
Table 4 show the average percentage change in the characteristic values of each specimen under each fatigue loading.
Figure 5.
Load vs. displacement of SIP specimens under cyclic and monotonic loading. (a) Specimen A3-1C; (b) Specimen A3-2C; (c) Specimen A4-1C; (d) Specimen A4-2C; (e) Specimen A4-3C; (f) Specimen A1-1C; (g) Specimen A1-2C; (h) Specimen A1 Bearing-3C; (i) Specimen A1 Internal-4C; (j) Specimen B-1C; (k) Specimen B-2C; (l) Specimen B-3C; (m) Specimen C-1C; (n) Specimen C-2C; (o) Specimen C-3C.
Figure 6.
Envelope curve and trend lines developed to predict failure points. (a) Specimen A1-1C Trend Line Curves; (b) Specimen B-1C Trend Line Curves; (c) Specimen C-1C Trend Line Curves.
Figure 6.
Envelope curve and trend lines developed to predict failure points. (a) Specimen A1-1C Trend Line Curves; (b) Specimen B-1C Trend Line Curves; (c) Specimen C-1C Trend Line Curves.
It is important to note that the wood frame walls were sheathed on both sides making them much stronger than a wall with sheathing on one side only. Previous published research testing light-frame wood walls with single sided sheathing obtained significantly lower peak loads and displacements [
18,
19]. It can be assumed that the Specimens A1 and B would have outperformed the traditional wood frame specimen had it only been sheathed on one side.
Table 3.
Average percentage loss (−) or gain (+) in characteristic values at strength limit state after fatigue tests of specimens.
Table 3.
Average percentage loss (−) or gain (+) in characteristic values at strength limit state after fatigue tests of specimens.
| Response Parameter | Fatigue 1 | Fatigue 2 | Fatigue 3 |
|---|
| Specimens | C | A1 | B | C | A1 | B 1 | A1 |
| Displacement | +13 | +3 | +10 | 0 | −2 | +3 | +1 |
| Shear Force | 0 | −18 | −12 | −9 | −5 | −4 | −12 |
| Shear Modulus | −7 | −23 | −19 | −10 | −4 | −8 | −13 |
| Shear Strength | 0 | −17 | −13 | −9 | −3 | −4 | −4 |
| Elastic Shear Stiffness | −40 | −53 | −46 | −15 | −9 | −10 | −13 |
| Ductility | −2 | −8 | −3 | −2 | +1 | 0 | −7 |
Table 4.
Average percentage loss (−) or gain (+) in characteristic values at yield limit state after fatigue tests of specimens.
Table 4.
Average percentage loss (−) or gain (+) in characteristic values at yield limit state after fatigue tests of specimens.
| Response Parameter | Fatigue 1 | Fatigue 2 | Fatigue 3 |
|---|
| Specimens | C | A1 | B | C | A1 | B 1 | A1 |
| Displacement | +9 | +11 | +3 | +5 | −3 | +5 | +1 |
| Shear Force | −9 | −28 | −21 | −9 | −5 | −4 | −12 |
| Shear Modulus | −20 | −36 | −24 | −12 | −5 | −9 | −13 |
5.3. Evaluation by ASTM E2126 and Criteria
The following sections describe the analytical evaluation associated with each specimen based on the ASTM E2126 criteria [
27,
28]. In this paper, to determine the average response parameters the positive and negative envelope curves were analyzed individually and then the two values obtained were averaged, as described in ASTM E2126-08 [
27]. According to the most recent version of ASTM E2126-11 [
28], these parameters may be non-conservative when a specimen responds asymmetrically to the testing. Refer to Terentiuk [
1] for the results found by analyzing the positive and negative envelope curves individually without averaging. Both the SIP specimens and the wood frame specimens were analyzed using the method described in ASTM E2126-08 [
27]. The consistency in the analysis method should result in a fair comparison between the two types of specimens. The data obtained during the monotonic and cyclic loading of the wall systems was used to determine performance parameters of the various SIP wall designs. The shear strength was found by determining the absolute value of the load per unit length of the specimen,
![Buildings 04 00394 i001]()
. The secant shear modulus at both 0.4
Ppeak and
Ppeak was found by using the relation:
![Buildings 04 00394 i002]()
. The
![Buildings 04 00394 i003]()
refers to the aspect ratio of the specimen. The cyclic ductility ratio is defined as the ratio of the ultimate displacement and the yield displacement,
![Buildings 04 00394 i004]()
. An equivalent energy elastic-plastic (EEEP) curve was developed by circumscribing the area enclosed by the envelope curve. The enclosed area was bordered by the origin, the ultimate displacement, and the displacement axis of the envelope curve. The envelope curve consisted of the extreme points of the load-displacement hysteresis loops. An EEEP curve can be used as a visual comparison between differing wall designs and materials [
27,
28].
The calculations for the specimens that used trend lines were slightly different in that each step was repeated for each trend line. For instance, the calculations in Sections 9.1.1 through 9.1.4 of ASTM E 2126 [
27,
28] were followed to determine the performance parameters of Specimen A1 in terms of the third power polynomial trend line. Next, the fourth power polynomial trend line was analyzed in the same manner. This was repeated until all of the trend lines were analyzed. By determining the performance values according to each trend line, a range of values was determined for the specimen.
Table 5 compares the average characteristic values obtained by analyzing data from the cyclic tests performed on each specimen. The values in the table demonstrate the effect hardware and spline design have on the engineering values of a specimen. Specimens A3 and A4 were able to withstand the least amount of displacement and shear force before they failed. The peak displacement of Specimen A1 was slightly less than Specimen B which can be attributed to the difference in spline designs. The double 38 mm × 89 mm spline in Specimen B slightly reduced the shear modulus, shear strength, and elastic shear stiffness in comparison to the OSB spline in Specimen A1. Specimen C had the highest shear force, shear modulus, shear strength, and elastic shear stiffness. It is important to remember that the values found for Specimen C are based on a timber wall with sheathing on both sides, whereas actual construction methods typically have OSB sheathing on one side. Specimen A4 had the greatest shear modulus, it was about 13% greater than Specimen C and 23% greater than Specimen A3. Specimens A1 and B had the lowest shear modulus values.
As expected, fastener hardware had an effect on ductility. Specimen A1 had the highest ductility, followed by Specimens C and B. A specimen with high ductility has the ability to yield and deform inelastically without experiencing a significant loss of load resistance. However, the ductility property should be examined in conjunction with other characteristic values because a high ductility factor does not directly mean that the specimen will perform well under seismic loading. Specimen C had the highest shear strength out of all the specimens while Specimen A3 had the lowest shear strength. Specimen A4 was slightly lower than Specimens A1 and B, which have very similar shear strength values. Specimens C and A4 had very similar elastic stiffness values which was unexpected. The similar elastic stiffness values signify that both specimens will have reduced lateral drift during seismic loading, which will reduce nonstructural damage [
18].
Table 5.
Average characteristic values of each specimen under cyclic loading.
Table 5.
Average characteristic values of each specimen under cyclic loading.
| Response Parameter | A3 | A4 | A1 | A1 Bearing | A1 Internal | B | C |
|---|
| Min | Max | Min | Max | Min | Max | Min | Max | Min | Max |
|---|
| ∆max (mm) | 79.50 | 88.39 | 128.27 | 134.62 | 106.68 | 129.79 | 131.57 | 139.95 | 111.76 | 149.61 |
| ∆yield (mm) | 69.34 | 76.71 | 108.71 | 111.00 | 87.88 | 90.17 | 94.49 | 95.76 | 114.05 | 133.10 | 96.52 | 128.52 |
| Fmax (N) | 50,768 | 74,236 | 80,055 | 80,842 | 87,652 | 73,854 | 81,300 | 82,679 | 88,866 | 104,164 |
| Fyield (N) | 48,236 | 63,970 | 75,433 | 77,132 | 84,391 | 86,477 | 69,561 | 70,317 | 73,436 | 84,623 | 81,091 | 101,206 |
| G’ (N/mm) | 664 | 857 | 602 | 625 | 822 | 571 | 597 | 621 | 697 | 800 |
| G’yield (N/mm) | 708 | 847 | 699 | 700 | 979 | 800 | 653 | 655 | 785 | 850 |
| Ductility | 1.36 | 1.34 | 1.36 | 1.73 | 1.36 | 1.56 | 1.63 | 1.99 | 1.26 | 1.41 | 1.33 | 1.53 |
| Vpeak (N/m) | 20,826 | 30,443 | 32,836 | 33,157 | 35,945 | 30,282 | 33,347 | 33,902 | 36,441 | 42,716 |
| Ke (N/mm) | 708 | 765 | 699 | 700 | 979 | 800 | 653 | 655 | 768 | 800 |
5.4. Allowable Drift Capacity
The allowable drift for service wind loading is found by using
H/400. In this case,
![Buildings 04 00394 i005]()
. The allowable seismic drift is 2.5% of the height of the specimen, or 0.025 ×
H = 0.025 × 2.4m = 0.061 m = 61 mm [
2,
3], or almost ten times the allowable wind drift. All of the SIP specimens performed much better under monotonic and cyclic loading than expected. Most A1, B, and C type specimens were able to withstand drifts of 127 mm (5.2% drift ratio) and greater, which is well beyond the practical application of these systems. Therefore, most of the specimens showed capacities at least twice the allowable seismic drift limit. This shows that the wall systems are not only strong but they are also ductile.
Parameters such as elastic stiffness, strength, and ductility are some of the factors which govern the response a shear wall has under seismic loading. These deformational characteristics are based on the wall’s load-displacement relationship under cyclic loading. Specimen C was able to withstand the greatest force and displacement before the capacity of the wall began to decline. A larger peak load results in a larger load at the yield limit strength. As a result, Specimen C performed elastically under a higher load and displacement compared to the SIP specimens tested. Refer to
Table 6 for the average peak load and displacement values of the specimens at their strength limit state.
The SIP specimens tested under monotonic loading had higher load capacities at both the allowable wind and seismic drifts than the specimens tested under cyclic loading. For Specimens A3, A4, A1 and B the load capacity at the allowable drift for service wind loading ranged from 35% to 50% greater during monotonic loading in comparison to cyclic loading.
In terms of cyclic loading, Specimen A1Internal-4C required the greatest load (10,208 N) to be pushed to a drift of 6 mm. Specimen A1Bearing-3C was high as well, within 10% of Specimen A1Internal-4C. Specimens A3, A4, and C had load capacities ranging from about 5631 N to 8990 N, which were 55% to 88% of the load required to displace Specimen A1Internal-4C. The largest amount of force was needed to push Specimen A1Bearing-3C to the allowable seismic drift of 61 mm out of all the specimens. Specimen C and A4 needed about 20% less force than A1Bearing-3C.
Table 6.
Maximum measured load and corresponding drift, and load capacity corresponding to allowable drift under wind and seismic loading condition.
Table 6.
Maximum measured load and corresponding drift, and load capacity corresponding to allowable drift under wind and seismic loading condition.
| Specimen | Maximum Load Measured and Corresponding Drift | Capacity N at 6 mm Drift(Allowable drift for wind) | Capacity N at 61 mm Drift(Allowable drift for seismic) | Vpeak (N/m) | Allowable Load (Vpeak/F.S. 1) |
|---|
| Max. Load (N) | Drift (mm) |
|---|
| A3 Monotonic | 55,698 | 92 | 11,707 | 45,877 | 22,838 | 7,618 |
| A3-1C Cyclic | 51,494 | 80 | 6,512 | 41,620 | 21,116 | 7,034 |
| A3-2C Cyclic | 50,036 | 79 | 8,389 | 41,905 | 20,518 | 6,844 |
| A4 Monotonic | 82,791 | 79 | 12,112 | 74,193 | 33,958 | 11,324 |
| A4-1C Cyclic | 75,420 | 93 | 7,584 | 47,660 | 30,937 | 10,317 |
| A4-2C Cyclic | 73,276 | 83 | 5,631 | 49,773 | 30,047 | 10,011 |
| A4-3C Cyclic | 74,006 | 89 | 8,678 | 50,543 | 30,353 | 10,113 |
| A1 Monotonic | 78,133 | 114 | 11,863 | 57,522 | 32,046 to 32,163 | 10,682 to 10,721 |
| A1-1C Cyclic | 78,867 | 125 | 8,887 | 44,738 | 32,338 to 32,980 | 10,784 to 10,989 |
| A1-2C Cyclic | 81,243 | 131 | 2,882 | 43,839 | 33,316 | 11,105 |
| A1 Brg-3C Cyclic | 87,648 | 107 | 9,163 | 61,631 | 35,945 | 11,981 |
| A1 Int-4C Cyclic | 73,855 | 130 | 10,208 | 45,352 | 30,280 | 10,098 |
| B Monotonic | 76,466 | 131 | 7,811 | 45,814 | 31,360 | 10,449 |
| B-1C Cyclic | 77,443 | 131 | 5,351 | 38,159 | 31,754 to 32,732 | 10,580 to 10,916 |
| B-2C Cyclic | 87,638 | 127 | 7,063 | 45,370 | 35,943 to 36,483 | 11,981 to 12,156 |
| B-3C Cyclic | 78,810 | 137 | 2,851 | 40,806 | 32,323 to 32,499 | 10,770 to 10,828 |
| C Monotonic | 90,539 | 178 | 3,799 | 32,517 | 37,127 to 46,277 | 12,376 to 15,426 |
| C-1C Cyclic | 88,875 | 117 | 8,990 | 50,847 | 36,441 to 41,914 | 12,147 to 13,971 |
| C-2C Cyclic | 88,777 | 107 | 5,743 | 50,407 | 36,412 to 44,074 | 12,137 to 14,691 |
| C-3C Cyclic | 88,942 | 111 | 6,294 | 49,255 | 36,470 to 42,162 | 12,157 to 14,054 |
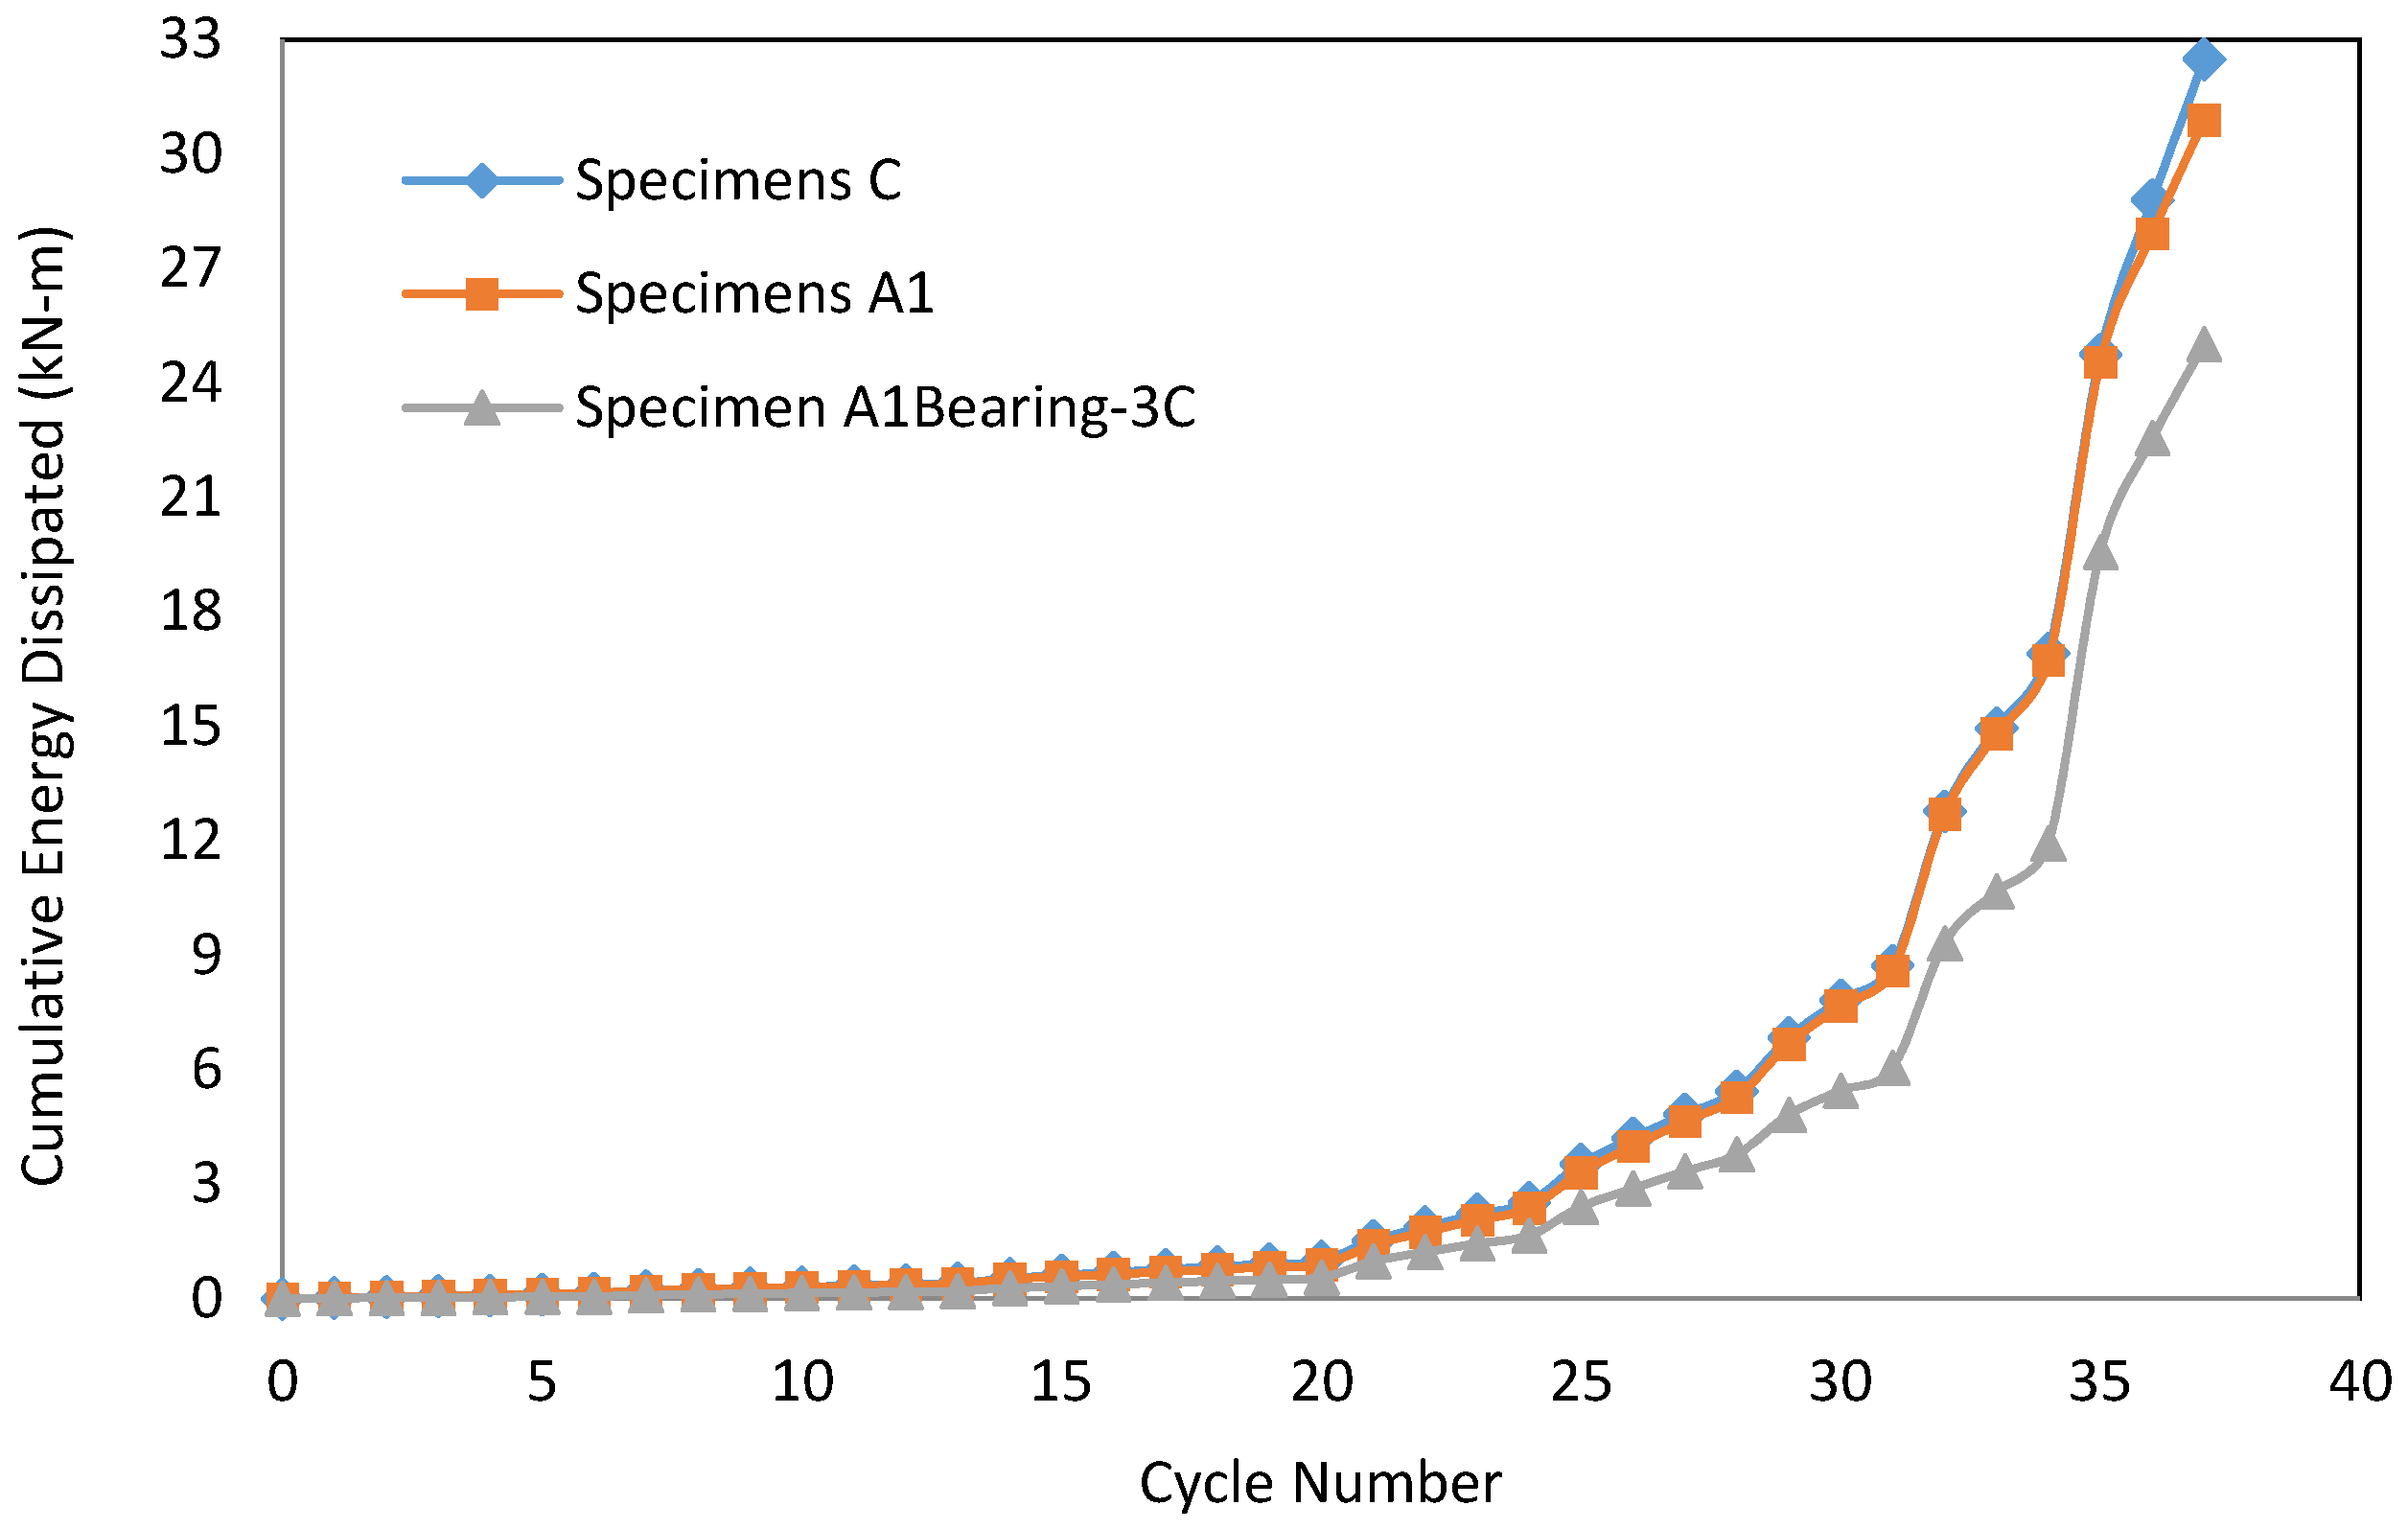
5.5. Energy Dissipation
The energy dissipation of a specimen is determined by finding the area enclosed by the hysteresis loops obtained from the load
vs. displacement graph of a specimen under cyclic loading. In this paper, the trapezoid rule was used to determine the area within the hysteresis loops. To perform well during an earthquake, a structure must be able to dissipate large amounts of energy. When a shear wall is within its elastic limit, it will not dissipate any hysteretic energy.
Figure 7 and
Figure 8 show graphs of the average energy dissipated per cycle and the average total (cumulative) energy dissipated up to the current cycle of the specimens tested under cyclic loading. The energy dissipated in the early cycles is minimal compared to the large spikes found in the later primary cycles. When a shear wall is pushed past its elastic limit, the energy is dissipated through inelastic behavior or fracture of fasteners/connection materials. A minimal amount of energy is also dissipated through the friction forces created by panel sheathing rubbing up against an adjacent panel or framing members [
30]. Specimens A1Bearing-3C and A1Internal-4C were not included in their appropriate specimen averages because they were not an identical replica of the original walls tested.
Specimens A1 and C had the ability to dissipate the largest amount of energy within 37 cycles, while Specimen A4 dissipated the least amount of energy within the same number of cycles. This is consistent with the strength and displacement capacities of the specimens. Specimen A4 was able to withstand three more cycles of the CUREE loading protocol than Specimen A3, and at the forty-first cycle, Specimen A4 dissipated 24% more cumulative energy than Specimen A3.
Figure 7.
Average energy dissipation of SIP specimens under cyclic loading. (a) Specimen A3; (b) Specimen A4; (c) Specimen A1; (d) Specimen B; (e) Specimen C.
Figure 7.
Average energy dissipation of SIP specimens under cyclic loading. (a) Specimen A3; (b) Specimen A4; (c) Specimen A1; (d) Specimen B; (e) Specimen C.
Figure 8.
Comparison between cumulative energy dissipation of wood frame wall and SIP specimens.
Figure 8.
Comparison between cumulative energy dissipation of wood frame wall and SIP specimens.
6. Compatibility with Wood Frame Shear Wall—ICC-ES AC130, ICC-ES AC04 Appendix A, and NTA IM 14 TIP 10.0
ICC-ES AC130 [
4] was followed to determine if the specimens were deemed seismically compatible to a code-defined seismic-force resisting system. First, the ultimate displacement of the specimen divided by the displacement at the ASD design load must be greater than or equal to 11, or
![Buildings 04 00394 i006]()
. The ASD design load is 70% of the load of the specimen found at a displacement of 15 mm. Next, the ultimate displacement has to be greater than 2.8% of the height of the specimen, as described in the equation, ∆
u ≥ 0.028
H. Finally, the ratio of the peak load to the ASD design load must be between or equal to 2.5 to 5.0,
![Buildings 04 00394 i007]()
. If all of these requirements are met, the prefabricated panels should be deemed usable as a seismic force resisting system and the specimen can be assigned the following IBC values:
- (1)
Response Modification Coefficient: R = 6.5;
- (2)
System Overstrength Factor: Ω0 = 3;
- (3)
Deflection Amplification Factor: Cd = 4.
ICC-ES AC130 was developed to be used with prefabricated wood shear panels but was applied to structural insulated panels as well in this study. Specimens A1 (8 d common nails, OSB surface spline), B (8 d common nails, double 39 mm × 89 mm lumber spline), and C (wood-frame) met the requirements stated in ICC-ES AC130; therefore, they can be used within a seismic-force resisting system. However, the specimens did not meet Section 5.3.4 of ICC-ES AC130 [
4] because the
![Buildings 04 00394 i008]()
ratios turned out to be greater than 5.0. In order to be considered compliant, the evaluation report for the panel must include “a requirement that collectors and their connections, bearing and anchorage of the panel, and the lateral load path to the panel are designed in accordance with the special load combinations of Section 12.4.3 of ASCE 7, using
Em where
Em is calculated using the test panel overstrength” [
4]. Similar to Specimens A1, B, and C, the fatigue tests of these specimens were deemed seismically compatible but did not meet the full criteria of Section 5.3.4 in ICC-ES AC130 [
4].
Unlike ICC-ES AC130, Appendix A of ICC ES AC04 [
3] applies directly to SIP sandwich panels under cyclic loading. The ductility, drift, and overstrength compatibility requirements are exactly the same as ICC-ES AC130 [
4]. Axial load was not applied to the specimens tested in this study so they would be considered non-load bearing Assembly B (Specimen B, lumber spline) and Assembly C (Specimen A, surface spline) SIP shear walls.
Instead of comparing test values of a SIP specimen to a predetermined performance criterion as seen in ICC-ES AC130 [
4] and ICC ES AC04 [
3], the previous Appendix A of the 2005 version of ICC-ES AC04 [
2] allowed SIPs to be used in all of the IBC seismic design categories if it was shown to be equivalent to a light-framed wood-based shear wall under cyclic loading. The following requirements had to be met: the peak strength of the SIP specimen had to be within 90% of the benchmark (wood-based shear wall), the stiffness of the SIP specimen had to be within 85% of the benchmark, and the load capacity of the panel at the allowable story drift under seismic loading (∆
all = 61 mm) had to be within 85% of that for the wood-based shear wall. In addition to these three requirements, the cumulative energy dissipated by the SIP specimen had to be within 85% of that of the benchmark. In this study, Specimen C was considered the benchmark and after reviewing the peak strength (
Table 5), stiffness, allowable story drift (
Table 6), and the cumulative energy dissipated (
Figure 7 and
Figure 8) of the six SIP specimen designs, Specimens A1 (8 d common nails, OSB surface spline) met all of the requirements. Therefore, according to Appendix A of ICC-ES AC04 [
2], Specimen A1 was deemed equivalent to a wood-frame wall. The implication is that this system may be permitted to be used as shear walls in buildings located in Seismic Design Categories A through F.
NTA IM 14 TIP 10.0 [
5] has similarities to both Appendix A of ICC-ES AC04 [
2] and ICC-ES AC130 [
4]. Similarly to ICC-ES AC04 [
2], the performance of a SIP specimen under cyclic loading is compared to the performance of a conventional wood frame wall. Unlike ICC-ES AC04, according to NTA IM 14 TIP 10.0, if the SIP demonstrates equivalence to the wood frame benchmark assembly, it can be assigned the strength and seismic design parameters of the benchmark assembly. More specifically, it should be deemed equivalent to System A13 in ASCE 7 Table 12.2-1, R = 6.5, Ω
o = 3, and C
d = 4 [
6]. These are the same seismic factors applied in ICC-ES AC130 [
4]. In this study, Specimen C was used as the benchmark for comparison with the structural insulated panels. The difference between ICC-ES AC130 and NTA IM I4 TIP 10.0 is that the Allowable Stress Design (ASD) load used in the equivalency analysis is based on IBC Table 2306.4.1 [
20] or a code research report instead of Section 5.1.3 of ICC-ES AC130 [
4].
To meet the first performance requirement of Section 7 in the NTA IM 14 TIP 10.0 [
5], the peak strength load of the SIP panel cannot be less than 90% of that of the wood frame shear wall (Specimen C). Next, the displacement at the ASD design load, P = 9,963.5 N [
20], for the SIP panel cannot be less than 85% of that of the benchmark (Specimen C). The ultimate displacement (∆
u) shall not be less than 85% of the benchmark specimen. The ratio of the ultimate displacement to the ASD design load displacement shall not be less than 85% of that of the benchmark specimen. The load at the maximum allowable story drift (∆
all = 61 mm) cannot be less than 85% of that of Specimen C. The final requirement states that the cumulative energy dissipated by the SIP specimen cannot be less than 85% of that for Specimen C.
With reference to
Table 7, according to NTA IM 14 TIP 10.0 [
5], Specimen A1 is equivalent to a wood frame wall under cyclic loading. As a result, the following seismic factors may be applied: R = 6.5, Ω
0 = 3, and C
d = 4.
Table 7.
Data to Meet Performance Requirements of NTA, Inc. [
5].
Table 7.
Data to Meet Performance Requirements of NTA, Inc. [5].
| Specimen | Ppeak (N) | Ppeak/PASD | ∆u (mm) | ∆ASD (mm) | ∆u/∆ASD |
|---|
| C-1C | 88,875 | 8.92 | 129.29 | 7.11 | 18.18 |
| C-2C | 88,777 | 8.91 | 122.68 | 13.46 | 9.11 |
| C-3C | 88,942 | 8.93 | 127.00 | 10.16 | 12.5 |
| Average C | 88,865 | 8.92 | 126.32 | 10.24 | 13.26 |
| A1-1C | 78,867 | 7.92 | 140.72 | 8.13 | 17.31 |
| A1-2C | 81,243 | 8.15 | 158.24 | 20.83 | 7.60 |
| Average A1 | 80,055 | 8.04 | 149.48 | 14.48 | 12.46 |
7. Summary, Conclusions, Recommendations, and Limitations
In this study, a total of 21 wall specimens were tested under monotonic and cyclic loading. Characteristic values such as shear modulus and shear strength were found for each specimen, as well as allowable drift capacity and energy dissipation during cyclic loading. Parameters such as fastener hardware, spline design, hold-down anchor location, and sheathing bearing were adjusted on 2.4 m × 2.4 m structural insulated panels to determine their effect on the performance of the shear walls under monotonic and cyclic loading. The SIP specimens were compared to a traditional wood frame wall (but with sheathing on both sides) under identical loading procedures.
The mode of failure for all of the specimens occurred either in the fastener hardware or the OSB sheathing. The SIP specimens (A1, A3, A4) with the OSB surface splines typically had failure in the sheathing along the vertical spline connection. The staples withdrew and sheared, the screws sheared and the nails withdrew and caused sheathing tear-out. Specimen B failed when the two 38 mm × 89 mm spline members separated, allowing the SIP panels to rotate independently of each other. Additional 16 d common nails at a reduced spacing would significantly increase the capacity of the specimen. The specimens with nails withstood a peak load 37% higher and a peak displacement 38% higher than the stapled specimens. The nailed specimens also withstood a peak load 7% higher and a peak displacement 31% larger than the screwed specimens. The specimens held together with screws had a sudden and brittle failure due to the shear failure of the fasteners. The ductile nature of the 8 d common nails allowed Specimens C and A1 to dissipate a greater amount of energy than the screwed and stapled specimens.
In order to determine the effect design elements had on the specimen’s performance, the fastener hardware was held constant (8 d common nails) and the spline design, hold-down anchor location, and sheathing bearing were adjusted. The spline design did not have a significant effect on the performance of the SIP specimens. The load, displacement, and ductility of Specimen A1 (8 d common nails, surface spline) and Specimen B (8 d common nails, double 38 mm × 89 mm lumber spline) were within 10% of each other. By placing the hold-down anchor on the interior of the SIP wall in rectangular cut-outs (Specimen A1 Internal), the specimen’s ductility and elastic shear stiffness increased by about 13%. The specimen also required the greatest amount of force out of all of the SIP specimens to reach the allowable wind drift (6 mm). In actual field conditions, SIP sheathing often bears directly on the sill plate. During testing, this caused more extensive damage to the panels during cyclic loading than the specimens which lacked sheathing bearing. There was also a moderate increase in peak load (8%) and peak displacement (17%) in Specimen A1 Bearing. The elastic shear stiffness also increased by 29%.
Similar to results in previous publications [
24], monotonic loading produced non-conservative results in comparison to cyclic loading. The peak load capacities at the allowable wind drift of 6 mm for the specimens averaged 35% to 50% greater under static loading
versus cyclic loading. This is consistent with Section X2.2.2.2 in ASTM E2126 [
28] that suggests that the reference deformation in the CUREE loading protocol be 60% of the monotonic deformation capacity. This is because the cumulative damage caused under cyclic loading leads to a quicker reduction in strength than damage incurred under monotonic loading.
Specimens that did not fail after the first 37 cycles of the CUREE cyclic loading protocol were loaded a second, third, and fourth time if possible to determine their ability to withstand repeated cyclic loading. Specimen C was able to retain the greatest amount of strength after Fatigue 1 test in comparison to Specimens A1 and B. Specimen A1 had the smallest decrease in strength after Fatigue 2 test. During fatigue loading of Specimens C, A1 and B the elastic shear stiffness experienced the largest reduction out of all the structural properties calculated. The specimens had an average loss of 40% to 53% after Fatigue 1 test and an average loss of 9% to 15% after Fatigue 2 test.
The results found from monotonic and cyclic testing were examined under three different seismic evaluation procedures, ICC-ES AC130 [
4], ICC-ES AC04 [
2,
3], and NTA 1M 14 TIP 10.0 [
5]. The SIP specimens connected with 8d common nails and either the surface splines or a double 38 mm × 89 mm lumber splines (Specimens A1, A1 Bearing, A1 Internal, and B) met the requirements stated in ICC-ES AC130 [
4] and ICC-ES AC04 Appendix A [
3], which allows them to be used within a seismic force resisting system with the following values: R = 6.5, Ωo = 3, and C
d = 4. Specimen A1 was the only SIP design which met the additional requirements stated in ICC-ES AC04 [
2] and NTA 1M 14 TIP 10.0 [
5]. As a result and based on such criteria, Specimen A1 may be permitted to be used as shear walls in buildings located in Seismic Design Categories A through F with the following seismic values: R = 6.5, Ωo = 3, and C
d = 4. Out of the various SIP specimen designs, A1 was the most effective design in terms of: load capacity, ductility, resistance under fatigue loading and seismic compatibility.
This research should be considered as preliminary testing, which can be used to provide a better understanding of the performance of structural insulated panels with varying parameters under monotonic and cyclic loading. Each specimen was tested once under monotonic loading and the minimal requirements for cyclic testing according to the ASTM standards. To provide a more thorough investigation, additional monotonic and cyclic testing should be performed. The specimens in this study proved to be much stronger than stated in previously published research. A testing facility with a load capacity of at least 120,096 N and a minimal drift capacity of 254 mm is required to bring the specimens to their ultimate failure should future testing be performed. ASTM 2126 [
27,
28], which was followed in this study, limits the amount of axial loading applied to the specimens under lateral loading. Future testing should place the SIPs under biaxial loading in order to mimic actual field conditions and demonstrate the panel’s ability as a load-bearing wall under cyclic loading.


 . The secant shear modulus at both 0.4 Ppeak and Ppeak was found by using the relation:
  . The
. The  refers to the aspect ratio of the specimen. The cyclic ductility ratio is defined as the ratio of the ultimate displacement and the yield displacement,
  . An equivalent energy elastic-plastic (EEEP) curve was developed by circumscribing the area enclosed by the envelope curve. The enclosed area was bordered by the origin, the ultimate displacement, and the displacement axis of the envelope curve. The envelope curve consisted of the extreme points of the load-displacement hysteresis loops. An EEEP curve can be used as a visual comparison between differing wall designs and materials [27,28].
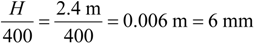 . The allowable seismic drift is 2.5% of the height of the specimen, or 0.025 × H = 0.025 × 2.4m = 0.061 m = 61 mm [2,3], or almost ten times the allowable wind drift. All of the SIP specimens performed much better under monotonic and cyclic loading than expected. Most A1, B, and C type specimens were able to withstand drifts of 127 mm (5.2% drift ratio) and greater, which is well beyond the practical application of these systems. Therefore, most of the specimens showed capacities at least twice the allowable seismic drift limit. This shows that the wall systems are not only strong but they are also ductile.
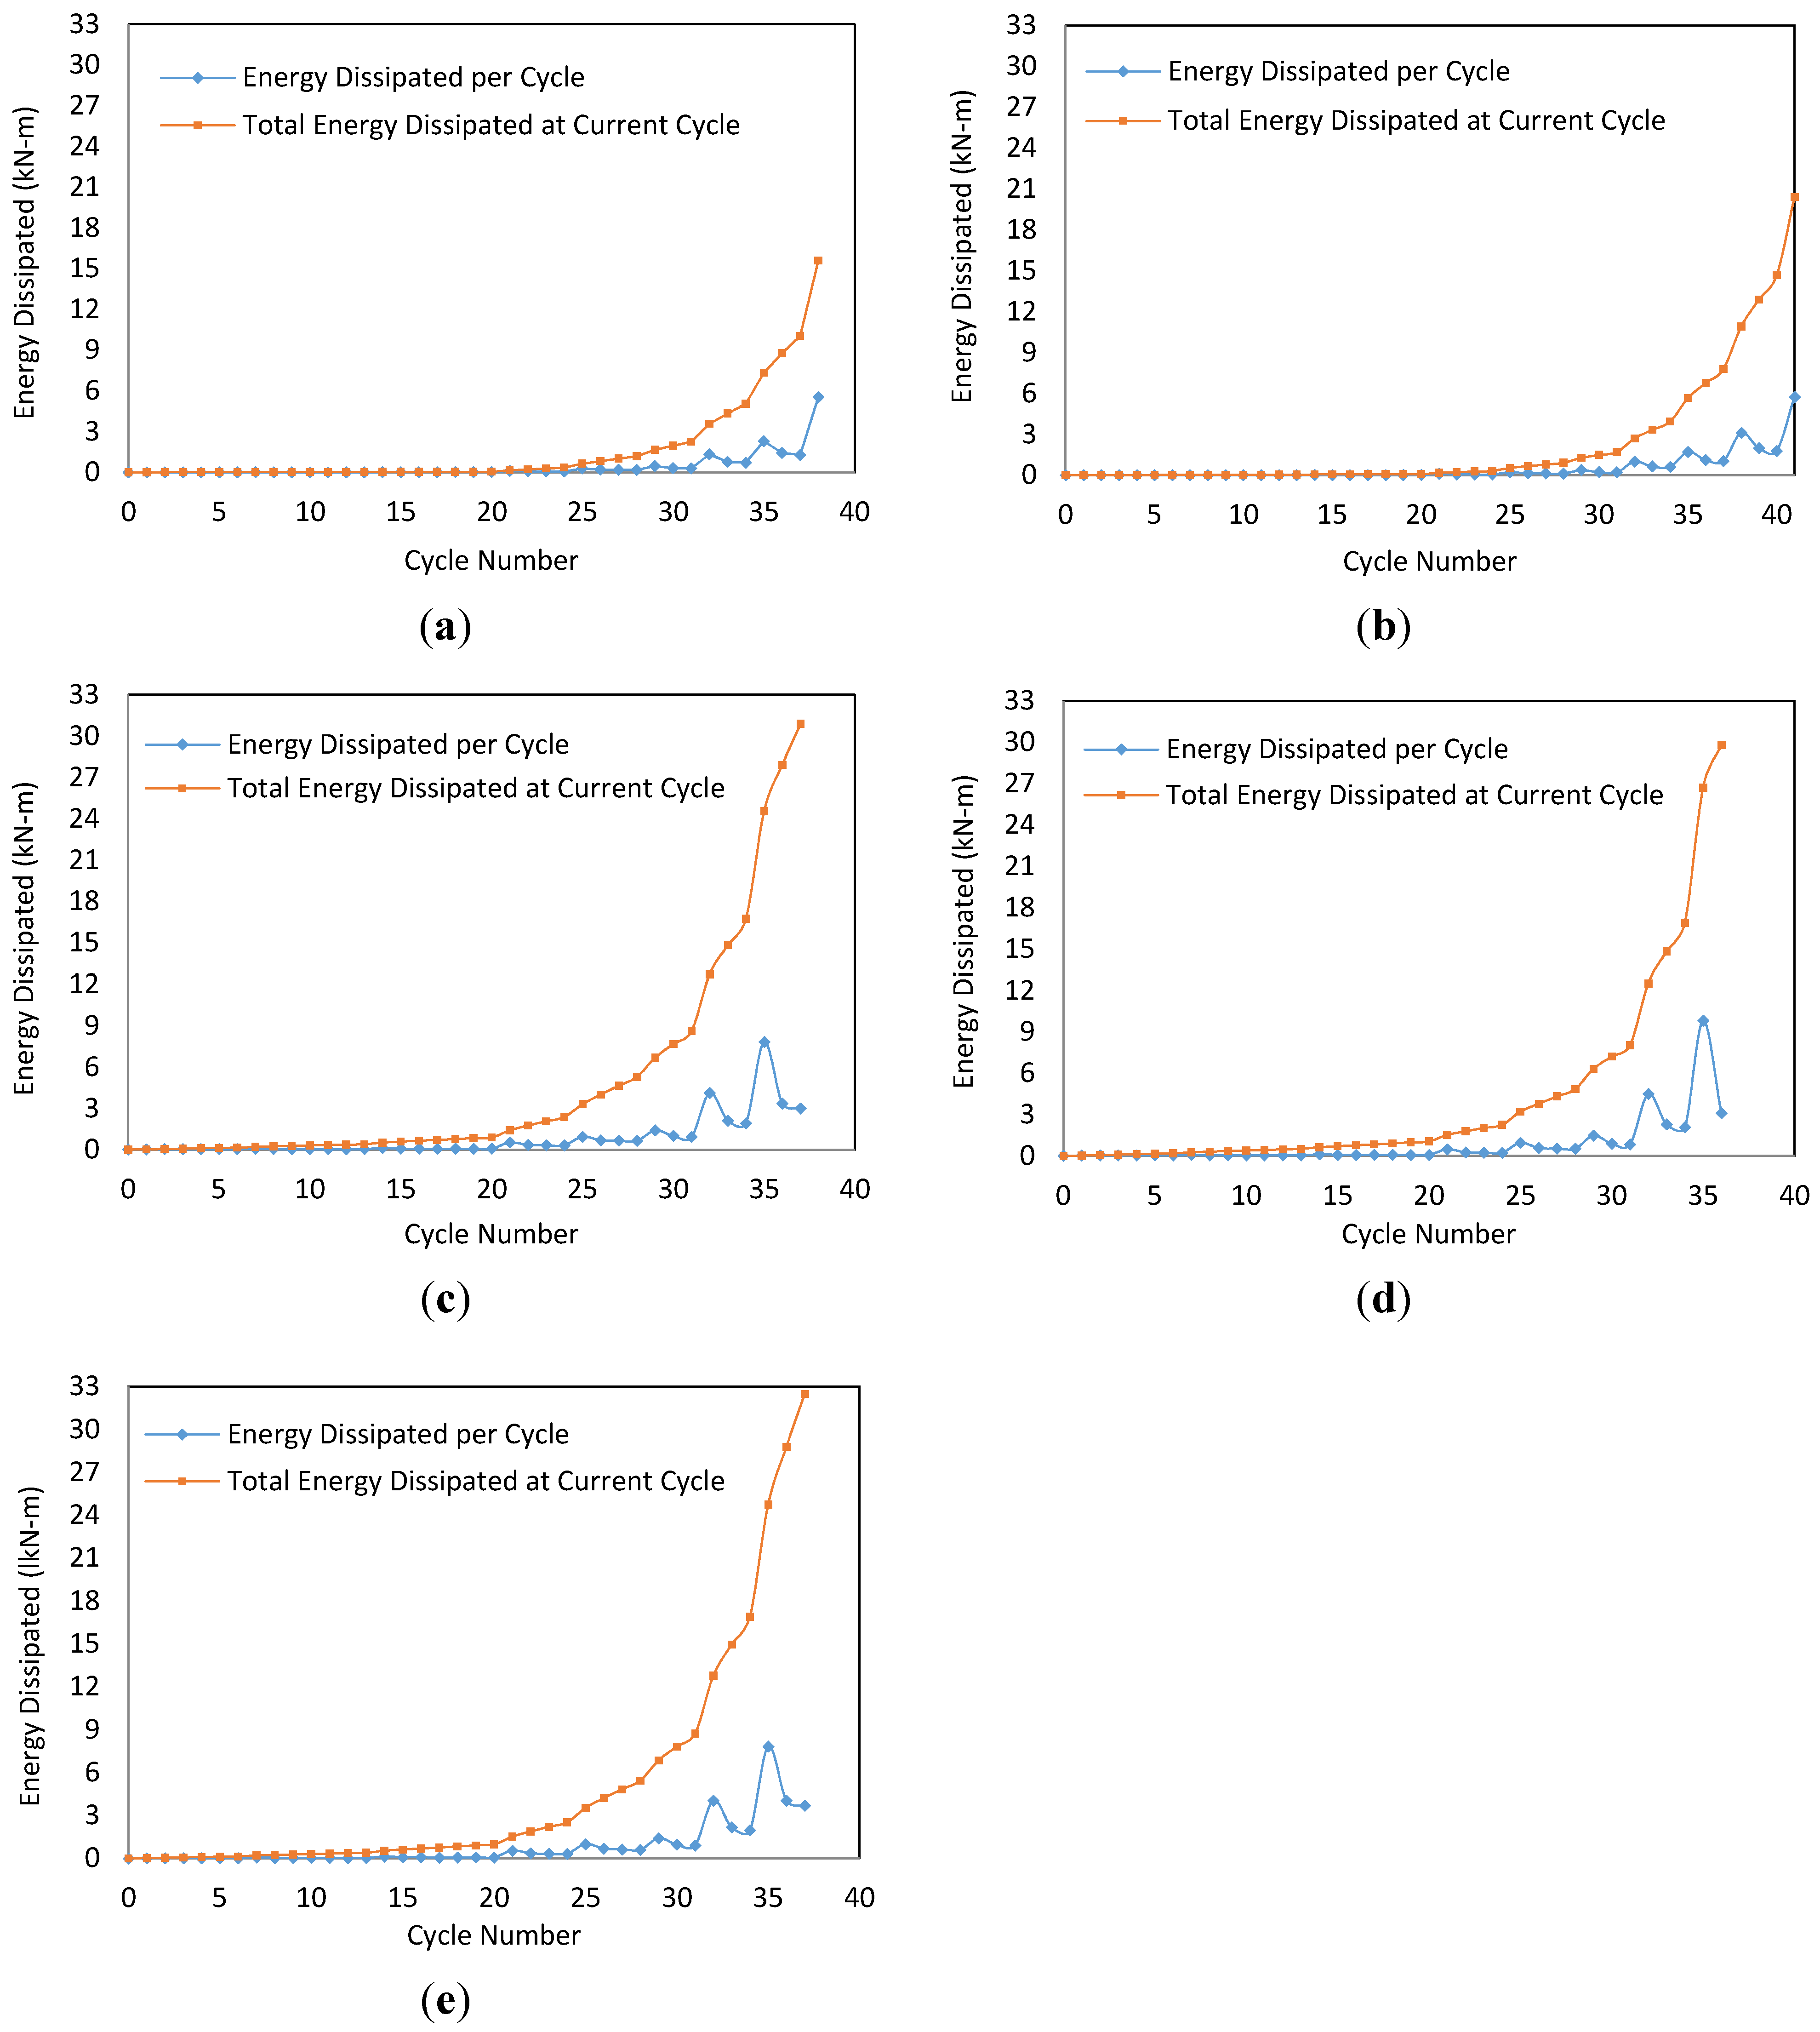
 . The ASD design load is 70% of the load of the specimen found at a displacement of 15 mm. Next, the ultimate displacement has to be greater than 2.8% of the height of the specimen, as described in the equation, ∆u ≥ 0.028H. Finally, the ratio of the peak load to the ASD design load must be between or equal to 2.5 to 5.0,
  . If all of these requirements are met, the prefabricated panels should be deemed usable as a seismic force resisting system and the specimen can be assigned the following IBC values:
 ratios turned out to be greater than 5.0. In order to be considered compliant, the evaluation report for the panel must include “a requirement that collectors and their connections, bearing and anchorage of the panel, and the lateral load path to the panel are designed in accordance with the special load combinations of Section 12.4.3 of ASCE 7, using Em where Em is calculated using the test panel overstrength” [4]. Similar to Specimens A1, B, and C, the fatigue tests of these specimens were deemed seismically compatible but did not meet the full criteria of Section 5.3.4 in ICC-ES AC130 [4].