1. Introduction
Moisture buffering effect is the capacity of interior finishing or furnishing materials to moderate indoor humidity in buildings. The moisture buffering characteristics of hygroscopic materials used for interior finishing or furnishing materials in buildings can therefore improve thermal comfort and save energy by reducing the operating hours and/or the size of HVAC systems [
1,
2,
3,
4,
5,
6]. Many large-scale experimental investigations and field tests have been conducted recently to study the moisture buffering potential of surface materials or furniture [
7,
8,
9,
10,
11]. The resultant reduction of the indoor RH amplitude between periods with and without moisture generation when hygroscopic material is applied is normally used for the evaluation of moisture buffering potential. This approach is typically approximate and sometimes hard to be applied when comparisons are made between cases tested under different test conditions, such as different air supply rates and moisture generation protocols. For this reason, the Maximum Accumulated Moisture Buffering Value (MAMBV), a value similar to the Moisture Buffer Value (MBV) at the material level, was developed and used to quantify the moisture buffering potential of test rooms under a full-scale experimental investigation [
12]. The value represents the maximum amount of moisture buffered by the hygroscopic materials with a unit of g under the representative test conditions and is computed based on moisture balance analyses established in the test rooms. This MAMBV quantifies the moisture buffering potential of a room under specific conditions and can be used to provide direct comparison among different test scenarios, and therefore, represents an easy and direct approach to evaluate the impact of various parameters on the moisture buffering potential at the whole building level.
This experimental study was carried out in a test room, measuring 3.62 m by 2.44 m by 2.43 m high, which was placed inside a large environmental chamber. The hygroscopic materials (uncoated gypsum board or wood paneling) were installed on the interior side of two walls. The effect of ventilation rates in the range of 0.5–1.5 ACH (air change per hour) and three different moisture generation profiles on the moisture buffering potential of the rooms finished with uncoated gypsum board and wood paneling were evaluated by comparing the MAMBVs obtained in each case. More information on the experimental study can be found in Reference [
12].
Due to the time and cost constraints, the cases tested in the experimental study were limited to 20. To provide a systematic evaluation of the effect of influencing parameters on the moisture buffering potential of full-scale rooms, a whole building Heat, Air and Moisture (HAM) simulation tool, BSim, is firstly validated against measurements obtained from cases tested in the large-scale environmental chamber and then applied to study additional scenarios. The parameters investigated through simulations include a larger range of ventilation rates from 0.5–5 ACH; additional materials including orientated strand board, aerated cellular concrete, and telephone book paper; different supply air conditions, a range of volume rates, and different steady-state outdoor conditions. The volume rate is defined as the ratio of surface area covered with hygroscopic materials to the total volume of the room. A detailed discussion is provided in
Section 3.4.
2. Model Set Up, Validation, and Simulated Cases
BSim is a whole building HAM simulation tool developed by Danish Building Research Institute [
13]. It has been widely used to investigate indoor climate in research and industrial projects via an integrated approach, which includes indoor climate, building envelopes, ventilation systems, and outdoor environment simulation in one package. The moisture mass balance of BSim is shown as [
14]:
where
V is the volume of the test room- (m
3); w
old and w
new are the moisture content of indoor air in the previous and current calculation steps (kg/kg); Δ
t is the time step (s);
Asurf is the surface area of hygroscopic materials (m
2);
psurf is the vapor pressure of ambient air (Pa),
P is the atmospheric pressure (Pa),
n is the ventilation rate (ACH);
G is the moisture generation rate (kg/s); β is the surface coefficient of water vapor transfer (m/s); and ρ is the density of air, kg/m
3.
BSim is a zonal model simulation tool, which assumes the room conditions well-mixed as one single node. The physical model of this tool integrates vapor transfer driven by partial vapor pressure, which was shown to have sufficient accuracy for zonal simulations [
15]. A great advantage of this model, as compared to other similar simulation tools, is that it allows users to set up specific ventilation control strategies, air leakage and supply air conditions, which makes it the most suitable simulation tool for the experiments we carried out. In addition, sufficient outputs including the original setting of simulation conditions allow users to easily track and correct mistakes.
2.1. Model Set Up and Simulated Cases
The test room and its ventilation system are modeled as a building with two rooms, of which only one simulates the test room, as shown in
Figure 1. In the test room, walls a and b were modelled with the interior finishing materials tested. The other interior surfaces of the test room were covered with aluminum sheets (0.8 mm thick), which are inert to the moisture interaction with the indoor air. The supply air, taken from the conditioned room (
Figure 1), is set to be at the same conditions as those set in the experimental study. The conditioned room is added to simplify the ventilation system and its control (inlet control) in the BSim model. The temperature and RH of this conditioned room are set at slightly lower values than those required for the supply air of the test room. So, in the ventilation system, the cooling requirement is eliminated and only humidifier and heater are added to maintain the required design conditions of the supply air. The test room temperature is maintained and controlled by a heater inside the test room. The indoor RH is left floating as the result of the test room moisture balance.
Figure 1.
Model setup in BSim (dimensions are in meters).
Figure 1.
Model setup in BSim (dimensions are in meters).
The model set up in BSim is first validated against test results from 18 of the 20 cases tested in the experimental investigation. The simulation scenarios are set according to the test conditions in the experiment, which are listed in the first part of
Table 1. Thirty additional cases (cases 19–48) are simulated in BSim. The simulation scenarios of these cases are listed in the second part of
Table 1. Cases 19–24 are designed to investigate the impact of the supply air conditions on the moisture buffering effect. Cases 25–34 are performed to investigate the impact of a larger range of ventilation rates (1.5–5 ACH); cases 35–36 are conducted under summer outdoor conditions to examine the influence of different outdoor conditions on the moisture buffering effect. Cases 37–42 are carried out to study the moisture buffering potential of additional finishing materials including orientated strand board-OSB, aerated cellular concrete-ACC, and telephone book paper-TBP. Cases 43–48 investigate the effect of increasing the areas of surfacing material on the moisture buffering potential.
The air leakage rate is set according to the measurements taken from the experimental study for cases tested (1–18), repeating the same test scenarios carried out in the experimental study while in the additional simulated cases (19–48), air infiltrations are set to be 0 to simplify the simulations.
Table 1.
Cases analyzed by simulations using BSim.
Table 1.
Cases analyzed by simulations using BSim.
| Case No. | Surface materials | HR of supply air (g/kg HR)1 | Moisture generation (g/h) | Ventilation rate (ACH) | Outdoor condition |
|---|
| 1/2 | GB/Poly | 4.7 | 103.6 g/h for 10 h | 0.5 | Winter (−10 °C) |
| 3/4 | 103.7 g/h for 10 h | 0.75 |
| 5/6 | 101.6 g/h for 10 h | 1.02 |
| 7/8 | 53.3 g/h for 10 h | 0.51 |
| 9/10 | 200.2 g/h for 2 h | 0.52 |
| 11/12 | WP/Poly | 7 | 96.6 g/h for 10 h | 0.5 | Winter (−5 °C) |
| 13/14 | 96.8 g/h for 10 h | 0.75 |
| 15/16 | 55.5 g/h for 10 h | 0.5 |
| 17/18 | 188.5 g/h for 2 h | 0.51 |
| 19 | GB | 7 | 100 g/h for 10 h | 0.5 | Winter |
| 20 | GB | 5.5 | 0.5 |
| 21 | GB | 3 | 0.5 |
| 22 | WP | 4.7 | 100 g/h for 10 h | 0.5 | Winter |
| 23 | WP | 5.5 | 0.5 |
| 24 | WP | 3 | 0.5 |
| 25 | GB | 4.7 | 100 g/h for 10 h | 1.5 | Winter |
| 26 | GB | 2 |
| 27 | GB | 3 |
| 28 | GB | 5 |
| 29 | WP | 0.75 |
| 30 | WP | 1 |
| 31 | WP | 1.5 |
| 32 | WP | 2 |
| 33 | WP | 3 |
| 34 | WP | 5 |
| 35 | GB | 4.7 | 100 g/h for 10 h | 0.5 | Summer |
| 36 | WP | 7 | 0.5 | 20 ºC, 70% |
| 37 | OSB | 4.7 | 100 g/h for 10 h | 0.5 | Winter |
| 38 | ACC |
| 39 | TBP |
| 40 | OSB | 4.7 | 200 g/h for 2 h |
| 41 | ACC |
| 42 | TBP |
| 432 | GB | 4.7 | 100 g/h for 10 h | 0.5 | Winter |
| 442 | WP | 7 |
| 453 | GB | 4.7 |
| 463 | WP | 7 |
| 474 | GB | 4.7 |
| 484 | WP | 7 |
2.2. MAMBV in BSim Simulations
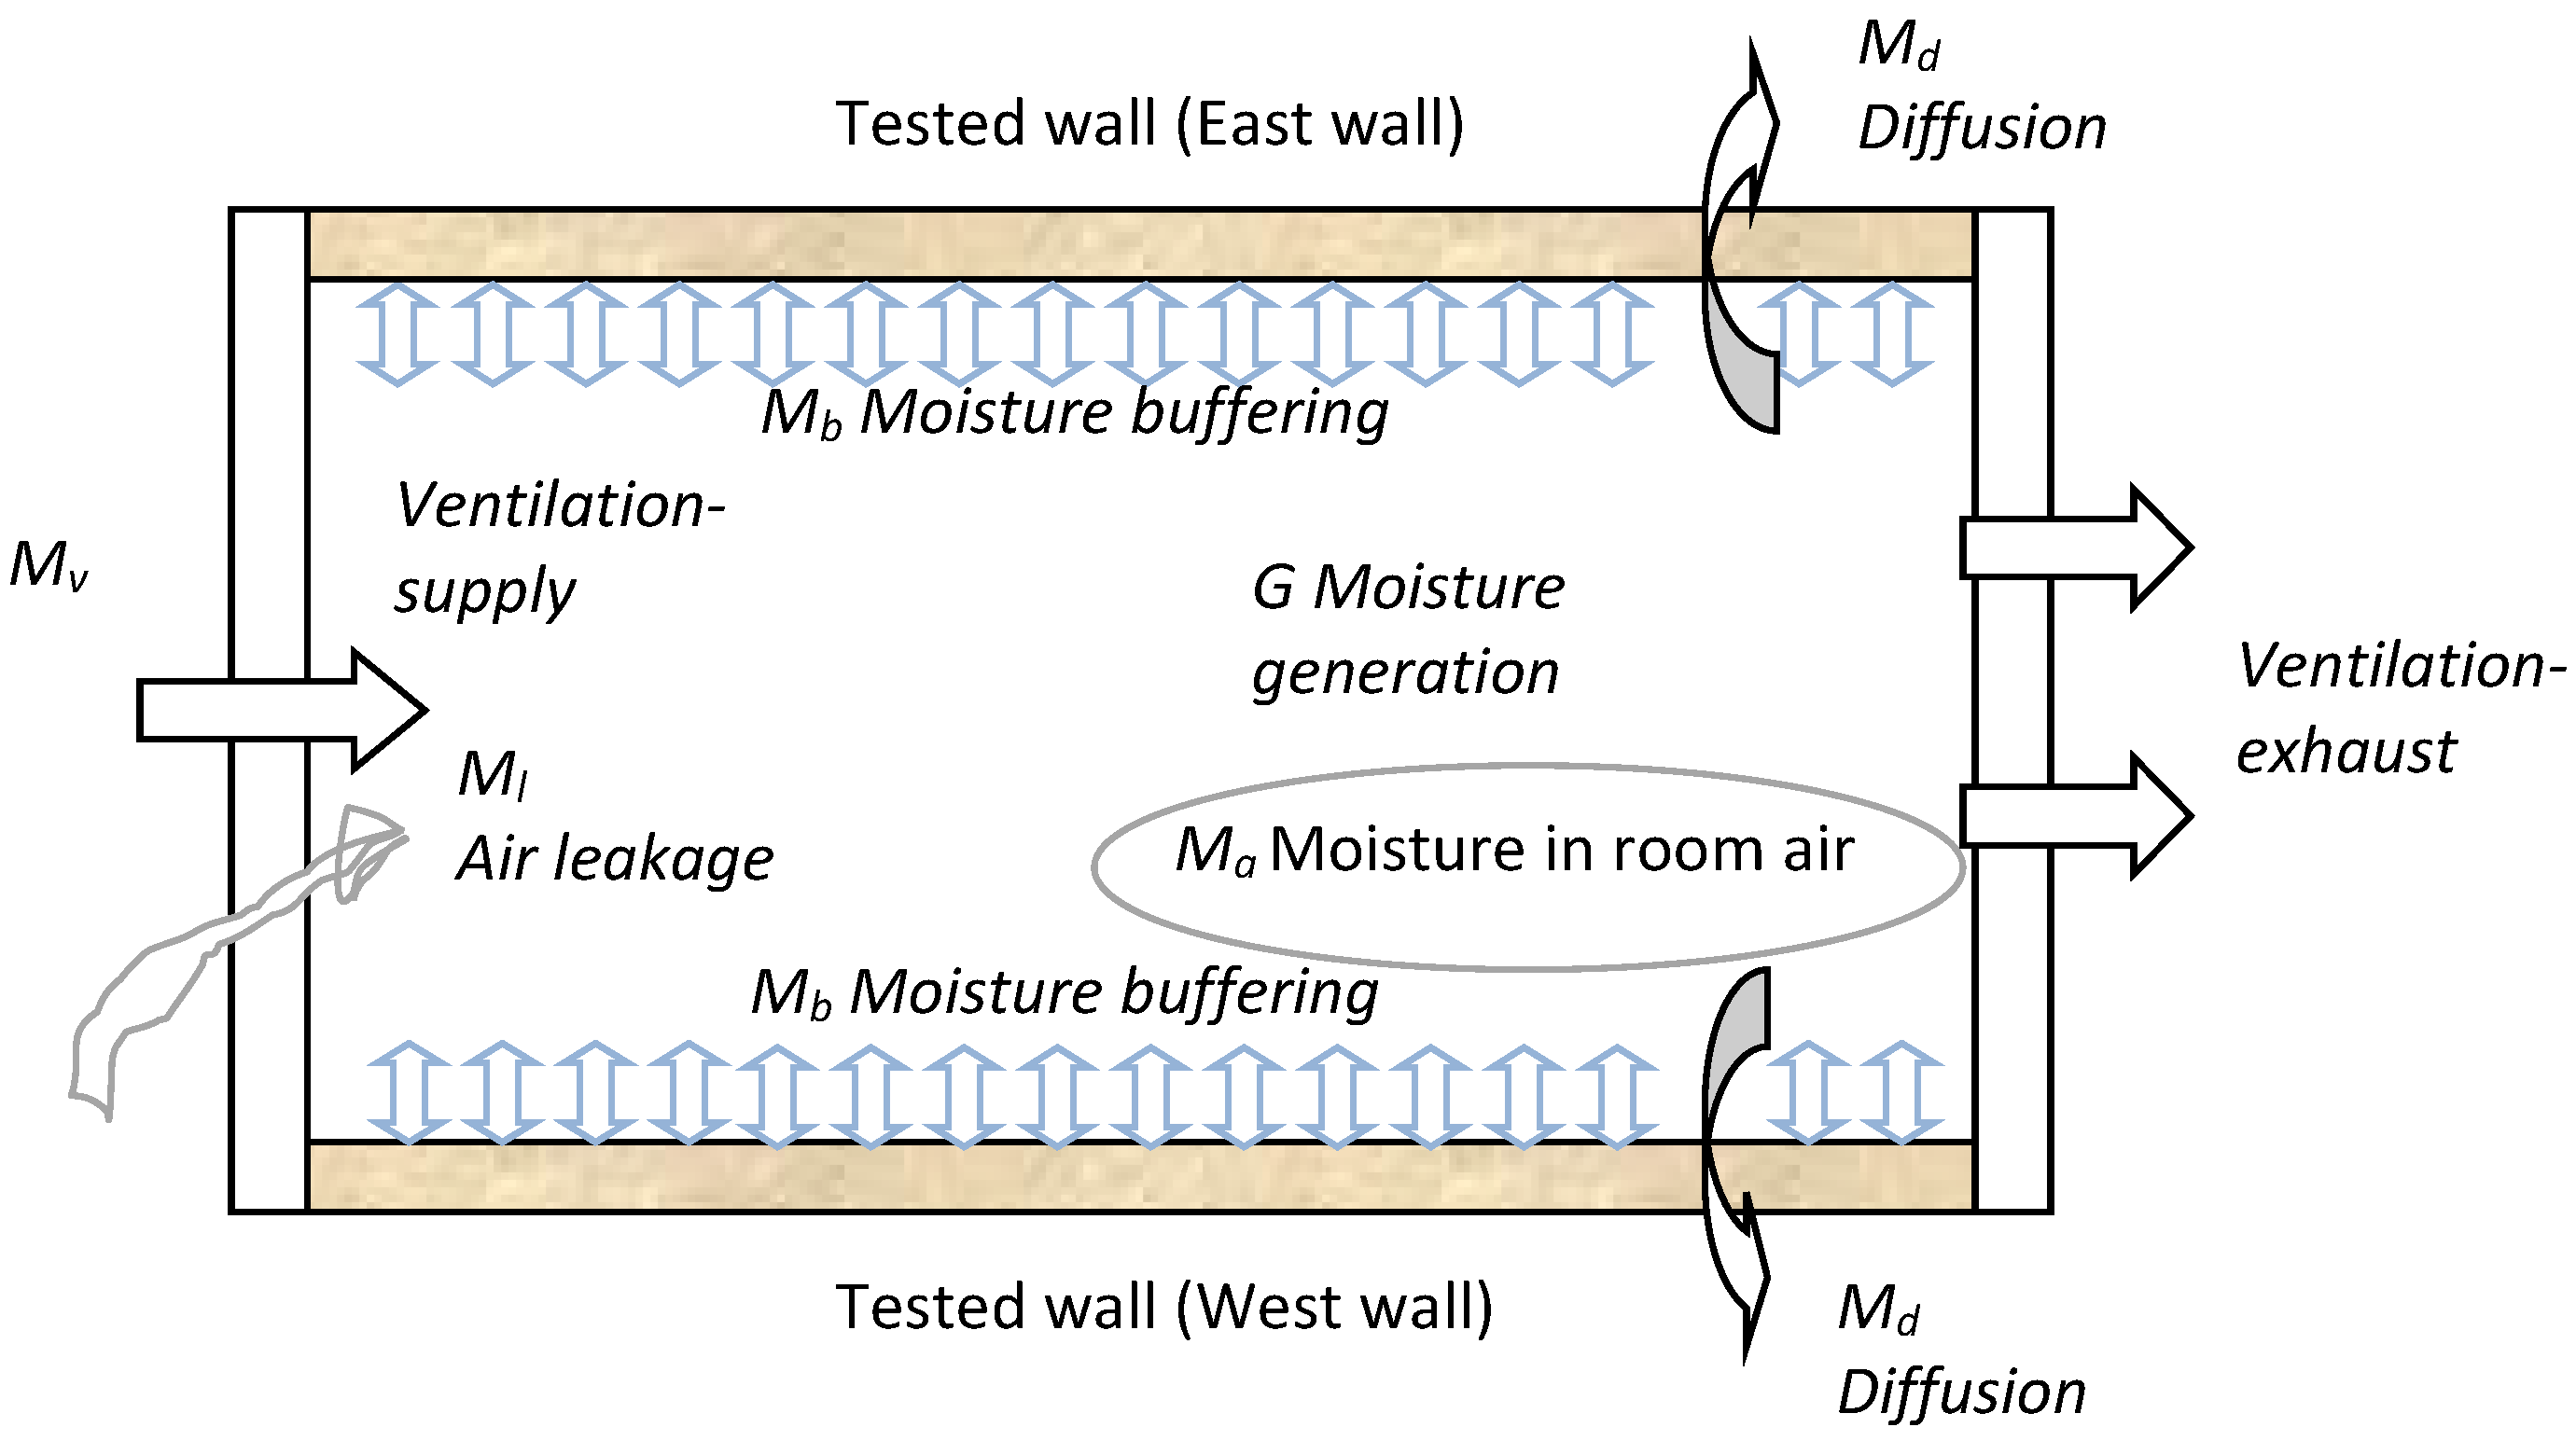
As a zonal model, BSim assumes the indoor environment as one node in the simulation. The concept of moisture balance is presented in
Figure 2. Based on the moisture balance of the test room, the moisture absorption by the finishing materials can be calculated from the simulation results as:
where
X(
t) is the moisture generated (g); The time instant,
t, is the time (h) lapsed from the start of each test, which is synchronized with the start of the moisture generation;
Mv and
Ml are the accumulated moisture removed by ventilation and by air leakage (g), respectively;
Md is the accumulated moisture diffusion through test walls (g), and
Ma is the variation of moisture in the indoor air using the total moisture in the indoor air at the start of the moisture loading cycle as the base (g). The accumulation terms are calculated from the start of the moisture loading cycle.
The simulation results of the moisture transport by ventilation,
Mv (kg), can be calculated based on the conditions of inlet air and indoor air,
where
wv is the humidity ratio (HR) of the inlet air (kg/kg),
wi is the average humidity ratio of the indoor air (kg/kg), and
Qv is the mass flow rate of ventilation air (kg/h).
Ql is the mass flow rate (kg/h) of air leakage that infiltrates from the outdoor into the test room. The accumulated water mass gain is calculated as:
where
wc is the humidity ratio of the air in the environmental chamber (kg/kg). For Cases 19–48, there is no air leakage and
Ql is assumed to be zero in Equations (3) and (4).
Figure 2.
Moisture accumulation in the test room (Reproduced with permission from [
12]. Copyright 2012 Elsevier).
Figure 2.
Moisture accumulation in the test room (Reproduced with permission from [
12]. Copyright 2012 Elsevier).
MAMBV in the cases of BSim simulations thus can be defined as the maximum value of Mb(t). This value, obtained from BSim simulations, is used to evaluate the impact of various parameters on the moisture buffering effect in this paper.
2.3. Comparison of Experimental and BSim Simulation Results
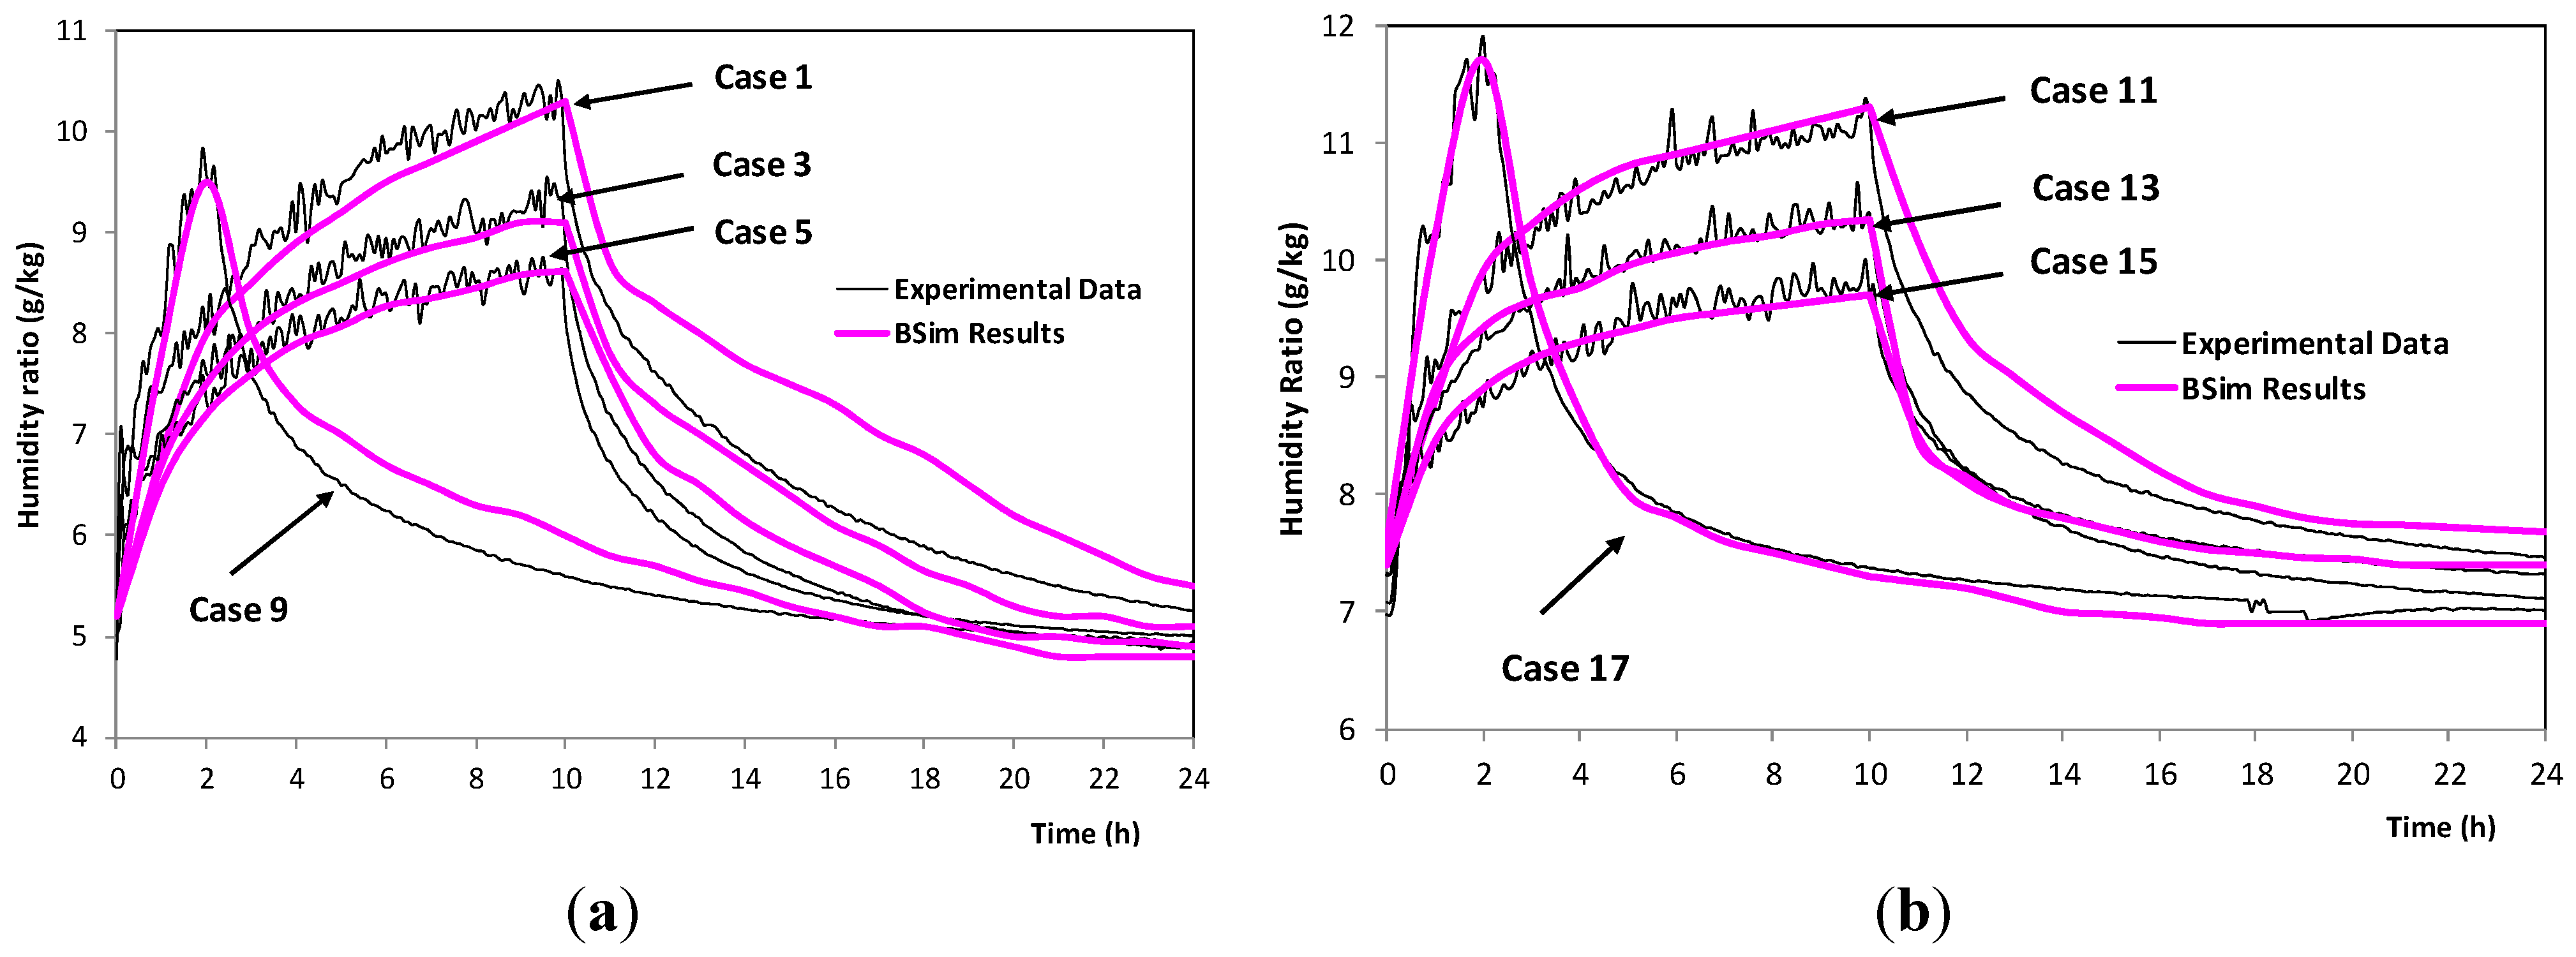
As shown in
Figure 3, the BSim simulation results are within 3% of the experimental results during the period of moisture generation for cases 1–18. That is, the differences in HR between simulations and measurements are within 0.2 g/kg for all cases. During the non-moisture generation period, the difference between experimental and simulation results is approximately 7%, for the cases using uncoated gypsum board. The maximum difference in MAMBV between experimental results and simulations is less than 10% for all 18 cases with experimental data, as shown in
Table 2.
Figure 3.
Comparisons of indoor humidity ratio, simulations (a) vs. experiments (b).
Figure 3.
Comparisons of indoor humidity ratio, simulations (a) vs. experiments (b).
Table 2.
Comparison of MAMBVs obtained from simulation results and experimental data.
Table 2.
Comparison of MAMBVs obtained from simulation results and experimental data.
| Case No. | Conditions | MAMBV in experiments (g) | MAMBV in simulations (g) | *Difference (%) |
|---|
| 1 | GB, 4.7 g/kg HR supply air, 103.6 g/h for 10 h moisture generation, 0.5 ACH | 226 | 246 | 8.8 |
| 3 | GB, 4.7 g/kg HR supply air, 103.7 g/h for 10 h moisture generation, 0.75 ACH | 155 | 167 | 7.7 |
| 5 | GB, 4.7 g/kg HR supply air, 101.6 g/h for 10 h moisture generation, 1.02 ACH | 114 | 121 | 6.1 |
| 7 | GB, 4.7 g/kg HR supply air, 53.3 g/h for 10 h moisture generation, 0.51 ACH | 113 | 125 | 10.6 |
| 9 | GB, 4.7 g/kg HR supply air, 200.2 g/h for 2 h moisture generation, 0.52 ACH | 186 | 191 | 2.7 |
| 11 | WP, 7 g/kg HR supply air, 96.6 g/h for 10 h moisture generation, 0.5 ACH | 236 | 245 | 3.8 |
| 13 | WP, 7 g/kg HR supply air, 96.8 g/h for 10 h moisture generation, 0.75 ACH | 154 | 170 | 10.3 |
| 15 | WP, 4.7 g/kg HR supply air, 55.5 g/h for 10 h moisture generation. 0.5 ACH | 141 | 146 | 3.5 |
| 17 | GB, 4.7 g/kg HR supply air, 188.5 g/h for 2 h moisture generation, 0.51 ACH | 110 | 121 | 10.0 |
In summary, it can be concluded that BSim simulation results agree well with measurements undertaken under the test cases; therefore, they can be used as a reliable tool to study the impact of different parameters on the moisture buffering potential.
3. Results and Discussion
The impact of different parameters on moisture buffering potential of the hygroscopic materials is evaluated using the MAMBV calculated for each case using simulation results. Parameters investigated include ventilation rates, supply air conditions, types of hygroscopic materials, steady-state outdoor conditions, and volume rates.
Under ideal conditions, the amount of moisture buffered (MBC) (kg/m
2) by hygroscopic material under a relative humidity amplitude of ΔRH can be estimated as:
At the material level, the ideal Moisture Buffering Value (MBV), kg/m
2·%RH, is proportional to the moisture effusivity
bm times the square root of the time period,
tp, as given by Equation (6) [
16].
where,
α is the fraction of the time period where the humidity level is high. For 10/14 load schemes, the ideal MBV becomes:
The effusivity is defined as:
where, δ
p (kg/(m·s·Pa)) is the water vapor permeability, ρ
0 (kg/m
3) is the dry density of the material,
u (kg/kg) is the moisture content, φ (% or −) is relative humidity, and
Ps (Pa) is the saturation vapor pressure. The above equations are only valid for ideal conditions, which are (1) the specimen’s thickness exceeds the penetration depth for daily humidity variation and can thus be treated as semi-infinite for the imposed signal; (2) the non-linearity of the material properties is negligible in the RH range under consideration; and (3) the surface convective mass transfer coefficient is infinity, thus the surface film resistance is negligible in comparison with the internal vapor diffusion resistance.
The MAMBV (kg) for the test room under ideal conditions is:
where
A is the surface area of hygroscopic materials, m
2. Under realistic conditions, the actual moisture buffering capacity of hygroscopic materials is influenced by its actual thickness, loading profiles, and boundary conditions,
etc.
3.1. Impact of Ventilation Rates on Moisture Buffering Potential
Fourteen cases with a larger ventilation rate variation were simulated and analyzed to evaluate the impact of ventilation rates. For all these cases, the same supply air conditions of 4.7 g/kg of dry air, HR, is applied.
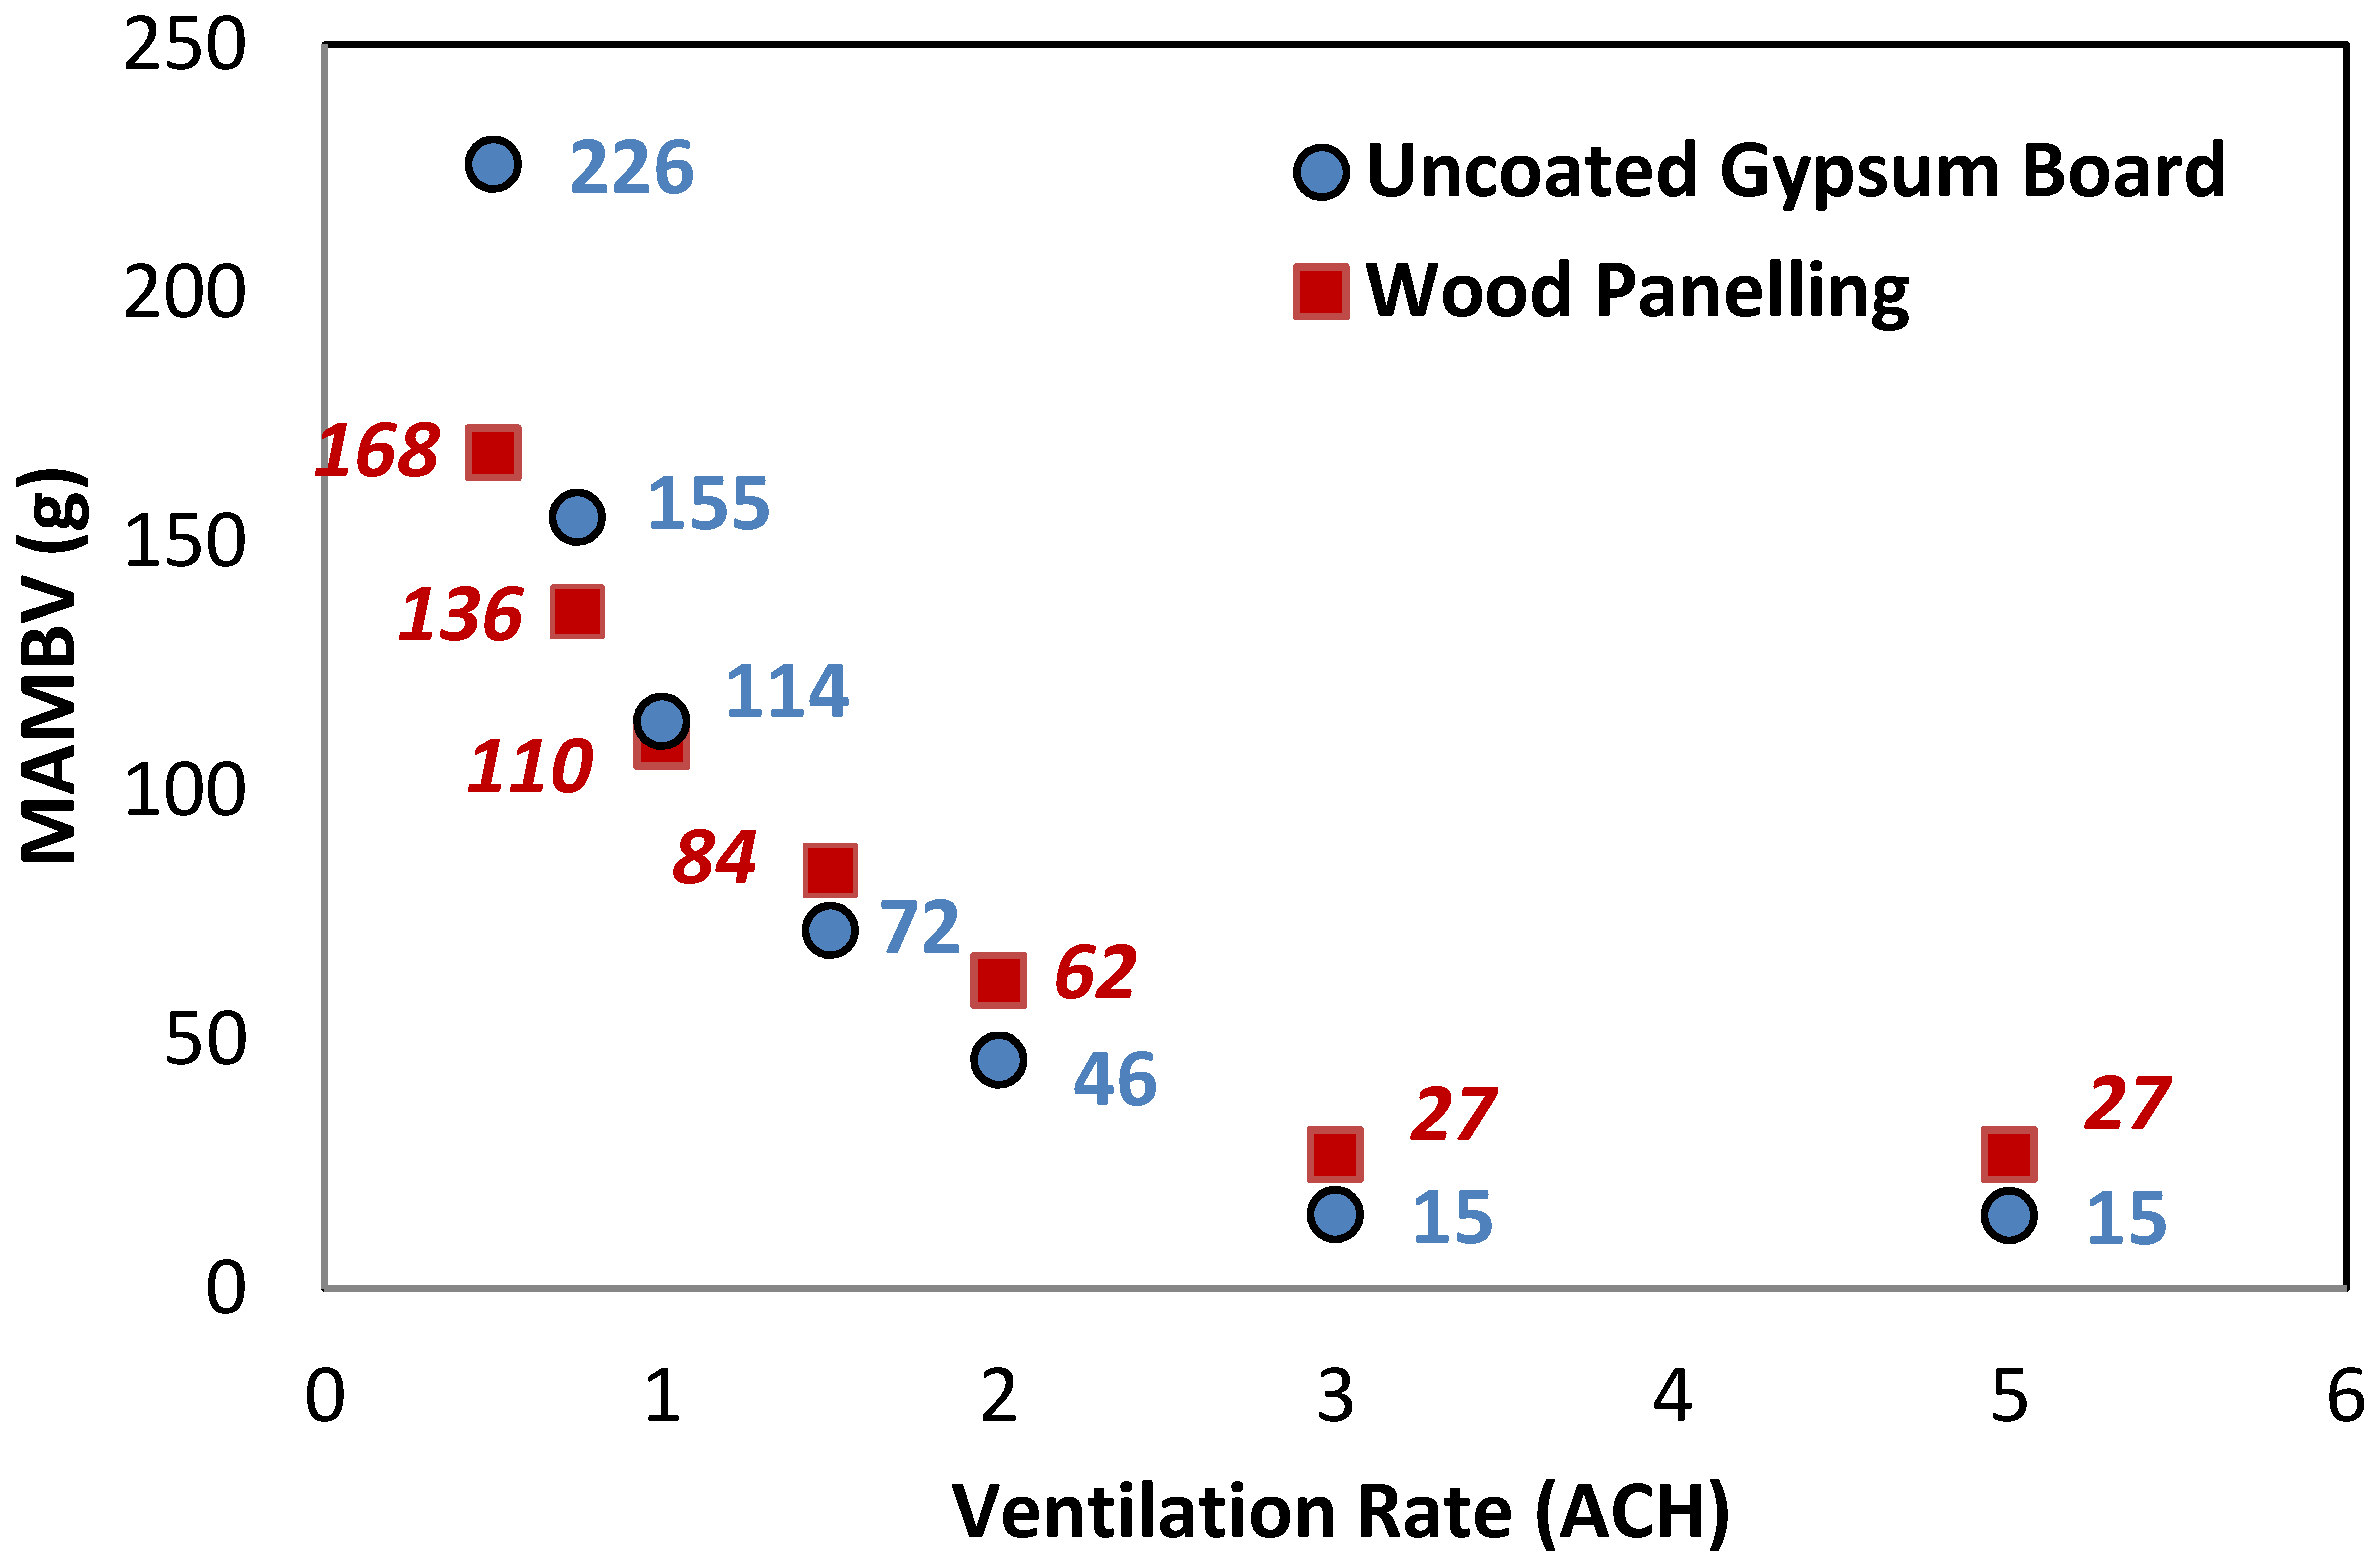
The increase of the ventilation rate results in a reduction of indoor RH variation, which has been observed in the experimental study as well (cases 1, 3, and 5). However, due to the limited experimental data points for MAMBV analyses, it was difficult to derive the trend. Therefore, a larger range of ventilation rates is analyzed in simulated cases 25–34. It is found that the impact of ventilation rates is more significant under the lower ventilation rates based on MAMBV analyses obtained from BSim simulations. For example, when the ventilation rate increases from 0.5–1 ACH and from 1–1.5 ACH, the reductions of MAMBV are 112 g (50% reduction) and 42 g (19% reduction), respectively, for cases using uncoated gypsum board, as shown in
Figure 4. Equivalent reductions for cases using wood paneling are 58 g (35% reduction) and 26 g (15% reduction), respectively. The moisture buffering effect is significantly reduced when the ventilation rate is greater than 3 ACH, as shown in
Figure 4.
The effect of ventilation rates on the MAMBV can be explained by the effect of ventilation rates on the average room relative humidity and the relative humidity amplitude during the moisture generation period. As shown in
Figure 5, with the increase of ventilation rate, both the average RH and RH amplitudes decrease. The relation is almost linear for the ventilation rates from 0.5–1.5 ACH while for ventilation rates greater than 1.5 ACH, the effect of ventilation rates on the RH is much smaller. The resultant room RH for the wood paneling is similar to that for the uncoated gypsum board.
Figure 4.
Maximum accumulated moisture buffering value (MAMBV) at different ventilation rates for uncoated gypsum board and wood paneling under supply air humidity at 4.7 g/kg (cases 1, 22, 25–34).
Figure 4.
Maximum accumulated moisture buffering value (MAMBV) at different ventilation rates for uncoated gypsum board and wood paneling under supply air humidity at 4.7 g/kg (cases 1, 22, 25–34).
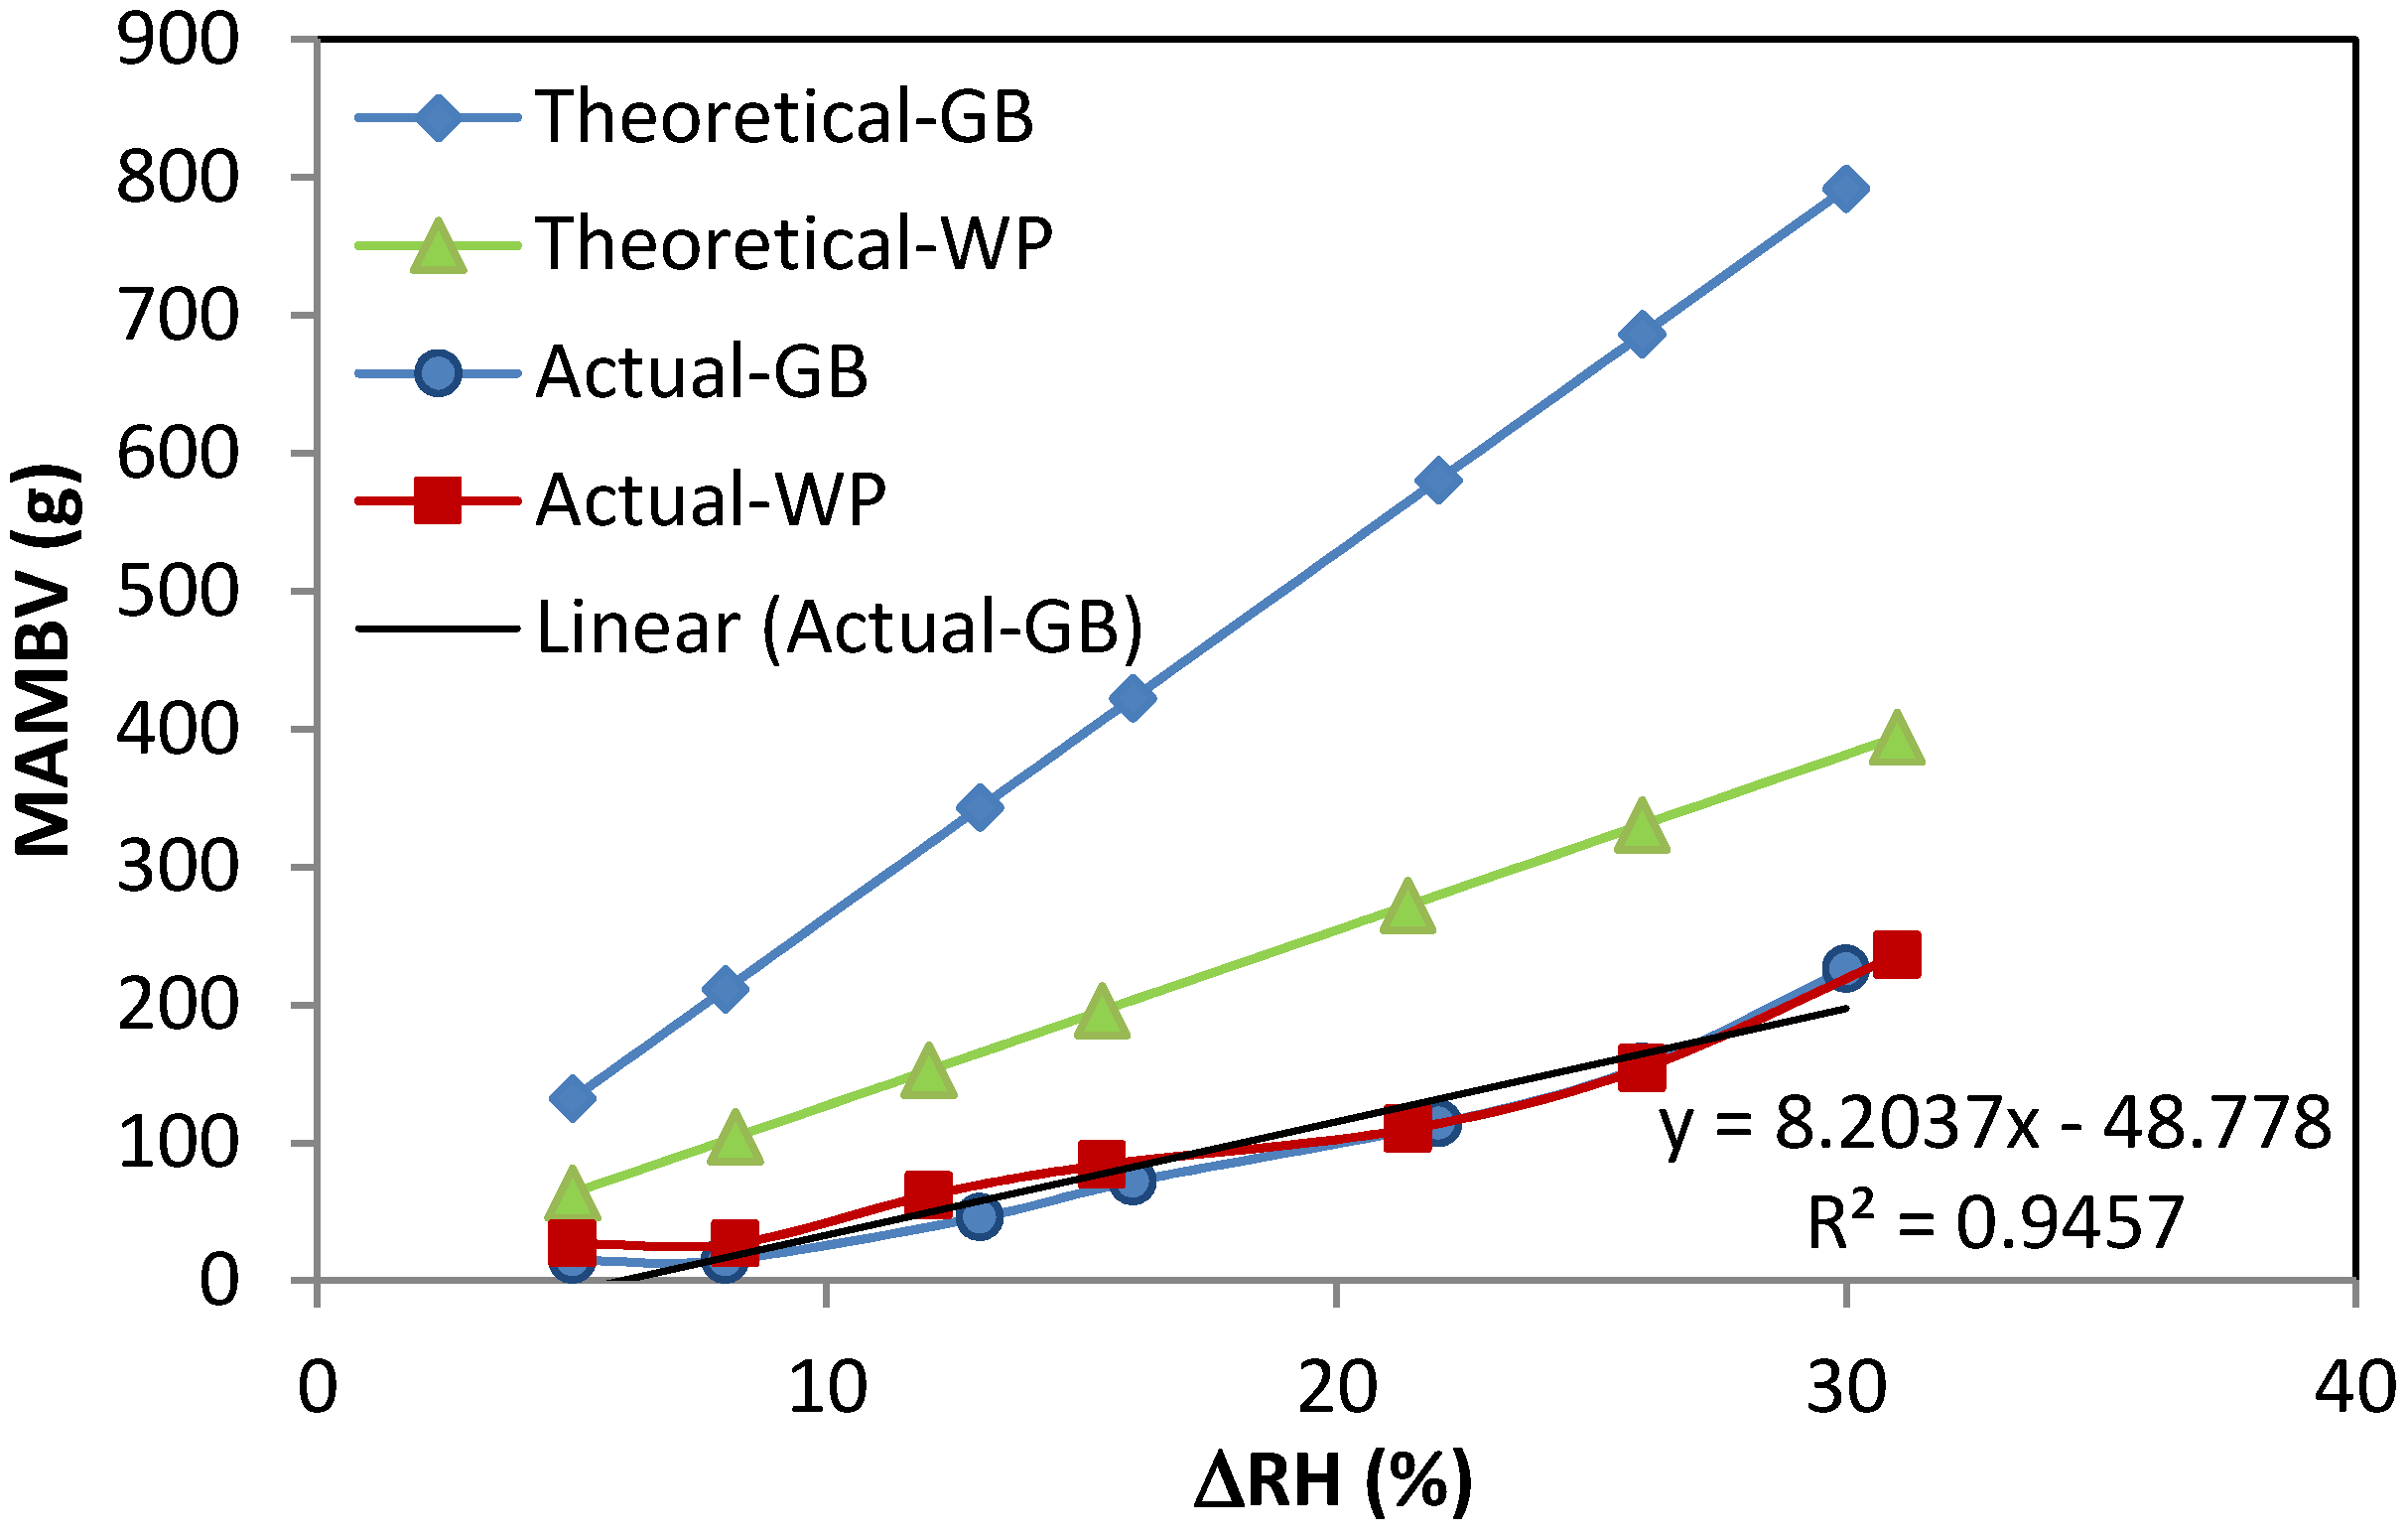
Theoretically, under ideal conditions, the MAMBV is proportional to the RH amplitude according to Equations (5) and (9).
Figure 6 plots the relations between RH amplitude and the MAMBV for both uncoated gypsum board and wood paneling under ideal and realistic conditions. The effusivity of uncoated gypsum board is about twice that of the wood paneling, therefore, theoretically uncoated GB should have MAMBV twice that of the wood paneling under the same RH amplitude. However, the actual MAMBV for the GB is similar to that of the wood paneling under the realistic conditions. This is mainly attributed to the finite thickness of GB, which is 13 mm although the 1% penetration depth of GB is 103 mm. Therefore, the moisture buffering potential of GB is restricted by its limited thickness [
17]. The actual MAMBV shows a good linearity with the RH amplitude.
Figure 5.
Relation between ventilation rate and room relative humidity for uncoated gypsum board and wood paneling under supply air humidity at 4.7 g/kg (cases 1, 22, 25–34).
Figure 5.
Relation between ventilation rate and room relative humidity for uncoated gypsum board and wood paneling under supply air humidity at 4.7 g/kg (cases 1, 22, 25–34).
Figure 6.
Relation between the MAMBV and the RH amplitude for both uncoated gypsum board and the wood paneling under ideal and realistic conditions.
Figure 6.
Relation between the MAMBV and the RH amplitude for both uncoated gypsum board and the wood paneling under ideal and realistic conditions.
3.2. Impact of Humidity Levels in the Supply Air on Moisture Buffering Potential
In the experimental investigation, the condition of the supply air is at 4.7 g/kg HR and 19 °C for the cases using uncoated gypsum board and at 7.0 g/kg HR and 19 °C for the cases using wood paneling. To explore the influence of different supply air conditions on the room moisture buffering potential (MAMBVs), additional cases (19–24) are simulated. Two humidity levels (4.7 and 7.0 g/kg HR) are applied to the supply air in these cases.
It is found that with higher humidity levels in the supply air, more moisture is absorbed by the hygroscopic materials, as shown in
Figure 7. Of course, over the seasons, humidity levels in the supply air vary and are fully determined or partly affected by the conditions of the outdoor air depending on the ventilation strategy. A commonly used ventilation strategy is to take in the minimum amount of outdoor air required during the winter and summer and to increase the outdoor air up to 100% during the spring and fall seasons. So, the moisture buffering effect varies seasonally depending on the outdoor air conditions and the ventilation strategy.
Figure 7.
Maximum accumulated moisture buffering value (MAMBV) obtained from simulations under different humidity levels of supply air (case 1, 11, 19–24).
Figure 7.
Maximum accumulated moisture buffering value (MAMBV) obtained from simulations under different humidity levels of supply air (case 1, 11, 19–24).
3.3. Impact of Material Properties on Moisture Buffering Potential
In the experimental investigation, it is found that the moisture buffering potential (in terms of MAMBV) of uncoated gypsum board and wood paneling under long (10/14 h) or short (2/22 h) moisture generation loads are determined by their differences in the moisture capacity and vapor permeability [
12,
18,
19]. To confirm this observation, extra cases (37–42) using aerated cellular concrete (ACC), oriented strand board (OSB), and telephone book paper (TBP) are simulated.
ACC has high vapor permeability but low moisture absorption capacity, similar to those of uncoated gypsum boards. OSB has high moisture absorption capacity but low vapor permeability, similar to wood paneling. TBP has high values for both moisture absorption capacity and vapor permeability. These three materials represent three types of hygroscopic materials; their materials properties are included in
Table 3 and
Table 4. The material properties are taken from reference indicated in the table. Moisture sorption isotherm and vapor transfer resistance factor can be expressed as [
11]:
where
wsat is the saturation moisture content of materials (kg/m
3); a, b, c, m, n are constants obtained from fitting.
Table 3.
Constants used for sorption isotherm curve and vapor transfer resistance factor of materials used in this paper.
Table 3.
Constants used for sorption isotherm curve and vapor transfer resistance factor of materials used in this paper.
| Materials | wsat | m | n | a | b | c |
|---|
| Wood paneling (WP) [15] | 588 | −625.404 | 1.4639 | 1.98 × 10⁻⁵ | 2.72 × 10⁻⁴ | 5.930 |
| Oriented strand board (OSB) [12] | 903 | −1057.568 | 1.449 | 3.90 × 10⁻⁵ | 1.06 × 10⁻³ | 3.241 |
| Uncoated gypsum board (GB) [12] | 805 | −8416.602 | 1.652 | 0.650 | −0.512 | −0.224 |
| Aerated cellular concrete (ACC) [14] | 498 | −8414.644 | 1.515 | 0.101 | 6.59 × 10⁻⁶ | 8.930 |
| TEL. book paper (TBP) [13] | 165 | −14.172 | 1.594 | 0.009 | 2.57 × 10⁻⁴ | 5.656 |
Table 4.
Other properties of materials used in this paper.
Table 4.
Other properties of materials used in this paper.
| Materials | Thickness (m) | Density (kg/m3) | Heat capacity (J/kg·K) | Thermal conductivity (W/m·K) |
|---|
| Wood paneling (WP) [15] | 0.018 | 520 | 1880 | 0.120 |
| Gypsum board (GB) [12] | 0.013 | 592 | 870 | 0.150 |
| Oriented strand board (OSB) [12] | 0.012 | 664 | 1880 | 0.090 |
| Aerated cellular Concrete (ACC) [14] | 0.010 | 450 | 900 | 0.110 |
| Tel. book paper (TBP) [13] | 0.010 | 690 | 1300 | 0.130 |
In the simulated cases, these three materials are applied on two wall surfaces, where wood paneling or uncoated gypsum board was installed in the experimental investigation. Two different moisture generation protocols are applied in the test room for the simulations: 10/14 h at 100 g/h for 10 h and 2/22 h at 200 g/h for 2 h moisture generation.
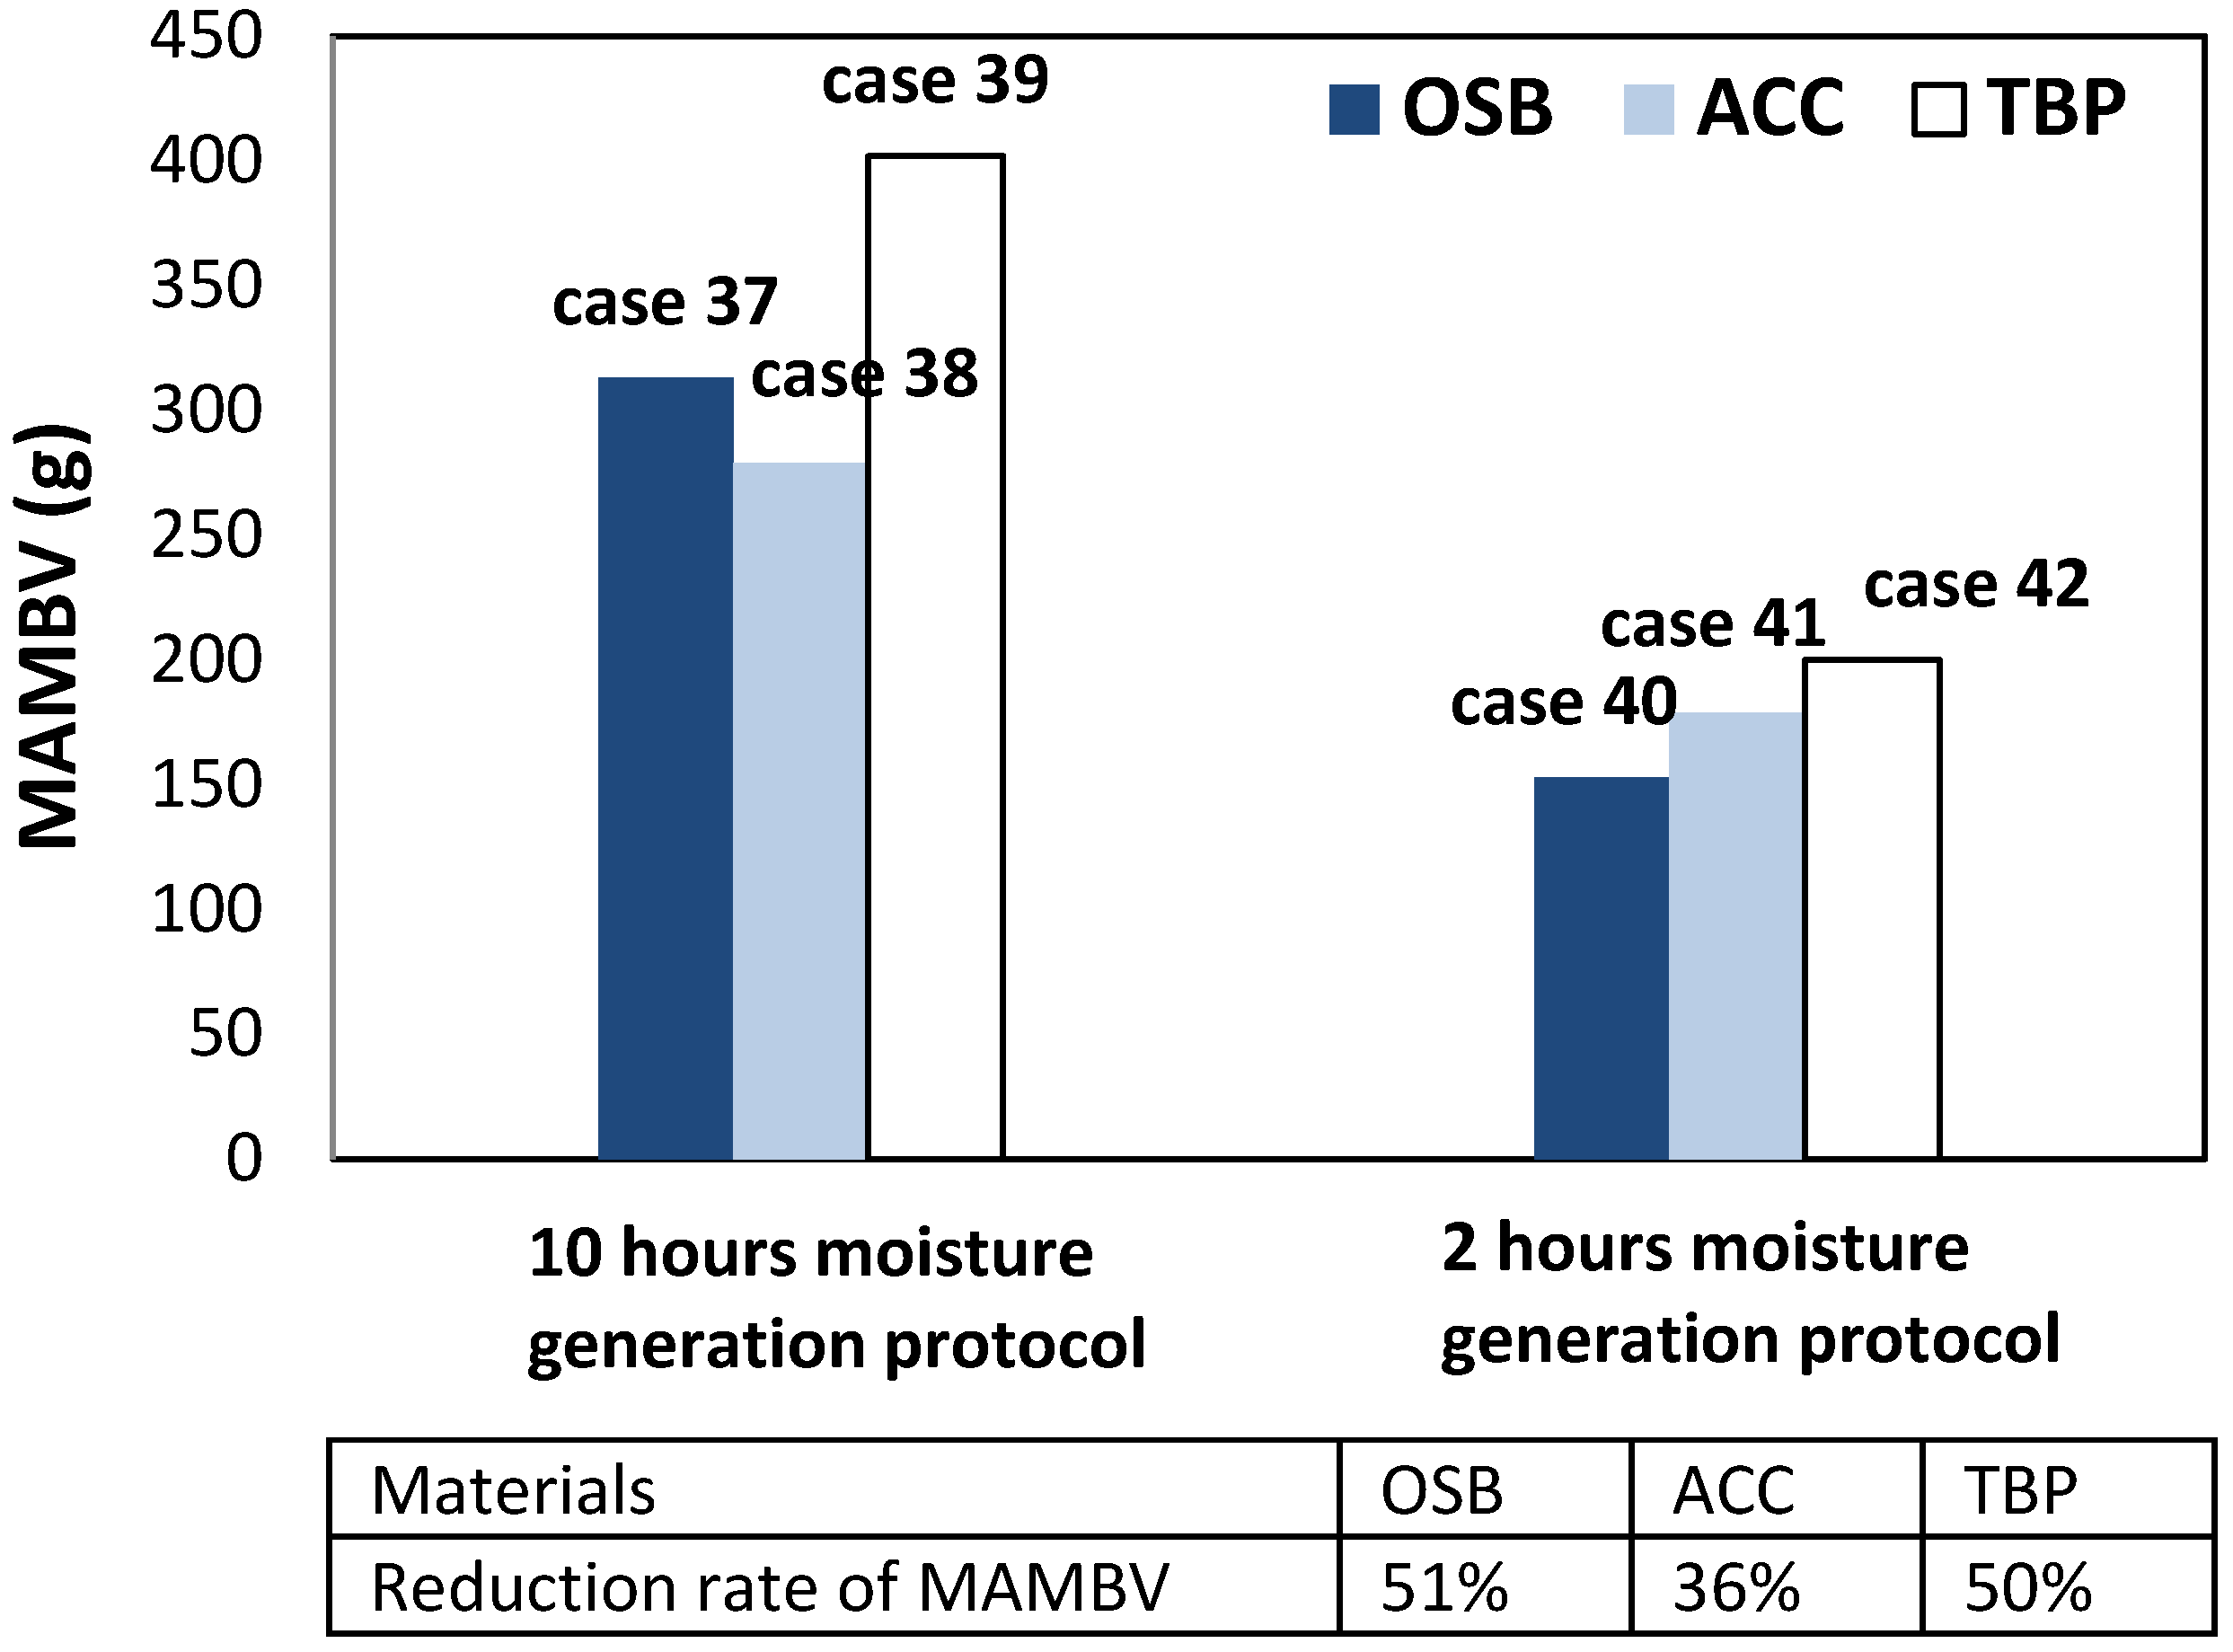
Under the 10/14-h moisture generation protocol, in which moisture is generated continuously for 10 h in a 24 h cycle, the MAMBV in case 37, which uses OSB, is 10% higher than in case 38, which uses ACC (
Figure 8). For the same moisture loading profile, case 39 using TBP results in a much higher MAMBV (of over 20%–25%) than cases 37 (OSB) and 38 (ACC). These results confirm the conclusion drawn from the experimental investigation that materials with high moisture absorption capacity show higher moisture buffering potential under long-period moisture generation protocol (10/14).
It is interesting to note that, under the shorter moisture generation schedule 2/22 (in which moisture is generated continuously for 2 h in a 24 h cycle), the MAMBV values for case 40 with OSB, case 42 with TBP, and case 41 with ACC, reach 51%, 50% and 36%, respectively, of the corresponding MAMBV values for cases 37, 39, and 38 simulated under the 10/14 moisture generation protocol. Hence, ACC with the higher permeance exhibits the higher rate of moisture absorption followed by the TBP and then by OSB with the lowest permeance. These values indicate that materials with higher permeance have higher moisture buffering potential under short period moisture generation protocol. As discussed in
Section 3.1, under ideal conditions when the hygroscopic material has an infinite thickness, the moisture buffering capacity of hygroscopic material is proportional to its effusivity. However, under realistic conditions the actual moisture buffering capacity of hygroscopic materials is influenced by its actual thickness and the loading profiles. In the case of short loading scheme, the higher vapor permeance of ACC allows moisture to penetrate easily into the depth of the material; therefore, more volume of the material participates in moisture buffering. Although OSB has higher moisture capacity, under short loading scheme its penetration depth is small due to its high vapor resistance, therefore, a smaller volume of material involved in the moisture storage, thus less moisture buffering capacity.
Figure 8.
Maximum accumulated moisture buffering value (MAMBV) of cases using OSB, ACC and TBP as interior surface materials under two different moisture generation protocols.
Figure 8.
Maximum accumulated moisture buffering value (MAMBV) of cases using OSB, ACC and TBP as interior surface materials under two different moisture generation protocols.
3.4. Impact of Room Volume (Volume Rate) on Moisture Buffering Potential
The surface area covered with hygroscopic materials divided by the total volume of the room is defined as the volume rate [
20]. It represents the amount of surface material that is active in the hygrothermal interaction with an indoor environment. The impact of the volume rate on moisture buffering potential is investigated through simulations.
More areas of uncoated gypsum board or wood paneling are added in the indoor space in four steps. Initially, cases 1 and 11 have test walls a and b covered with hygroscopic materials. In the first step, hygroscopic materials are applied on two more interior walls, walls c and d (cases 43 and 44). In the second step, the ceiling of the test room is also covered with hygroscopic materials (cases 45 and 46). In the last step, the floor of the simulated room is covered with hygroscopic materials (cases 47 and 48). So, the volume rate increased from 0.81–1.36, 1.76, and finally 2.18, respectively. The conditions of these simulations are listed in
Table 1.
The MAMBVs in these cases, plotted in
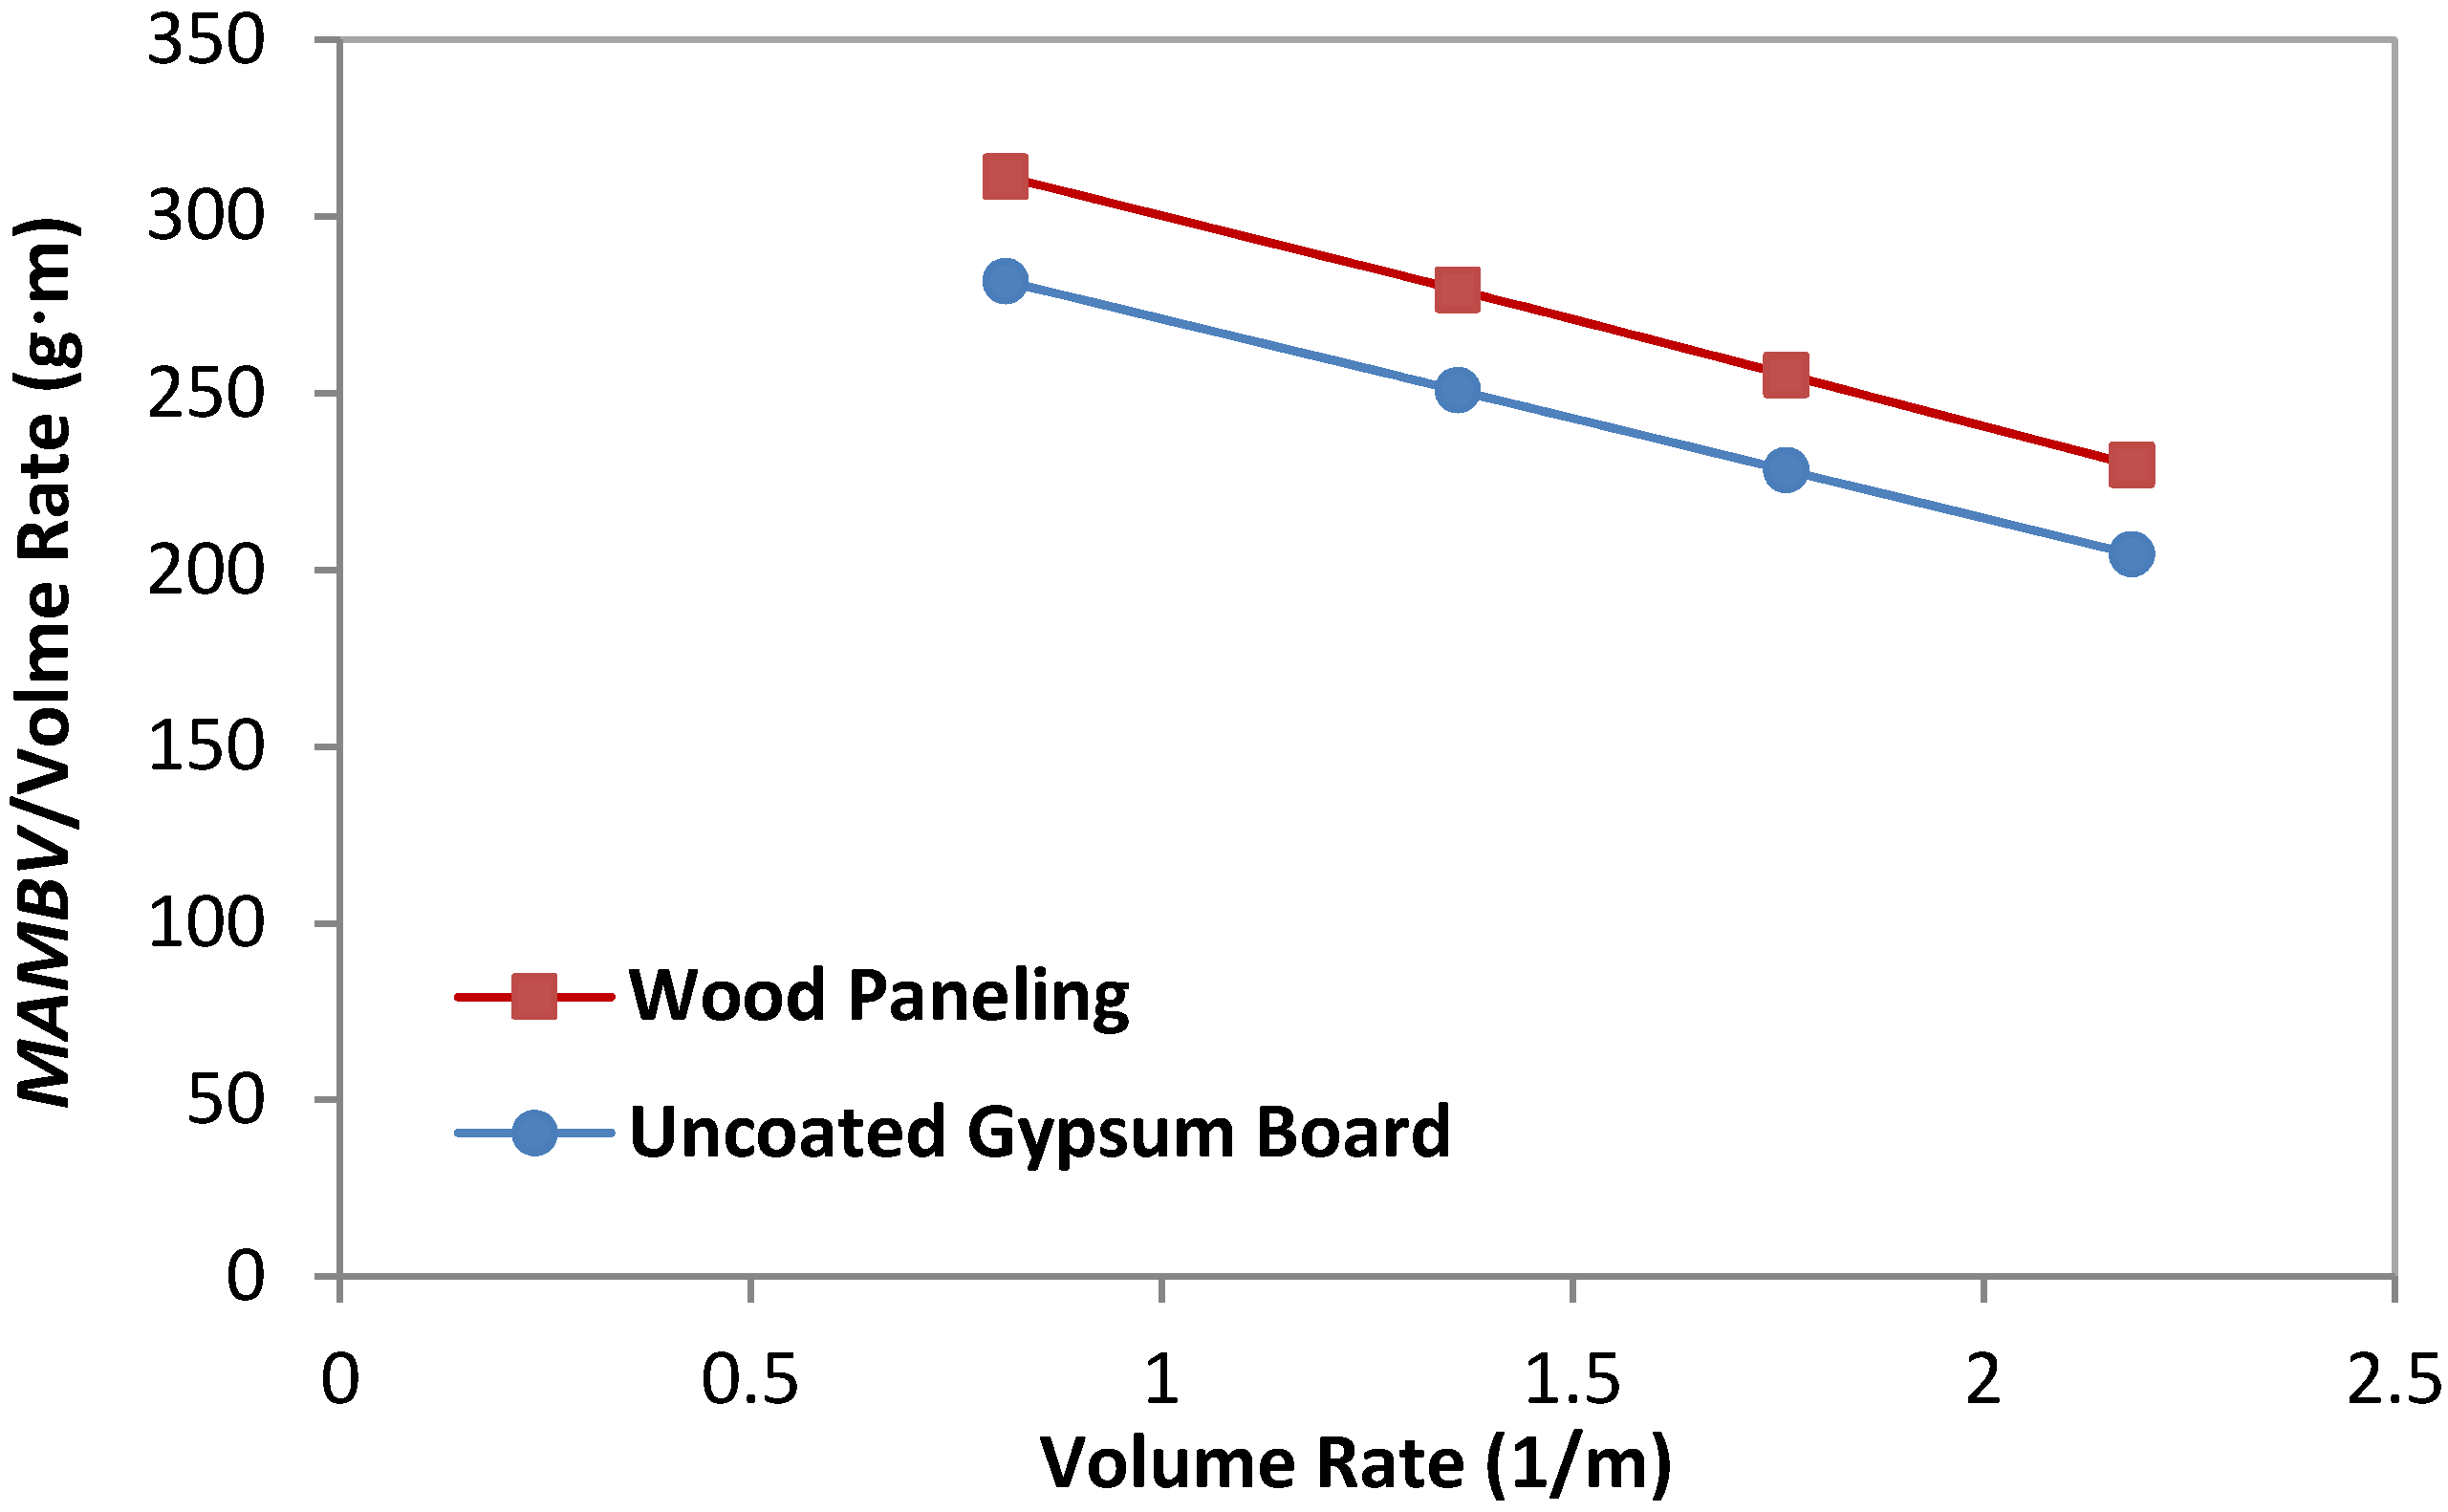
Figure 9, indicate that the larger the area of hygroscopic surface materials exposed to the indoor environment (the higher volume rate), the higher the moisture absorption observed (the higher MAMBV). However, the increase of the moisture buffering effect is not proportional to the increase of the volume rate. The ratio, MAMBV/volume rate, is therefore calculated and presented in
Figure 10. This ratio, MAMBV/volume rate, represents the contribution of per unit surface area to the moisture buffering potential for the specific volume of room air. With the increase of the volume of hygroscopic materials, the indoor RH amplitude reduces therefore the moisture buffering capacity per unit area reduces.
Figure 8 showed that the MAMBV/volume rate, equivalent to MAMBV/m
2 decreases with the increase of volume rate.
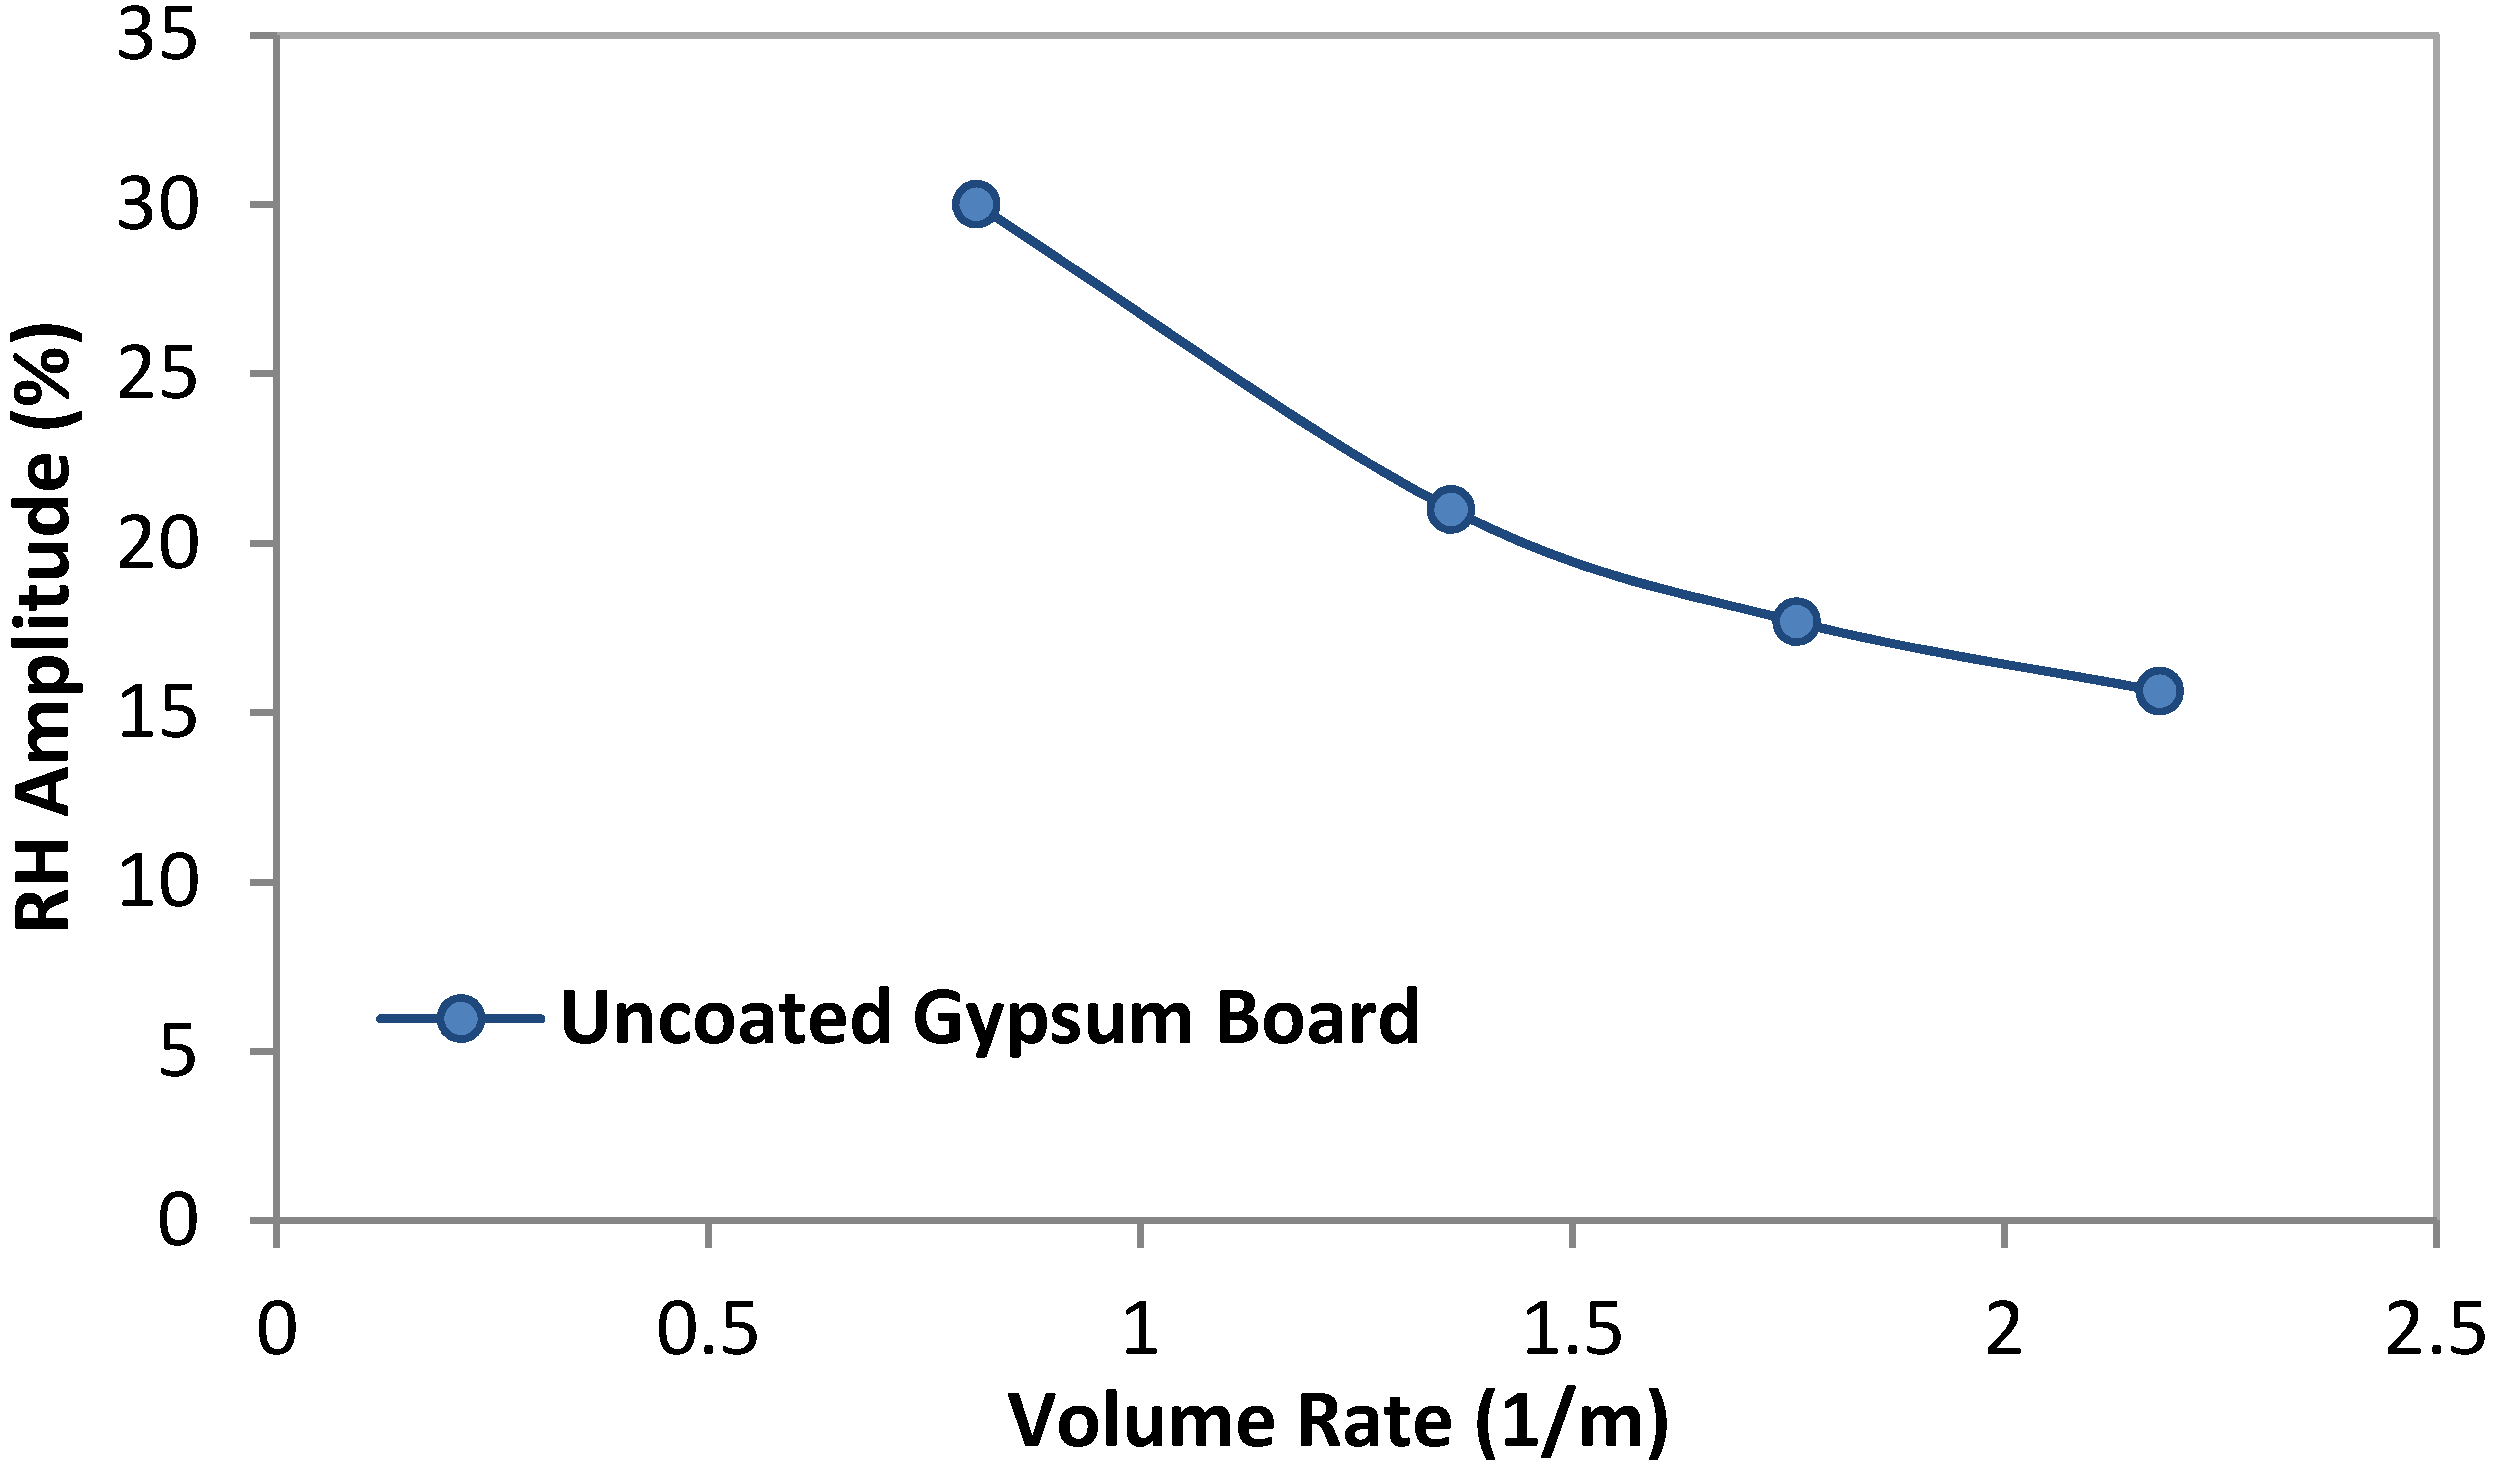
Figure 11 shows the relation between the volume rates and the relative humidity amplitude.
Figure 9.
Maximum accumulated moisture buffering value as a function of volume rates for gypsum board and wood paneling under different volume rates.
Figure 9.
Maximum accumulated moisture buffering value as a function of volume rates for gypsum board and wood paneling under different volume rates.
Figure 10.
Relation between the volume rate and the MAMBV/volume rate for both wood paneling and uncoated gypsum board for cases 1, 11, 45–50.
Figure 10.
Relation between the volume rate and the MAMBV/volume rate for both wood paneling and uncoated gypsum board for cases 1, 11, 45–50.
Figure 11.
Relation between volume rate and room relative humidity amplitude for the uncoated gypsum board under supply air humidity at 4.7 g/kg (cases 1, 45, 47, and 49).
Figure 11.
Relation between volume rate and room relative humidity amplitude for the uncoated gypsum board under supply air humidity at 4.7 g/kg (cases 1, 45, 47, and 49).
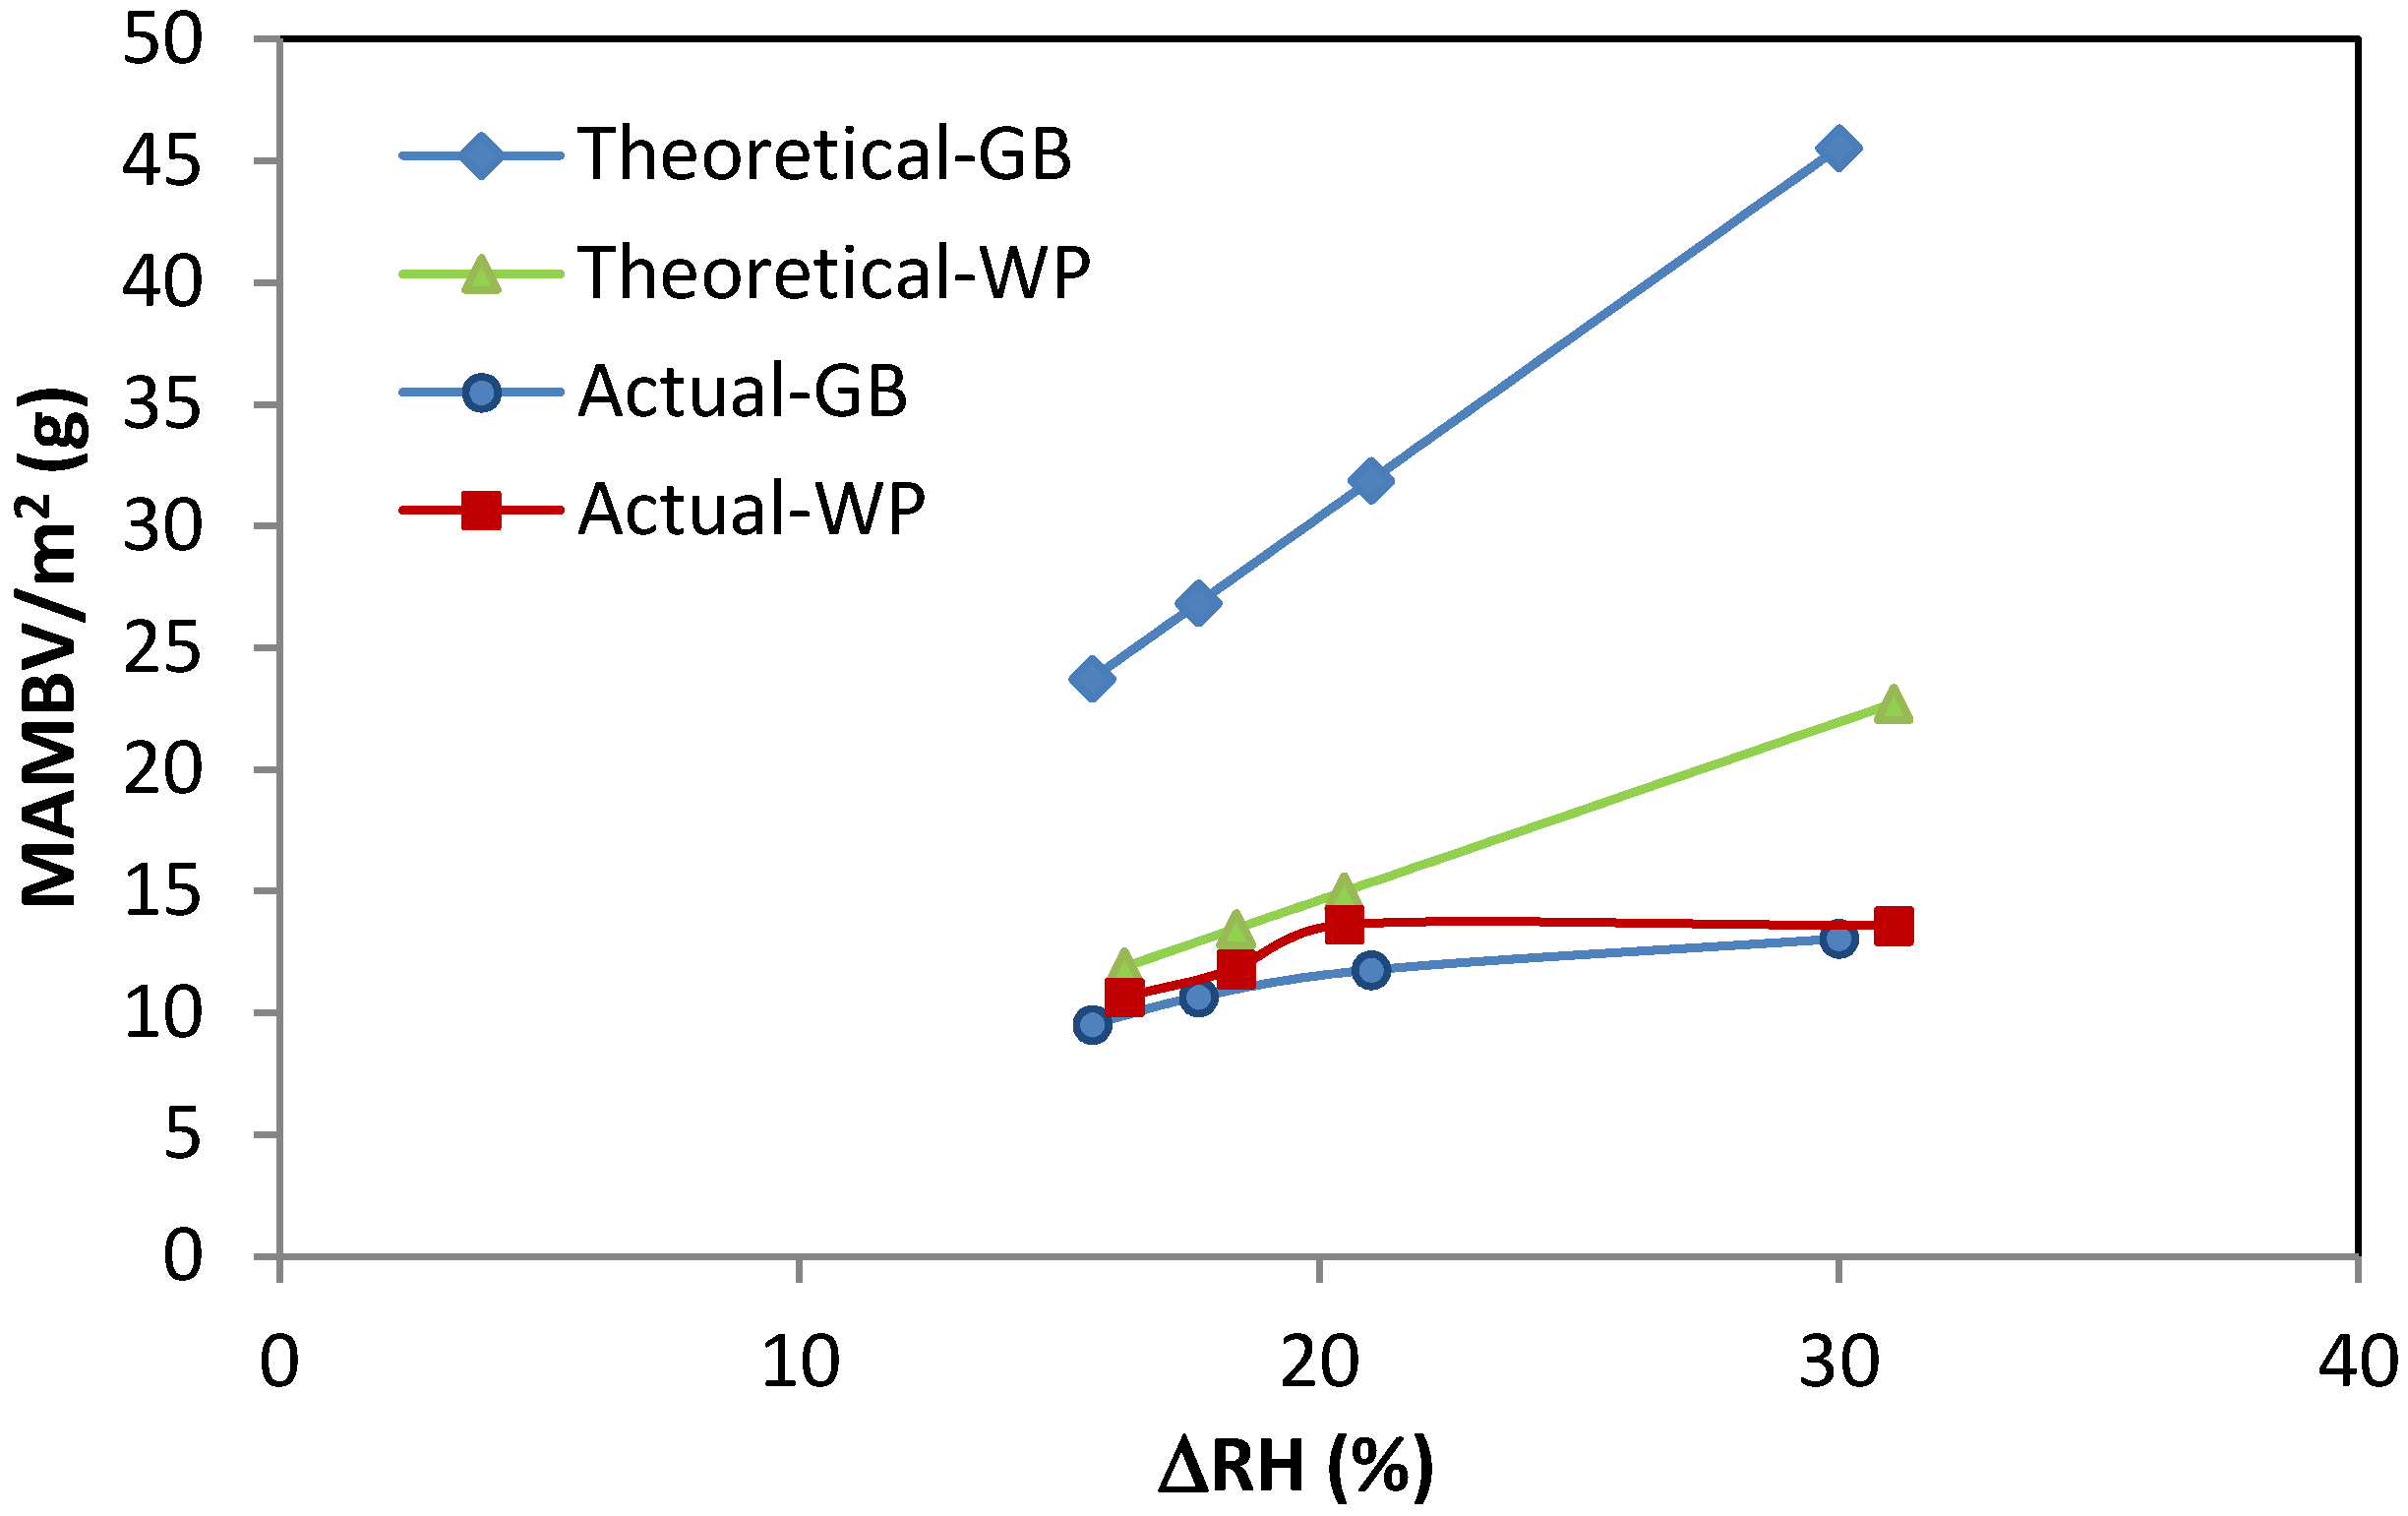
Figure 12 shows the MAMBV per unit surface area in relation to the relative humidity amplitude under both ideal and realistic conditions. Similar to the cases with varying ventilation rates, with the increase of volume rates, the RH amplitude decreases, therefore, the MAMBV/m
2 decreases although the total amount of moisture buffered MAMBV increases with the increase of volume rates. Theoretically, the MAMBV/m
2 of uncoated GB is greater than that of the wood paneling for the same volume rates, however under the realistic conditions the difference between these two materials are similar.
Figure 12.
Relation between the MAMBV/m2 and the RH amplitude for both uncoated gypsum board and the wood paneling under ideal and realistic conditions.
Figure 12.
Relation between the MAMBV/m2 and the RH amplitude for both uncoated gypsum board and the wood paneling under ideal and realistic conditions.
3.5. Impact of Outdoor Weather Conditions on Moisture Buffering Potential
Two different outdoor conditions were used in the experimental investigation. The tests for the cases using wood paneling were conducted under simulated outdoor conditions of −5 °C and 70% RH, while tests using uncoated gypsum board were conducted under −10 °C and 45% RH.
To study the impact of outdoor environment on the moisture buffering process, cases 37 and 38, simulated under summer conditions, are compared to cases 1 and 11 (simulated under winter outdoor conditions), respectively. The typical summer conditions of Montreal, 20 ºC and 70% RH [
21], were applied in cases 35 and 36. Other conditions set in simulations including supply air conditions, ventilation and air leakage rate, and moisture generation protocols are the same as those used in the experiments.
Table 5 shows that the MAMBV under summer conditions (cases 35 and 36) is almost the same as those tested for the winter conditions (cases 1 and 11). This similarity is attributed to the fact that moisture buffering involves only a very thin inner layer of hygroscopic materials [
22,
23], within which the moisture condition is less dependent on the outdoor conditions in well-insulated walls. It should be noted that only the impact of the steady-state outdoor conditions was considered.
Table 5.
Comparison of MAMBV under winter and summer outdoor conditions.
Table 5.
Comparison of MAMBV under winter and summer outdoor conditions.
| Case No. | Case 1 | Case 35 | Case 11 | Case 36 |
|---|
| Outdoor condition | Winter | Summer | Winter | Summer |
| MAMBV (g) | 217 | 226 | 245 | 247 |
4. Conclusions
The moisture buffering effect of hygroscopic materials in a full-scale setting is influenced by material properties, moisture generation rate and profile, operation of ventilation systems, i.e., supply air humidity ratio and ventilation rates. Theoretically, the moisture buffering capacity of hygroscopic materials is proportional to the material’s effusivity, period of moisture load, the relative humidity amplitude, and surface area of hygroscopic materials. Under realistic conditions though, the actual moisture buffering capacity is determined by the material’s thickness, boundary conditions, moisture load profiles, etc.
The impacts of six ventilation rates, four humidity levels of supply air, five different interior surfacing/finishing materials, four levels of volume rates, and two steady-state outdoor conditions on the moisture buffering potential of a typical room are investigated. This investigation is carried out by running 48 simulations cases using the BSim tool. The BSim was validated first by comparing 18 of these runs with the data obtained from 18 cases tested in a large-scale experimental investigation. The percentage differences between the experimental and simulation results for the 18 cases were within 3% for the moisture generation periods and within 7% for the non-moisture generation periods.
Simulation results showed that:
With the increase of ventilation rate, the indoor relative humidity amplitude decreases and the moisture buffering effect is reduced. No significant moisture buffering effect can be found when the ventilation rate is over 3 ACH. The reduction of the moisture buffering effect is much more sensitive to the increase of ventilation rate when the ventilation rate is lower than 1 ACH;
Supply air conditions partly determine the level of indoor humidity. A higher humidity level in the ventilation air increases the indoor humidity level, consequently enhancing the moisture buffering effect;
The moisture buffering potential is influenced by material properties including moisture capacity and vapor permeability. Under ideal conditions when the hygroscopic material has an infinite thickness, the moisture buffering capacity of hygroscopic material is proportional to its effusivity. However, under realistic conditions the actual moisture buffering capacity of hygroscopic materials is influenced by its actual thickness and the loading profiles. Materials with high moisture capacity such as OSB show a relatively high moisture buffering potential under long period moisture generation schedule. However, materials with higher vapor permeability, such as GB and ACC, have a greater moisture buffering potential under short-period (2 h) moisture generation protocol. Materials, like TBP, which has both high vapor permeability and high moisture capacity, have better moisture buffering potential under both short-period and long-period moisture generation protocol;
When the area of hygroscopic materials, involved in moisture balance of the indoor environment, increases, more moisture can be buffered. However, the increase in the moisture buffering effect is not proportional to the increase of the volume rate for hygroscopic materials. The increase of surface area of hygroscopic materials reduces the relative humidity amplitude, and therefore reduces the moisture buffering potential per unit of surface area.
Based on these findings, hygroscopic materials will be more effective for situations with low ventilation rate, higher humidity ratio of supply air, and higher moisture generation loads. Depending on the moisture load profiles, materials with higher vapor permeability such as uncoated gypsum board are more suitable for short periods while materials with high moisture capacity but low vapor permeability such as wood panels are more suitable for long periods of moisture generation. Materials with both high moisture capacity and high vapor permeability, thus high effusivity, will perform better under both short and long period of moisture profile. The application of hygroscopic materials reduces the variation of indoor relative humidity, thus reduces the risk of mold growth.
Author Contributions
Xiangjin Yang designed and carried out the experiment, collected and analyzed data, carried out the simulations with BSim, and prepared initial drafts of the paper.
Hua Ge co-supervised the thesis project, which includes the results of this paper, of the lead author. She oversaw and participated in the experiment design, experimental data analysis and theoretical analysis. By carrying out an exhaustive review and analysis of simulation results, she brought the paper to fruition.
Paul Fazio was the principal investigator who defined and secured funding from the National Science and Engineering Research (NSERC) of Canada for the overall project, as part of an international research program, Annex 41, carried out under the auspices of the International Energy Agency (IEA). He oversaw the experimental setup and delivered data sets to the international group of peers. He co-supervised the PhD thesis of the lead author, which comprises the results of this paper. He reviewed and revised the paper on several occasions.
Jiwu Rao contributed in the design, implementation and operation of experimental setup, instrumentation, and data acquisition and analysis of the presented research. He reviewed and revised the paper.


