Article

Avoiding the Possible Impact of Climate Change on the Built Environment: The Importance of the Building’s Energy Robustness

1
CIAE, School of Architecture, Catholic University of the North, Avenida Angamos 610, Antofagasta, Chile
2
AIE, Department of Architectonical Constructions, ETSAB, Poly-technical University of Catalonia, Avenida Diagonal 629, Barcelona, Spain
*
Author to whom correspondence should be addressed.
Buildings 2013, 3(1), 191-204; https://doi.org/10.3390/buildings3010191
Submission received: 28 November 2012 / Revised: 29 January 2013 / Accepted: 1 February 2013 / Published: 7 February 2013

Abstract

:
Following years of research and design in architecture under bio-climatic, sustainable and passive-energy concepts, today’s buildings are often well designed and constructed, responding to determined climate conditions and the user’s requirements for comfort and, in some cases, they are integrated into the urban environment. However, the lifetime of a building can be over 100 years and the climate is changing rapidly. This work investigates the impact of climate change future (2040 and 2070) on the energy consumption of residential buildings recently constructed, under three possible scenarios. The scenarios are created considering a low, medium or strong effect of global warming. Two types of buildings, with comparable consumption results of today, are investigated in three different cities around the world with a multi-zone type 56 of Trnsys simulation tool. At the end of the work, the concepts of energy robustness and global thermal effusivity of buildings are discussed as important strategies to reduce the possible impact of climate change on the built environment. The use of simulation tools to estimate the sensitivity of buildings is also analyzed, taking into consideration the recent goals of applying uncertainty and sensitivity analysis to building performance simulation science.

1. Introduction

After years of discussion, for the majority of scientists climate change is now a reality. To reduce global warming of the atmosphere is one of the most important challenges of the new century. For this reason, the Intergovernmental Panel on Climatic Change (IPCC) was founded in 1989.
One of the goals of this important institution was the creation of possible future scenarios for the world. Scenarios can be used to predict the climatic situation, in order to evaluate the viability and reliability of actions to take now, with the future in mind.
The construction sector produces almost the 30% of CO2 emissions to the atmosphere. At least 60% of these emissions correspond to the use of the buildings during their lifetime [1], even in mild climates (emissions from use represent more than 80% in extreme climates). For this reason, the built environment is an important actor in reducing global warming. At the same time, global warming influences the functioning of the building, especially reducing winter heating demand and increasing summer cooling demand. For these reasons, over the past 30 years various scientists have produced a number of models to simulate energy performance of buildings. In this way, building simulation science started to develop (see for example the works of Clarke [2], Waltz [3], Hensen et al. [4] and Crawley et al. [5]). Performance simulators perform calculations based on weather data, which have been obtained directly by monitoring over a number of years, or have been generated on the basis of this monitoring [6]. A typical format of data is the TMY (Typical Meteorological Year), used for example by the Trnsys software. Simulation data are hourly data, while IPCC future scenario generated data are daily averages. To avoid this problem, Jentsch et al. [7] developed a simple tool to transform daily IPCC data into hourly TMY data. This tool has been used in predictive and uncertainty studies, as in the work of De Wilde and Tian [8]. Sensitivity to climatic change seems to be significant for buildings, especially in long-term predictions. On the other hand, it is difficult to simulate the future, because of the presence of epistemic uncertainties, such as uncertainty related to the probable improvement of knowledge in the future. However, a number of hypotheses seem to be reasonable, and the simulation process is possible and credible.
Architects and energy consultants have different approaches to reducing building CO2 emissions. A common method is to directly reduce the estimated energy demand by selection of materials and building design. Another is the implementation of renewable energy systems, such as photovoltaic, solar thermal, heat recovery, etc. Within these two groups of actions, there are also differences between strategies: orientation, thermal mass, insulation, window design are options of the first group, whilst energy source selection and systems efficiency are options of the second. Focusing on energy demand (although the same idea can be applied to system management), it should be noted that selection of different options can lead to equivalent predicted performance in the present, but not to the same real performance of the building in the future, due to changes in the climate conditions.
This paper investigates the future performance of two building typologies, which use different construction strategies to address the same situation. The typologies are referred to as “robust” and “sensitive” respectively. It is important to understand that the “robust” concept is an energy concept; this means, for example, that in many cases “robust” signifies “flexible”, in the same way as the original expression “robust design”, used first by the Japanese engineer Genichi Taguchi in the 1980s [9,10,11].

2. Methodology

We define as “robust” a building that is not negatively affected by changes in operation parameters, a building that is adaptable to different situations and scenarios. For instance, with regards to building design, a robust building can be a building with high values of thermal mass, well distributed. This mass is responsible for absorbing excess of incoming radiation and preserving energy performance, for example. A sensitive building, on the other hand, refers to a building whose supposed performance is extremely dependent on precise input variables. Incoming radiation and air movement (natural ventilation systems) are quite sensitive strategies in these terms. Changes in wind directions or other macro and micro climatic factors can cause dispersion in estimated energy prediction. It appears important to predict an effective (probable) performance to classify the success of a building design. Energy robustness also seems to be an important character of a sustainable architecture. A quantification of robustness can be obtained from an estimation of global thermal effusivity or sensitivity vectors. Thermal effusivity is a well-known parameter of materials; in this paper, we propose the extension of the definition to the whole building, including the concepts of storage, transmission and ventilation losses. Sensitivity vectors are an estimation of performance variability (simulated or predicted) depending on uncertainty of input variables. We use the term “vectors” to define a function of n variables, each with uncertainty. Both methodologies are described and exemplified for example in the work of Palme et al. [12,13], Palme [14], Zeiler et al. [15] and Harputlugil et al. [16]. Thermal effusivity estimates inertia and transmission properties depending on form, orientation and distribution of the analyzed building. The sensitivity vector is the result of a simulation set and sensitivity analysis by a mathematical method (Monte Carlo, Latin-cube, etc.)

2.1. Future IPCC Climate Scenarios Considered

In this paper, IPCC data are used to simulate future energy performance of two types of buildings. TMY data are obtained by the Climatic Change Weather Files Generator developed by Jentsch. Selected scenarios to simulate the future are the A1FI, A2 and B2. IPCC scenarios are described in the IPCC report [17]. In the paper, these scenarios are identified respectively as high, medium and low emissions scenarios. The characteristics of three scenarios are:
The A1FI scenario describes a future world of very rapid economic growth, population peak in the middle of the century, convergence among regions, reduction in the regional differences in per capita income. Research centers on fossil fuel use and production. It is a fossil fuel-intensive and very high emissions scenario.
The A2 scenario describes a heterogeneous world, with slow population increase, differences among regions and social classes. The result is a medium-high emissions scenario.
The B2 scenario describes a world in which attention is focused on local solutions to economic, social and environmental sustainability. Population is continuously increasing at a lower rate than A2 and technology shifts towards sustainable solutions, with important differences among regions. It is a low emissions scenario.

2.2. Climate Description of Cities

In order to obtain suitable information for different places around the world, simulations are carried out in three different climatic emplacements: the cities of Rome, Osaka and Caracas. Climates can be classified using for example the Strahler classification method, cited by Neila [18].
Rome (42° N latitude, 12° E longitude, altitude 40 m) has a typical Mediterranean climate, with mild winters, warm and humid summers, long autumns and springs. Seasonal temperature oscillation is reduced and the day-night fluctuation is not very high. Radiation levels are medium-high, urban density increases the humidity retention effect, and wind is sometimes present.
Osaka (34° N latitude, 135° E longitude, altitude 10 m) has a climate classified by Stralher as continental, although the city is very close to the sea. Winters are cold and summers are warm. Day-night fluctuations are higher than in the Mediterranean climate. Radiation levels are high to very high, urban density has a strong effect on the comfort sensation.
Caracas (10° N latitude, 66° O longitude, altitude 920 m) is classified as a tropical hot humid climate. There are two seasons, the wet season and the dry season. Temperature is high with medium-low fluctuations. Radiation levels are very high. The altitude mitigates the hot sensation of the climate.

2.3. Building Model Description

Building typologies referred to as “robust” and “sensitive” vary slightly depending on the climatic emplacement. However, the general definition of “robust” and “sensitive” construction strategies leads to two general aspects of the samples:
Robust buildings have high values of thermal mass, while sensitive buildings have medium or low values.
Robust buildings have up to 10% of glass on the façades, while sensitive buildings have up to 50%.
A typical wall section for a “robust” building is: external mortar (5 mm), insulation (20–70 mm depending on the climate), granite or concrete (600 mm) and internal chipboard (5 mm). A typical wall section for a “sensitive building” is: external mortar (5 mm), insulation (20–70 mm depending on the climate), bricks (150 mm) and internal chipboard (5 mm). Table 1 summarizes these values.
Table 1. Robust and sensitive building typology description for the Northern Hemisphere.
Building typology Wall thickness (mm)Glaze ratio on north façade (%) Glaze ratio on south façade (%) Glaze ratio on east façade (%)Glaze ratio on west façade (%)
Robust630–68010101010
Sensitive180–2300503030
The floor section in both cases is (from the top): linoleum (10 mm), cement mortar (50 mm), insulation (0–50 mm depending on the climate) and concrete (200 mm). The roof section in both cases (from the top) is ceramic tiles (20 mm), cement mortar (10 mm), air gap (10 mm), insulation (40–80 mm depending on climate) and concrete (100 mm). Theinternal wall section in both cases is: plasterboard (10 mm), air gap (80 mm) and plasterboard (10 mm).
Robust buildings have 10% of transparent surface on all the façades. Sensitive buildings have 30% on the east and west façades, 50% on the south and 0% on the north façade (in the Northern Hemisphere). External air renewal rate, internal gains, solar protection factor due to internal blinds and occupancy schedule of the sample buildings in the three climates are described in Table 2. U-values of walls, floor and roof are described in Table 3.
The test building model is a construction of 40 × 30 × 9 m, N-S oriented. The simulation calculates energy demand in free running conditions, without any mechanical system, in order to obtain information for design impact on thermal performance.
Table 2. Internal gains, external air renewal rate, occupancy and solar protection values.
CityBuildingInternal gains (W/m2)Air renewal coefficient (1/h)Occupancy and HVAC (schedule)Solar protection (internal blinds)
RomeSensitive550.68.00–18.000.0
OsakaSensitive550.48.00–18.000.0
CaracasSensitive551.28.00–18.000.8
RomeRobust550.68.00–18.000.0
OsakaRobust550.48.00–18.000.0
CaracasRobust551.28.00–18.000.8
Table 3. Transmittance values of external walls, internal walls, floor and roof.
CityBuildingU-value of external walls (W/mK)U-value of internal walls (W/mK)U-value of the floor (W/mk)U-value of the roof (W/mK)
RomeSensitive0.492.200.990.47
OsakaSensitive0.392.200.610.38
CaracasSensitive0.972.202.580.62
RomeRobust0.632.200.990.47
OsakaRobust0.542.200.610.38
CaracasRobust1.182.202.580.62

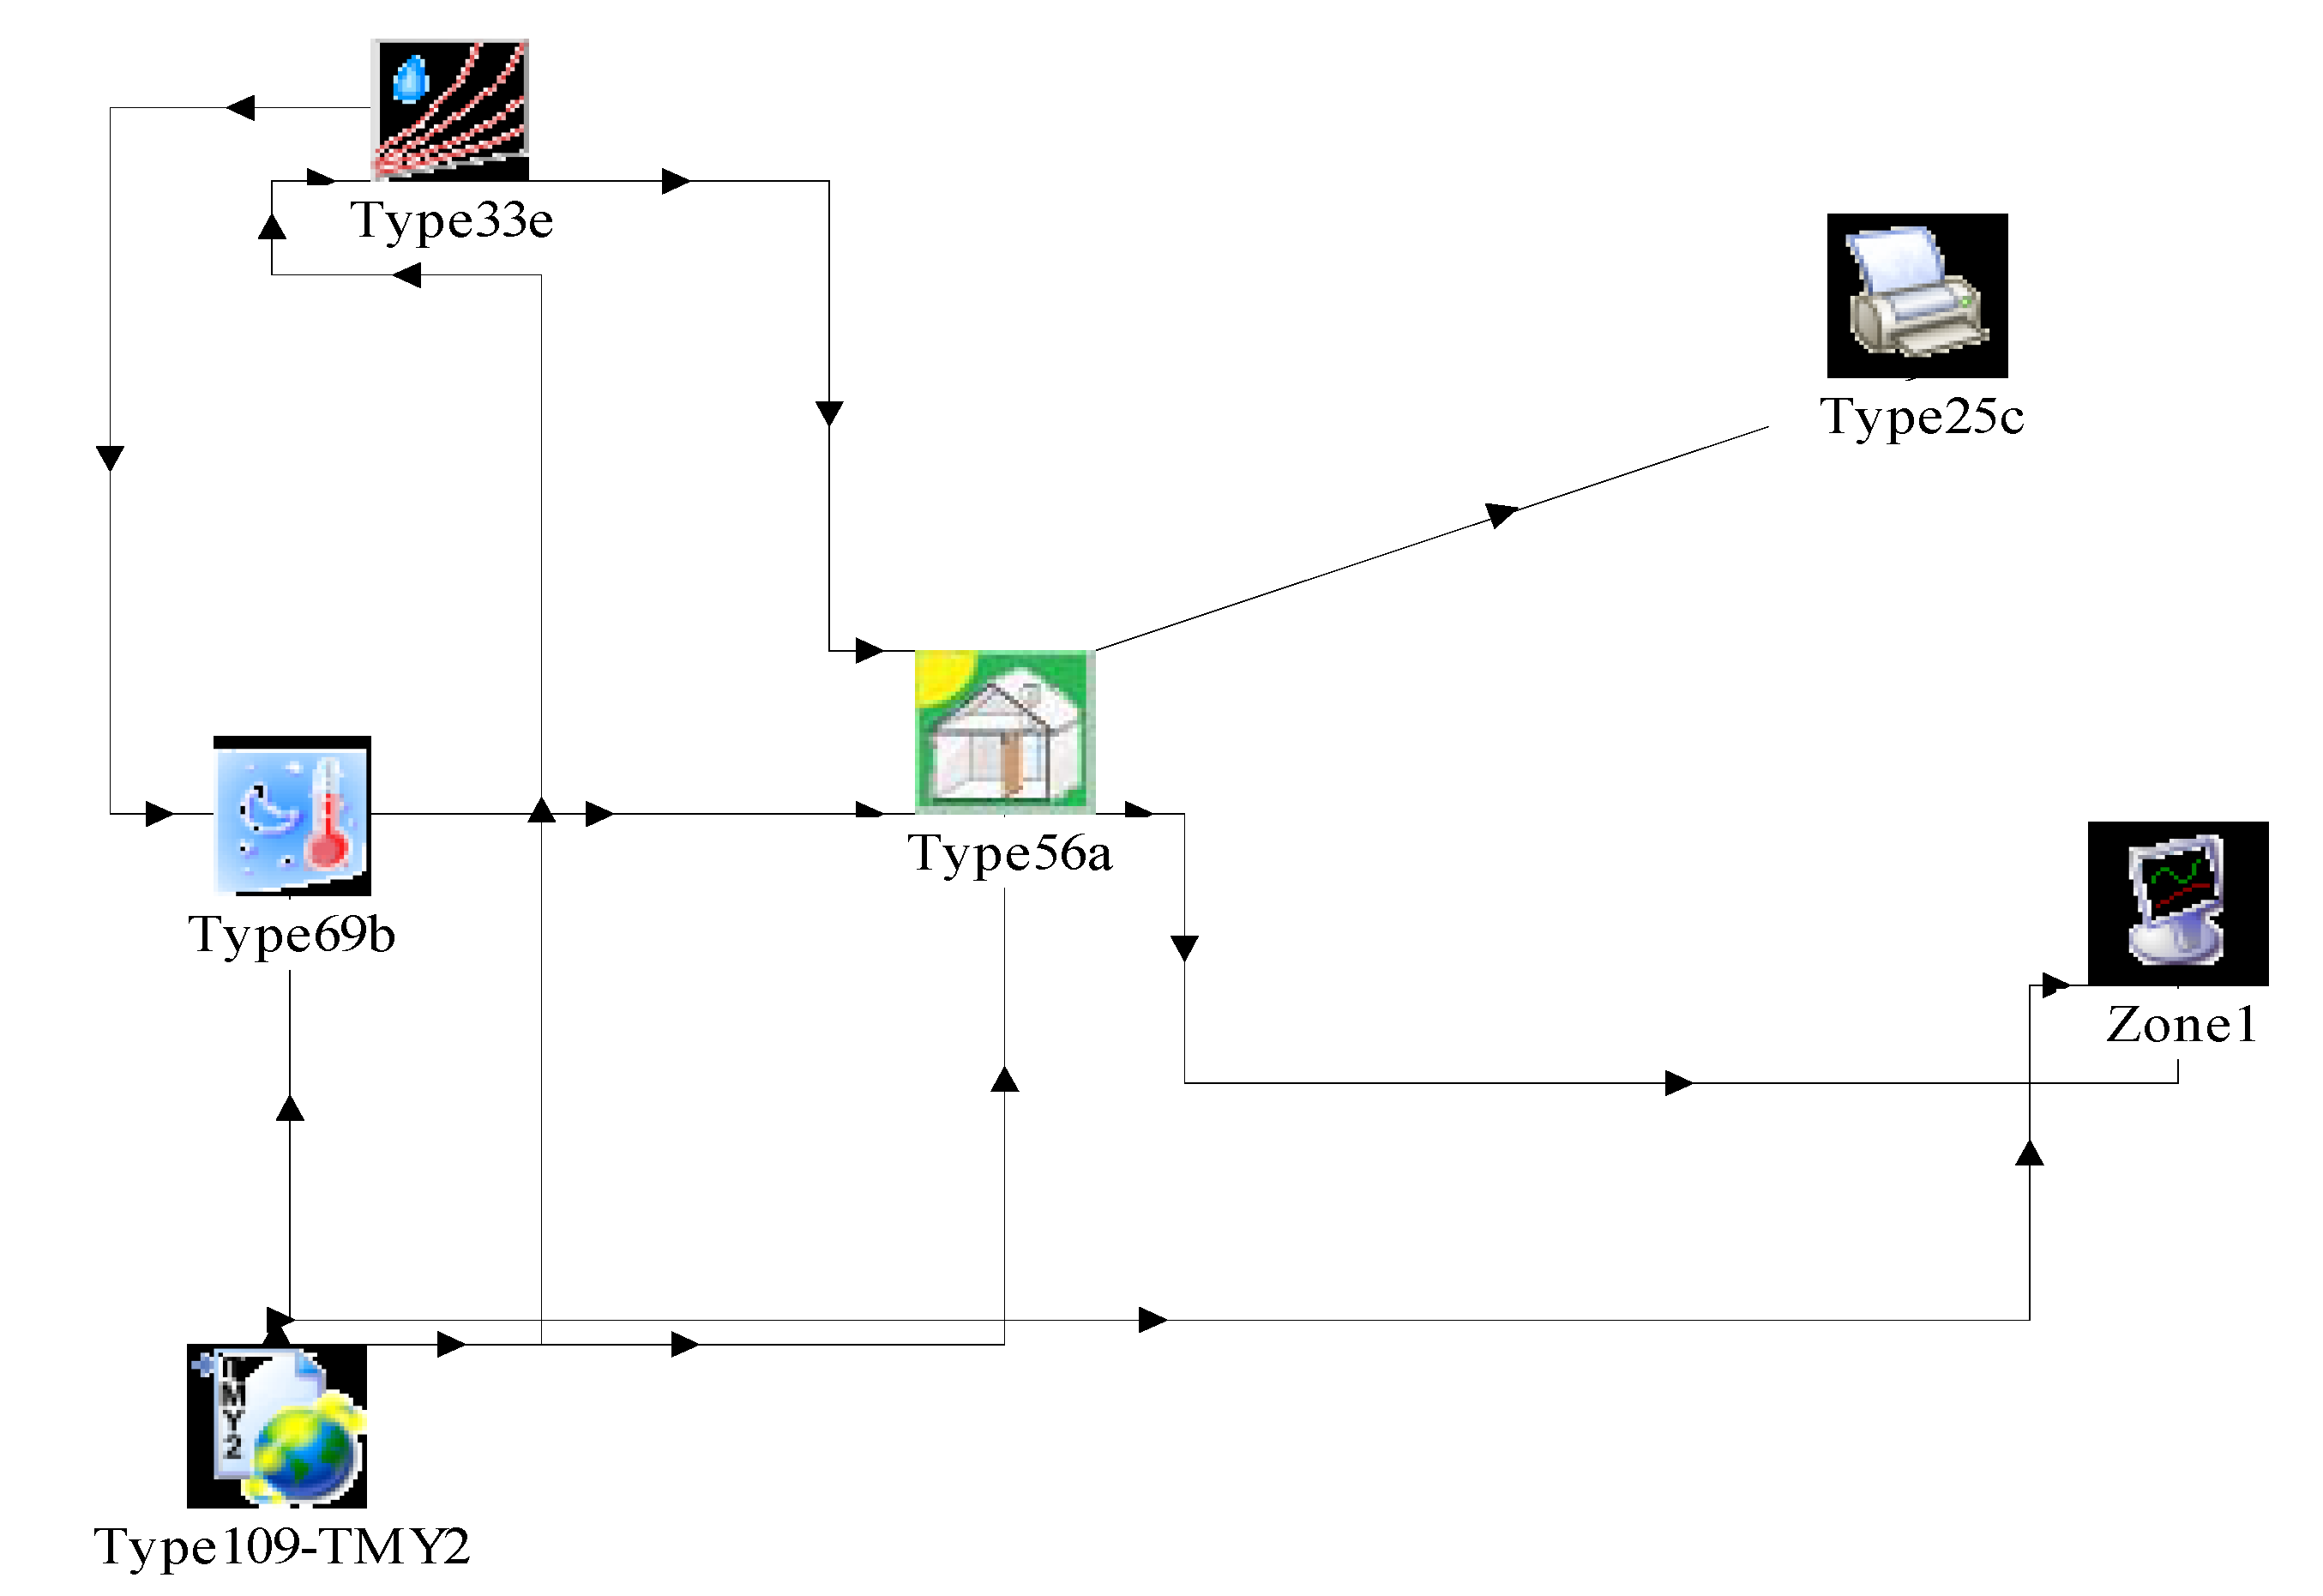
2.4. Simulation Management

Simulations are carried out using Types 56a (multizone building) with the Trnsys tool. Trnsys works as a modular tool, using different sections named “Types”. Type 56a is where building typologies (robust and sensitive) are described and all the parameters are inserted (walls, windows, schedules, gains, etc.) Climatic TMY files are read in Type 109, sky cloudiness is calculated by Type 69b and psychometric variables by Type 33e. Types are described in Trnsys tool [19] as follows:
Type 109: “This component serves the main purpose of reading weather data at regular time intervals from a data file, converting it to a desired system of units and processing the solar radiation data to obtain tilted surface radiation and angle of incidence for an arbitrary number of surfaces. In this mode, Type 109 reads a weather data file in the standard TMY2 format.”
Type 69: “This component determines an effective sky temperature, which is used to calculate the long-wave radiation exchange between an arbitrary external surface and the atmosphere. The effective sky temperature is always lower than the current ambient temperature. The black sky on a clear night for example, is assigned a low effective sky temperature to account for the additional radiative losses from a surface exposed to the sky. In this instance of Type69, the cloudiness of the sky is calculated based on user-provided dry bulb and dew point temperatures.”
Type 33: “This component takes as input the dry bulb temperature and relative humidity of moist air and is called the TRNSYS Psychrometrics routine, returning the following corresponding moist air properties: dry bulb temperature, dew point temperature, wet bulb temperature, relative humidity, absolute humidity ratio, and enthalpy.”
Figure 1 shows the model used to connect different types. This step is necessary to obtain the simulation parameters (radiation on the tilted surfaces defined in Type 109, ambient temperature, relative humidity and fictive sky temperature) to be used as inputs in the building model. Type 56 read as input ambient temperature and relative humidity in Type 33, fictive sky temperature in Type 69 and radiation on the tilted surfaces directly in Type 109. Fictive sky temperature is calculated by Type 69 reading radiation data in Type 109 and psychometric data in Type 33.
The Jentsch method to generate TMY future data uses “shift” and “stretch” modifications for temperature, “stretch” modification for wind speed and global radiation, “shift” for relative humidity and atmospheric pressure. This means that for future predictions, temperature will be higher and day-night oscillation cycle will also be incremented. This assessment is according to the IPCC’s general assumption that future climate will be more extreme in the most parts of the world.
Type 109 allows us to read external files as weather data, so 27 different scenarios were generated (three degrees of emissions—low, medium and high, three locations—Rome, Osaka and Caracas, and three climate projections—2010, 2040 and 2070). The simulations sets were then run. For more detailed information on the future climate generation model, see the tools manual published by UKCIP [20].
Figure 1. Trnsys 16 input-output model used in simulation. Links between types are used to generate and manage weather data inputs. Type 22 is a psychometric calculator and Type 69 is a sky temperature calculator.
Buildings 03 00191 g001

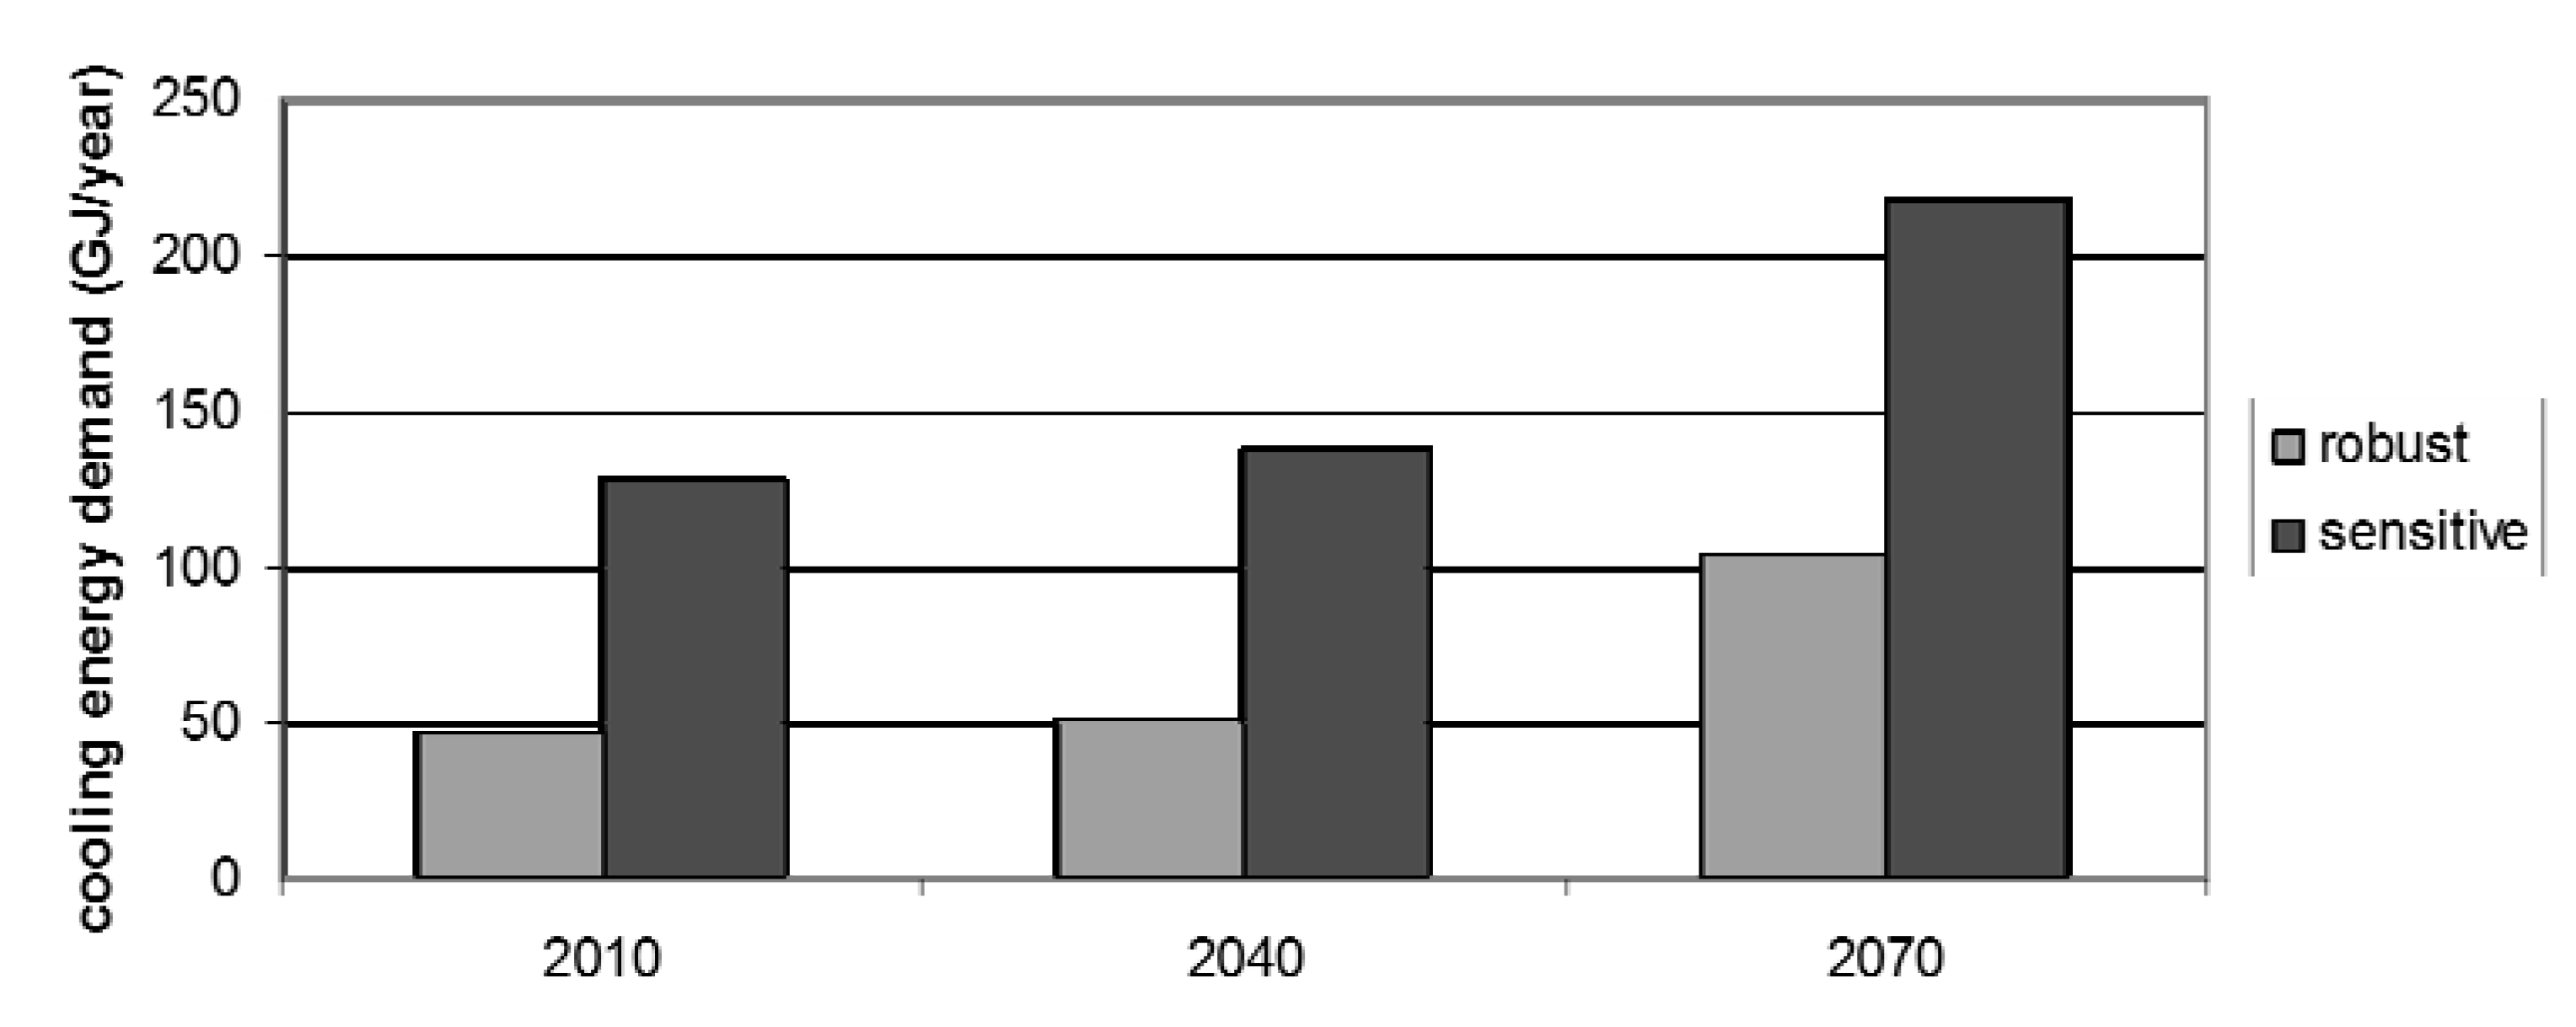
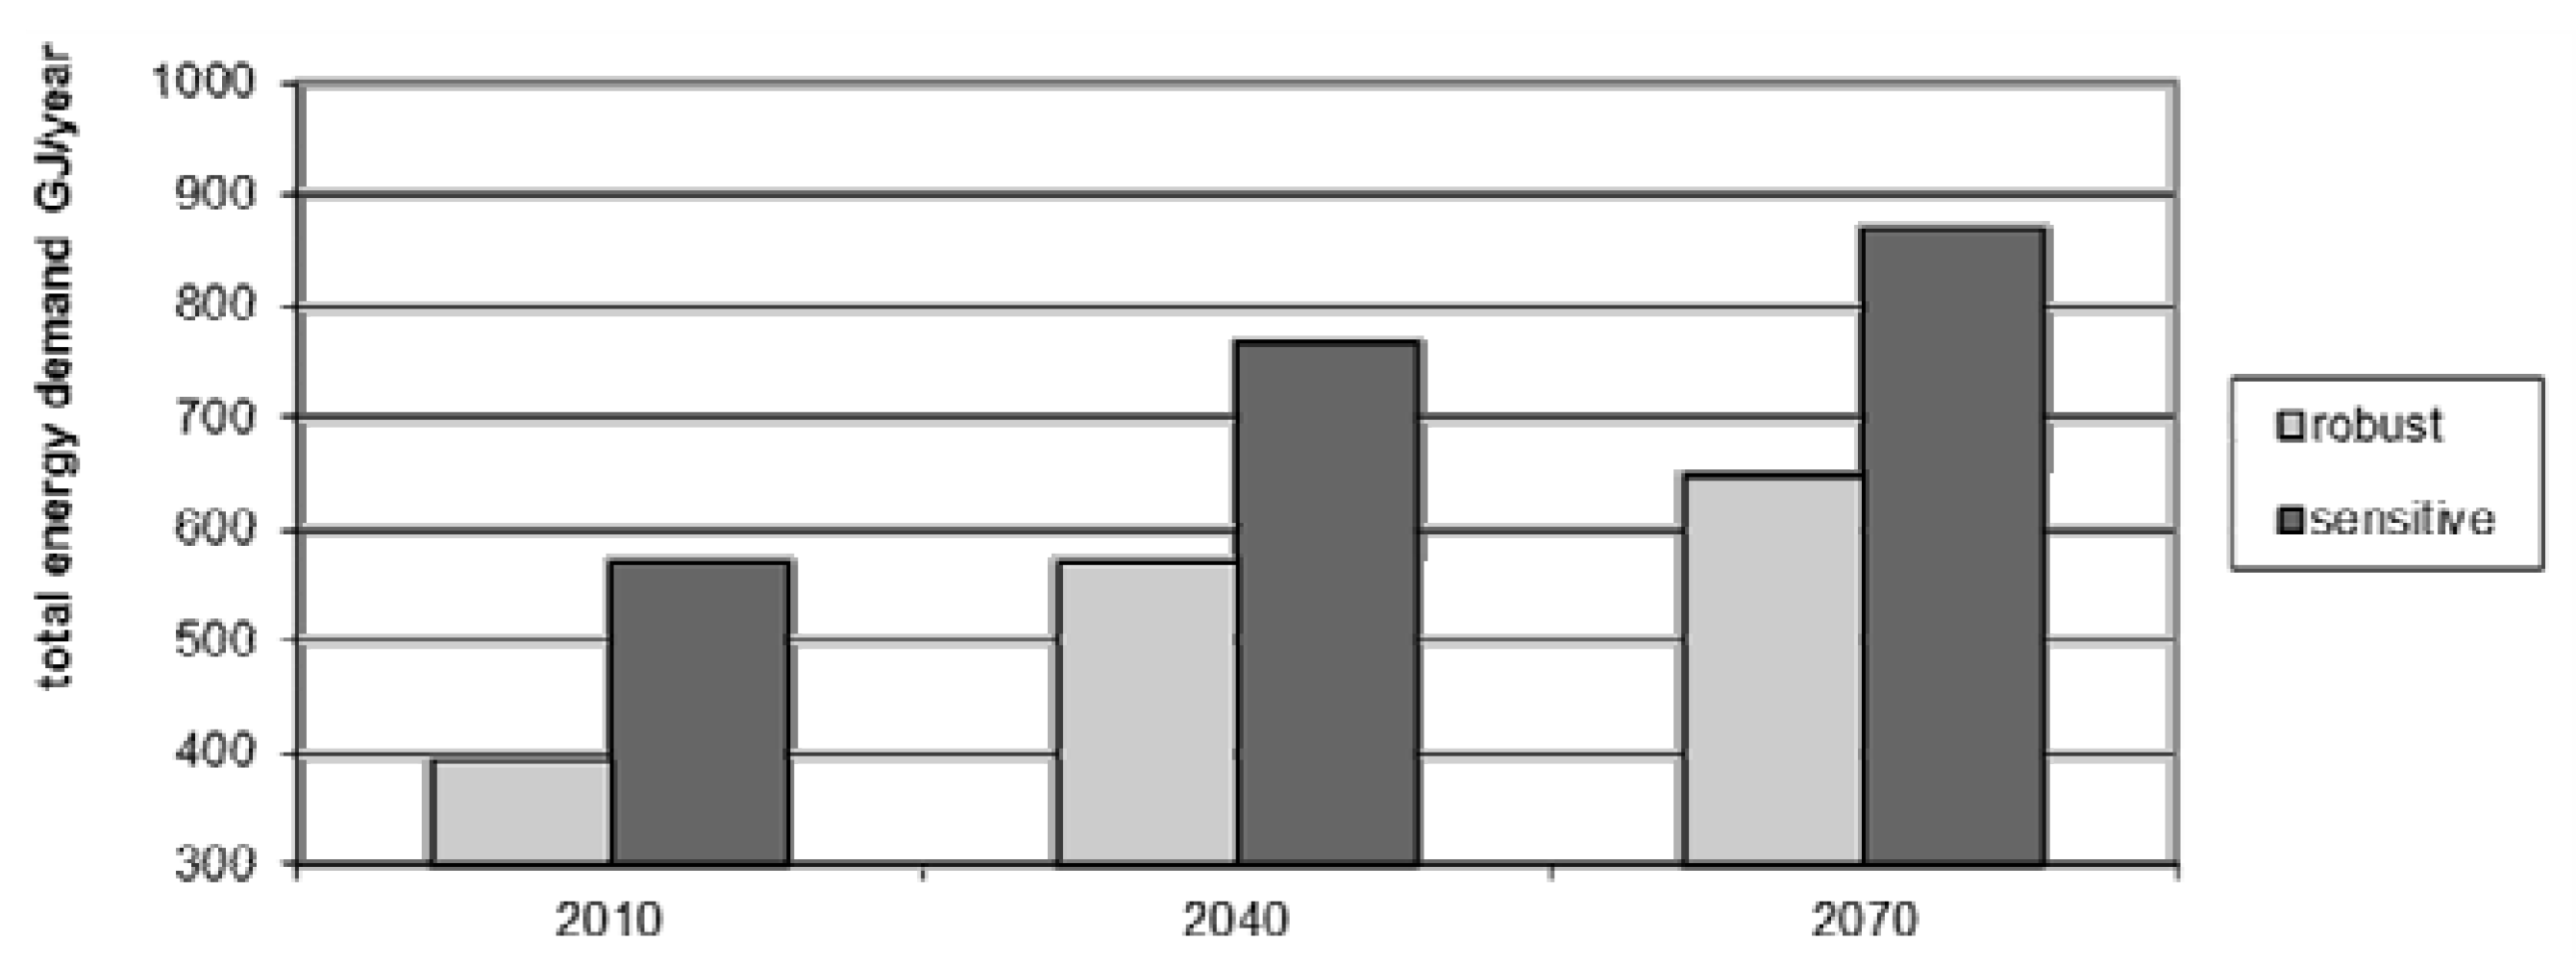
3. Results and Discussion

Results are searched by comparison among heating, cooling and total energy demand of buildings designed to sensitive and robust parameters in the nine climate situations generated using IPCC data for 2010, 2040 and 2070. Simulation parameters have been calibrated to obtain a total energy demand comparable to current data. Sensitive and robust buildings start with comparable global performance and simulation results indicate the possible impact of climate changes on the energy performance in the future.

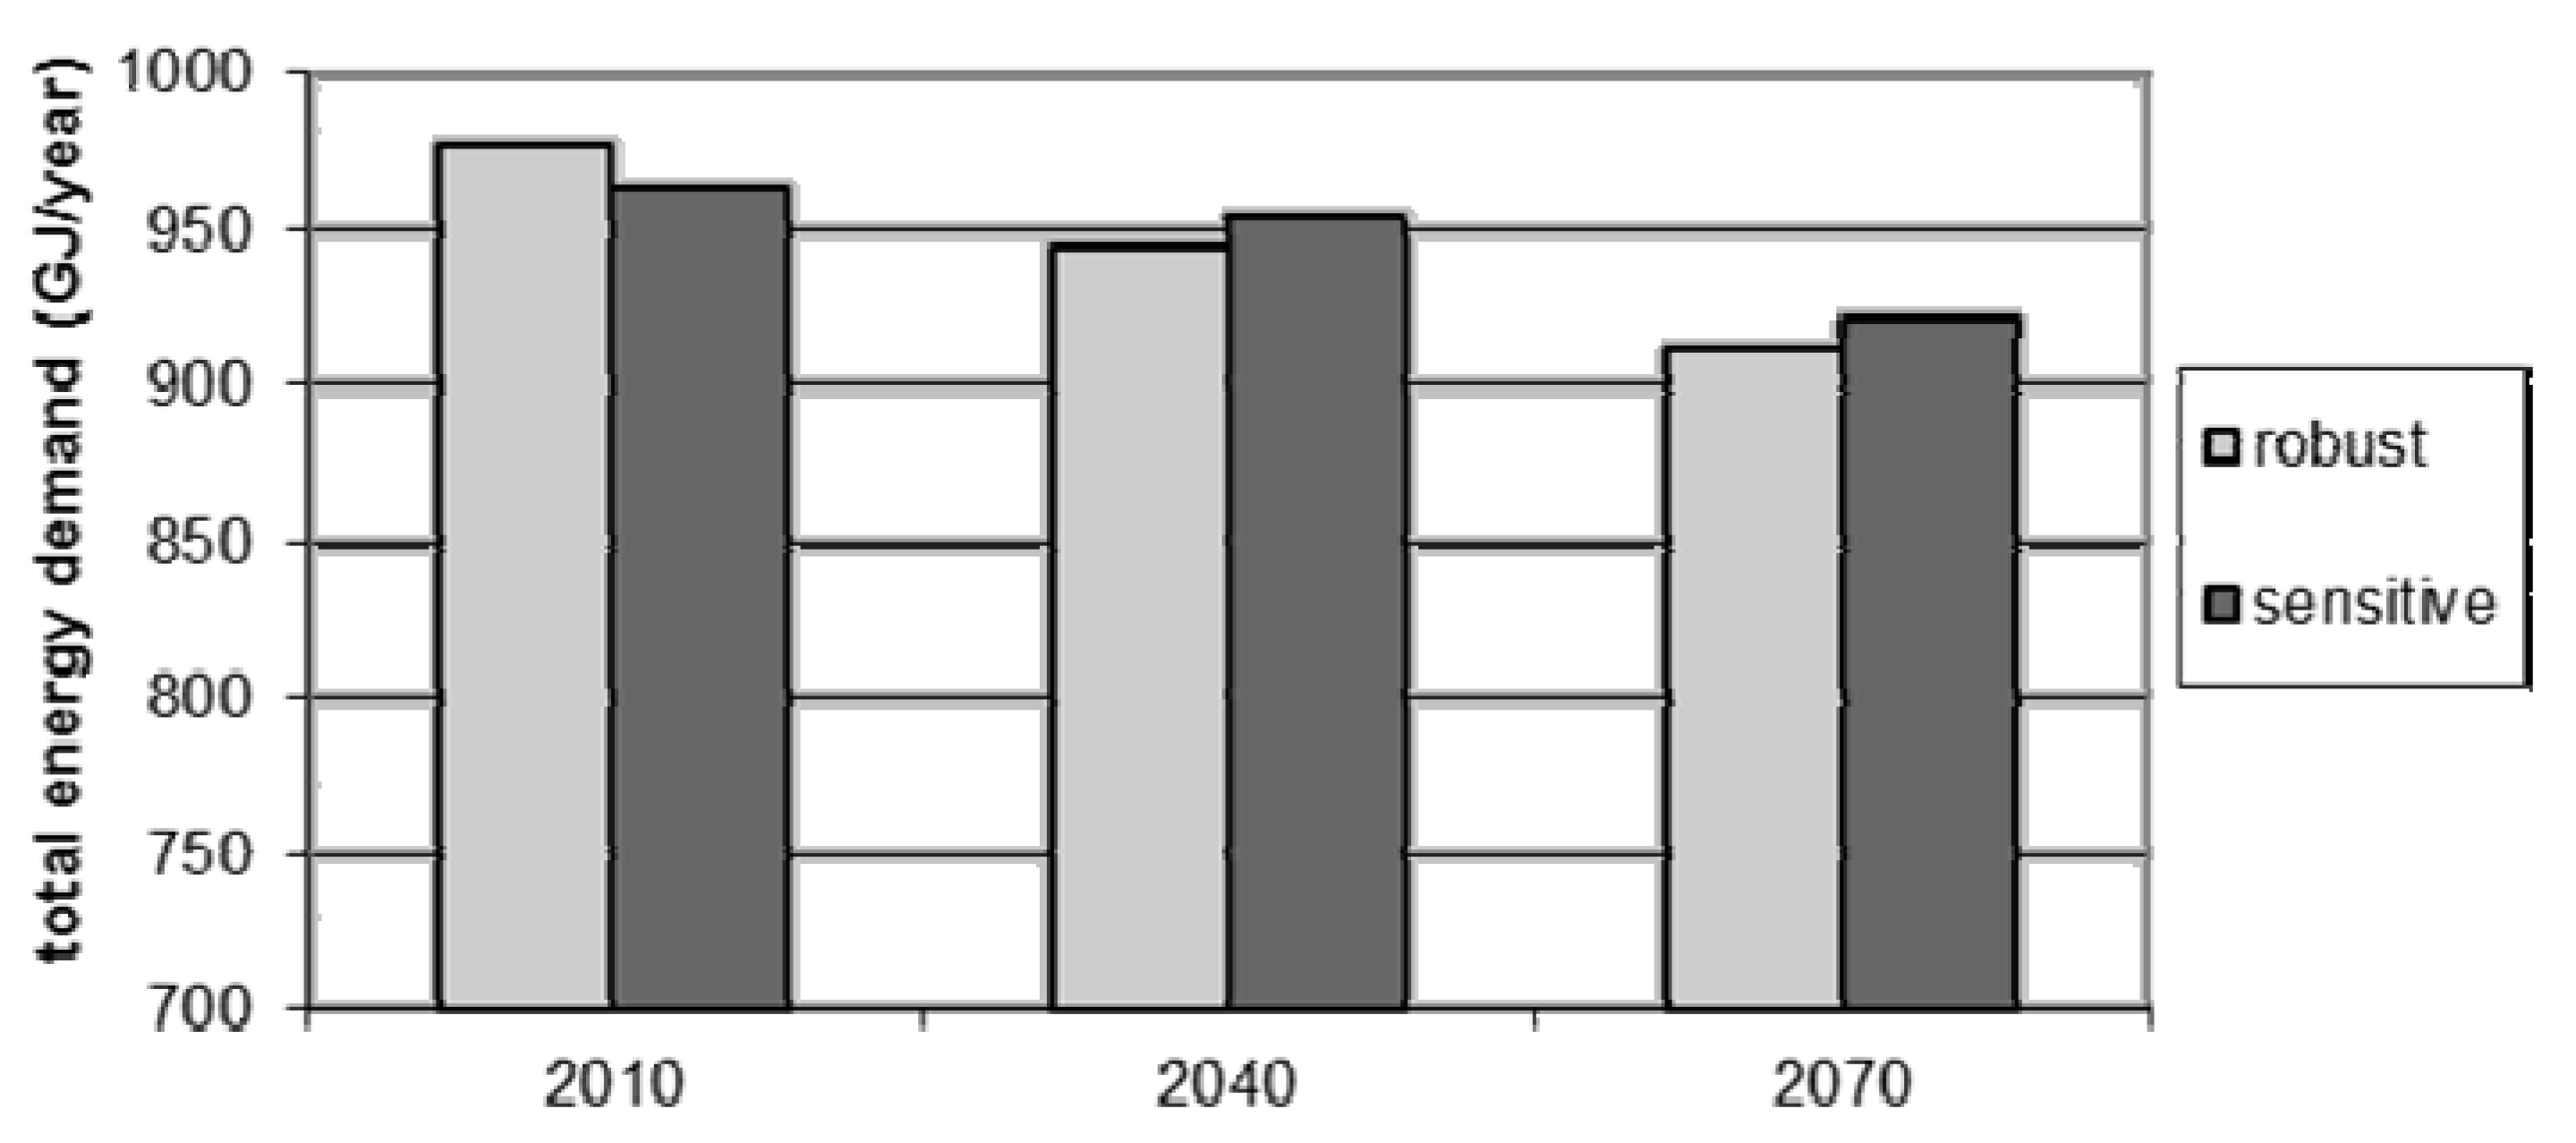
3.1. Rome Simulation, Medium Emission Scenario

Figure 2 shows the heating demand for both architectural solutions in Rome, considering a medium emissions scenario.
Figure 2. Heating energy demand in Rome for medium emissions scenario prevision—one building 40 × 30 × 9 m3.
Buildings 03 00191 g002
Heating energy demand decreases for both the construction typologies, as an effect of the increase in average temperatures. Figure 3 shows the cooling energy demand for the case of Rome, in the medium emissions scenario.
Figure 3. Cooling energy demand in Rome for medium emissions scenario prevision—one building 40 × 30 × 9 m3.
Buildings 03 00191 g003
As expected, cooling energy demand increases with time because of global warming. The use of a sensitive building type appears to raise cooling consumption more than a robust one. Figure 4 shows the total energy demand in the case of Rome, in the medium emissions scenario.
Figure 4. Total energy demand in Rome for medium emissions scenario prevision—one building 40 × 30 × 9 m3.
Buildings 03 00191 g004
The total energy demand of the robust building, which is higher than that of the sensitive building in 2010, decreases rapidly, and is lower in 2040 and in 2070. This effect depends on the combination of cooling increase and heating decrease for this climate and emissions scenario.
The shift effect, or change in the priority between heating and cooling provisions, has been investigated and discussed in some studies, especially in mild and continental climates, as for example in the research conducted by Orehounig et al. in 2011 [21].
Discussing the specific result of our simulation set, global energy demand will decrease in the future, but in the case of sensitive buildings the cooling increase will negatively affect the final result, while robust buildings resist the new climate situation better.

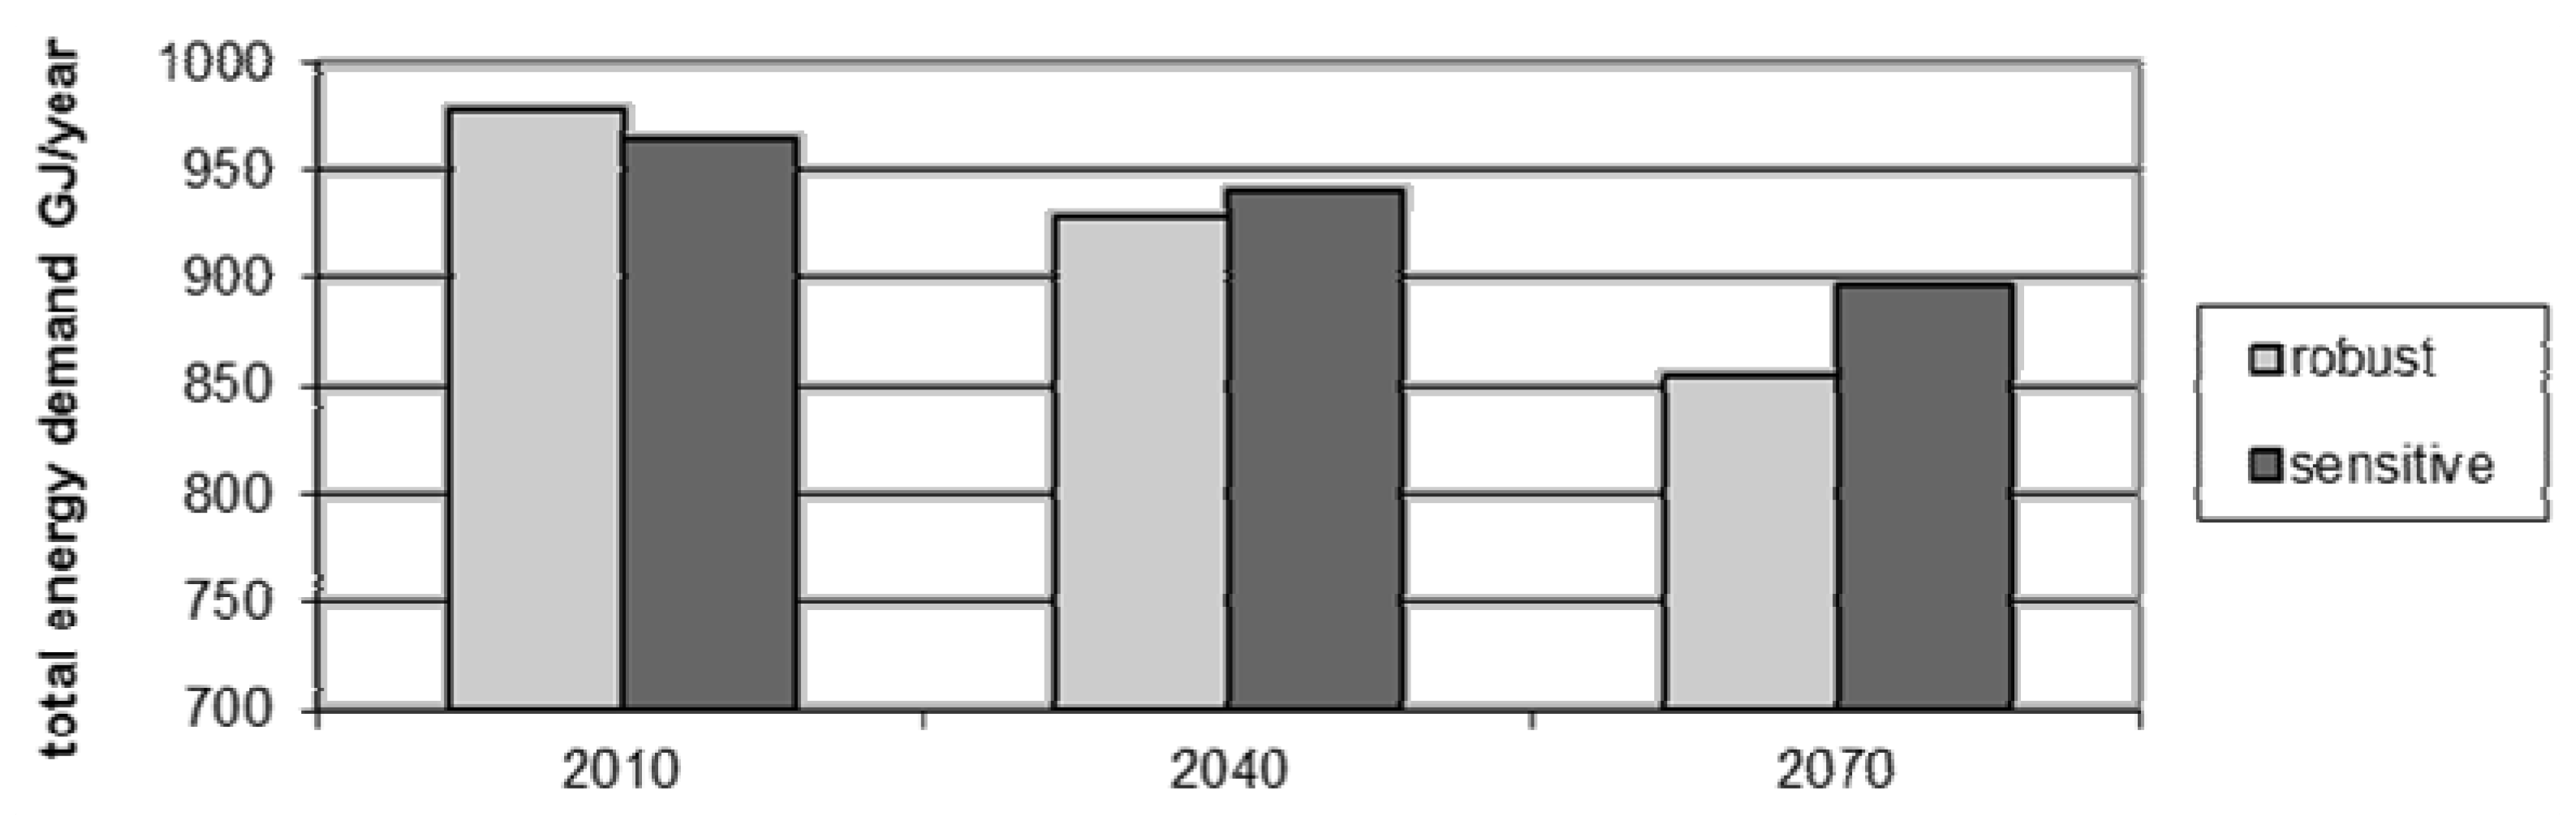
3.2. Rome Simulation, Low and High Emission Scenarios

Figure 5 and Figure 6 show the results for Rome, in the low and high emissions scenarios respectively. As expected, the low emissions scenario leads to better performance from the sensitive buildings than in the medium emissions case, whilst high emissions scenario leads to worse performance, showing that the higher the level of emissions, the more convenient robust building designs become.
Figure 5. Total energy demand in Rome for the low emissions scenario prevision—one building 40 × 30 × 9 m3.
Buildings 03 00191 g005
Figure 6. Total energy demand in Rome for the high emissions scenario prevision—one building 40 × 30 × 9 m3.
Buildings 03 00191 g006

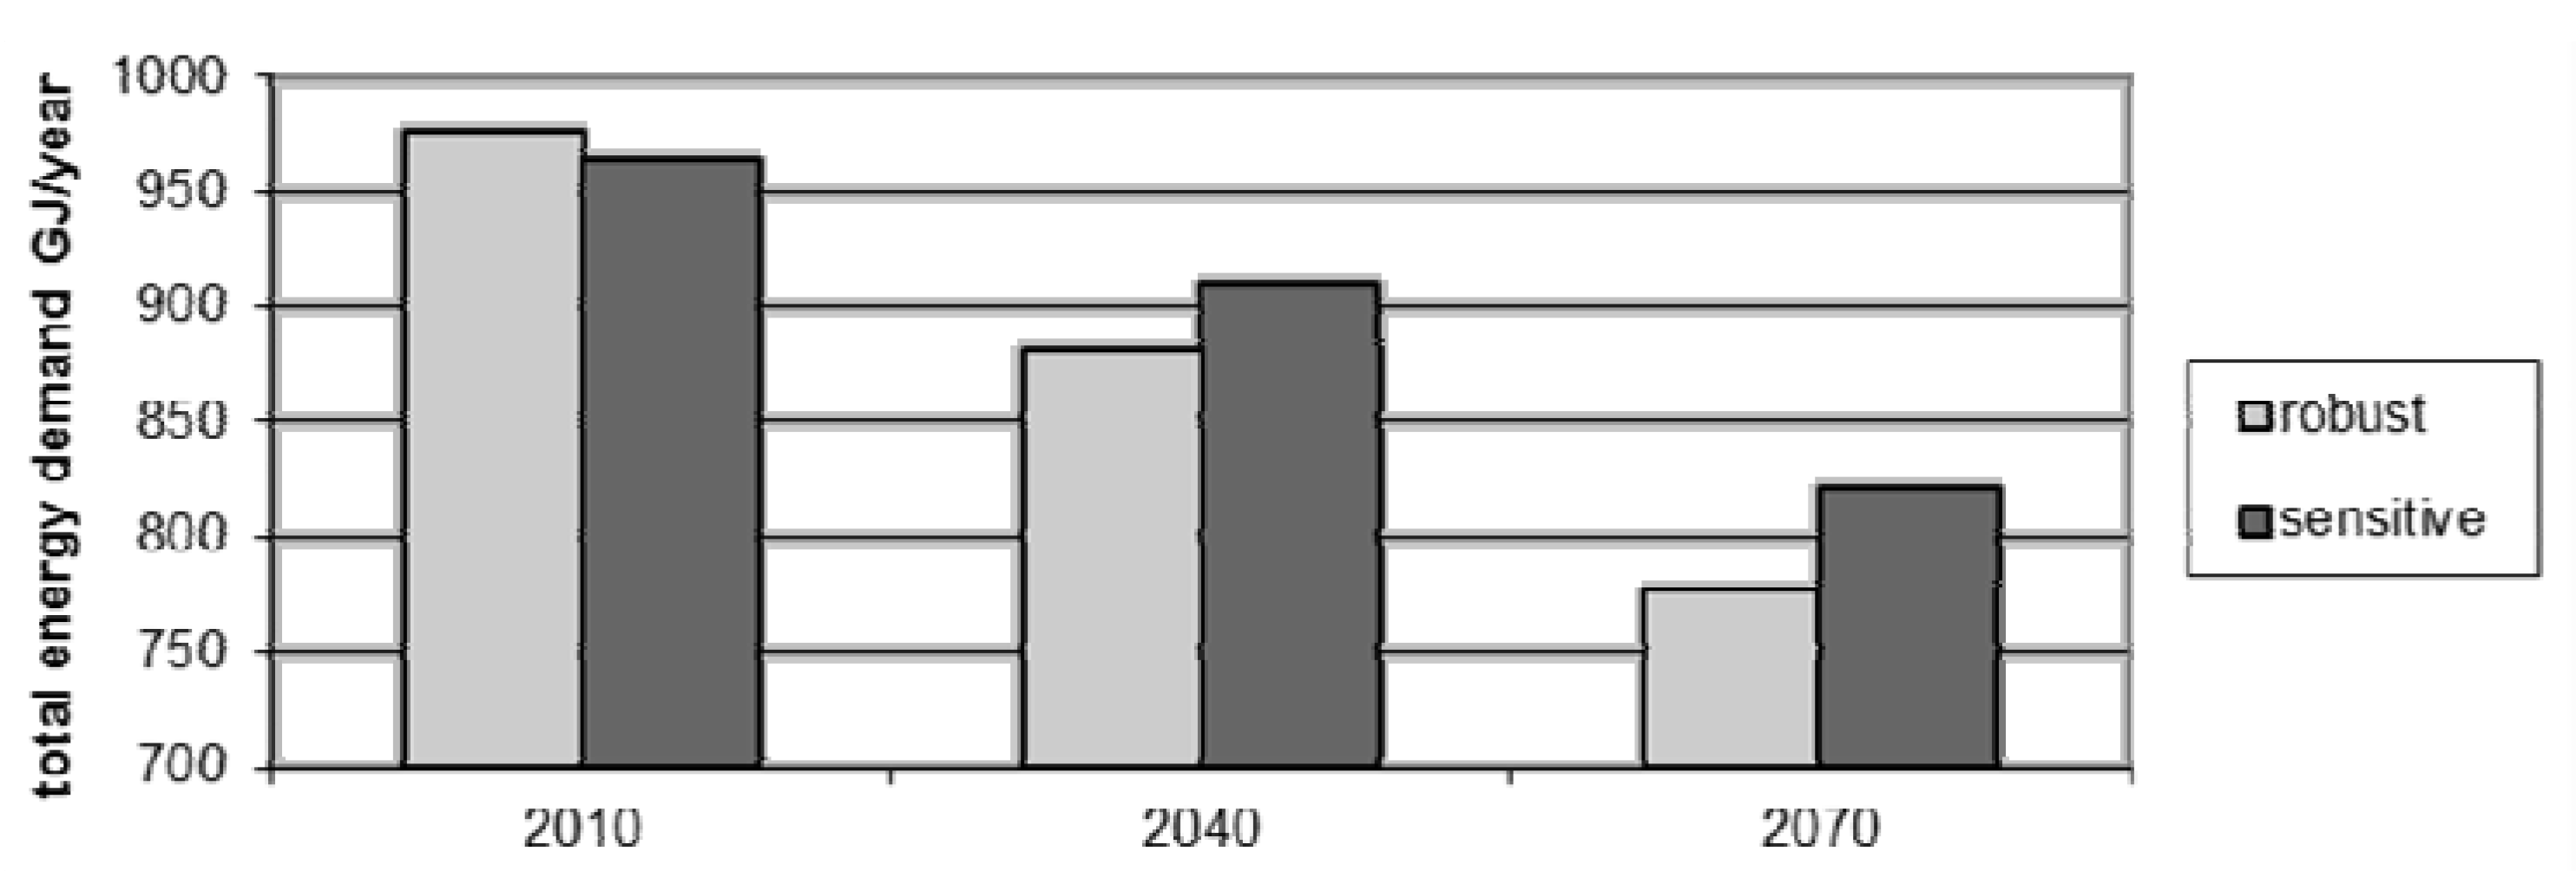
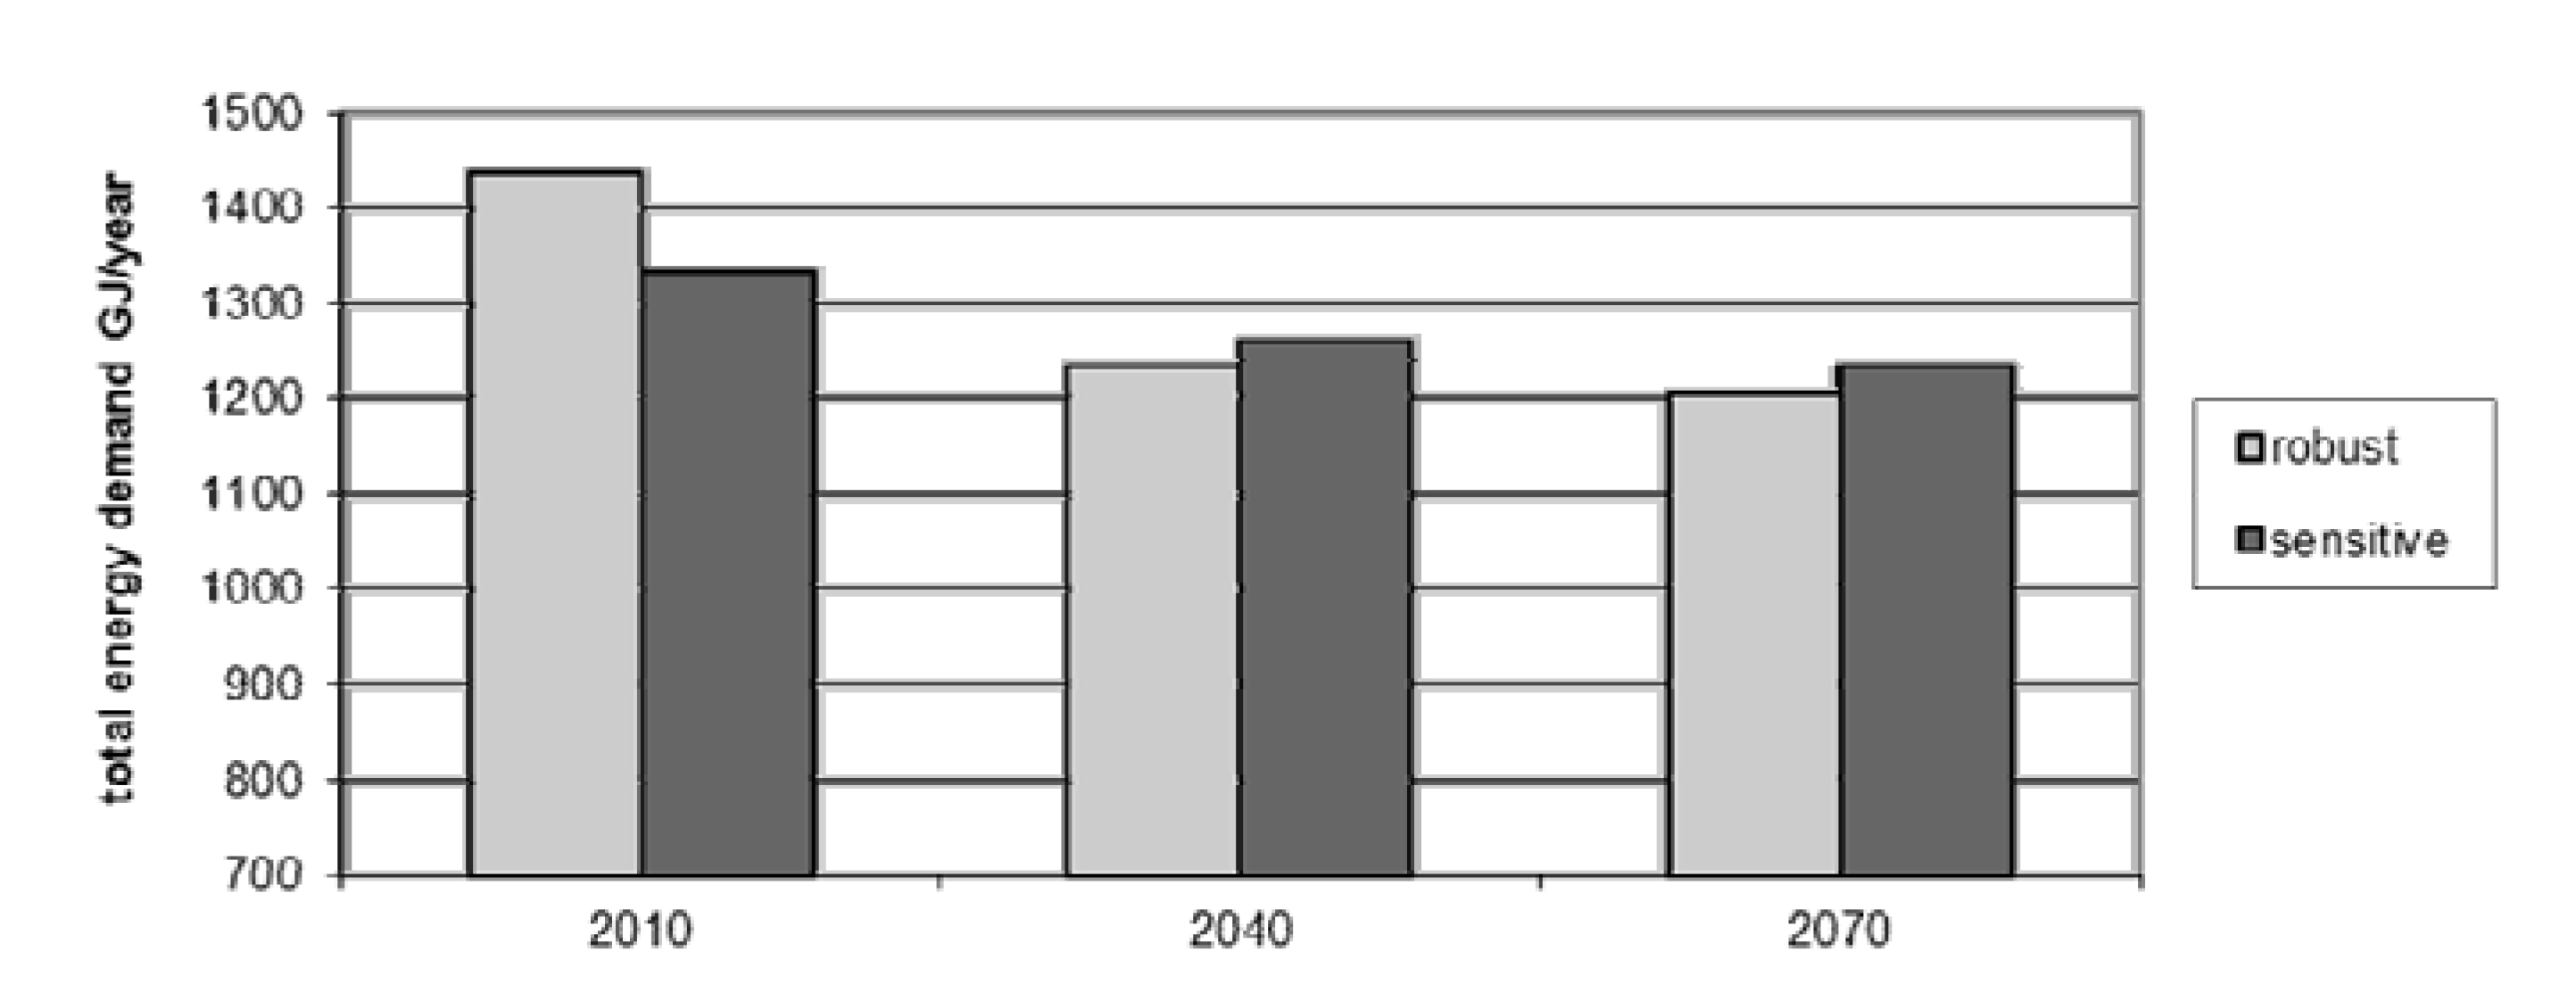
3.3. Osaka and Caracas Simulations

Figure 7 and Figure 8 show results for Osaka and Caracas for the medium emissions scenario. The Osaka simulation confirms the Rome case perfectly: the robust building starts poorly and finishes better than the sensitive design. The Caracas situation is obviously different. In a climate such as Caracas, heating demand is negligible and only cooling demand has to be taken into account. In the future, buildings in hot climates will consume more energy than nowadays.
Figure 7. Total energy demand in Osaka for the medium emissions scenario prevision—one building 40 × 30 × 9 m3.
Buildings 03 00191 g007
Figure 8. Total energy demand in Caracas for the medium emissions scenario prevision—one building 40 × 30 × 9 m3.
Buildings 03 00191 g008
However, the robust and sensitive buildings seem in this case to maintain the relative difference of consumption, that is to say, the robust building does not improve its performance more than the sensitive building, as in the other cases. Table 4 resumes the difference between robust and sensitive buildings in GJ/year for all the simulated cases.
Table 4. Difference between robust and sensitive typologies (total energy demand in GJ/year)—one building 40 × 30 × 9 m3.
City20102040 low emissions2070 low emissions2040 medium emissions2070 medium emissions2040 high emissions2070 high emissions
Rome+14−10−10−14−43−29−44
Osaka+8−3−23−25−28−28−44
Caracas−207−208−207−207−219−197−220

4. Conclusions

The present paper shows heating and cooling trends for future climatic scenarios in different regions of the world. Two architectural typologies are studied. Results confirm the initial supposition: a robust building will improve its performance relative to a sensitive building in all the cases considered. Only in the tropical hot climate is the progressive difference among the buildings not significant. The reason for this result lies in the difficult equilibrium between heating and cooling, which will change drastically in the future.
Robust design represents a building concept that doesn’t depend on system efficiency and user behavior to respond to a variable situation (low, medium and high frequency variations). A robust building has the capacity to adsorb heat gains in thermal mass and to use incoming solar radiation, combining the absorption effect with energy accumulation. Sensitive building may have a better performance at present, but the use of solar radiation is not necessarily combined with the necessary day-night accumulation-transmission cycle.
Under climate change, sensitive buildings drastically increase their cooling consumption. Moreover, the phenomenon creates a vicious cycle: the higher cooling demand, the higher electricity consumption and CO2 emissions, which further increase the global heating and the cooling demand. Recovering massive construction and functionality of architectural elements (as windows) is the best way to reduce emissions and to maintain comfort standards in buildings.
This paper focuses on energy demand evaluations, to put into context the impact of different design strategies on the future performances of buildings. More complex analyses are also needed to understand the impact on climate change in terms of primary energy consumption and carbon emissions caused by these energy demands. In this context, fuel typology, systems efficiency and new trends in electrical supply will be determinant to establish a general conclusion. However, from the point of view of building design, it is a remarkable result to understand that building robustness can react better to future simulations, such as those for climate.
It can be said that robust buildings have higher construction costs (both economical and energetic). However, energy consumption from use of buildings represents more than the half of emissions in mild climates (60%–70% depending by occupation density), as showed for example by Pages et al. in 2008 [22]. Embodied energy estimations show that increasing thermal mass raises construction-related emissions, but it seems that the adaptability of the resulting buildings justifies the energy used to build them. This supposition should be confirmed by future development of similar studies.
It can also be said that carbon equivalent emissions calculation can change previous results. However, two considerations have to be remarked upon:
  • A shift in cooling will be probably have a greater effect on emissions than a reduction in heating, because of the environmental cost of electricity production. Even considering good efficiency of cooling systems, the actual emissions coefficient for electricity is higher than coefficients associated with other fuels.
  • Predictions based on the future composition of electrical supply are very uncertain. Even today, the emissions coefficient is extremely sensitive to country policies and development. We do not know if the future will be more sustainable, with use of renewable sources to produce energy at macro, meso or micro scale. Even the IPCC scenarios do not consider direct actions to reduce global warming in their suppositions.
Because of these facts, it seems to be prudent to consider the worst case, and to use building design to reduce energy demand despite increasing embodied energy content.
As a final conclusion, it can be remarked that future performance simulations will obviously have some degree of uncertainty, but that simulations are absolutely necessary to define architectural projects. The lifetime of a building can be more than 100 years and the climatic situation will change over that time. It is impossible to not consider this fact. If climate data are obtained from good estimations (such as IPCC scenarios) and different situations are considered, simulations will be affordable and reliable.
Moreover, it is possible (and recommendable) to carry out uncertainty and sensitivity analysis of results. An indication of how to perform sensitivity analysis for building simulations is described for example by Mara and Tarantola [23].
A very simple preliminary evaluation of building sensitivity (to climate change or to other variations) can be obtained by thermal effusivity evaluation. Thermal effusivity is used in material physics to express the rapidity of response of materials, and is a combination of the basic material properties: conductivity λ (W/mK), specific heat c (J/kgK) and density δ (kg/m3) as in the formula:
Buildings 03 00191 i001
Thermal effusivity has the dimensions of J/m2Ks0.5 and it can be assumed that is a good indicator of the capacity of a material to respond to climate requirements.
By analogy, we propose a new concept: global thermal effusivity. This parameter can be defined for a whole building as:
Buildings 03 00191 i002
where M is the total thermal mass (J/m3K)—including skin and core materials; G is the total energy loss coefficient (W/m3K)—including ventilation and transmission losses; and φ is a correction coefficient depending on distribution and orientation of thermal mass and shell transmittances.
Effusivity has the dimensions of J/m3Ks0.5 and represents the rapidity of the building in responding to variations. It depends obviously on architectural form and space distribution, on materials used and ventilation mechanism. In this work, it is supposed to move in the range of 1–10 J/m3Ks0.5 where 1 represents a sensitive building and 10 a robust one.
An estimation of the φ coefficient can be conducted in a first approach considering a 0.25–1 range, where 0.25 represents a north-south oriented building with thermal mass and insulation on the north and glass on the south without solar protection, whilst 1 represents a total distributed thermal mass and windows, insulation and air interchange equilibrium on the façades.
For an exact calculation, information on internal space distribution and use is needed. For more information on G, M and φ numerical evaluation, see for example the Serra formulation [24]. Table 5 resumes the G, M, and φ values for the cases studied, and resultant thermal effusivities.
Table 5. Robust and sensitive thermal effusivity evaluation for the three cities.
CityΦ (0.25-1)Φ (0.25-1)M (J/m3K)M (J/m3K)G (W/m3K)G (W/m3K)E (J/m3Ks0.5)E (J/m3Ks0.5)
robust sensitiverobust sensitive robust sensitive robust sensitive
Rome0.90.380300.60.36.61.6
Osaka0.90.385350.40.25.51.4
Caracas0.90.575250.80.77.33.0
With respect to other methods for obtaining sensitivity indicators, the most effective for expert simulation tools users is to carry out uncertainty and sensitivity analysis using simplified strategies as suggested by Saltelli et al. [25,26,27], Hoffmann and Hammonds [28], De Wit [29], Bruke et al. [30], Clevenger and Haymaker [31]. In the case of climate change, this means that possible scenarios (e.g., three scenarios used in this paper) have to be tested and results have to be compared to understand the possible variation of a predicted result under aleatory conditions. Input variables can be discrete or probability distributions. A simplified analysis output is the uncertainty of the result under variation of each parameter. Another output is the sensitivity analysis, that is, to screen which variables have the most effect on result changes.
The simulation result, in other words, will be representative of the real building “sensitivity” and capacity to respond if stimulated (speaking climatically, when considered parameters—temperature, humidity, wind speed and direction, solar radiation—are shifted or stretched or generally modified by some climatic assumptions).
It has to be remembered that climate variation is not the only variation that can stimulate the building response: user behavior, changes to the local environment and urban modification are possible factors forcing the boundary conditions to be taken in to account. Some of the studies cited show that user related uncertainty is very important to reach a reliable prediction. Ventilation phenomena especially affect calculations and results can vary by 50%. De Wilde and Tian research (see cited document in reference) shows that climate change has also an important effect on result dispersion, even considering a supposed improvement in technology for the future.
Sensitivity analysis, in one of the described forms, should for instance be included in regulations and official certifications. In most countries around the world, energy labels policies are being implemented, considering that analyzed building projects will have a predicted performance, assessed terms of energy demand, primary energy consumption or greenhouse gas emissions caused by operation.
However, as explained in this paper, definitive conclusions on the predicted consumption or demand are not reliable, because of the changing world depending on climate, users, environment modification, etc.
We propose an energy certification process founded on steps: a first step can be minimum compliance with normative values, whilst the second and third steps can be energy demand evaluation and sensitivity analysis of this result. Simulation results and sensitivity to unpredictable changes can assign points or credits to the project, which, in order to be certified, has to reach a minimum in both analyses.

Acknowledgements

This work is part of a Ph.D. thesis presented at the Poly-Technic University of Catalonia in 2010 under the UPC Grant Programme for Doctoral Studies. The authors also thank Trama Tecnoambiental S.L. and UCN MECESUP programme for their contribution to the development of this work.

References

  1. Pagès, A.; Cuchí, A. Moving the entire building sector towards low CO2 emissions. In Proceedings of the PLEA Conference, Dublin, Ireland, 22–24 October 2008.
  2. Clarke, J.A. Energy Simulation in Building Design; Butterworth-Heinemann: Oxford, UK, 2001. [Google Scholar]
  3. Waltz, J.P. Computerized Building Energy Simulation Handbook; Monticello: New York, NY, USA, 2000. [Google Scholar]
  4. Hensen, J.L.M.; Lamberts, R.; Negrao, C.O.R. Building performance simulation at the start of the 3rd millennium. Build. Environ. 2002, 37, 765–767. [Google Scholar] [CrossRef]
  5. Crawley, D.B.; Lawrie, L.K.; Winkelmann, F.C.; Buhl, W.F.; Huang, Y.J.; Pedersen, C.O.; Strand, R.K.; Liesen, R.J.; Fisher, D.E.; Witte, M.J.; Glazer, J. EnergyPlus: Creating a new-generation building energy simulation program. Energy Build. 2001, 33, 319–331. [Google Scholar] [CrossRef]
  6. Barnaby, C.S.; Crawley, D.B. Weather data for building performance simulation. In Building Performance Simulation for Design and Operation; Routdledge: London, UK, 2011; Chapter 3. [Google Scholar]
  7. Jentsch, M.F.; Bahaj, A.S.; James, P.A.B. Climate change future proofing of buildings—Generation and assessment of building simulation weather files. Energy Build. 2008, 40, 2148–2168. [Google Scholar] [CrossRef]
  8. De Wilde, P.; Tian, V. Identification of key factors for uncertainty in the prediction of the thermal performance of an office building under climate change. Build. Simul. 2009, 2, 157–174. [Google Scholar] [CrossRef]
  9. Taguchi, G. System of Experimental Design; White Plains: New York, NY, USA, 1987. [Google Scholar]
  10. Taguchi, G. Introduction to Quality Engineering; White Plains: New York, NY, USA, 1986. [Google Scholar]
  11. Taguchi, G. Robust technology development. Mech. Eng. 1993, 3, 60–62. [Google Scholar]
  12. Palme, M.; Isalgué, A.; Coch, H.; Serra, R. Robust design: A way to control energy use from human behavior in architectural spaces. In Proceedings of the PLEA Conference, Geneve, Switzerland, 6–8 September 2006.
  13. Palme, M.; Isalgué, A.; Coch, H.; Serra, R. Energy consumption and robustness of buildings. In Proceedings of the CESB10 Conference, Prague, Czech Republic, 26–28 June 2010.
  14. Palme, M. Energy Sensitivity of Buildings. Ph.D. Dissertation, Universidad Politécnica de Cataluña, Barcelona, Spain, 10 March 2010. Available online: http://hdl.handle.net/10803/6140 (accessed on 15 November 2012).
  15. Zeiler, W.; van Houten, R.; Boxem, G. SMART buildings: Intelligent software agents. In Proceedings of the SEB Conference, Brighton, CO, USA, 29 April–1 May 2009.
  16. Harputlugil, G.; de Wilde, P.; Hensen, J.; Celebi, G. Development of a thermally robust school outline design for different climate regions of Turkiye. In Proceeding of the IBPSA Building Simulation Conference, Glasgow, UK, 27–30 July 2009.
  17. IPCC Emissions Scenario Special Report. Available online: http://www.ipcc.ch (accessed on 15 November 2012).
  18. Neila, F.J. Arquitectura Bioclimática en un Entorno Sostenible (in Spanish); Munilla-Lería Ed.: Madrid, Spain, 2004. [Google Scholar]
  19. TRNSYS Manual. Available online: http://www.trnsys.com (accessed on 15 November 2012).
  20. Climatic Change Weather File Generator Manual, UKCIP Official Site. Available online: http://www.ukcip.com (accessed on 15 November 2012).
  21. Orehounig, K.; Doppelbauer, E.M.; Madhavi, A.; Loibl, W.; Totzer, T. Climate change, building design, and thermal performance. In Proceedings of the IBPSA Building Simulation Conference, Sydney, Australia, 14–16 November 2011.
  22. Pagés, A.; Palme, M.; Isalgué, A.; Coch, H. Energy consumption and CO2 emissions in the construction and use of flats according to floor area. In Proceedings of theWREC Congress X, Glasgow, UK, 19–25 July 2009.
  23. Mara, T.; Tarantola, S. Application of global sensitivity analysis of model output to building thermal simulation. Build. Simul. 2008, 1, 290–302. [Google Scholar] [CrossRef]
  24. Serra, R.; Coch, H. Arquitectura y Energía Natural (in Spanish); UPC Edicions: Barcelona, Spain, 1996. [Google Scholar]
  25. Saltelli, A.; Chan, K.; Scott, E.M. Sensitivity Analysis; John Wiley and Sons: West Sussex, UK, 2000. [Google Scholar]
  26. Saltelli, A.; Ratto, M.; Tarantola, S.; Campolongo, F. Sensitivity Analysis in Practice: A Guide to Assessing Scientific Models; John Wiley and Sons: West Sussex, UK, 2004. [Google Scholar]
  27. Saltelli, A.; Tarantola, S. On the relative importance of input factors in mathematical models: Safety assessment for nuclear waste disposal. J. Am. Stat. Assoc. 2002, 97, 702–709. [Google Scholar] [CrossRef]
  28. Hoffman, F.O.; Hammonds, J.S. Propagation of uncertainty in risk assessments: The need to distinguish between uncertainties due to lack of knowledge and uncertainty due to variability. Risk Anal. 1994, 14, 707–712. [Google Scholar]
  29. De Wit, S. Identification of the important parameters in thermal building simulation. J. Stat. Comput. Simul. 1997, 57, 305–320. [Google Scholar] [CrossRef]
  30. Bruke, K.; Kenny, P.; Finn, D. The transparency and repeatability of building energy performance certification. In Proceedings of the DYNASTEE Conference, Athens, Greece, 14–18 October 2005.
  31. Clevenger, C.; Haymaker, J. The impact of the building occupant on energy modeling simulation. In Proceedings of the Joint International Conference on Computing and Decision Making in Civil and Building Engineering, Montreal, Canada, 14–16 June 2006.

