1. Introduction
Poor quality control and the use of sub-standard building materials are attributed to the high failure rates of buildings in Nigeria [
1,
2,
3,
4]. Also [
5] as cited in [
6] were of the view that structural failure is a direct function of constituent material failures and the material-to-material interactions within the structural unit. For this reason, if constituent materials of any structural unit are improved, it will ultimately improve the structural value of the whole unit. For some time now, the majority of the sandcrete blocks used primarily for load bearing walls (structural masonry) and in a few cases as partition walls, in the Nigerian building industry often fall short of specification standards recommended by the Nigerian Federal Ministry of Works [
3]. Some of these blocks even fail while being transported due to self-weight. It is not surprising therefore, to see reoccurring cases of building collapse; most especially due to failures of load bearing walls made from these blocks.
Freestanding walls and building structures with sandcrete load bearing walls are very common in Nigeria because they are simple to construct and easily affordable. Even sandcrete skin panels and blocks can sometimes be used to provide aesthetic value to buildings and also, when adequately prepared, to control moisture infiltration and wind action. This utility value of sandcrete in comparison to its cost and its adaptability to climatic factors is responsible for its wide application; most especially in small to medium size buildings in countries within tropical rainforests (
i.e., Nigeria, Ghana, Cameroon, Ivory Coast,
etc.) where a considerable amount of precipitation and high average temperatures are predominant. Other forms of modern walling materials exist such as clay masonry units, concrete masonry units (dense and lightweight aggregates), autoclaved aerated concrete masonry units, manufactured and natural stone masonry units, local studs and lateritic mud. However, these are hardly ever used for domestic buildings due to cost, the need of technical skills and in some cases aesthetic values and technology. In fact, [
21] as cited in [
22] also emphasized the wide spread use of sandcrete blocks. They were of the view that close to 90 percent of physical infrastructure, predominantly housing in Nigeria, is made of hardened sandcrete blocks (see
Figure 1).
Figure 1.
Typical housing development (predominantly of sandcrete blocks) in a semi-urban area in Nigeria.
Figure 1.
Typical housing development (predominantly of sandcrete blocks) in a semi-urban area in Nigeria.
Therefore, because of their common use, the need for masonry studies to address these problems is overwhelming. This is particularly true as several studies have established that most sandcrete blocks produced in Nigeria are substandard.
These inadequacies often stem from the quality and quantity of the materials used in the production of these blocks,
i.e. fine aggregate, cement and water. The Portland cement predominantly used in the manufacture of sandcrete blocks is often deficient in basic characteristics such as its soundness: leading to excessive change in volume; particularly expansion of the cementious paste after setting. This manifests itself in time by cracking and disintegration of surfaces. Even the mixing water frequently employed in sandcrete block manufacture is often unsuitable. Most water used in sandcrete production in Nigeria is waste water significantly polluted with organic materials, alkalis, acids and glycerine (grease). This is particularly true due to the fact that portable water is almost a luxury in Nigerian rural and semi-urban areas. Furthermore, substandard constituent materials such as fine aggregate with poor engineering properties is also very commonly used. Fine aggregate constitutes 60 to 80% of the volume of sandcrete and thus functions as an inert material acting as a filler. Sadly however, the majority of this fine aggregate employed in sandcrete block making in Nigeria is also contaminated with organic materials such as humus, dirt, silt, clay, mica and salts. This continues despite the fact that it is a widely accepted fact that choice (quality) of sand and its grading has a considerable consequence on the consistence (workability) of fresh mortar and finishing properties of hardened mortar [
23] as some sand may require undue (uneconomic) adjustment of mix ratio.
As reiterated previously, the quantities of material (mix ratios) can also impact on the overall quality of these blocks: water-cement ratio, wrong mix proportions (sand-cement ratio). Inadequate and uncontrolled curing conditions and inadequate compaction could also influence the overall quality of the sandcrete blocks. As a way forward, this paper concentrates on the application of vibration time in sandcrete block production to enhance durability and compressive strength through compaction. To achieve this, the following objectives are to be established in this paper:
However, the influence of fine aggregate combinations on particle size distribution, grading parameters and compressive strength of sandcrete blocks have been ascertained in previous studies carried out by [
7]. Thus, what is principally being examined in this paper is the impact of vibration time on the compressive strength of sandcrete blocks.
Masonry studies in various parts of Nigeria revealed that the majority of blocks do not meet the minimum standard strength of 1.7 N/mm
2 or the required mean strength of 2.1N/mm
2. Moreover, the strength of the samples varied from one block manufacturer to another and similar strength variations also exist within samples from a single source [
2,
3,
7,
8].
For example, in the eastern part of Nigeria (Enugu and its environs) studies revealed that none of the sandcrete block samples selected by random sampling from the twenty five block molding manufacturers in the city met the twenty-eight day minimum strength of 1.7 N/mm
2 [
2,
7]. There were recurring cases of variation from one manufacturer to another and even within the same source.
Similarly, recent assessments of the quality of sandcrete blocks in the north central part of Nigeria (Kaduna state), using stratified-purposeful sampling to select locations and block molding industries within Kaduna state, revealed very low durability and wet compressive strength properties. A total of five block molding manufacturers and ninety five randomly selected block samples were used in this investigation [
9]. Further investigations carried out in Minna, Niger State (north-western part of Nigeria) also revealed that commercially produced blocks within the town were far below standard minimum requirements [
10]. [
3] as cited in [
7] revealed, from similar studies covering six northern states, that the blocks produced in the northern part of Nigeria were of very low quality; a total of 306 randomly selected block samples were used for this investigation.
Some related studies carried out in the mid-western part of Nigeria (Benin City, Ekpoma, Ughelle, Effurun and Warri towns) revealed similar findings in the east, north central and north western parts of Nigeria.
In England for instance, masonry units have to comply with the relevant BS EN Standards. Where they fail to conform to these standards, they are normally subjected to appropriate tests to ascertain that the units satisfy the engineering requirements. Normally, specifications for structural masonry units are a function of the designers’ requirements which are normally based on the strength (compressive and/or flexural) and durability (the exposure conditions that the units will be subjected to). However, strength and durability are dependent on the mortar used and masonry units’ properties. In Nigeria, due to lack of knowledge and for economic reasons, prospective developers hardly consult relevant expertise for small scale or domestic projects where sandcrete masonry is often employed. Most disturbing of all, is that some of these blocks tend to fail due to their own self weight. If this scenario was not the case, structural engineers would have been sufficiently equipped in expertise to improve what is available with adequate structural design. The minimum masonry mortar compressive strength at 28 days in the UK and most European countries is 2 N/mm
2 (mortar designation (iv); compressive strength class M2) [
24,
25]. By implication, the minimum standard compressive strength requirements in Nigeria compete favorably with other parts of the world if adequately adhered to.
In all, it was observed that block manufacturers in Nigeria do not comply with the basic principles of block production and often employ sub-standard constituent materials. Since fine aggregate (sand) makes 80% of the sandcrete, it is important to briefly attempt to explain the natural formation of these materials in the environment. This paper is subdivided into six parts, namely: introduction; sources of fine aggregate; program of investigation; methodology; discussion; recommendations and conclusion.
5. Discussion
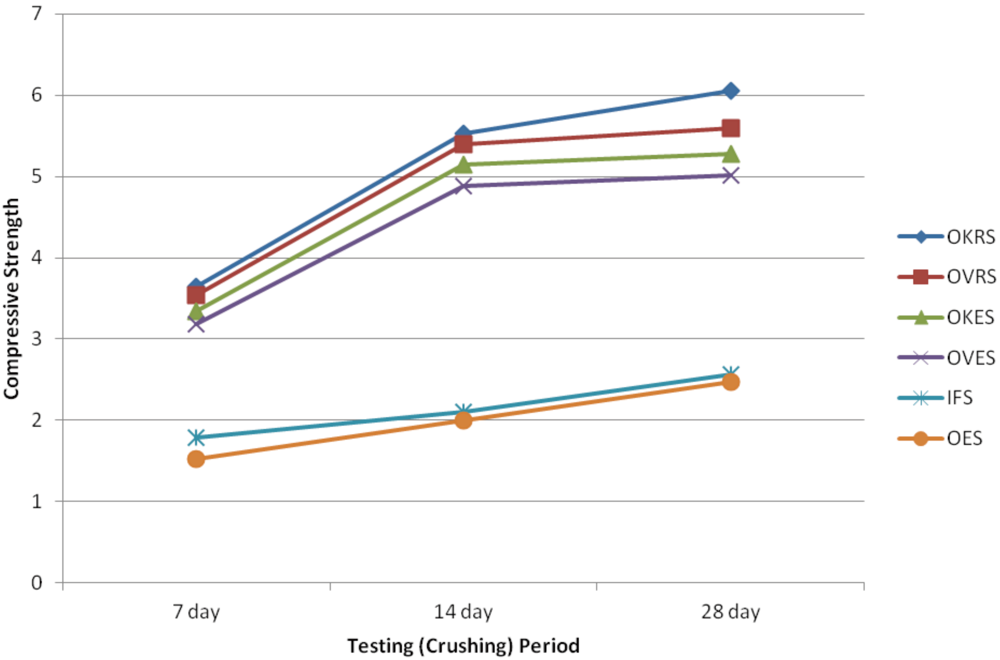
Figure 6.
Compressive strength at 7, 14 and 28-day test for all the various sands.
Figure 6.
Compressive strength at 7, 14 and 28-day test for all the various sands.
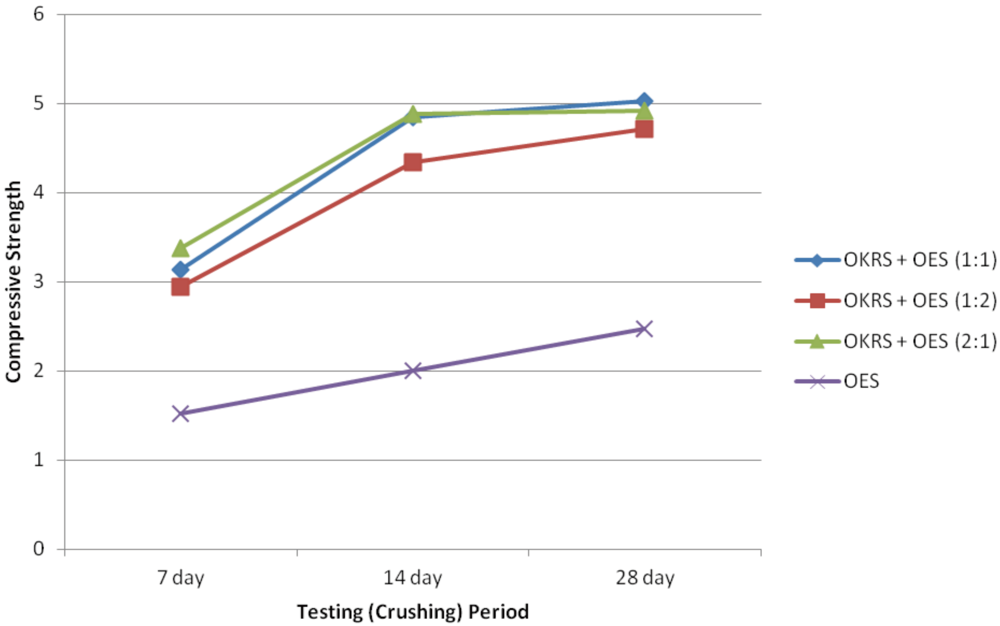
Figure 7.
Compressive strength at 7, 14 and 28-day testing period for OES and its combinations.
Figure 7.
Compressive strength at 7, 14 and 28-day testing period for OES and its combinations.
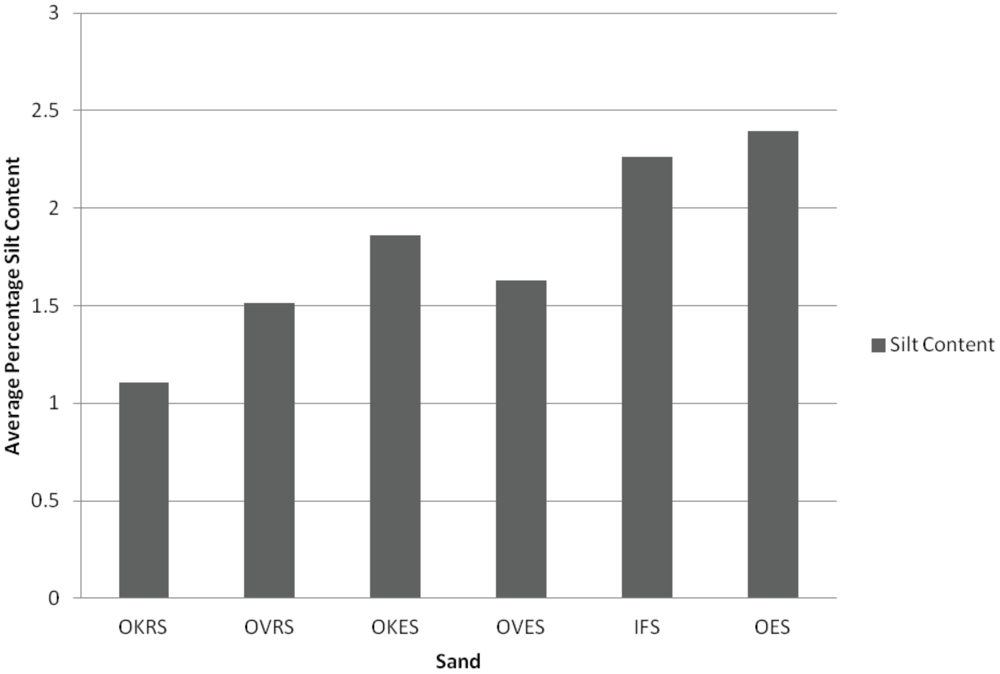
Figure 8.
Silt content profile of all the various sands.
Figure 8.
Silt content profile of all the various sands.
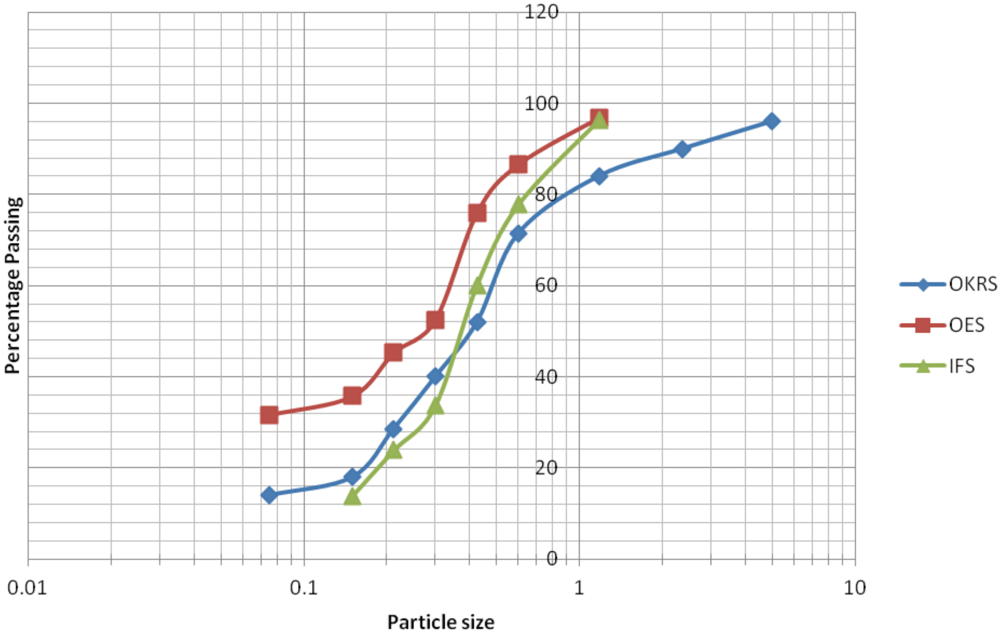
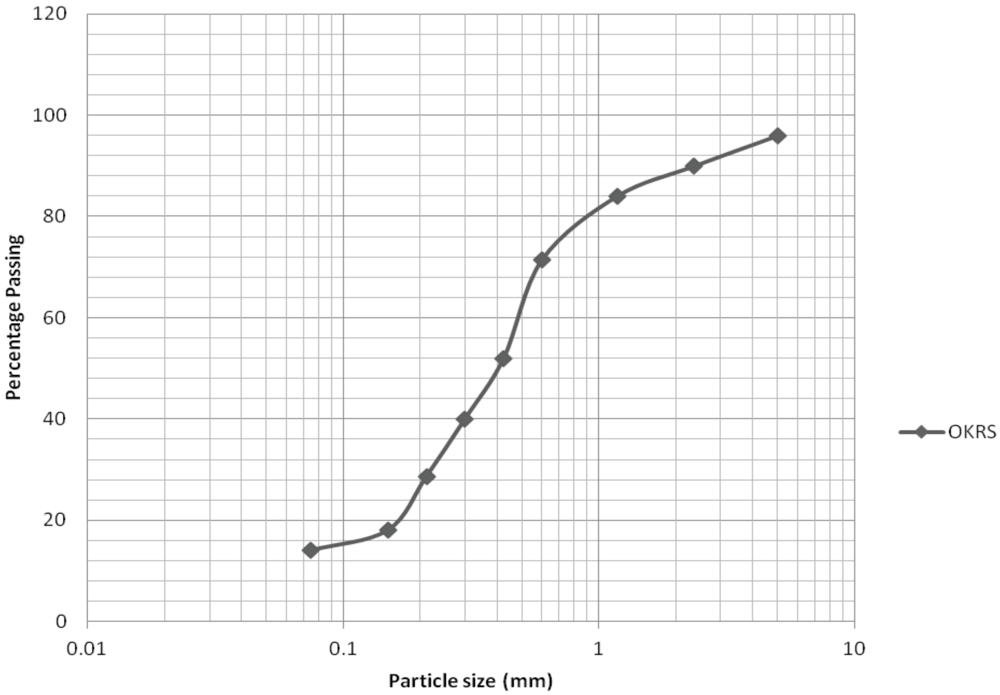
From the compressive strength results tables (
Table 7 and
Table 9) and plotted graphs (
Figure 6 and
Figure 7) for all the various sand samples (excluding combinations); the highest compressive strengths were recorded at the 28-day crushing test and 25 seconds vibration time. OKRS gave the highest compressive strength at 7-day, 14-day and 28-day respectively. The next was OVRS; this was followed by OKES and then OVES. However, the last two: IFS and OES had compressive strength values that were much lower compared with the likes of OKRS, OVRS, OKES, and OVES. OES recorded the lowest compressive strength.
From the silt content test results, it was revealed that OES had the highest percentage silt content. This was followed by IFS and then OVES, OKES and OVRS. OKRS had the least silt content (see
Figure 8;
Table 5). Nevertheless, the minimum allowable percentage silt content was not surpassed by any of the sands. What is noticeable from these results, is that with increasing silt content and reduced vibration periods, the compressive strength depreciates.
The particle size distribution test (
i.e., sieve analysis) carried out to ascertain the grading parameters of each of these sands showed that OKRS was the best sand in every measure in comparison to the others (see
Table 5,
Figure 3 and
Figure 4). Generally, the grading performance of each of these sands was similar to their relative positions or performance during the compressive strength test. For example, the grading performance of OES was poor because of its high silt content in comparison to the others (see
Table 5 and
Figure 3,
Figure 4 and
Figure 8). This might have led to an increase in the water-cement ratio for a given workability which in turn reduced the compressive strength. Thus, strength is partly related to the level of silt content in sands. It is ‘partly related’ because several other factors outside constituent materials affect strength
i.e., method of preparation, curing and test conditions [
18,
19].
OES on the other hand exhibited poor grading parameters, compressive strength and much higher silt content. Notwithstanding this, OES is still the most widely used sand in Benin City and its environs because it is readily available.
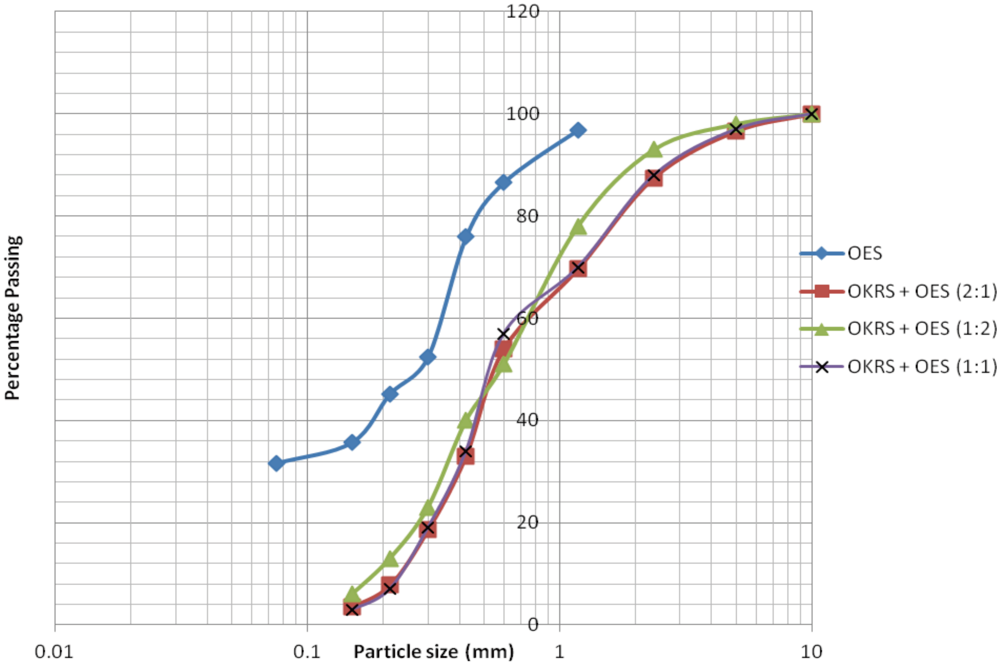
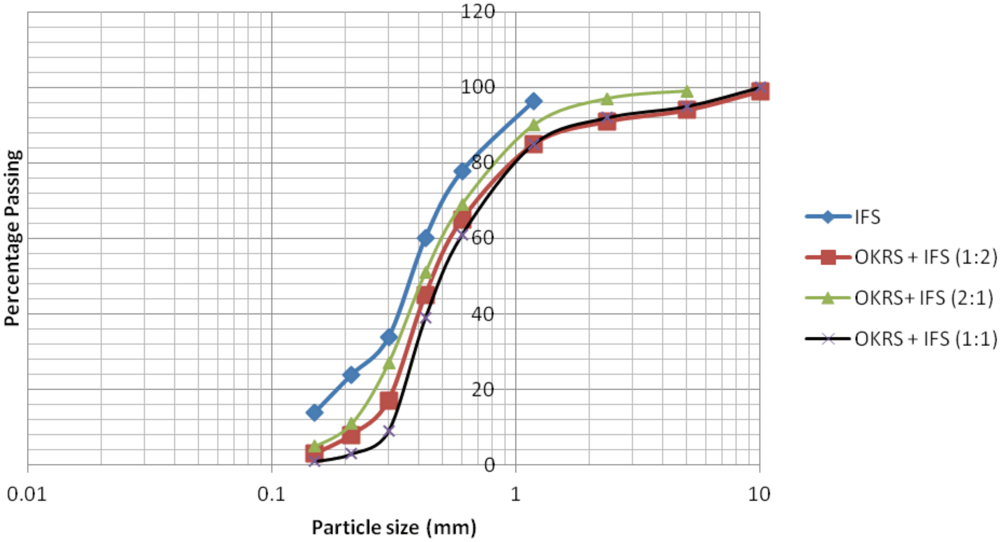
In the bid to maximize the utility value of both OKRS and OES, a combination approach was employed: OES (with the weakest engineering properties) combined with OKRS (with better engineering properties) at ratios 1:1, 2:1 and 1:2. Similarly, OKRS and IFS were blended together at the same ratios and these were repeated combining OVRS with OES and OVRS and IFS. The results were encouraging. It was observed that the compressive strengths of all the block samples were higher with increasing vibration periods during production
i.e., the highest compressive strength was recorded at 25 seconds vibration time; followed by 20 seconds vibration time and 10 seconds respectively. Thus, strength is also partly related to the vibration periods or levels of compaction. Of particular interest was the combination of OKRS with OES and OKRS with IFS. Here, the results of the wet compressive strength test at 14-day and 25 seconds vibration time were within the range of 37 percent to 41 percent less than their dry compressive strength values. This comparison was necessary in view of the prevalent exposure conditions these blocks might be subjected to in future, for example natural flooding and failed infrastructures (e.g., broken pipes in the water supply network, drainage systems and sanitation). Information such as this would assist developers or builders in how to use these blocks particularly in the riverine areas and water logged soils like the Niger-delta region of Nigeria. It should also be noted that blocks used for external cladding and boundary walls which are subject to driving rain or water logged soil are either partially or fully soaked with water. This affects the compressive strength and durability properties. For this reason, it is necessary to determine the wet compressive strength of the blocks after soaking in water for 14 days [
20]. In addition, samples from these relative combinations
i.e., OKRS and OES; OKRS and IFS yielded very high compressive strength increases over those of OES, IFS when used individually (
Table 7,
Table 8,
Table 9, ). The range increase was from 99 percent to 103 percent for the OKRS and OES blend alone (
Table 6).
6. Recommendations
Since vibration time was significant in compressive strength and durability of sandcrete blocks, future investigation needs to establish an optimum vibration time relevant to materials and circumstances. In addition, increasing the vibration time beyond what is currently employed (which is about 10–15 seconds) should be emphasized during block manufacture.
To maximize the utilization of fine aggregate like Okhoro river sand (OES) and Ikpoba flood erosion (IFS) sand in Benin City, the combination with superior sands such as Okhuahia river sand (OKRS) is strongly recommended. It is expected that similar problems could be tackled using this technique. The blending must not be carried out arbitrarily otherwise the objectives will be defeated. Rather, it should be practically measured on site by mass or by volume (since the cost of weighing machines is far beyond the reach of an average builder or developer in Nigeria). Efforts should also be geared towards knowing the actual moisture content and the optimum moisture content of the sand combinations to achieve the best water-cement ratio for the best possible performance as this would assist in eradicating concerns of workability and sand buckling. Further work needs to be carried out to ascertain the geotechnical properties of these combinations in comparison to those of the individual fine aggregates.
There is also a need to establish the optimum mix ratio of each sand combination as a guide for best performance. A similar investigation of this magnitude where pozollanic materials and admixtures are used as binders should also be considered in the future for economic reasons and in view of the energy intensive and the environmental impact of the use and manufacture of Portland cement.
For external walls and in areas where these blocks are exposed to moisture (ingress), after laying, the surfaces should be well rendered. Below ground level, the surfaces should be coated with a water proofing agent e.g., bitumen. Waterproof Portland cement could be used for the laying, manufacture and rendering of sandcrete blocks to prevent moisture ingress. This cement contains waterproofing agents so blocks made with it are less permeable to water. The objective is to fill the pores of the mortar or to line the pores with a film of water repellent material.
Owing to the skilled manpower required for the manufacture and use of sandcrete blocks and relevant quality control processes in developing countries like Nigeria, subsidized further education (technical colleges) tuition and other forms of incentivized training schemes should be encouraged to cater for skill gaps in these areas. In addition, an appropriate regulatory framework should be put in place to monitor, and enforce where necessary, quality control processes in the making of sandcrete blocks.
7. Conclusion
Most frequently used sands in Nigeria are poorly graded and the blocks made from these sands are also poorly produced. This has been indirectly responsible for the high failure rates of sandcrete blocks. Usually, poorly graded sand would require a high water-cement ratio which seriously affects compaction of sandcrete blocks. It is difficult to specify a fixed vibration time economically viable for each producer without the relevant knowledge of the materials and technology that is applicable and available to them (18–25 seconds vibration time is generally recommended in Nigeria). This is hardly ever enforced or adhered to. It is also of note that the characteristics of fine aggregates have a considerable influence on the mix proportions and on the economy of sandcrete. Therefore, fine aggregate should consist of clean, hard, durable particles free from a coating of clay or other fine aggregate capable of influencing the bond of the cement paste. Contaminating substances most often encountered are dirt, silt, clay, mica, salts and humus or other organic matter that may appear as coating or as loose fine material. However, these substances can be removed by washing. A physical examination could be used as a simple, preliminary method of identifying suitable sand(s) for block production. The cleaner and grittier the sand is between the fingers, the better the sand is. Silt by comparison feels almost like flour.
Lastly, increasing the vibration time of sandcrete, blending sands during production or a combination of the two, undoubtedly improves the compressive strength and durability properties and also maximizes the use of these poorly graded sands.


