Article

A Study on the Driving Mechanism of Future Community Building in China from the Perspective of Resident Participation

School of Mechanics and Civil Engineering, Suzhou University of Science and Technology, Suzhou 215009, China
*
Author to whom correspondence should be addressed.
Buildings 2025, 15(7), 1203; https://doi.org/10.3390/buildings15071203
Submission received: 24 February 2025 / Revised: 28 March 2025 / Accepted: 2 April 2025 / Published: 7 April 2025
(This article belongs to the Section Construction Management, and Computers & Digitization)

Abstract

:
A future community is a community with the core mission of realizing people’s vision of a better life, focusing on meeting the all-round life needs of community residents. Residents’ participation in the construction of a future community is also regarded as one of the core driving forces to promote the sustainable development and innovation of future community construction. Therefore, to better facilitate the construction of future communities, based on relevant studies at home and abroad, this thesis combines questionnaire surveys and expert interviews, identifies 20 driving factors from five levels of human nature, ecology, intelligence, convenience, livability, etc., according to which it constructs a system dynamics model and carries out a simulation analysis, observes the effects of the driving factors at each level on residents’ sense of belonging and sense of participation, and finally, the results of the analyses are combined to put forward relevant suggestions for future community building. The results of this study show that residents’ perception of future community construction, their demand for intelligent life, the degree of promotion of a 15 min community living circle, and the degree of improvement of a community’s disaster warning and emergency response mechanism are the key factors driving resident participation in the construction of a future community, with residents’ demand for intelligence at different times being the most central driving factor. The research results of this thesis provide theoretical references for stimulating resident participation and building livable future communities while offering insights applicable to global contexts, particularly in regions undergoing rapid urbanization and digital transformation.

1. Introduction

Community is the basic unit of a city, and it is an important place for the cohesion and happiness of urban residents [1]. A future community is a scientifically planned, carefully laid out, intelligent, and advanced living space, which is a carrying platform for more modern urban development and better people’s lives. Since the end of the 20th century, people from all walks of life have gradually begun to discuss the future of communities [2]. Foreign research on ‘future community’ started earlier, and although not explicitly putting forward the concept of ‘future community’, many scholars have conducted in-depth research on new scientific and technological revolutions in low-carbon communities, intelligent communities, and resilient communities. From their conception of community development and exploration of community construction, the dimensions of the future community can be found. In 1988, the Drucker Foundation published the book Future Communities, which put forward a beautiful imagination of a future community [3]. In 2000, Fidler [4], with the development of new media as a starting point, defined a ‘future community’. In this context, a future community is envisaged as a nexus where electronic media can enhance community wisdom by connecting community development and residents. Since then, foreign scholars have gradually carried out comprehensive research on future communities. Ortiz Robin relied on case studies and spatial simulation tools to construct a new community transport model dominated by green and public transport [5]. Dong [6] proposed a feasible evaluation system for the comprehensive process of future community development through the fuzzy Delphi method (FDM) and the TOPSIS method. Johansen et al. [7] proposed the concept of resilient community planning with self-renewal capacity centered on a static risk assessment framework. Mcnaughton et al. [8] used the community of Treasure Beach, Jamaica, as a case study to propose methods and initiatives for the implementation of a smart community project in the context of community tourism. While their case study provides valuable insights into localized governance, it lacks quantitative modeling of multifactor interactions, which is compensated for by our hybrid approach of DEMATEL-ISM and SD. In terms of research methodology, existing international studies have mainly used qualitative or single-dimension quantitative approaches (e.g., spatial analysis and policy evaluation). For example, Mike [9] explored sustainable community policy through legislative analysis explored sustainable community policy through legislative analysis. In contrast, our study used a system dynamics approach to model the non-linear effects of 20 drivers across five dimensions. This contrast highlights our contribution: the transition from static descriptive models to resident-centered dynamic simulations. In addition, while foreign studies usually prioritize a government-led perspective, this paper shifts the focus to resident participation, quantifying the impact of factors such as the 15 min living circle through survey data, which has not yet been fully explored in the previous literature.
China’s research on future communities is still in the beginning and exploration stages, and future communities are still a new thing [10]. Previously, the country has roughly experienced the stages of eco-community, smart community, low-carbon community, and so on in the exploration of community practice, which have certain similarities with future communities but lack a complete and systematic planning of the community. Of particular concern is the emergence of future community construction plans and actions explicitly proposed by local governments in China in recent years. In 2019, Zhejiang Province took the lead in pressing the start button for future community construction, promulgating the ‘Pilot Work Programme for the Construction of Future Communities in Zhejiang Province’. Since then, the pilot work of ‘future communities’ in Zhejiang Province has been comprehensively launched [11]. In January 2023, Zhejiang Province further issued the ‘Guidance Opinions of the General Office of the People’s Government of Zhejiang Province on Promoting the Construction of Future Communities in the Whole Region’, which puts forward opinions on the main tasks of the construction of future communities in terms of construction standards, cultural characteristics, public services, etc. [12]. Among the existing studies, domestic scholars’ research on future communities mainly focuses on value orientation, scene construction, and implementation path. In terms of value orientation, Liu [13] analyses the current situation of today’s community construction, operation, and maintenance and proposes a general implementation plan for digital twin-enabled future community construction, operation, and maintenance. Song [14] pointed out that the key to colonization is a change in concepts, such as the flexibility of planning, pedestrian-oriented design, function over appearance, passive technology, and appropriate technology systems. Chai [15] explored the guidance of three major value orientations for future community building. ‘People-oriented’ is the fundamental guideline for future community construction, highlighting human diversity, heterogeneity, and difference. In terms of scenario construction, Rao G [16] takes scenario theory as the center and couples various theories such as collaborative evolution theory, community theory, public service provision theory, etc., to provide an appropriate theoretical analysis framework and a new action path for the construction of educational scenarios in future communities. Xiang [17] starts from the three value systems, takes high-quality community development as the core, focuses on the design of the three main scenarios of future governance, education, and neighborhood, and embeds other scenarios to create a ‘3 + X’ scenario construction system, which provides residents with a good neighborhood community of sharing and interaction, an educational community of intellectual interest and integration, and a garden community of mountainous shape and with water. In terms of the implementation path, Yan [18] studies the dilemma of urban community digital governance in the context of digital reform and then proposes an optimization path for future community governance. Chen [19] explores the specific development paths of future communities in the construction of different scenarios for the practice of Yiwu’s future community.
From the research results of scholars at home and abroad, it can be seen that the construction of future communities in China is in the exploratory stage, with few research results and the following deficiencies: First, existing studies predominantly adopt a governmental or technological perspective, with limited empirical analysis on resident participation as the core driver. Second, most scholars have only elaborated on the development concept, development mode, and the significance of building future communities, neglecting the analysis of driving mechanisms in practice. Specifically, there is a scarcity of system dynamics (SD) applications to capture the time-varying effects of factors such as residents’ demand for intelligent living and the 15 min community living circle. Third, the research perspective is singular. Most existing studies overemphasize the government’s role while underestimating residents’ agency. Additionally, prior surveys often relied on small-scale or regionally concentrated samples, limiting the generalizability of findings. Therefore, this thesis takes the perspective of residents’ participation as the entry point, proposes the driving factors of future community construction from the perspective of residents’ participation on the basis of existing theoretical studies, constructs a system dynamics model to analyze the interrelationships and dynamic feedback among the driving factors, and finally, carries out a simulation analysis. By collecting 156 valid questionnaires covering diverse regions and demographic groups, this study addresses the representativeness gap in prior research. While this study focuses on China’s unique trajectory of future community construction, it aligns with global efforts to achieve sustainable urban development. The lessons drawn from China’s pilot projects in Zhejiang Province resonate with international frameworks such as the UN Sustainable Development Goals (SDG 11), highlighting the potential for cross-regional adaptation of resident-centric governance models. The research results of this thesis provide certain theoretical references for more effectively stimulating the enthusiasm and creativity of residents’ participation in community construction, as well as jointly building a more livable and harmonious future community [20].

2. Determining the Meaning and Drivers of Future Community Building

2.1. The Meaning of Future Community Building from the Perspective of Resident Participation

In March 2019, Zhejiang Province officially issued the Pilot Work Programme for the Construction of Future Communities in the province and defined future communities as centering on people’s aspirations for a better life, taking humanism, ecology, and digitalization as the value orientation, taking harmony and common governance, green and intensive, and intelligent sharing as the basic connotations, and constructing nine scenarios of future neighborhoods, namely education, health, entrepreneurship, architecture, transportation, low carbon, services, and governance, to create a new type of urban functional unit with a sense of belonging, comfort, and future [21]. Resident participation can be understood as the specific behavior of residents participating in community public affairs through various ways and forms, mainly including community political participation, managerial participation, policy formulation, and implementation participation. Residents’ participation processes are interacting with other community subjects [22]. Based on this, the future community construction from the perspective of residents’ participation can be defined as taking residents as the important, main body of community construction, fully respecting and absorbing residents’ opinions, needs, and expectations, and jointly constructing a new type of urban functional unit that meets people’s aspirations for a better life.

2.2. Identifying the Drivers of Future Community Building from a Resident Participation Perspective

In order to identify the driving factors affecting future community building from the perspective of resident participation, two major databases, China Knowledge and Web of Sciences, were used to search the literature with the keywords ‘future community’, ‘future community driving factors’, and ‘residents participation in community building’, searching in the literature published in the last 10 years with more authoritative and informative data, and systematically exploring the meaning of future community building from the perspective of resident participation. Then, based on the literature, combined with the questionnaire survey and expert interviews, we decided to establish first-level indicators from the five levels of human nature, ecology, intelligence, convenience, and livability, and finally selected 20 second-level indicators based on the connotation differences in these five first-level indicators, as shown in Table 1.

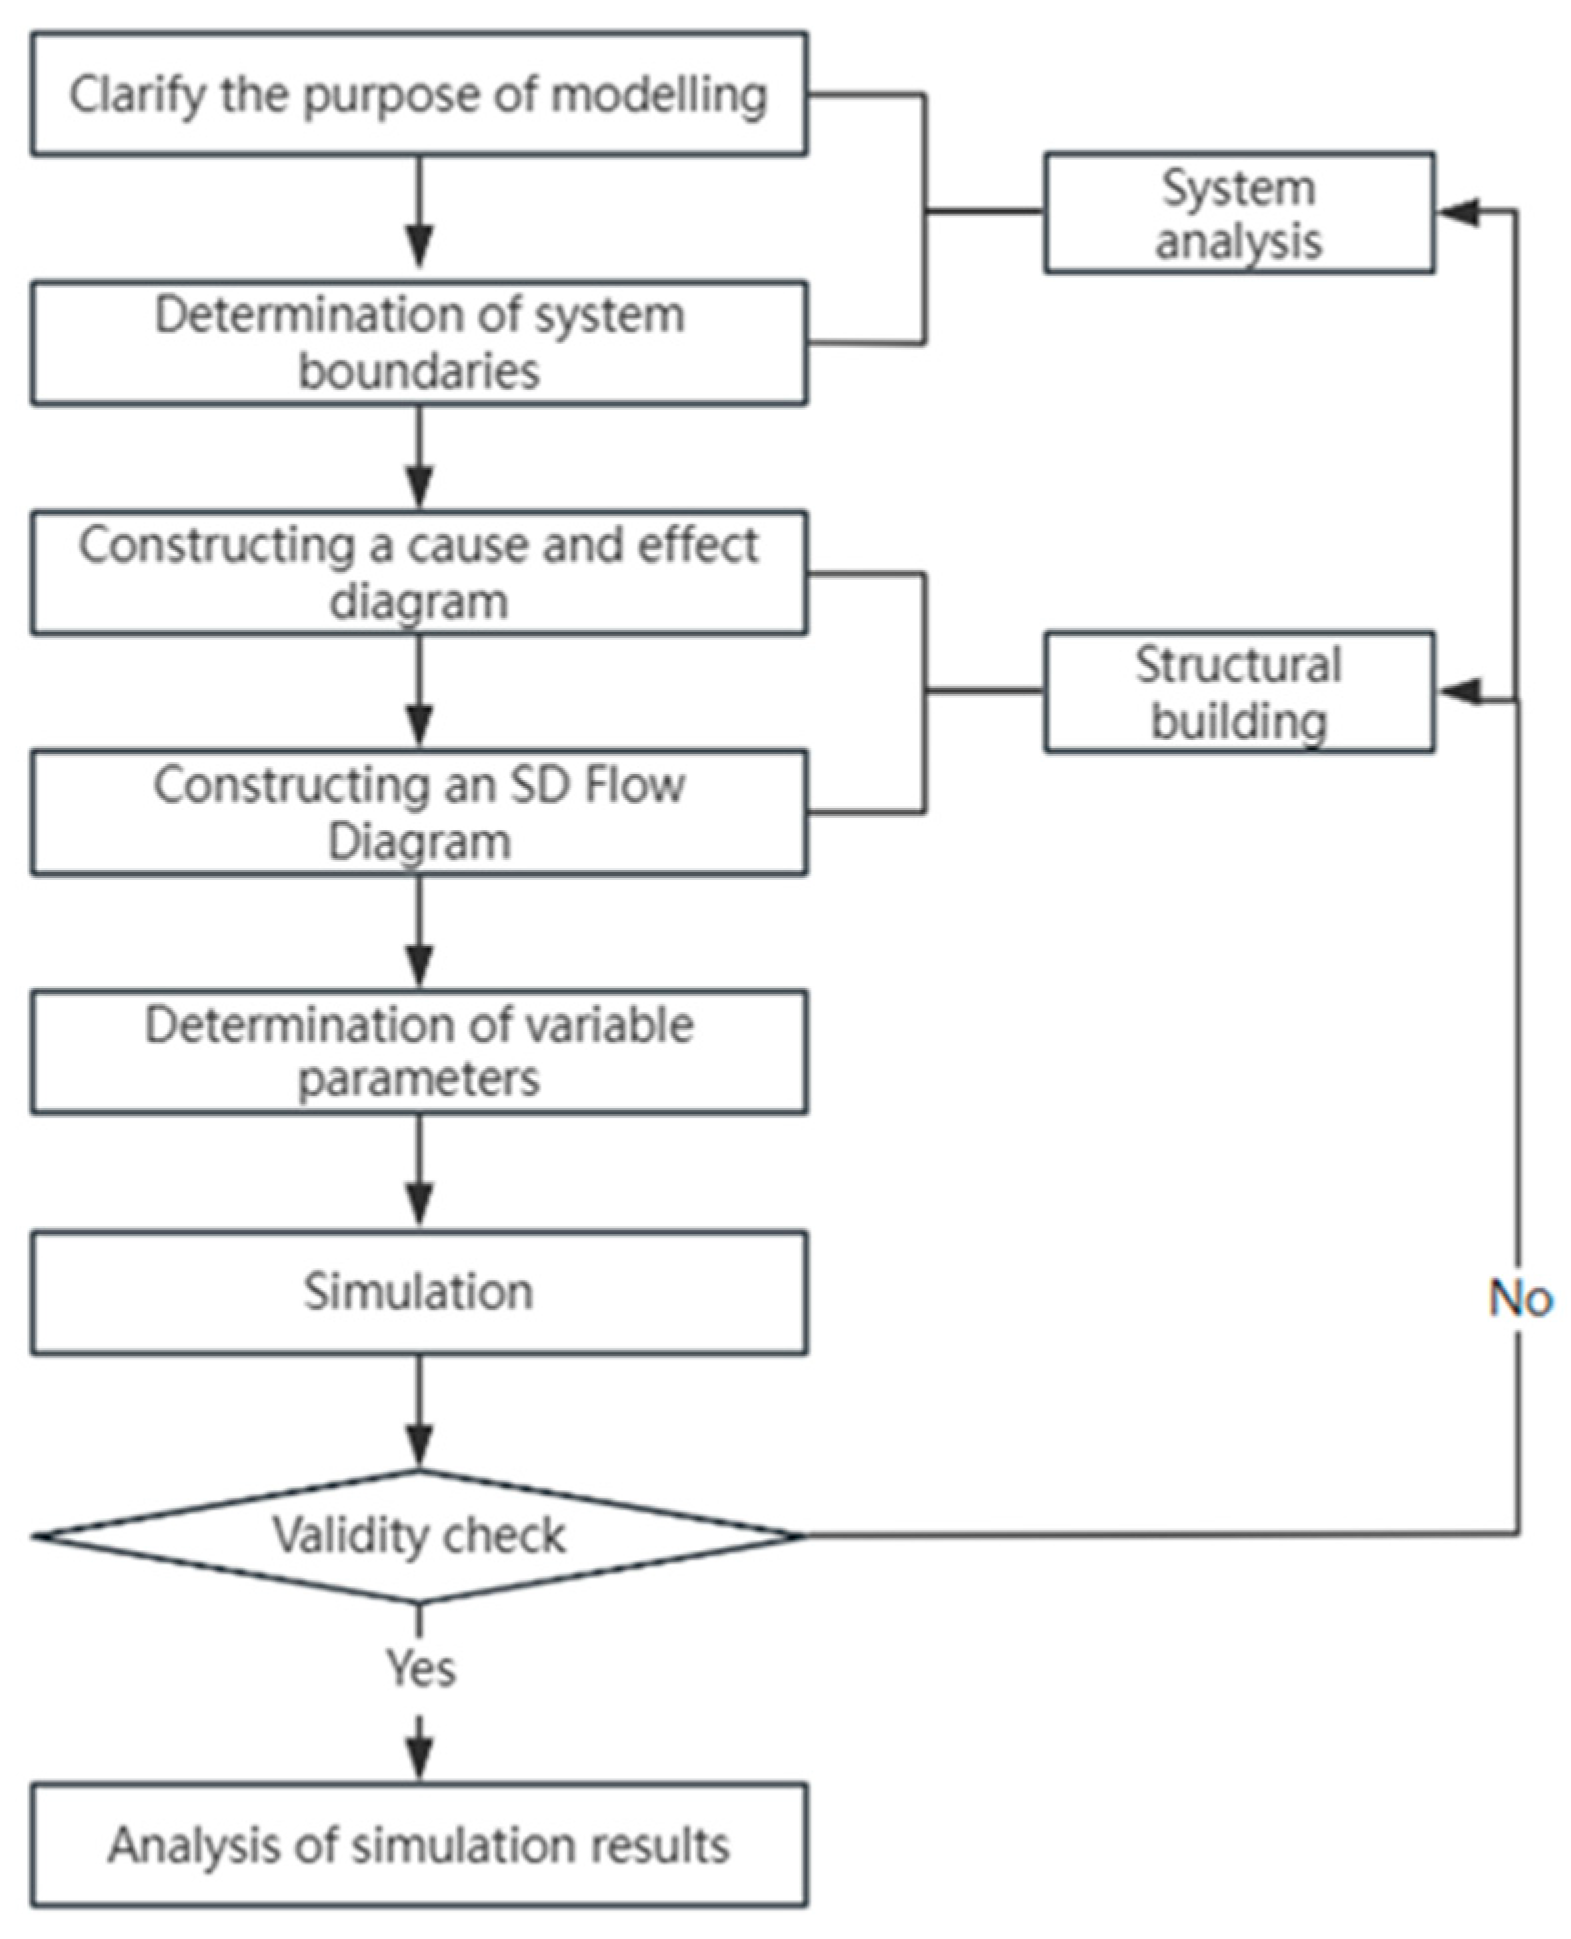
3. Research Methodology

Originally proposed by Professor J.W. Forrester of the Massachusetts Institute of Technology in the United States, system dynamics (SD) is a methodology for the systematic analysis of socio-economic problems, integrating both qualitative and quantitative methods of analysis [23]. System dynamics provides a rigorous approach to examining the effects of processes interacting with each other, rather than looking at factors in isolation [9]. Its distinctive feature is that it only studies the interactions of factors within the system and does not take into account the effects of disturbances or random events outside the system, and it is strongly practice-oriented [24].
Therefore, this paper adopts a system dynamics model that can deal with complex systems with feedback loops, delays and dynamically changing characteristics, reflect more comprehensively the multifactor interactions in the system, and study long-term and cyclical problems [25]. The idea of applying system dynamics can be divided into the following seven steps, as shown in Figure 1.

3.1. Determination of System

There are many driving factors affecting residents’ participation in future community building, and the system dynamics model is a complex and dynamic system, so when the system boundary changes, the variables included in the system change, and the model will change as well. Therefore, to make the system simulation results more relevant to reality, the boundary of the system needs to be defined based on the research problem before starting the system dynamics simulation [26]. In this paper, combining the conceptual connotation, structural relationship, and basic characteristics of the driving factors, the driving factors are defined as four types of attributes, namely, state variables, rate variables, auxiliary variables, and constants, and the specific definitions of the variables of the system are shown in Table 2.

3.2. Causality Analysis

Vensim PLE x64 software was used to draw a causality diagram of the driving factors of future community building from the perspective of resident participation, as shown in Figure 2. A causal diagram consists of the variables of a system and the feedback loops formed between them [27]. In the causality diagram, a positive feedback relationship means that an increase in one variable causes an increase in another variable associated with it, which is indicated by a ‘+’ arrow; the opposite is a negative feedback relationship, which is indicated by a ‘−’ arrow [28].
Loop 1 (positive feedback path): residents’ sense of belonging and participation in the community (+) → residents’ perception of future community building (+) → residents’ pursuit of community style (+) → residents’ sense of belonging and participation in the community (+).
This indicates that as residents’ sense of belonging and participation in the community increases, residents’ perception of future community construction also increases, which in turn causes residents to increase their pursuit of community style, ultimately leading to further enhancement of residents’ sense of belonging and participation in the community.
Loop 2 (positive feedback path): residents’ sense of belonging and participation in the community (+) → residents’ pursuit of community style (+) → future community greening rate (+) → future community decarbonization degree (+) → residents‘ environmental awareness (+) → residents’ sense of belonging and participation in the community (+).
This indicates that as the residents’ sense of belonging and participation in the community increases, the residents’ pursuit of community style will also increase, which in turn will affect the greening rate of the future community, and with the changes in the greening rate of the future community, the degree of low-carbonization of the future community will also change so that the residents’ awareness of environmental protection will be cultivated, and ultimately, the residents’ sense of belonging to the community and their participation in the community will be further strengthened.
Loop 3 (positive feedback path): residents’ sense of belonging and participation in the community (+) → residents’ demand for intelligent living (+) → degree of promotion of the 15 min community living circle (+) → residents’ sense of belonging and participation in the community (+).
This indicates that as residents’ sense of belonging and participation in the community increases, residents’ demand for intelligent living will expand, further affecting the degree of promotion of the 15 min community living circle, and ultimately, residents’ sense of belonging and participation in the community will be further enhanced.

3.3. SD Flow Diagram Model Construction

The causal loop diagram expresses the correlation and feedback process between system elements, and to further distinguish the nature of variables in the system, a system flow chart is needed to describe the process of system management and control. A flowchart is based on the causal diagram with more intuitive symbols to portray the logical relationship between the system elements to clarify the feedback mechanism and control law of the system [29]. Therefore, based on the above causality diagram, this paper constructs the SD flow diagram of future community building from the perspective of residents’ participation, as Figure 3 below shows.

3.4. Determination of Initial Values of SD Model Variables

For the model to be quantitatively analyzed, the initial values of the state variables, auxiliary variables, and constants involved in the model need to be assigned. Since there is less relevant literature on future community construction from a resident perspective and a lack of specific cases and data, in order to ensure the accuracy of the data, the residents of the future community were asked to rate the factors from 1 to 5, taking into account the problem that the basic units of the variables involved in the model are not uniform. The more commonly used extreme value method is adopted to carry out the dimensionless processing of the variables, and the range of the variables by the Formulae (1) and (2) is limited to between 0 and 1. A total of 156 valid questionnaires were collected to determine the initial values of the variables required in the system dynamics model. Stratified random sampling based on gender, age group, and geographic distribution (province) was used to ensure the representativeness and diversity of the sample. The population was divided into strata based on these categories, and participants were randomly selected from each stratum to ensure proportional representation. This method minimized selection bias and increased the generalizability of the findings. The sample information of the questionnaire is shown in Table 3. Initial values for specific variables are shown in Table 4.
Table 3. Description of the questionnaire sample.
Sample ItemsSample ClassificationSample SizeProportion of Samples
GenderMen8152%
Women7548%
Age18~30 years5837%
31~40 years4026%
41~50 years3623%
51~70 years2214%
ProvinceJiangsu6038%
Zhejiang7246%
Shanghai1812%
Fujian64%
Note: Participants were selected through stratified random sampling across gender, age, and province strata. Random selection within each stratum aimed to avoid bias related to pre-existing interest in community development.
M i = max x i j ,   m i = min x i j
X i j = x i j m j M j m j ,   x i j ϵ 0,1
In the above formula, M j is the highest value scored in the question item, and   m j is the lowest value scored in the question item.
Table 4. Initial Values of SD for Future Community Building from the Perspective of Residents’ Participation.
Nature of the VariableVariable NameSD Initial Value
State variableResidents’ sense of belonging and participation in the community (Z1)0.503
Degree of sophistication of population participation mechanisms (Z2)0.258
Degree of decarbonization of future communities (Z3)0.335
Extent of construction of community sponge facilities (Z4)0.326
Extent of development in TOD (Z5)0.252
Extent of promotion of 15 min community living circles (Z6)0.254
Degree of sophistication of community disaster warning and emergency response mechanisms (Z7)0.412
Extent of construction of community centers for the elderly (Z8)0.322
ConstantConstruction of intelligent security systems (C1)0.361
Construction of an intelligent telemedicine system (C2)0.346
Future community sharing project types (C3)0.318
Construction of community recreational facilities (C4)0.336
Construction of community shared gyms (C5)0.305

3.5. Establishment of Simulation Equations in System Dynamics Models

According to the system flow diagram and the meaning of each parameter, the equations of the future community building system dynamics model from the perspective of residents’ participation are listed, and the initial values of the state variable and the coefficients of the rate of change equations, as well as the fixed values of the auxiliary variables and the constants, are all taken from the results of the previous research and calculations, in which the initial values of the state variables, auxiliary variables, and constants are obtained by the calculation of the average value of the results of the questionnaire survey, and the auxiliary variables and the rate variables are taken from the comprehensive influence matrix G in DEMATEL-ISM. Influence coefficients are taken from the comprehensive influence matrix G in DEMATEL-ISM, as shown in Table 5.
The specific equations are shown in Table 6. Among them, residents’ sense of belonging and participation in the community will change over time, so this paper introduces TIME to construct its equation.

4. Results and Discussion

To discover the dynamics of the driving mechanism of future community building from the perspective of residents’ participation at a certain time in the future, a simulation was carried out using the Vensim PLE 10.2.1 software. In the model, INITIAL TIME = 0, FINIAL TIME = 12, TIME STEP = 1, Units for Time = Month; meanwhile, the system dynamics model is divided into five modules according to the first-level indexes, namely, humanistic module, ecological module, wisdom module, convenience module, and livability module, and different simulation schemes are designed based on each module. Based on each module, different simulation schemes are designed to analyze the effects of the drivers on residents’ participation in future community building in different stages from the time dimension by adjusting the input values of the drivers.

4.1. Simulation Analysis Based on Human Factors

In the human nature module, the input values of the three drivers, namely, residents‘ knowledge of future community construction, the degree of improvement of residents’ participation mechanism, and residents‘ pursuit of community style, were sequentially increased by 20% for simulation, and the effects of different drivers on residents’ participation in future community construction at different stages were observed, as shown in Figure 4 and Table 7.
As can be seen from Table 5 of the simulation results, the four factors of the human nature module exhibit varying degrees of influence on residents’ sense of belonging and participation across the 0–12-month period, with distinct phases of impact.
During the initial three months, the values for all four factors remain low. For instance, ‘20% Increase in Residents’ Perceptions of Future Community Building’ rises from 0.139 to 0.536, while the other factors show similarly minimal growth. These small absolute values indicate that none of the factors significantly drive residents’ engagement during this phase. From March to June, the effects intensify. ‘Perceptions of Future Community Building’ surges from 0.536 to 4.855, far outpacing ‘Sophistication of Participation Mechanisms’ (0.443 to 3.909) and ‘Residents’ Quest for Community Style’ (0.442 to 3.871). This aligns with the conclusion that residents’ knowledge of future community plans has the strongest motivational effect, followed by improvements in participation mechanisms and lastly by aesthetic preferences. Notably, the ‘Current’ scenario (closely tracking ‘Quest for Community Style’) lags behind, suggesting that proactive interventions in education and governance are more impactful than passive stylistic preferences. In the latter half of the year, exponential growth dominates. ‘Perceptions of Future Community Building’ skyrockets from 4.855 to 434.610, while ‘Sophistication of Participation Mechanisms’ rises from 3.909 to 308.304 and ‘Quest for Community Style’ from 3.871 to 294.432. Despite all factors showing dramatic increases, the widening gap between them underscores the sustained dominance of future-oriented knowledge. By month 12, the difference between the top factor (‘Perceptions’) and the lowest (‘Current’) exceeds 140 units, highlighting its unparalleled role in long-term engagement.
The simulation reveals a critical hierarchy: ** future community knowledge > participation mechanisms > community style preferences. While the aesthetic appeal and existing mechanisms passively motivate residents, proactive education about future plans acts as the primary catalyst for sustained belonging and participation. Over time, this factor’s exponential growth solidifies its centrality in driving community-building efforts.

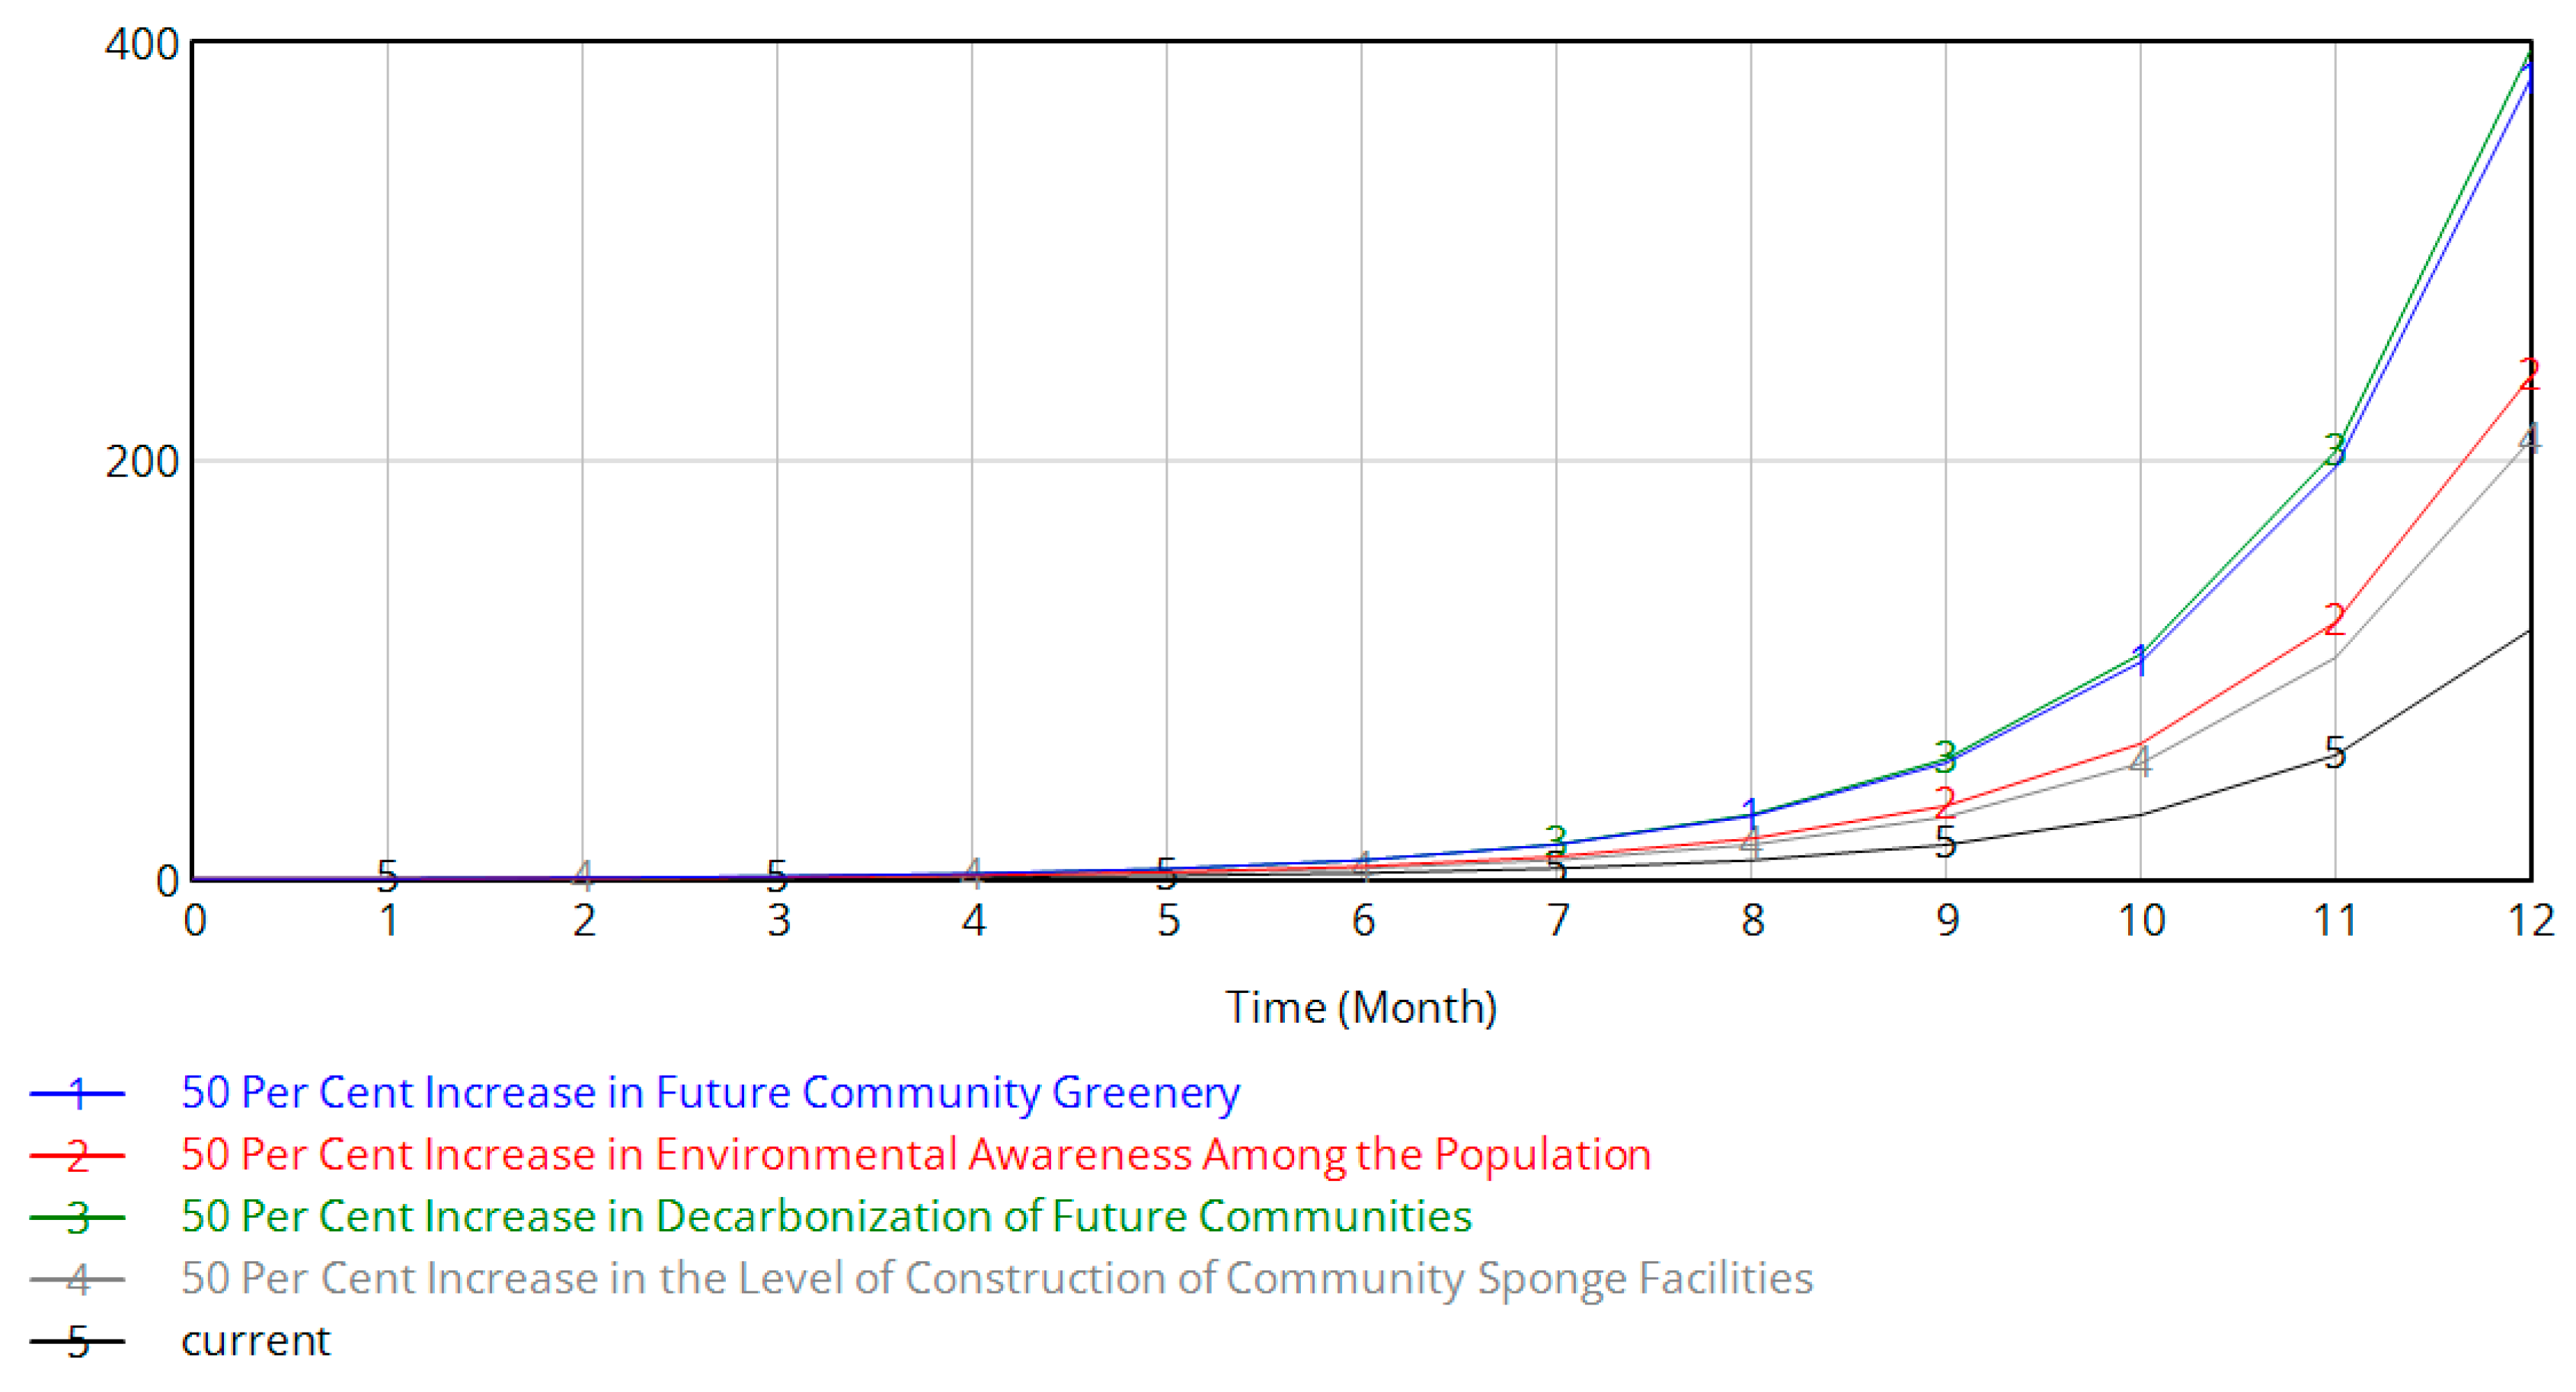
4.2. Simulation Analysis Based on Ecological Sex Factors

The input values of the greening rate of the future community, residents’ environmental awareness, the degree of decarbonization of the future community, and the degree of construction of sponge facilities in the future community were sequentially simulated by increasing the input values by 50% to obtain the effects of different ecological drivers on residents’ sense of participation and sense of belonging, as shown in Figure 5 and Table 8.
It can be seen that the greening rate of the future community increases because of its intuitive environmental improvement effect and its positive impact on the psychology of the overall effect on residents’ sense of belonging and participation. The second is residents’ environmental awareness, which provides the basic support for the ecological construction of the community. The degree of future community decarbonization and the degree of construction of community sponge facilities had relatively little direct effect on residents’ sense of belonging and participation in this period.

4.3. Simulation Analysis Based on Intelligence Factors

The input values of the construction of a smart security system, the arrangement of intelligent facilities, the residents’ demand for intelligent life, and the construction of an intelligent telemedicine system were simulated by increasing the input values by 20%, in turn, to obtain the effect of different smartness drivers on residents’ sense of participation and sense of belonging, as shown in Figure 6 and Table 9.
As can be seen from Table 7 of the simulation results for intelligence drivers, the five factors exhibit distinct trends in influencing residents’ engagement and adoption of smart community initiatives over the 0–12-month period. The analysis is structured as follows.
During the initial phase (0–3 months), all factors show moderate growth but remain at relatively low levels. From March to June, growth accelerates sharply. Here, residents’ demand for smart living emerges as the strongest driver, with security systems and infrastructure upgrades playing supportive roles. In the latter half, ‘Residents’ Demand for Smart Living’ skyrockets from 6.972 to 478.452, far surpassing other factors. ‘Intelligent Security Systems’ and ‘Smart Facilities Placement’ remain critical but secondary. ‘Smart Telemedicine Systems’ trails slightly, suggesting less prioritization compared with security and facilities. By month 12, the hierarchy of influence is clear: Residents’ Demand for Smart Living > Intelligent Security Systems > Smart Facilities Placement > Smart Telemedicine Systems.
The simulation underscores that residents’ intrinsic demand for smart living is the paramount driver of engagement, consistently outperforming infrastructure investments (security, facilities, telemedicine). While technological upgrades (e.g., security systems) amplify participation, they are most effective when aligned with residents’ evolving needs. Policymakers should prioritize demand-driven strategies—such as co-designing smart solutions with residents—to ensure sustained adoption and community integration. Additionally, telemedicine systems, though impactful, require targeted advocacy to match the prominence of security and lifestyle enhancements.

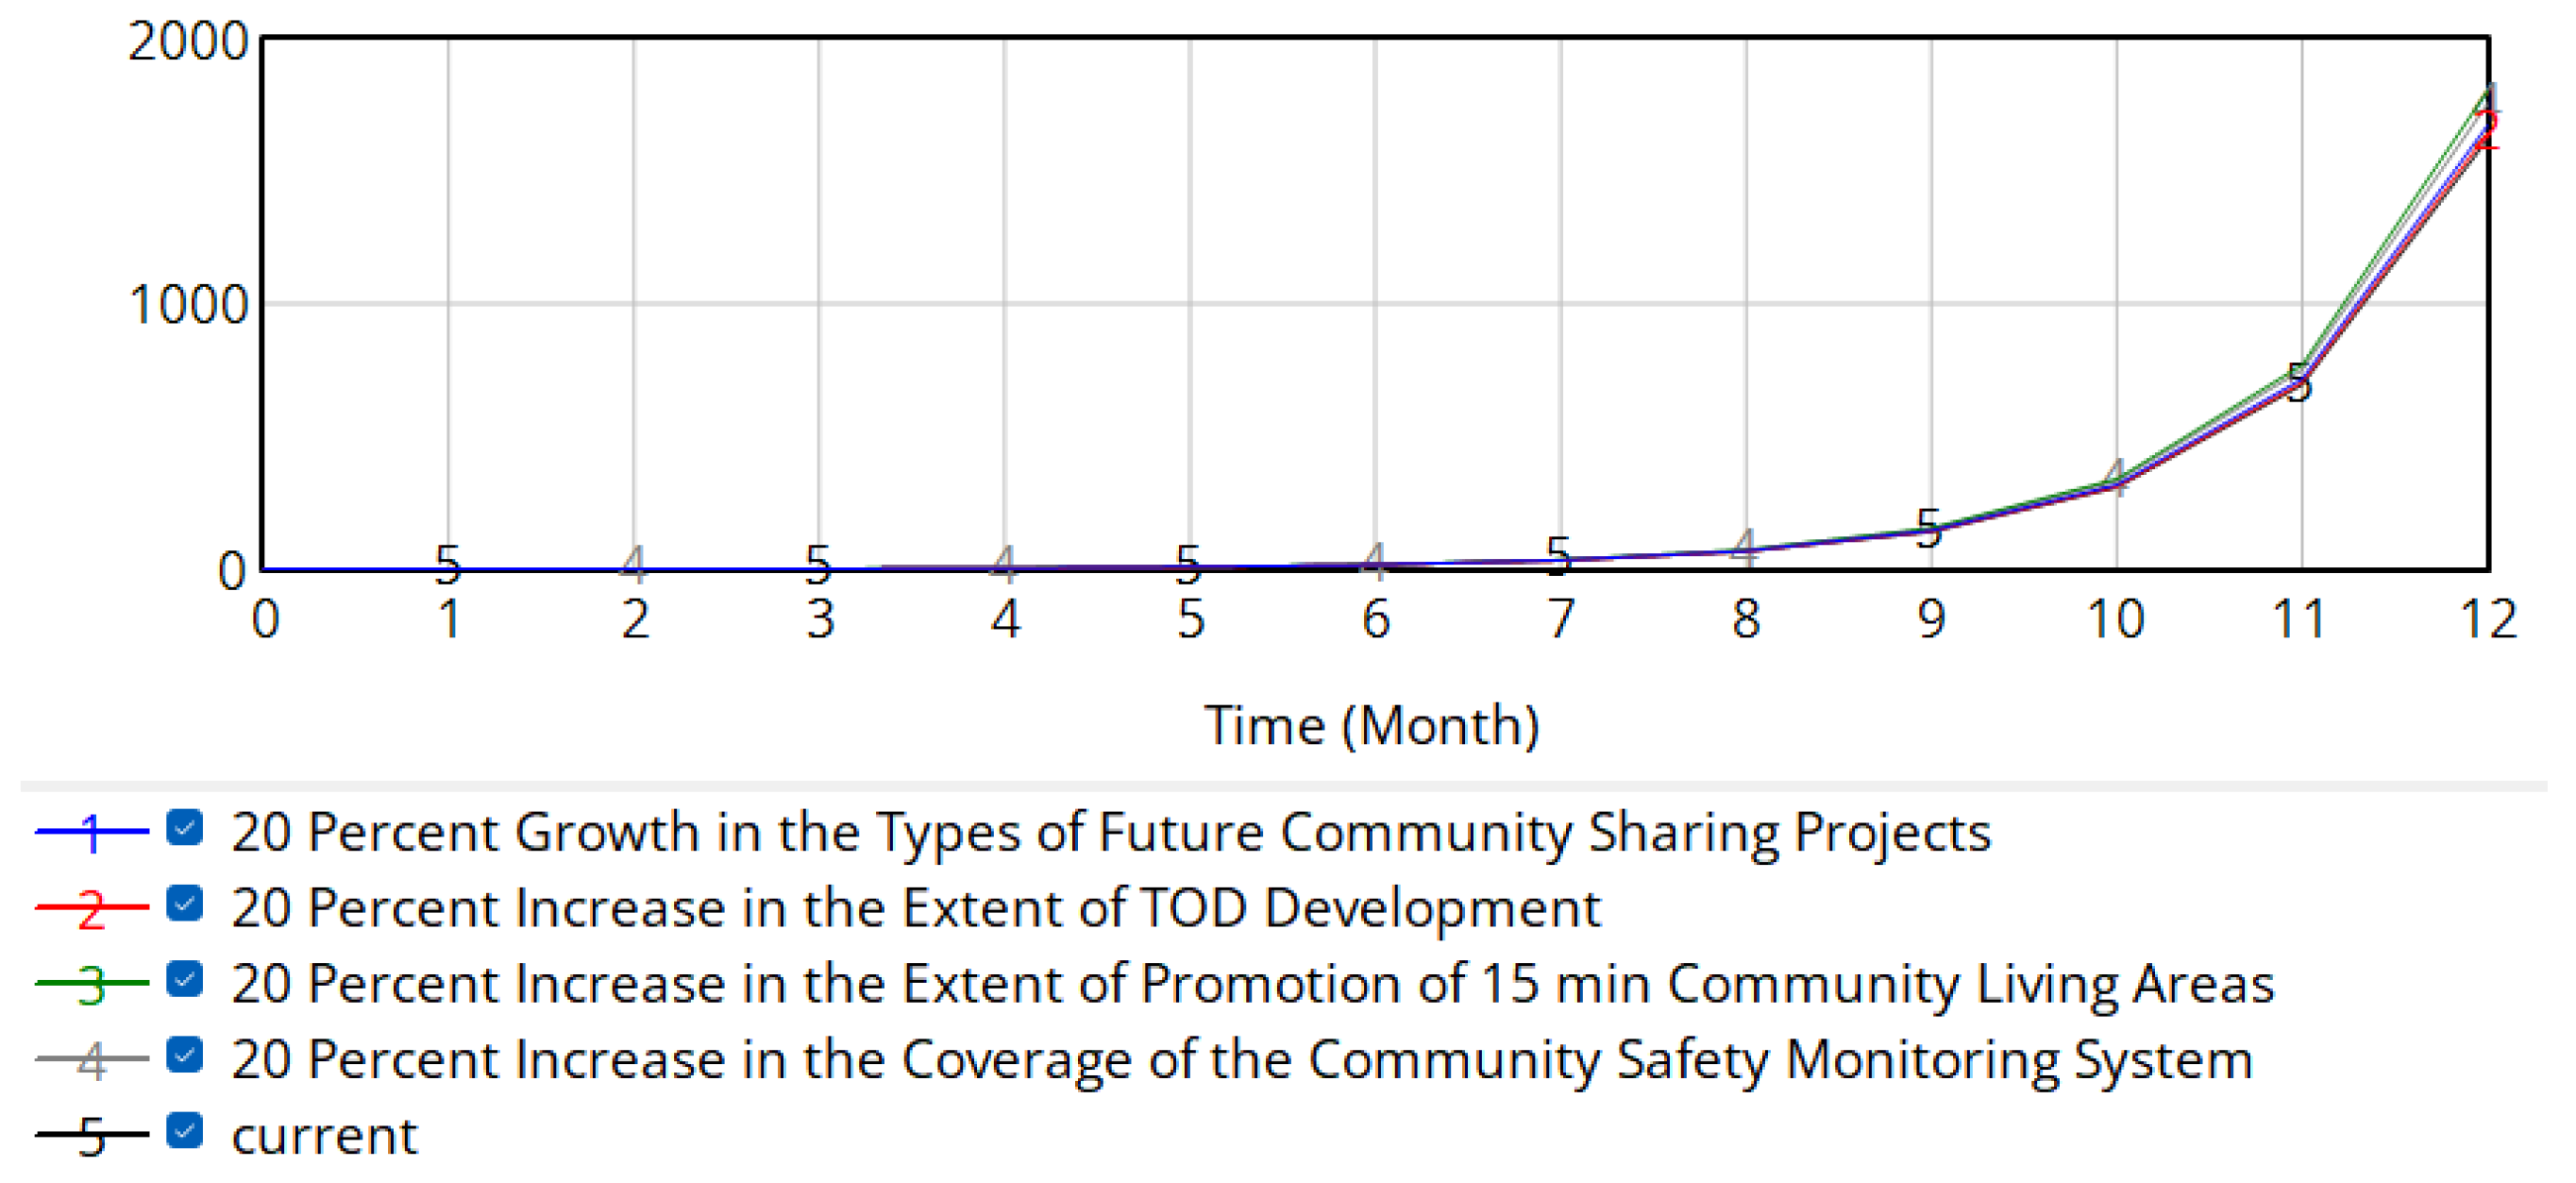
4.4. Simulation Analysis Based on the Convenience Module

The types of future community sharing projects, the degree of development of TOD, the degree of promotion of the 15 min community living circle, and the increase of 20% in the input value of the coverage of the community security monitoring system were simulated, in turn, to obtain the effects of different convenience drivers on the sense of participation and sense of belonging of the residents, as shown in Figure 7 and Table 10.
As can be seen from Table 8 of the simulation results for convenience drivers, the five factors exhibit distinct trends in influencing residents’ engagement and satisfaction with community convenience initiatives over the 0–12-month period. The analysis is structured as follows.
During the initial phase (0–3 months), all factors show gradual growth but remain at low levels. This indicates that early-stage convenience improvements are modest, with shared community projects and TOD development showing a marginally stronger influence than lifestyle and safety interventions. From March to June, growth accelerates significantly. Here, shared projects and TOD development emerge as primary drivers, reflecting residents’ prioritization of accessible infrastructure and collaborative initiatives. In the latter half (months 6–12), exponential growth dominates: ‘Future Community Sharing Projects’ skyrockets from 1.442 to 78.772, far surpassing other factors. ‘TOD Development’ (1.411 to 76.499) and ‘15 min Community Living Areas’ (1.214 to 68.865) remain critical but secondary. By month 12, the hierarchy of influence is clear: Future Community Sharing Projects > TOD Development > 15 min Community Living Areas > Safety Monitoring Systems.
The simulation underscores that shared community projects and TOD development are the most impactful drivers of convenience and resident engagement. These factors align with residents’ needs for accessible infrastructure and collaborative spaces, fostering a sense of ownership and participation. While safety systems and lifestyle enhancements contribute, their influence is secondary. Policymakers should prioritize co-creating shared community resources and expanding transit-oriented development to maximize convenience and long-term engagement. Additionally, integrating 15 min living areas and safety measures into broader planning frameworks can enhance holistic community satisfaction.

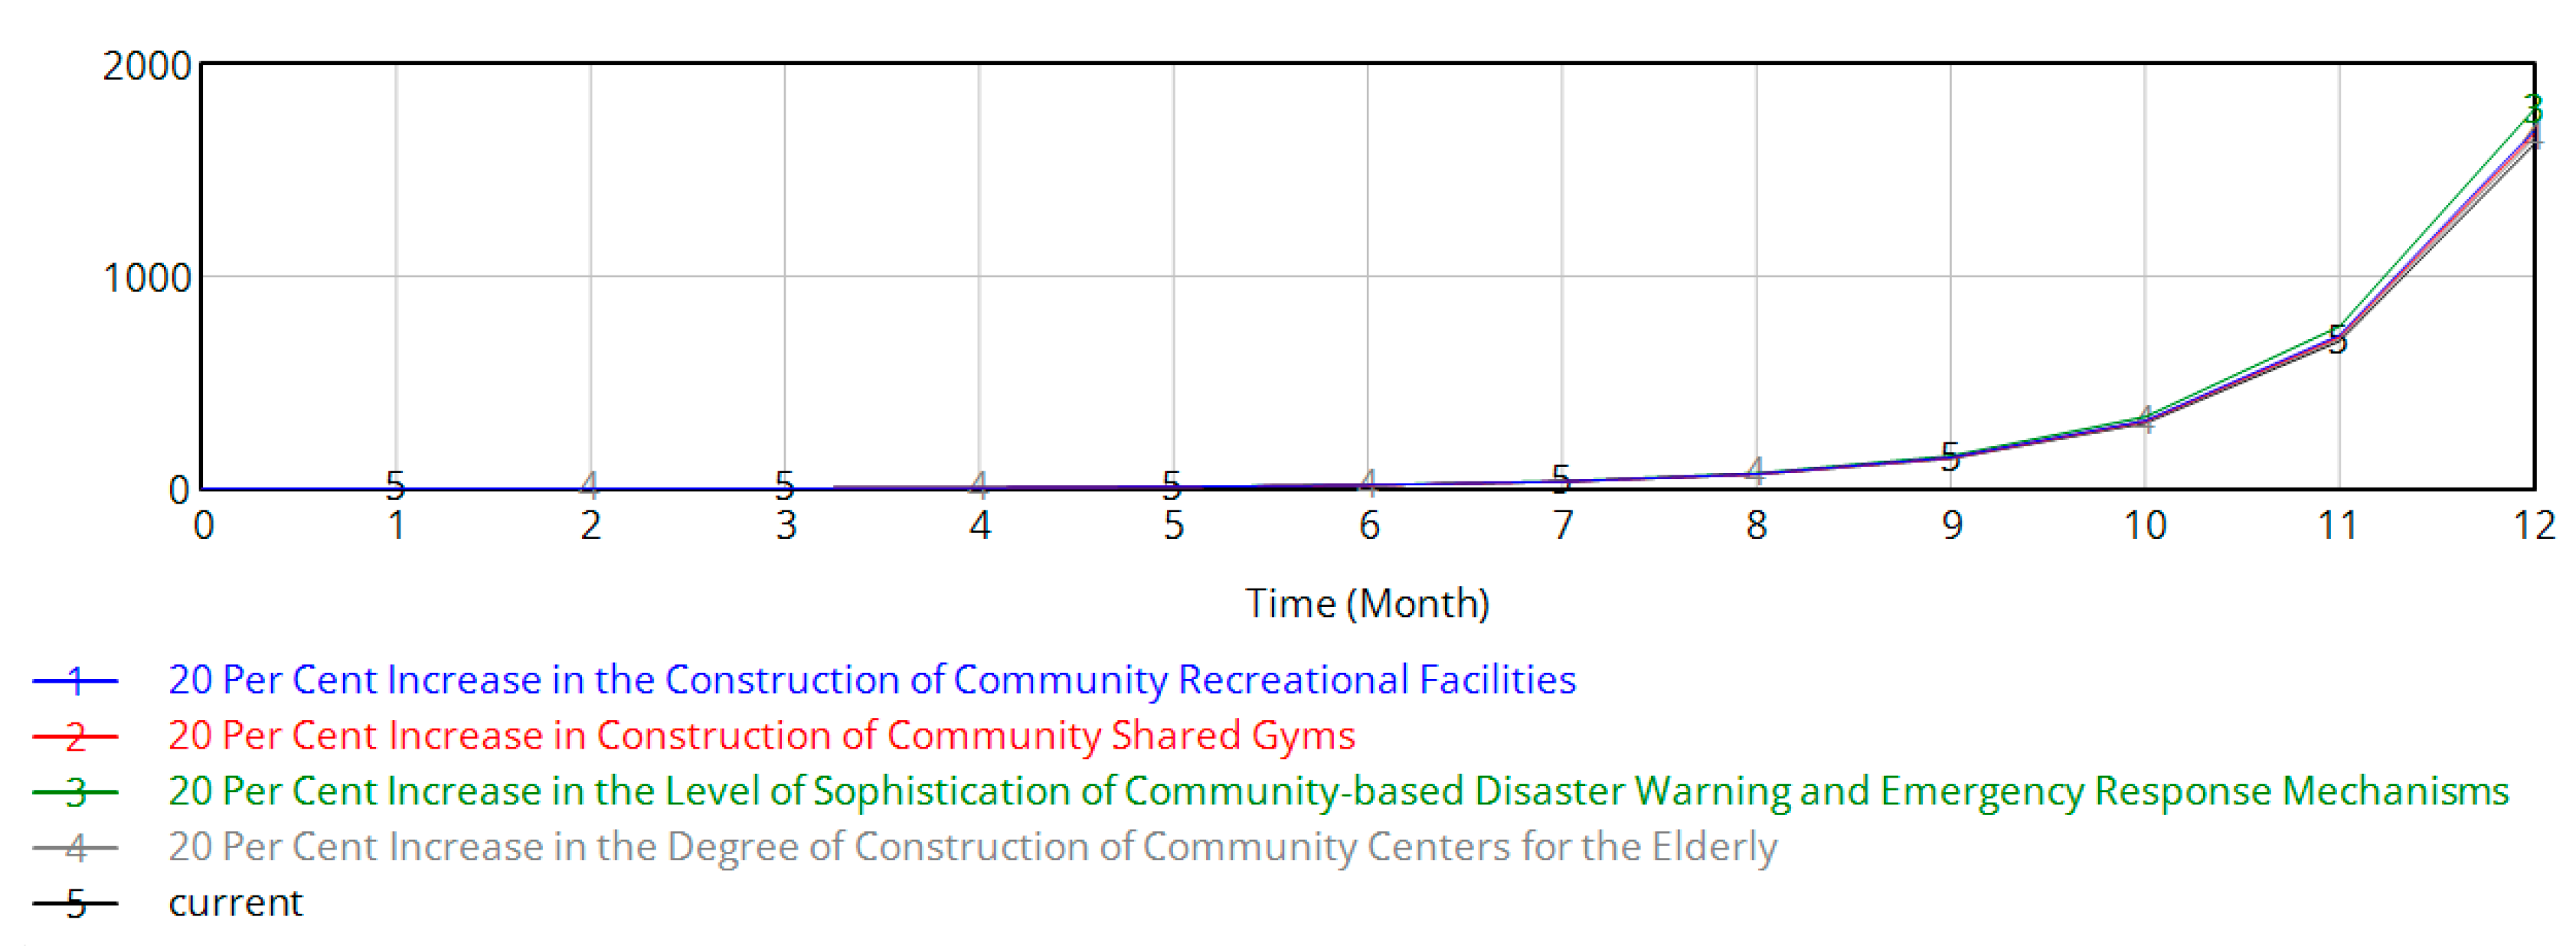
4.5. Simulation Analysis Based on the Livability Module

Sequentially, the input values of the construction of community recreational facilities, the construction of community shared built housing, the degree of improvement of community disaster warning and emergency response mechanisms, and the degree of construction of community elderly centers were simulated by increasing the input values by 20% to obtain the effects of different livability drivers on the residents’ sense of participation and sense of belonging, as shown in Figure 8 and Table 11.
As can be seen from Table 9 of the simulation results for livability drivers, the five factors exhibit distinct trends in influencing residents’ sense of belonging and participation over the 0–12-month period. The analysis is structured as follows.
During the initial phase (0–3 months), all factors show gradual growth but remain at low levels. This indicates that early-stage improvements in livability are modest, with disaster warning mechanisms showing marginally stronger influence, likely due to their direct impact on residents’ perceived safety and trust in community governance. From March to June, growth accelerates significantly. Here, safety-oriented initiatives (disaster warning) and recreational infrastructure emerge as primary drivers, reflecting residents’ prioritization of both security and quality of life enhancements. In the latter half (months 6–12), ‘Disaster Warning Mechanisms’ skyrockets from 4.548 to 338.363, far surpassing other factors. By month 12, the hierarchy of influence is clear: Disaster Warning Mechanisms > Recreational Facilities > Shared Gyms > Centers for the Elderly.
The simulation underscores that safety infrastructure (disaster warning mechanisms) and recreational facilities are the most impactful drivers of livability and resident engagement. These factors align with residents’ dual needs for security and enhanced daily life experiences, fostering trust and active participation.

5. Conclusions and Recommendations

5.1. Conclusions

In this paper, the system science theory is used as a guide to clarify the driving relationship between the elements within the system, the SD model of the driving mechanism is drawn using Vensim PLE software to quantify the role of the relationship between the variables therein, and the model is simulated for simulation studies. The main conclusions are as follows:
(1)
Identified driving factors for future community building from the perspective of residents
On the basis of relevant studies at home and abroad, this thesis combines questionnaire surveys and expert interviews to identify the driving factors of future community construction from the perspective of residents’ participation and identifies 20 driving factors from five levels: human nature, ecology, intelligence, convenience, and livability.
(2)
Based on the dynamic perspective, key factors at different stages of the future community are screened out
Based on the system dynamics analysis, this study clarifies the dynamic influence of driving factors on residents’ sense of belonging and participation across different timeframes. Four key factors are highlighted: Residents’ perceptions of the future of community building dominate in the mid to late teens. Residents’ demand for smart living is a core driver in both the pre and post period. The promotion of 15 min community living circles is crucial in the mid-to-late stages. Improving community-based disaster early warning and response mechanisms has important implications at all stages.

5.2. Recommendations

Based on the above findings, the following recommendations are made:
(1)
Strengthen publicity and education to raise residents’ awareness of future communities. Implement multichannel publicity, using a variety of channels such as community bulletin boards, WeChat public numbers, short video platforms, and community broadcasts to regularly release the concept, planning, progress, and expected results of the construction of the future community, ensuring that the information covers a wide range of topics. Hold lectures and seminars, inviting experts and scholars to organize thematic lectures to explain concepts in depth, as well as the advantages and successful cases at home and abroad of the community of the future, to enhance residents’ understanding and interest. Distribute publicity materials, producing exquisite brochures and posters detailing the characteristics of the future community, its design concepts, and how residents will benefit from it to make it easy for residents to refer to them at any time.
(2)
Focusing on diversified participation, actively promote 15 min community living circles. Activating community space resources using ‘space for resources’ and ‘one-dollar rent’, stimulating the motivation of talent services using ‘points bank’, and stimulating intrinsic vitality for the construction of the 15 min community happy living circle’ using innovative participation of social subjects. Through innovative ways of social participation, the path of social participation has been opened up to stimulate internal vitality for the construction of the ’15 min community happy living circle’. Ensure the visual presentation of community resources by drawing maps together. Taking the Community Neighborhood Festival, the Wave of Social Creation, and the ‘City View—Painting’ Planning and Design Festival as opportunities, we carried out activities such as ‘Citywalk’, community roaming, and social creation salons and mobilized residents to draw hand-drawn maps of their resources to make them aware of the community’s resources in a single map. Relying on the community channel, we launched the ’15 min community living circle digital map’ to promote the comprehensive presentation of service resources for party groups, government affairs, and life.
(3)
Contribute to the building of security and improving community disaster warning and emergency response mechanisms. Through multichannel dissemination, ensure that early warning information can be quickly communicated to community residents through a variety of channels, including radio, television, mobile phone text messages, social media, and community bulletin boards. Regularly organize community residents to participate in emergency drills to simulate the emergency response process of evacuation, rescue, and resettlement under different disaster scenarios. Through these drills, residents’ awareness of disaster prevention and mitigation and their ability to save themselves and each other are raised. According to the actual situation of the community, develop a detailed and operable emergency plan. Clarify the responsibilities of organizations at all levels, the emergency response process, the deployment of rescue forces, the stockpiling and distribution of materials, the resettlement and relief of disaster victims, and other key aspects.
(4)
In-depth community building to respond to residents’ needs for intelligent living. Promote smart home products and encourage and support the research, development, and innovation of smart home products, such as smart door locks, smart lighting, and smart home appliances, to improve the convenience and comfort of residents’ lives. Construct smart security systems, using face recognition, video surveillance, and other technologies to enhance community safety. Promote applications such as smart parking and smart rubbish classification to solve pain points in community management. Establish a community service platform to integrate community resources and provide convenient online services, such as online medical care, online education, and community shopping.
In conclusion, this thesis researches future community construction from the perspective of resident participation, which helps smoothly promote future community construction, and at the same time, it can better satisfy residents’ needs for future community construction.

Author Contributions

Writing—original draft, L.Z., Y.X., X.L., S.Y. and L.L. All authors have read and agreed to the published version of the manuscript.

Funding

This research was funded by the Project of Jiangsu Provincial Department of Housing and Construction, grant number 2018ZD165, and the National Natural Science Foundation of China, grant number 72201188.

Data Availability Statement

Data are contained within the article.

Conflicts of Interest

The authors declare no conflicts of interest.

Abbreviations

The following abbreviations are used in this manuscript:
SDSystem Dynamics

References

  1. Zhang, W.; Pan, H. From ‘Station City’ to ‘Station Society’: Design Strategies for Orbital TOD Development in Future Communities—Taking Ningbo as an Example. Urban Dev. Res. 2024, 31, 73–80. [Google Scholar]
  2. Tian, Y. Several Theoretical Problems of “Future Community” Construction. Soc. Sci. Res. 2020, 2, 8–15. [Google Scholar]
  3. Drucker, P. Future Community; China Renmin University Press: Beijing, China, 2006. [Google Scholar]
  4. Fidler, R. Media Form Change: Understanding New Media; Huaxia Publishing House: Beijing, China, 2000. [Google Scholar]
  5. Cervero, R.; Sullivan, C. Green TODs: Marrying transit-oriented development and green urbanism. Int. J. Sustain. Dev. World Ecol. 2011, 18, 210–218. [Google Scholar]
  6. Dong, W.; Lin, L. Evaluating the Whole-Process Management of Future Communities Based on Integrated Fuzzy Decision Methods. Sustainability 2023, 15, 16306. [Google Scholar] [CrossRef]
  7. Johansen, C.; Horney, J.; Tien, I. Metrics for Evaluating and Improving Community Resilience. J. Infrastruct. Syst. 2017, 23, 04016032. [Google Scholar]
  8. Mcnaughton, M.; Rao, L.; Verma, S. Building smart communities for sustainable development. Worldw. Hosp. Tour. Themes 2020, 12, 337–352. [Google Scholar] [CrossRef]
  9. Wu, G.; Duan, K.; Zuo, J.; Yang, J.; Wen, S. System Dynamics Model and Simulation of Employee Work-Family Conflict in the Construction Industry. Int. J. Environ. Res. Public Health 2016, 13, 1059. [Google Scholar] [CrossRef]
  10. Zhang, Y. Research on the Optimization of Seven-Color Future Community Governance System in Xiaoshan District, Hangzhou City. Master’s Thesis, Zhejiang University of Traditional Chinese Medicine, Hangzhou, China, 2023. [Google Scholar]
  11. Wang, S.; Xue, J. Construction of healing landscape space model based on future community health scenario. Urban Dev. Res. 2022, 29, 118–126. [Google Scholar]
  12. Yu, S. The Value, Limits and Progress of Multi-Domain Collaborative Governance in Future Communities—The Case of S Future Community in Hangzhou F District. J. Party Sch. Harbin Munic. Party Comm. 2023, 6, 57–63. [Google Scholar]
  13. Liu, Y. Digital twin empowers the thinking of future community construction and operation and maintenance. Railw. Constr. Technol. 2024, 01, 1–5. [Google Scholar]
  14. Song, B.; Yang, P.; Shen, J.; Li, J.; Yang, M.; Li, Q. Urban regeneration and future communities—Humanistic, ecological and digital. Constr. Sci. Technol. 2022, 13, 35–39+43. [Google Scholar]
  15. Chai, X.; Xu, C.; Jin, L.; Shen, J.; Hong, Y. Countermeasure suggestions on several major issues of future community construction in Zhejiang. Decis.-Mak. Consult. 2019, 03, 65–67. [Google Scholar]
  16. Rao, G. Value and action path of future community education scenario construction based on multiple theory coupling. Vocat. Educ. Forum 2024, 40, 93–99. [Google Scholar]
  17. Xiang, Z. Thinking and exploring the construction of future community scenarios—Taking Songyang Jiangnan future community implementation programme as an example. World Archit. 2022, S1, 70–73. [Google Scholar]
  18. Yan, H. A preliminary study on the dilemma and optimization path of urban future community digital governance under the background of digital reform. China Manag. Informatisation 2024, 27, 168–171. [Google Scholar]
  19. Chen, W.; Liang, S. Logical Interpretation and Development Path of Future Community Scene Construction—A Study Based on Spatial Production Theory. J. Hubei Second Norm. Coll. 2023, 40, 58–62. [Google Scholar]
  20. Li, W.; Li, Q.; Jia, L.; Hou, D.; Wang, S.; Liu, Y. Resilience Regeneration Priorities for Old Blocks Based on Public Satisfaction: A Case Study of Beijing, China. Buildings 2025, 15, 536. [Google Scholar] [CrossRef]
  21. Shi, S.; Guan, Y. Construction of evaluation index system for upgrading old communities under the concept of future community. Urban Dev. Res. 2024, 31, 134–140. [Google Scholar]
  22. Zhuang, J. Research on the Influencing Factors of Residents’ Participation in Community Governance in Demolition and Resettlement Communities. Master’s Thesis, Northwest University for Nationalities, Lanzhou, China, 2023. [Google Scholar]
  23. Liu, W.; Liu, Z. Simulation Analysis of Supply Chain Resilience of Prefabricated Building Projects Based on System Dynamics. Buildings 2023, 13, 2629. [Google Scholar] [CrossRef]
  24. Duan, Z.; Ai, J.; Qin, Q. Dilemmas, Problems and Future of System Dynamics Methodology in Systems Theory—A Critical Perspective Based on Classical Qualitative and Quantitative Methods. J. Syst. Sci. 2022, 30, 30–34. [Google Scholar]
  25. Gao, J.; Yang, W.; Shan, X.; Yu, K.; Zhang, Y. An Intervention Study of Employee Safety Behavior in Nuclear Power Plants Under Construction Based on the SEM-SD Model. Buildings 2025, 15, 954. [Google Scholar] [CrossRef]
  26. Ye, Z. Research on the Driving Mechanism of Value Co-creation of Residents’ Participation in Smart Community Service Platform. Master’s Thesis, China University of Mining and Technology, Xuzhou, China, 2022. [Google Scholar]
  27. Luo, J. System Dynamics-Based Simulation Analysis of the Policy of the Prefabricated Building Industry Chain. Tech. Gaz./Teh. Vjesn. 2024, 31, 982–992. [Google Scholar]
  28. Xiong, C.; Wang, Y. Driving mechanism of rural digital governance: Model construction and simulation. Chongqing Soc. Sci. 2024, 4, 6–25. [Google Scholar]
  29. Lu, X.; Sui, L.; Guo, L.; Wu, C. A systematic simulation study on the driving mechanism of rural tourism development--taking Dalian City as an example. Syst. Eng. 2017, 35, 121–129. [Google Scholar]
Figure 1. System dynamics application.
Buildings 15 01203 g001
Figure 2. Causality diagram.
Buildings 15 01203 g002
Figure 3. SD flow diagram.
Buildings 15 01203 g003
Figure 4. Effectiveness of personality drivers on residents’ sense of belonging and participation in the community.
Buildings 15 01203 g004
Figure 5. The effect of ecological drivers on residents’ sense of belonging and participation in the community.
Buildings 15 01203 g005
Figure 6. Effect of intelligence drivers on residents’ sense of belonging and participation in the community.
Buildings 15 01203 g006
Figure 7. Effect of convenience drivers on residents’ sense of belonging and engagement in the community.
Buildings 15 01203 g007
Figure 8. Effect of livability drivers on residents’ sense of belonging and participation in the community.
Buildings 15 01203 g008
Table 1. Drivers of Future Community Building from the Perspective of Resident Participation.
Target LevelLevel 1 IndicatorsSecondary Indicators
Resident participation in future community building driversHuman nature AResidents’ sense of belonging and participation in the community A1
Residents’ perceptions of future community building A2
Degree of sophistication of population participation mechanisms A3
Residents’ quest for a future community look A4
Ecological BFuture community greening rate B1
Environmental awareness of residents B2
Degree of decarbonization of future communities B3
Extent of construction of community sponge facilities B4
Intelligence CConstruction of intelligent security systems C1
Arrangement of intelligent facilities C2
Residents’ demand for intelligent living C3
Construction of an intelligent telemedicine system C4
Convenience DFuture community sharing project Types D1
Degree of development of transit-oriented development (TOD) D2
Extent of promotion of 15 min community living circles D3
Community security surveillance system coverage D4
Livability EConstruction of community recreational facilities E1
Construction of community shared gyms E2
Degree of sophistication of community disaster warning and emergency response mechanisms E3
Extent of construction of community centers for the elderly E4
Table 2. System Variables Defined.
Variable CategoryNumber of IndividualsVariable Name
State variable8Residents’ sense of belonging and participation in the community (Z1)
Degree of sophistication of population participation mechanisms (Z2)
Degree of decarbonization of future communities (Z3)
Extent of construction of community sponge facilities (Z4)
Extent of development in TOD (Z5)
Extent of promotion of 15 min community living circles (Z6)
Degree of sophistication of community disaster warning and emergency response mechanisms (Z7)
Extent of construction of community centers for the elderly (Z8)
Rate variable8Increase in residents’ sense of belonging and participation in the community (SZ1)
Incremental improvement of population participation mechanisms (SZ2)
Incremental decarbonization of future communities (SZ3)
Incremental increase in the degree of construction of community sponge facilities (SZ4)
Incremental degree of development for TOD (SZ5)
Incremental degree of promotion of 15 min community living area (SZ6)
Increment in the degree of improvement of community-based disaster warning and emergency response mechanisms (SZ7)
Increase in the degree of construction of community centers for the elderly (SZ8)
Auxiliary variable7Residents’ perceptions of future community building (F1)
Residents’ quest for community style (F2)
Environmental awareness of residents (F3)
Residents’ demand for intelligent living (F4)
Future community greening rate (F5)
Community security surveillance system coverage (F6)
Arrangement of intelligent facilities (F7)
Constant5Construction of intelligent security systems (C1)
Construction of an intelligent telemedicine system (C2)
Future community sharing project types (C3)
Construction of community recreational facilities (C4)
Construction of community shared gyms (C5)
State variables: represent accumulative factors. Rate variables: reflect incremental change mechanisms. Auxiliary variables: intermediate factors influenced by states/rates. Constants: fixed parameters.
Table 5. Integrated impact matrix G.
ConsiderationsA1A2A3A4B1B2B3B4C1C2C3C4D1D2D3D4E1E2E3E4
A10.20 0.23 0.16 0.23 0.07 0.02 0.07 0.07 0.01 0.05 0.24 0.04 0.01 0.04 0.04 0.02 0.08 0.03 0.01 0.00
A20.36 0.07 0.11 0.28 0.08 0.02 0.09 0.08 0.00 0.02 0.07 0.01 0.00 0.01 0.01 0.01 0.02 0.01 0.00 0.00
A30.30 0.06 0.04 0.06 0.02 0.00 0.02 0.02 0.00 0.01 0.06 0.01 0.00 0.01 0.01 0.00 0.02 0.01 0.00 0.00
A40.22 0.04 0.03 0.19 0.34 0.09 0.37 0.33 0.00 0.01 0.04 0.01 0.00 0.01 0.01 0.00 0.01 0.01 0.00 0.00
B10.06 0.01 0.01 0.15 0.08 0.13 0.36 0.23 0.00 0.00 0.01 0.00 0.00 0.00 0.00 0.00 0.00 0.00 0.00 0.00
B20.11 0.02 0.01 0.36 0.14 0.08 0.42 0.34 0.00 0.00 0.02 0.00 0.00 0.00 0.00 0.00 0.01 0.00 0.00 0.00
B30.16 0.03 0.02 0.34 0.23 0.18 0.20 0.28 0.00 0.01 0.03 0.01 0.00 0.01 0.00 0.00 0.01 0.00 0.00 0.00
B40.14 0.03 0.02 0.30 0.11 0.11 0.25 0.12 0.00 0.01 0.03 0.01 0.00 0.01 0.00 0.00 0.01 0.00 0.00 0.00
C10.12 0.02 0.02 0.06 0.02 0.01 0.02 0.02 0.07 0.26 0.30 0.06 0.01 0.06 0.04 0.29 0.01 0.04 0.27 0.00
C20.21 0.04 0.03 0.19 0.06 0.01 0.06 0.05 0.27 0.07 0.11 0.02 0.00 0.02 0.01 0.07 0.01 0.02 0.07 0.00
C30.34 0.06 0.05 0.11 0.03 0.01 0.04 0.03 0.06 0.24 0.12 0.21 0.03 0.21 0.14 0.09 0.02 0.16 0.03 0.02
C40.20 0.04 0.03 0.04 0.01 0.00 0.01 0.01 0.00 0.01 0.04 0.01 0.02 0.01 0.20 0.00 0.01 0.03 0.00 0.03
D10.27 0.05 0.04 0.11 0.04 0.08 0.05 0.05 0.05 0.21 0.07 0.08 0.02 0.01 0.23 0.02 0.14 0.04 0.01 0.03
D20.06 0.01 0.01 0.03 0.01 0.00 0.01 0.01 0.02 0.10 0.15 0.03 0.00 0.03 0.02 0.02 0.00 0.02 0.01 0.00
D30.27 0.05 0.04 0.07 0.02 0.01 0.02 0.02 0.01 0.03 0.05 0.02 0.08 0.01 0.04 0.01 0.03 0.14 0.00 0.13
D40.06 0.01 0.01 0.02 0.01 0.00 0.01 0.01 0.01 0.04 0.19 0.04 0.00 0.03 0.02 0.08 0.00 0.03 0.27 0.00
E10.05 0.01 0.01 0.08 0.02 0.01 0.03 0.02 0.00 0.00 0.01 0.00 0.01 0.00 0.13 0.00 0.00 0.02 0.00 0.02
E20.08 0.02 0.01 0.10 0.03 0.02 0.03 0.03 0.01 0.03 0.02 0.01 0.14 0.00 0.16 0.00 0.02 0.02 0.00 0.02
E30.06 0.01 0.01 0.02 0.01 0.00 0.01 0.01 0.01 0.04 0.19 0.04 0.00 0.03 0.02 0.28 0.00 0.03 0.07 0.00
E40.15 0.03 0.02 0.03 0.01 0.00 0.01 0.01 0.00 0.01 0.03 0.01 0.00 0.01 0.00 0.00 0.01 0.00 0.00 0.00
Table 6. System Model Equation Establishment.
Nature of the VariableVariable NameVariational Equation
State variableResidents’ sense of belonging and participation in the community (Z1)Residents’ sense of belonging and participation in the community = INTEG (increase in residents’ sense of belonging and participation in the community, Z1)
Degree of sophistication of population participation mechanisms (Z2)Degree of sophistication of population participation mechanisms = INTEG (incremental improvement of population participation mechanisms, Z2)
Degree of decarbonization of future communities (Z3)Degree of decarbonization of future communities = INTEG (incremental decarbonization of future communities, Z3)
Extent of construction of community sponge facilities (Z4)Extent of construction of community sponge facilities = INTEG (incremental increase in the degree of construction of community sponge facilities, Z4)
Extent of development in TOD (Z5)Extent of development in TOD = INTEG (incremental degree of development for TOD, Z5)
Extent of promotion of 15 min community living circles (Z6)Extent of promotion of 15 min community living circles = INTEG (incremental degree of promotion of 15 min community living area, Z6)
Degree of sophistication of community disaster warning and emergency response mechanisms (Z7)Degree of sophistication of community disaster warning and emergency response mechanisms = INTEG (increment in the degree of improvement of community-based disaster warning and emergency response mechanisms, Z7)
Extent of construction of community centers for the elderly (Z8)Extent of construction of community centers for the elderly = INTEG (increase in the degree of construction of community centers for the elderly, Z8)
Rate variableIncrease in residents’ sense of belonging and participation in the community (SZ1)SZ1 = (F1 × 0.193 + Z2 × 0.064 + Z6 × 0.160 + C3 × 0.144 + F4 × 0.144 + F7 × 0.182 + Z8 × 0.112) * TIME
Incremental improvement of population participation mechanisms (SZ2)SZ2 = Z1 × 0.160
Incremental decarbonization of future communities (SZ3)SZ3 = F5 × 0.350 + Z4 × 0.243 + F3 × 0.408
Incremental increase in the degree of construction of community sponge facilities (SZ4)SZ4 = F5 × 0.274 + Z4 × 0.333 + F3 × 0.393
Incremental degree of development for TOD (SZ5)SZ5 = F4 × 0.210
Incremental degree of promotion of 15 min community living area (SZ6)SZ6 = C3 × 0.267 + F4 × 0.163 + C2 × 0.233 + C4 × 0.151 + C5 × 0.186
Increment in the degree of improvement of community-based disaster warning and emergency response mechanisms (SZ7)SZ7 = C1 × 0.500 + F6 × 0.500
Increase in the degree of construction of community centers for the elderly (SZ8)SZ8 = Z6 × 0.130
Auxiliary variableResidents’ perceptions of future community building (F1)F1 = Z1 × 0.230
Residents’ quest for community style (F2)F2 = F1 × 0.438 + F3 × 0.563
Environmental awareness of residents (F3)F3 = Z3 × 0.180
Residents’ demand for intelligent living (F4)F4 = C1 × 0.265 + Z1 × 0.212 + C5 × 0.018 + C2 × 0.035 + Z5 × 0.133 + Z7 × 0.168 + F6 × 0.168
Future community greening rate (F5)F5 = F2 × 0.596 + Z3 × 0.404
Community security surveillance system coverage (F6)F6 = C1 × 0.509 + Z7 × 0.491
Arrangement of intelligent facilities (F7)F7 = F4 × 0.329 + C1 × 0.356 + C3 × 0.288 + C2 × 0.014 + F2 × 0.014
ConstantConstruction of intelligent security systems (C1)Construction of intelligent security systems = c1
Construction of an intelligent telemedicine system (C2)Construction of an intelligent telemedicine system = c2
Future community sharing project types (C3)Future community sharing project types = c3
Construction of community recreational facilities (C4)Construction of community recreational facilities = c4
Construction of community shared gyms (C5)Construction of community shared gyms = c5
Table 7. Simulation Results Output for Human Nature Drivers.
TIME (Month)20 Percent Increase in Residents’ Perceptions of Future Community Building20 Percent Increase in the Sophistication of Population Participation Mechanisms20 Percent Increase in Residents’ Quest for Community StyleCurrent
00.139 0.116 0.116 0.116
10.139 0.116 0.116 0.116
20.246 0.204 0.204 0.204
30.536 0.443 0.442 0.442
41.157 0.950 0.946 0.946
52.399 1.953 1.940 1.940
64.855 3.909 3.871 3.869
79.765 7.753 7.646 7.642
819.811 15.467 15.178 15.168
940.980 31.376 30.608 30.582
1087.098 65.203 63.187 63.120
11191.168 139.511 134.234 134.062
12434.610 308.304 294.432 293.985
Table 8. Output of Simulation Results for Ecological Drivers.
TIME (Month)50 Percent Increase in Future Community Greenery50 Percent Increase in Environmental Awareness Among the Population50 Percent Increase in Decarbonization of Future Communities50 Percent Increase in the Level of Construction of Community Sponge FacilitiesCurrent
00.348 0.308 0.294 0.294 0.116
10.544 0.454 0.484 0.420 0.116
20.925 0.733 0.853 0.663 0.204
31.624 1.231 1.539 1.092 0.442
42.887 2.101 2.791 1.836 0.946
55.159 3.618 5.072 3.125 1.940
69.259 6.281 9.240 5.378 3.869
716.708 11.008 16.894 9.371 7.642
830.376 19.540 31.056 16.592 15.168
955.796 35.261 57.538 29.975 30.582
10103.911 64.983 107.745 55.529 63.120
11197.024 122.958 204.656 106.041 134.062
12382.245 240.229 396.038 209.870 293.985
Table 9. Output of Simulation Results for Intelligence Drivers.
TIME (Month)20 Percent Increase in the Construction of Intelligent Security Systems20 Percent Increase in the Placement of Smart FacilitiesResidents’ Demand for Smart Living Grows by 20 Percent20 Percent Increase in the Construction of Smart Telemedicine SystemsCurrent
00.498 0.485 0.582 0.485 0.116
10.622 0.593 0.714 0.593 0.116
20.870 0.812 0.985 0.809 0.204
31.317 1.212 1.483 1.200 0.442
42.103 1.920 2.376 1.890 0.946
53.490 3.175 3.989 3.106 1.940
65.992 5.448 6.972 5.295 3.869
710.652 9.698 12.682 9.355 7.642
819.654 17.936 24.036 17.157 15.168
937.740 34.535 47.552 32.729 30.582
1075.554 69.322 98.287 65.033 63.120
11157.800 145.113 212.244 134.652 134.062
12343.702 316.631 478.452 290.400 293.985
Table 10. Output of Simulation Results for Convenience Drivers.
TIME (Month)20 Percent Growth in the Types of Future Community Sharing Projects20 Percent Increase in the Extent of TOD Development20 Percent Increase in the Extent of Promotion of 15 min Community Living Areas20 Percent Increase in the Coverage of the Community Safety Monitoring SystemCurrent
00.124 0.124 0.103 0.103 0.116
10.155 0.155 0.129 0.129 0.116
20.216 0.215 0.179 0.178 0.204
30.325 0.322 0.269 0.266 0.442
40.514 0.507 0.427 0.418 0.946
50.847 0.831 0.708 0.685 1.940
61.442 1.411 1.214 1.162 3.869
72.545 2.483 2.158 2.043 7.642
84.661 4.540 3.981 3.731 15.168
98.882 8.641 7.637 7.096 30.582
1017.639 17.145 15.259 14.069 63.120
1136.517 35.475 31.764 29.087 134.062
1278.772 76.499 68.865 62.671 293.985
Table 11. Simulation Result Output for Livability Drivers.
TIME (Month)20 Percent Increase in the Construction of Community Recreational Facilities20 Percent Increase in Construction of Community Shared Gyms20 Percent Increase in the Level of Sophistication of Community-Based Disaster Warning and Emergency Response Mechanisms20 Percent Increase in the Degree of Construction of Community Centers for the ElderlyCurrent
00.116 0.116 0.116 0.116 0.116
10.116 0.116 0.116 0.116 0.116
20.389 0.387 0.389 0.385 0.204
30.502 0.423 0.588 0.412 0.442
41.056 1.049 1.062 1.040 0.946
52.249 2.230 2.277 2.208 1.940
64.456 4.415 4.548 4.367 3.869
78.673 8.591 8.928 8.494 7.642
816.995 16.830 17.625 16.637 15.168
933.940 33.610 35.422 33.223 30.582
1069.570 68.892 72.971 68.099 63.120
11146.945 145.516 154.708 143.846 134.062
12320.538 317.427 338.363 313.793 293.985
Disclaimer/Publisher’s Note: The statements, opinions and data contained in all publications are solely those of the individual author(s) and contributor(s) and not of MDPI and/or the editor(s). MDPI and/or the editor(s) disclaim responsibility for any injury to people or property resulting from any ideas, methods, instructions or products referred to in the content.

