
Dynamic Integration of Shading and Ventilation: Novel Quantitative Insights into Building Performance Optimization


Abstract
1. Introduction
2. Literature Review
2.1. Shading Systems and Solar Control
2.2. Ventilation Strategies and Thermal Regulation
2.3. Combined Effects of Shading and Ventilation
2.4. Machine Learning and Predictive Models in Building Performance
2.5. Integration of Machine Learning with Scenario Analysis
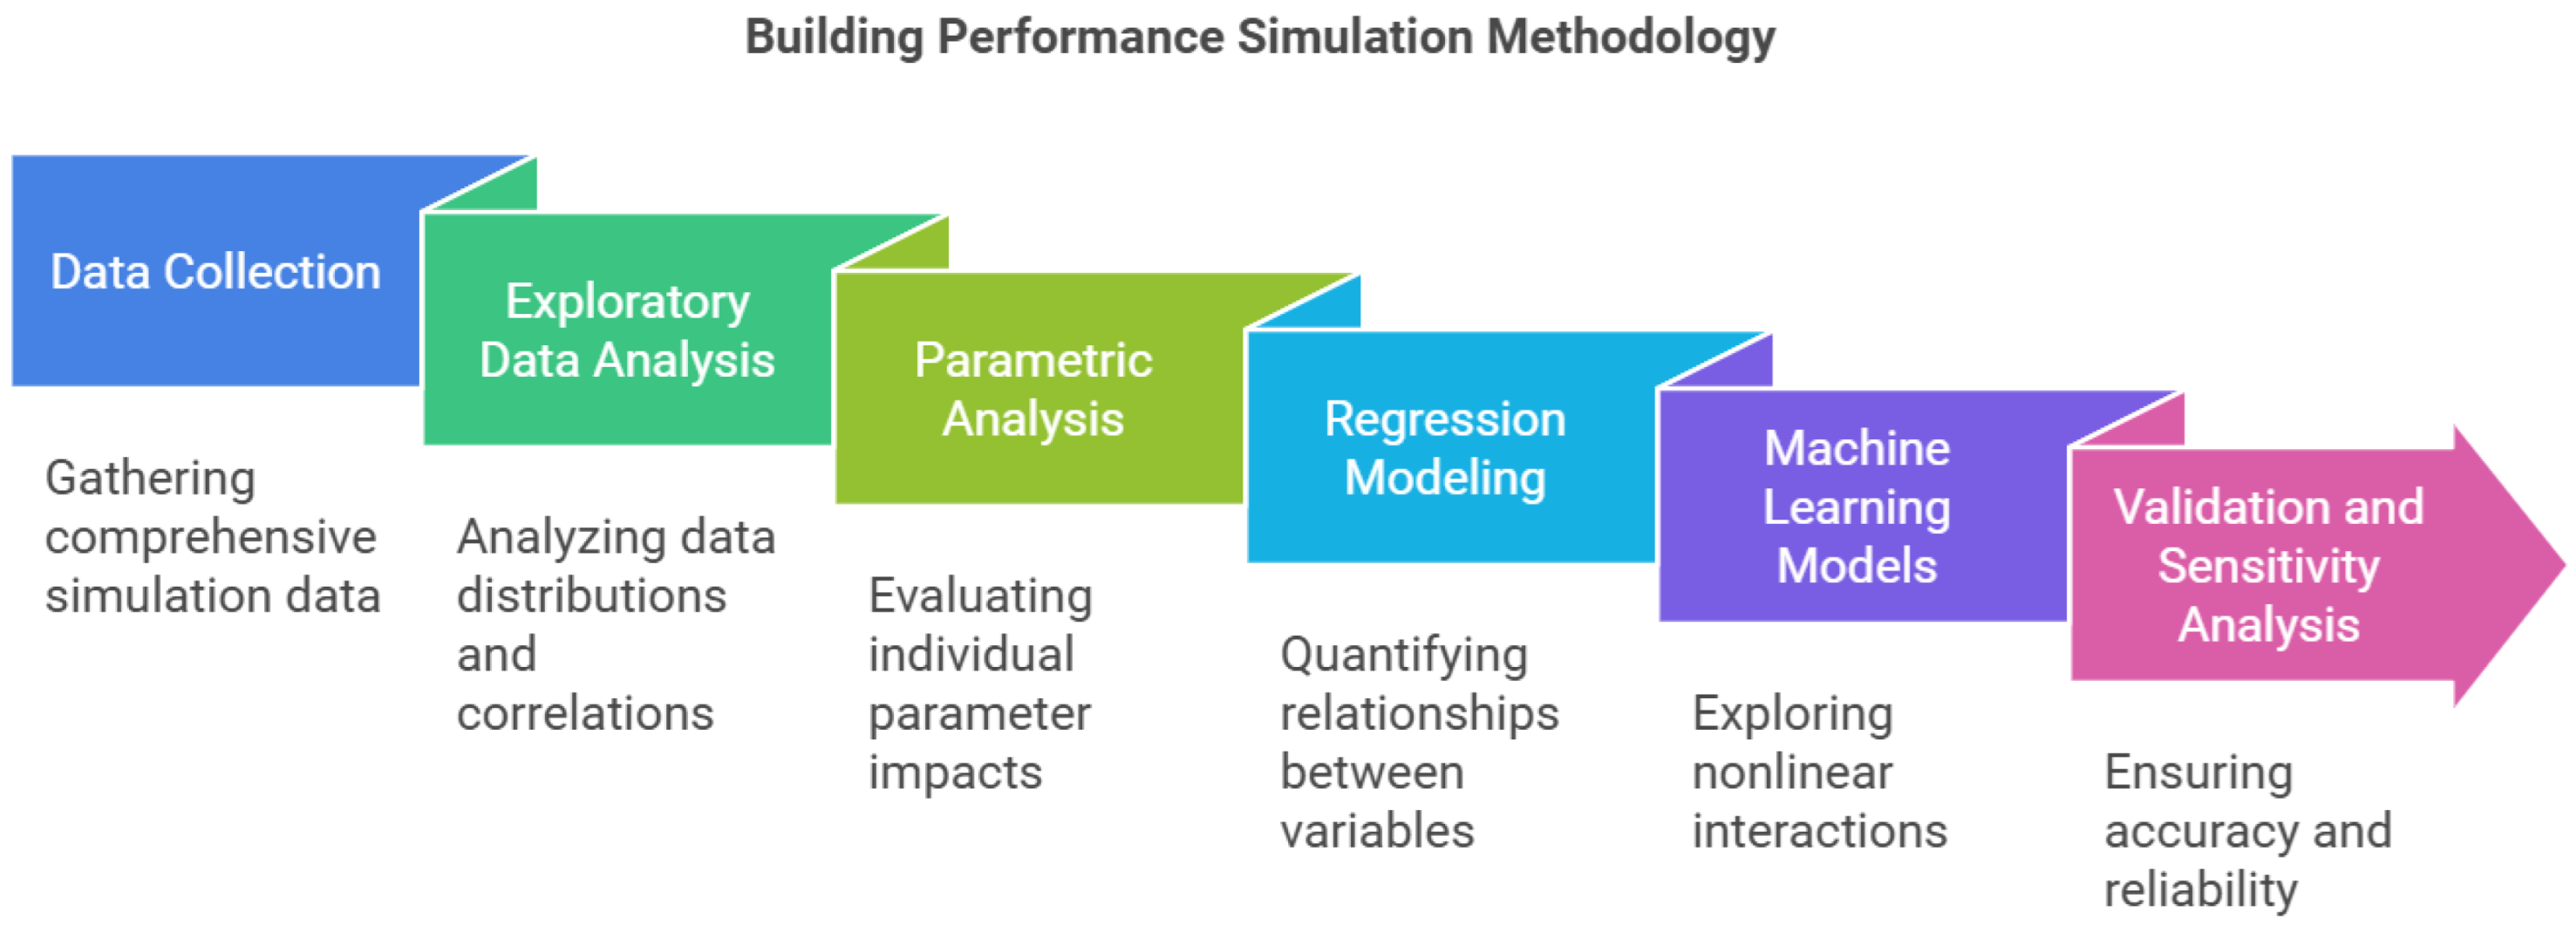
3. Methodology
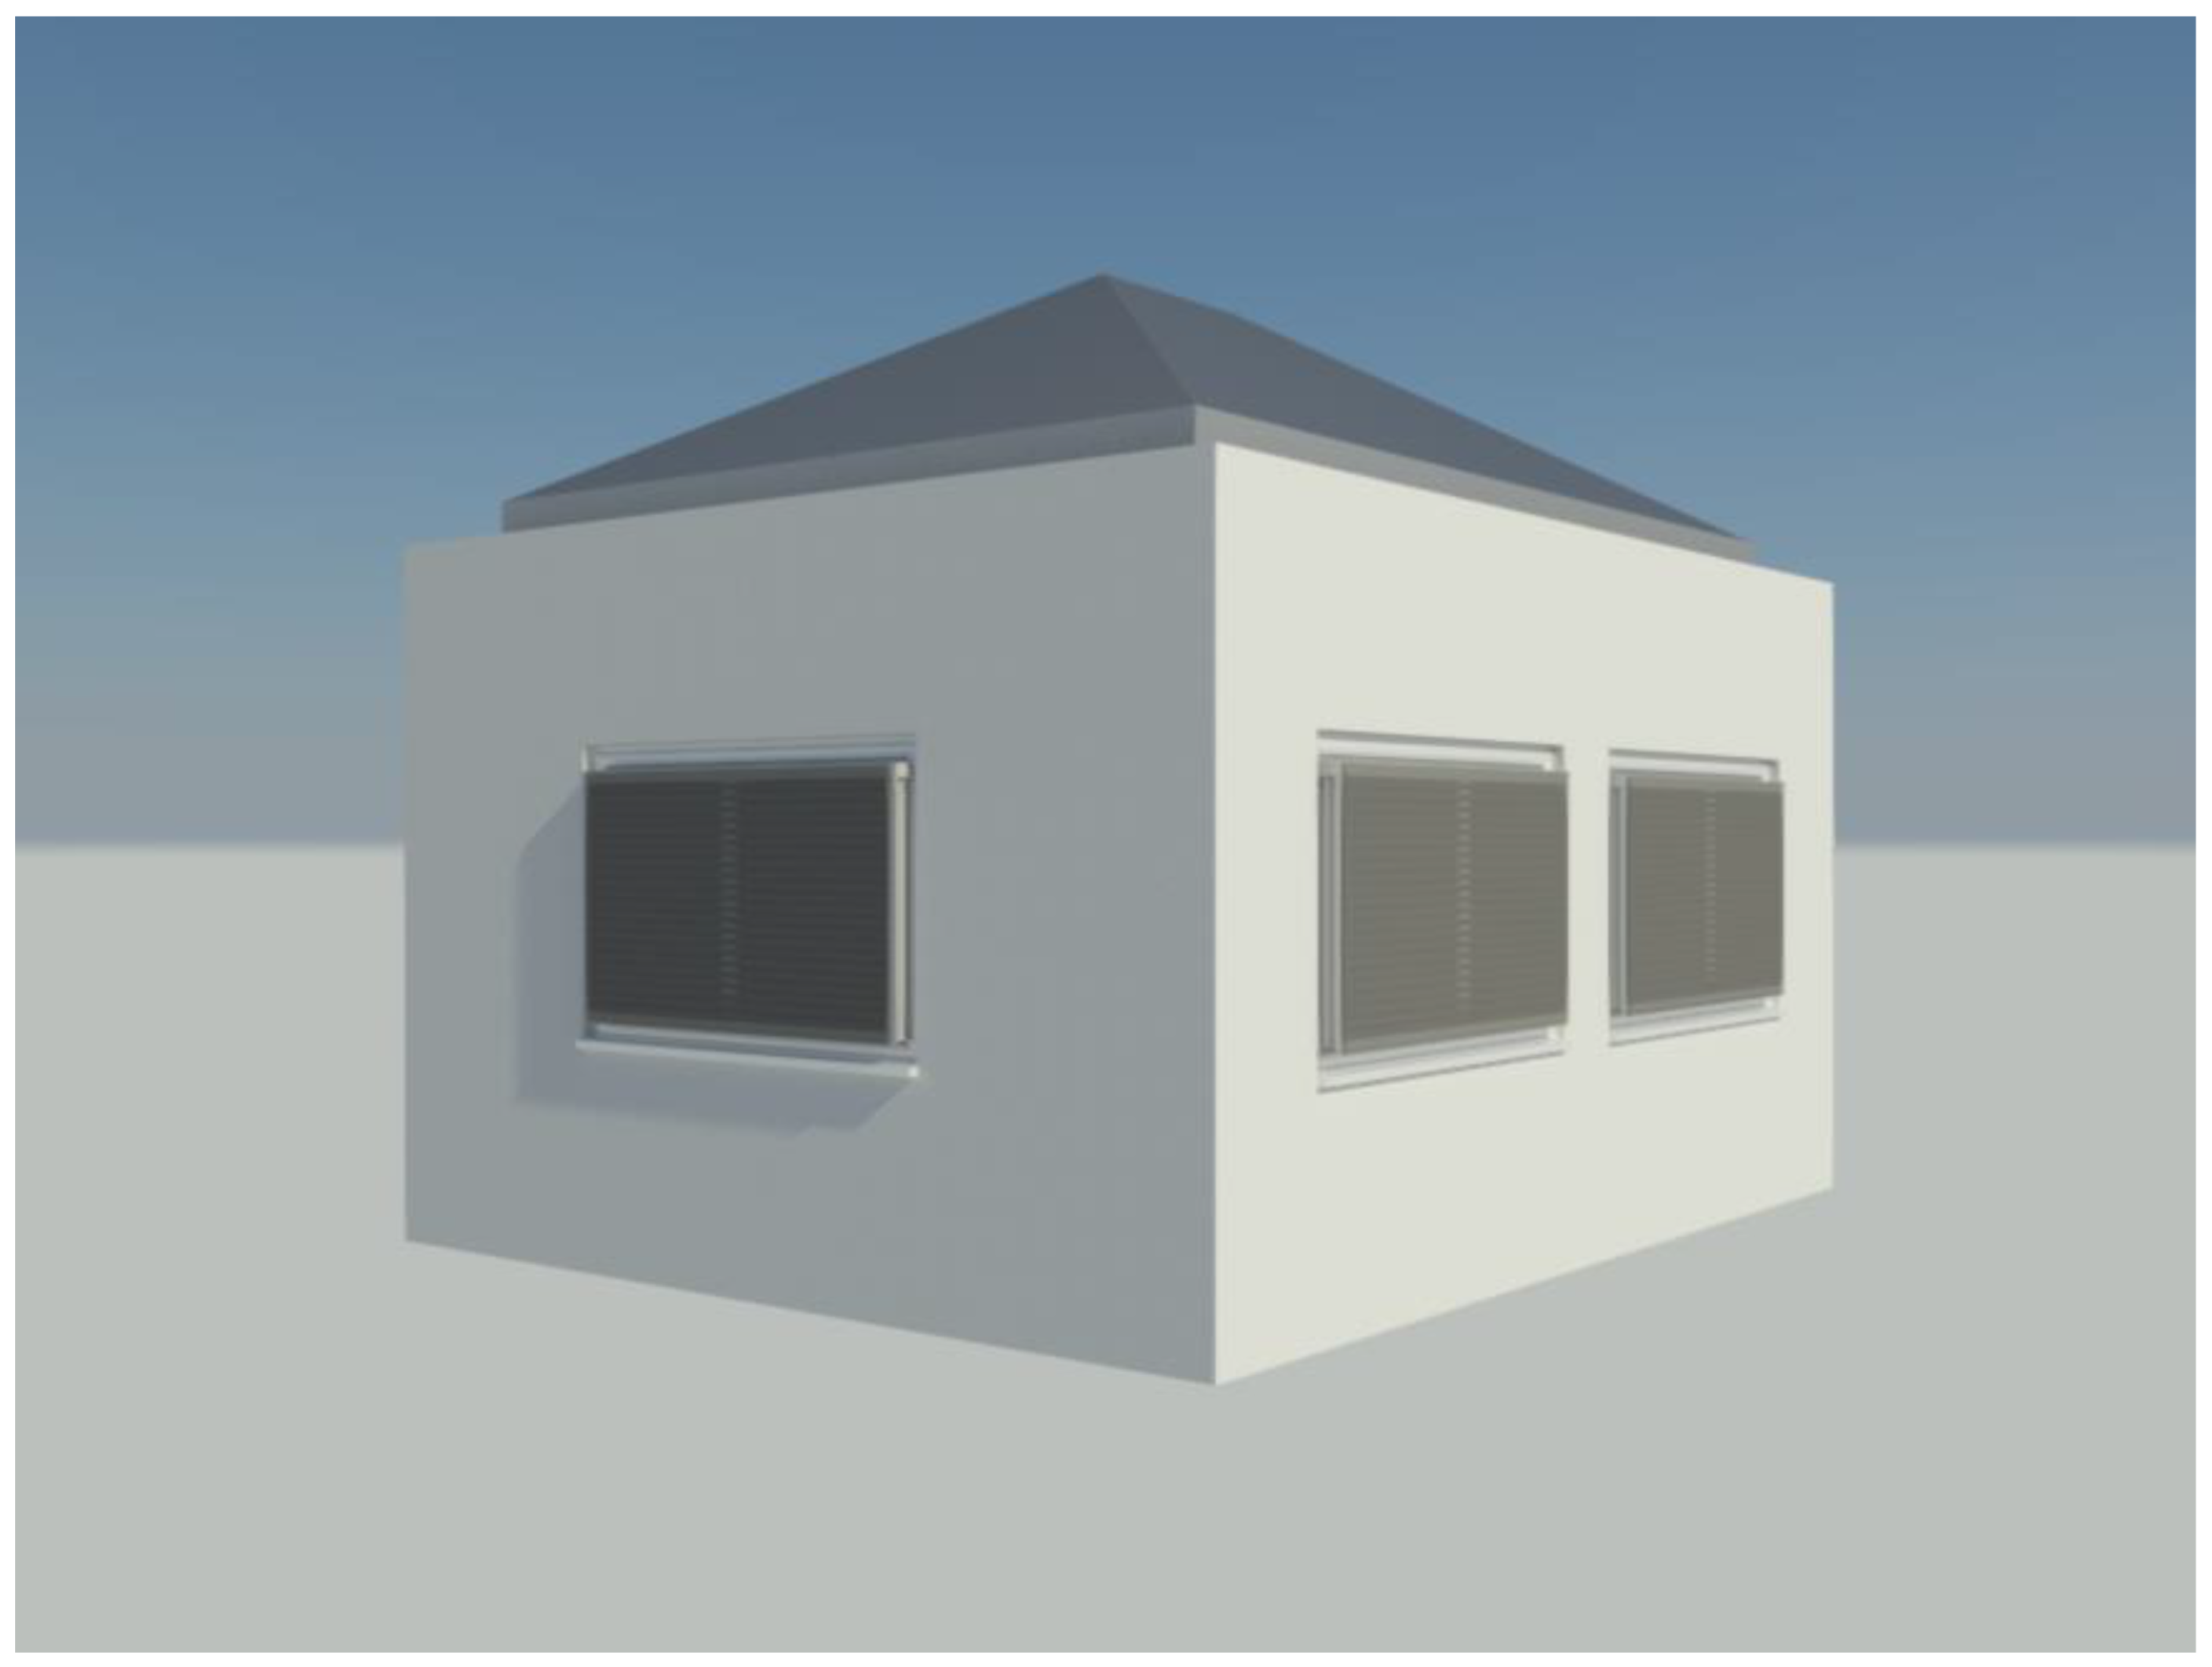
3.1. Data Collection
3.2. Data Analysis Approach
3.2.1. Exploratory Data Analysis
3.2.2. Parametric Analysis
3.2.3. Regression Modeling
3.2.4. Machine Learning Models
3.2.5. Validation and Sensitivity Analysis
3.2.6. Scenario Analysis
4. Results
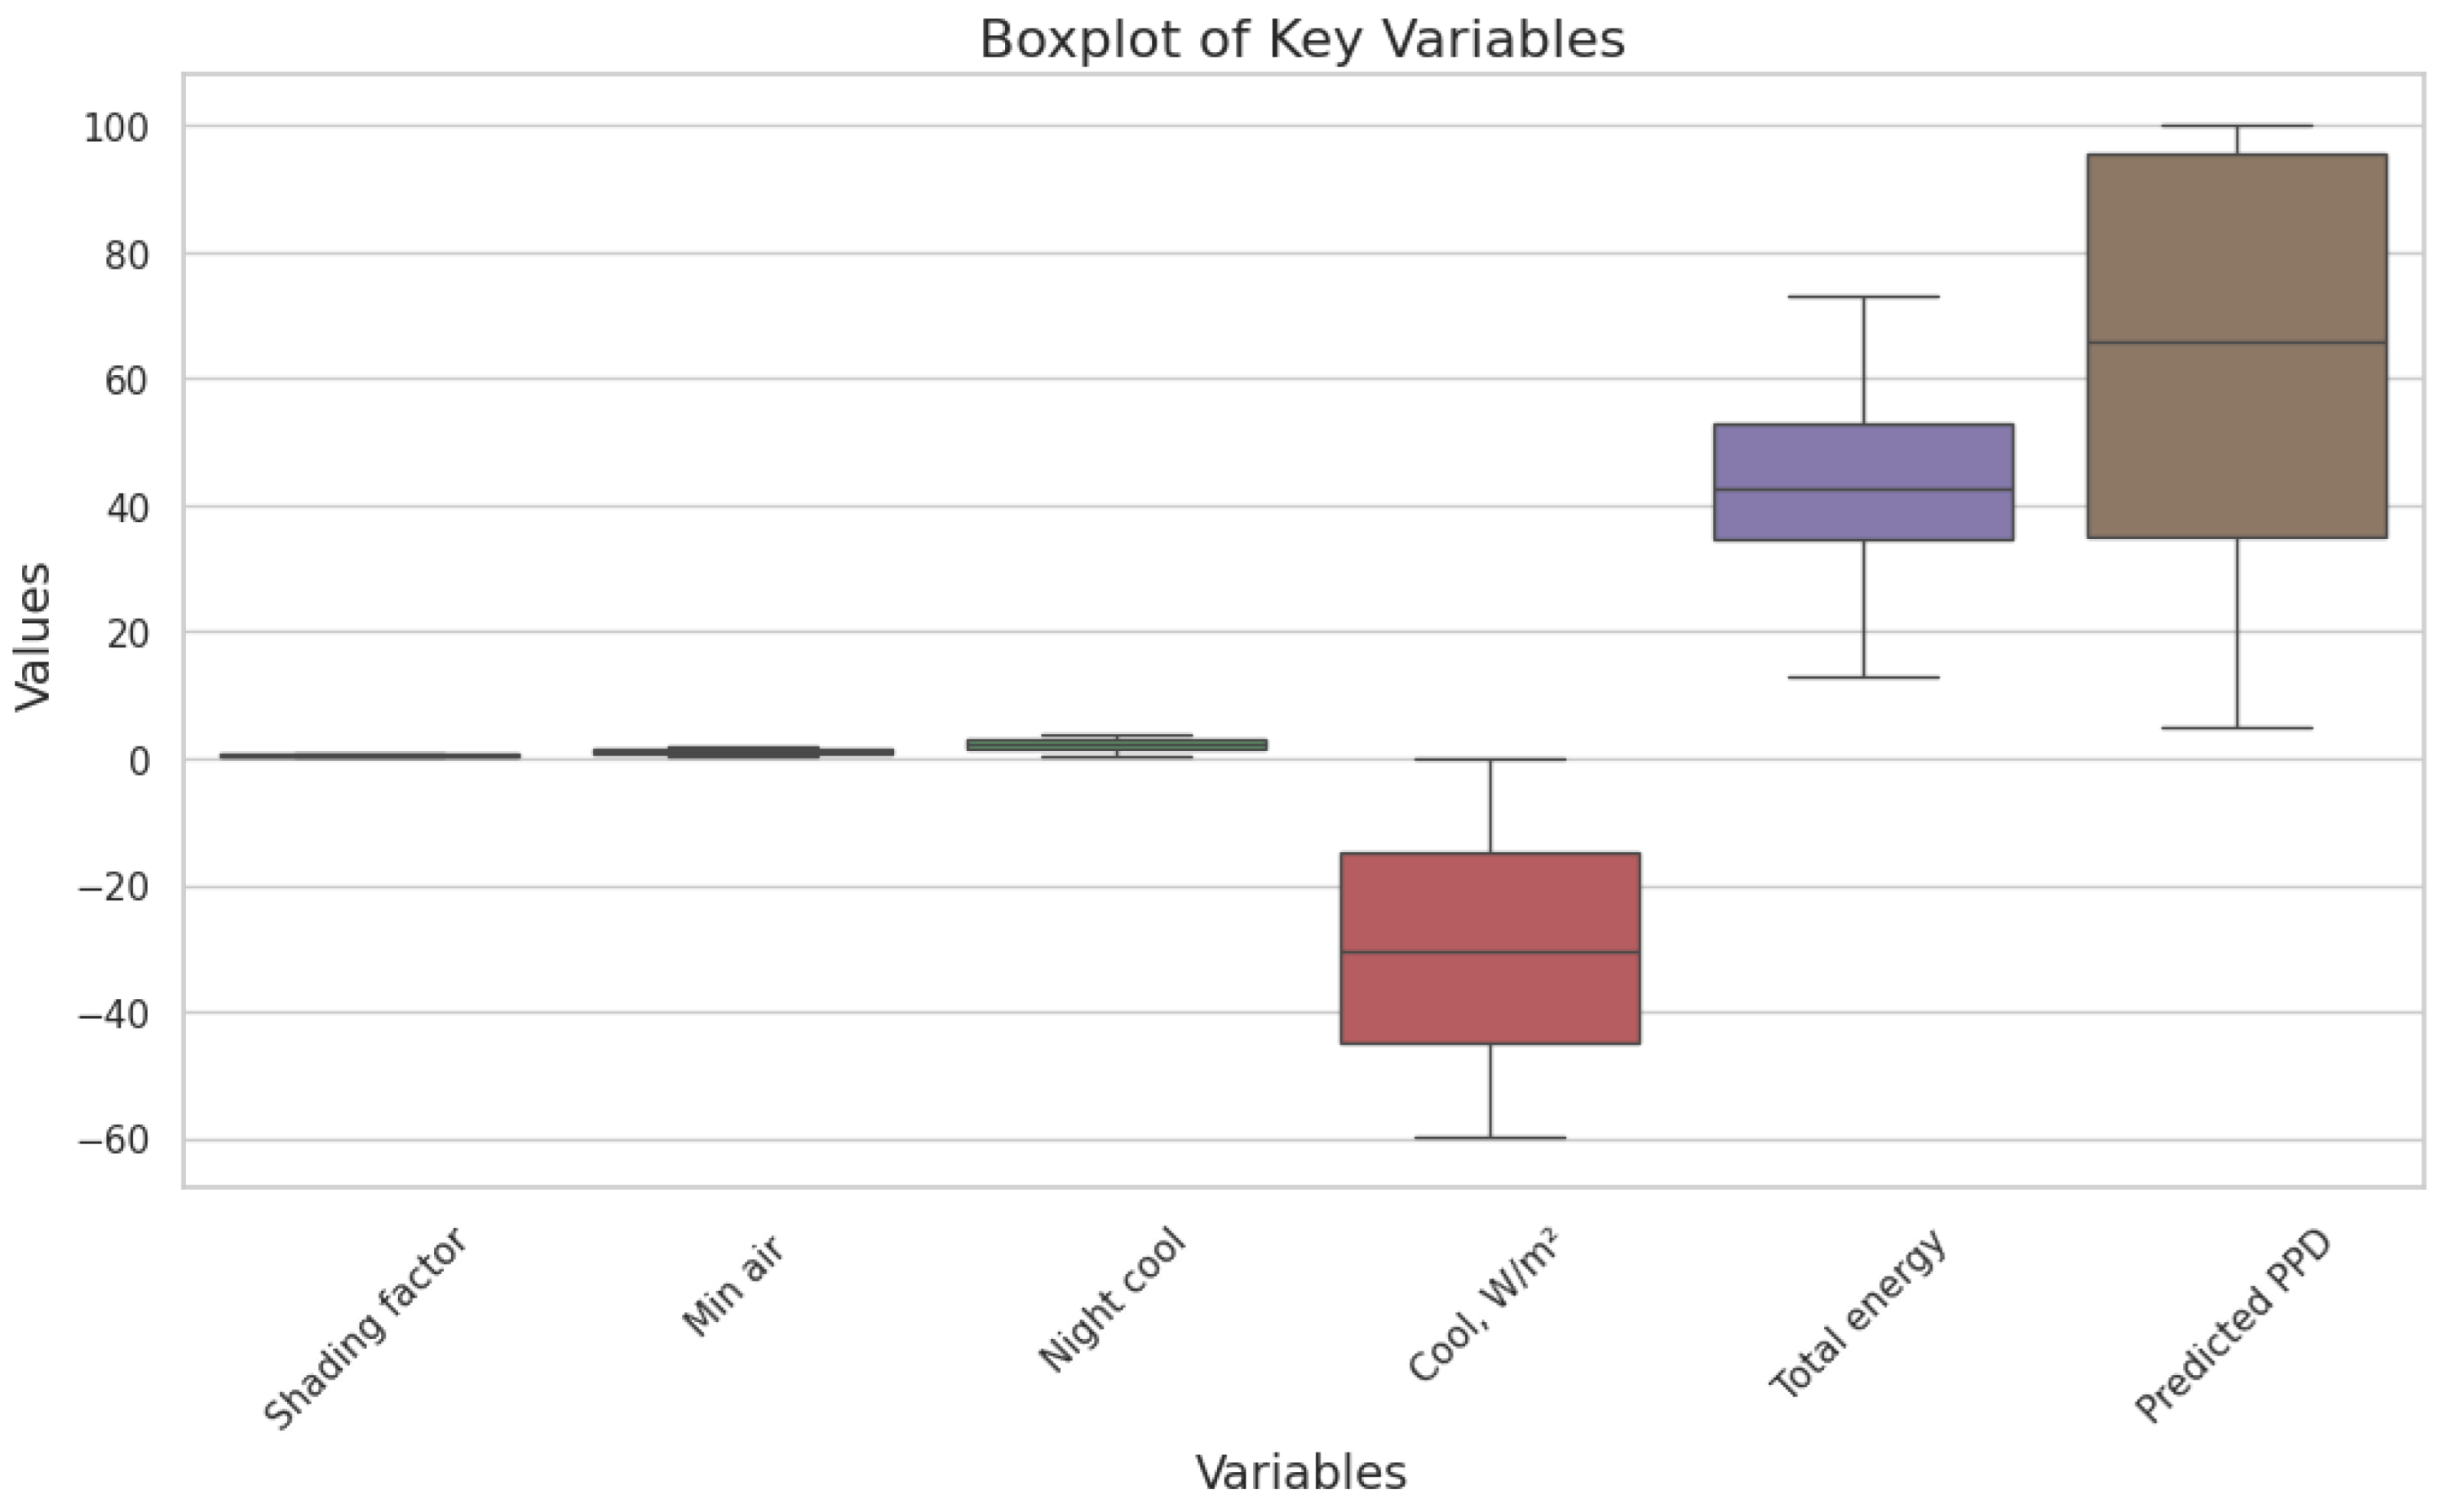
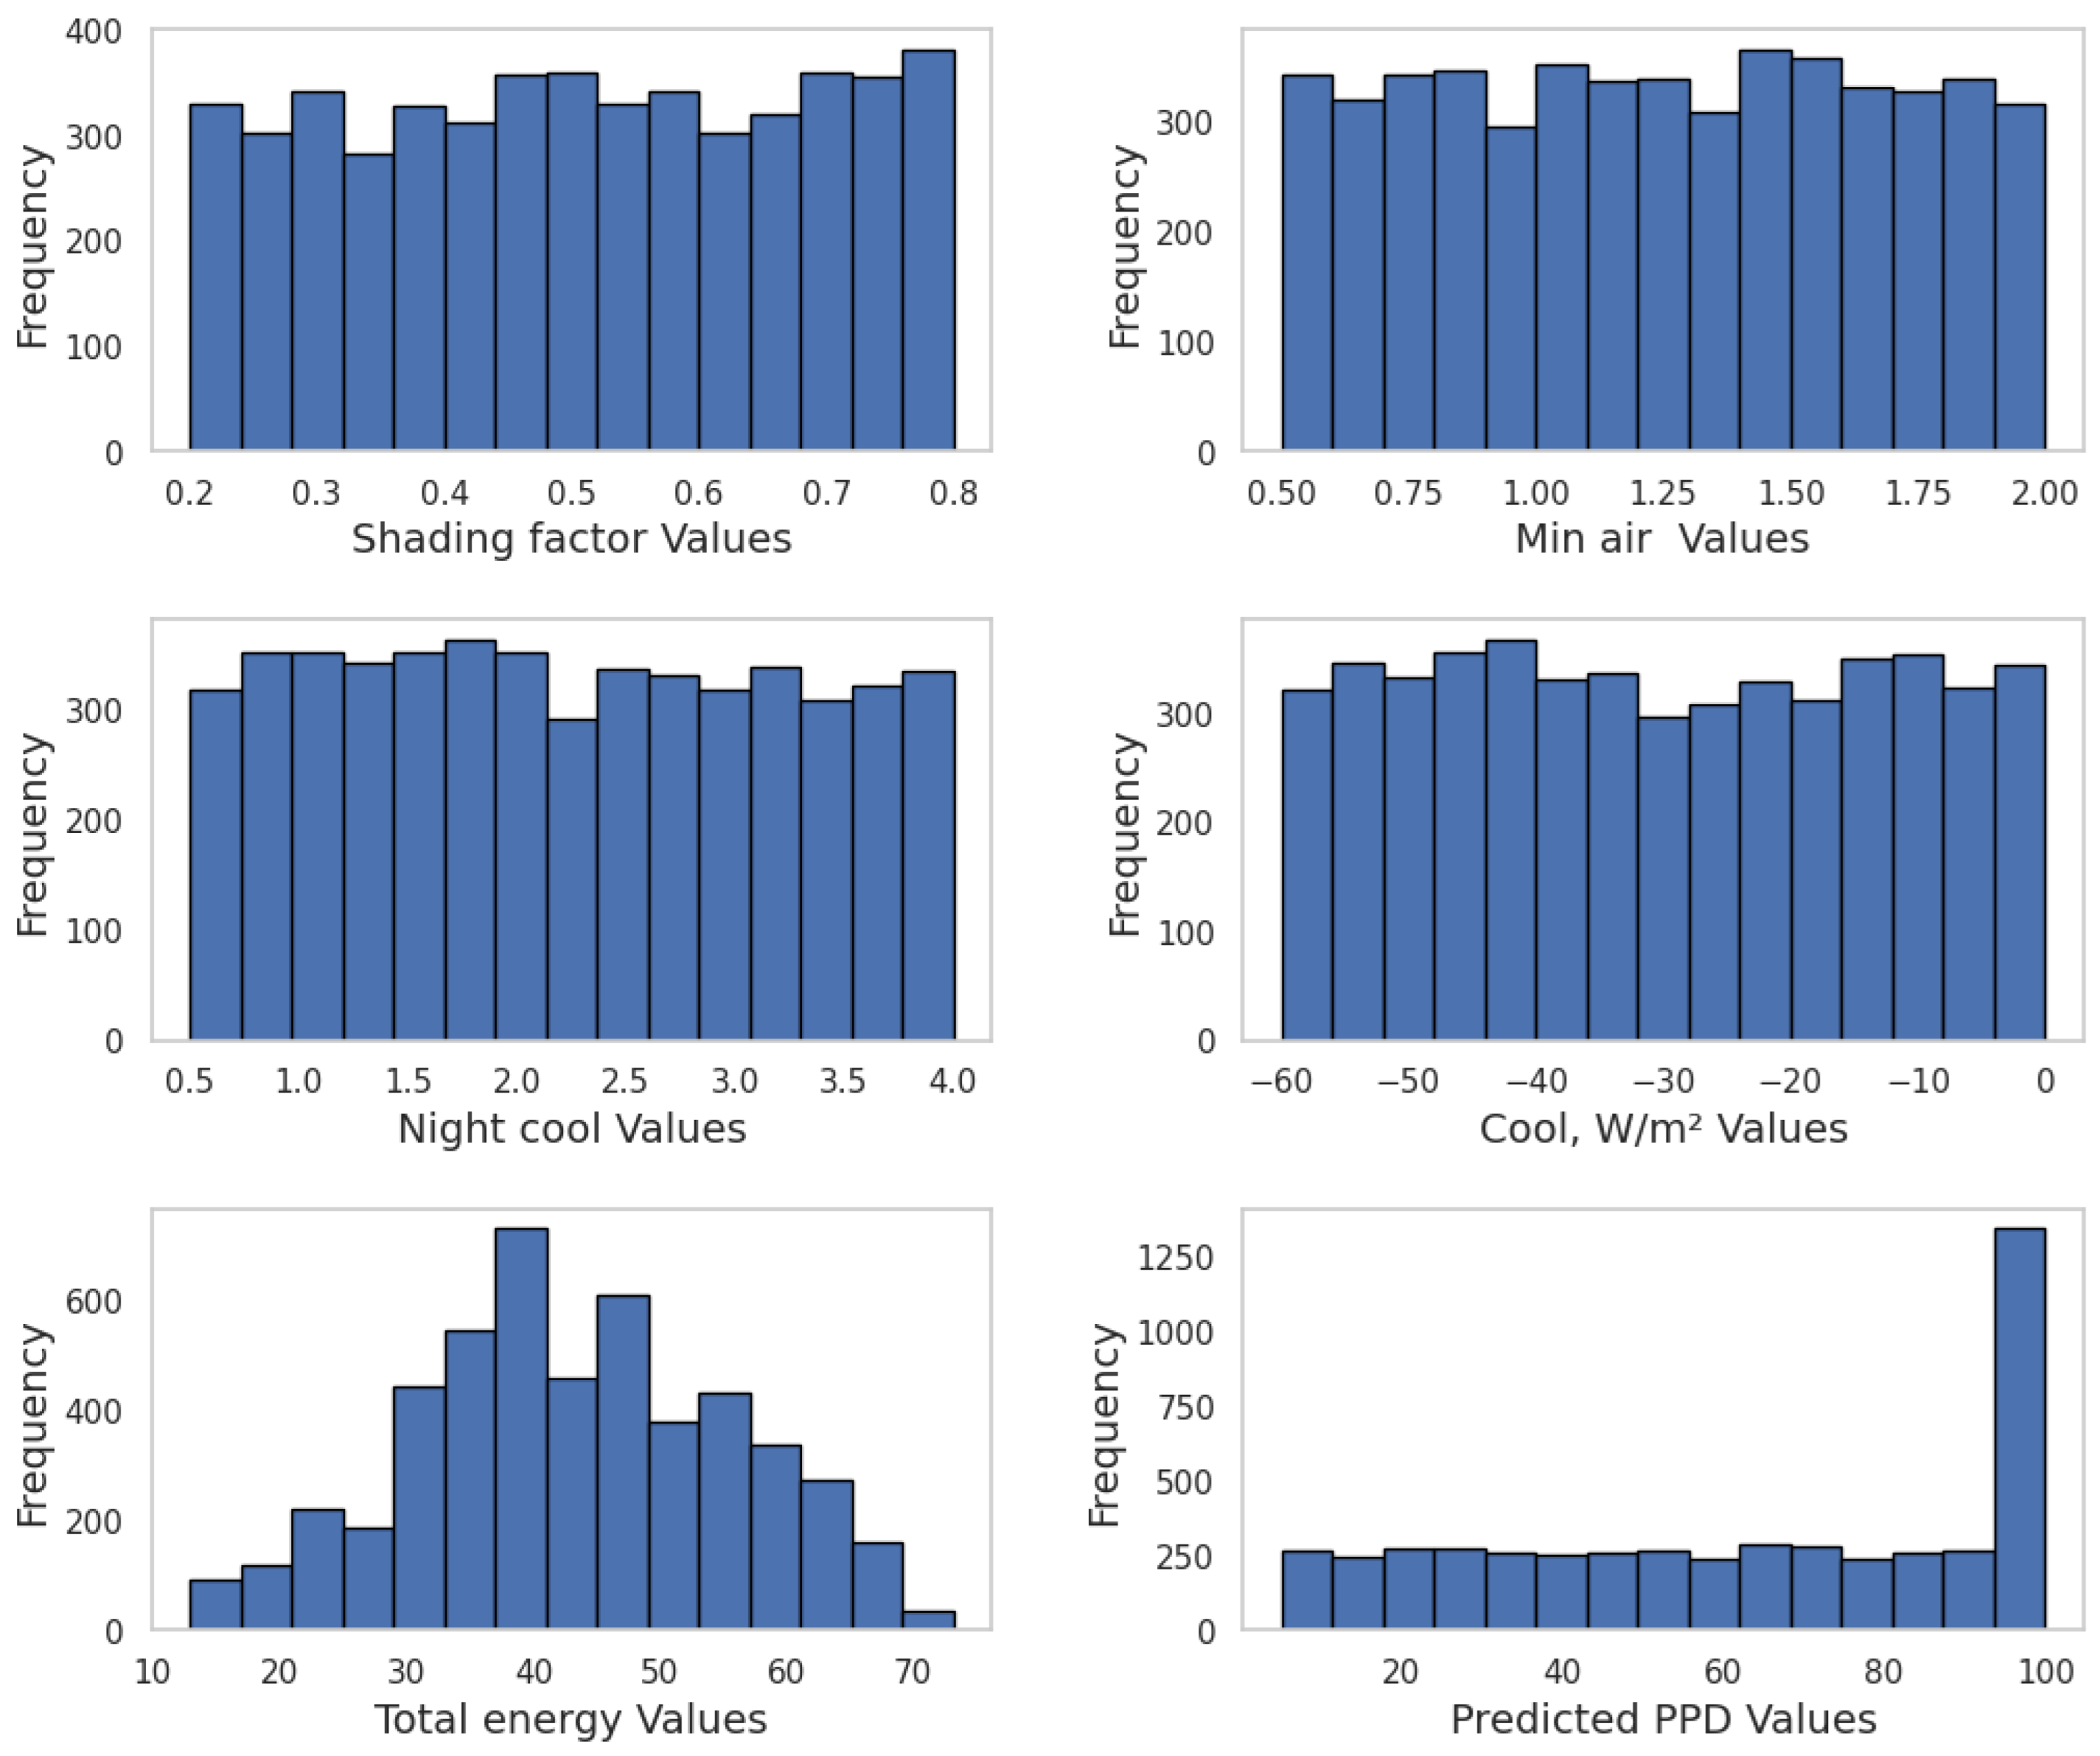
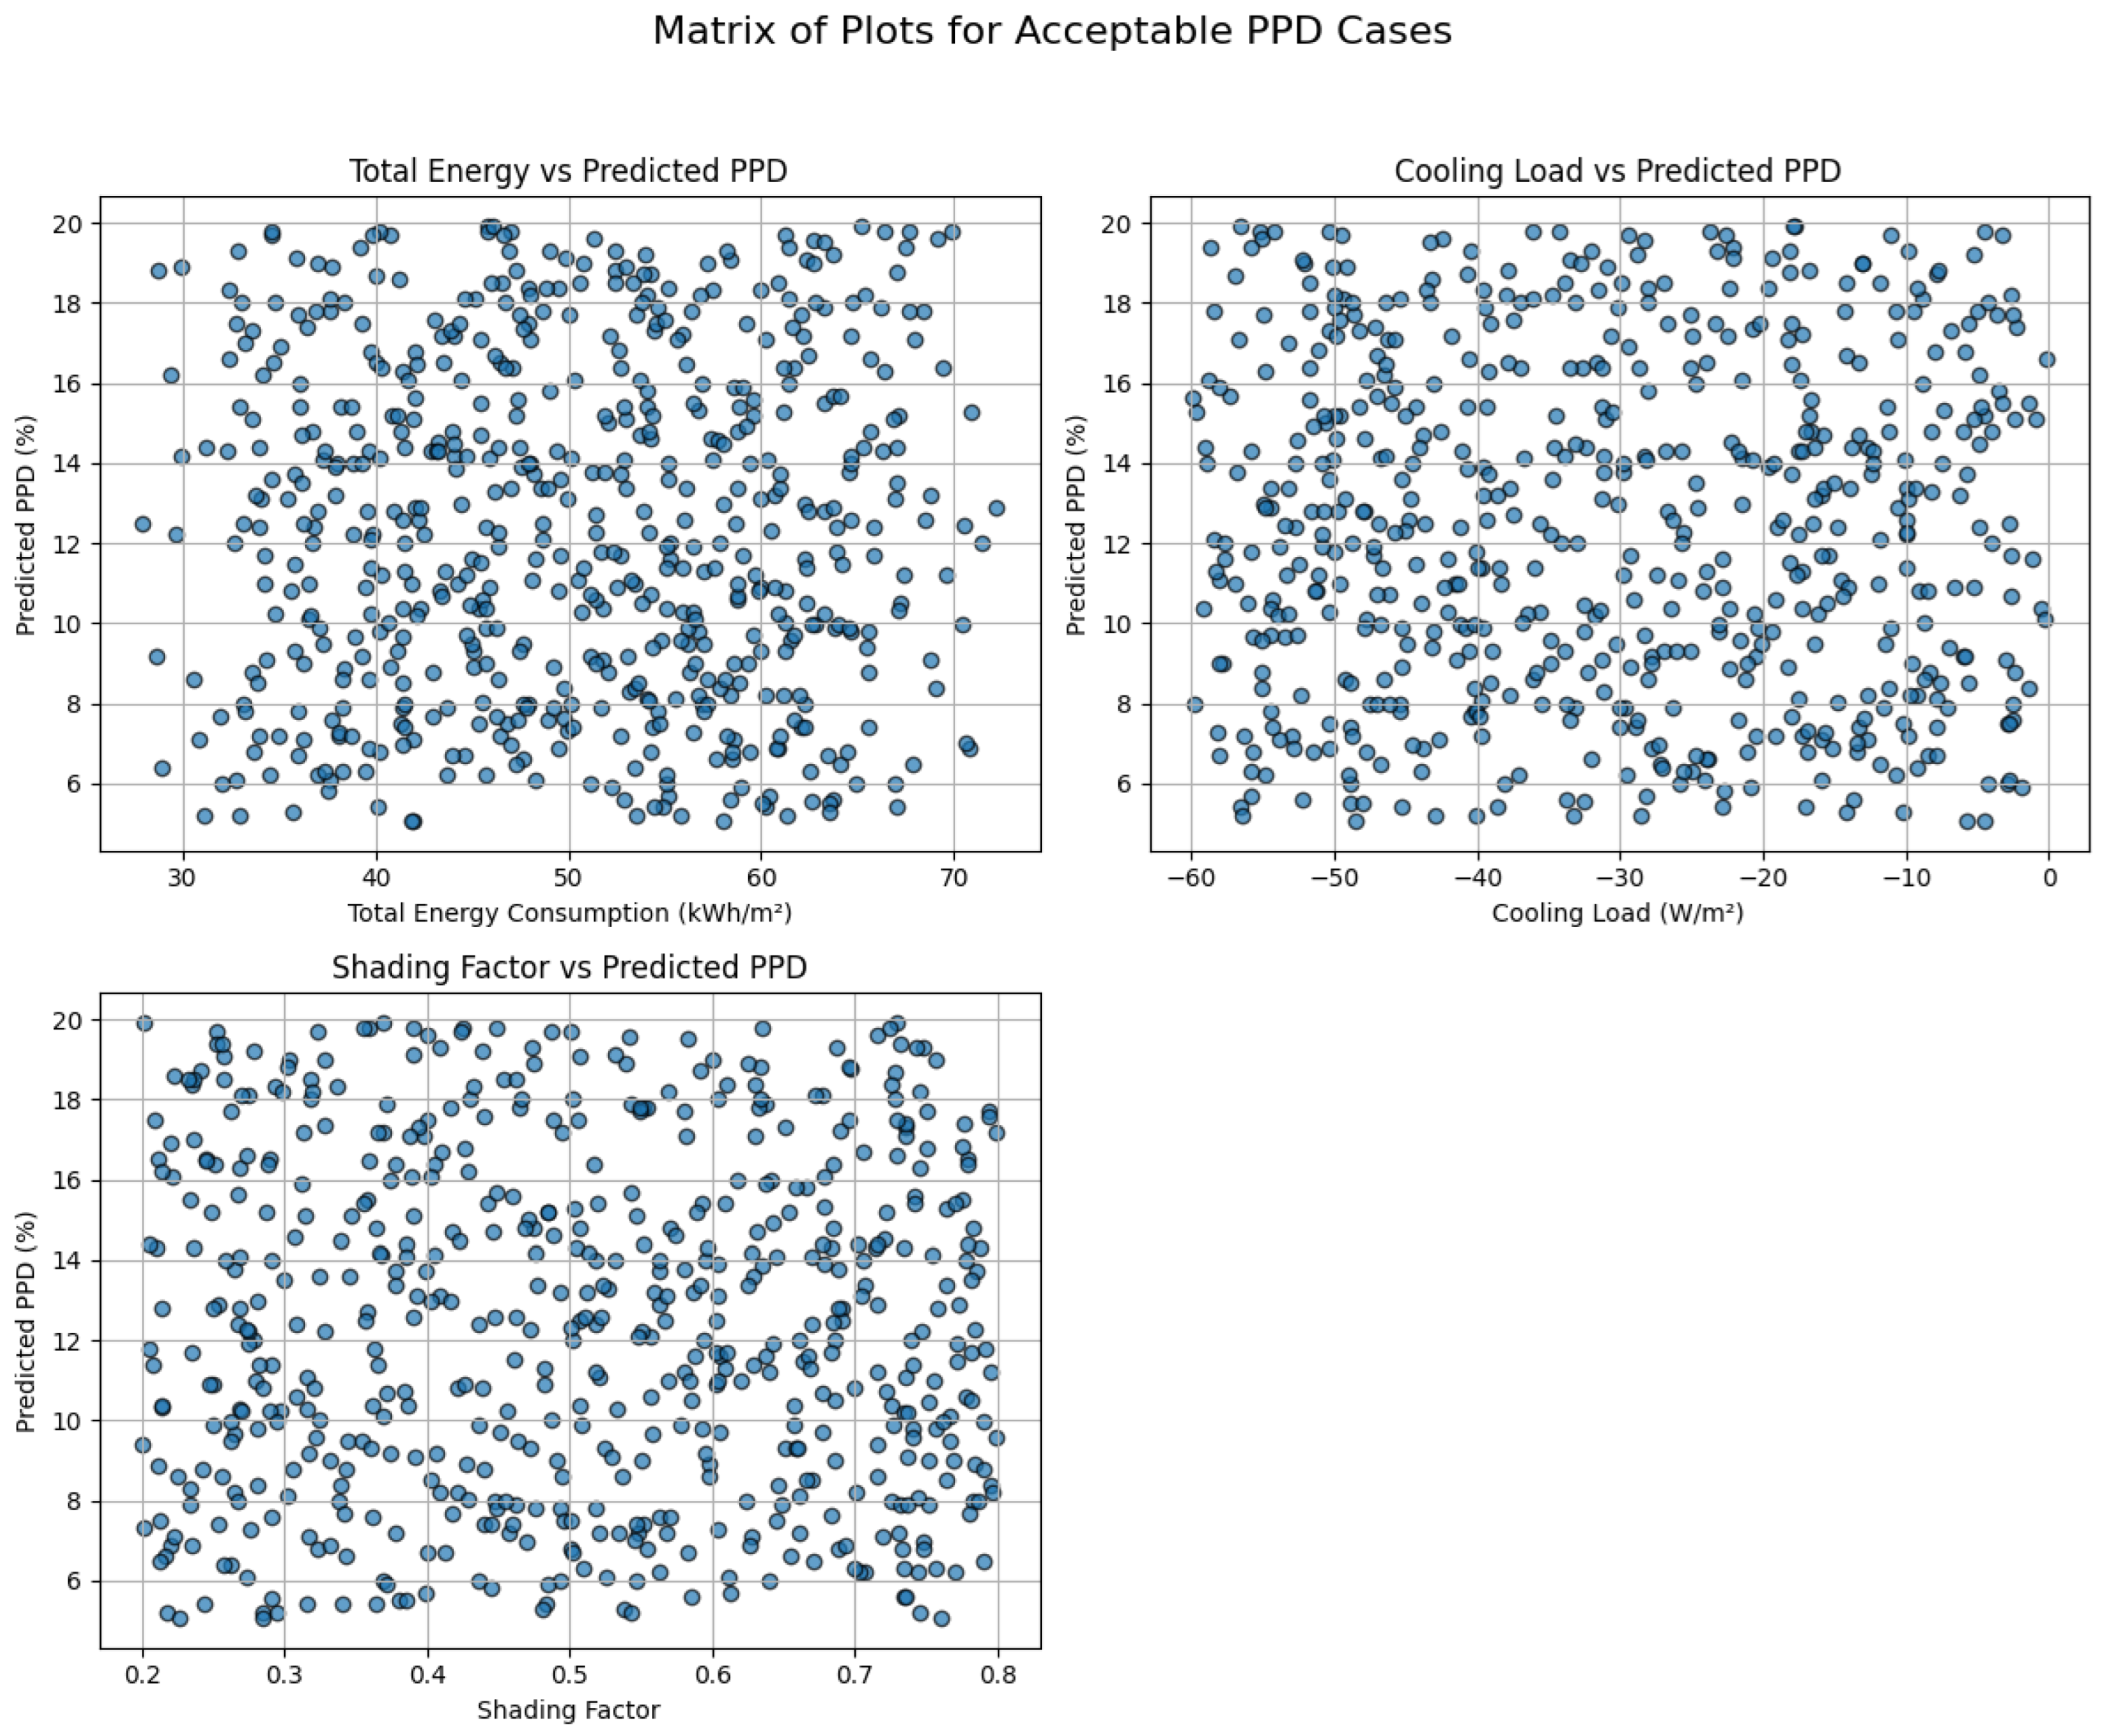
4.1. Exploratory Data Analysis
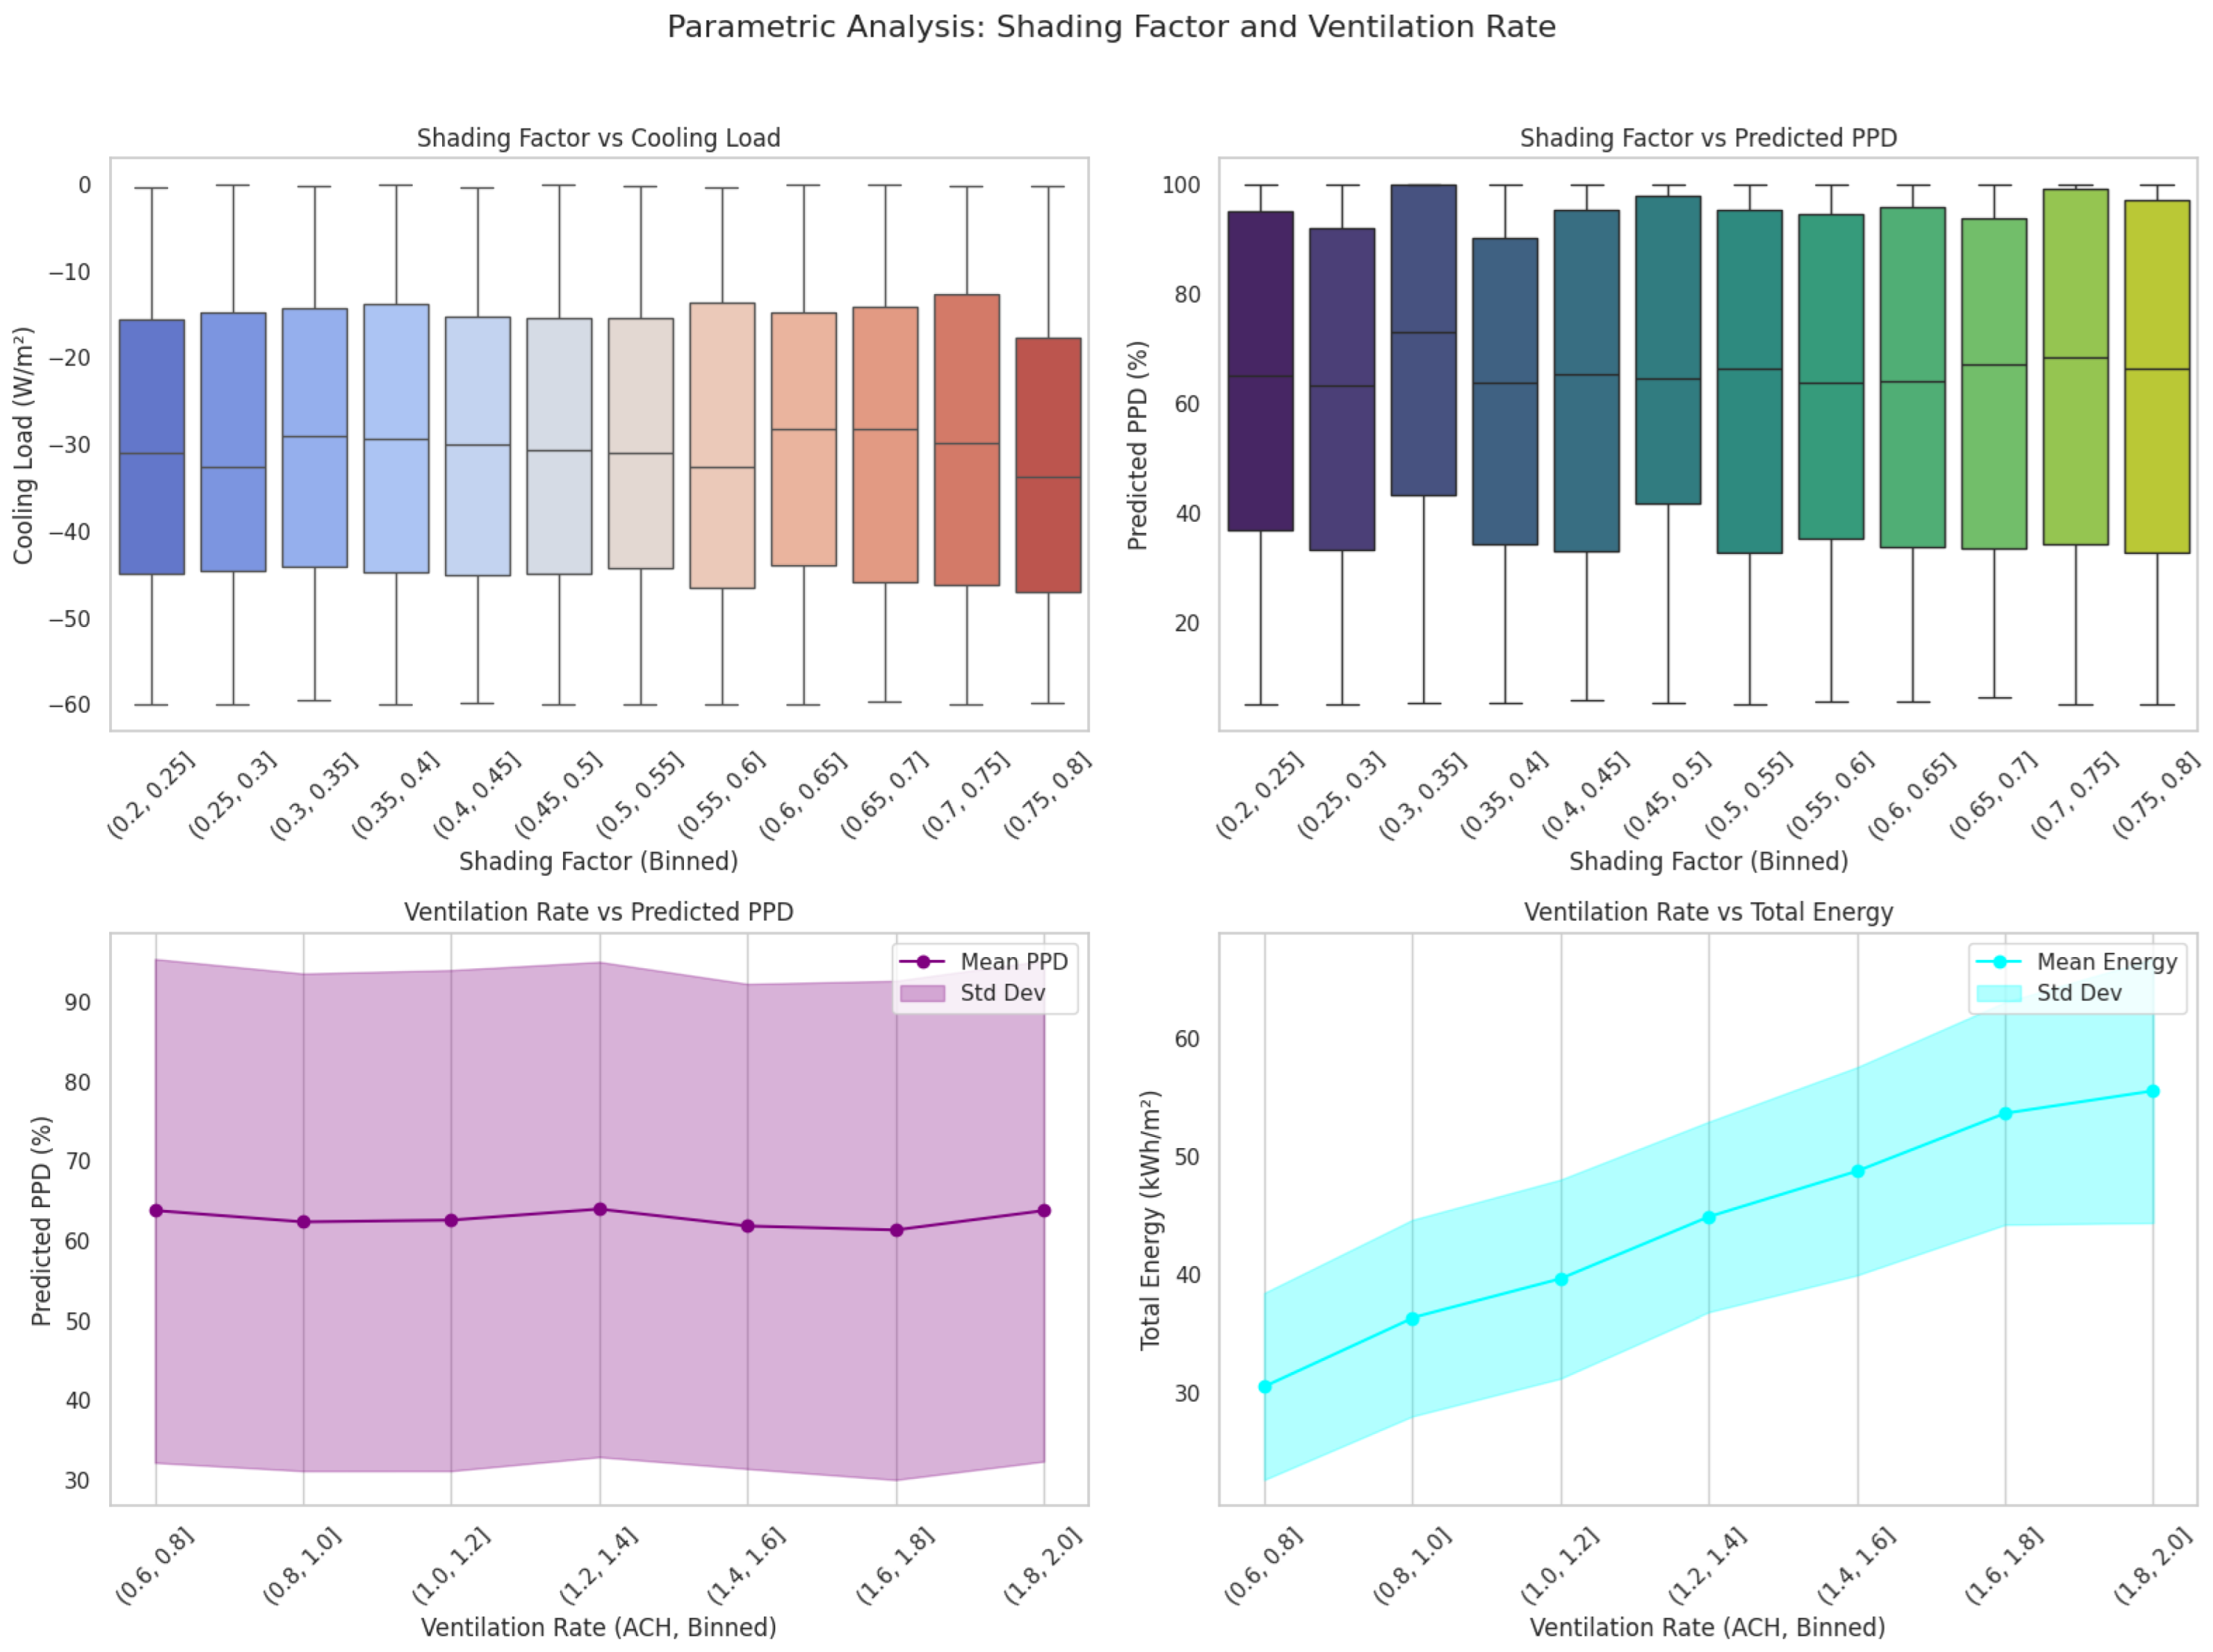
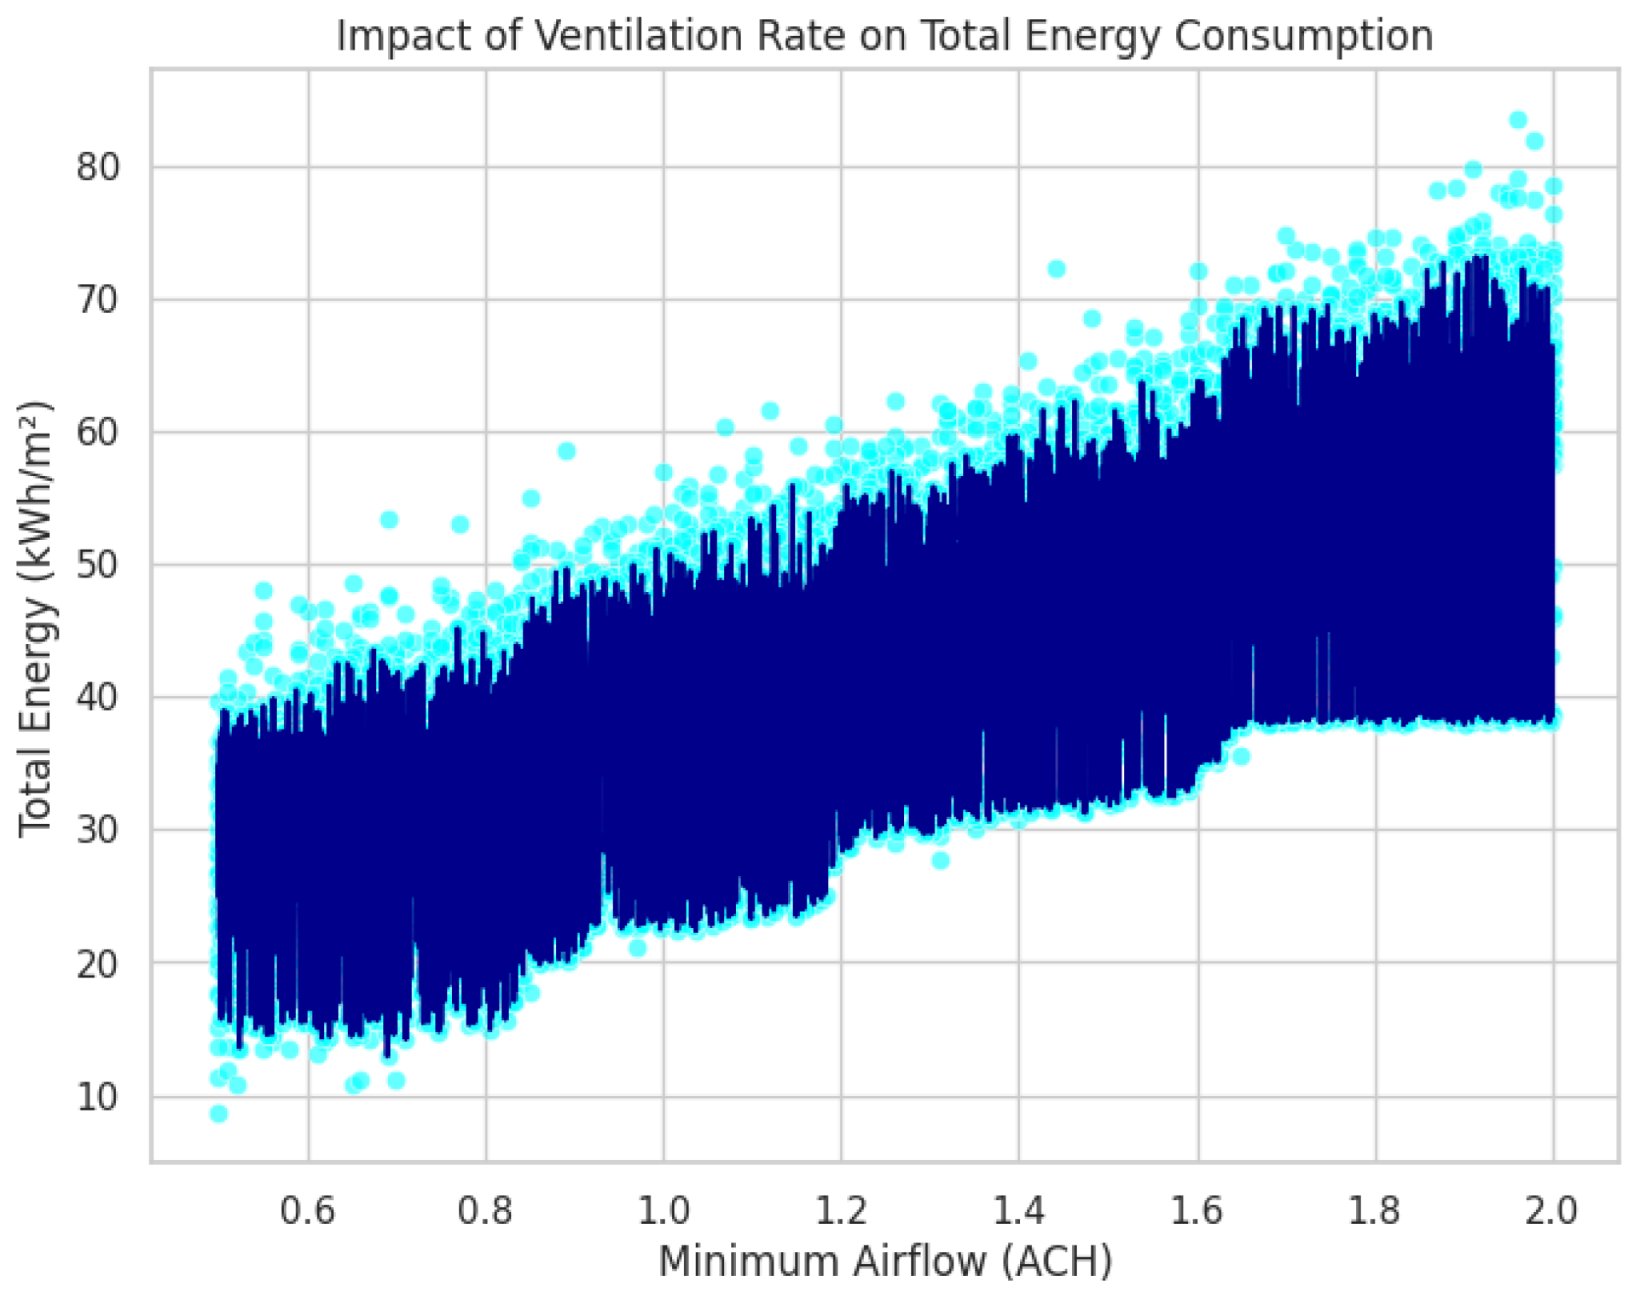
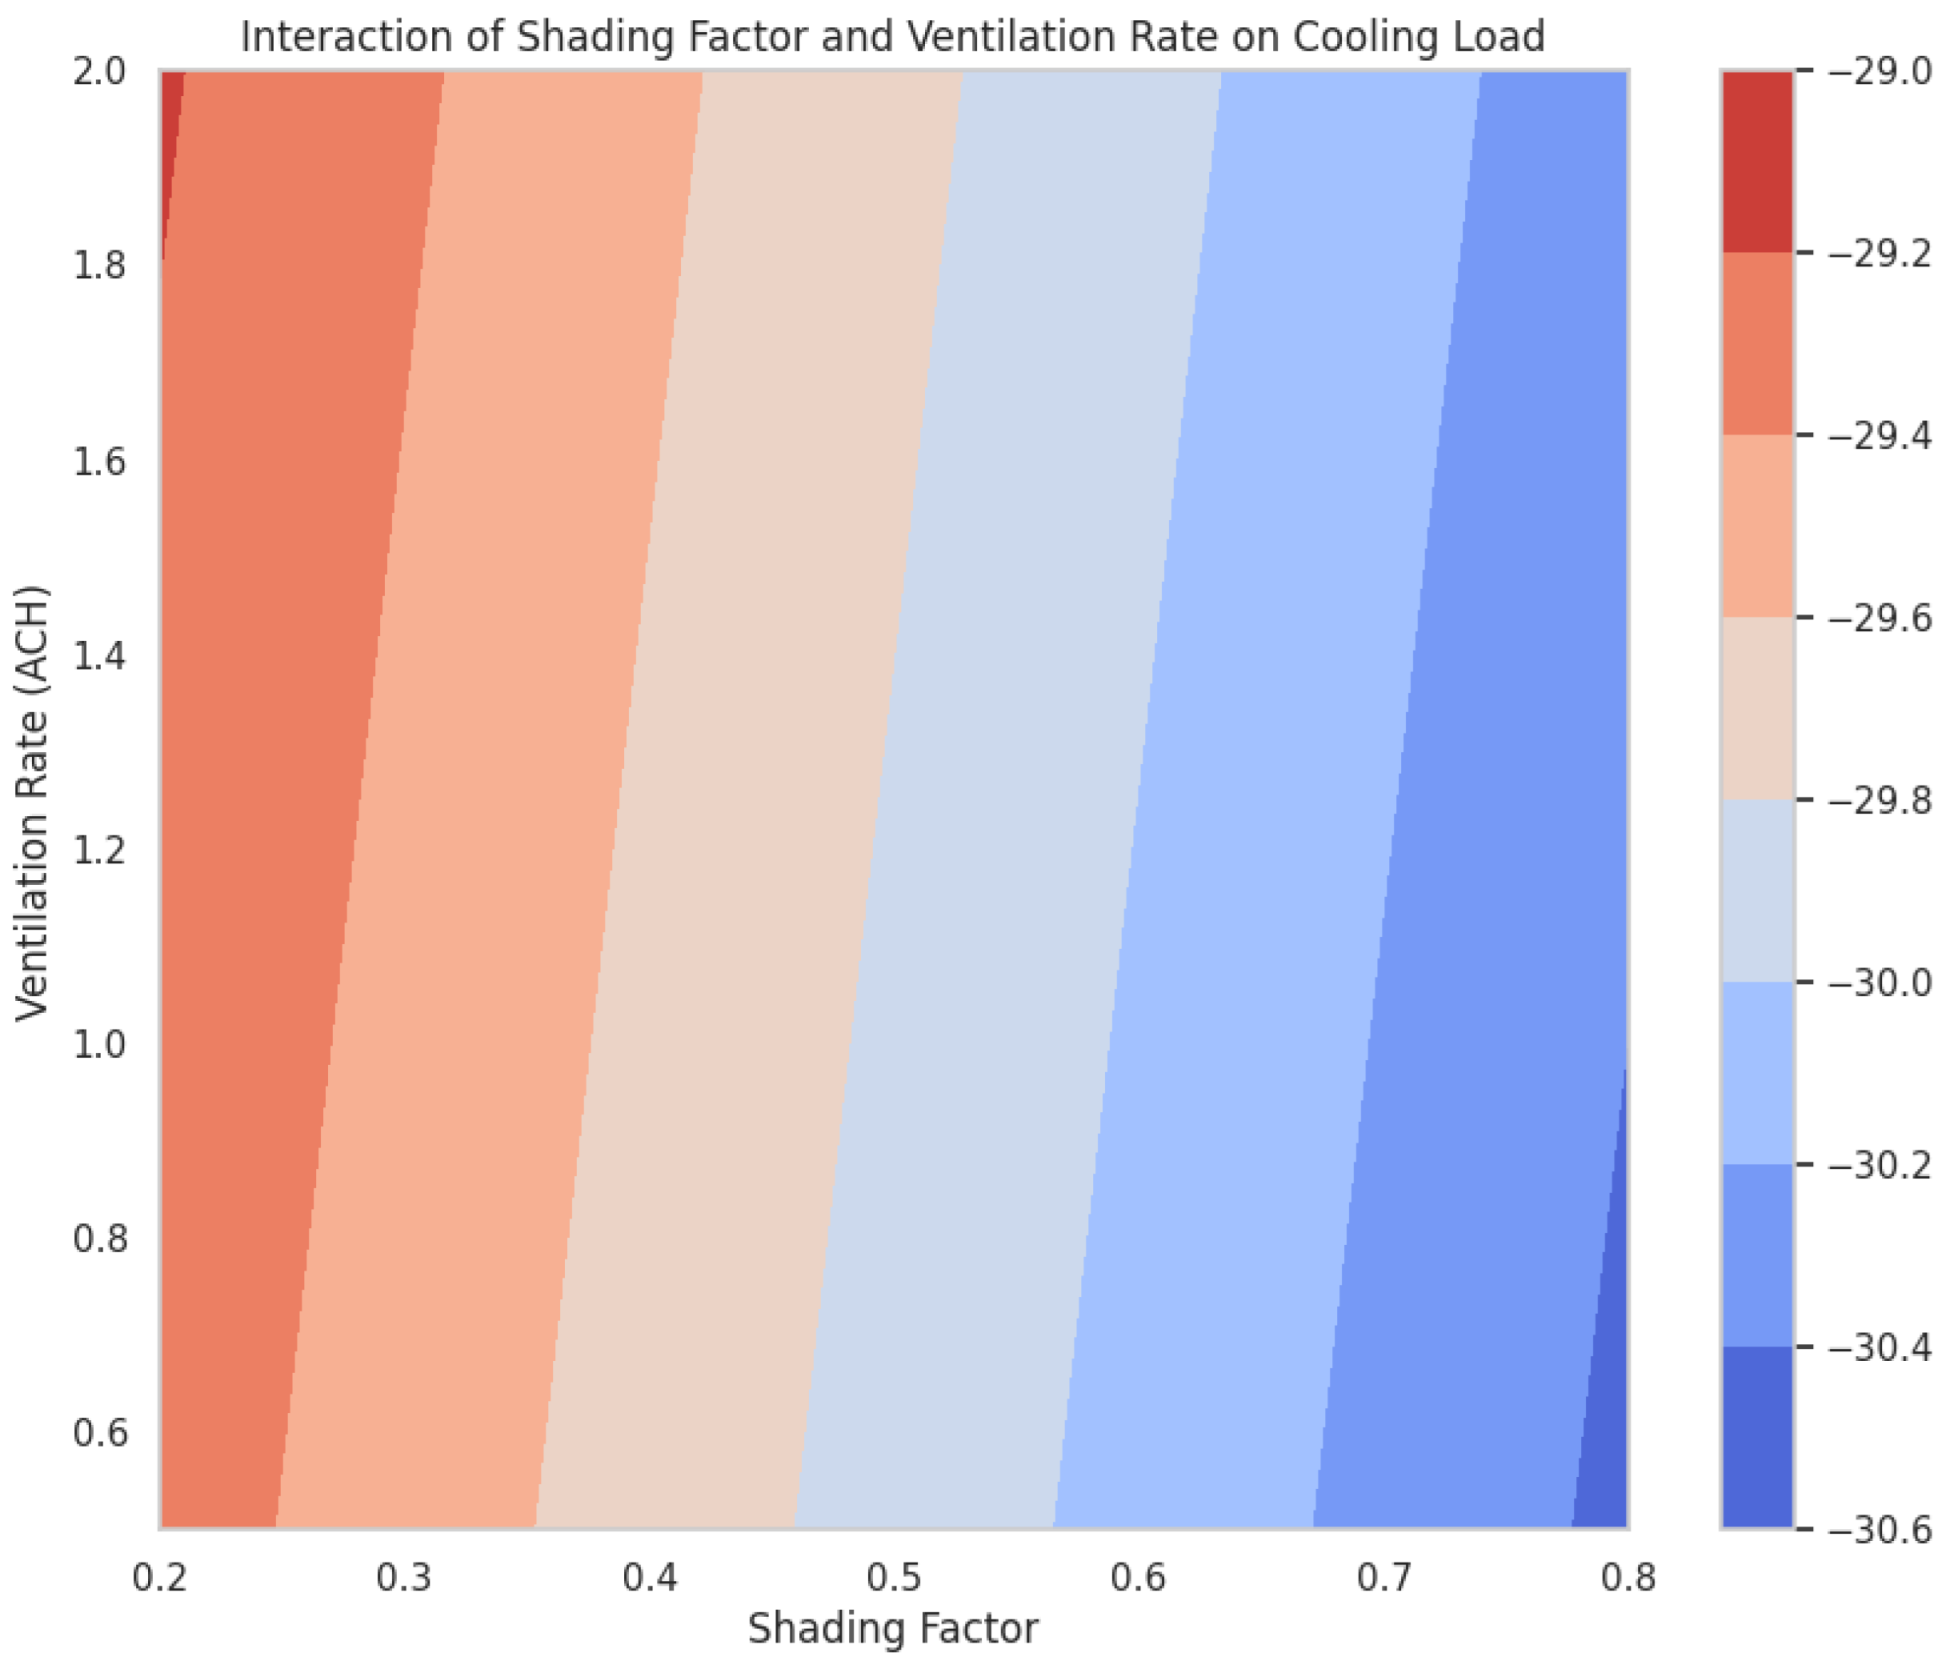
4.2. Parametric Analysis
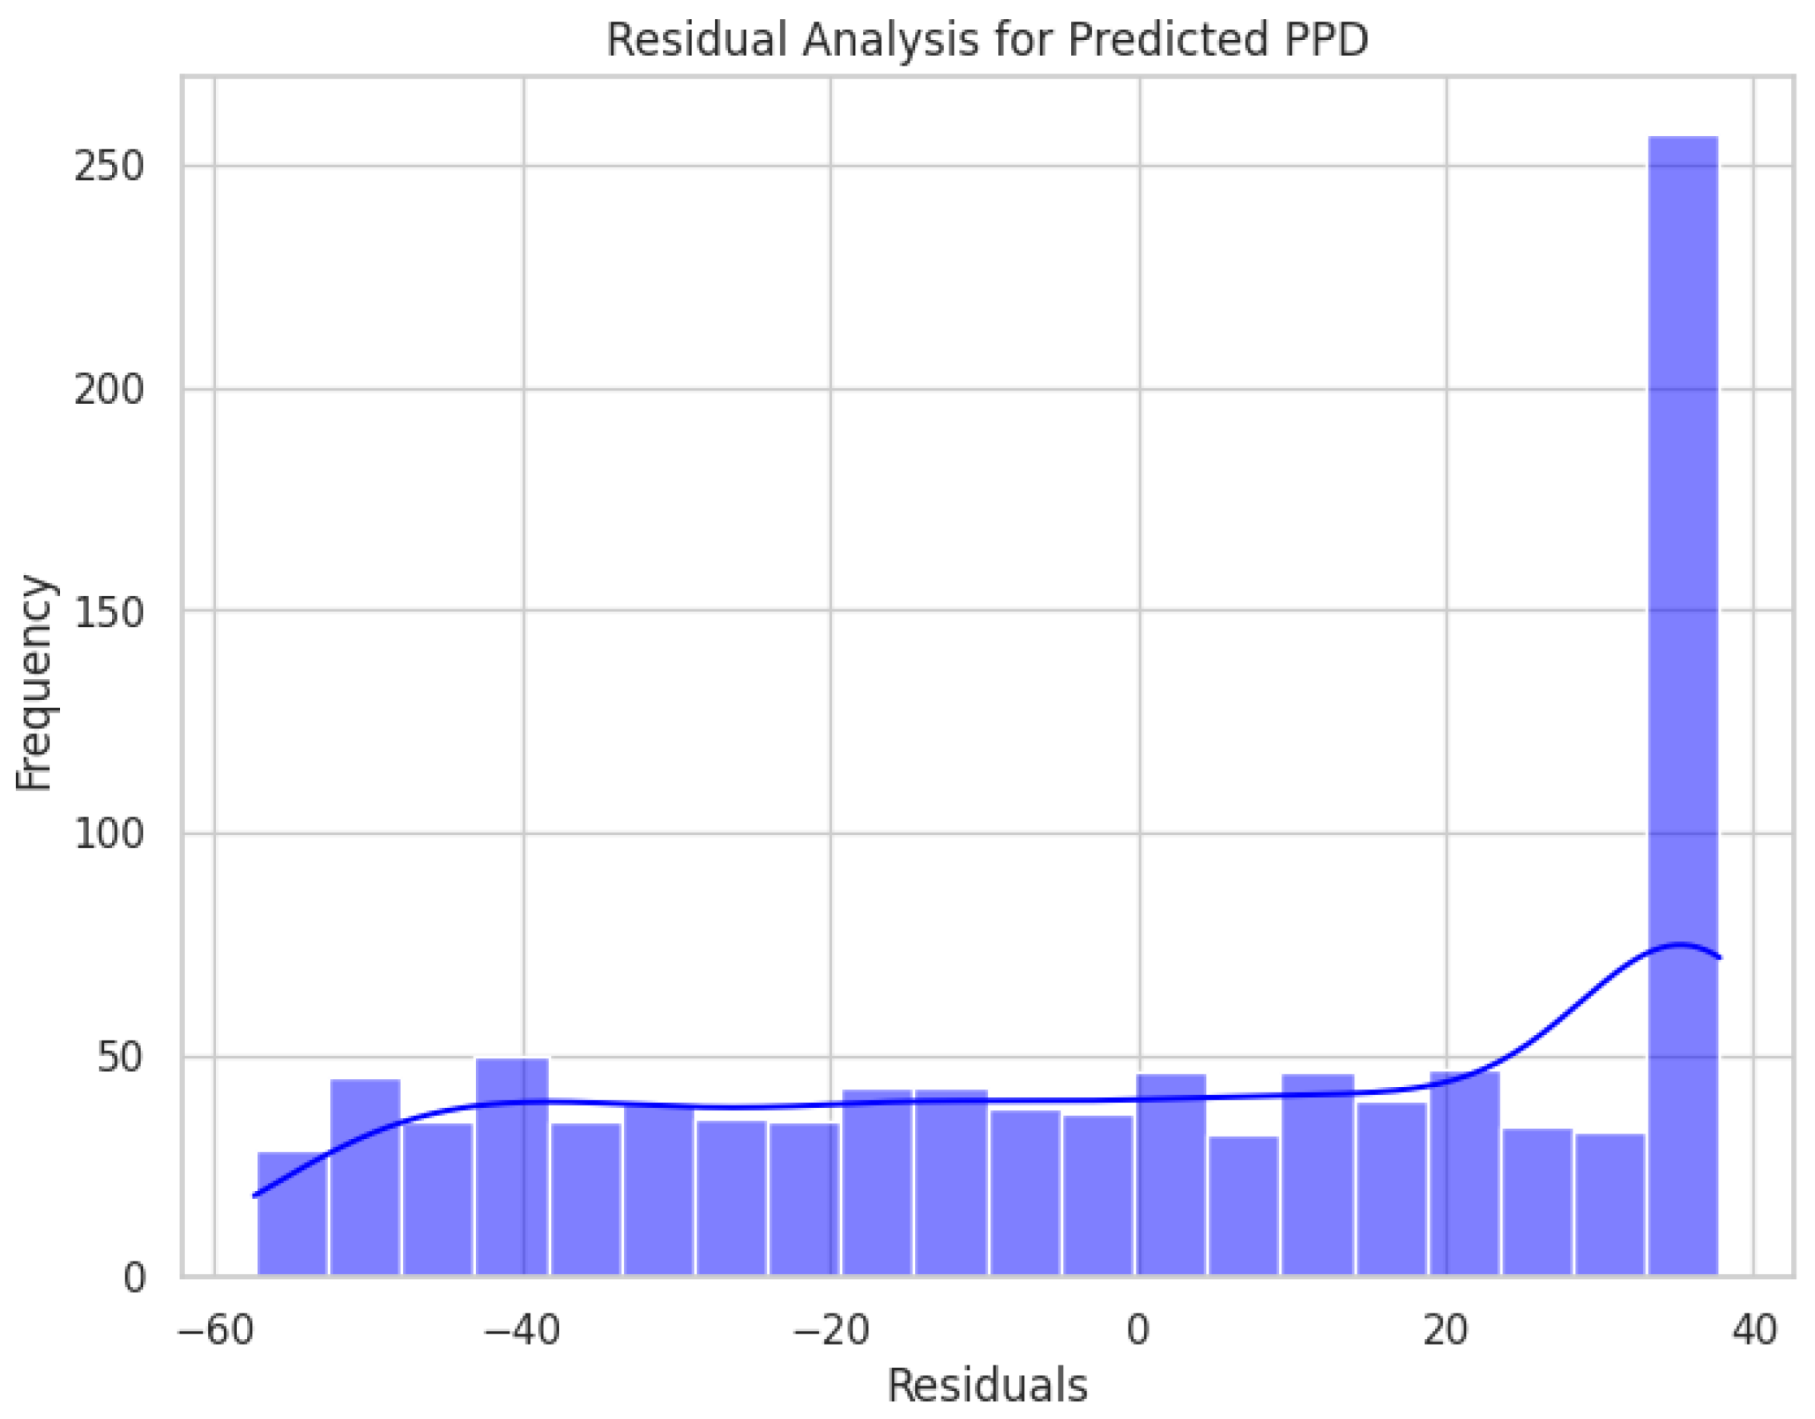
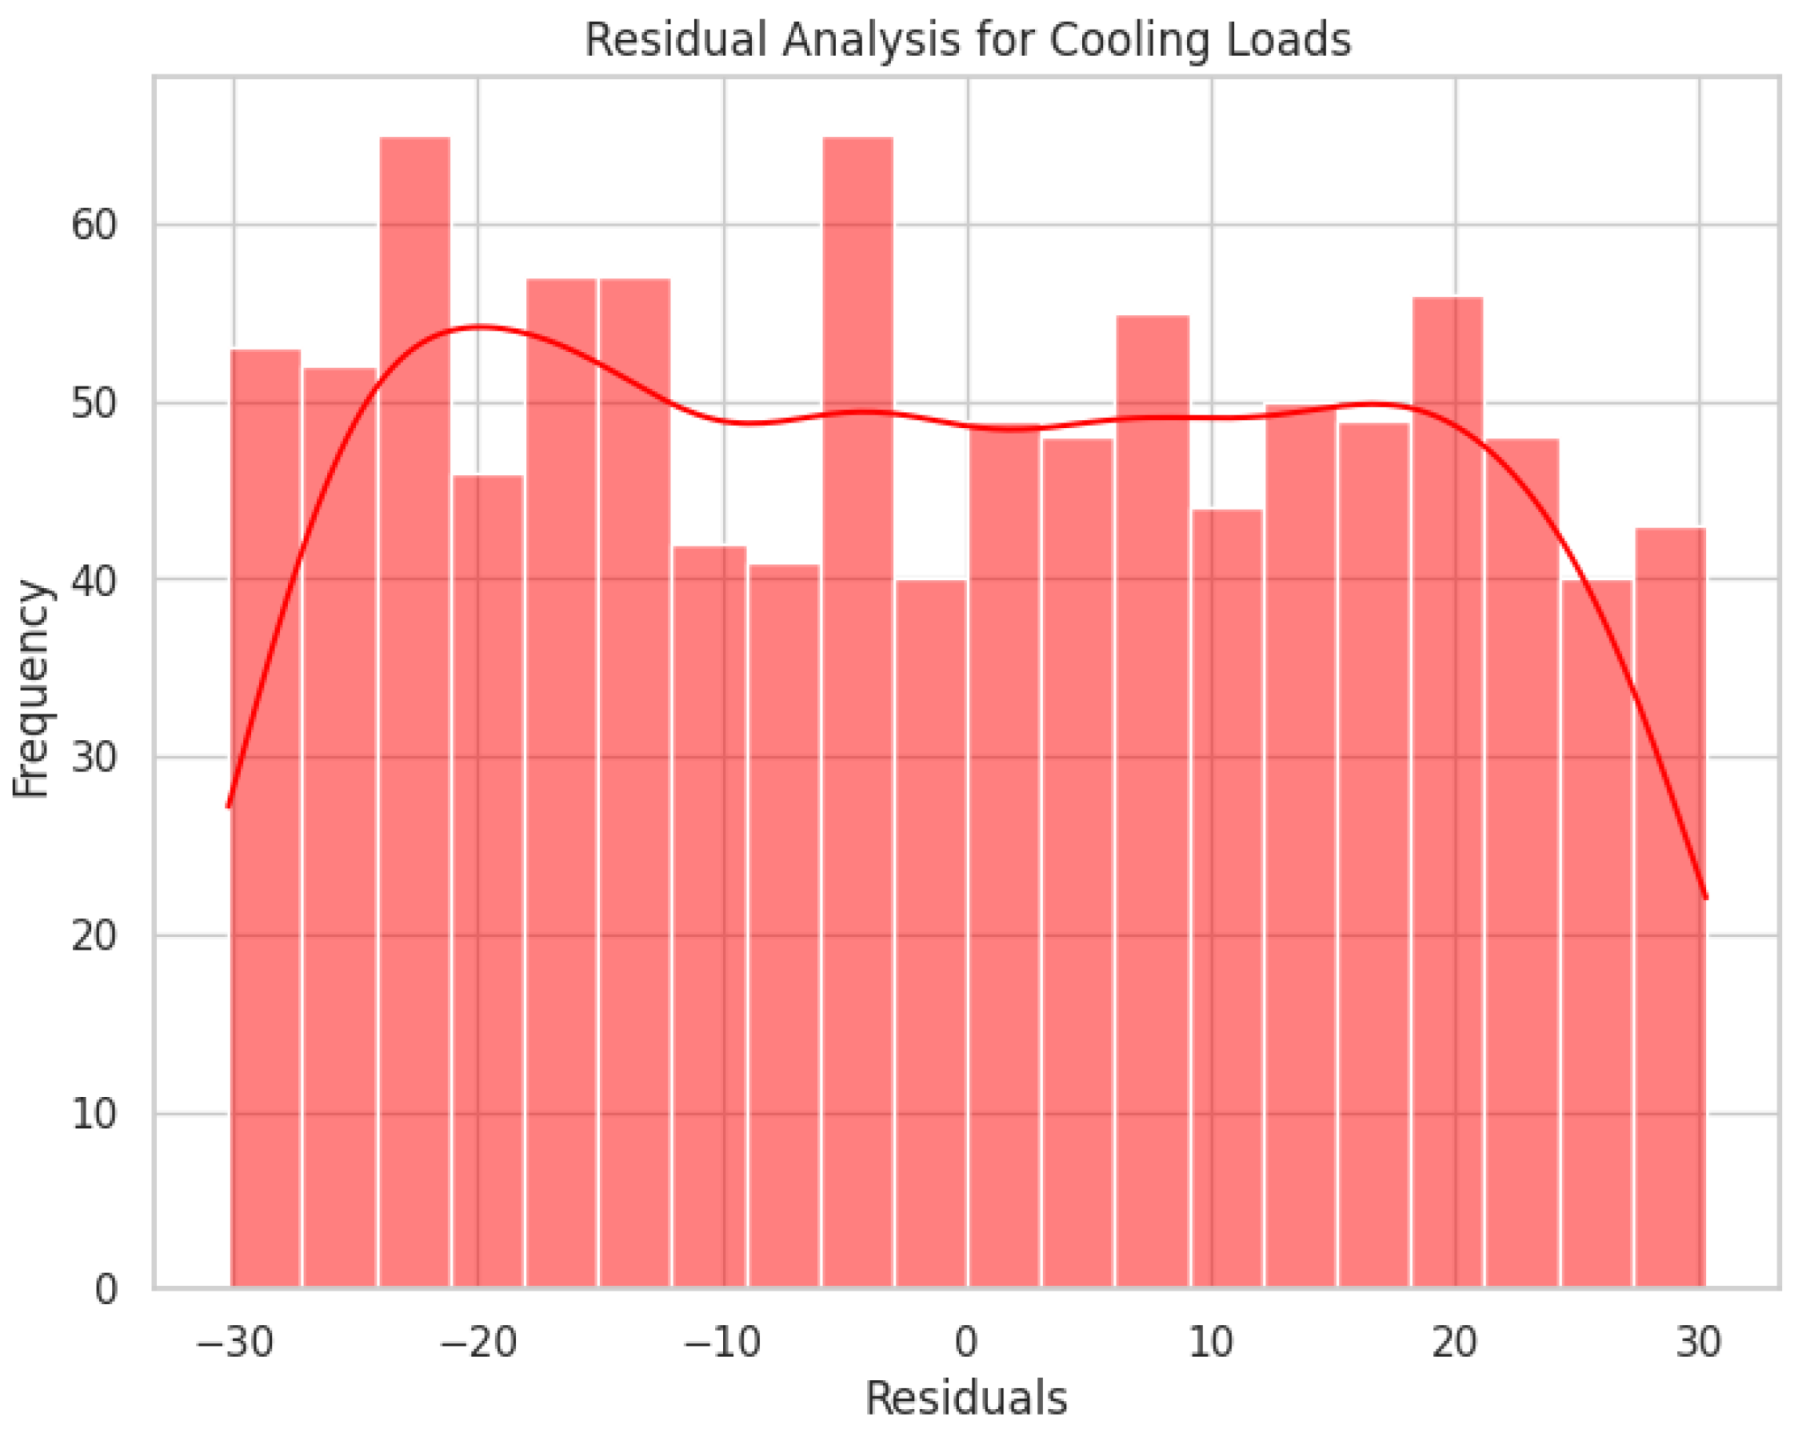
4.3. Regression Modeling
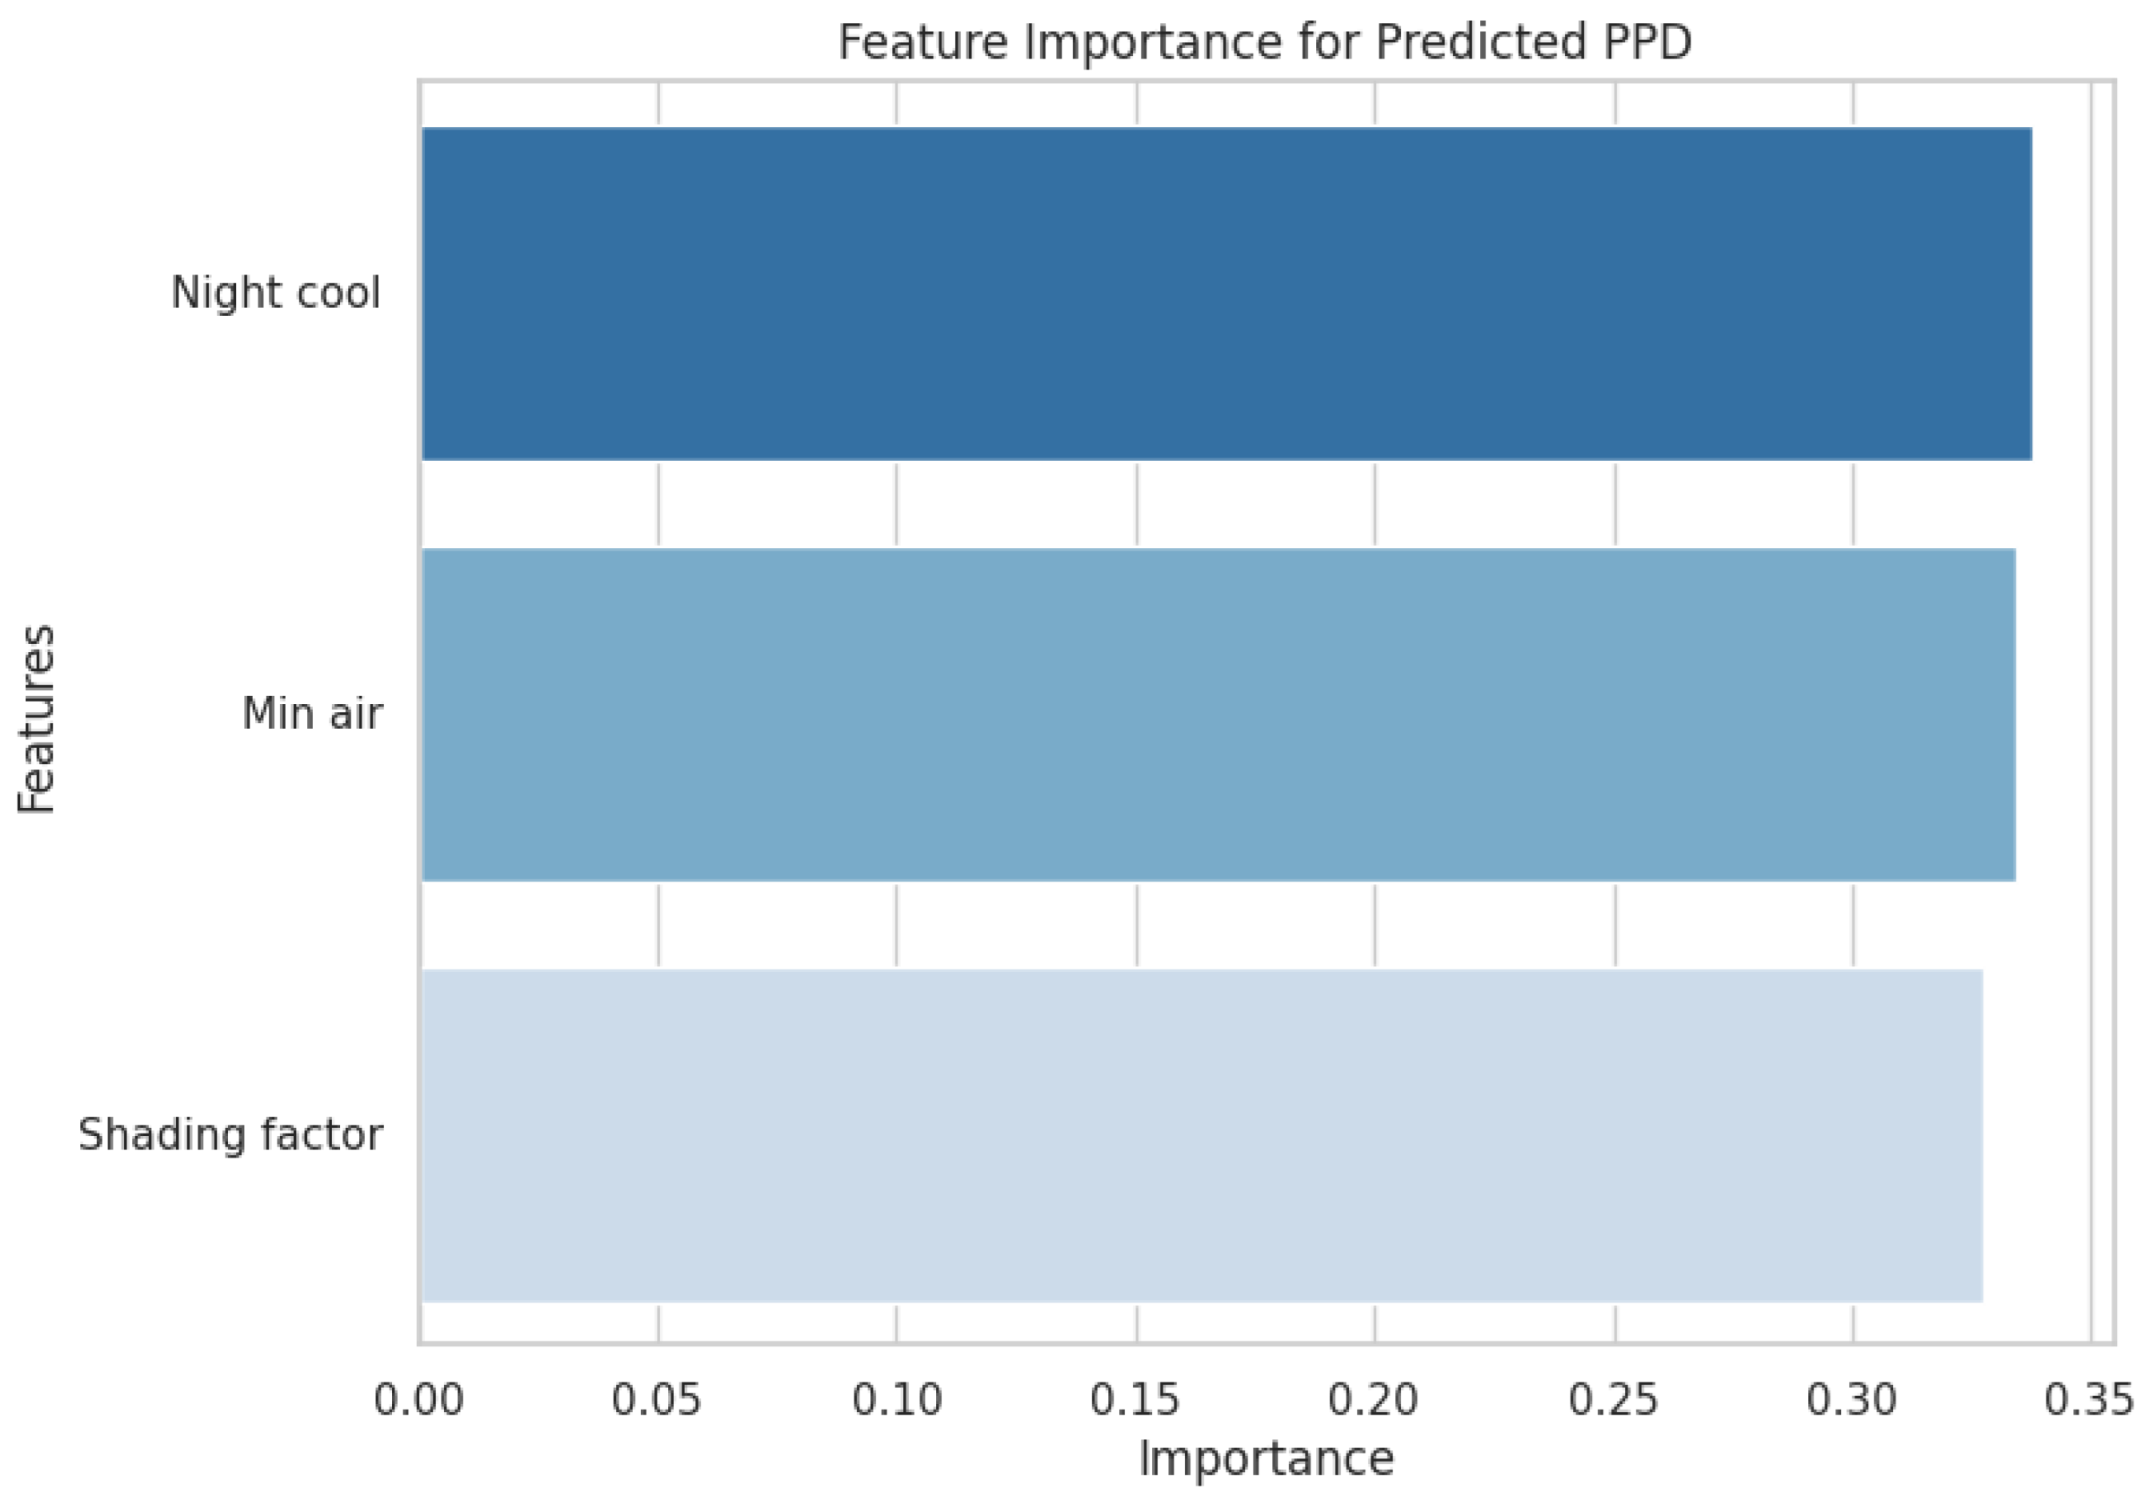
4.4. Machine Learning Analysis
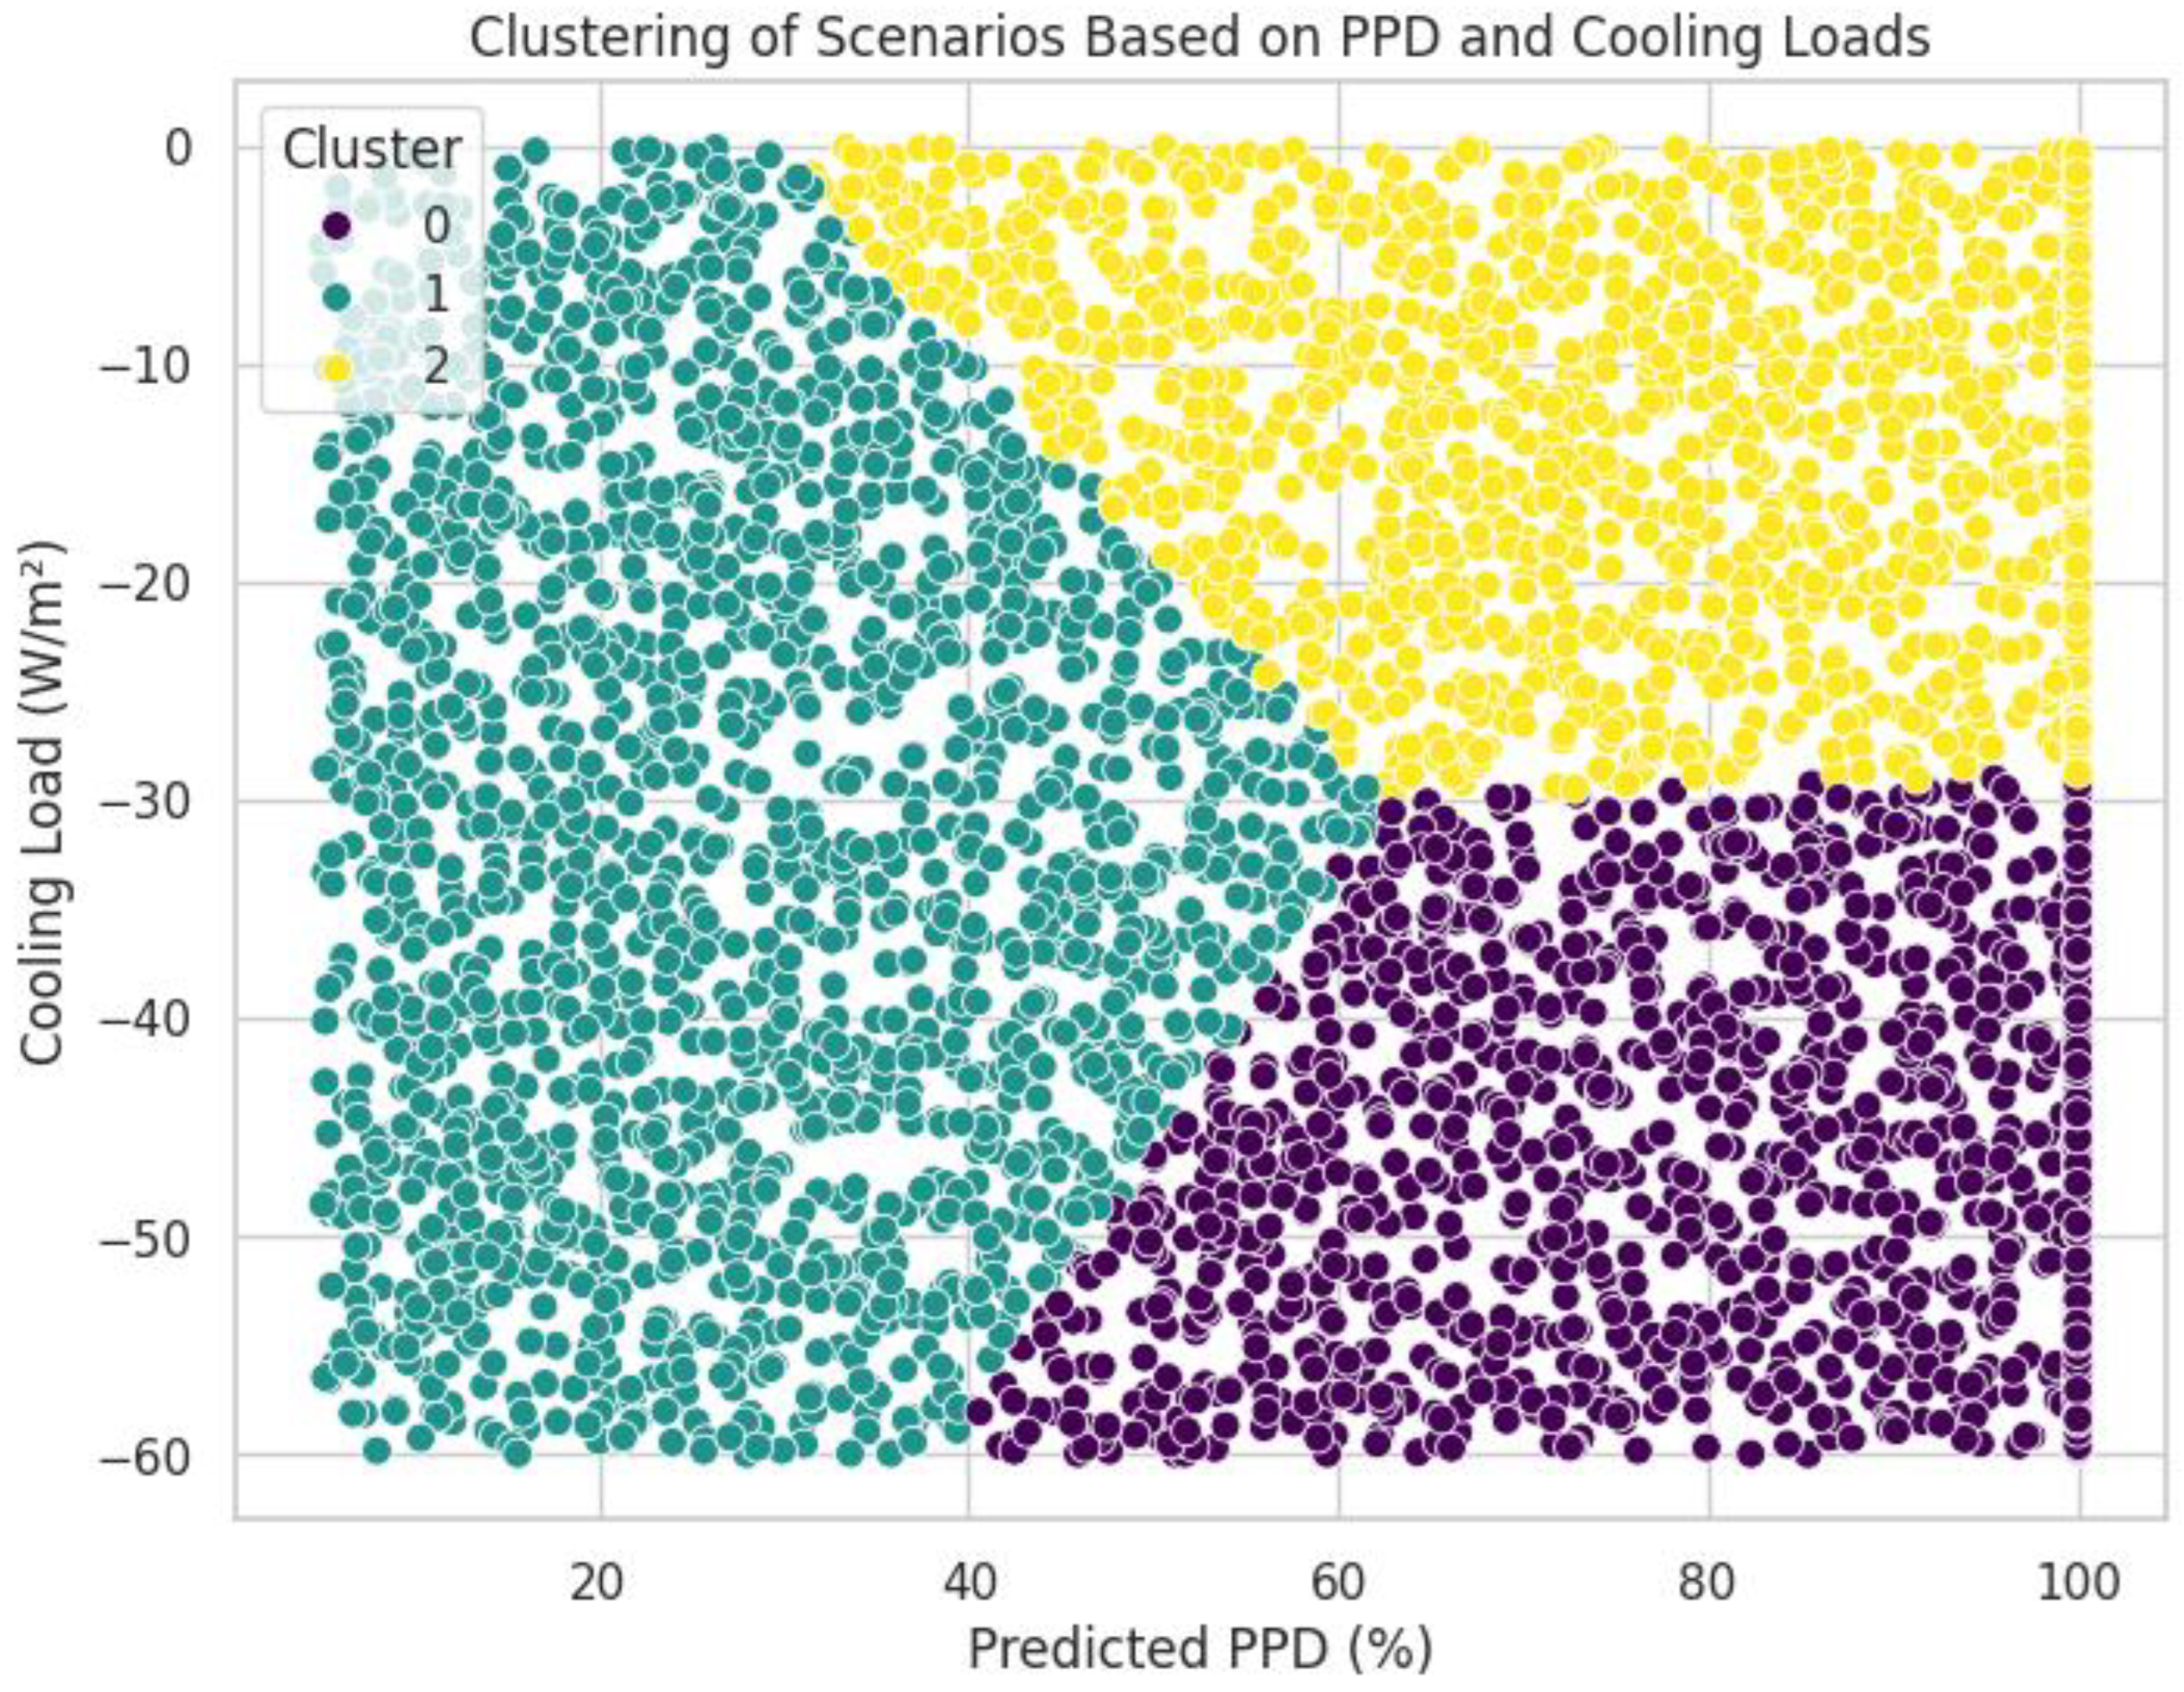
4.5. Scenario Analysis
5. Discussion
6. Limitations and Future Work
7. Conclusions
Funding
Data Availability Statement
Acknowledgments
Conflicts of Interest
References
- Huang, L.; Krigsvoll, G.; Johansen, F.; Liu, Y.; Zhang, X. Carbon emission of global construction sector. Renew. Sustain. Energy Rev. 2018, 81, 1906–1916. [Google Scholar] [CrossRef]
- Khahro, S.H.; Kumar, D.; Siddiqui, F.H.; Ali, T.H.; Raza, M.S.; Khoso, A.R. Optimizing Energy Use, Cost and Carbon Emission through Building Information Modelling and a Sustainability Approach: A Case-Study of a Hospital Building. Sustainability 2021, 13, 3675. [Google Scholar] [CrossRef]
- Mazzetto, S. Integrating Emerging Technologies with Digital Twins for Heritage Building Conservation: An Interdisciplinary Approach with Expert Insights and Bibliometric Analysis. Heritage 2024, 7, 6432–6479. [Google Scholar] [CrossRef]
- Pacheco, R.; Ordóñez, J.; Martínez, G. Energy efficient design of building: A review. Renew. Sustain. Energy Rev. 2012, 16, 3559–3573. [Google Scholar] [CrossRef]
- Abbasi, M.A.K.; Khahro, S.H.; Javed, Y. Carbon Dioxide Footprint and Its Impacts: A Case of Academic Buildings. Sustainability 2021, 13, 7847. [Google Scholar] [CrossRef]
- Mahdy, M.; Elwy, I.; Mahmoud, S.; Abdelalim, M.; Fahmy, M. The impact of using different weather datasets for predicting current and future energy performance of residential buildings in Egypt. Energy Rep. 2022, 8, 372–378. [Google Scholar] [CrossRef]
- Sirror, H.; Labib, W.; Abowardah, E.; Metwally, W.; Mitchell, C. Sustainability in the Workplace: Evaluating Indoor Environmental Quality of a Higher Education Building in Riyadh. Buildings 2024, 14, 2115. [Google Scholar] [CrossRef]
- Al-Masrani, S.M.; Al-Obaidi, K.M. Dynamic shading systems: A review of design parameters, platforms and evaluation strategies. Autom. Constr. 2019, 102, 195–216. [Google Scholar] [CrossRef]
- Chan, H.-Y.; Riffat, S.B.; Zhu, J. Review of passive solar heating and cooling technologies. Renew. Sustain. Energy Rev. 2010, 14, 781–789. [Google Scholar] [CrossRef]
- Tzempelikos, A.; Athienitis, A.K. The impact of shading design and control on building cooling and lighting demand. Sol. Energy 2007, 81, 369–382. [Google Scholar] [CrossRef]
- Al-Masrani, S.M.; Al-Obaidi, K.M.; Zalin, N.A.; Aida Isma, M.I. Design optimisation of solar shading systems for tropical office buildings: Challenges and future trends. Sol. Energy 2018, 170, 849–872. [Google Scholar] [CrossRef]
- Lai, K.; Wang, W.; Giles, H. Experimental study on the shading performance of a window integrated with grid shading configuration. Sci. Technol. Built Environ. 2018, 24, 560–570. [Google Scholar] [CrossRef]
- Mohammadzadeh, A.; Kavgic, M.; Al-janabi, A. Energy Management System (EMS): The Impact of Natural Ventilation and Shading Control on Thermal Performance of University Building in Winnipeg, Canada. In Building Simulation 2019; IBPSA: Toronto, ON, USA, 2019; Volume 16, pp. 5114–5122. [Google Scholar] [CrossRef]
- Godish, T.; Spengler, J.D. Relationships Between Ventilation and Indoor Air Quality: A Review. Indoor Air 1996, 6, 135–145. [Google Scholar] [CrossRef]
- Peng, Y.; Lei, Y.; Tekler, Z.D.; Antanuri, N.; Lau, S.-K.; Chong, A. Hybrid system controls of natural ventilation and HVAC in mixed-mode buildings: A comprehensive review. Energy Build. 2022, 276, 112509. [Google Scholar] [CrossRef]
- Wang, Z.; Yi, L.; Gao, F. Night ventilation control strategies in office buildings. Sol. Energy 2009, 83, 1902–1913. [Google Scholar] [CrossRef]
- Bre, F.; Fachinotti, V.D. A computational multi-objective optimization method to improve energy efficiency and thermal comfort in dwellings. Energy Build. 2017, 154, 283–294. [Google Scholar] [CrossRef]
- Bellia, L.; Marino, C.; Minichiello, F.; Pedace, A. An Overview on Solar Shading Systems for Buildings. Energy Procedia 2014, 62, 309–317. [Google Scholar] [CrossRef]
- Chi, F.; Xu, Y.; Pan, J. Impact of shading systems with various type-number configuration combinations on energy consumption in traditional dwelling (China). Energy 2022, 255, 124520. [Google Scholar] [CrossRef]
- Aldawoud, A. Conventional fixed shading devices in comparison to an electrochromic glazing system in hot, dry climate. Energy Build. 2013, 59, 104–110. [Google Scholar] [CrossRef]
- Zheng, J.; Tao, Q. Impact of shading louvers on wind-driven single-sided ventilation in a multi-storey building. E3S Web Conf. 2022, 356, 03061. [Google Scholar] [CrossRef]
- Ye, Y.; Xu, P.; Mao, J.; Ji, Y. Experimental study on the effectiveness of internal shading devices. Energy Build. 2016, 111, 154–163. [Google Scholar] [CrossRef]
- Danov, S.; Carbonell, J.; Cipriano, J.; Martí-Herrero, J. Approaches to evaluate building energy performance from daily consumption data considering dynamic and solar gain effects. Energy Build. 2013, 57, 110–118. [Google Scholar] [CrossRef]
- Atzeri, A.; Cappelletti, F.; Gasparella, A. Internal Versus External Shading Devices Performance in Office Buildings. Energy Procedia 2014, 45, 463–472. [Google Scholar] [CrossRef]
- Brzezicki, M. Enhancing Daylight Comfort with Climate-Responsive Kinetic Shading: A Simulation and Experimental Study of a Horizontal Fin System. Sustainability 2024, 16, 8156. [Google Scholar] [CrossRef]
- Li, Z.; Wu, Z. A study on the impact of electrochromic glazing on indoor environment. J. Build. Eng. 2024, 86, 108684. [Google Scholar] [CrossRef]
- Shen, E.; Hu, J.; Patel, M. Energy and visual comfort analysis of lighting and daylight control strategies. Build. Environ. 2014, 78, 155–170. [Google Scholar] [CrossRef]
- Premier, A. Solar shading devices integrating smart materials: An overview of projects, prototypes and products for advanced façade design. Archit. Sci. Rev. 2019, 62, 455–465. Available online: https://www.tandfonline.com/doi/abs/10.1080/00038628.2019.1653259 (accessed on 23 November 2024).
- Arnaoutakis, G.E.; Katsaprakakis, D.A. Energy performance of buildings with thermochromic windows in Mediterranean climates. Energies 2021, 14, 6977. [Google Scholar] [CrossRef]
- Stavrakakis, G.M.; Bakirtzis, D.; Drakaki, K.-K.; Yfanti, S.; Katsaprakakis, D.A.; Braimakis, K.; Langouranis, P.; Terzis, K.; Zervas, P.L. Application of the Typology Approach for Energy Renovation Planning of Public Buildings’ Stocks at the Local Level: A Case Study in Greece. Energies 2024, 17, 689. [Google Scholar] [CrossRef]
- Arsad, A.; Azhar, A.; Arsad, S.; Zuhdi, A.; Chau, C.; Ghazali, A. Towards artificial intelligence for solar charge controller: An analytical study of recent status, optimization and module development. Energy Syst. 2025, 1–54. [Google Scholar] [CrossRef]
- Ali, B.M.; Akkaş, M. The Green Cooling Factor: Eco-Innovative Heating, Ventilation, and Air Conditioning Solutions in Building Design. Appl. Sci. 2024, 14, 195. [Google Scholar] [CrossRef]
- Emmerich, S.J. Simulated Performance of Natural and Hybrid Ventilation Systems in an Office Building. HVACR Res. 2006, 12, 975–1004. [Google Scholar] [CrossRef]
- Aflaki, A.; Mahyuddin, N.; Al-Cheikh Mahmoud, Z.; Baharum, M.R. A review on natural ventilation applications through building façade components and ventilation openings in tropical climates. Energy Build. 2015, 101, 153–162. [Google Scholar] [CrossRef]
- Larsen, T.S.; Plesner, C.; Leprince, V.; Carrié, F.R.; Bejder, A.K. Calculation methods for single-sided natural ventilation: Now and ahead. Energy Build. 2018, 177, 279–289. [Google Scholar] [CrossRef]
- Pan, Y.; Zhong, W.; Zheng, X.; Xu, H.; Zhang, T. Natural ventilation in vernacular architecture: A systematic review of bioclimatic ventilation design and its performance evaluation. Build. Environ. 2024, 253, 111317. [Google Scholar] [CrossRef]
- Homod, R.Z.; Sahari, K.S.M.; Almurib, H.A.F. Energy saving by integrated control of natural ventilation and HVAC systems using model guide for comparison. Renew. Energy 2014, 71, 639–650. [Google Scholar] [CrossRef]
- Yang, S.; Wan, M.P.; Ng, B.F.; Dubey, S.; Henze, G.P.; Chen, W.; Baskaran, K. Model predictive control for integrated control of air-conditioning and mechanical ventilation, lighting and shading systems. Appl. Energy 2021, 297, 117112. [Google Scholar] [CrossRef]
- George, E. Advanced Thermodynamic Analyses of Energy Intensive Building Mechanical Systems. Graduate Thesis, Rochester Institute of Technology, Rochester, NY, USA, 2006. Available online: https://repository.rit.edu/theses/8272 (accessed on 17 March 2025).
- Artmann, N.; Manz, H.; Heiselberg, P. Climatic potential for passive cooling of buildings by night-time ventilation in Europe. Appl. Energy 2007, 84, 187–201. [Google Scholar] [CrossRef]
- Palanisamy, D.; Ayalur, B.K. Development and testing of condensate assisted pre-cooling unit for improved indoor air quality in a computer laboratory. Build. Environ. 2019, 163, 106321. [Google Scholar] [CrossRef]
- Darmanis, M.; Çakan, M.; Moustris, K.P.; Kavadias, K.A.; Nikas, K.-S.P. Utilisation of Mass and Night Ventilation in Decreasing Cooling Load Demand. Sustainability 2020, 12, 7826. [Google Scholar] [CrossRef]
- Stavrakakis, G.M.; Katsaprakakis, D.A.; Damasiotis, M. Basic principles, most common computational tools, and capabilities for building energy and urban microclimate simulations. Energies 2021, 14, 6707. [Google Scholar] [CrossRef]
- Shen, R.; Jiao, Z.; Parker, T.; Sun, Y.; Wang, Q. Recent application of Computational Fluid Dynamics (CFD) in process safety and loss prevention: A review. J. Loss Prev. Process Ind. 2020, 67, 104252. [Google Scholar] [CrossRef]
- Wijesooriya, K.; Mohotti, D.; Lee, C.-K.; Mendis, P. A technical review of computational fluid dynamics (CFD) applications on wind design of tall buildings and structures: Past, present and future. J. Build. Eng. 2023, 74, 106828. [Google Scholar]
- Sezer, N.; Yoonus, H.; Zhan, D.; Wang, L.L.; Hassan, I.G.; Rahman, M.A. Urban microclimate and building energy models: A review of the latest progress in coupling strategies. Renew. Sustain. Energy Rev. 2023, 184, 113577. [Google Scholar]
- Katal, A.; Mortezazadeh, M.; Wang, L.L.; Yu, H. Urban building energy and microclimate modeling–From 3D city generation to dynamic simulations. Energy 2022, 251, 123817. [Google Scholar]
- Yang, S.; Wang, L.L.; Stathopoulos, T.; Marey, A.M. Urban microclimate and its impact on built environment–a review. Build. Environ. 2023, 238, 110334. [Google Scholar]
- Cheng, Y.; Lin, Z.; Fong, A.M.L. Effects of temperature and supply airflow rate on thermal comfort in a stratum-ventilated room. Build. Environ. 2015, 92, 269–277. [Google Scholar] [CrossRef]
- Chenari, B.; Dias Carrilho, J.; Gameiro da Silva, M. Towards sustainable, energy-efficient and healthy ventilation strategies in buildings: A review. Renew. Sustain. Energy Rev. 2016, 59, 1426–1447. [Google Scholar] [CrossRef]
- Sun, B.; Luh, P.B.; Jia, Q.-S.; Jiang, Z.; Wang, F.; Song, C. Building Energy Management: Integrated Control of Active and Passive Heating, Cooling, Lighting, Shading, and Ventilation Systems. IEEE Trans. Autom. Sci. Eng. 2013, 10, 588–602. [Google Scholar] [CrossRef]
- Yüksel, A.; Arıcı, M.; Krajčík, M.; Civan, M.; Karabay, H. A review on thermal comfort, indoor air quality and energy consumption in temples. J. Build. Eng. 2021, 35, 102013. [Google Scholar] [CrossRef]
- Turhan, C.; Özbey, M.F.; Çeter, A.E.; Akkurt, G.G. A Novel Data-Driven Model for the Effect of Mood State on Thermal Sensation. Buildings 2023, 13, 1662. [Google Scholar] [CrossRef]
- Yusoff, W.F.M.; Shaharil, M.I.; Mohamed, M.F.; Rasani, M.R.M.; Sapian, A.R.; Dahlan, N.D. Review of openings with shading devices at naturally ventilated buildings. Archit. Eng. Des. Manag. 2023, 19, 463–479. [Google Scholar] [CrossRef]
- SeppȨnen, O. Ventilation Strategies for Good Indoor Air Quality and Energy Efficiency. Int. J. Vent. 2008, 6, 297–306. [Google Scholar] [CrossRef]
- De Grussa, A.; Andrews, D.; Chalk, A.; Bush, D. A Case Study assessing the impact of Shading Systems combined with Night-Time Ventilation strategies on Overheating within a Residential Property. In Proceedings of the 8th AIVC—6th TightVent & 4th Venticool Conference, 2017 Ventilating Healthy Low-Energy Buildings, Nottingham, UK, 13–14 September 2017; Available online: https://openresearch.lsbu.ac.uk/item/86xv5 (accessed on 9 December 2024).
- Ahemd, H.A.; Al-Faraj, A.A.; Abdel-Ghany, A.M. Shading greenhouses to improve the microclimate, energy and water saving in hot regions: A review. Sci. Hortic. 2016, 201, 36–45. [Google Scholar] [CrossRef]
- Freewan, A.A.Y. Impact of external shading devices on thermal and daylighting performance of offices in hot climate regions. Sol. Energy 2014, 102, 14–30. [Google Scholar] [CrossRef]
- Haase, M.; Marques da Silva, F.; Amato, A. Simulation of ventilated facades in hot and humid climates. Energy Build. 2009, 41, 361–373. [Google Scholar] [CrossRef]
- Dutta, A.; Samanta, A.; Neogi, S. Influence of orientation and the impact of external window shading on building thermal performance in tropical climate. Energy Build. 2017, 139, 680–689. [Google Scholar] [CrossRef]
- Lu, X.; O’Neill, Z.; Li, Y.; Niu, F. A novel simulation-based framework for sensor error impact analysis in smart building systems: A case study for a demand-controlled ventilation system. Appl. Energy 2020, 263, 114638. [Google Scholar] [CrossRef]
- Yang, L.; Yan, H.; Lam, J.C. Thermal comfort and building energy consumption implications—A review. Appl. Energy 2014, 115, 164–173. [Google Scholar] [CrossRef]
- Santamouris, M.; Kolokotsa, D. Passive cooling dissipation techniques for buildings and other structures: The state of the art. Energy Build. 2013, 57, 74–94. [Google Scholar] [CrossRef]
- Allard, F.; Ghiaus, C. Natural Ventilation in the Urban Environment: Assessment and Design; Routledge: London, UK, 2012. [Google Scholar]
- Taherian, H.; Peters, R.W. Advanced Active and Passive Methods in Residential Energy Efficiency. Energies 2023, 16, 3905. [Google Scholar] [CrossRef]
- Knuutila, M.; Kosonen, A.; Jaatinen-Värri, A.; Laaksonen, P. Profitability comparison of active and passive energy efficiency improvements in public buildings. Energy Effic. 2022, 15, 38. [Google Scholar]
- Lotfabadi, P. Analyzing passive solar strategies in the case of high-rise building. Renew. Sustain. Energy Rev. 2015, 52, 1340–1353. [Google Scholar] [CrossRef]
- Nielsen, M.V.; Svendsen, S.; Jensen, L.B. Quantifying the potential of automated dynamic solar shading in office buildings through integrated simulations of energy and daylight. Sol. Energy 2011, 85, 757–768. [Google Scholar]
- Neto, A.H.; Fiorelli, F.A.S. Comparison between detailed model simulation and artificial neural network for forecasting building energy consumption. Energy Build. 2008, 40, 2169–2176. [Google Scholar]
- Xu, Y.; Guo, C.; Yang, J.; Yuan, Z.; Ho, H.C. Modelling impact of high-rise, high-density built environment on Covid-19 risks: Empirical results from A case study of two Chinese cities. Int. J. Environ. Res. Public Health 2023, 20, 1422. [Google Scholar]
- Qin, S.; Liu, Y.; Yu, G.; Li, R. Assessing the potential of integrated shading devices to mitigate overheating risk in university buildings in severe cold regions of China: A case study in Harbin. Energies 2023, 16, 6259. [Google Scholar] [CrossRef]
- Jiang, Y.; Qi, Z.; Ran, S.; Ma, Q. A study on the effect of dynamic photovoltaic shading devices on energy consumption and daylighting of an office building. Buildings 2024, 14, 596. [Google Scholar] [CrossRef]
- Stein-Montalvo, L.; Ding, L.; Hultmark, M.; Adriaenssens, S.; Bou-Zeid, E. Kirigami-inspired wind steering for natural ventilation. J. Wind Eng. Ind. Aerodyn. 2024, 246, 105667. [Google Scholar] [CrossRef]
- Alwelayti, D.; Dehwah, A.H.; Krarti, M. Assessment of Dynamic Photovoltaic Shading Systems on Energy Performance of Commercial Buildings. J. Eng. Sustain. Build. Cities 2022, 3, 041003. [Google Scholar]
- Yi, Y.K.; Anis, M.; Jang, K.; Kim, Y.-J. Application of machine learning (ML) and genetic algorithm (GA) to optimize window wing wall design for natural ventilation. J. Build. Eng. 2023, 68, 106218. [Google Scholar] [CrossRef]
- Alsharif, R.; Arashpour, M.; Golafshani, E.; Rashidi, A.; Li, H. Multi-objective optimization of shading devices using ensemble machine learning and orthogonal design of experiments. Energy Build. 2023, 283, 112840. [Google Scholar] [CrossRef]
- Rodriguez-Galiano, V.; Sanchez-Castillo, M.; Chica-Olmo, M.; Chica-Rivas, M. Machine learning predictive models for mineral prospectivity: An evaluation of neural networks, random forest, regression trees and support vector machines. Ore Geol. Rev. 2015, 71, 804–818. [Google Scholar] [CrossRef]
- Jun, M.-J. A comparison of a gradient boosting decision tree, random forests, and artificial neural networks to model urban land use changes: The case of the Seoul metropolitan area. Int. J. Geogr. Inf. Sci. 2021, 35, 2149–2167. [Google Scholar] [CrossRef]
- Fallah, A.M.; Ghafourian, E.; Shahzamani Sichani, L.; Ghafourian, H.; Arandian, B.; Nehdi, M.L. Novel Neural Network Optimized by Electrostatic Discharge Algorithm for Modification of Buildings Energy Performance. Sustainability 2023, 15, 2884. [Google Scholar] [CrossRef]
- Bekdaş, G.; Aydın, Y.; Isıkdağ, Ü.; Sadeghifam, A.N.; Kim, S.; Geem, Z.W. Prediction of Cooling Load of Tropical Buildings with Machine Learning. Sustainability 2023, 15, 9061. [Google Scholar] [CrossRef]
- Homod, R.Z.; Mohamed Sahari, K.S.; Almurib, H.A.F.; Nagi, F.H. RLF and TS fuzzy model identification of indoor thermal comfort based on PMV/PPD. Build. Environ. 2012, 49, 141–153. [Google Scholar] [CrossRef]
- Ahmed, M.; Seraj, R.; Islam, S.M.S. The k-means Algorithm: A Comprehensive Survey and Performance Evaluation. Electronics 2020, 9, 1295. [Google Scholar] [CrossRef]
- Aijazi, A.N. (Arfa N. Machine learning paradigms for building energy performance simulations. Graduate Thesis, Massachusetts Institute of Technology, Cambridge, MA, USA, 2017. [Google Scholar]
- Grégoire, G. Multiple Linear Regression. Eur. Astron. Soc. Publ. Ser. 2014, 66, 45–72. [Google Scholar] [CrossRef]
- Lo Verso, V.R.M.; Pellegrino, A.; Pellerey, F. A multivariate non-linear regression model to predict the energy demand for lighting in rooms with different architectural features and lighting control systems. Energy Build. 2014, 76, 151–163. [Google Scholar] [CrossRef]
- Moayedi, H.; Bui, D.T.; Dounis, A.; Lyu, Z.; Foong, L.K. Predicting Heating Load in Energy-Efficient Buildings Through Machine Learning Techniques. Appl. Sci. 2019, 9, 4338. [Google Scholar] [CrossRef]
- Roy, S.S.; Samui, P.; Nagtode, I.; Jain, H.; Shivaramakrishnan, V.; Mohammadi-ivatloo, B. Forecasting heating and cooling loads of buildings: A comparative performance analysis. J. Ambient Intell. Humaniz. Comput. 2020, 11, 1253–1264. [Google Scholar] [CrossRef]
- Mangos, P.M.; Hulse, N.A. Advances in machine learning applications for scenario intelligence: Deep learning. Theor. Issues Ergon. Sci. 2017, 18, 184–198. [Google Scholar] [CrossRef]
- Wang, X. Space Layout Optimization For Natural Ventilation Using Machine Learning Techniques; Harvard University: Cambridge, MA, USA, 2024; Available online: https://dash.harvard.edu/handle/1/37378680 (accessed on 24. November 2024).
- O’Neal, K.; Brisk, P. Predictive Modeling for CPU, GPU, and FPGA Performance and Power Consumption: A Survey. In Proceedings of the 2018 IEEE Computer Society Annual Symposium on VLSI (ISVLSI), Hong Kong, 8–11 July 2018; pp. 763–768. [Google Scholar]
- Cai, W.; Wei, R.; Xu, L.; Ding, X. A method for modelling greenhouse temperature using gradient boost decision tree. Inf. Process. Agric. 2022, 9, 343–354. [Google Scholar] [CrossRef]
- Polo, J.; Martín-Chivelet, N.; Alonso-Abella, M.; Sanz-Saiz, C.; Cuenca, J.; de la Cruz, M. Exploring the PV Power Forecasting at Building Façades Using Gradient Boosting Methods. Energies 2023, 16, 1495. [Google Scholar] [CrossRef]
- Saxena, A.; Prasad, M.; Gupta, A.; Bharill, N.; Patel, O.P.; Tiwari, A.; Er, M.J.; Ding, W.; Lin, C.-T. A review of clustering techniques and developments. Neurocomputing 2017, 267, 664–681. [Google Scholar] [CrossRef]
- Simon, R.M.; Subramanian, J.; Li, M.-C.; Menezes, S. Using cross-validation to evaluate predictive accuracy of survival risk classifiers based on high-dimensional data. Brief. Bioinform. 2011, 12, 203–214. [Google Scholar] [CrossRef]
- Kamalzadeh, P. The Potential of AI Tools to Enhance Building Performance by Focusing on Thermal Comfort Optimization: A Comparative Study of AI Designing and Human Design in Building and Architecture. 2024. Available online: https://www.politesi.polimi.it/handle/10589/217593 (accessed on 24 November 2024).
- d’Ambrosio Alfano, F.R.; Ianniello, E.; Palella, B.I. PMV–PPD and acceptability in naturally ventilated schools. Build. Environ. 2013, 67, 129–137. [Google Scholar] [CrossRef]
- de Oliveira Aparecido, L.E.; da Silva Cabral de Moraes, J.R.; de Meneses, K.C.; Torsoni, G.B.; de Lima, R.F.; Costa, C.T.S. Köppen-Geiger and Camargo climate classifications for the Midwest of Brasil. Theor. Appl. Climatol. 2020, 142, 1133–1145. [Google Scholar] [CrossRef]
- Montgomery, D.C.; Runger, G.C. Applied Statistics and Probability for Engineers, 6th ed.; Wiley: Hoboken, NJ, USA, 2013; ISBN 978-1-118-53971-2. [Google Scholar]
- ASHRAE Handbook 2017 HVAC Fundamentals IP. Available online: http://archive.org/details/ashraehandbook2017hvacfundamentalsip (accessed on 9 December 2024).
- Guide A: Environmental Design (2015)|CIBSE. Available online: https://www.cibse.org/knowledge-research/knowledge-portal/guide-a-environmental-design-2015 (accessed on 9 December 2024).
- Bergman, T.L.; Lavine, A.S.; Incropera, F.P.; DeWitt, D.P. Introduction to Heat Transfer; John Wiley & Sons: Hoboken, NJ, USA, 2011; ISBN 978-0-470-50196-2. [Google Scholar]
- Draper, N.R.; Smith, H. Applied Regression Analysis; John Wiley & Sons: Hoboken, NJ, USA, 1998; ISBN 978-0-471-17082-2. [Google Scholar]
- Breiman, L.; Friedman, J.; Olshen, R.A.; Stone, C.J. Classification and Regression Trees; Chapman and Hall/CRC: New York, NY, USA, 2017; ISBN 978-1-315-13947-0. [Google Scholar]
- Doctor, P.G. Sensitivity and uncertainty analyses for performance assessment modeling. Eng. Geol. 1989, 26, 411–429. [Google Scholar] [CrossRef]
- Nguyen, G.T.; Iftekhar, M.S.; Ratnasiri, S.; Roiko, A.; Beal, C.D. Supply, demand and the economic effectiveness of urine-diverting technologies and products: A systematic literature review. Water Res. 2024, 255, 121478. [Google Scholar] [CrossRef] [PubMed]
- Shen, Y.; Yarnold, M. A novel sensitivity analysis of commercial building hybrid energy-structure performance. J. Build. Eng. 2021, 43, 102808. [Google Scholar] [CrossRef]
- Manfren, M.; Nastasi, B.; Piana, E.; Tronchin, L. On the link between energy performance of building and thermal comfort: An example. AIP Conf. Proc. 2019, 2123, 020066. [Google Scholar] [CrossRef]
- Delgarm, N.; Sajadi, B.; Delgarm, S. Multi-objective optimization of building energy performance and indoor thermal comfort: A new method using artificial bee colony (ABC). Energy Build. 2016, 131, 42–53. [Google Scholar] [CrossRef]
- Long, L.D. An AI-driven model for predicting and optimizing energy-efficient building envelopes. Alex. Eng. J. 2023, 79, 480–501. [Google Scholar]


| Strategy/Technology | Key Findings/Performance Metrics | Reference |
|---|---|---|
| Fixed shading devices | Annual energy consumption reduction of 20–25% Optimal in predictable conditions | [21] |
| Dynamic shading systems (Bi-sectional horizontal fin system) | 88.96% median useful daylight illuminance in Wroclaw Up to 82% reduction in active cooling reliance | [25] |
| Electrochromic glazing | Additional 10–15% energy savings with automated controls Improves energy performance while maintaining daylight and view | [26] |
| Photochromic glazing | Up to 43% reduction in internal heat gains under high solar exposure | [19] |
| Thermochromic glazing | 15–20% energy savings by modulating heat transfer during temperature fluctuations | [20] |
| Natural ventilation | Up to 30% energy waste reduction with demand-driven ventilation controls | [39] |
| Hybrid ventilation systems | 82% reduction in active cooling reliance through natural and mechanical integration | [15,17] |
| Night cooling | Up to 27% energy reduction through pre-cooling nighttime air | [42] |
| Advanced ventilation models (CFD, dimensional analysis) | Enhanced simulation and prediction of airflow, temperature distributions, and thermal comfort | [49,52] |
| Parameter | Value/Range |
|---|---|
| Room dimensions | 20 m2 area, 3 m ceiling height |
| Cooling setpoint temperature | 24 °C |
| Heating setpoint temperature | 20 °C |
| Relative humidity | 50% |
| Facade U-value | 0.2–1.5 W/m2 K |
| Thermal mass | 50–200 kJ/m2 K |
| Window-to-wall ratio (WWR) | 20–80% |
| Shading factors | 1 (no shading) to 0 (complete shading) |
| Reflectance | 0.50–0.75 |
| Ventilation rates (ACH) | 0.5–2 ACH |
| Internal heat loads | 12–25 W/m2 |
| CO2 generation | 8 L/s per person |
| Ventilation rate per person | ≤1000 ppm |
| Daylight factor (>2%) | 4–70% |
| Clothing insulation (clo) | 0.5 |
| Metabolic rate (met) | 1.2 |
| Solar heat gain coefficient (SHGC) | 0.35 |
| Climate | Warm–temperate climate |
| Weather data | Hourly profiles of temperature, humidity, and solar radiation |
| Scenario | Input Parameters | Output Parameters |
|---|---|---|
| Scenario 1 | Minimal shading ( = 0.2), limited ventilation (ACH = 0.5), no night cooling | Highest thermal discomfort (PPD > 80%), lowest energy demand |
| Scenario 2 | Optimized shading ( = 0.6), moderate ventilation (ACH = 1.5), night cooling enabled | Improved comfort (PPD ~ 40%), slightly increased energy demand |
| Scenario 3 | Dynamic shading ( varied with solar conditions), enhanced ventilation (ACH = 2.5), night cooling | Best balance of comfort and efficiency (PPD ~ 25%), moderate energy use |
| Scenario 4 | High shading ( = 1.0), maximum ventilation (ACH = 3.0), night cooling enabled | Consistent comfort (PPD ~ 15%), highest energy demand |
| Statistic | Shading Factor | Min Air | Night Cool | Cool, W/m2 | Total Energy | Predicted PPD |
|---|---|---|---|---|---|---|
| Mean | 0.506896 | 1.249414 | 2.228811 | −30.062716 | 43.228697 | 62.829081 |
| Std | 0.174276 | 0.431790 | 1.006384 | 17.394150 | 12.578403 | 31.124173 |
| Min | 0.200411 | 0.500215 | 0.500726 | −59.966619 | 12.924902 | 5.073860 |
| 25% | 0.359660 | 0.870374 | 1.351577 | −45.127772 | 34.518183 | 35.091155 |
| 50% (Median) | 0.507022 | 1.247015 | 2.196450 | −30.459140 | 42.664172 | 65.804830 |
| 75% | 0.660381 | 1.621512 | 3.099866 | −14.753576 | 52.897491 | 95.627063 |
| Max | 0.799621 | 1.999951 | 3.999884 | −0.003869 | 73.133333 | 100.000000 |
| Shading Factor | Ventilation Rate (ACH) | Mean Cooling Energy (kWh/m2) | Peak Thermal Load (W/m2) | % Scenarios with PPD ≤ 20% | % Scenarios with PPD > 80% |
|---|---|---|---|---|---|
| 0.2–0.4 | 0.5–1.0 | 60.2 ± 8.5 | 55.3 ± 6.2 | 5% | 85% |
| 0.2–0.4 | 1.5–2.5 | 52.8 ± 7.1 | 50.1 ± 5.8 | 12% | 75% |
| 0.4–0.6 | 1.5–2.5 | 45.6 ± 5.9 | 39.8 ± 4.9 | 28% | 62% |
| 0.6–0.8 | 1.5–2.5 | 38.3 ± 4.7 | 29.5 ± 4.1 | 42% | 50% |
| 0.6–0.8 | 3.0–4.0 | 48.1 ± 6.5 | 41.3 ± 5.2 | 22% | 68% |
| 1.0 | 0.5–1.5 | 35.7 ± 4.2 | 27.8 ± 3.8 | 50% | 35% |
| 1.0 | 2.0–3.0 | 30.9 ± 3.5 | 22.1 ± 3.2 | 68% | 22% |
| Metric | Predicted PPD | Heat Extraction Rates |
|---|---|---|
| Shading Factor Coefficient | 0.517 | −1.503 |
| Minimum Airflow Coefficient | 0.193 | 0.525 |
| Night Cooling Coefficient | 0.156 | 0.100 |
| Intercept | 61.85 | −30.00 |
| Shading Factor | Min Air (ACH) | Night Cooling | Predicted PPD | Predicted Heat Extraction Rate |
|---|---|---|---|---|
| 0.3 | 1.0 | 1.5 | 62.44 | −29.77 |
| 0.5 | 1.5 | 2.0 | 62.71 | −29.76 |
| 0.7 | 2.0 | 3.0 | 63.07 | −29.70 |
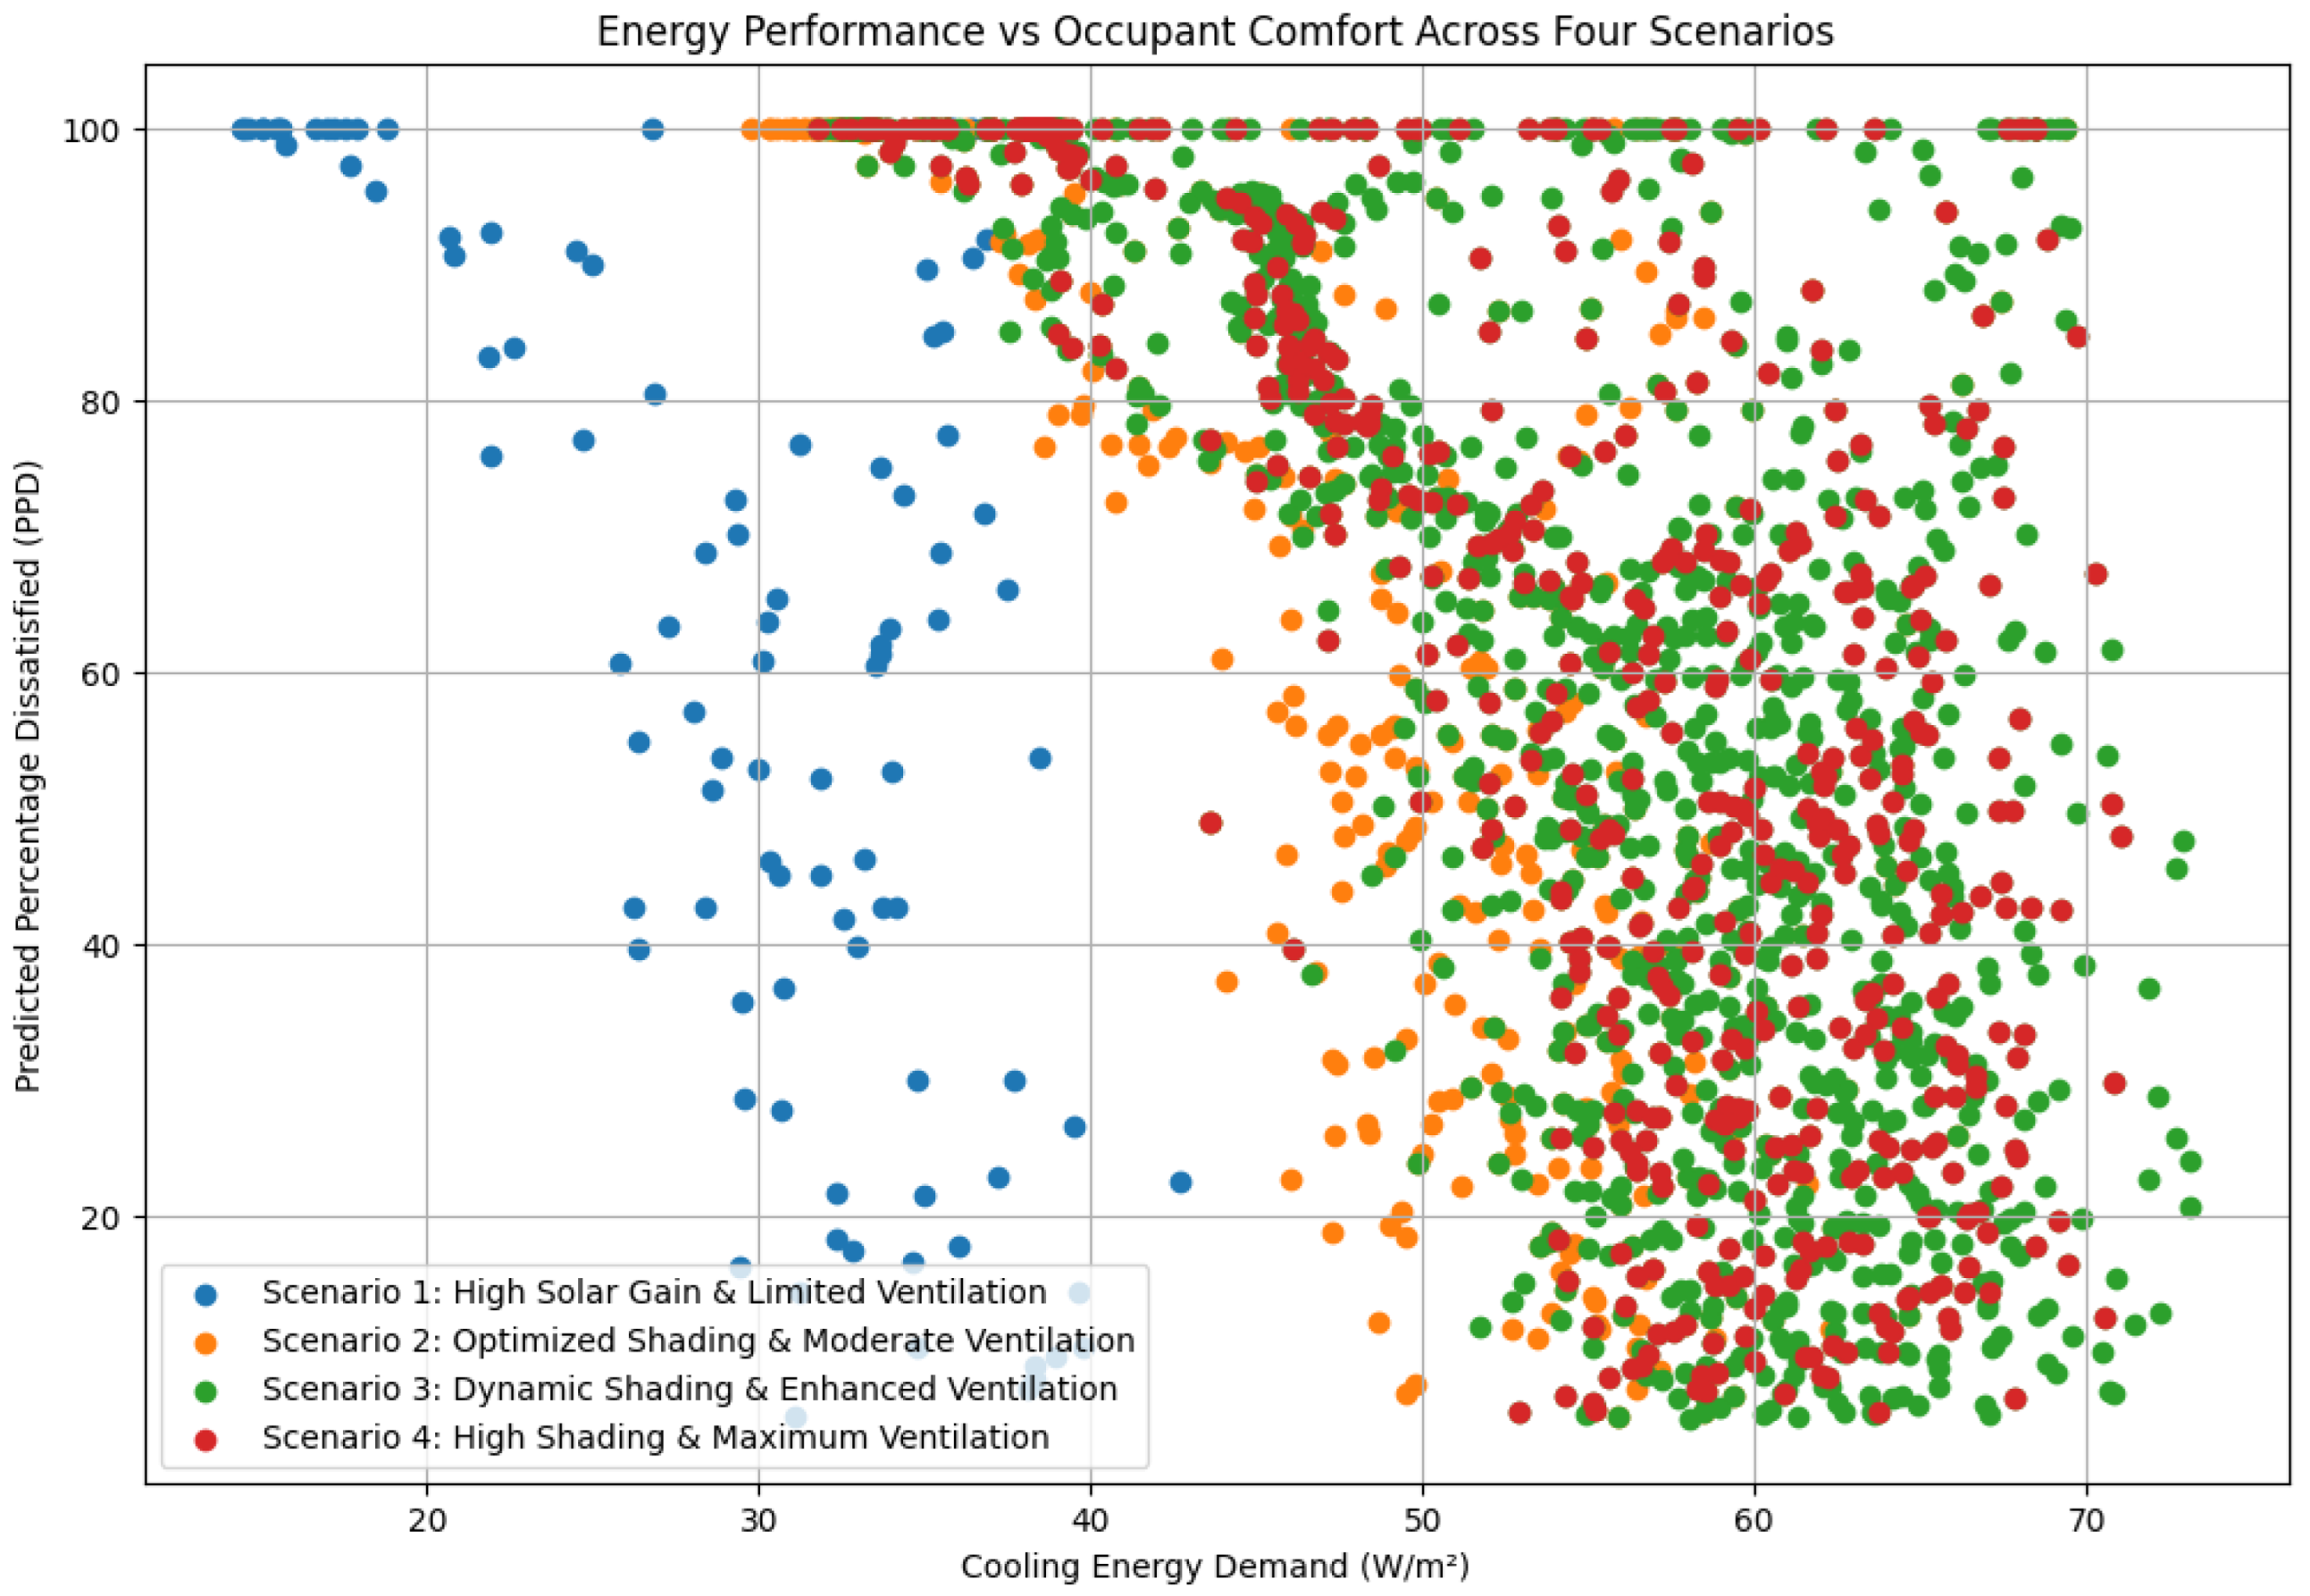
| Scenario | Shading Factor | Ventilation Rate (ACH) | Night Cooling | PPD Range (%) | Energy Consumption for Cooling (W/m2) | Key Findings |
|---|---|---|---|---|---|---|
| Scenario 1: High Solar Gain and Limited Ventilation | 0.2 | 0.5 | No | >80 | 15–40 | Poor comfort; lowest energy demand but insufficient cooling capacity, highlighting the need for interventions. |
| Scenario 2: Optimized Shading with Moderate Ventilation | 0.6 | 1.5 | Yes | 40–80 | 30–70 | Improved comfort compared to Scenario 1 but falls short of optimal performance in high solar exposure conditions. |
| Scenario 3: Dynamic Shading and Enhanced Ventilation | Dynamic (0.3–0.8) | 2.5 | Yes | 30–70 | 30–70 | Best balance of comfort and efficiency; adaptability allows response to varying environmental conditions. |
| Scenario 4: High Shading with Maximum Ventilation | 1.0 | 3.0 | Yes | 15–70 | 30–70 | Most consistent comfort with reduced variability but highest energy demand due to increased ventilation rates. |
Disclaimer/Publisher’s Note: The statements, opinions and data contained in all publications are solely those of the individual author(s) and contributor(s) and not of MDPI and/or the editor(s). MDPI and/or the editor(s) disclaim responsibility for any injury to people or property resulting from any ideas, methods, instructions or products referred to in the content. |
© 2025 by the author. Licensee MDPI, Basel, Switzerland. This article is an open access article distributed under the terms and conditions of the Creative Commons Attribution (CC BY) license (https://creativecommons.org/licenses/by/4.0/).
Share and Cite
Mazzetto, S. Dynamic Integration of Shading and Ventilation: Novel Quantitative Insights into Building Performance Optimization. Buildings 2025, 15, 1123. https://doi.org/10.3390/buildings15071123
Mazzetto S. Dynamic Integration of Shading and Ventilation: Novel Quantitative Insights into Building Performance Optimization. Buildings. 2025; 15(7):1123. https://doi.org/10.3390/buildings15071123
Chicago/Turabian StyleMazzetto, Silvia. 2025. "Dynamic Integration of Shading and Ventilation: Novel Quantitative Insights into Building Performance Optimization" Buildings 15, no. 7: 1123. https://doi.org/10.3390/buildings15071123
APA StyleMazzetto, S. (2025). Dynamic Integration of Shading and Ventilation: Novel Quantitative Insights into Building Performance Optimization. Buildings, 15(7), 1123. https://doi.org/10.3390/buildings15071123