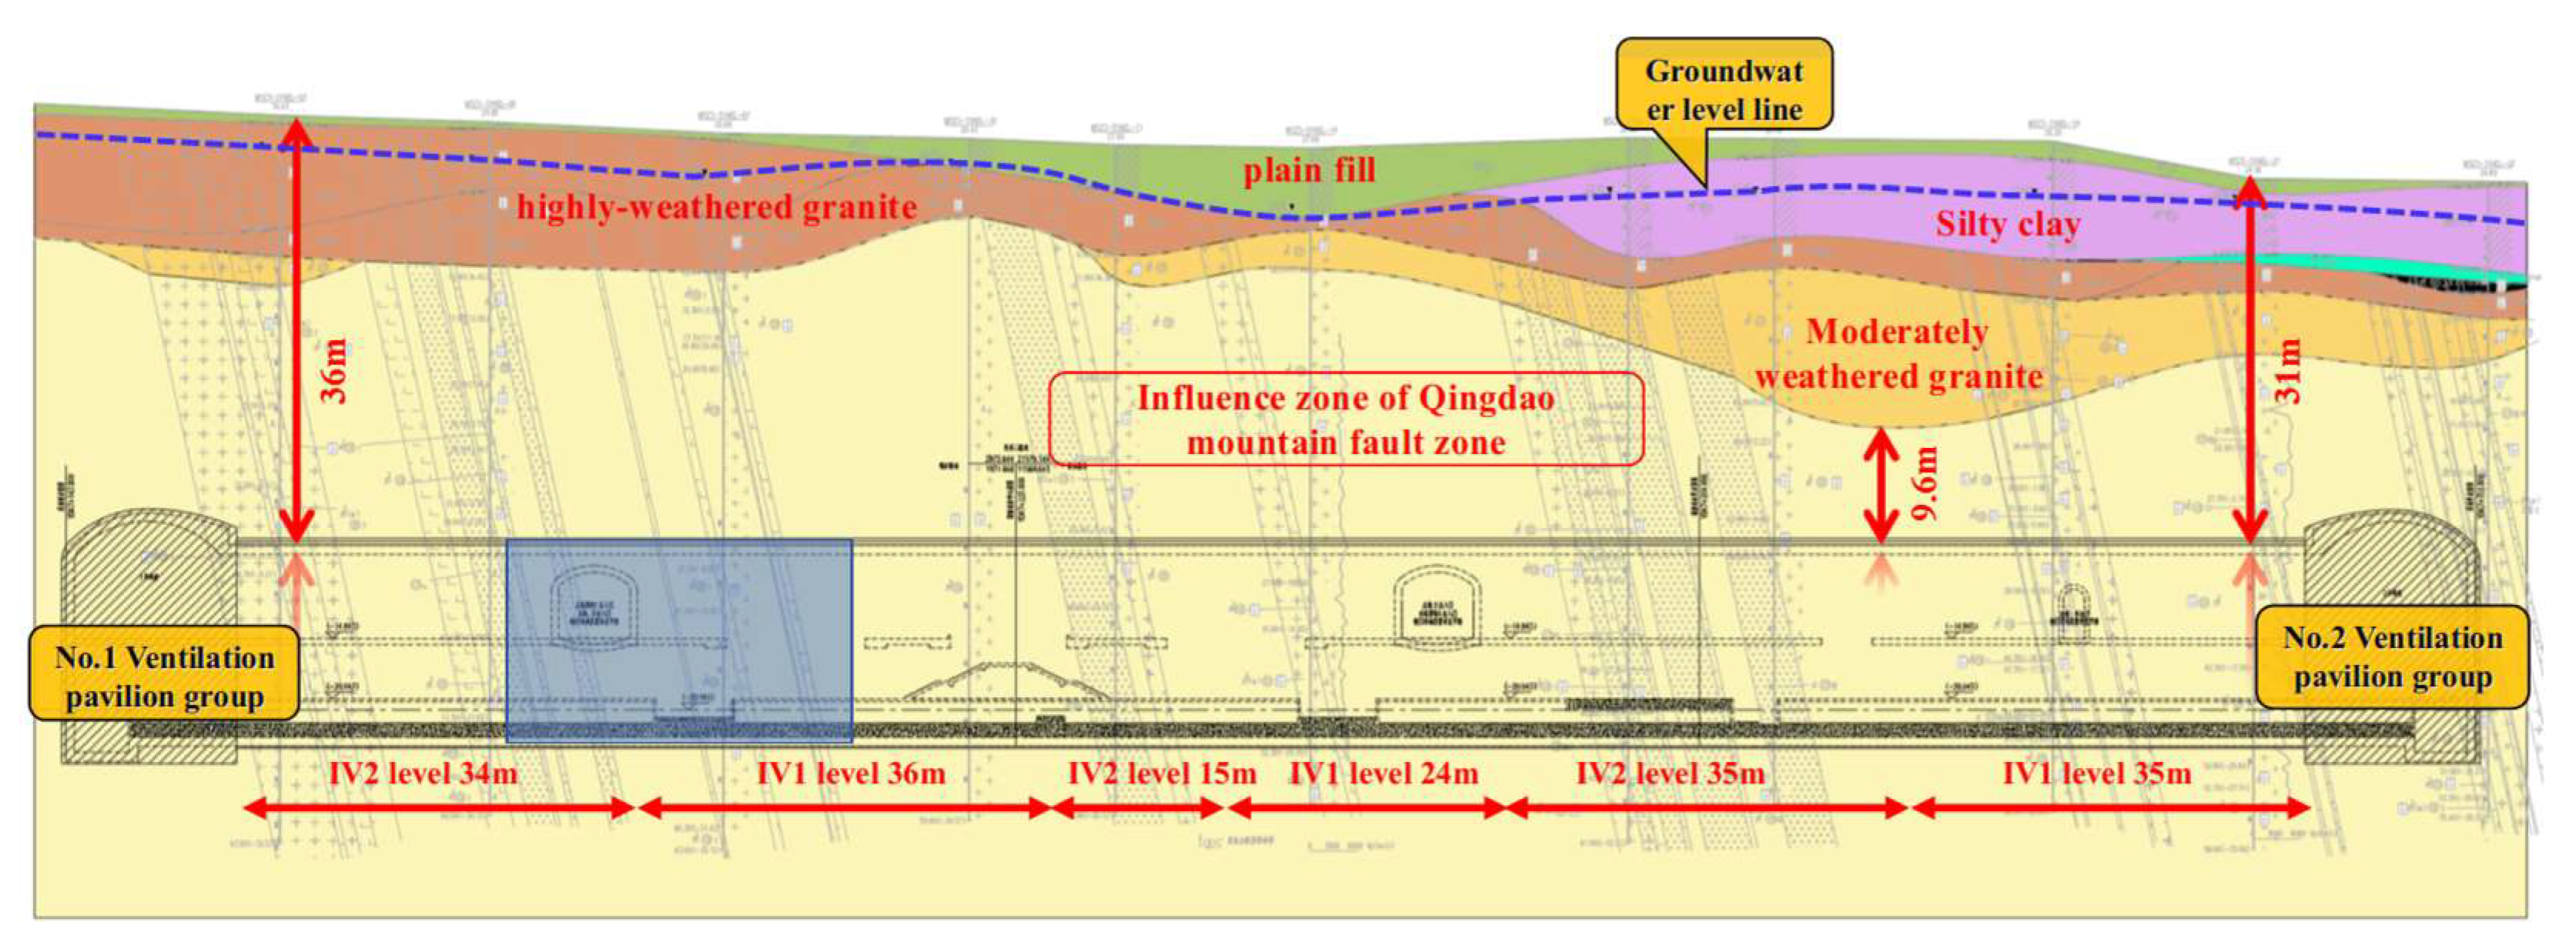
Figure 1.
Geological Profile.
Figure 1.
Geological Profile.
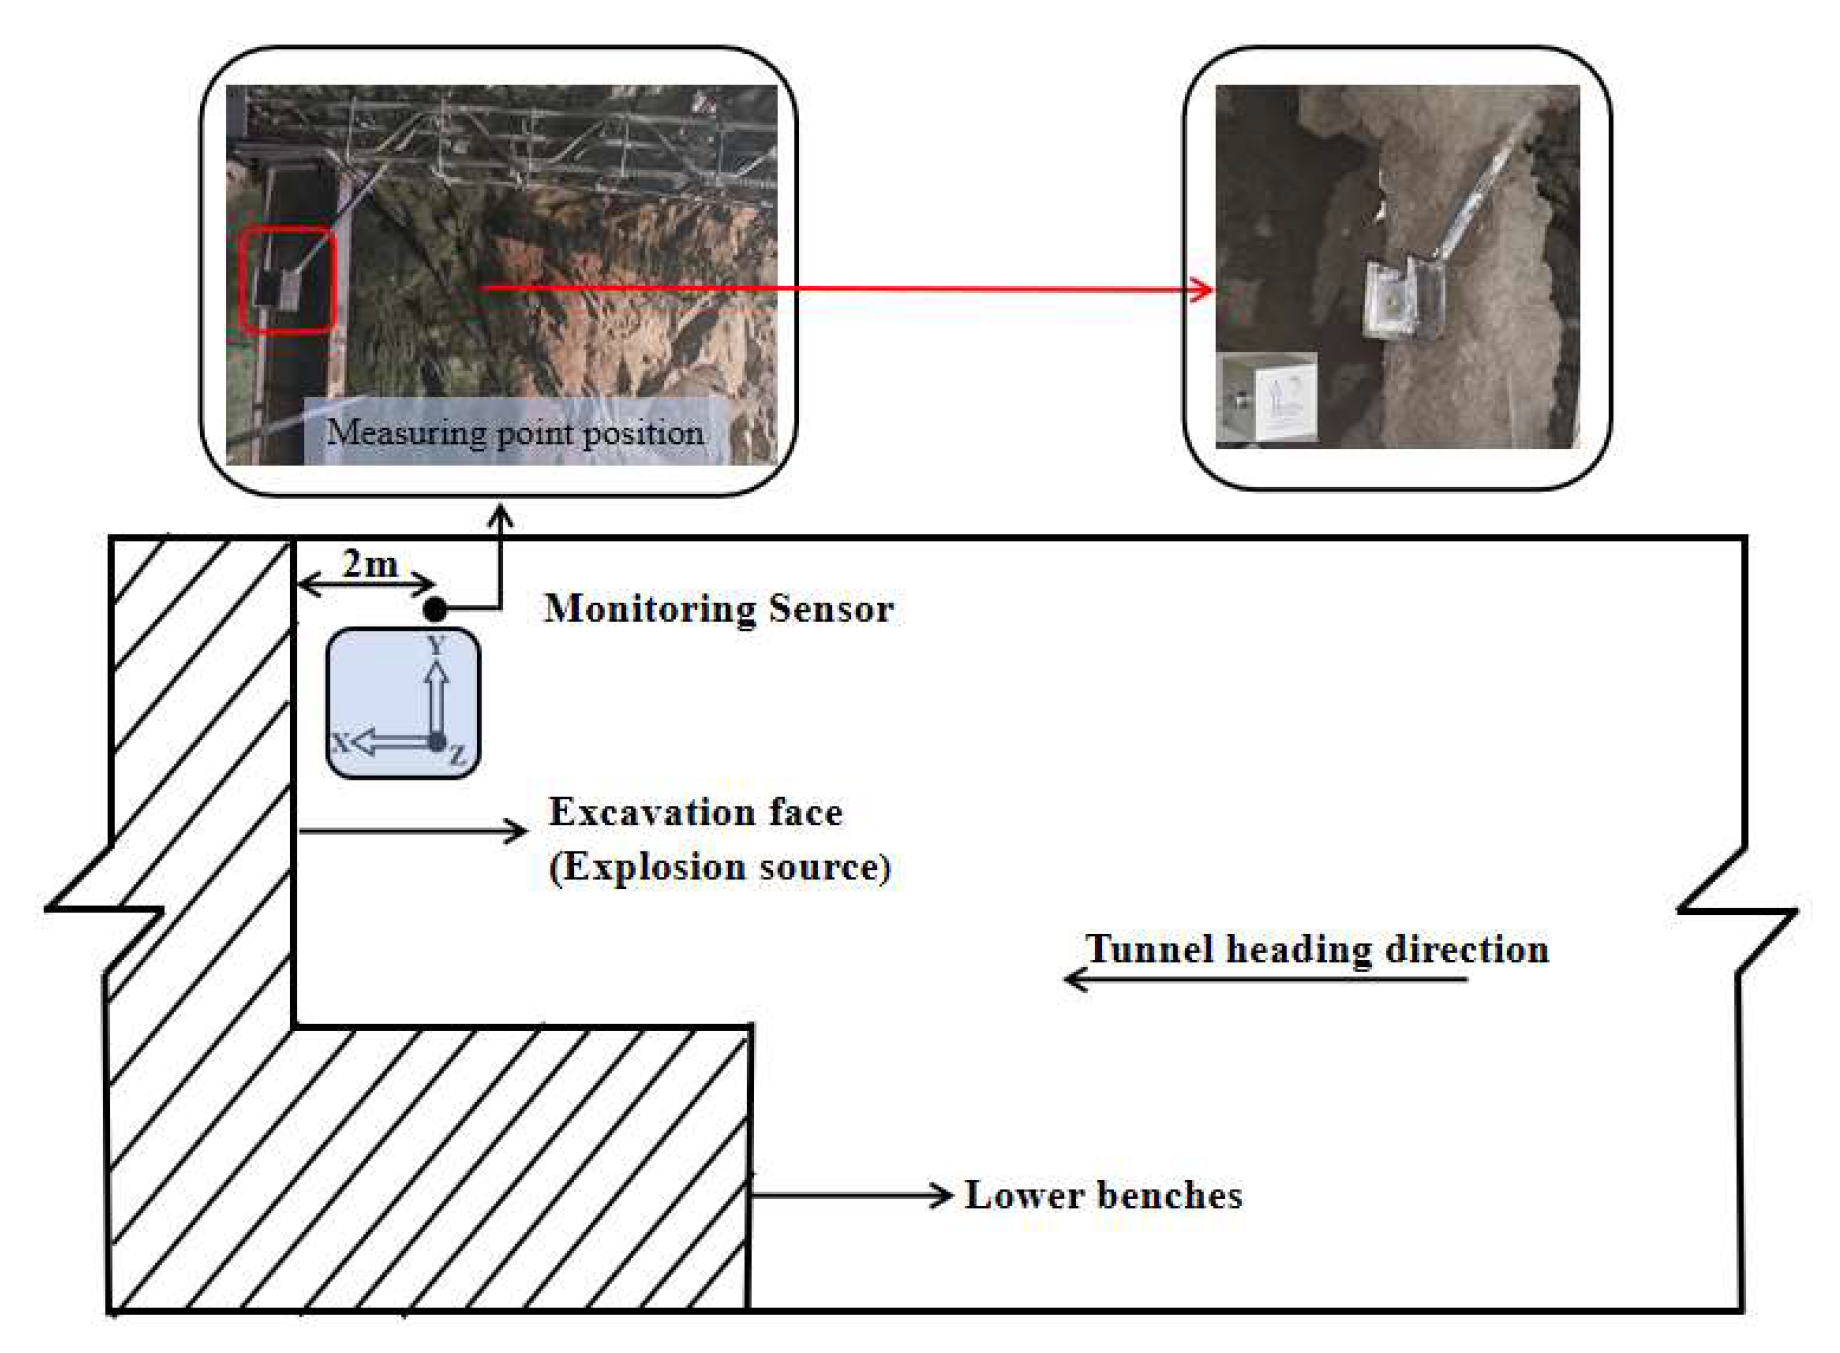
Figure 2.
Layout of monitoring equipment.
Figure 2.
Layout of monitoring equipment.
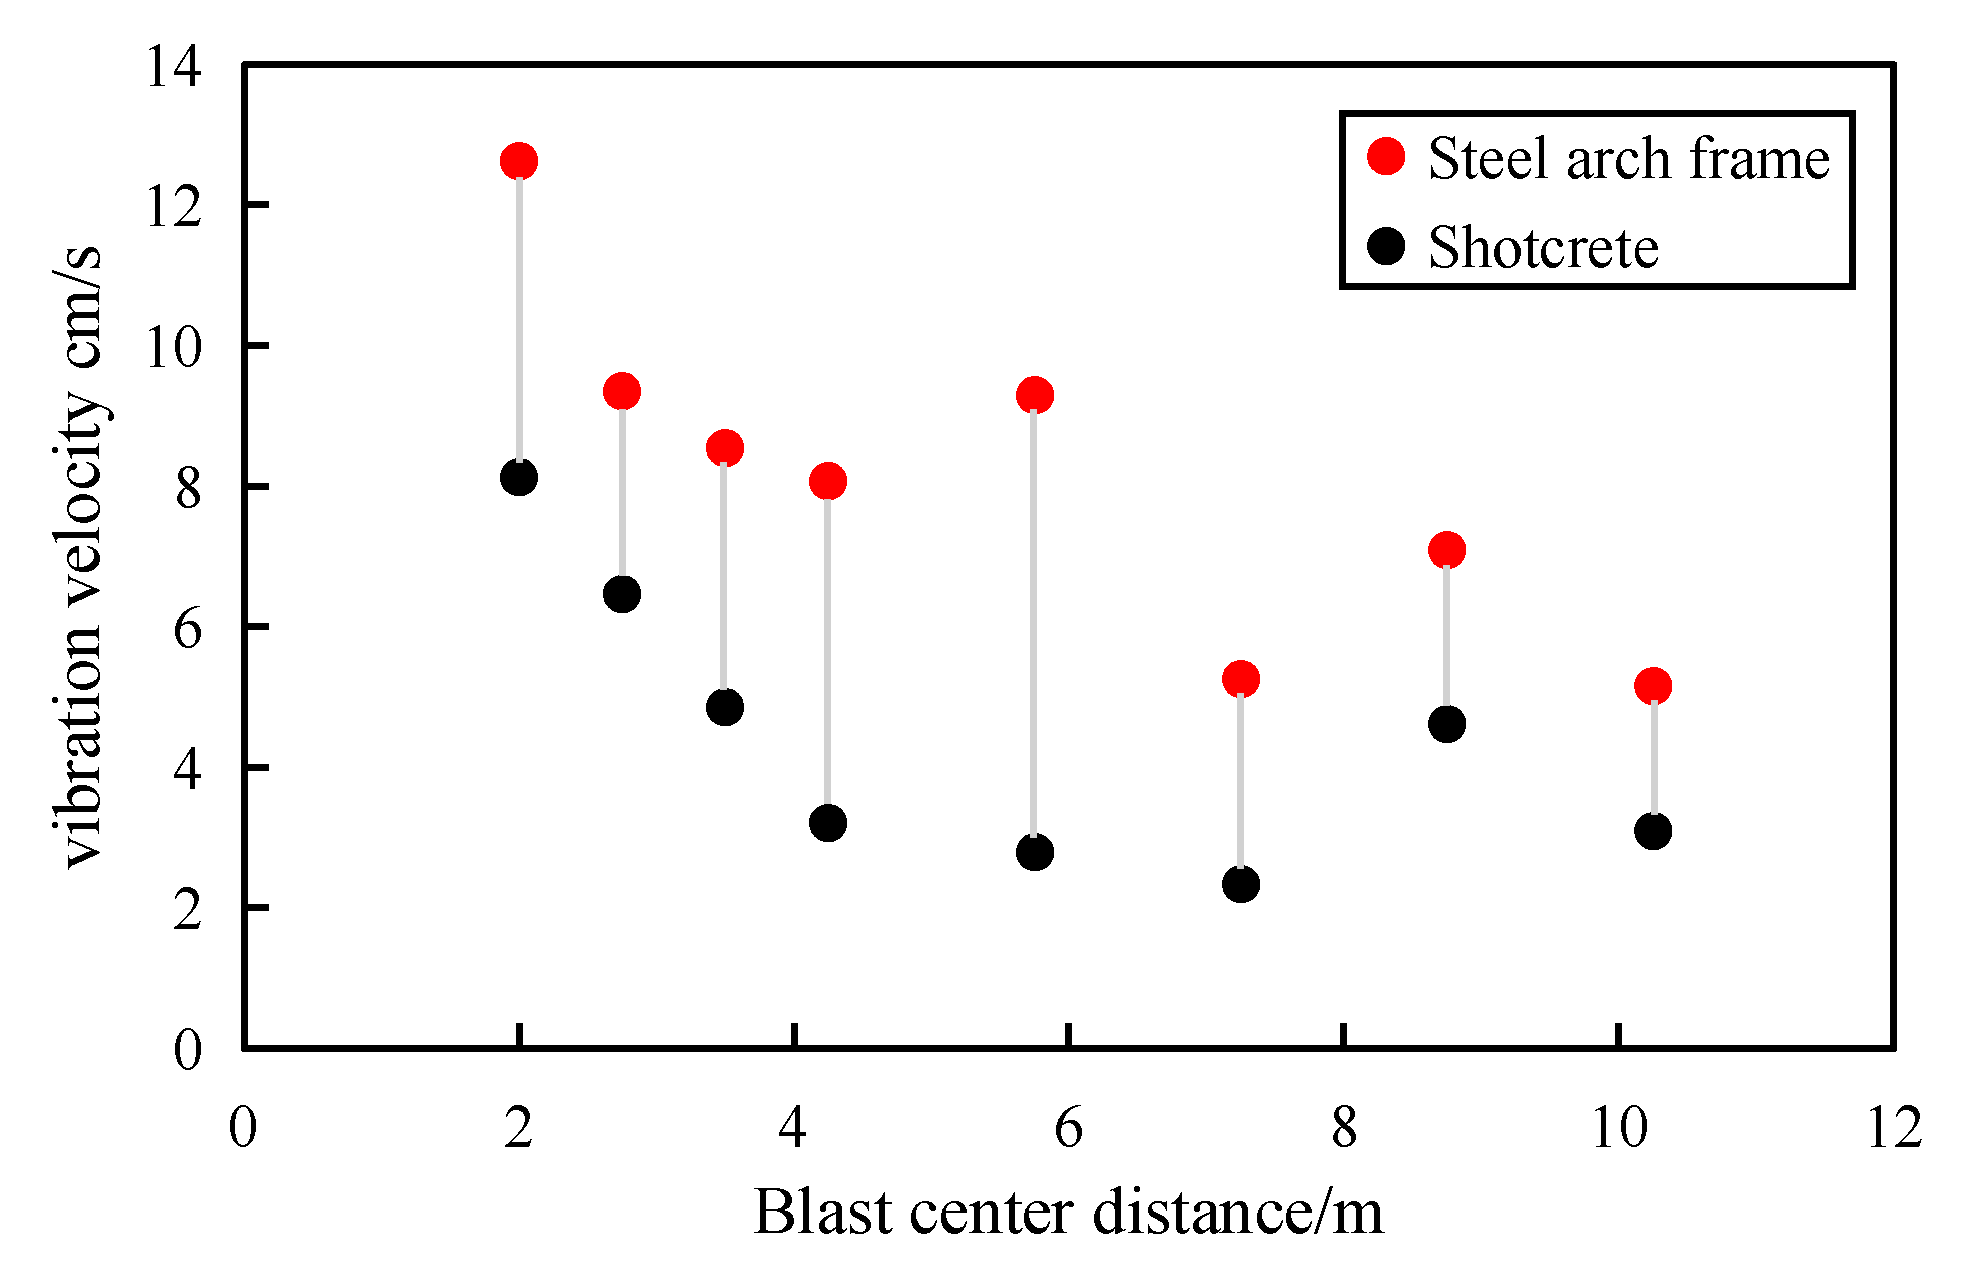
Figure 3.
Comparison of vibration velocity of steel frame-shotcrete structure.
Figure 3.
Comparison of vibration velocity of steel frame-shotcrete structure.
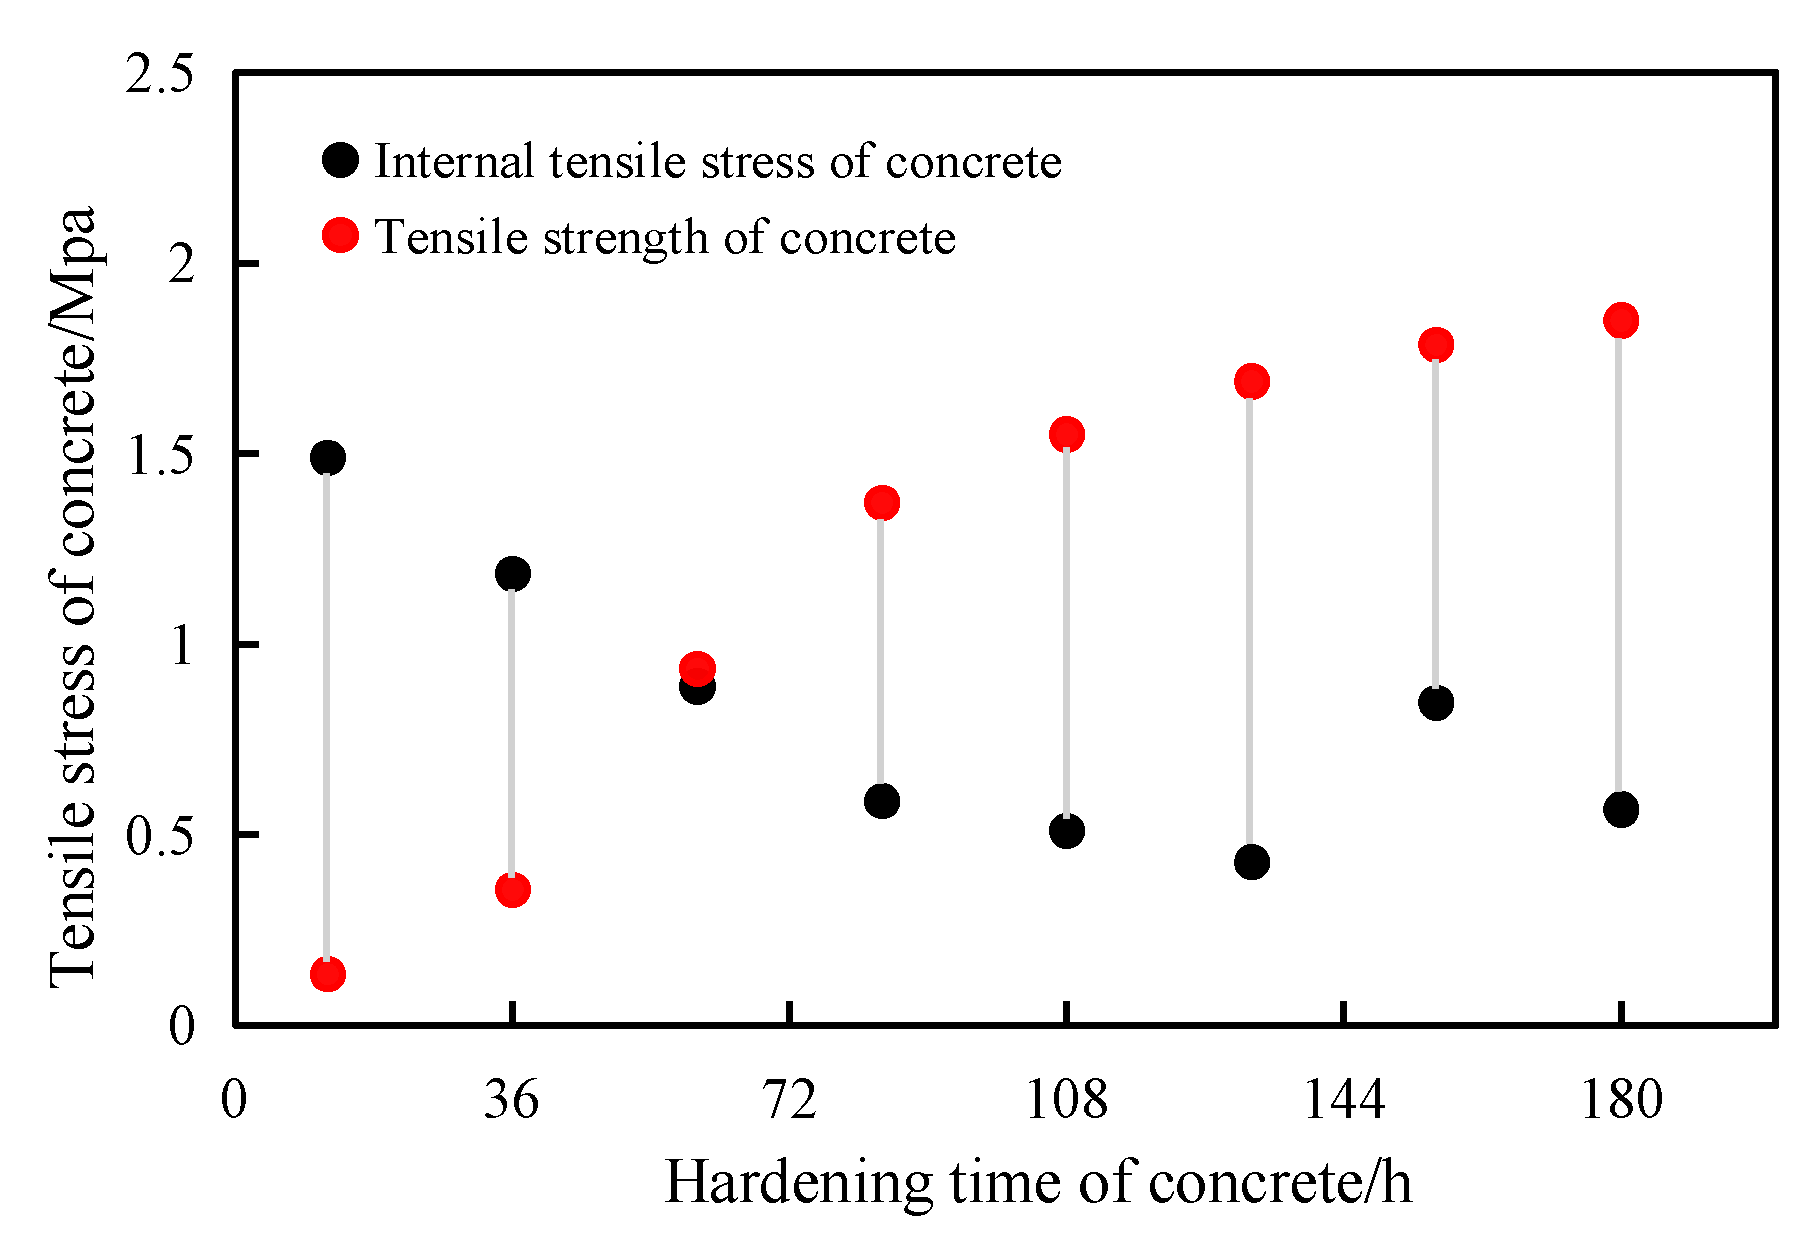
Figure 4.
Shotcrete tensile stress strength.
Figure 4.
Shotcrete tensile stress strength.
Figure 5.
Dimensions of arch specimen.
Figure 5.
Dimensions of arch specimen.
Figure 6.
Compressive strength test of concrete test block.
Figure 6.
Compressive strength test of concrete test block.
Figure 7.
Stress mode and simplified model of specimen.
Figure 7.
Stress mode and simplified model of specimen.
Figure 8.
Test device design scheme. (a) Schematic diagram of experimental device. (b) Laboratory layout.
Figure 8.
Test device design scheme. (a) Schematic diagram of experimental device. (b) Laboratory layout.
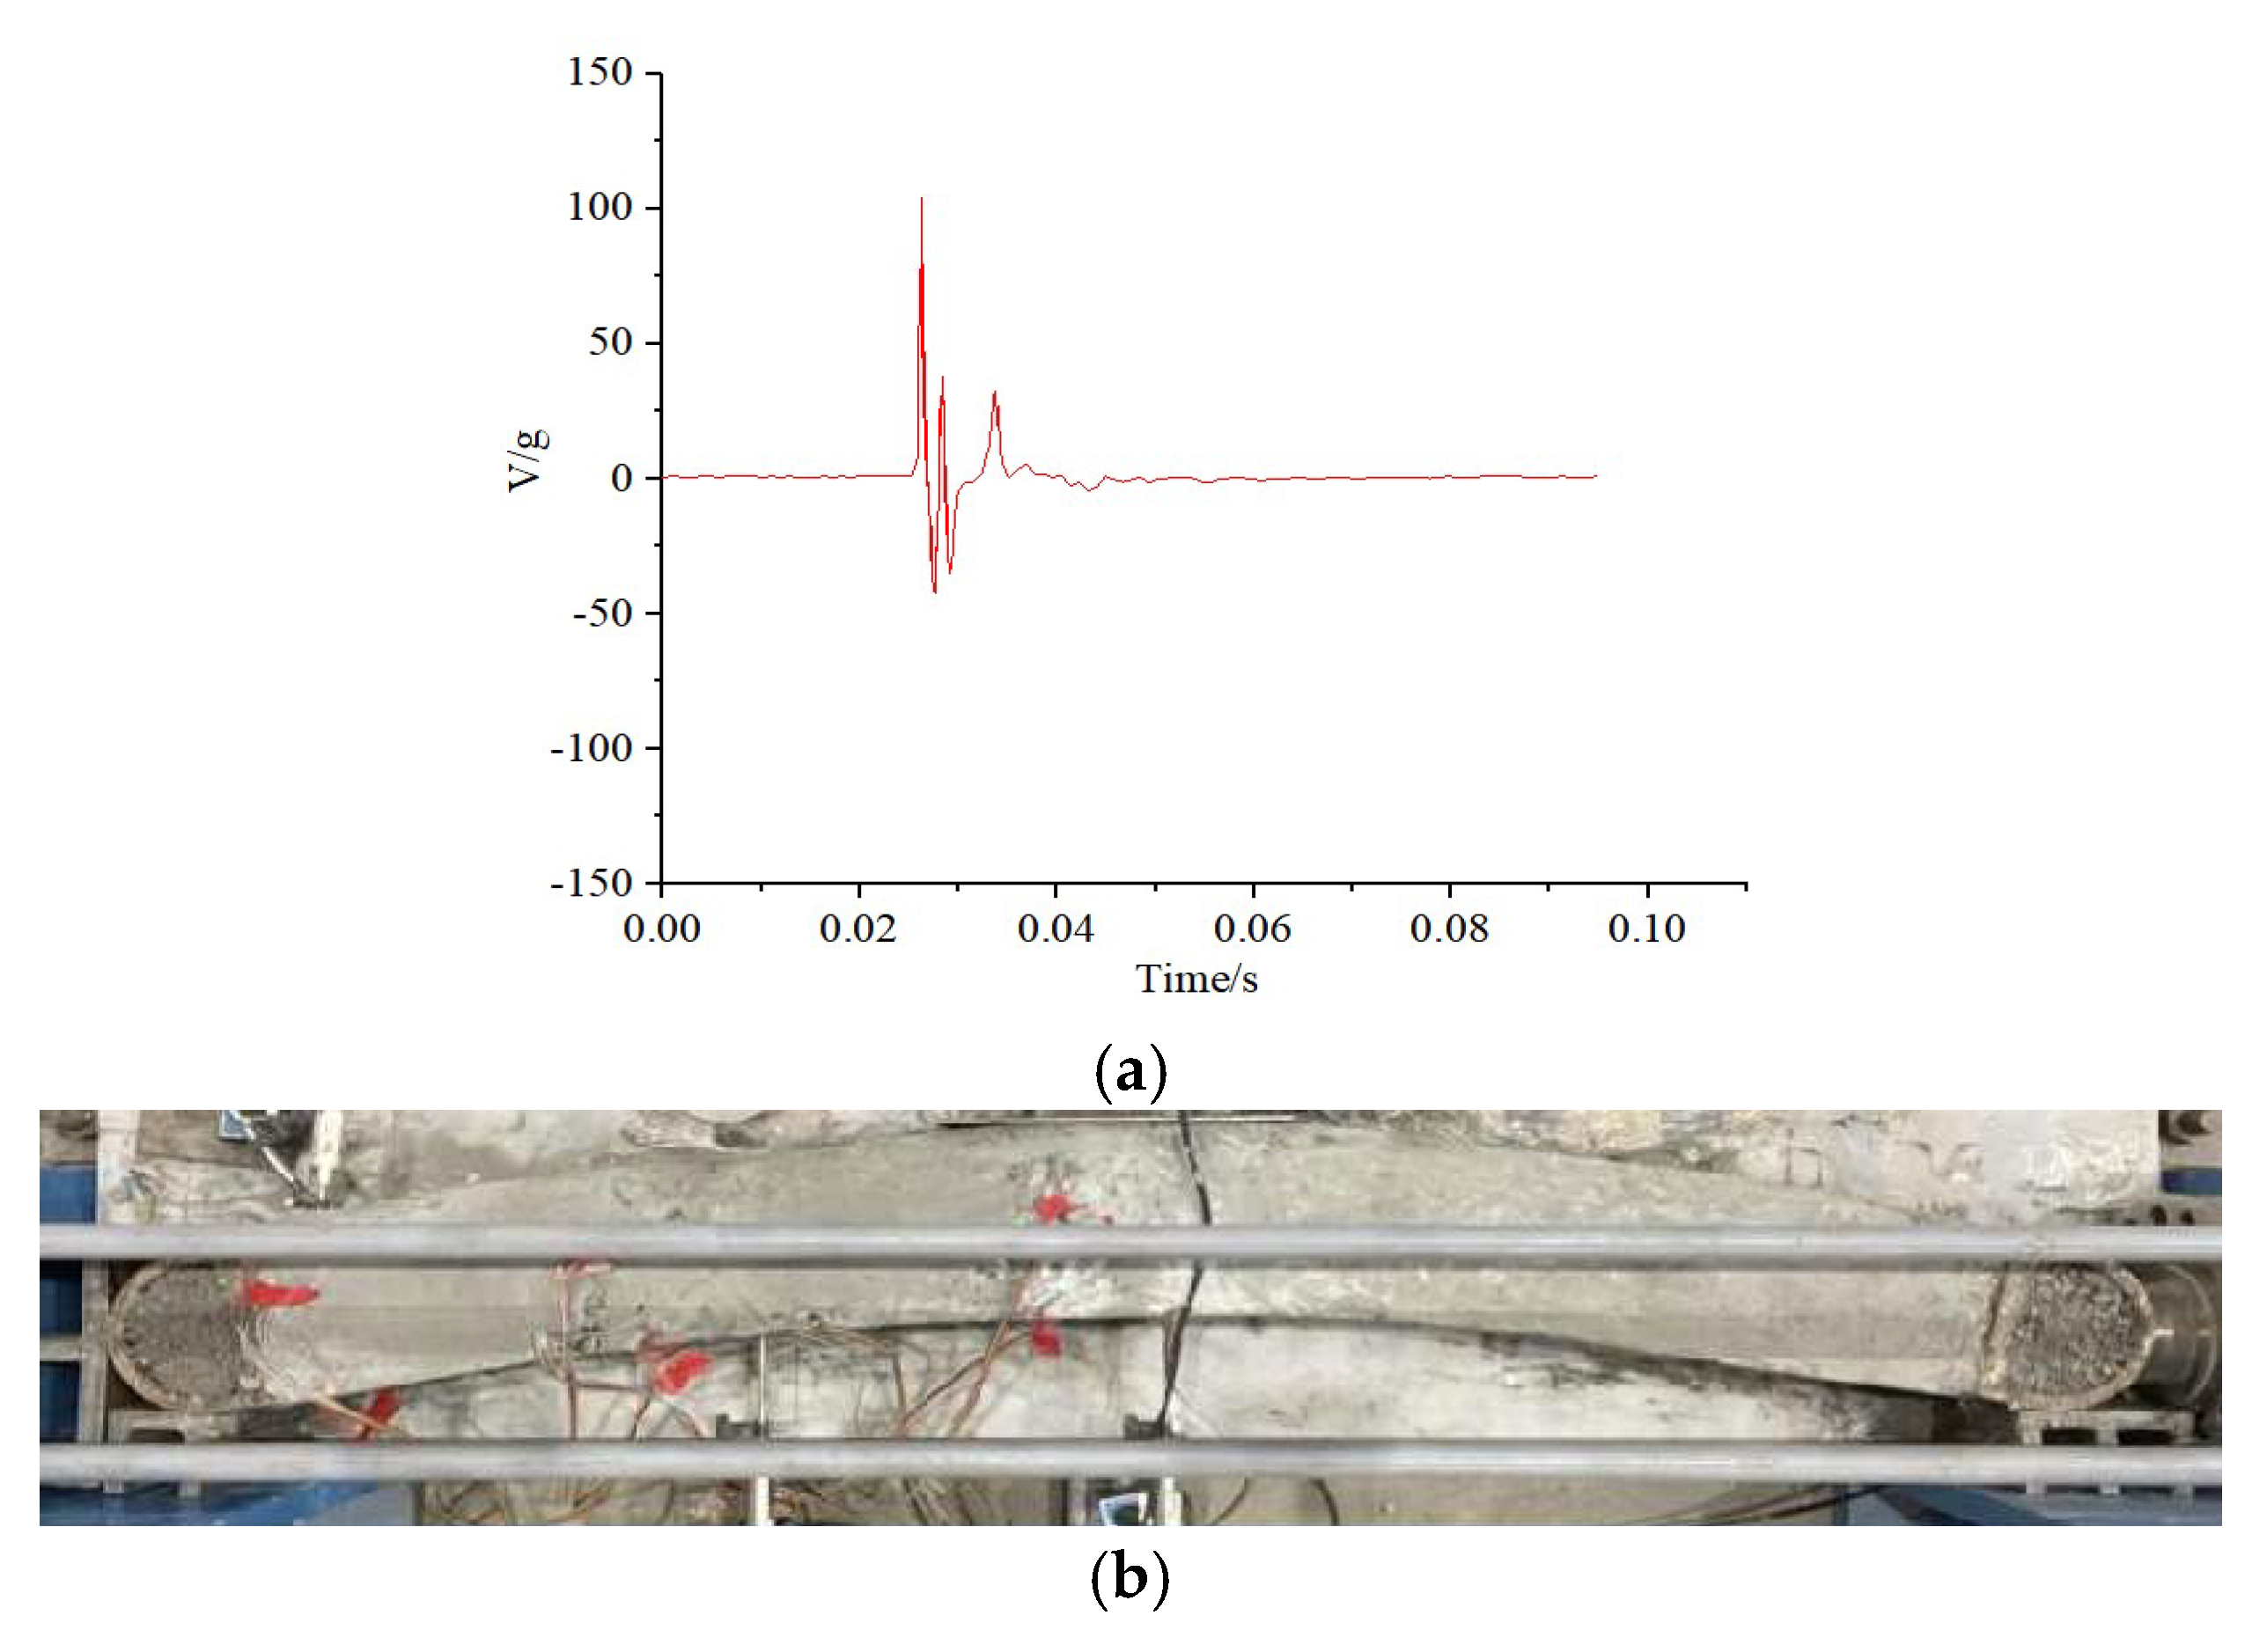
Figure 9.
S—1 initial load test. (a) Impact load acceleration waveform. (b) After 168 h of loading.
Figure 9.
S—1 initial load test. (a) Impact load acceleration waveform. (b) After 168 h of loading.
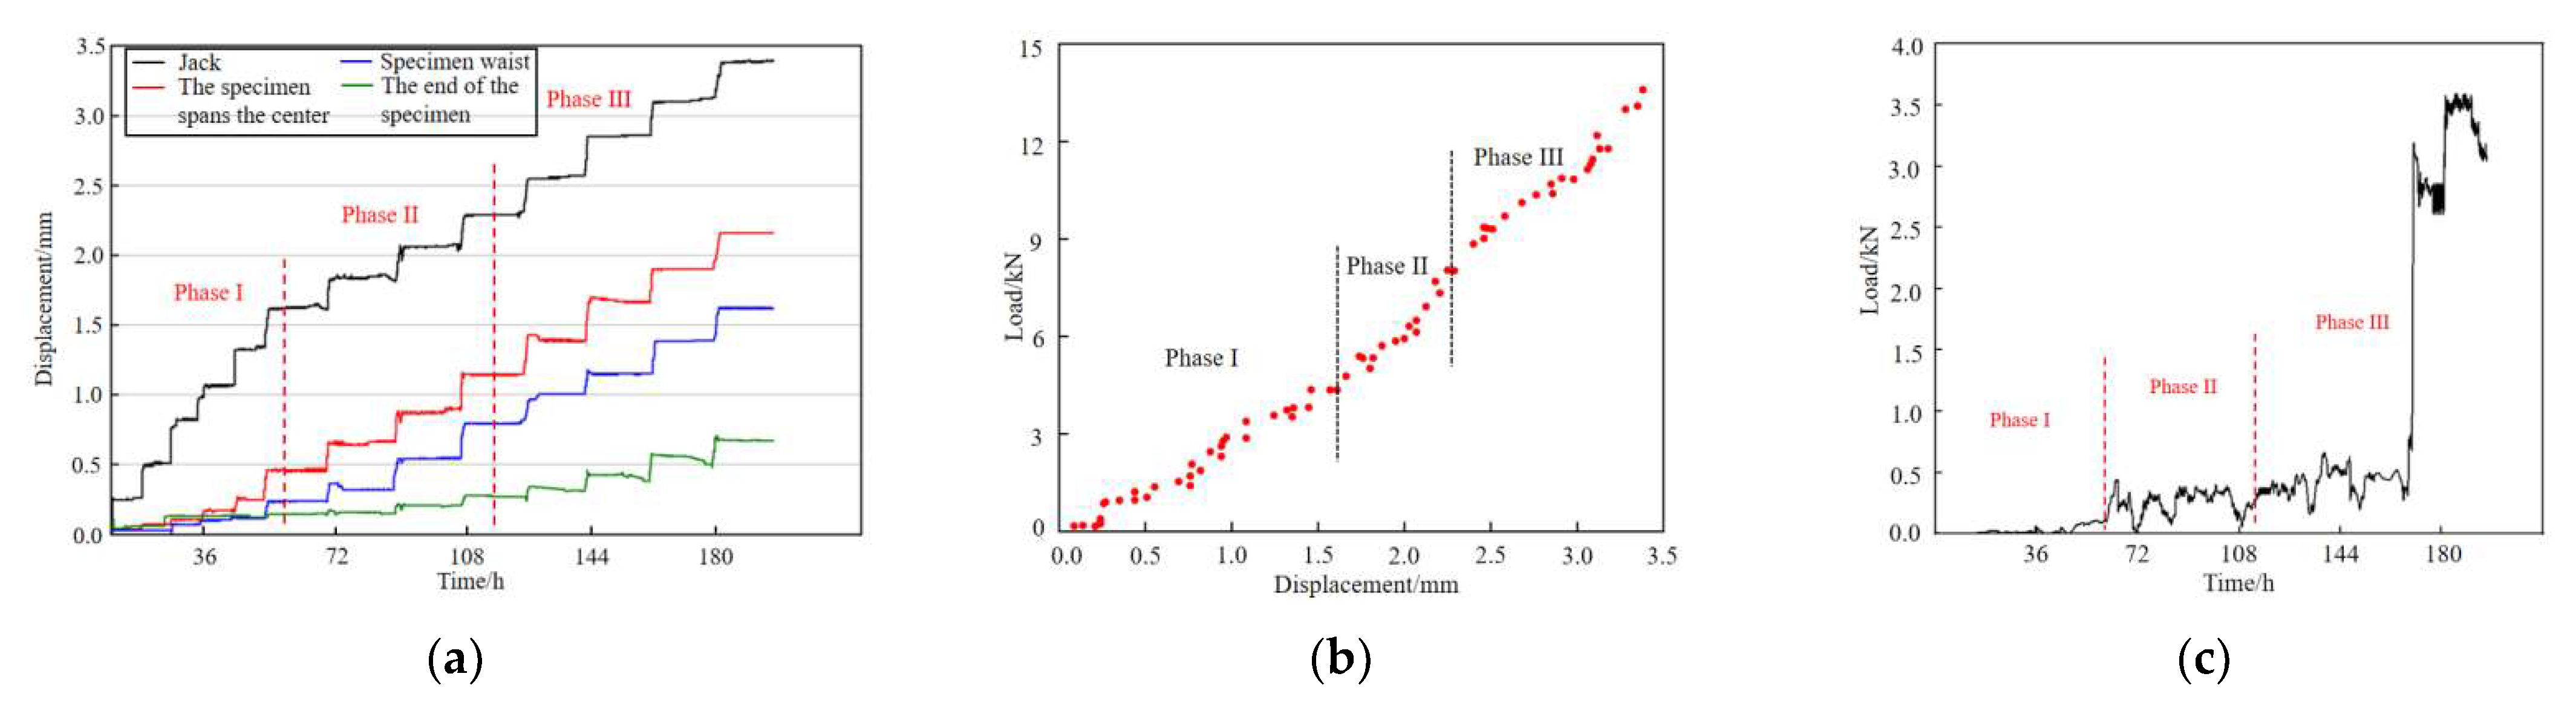
Figure 10.
S—1 displacement and load of monitoring point. (a) S—1 displacement monitoring, (b) Load displacement scatter diagram at Jack, (c) Axial load.
Figure 10.
S—1 displacement and load of monitoring point. (a) S—1 displacement monitoring, (b) Load displacement scatter diagram at Jack, (c) Axial load.
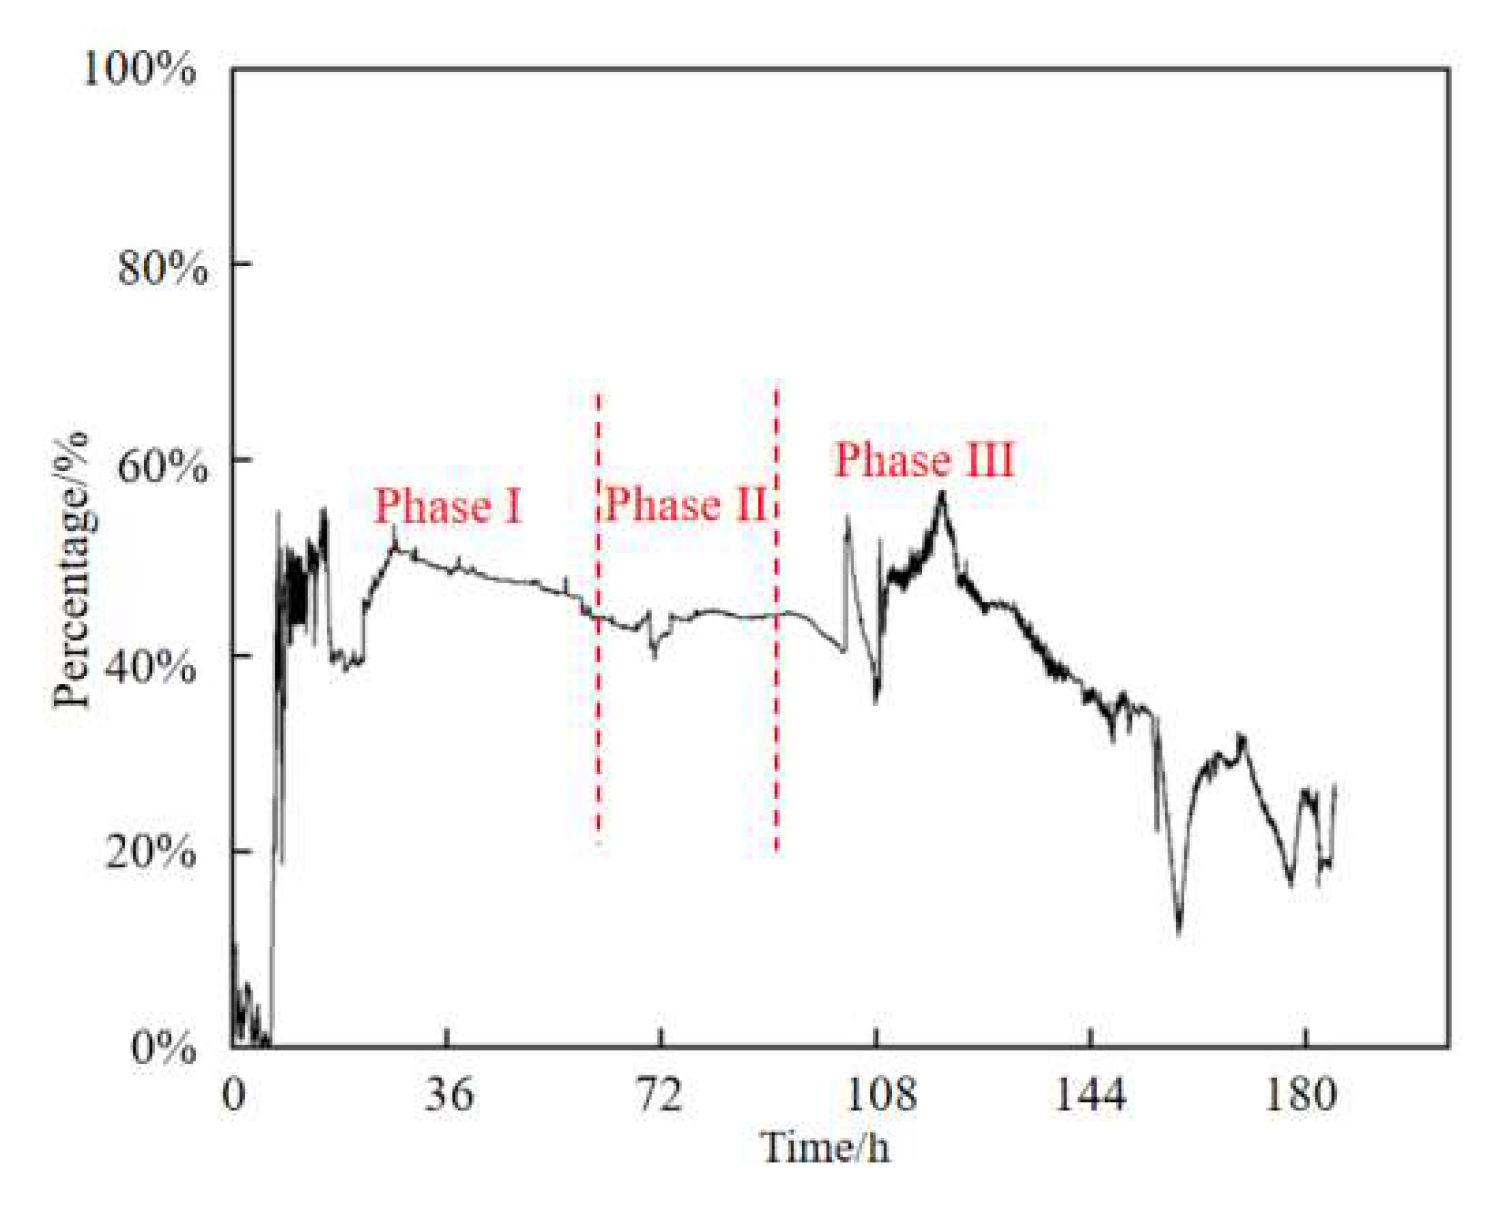
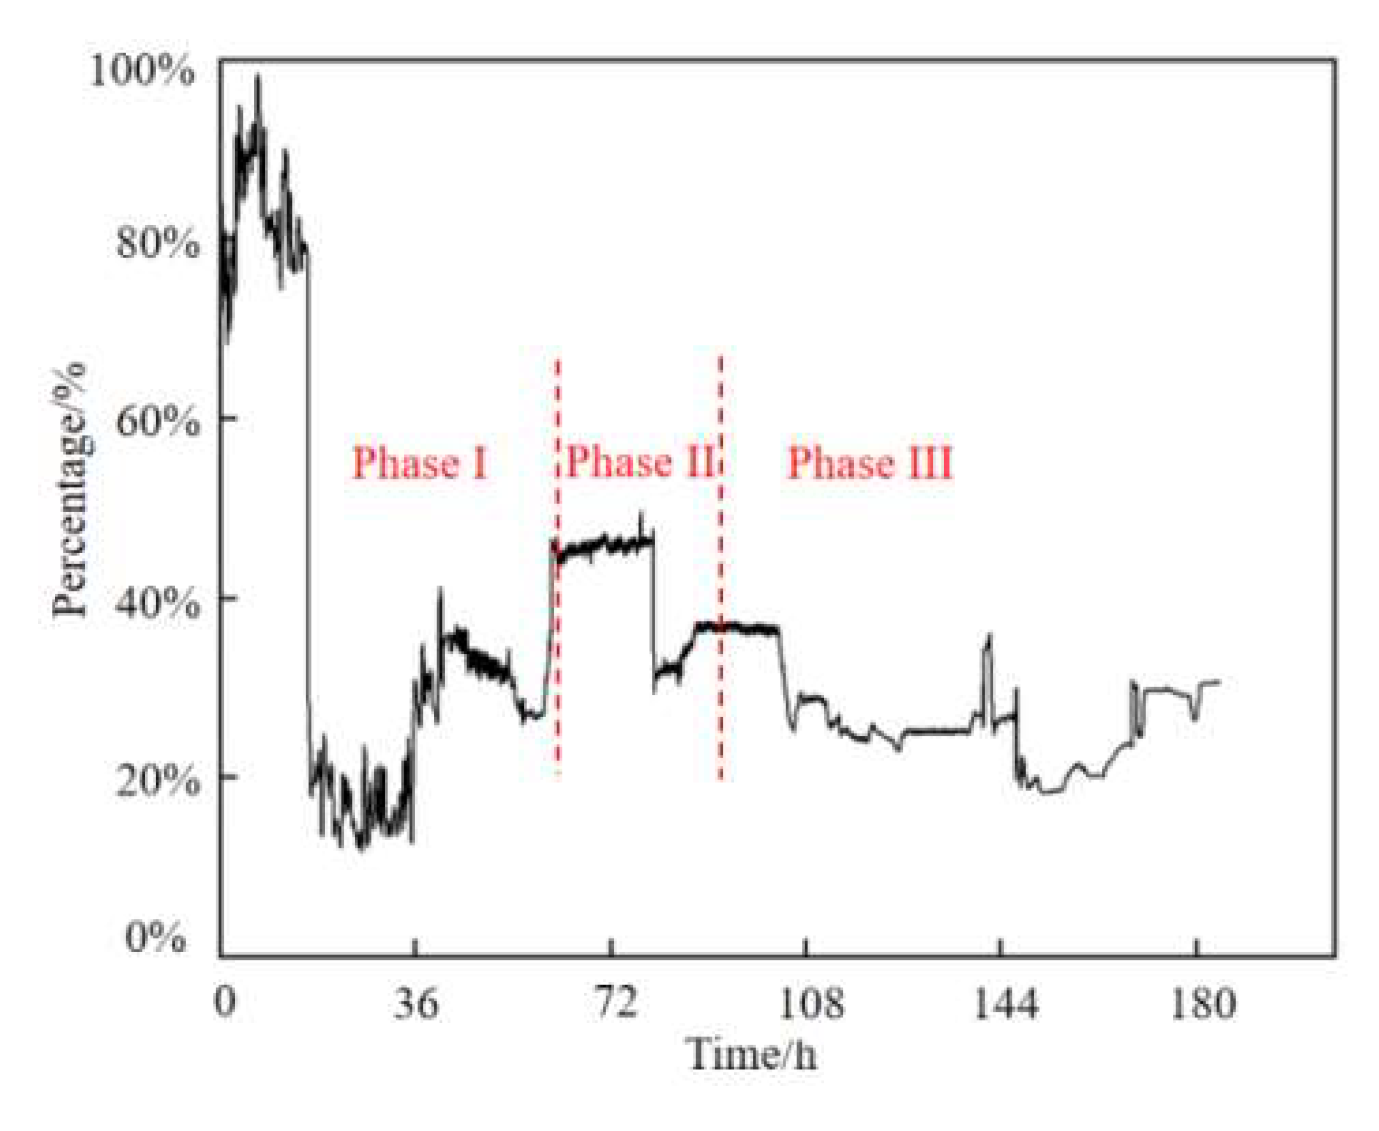
Figure 11.
Proportion of axial stress at the end of S—1.
Figure 11.
Proportion of axial stress at the end of S—1.
Figure 12.
L—1 initial load test. (a) Impact load acceleration waveform, (b) After 168 h of loading.
Figure 12.
L—1 initial load test. (a) Impact load acceleration waveform, (b) After 168 h of loading.
Figure 13.
Displacement and load of L—1 monitoring point. (a) L—1 displacement monitoring, (b) Load displacement scatter diagram at Jack, (c) Axial load.
Figure 13.
Displacement and load of L—1 monitoring point. (a) L—1 displacement monitoring, (b) Load displacement scatter diagram at Jack, (c) Axial load.
Figure 14.
L—1 initial load test.
Figure 14.
L—1 initial load test.
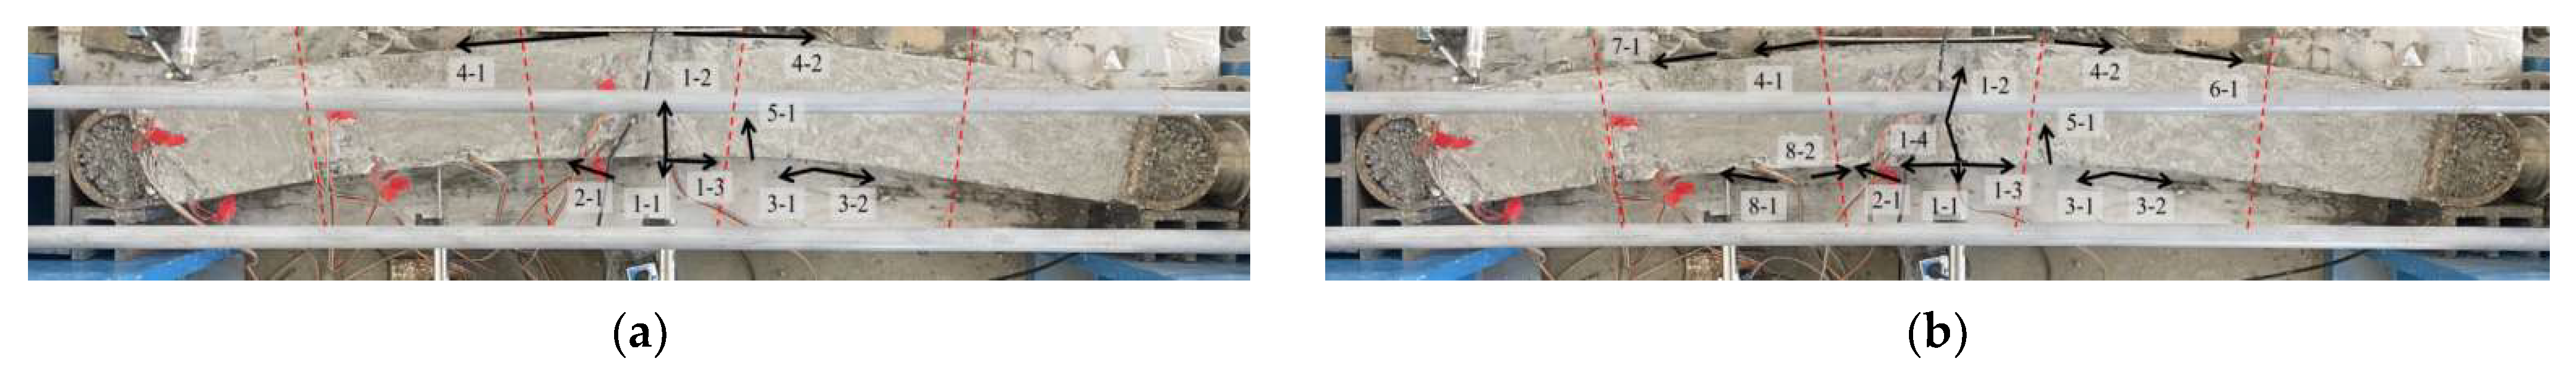
Figure 15.
S—1 phased loading completion diagram of test piece. (a) The phase I of loading is over, (b) The phase II of loading is over.
Figure 15.
S—1 phased loading completion diagram of test piece. (a) The phase I of loading is over, (b) The phase II of loading is over.
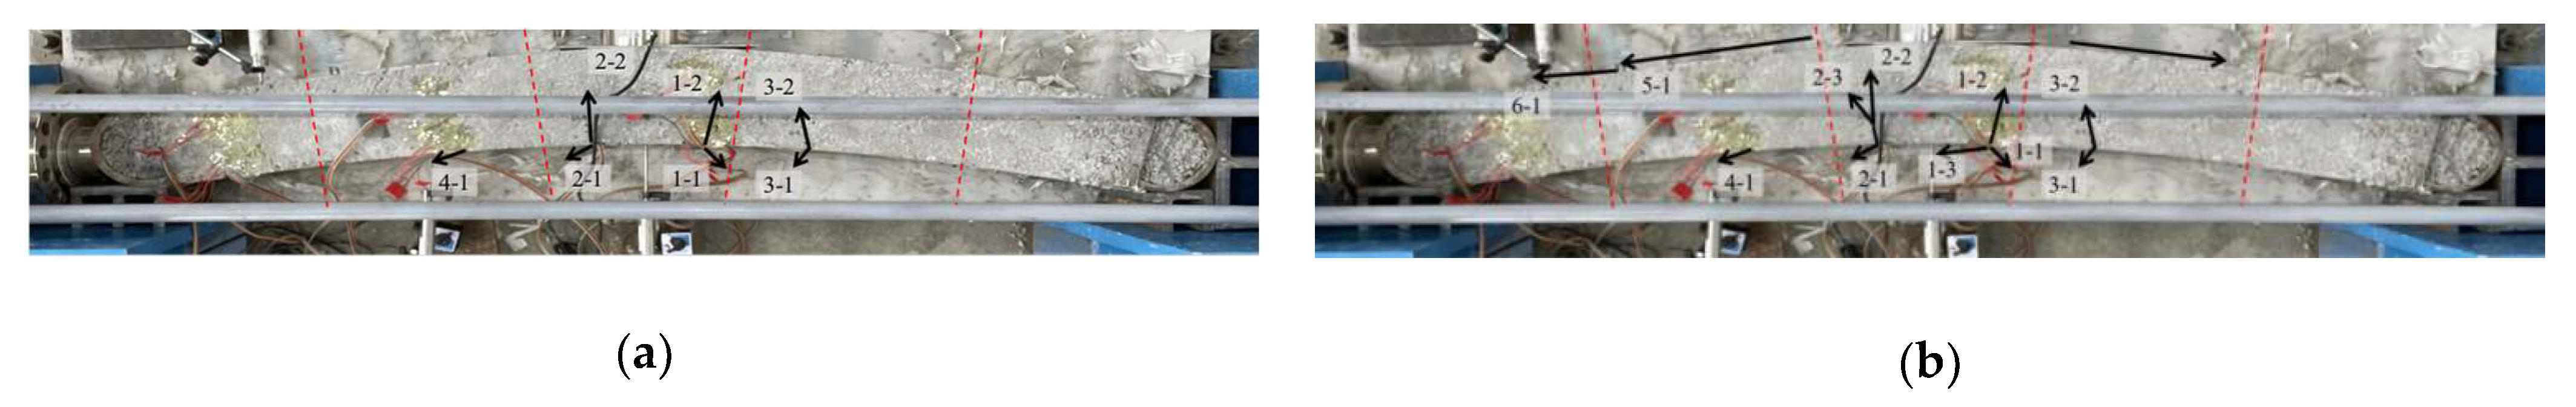
Figure 16.
S—2 phased loading completion diagram of test piece. (a) The phase I of loading is over, (b) The phase II of loading is over.
Figure 16.
S—2 phased loading completion diagram of test piece. (a) The phase I of loading is over, (b) The phase II of loading is over.
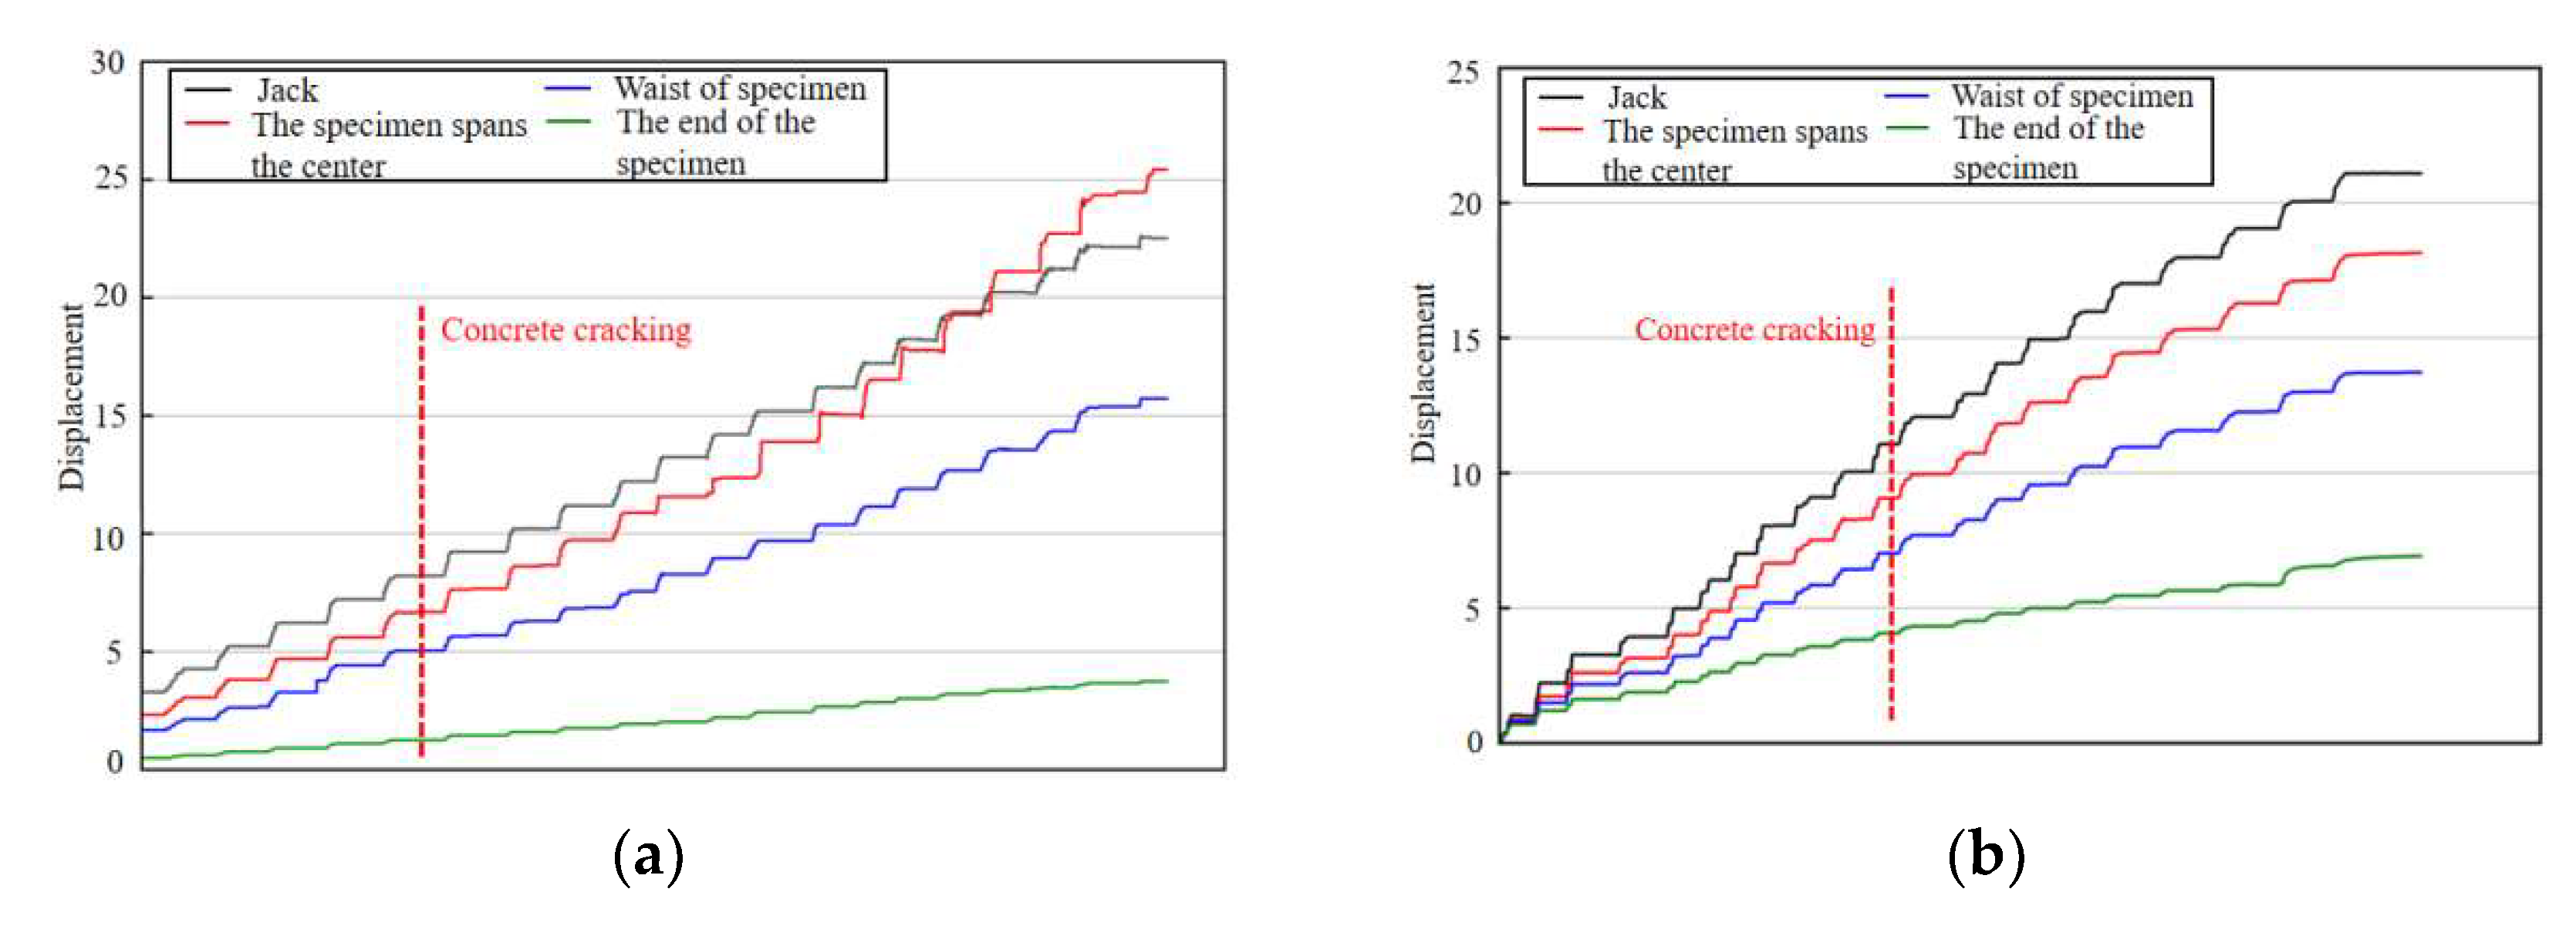
Figure 17.
Displacement monitoring value of section steel specimen. (a) Displacement monitoring curve of specimen S—1, (b) Displacement monitoring curve of specimen S—2.
Figure 17.
Displacement monitoring value of section steel specimen. (a) Displacement monitoring curve of specimen S—1, (b) Displacement monitoring curve of specimen S—2.
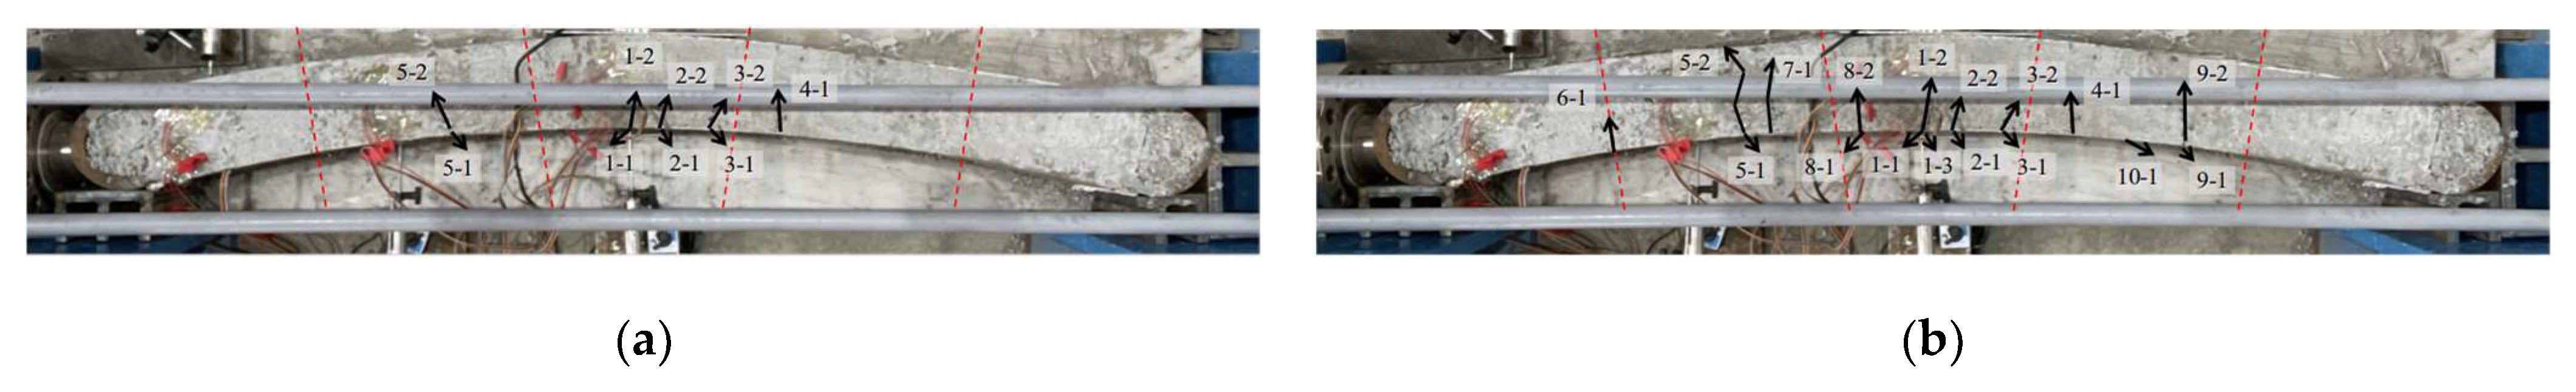
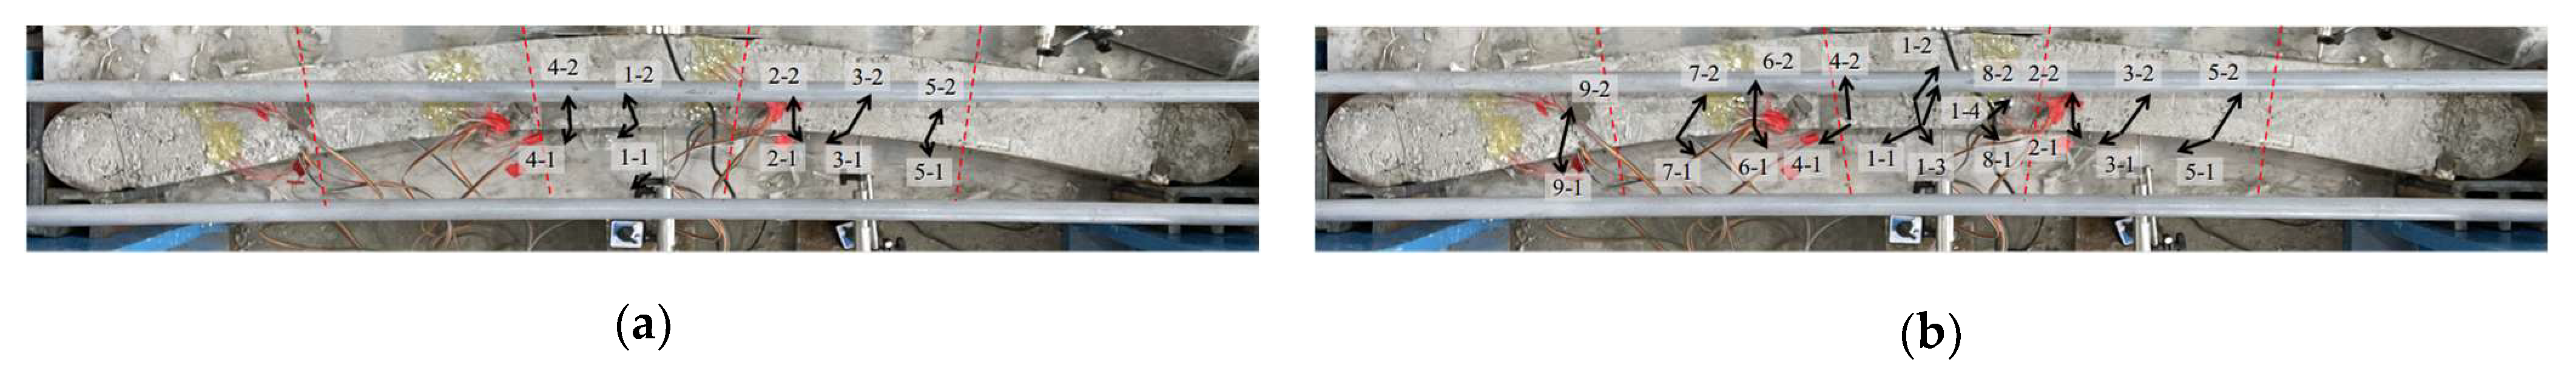
Figure 18.
L—1 phased loading completion diagram of test piece. (a) The phase I of loading is over, (b) The phase II of loading is over.
Figure 18.
L—1 phased loading completion diagram of test piece. (a) The phase I of loading is over, (b) The phase II of loading is over.
Figure 19.
L—2 phased loading completion diagram of test piece. (a) The phase I of loading is over, (b) The phase II of loading is over.
Figure 19.
L—2 phased loading completion diagram of test piece. (a) The phase I of loading is over, (b) The phase II of loading is over.
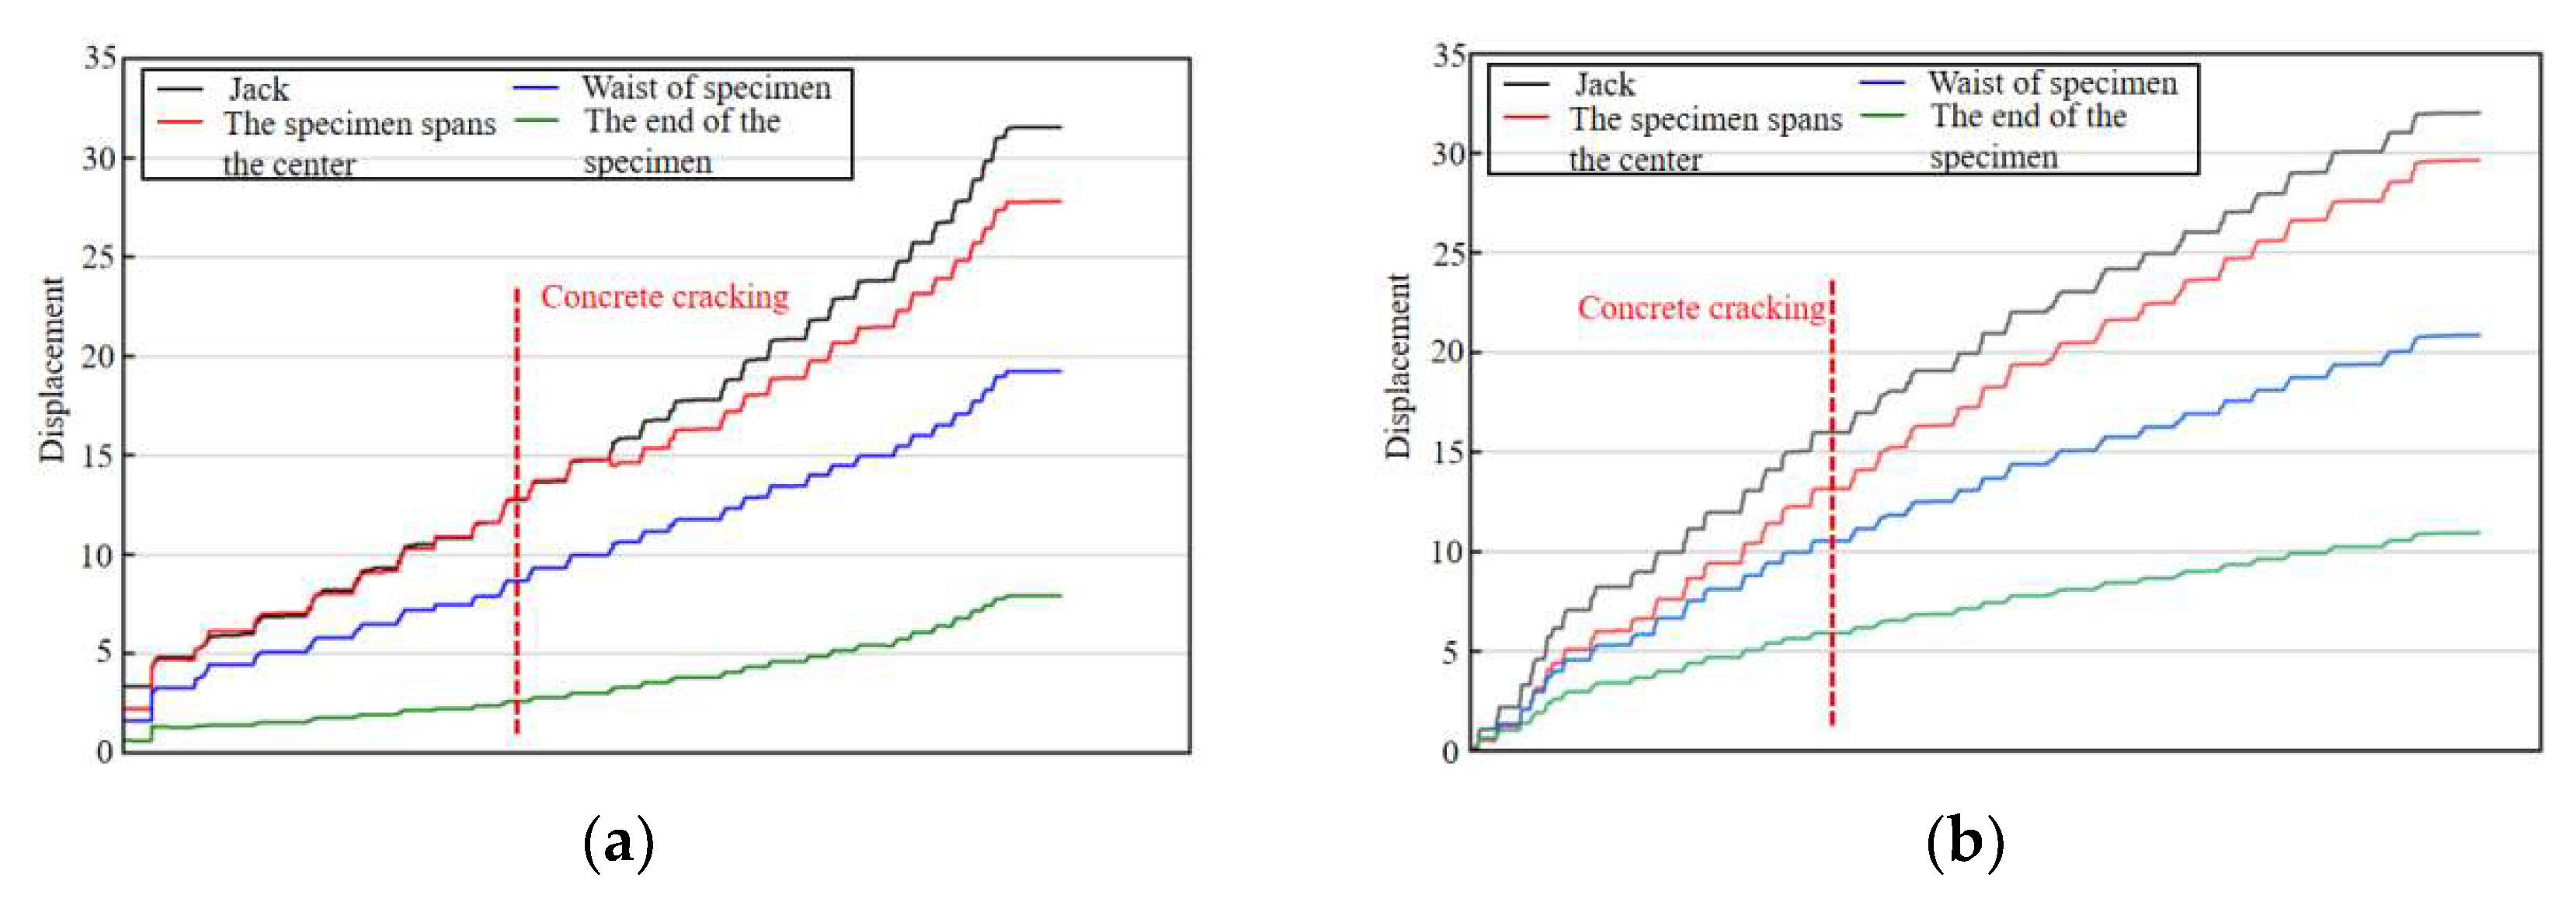
Figure 20.
Displacement monitoring curve of grid specimen. (a) Displacement monitoring curve of test piece L—1, (b) Displacement monitoring curve of test piece L—2.
Figure 20.
Displacement monitoring curve of grid specimen. (a) Displacement monitoring curve of test piece L—1, (b) Displacement monitoring curve of test piece L—2.
Figure 21.
Load and displacement curves of test pieces S—1 and S—2.
Figure 21.
Load and displacement curves of test pieces S—1 and S—2.
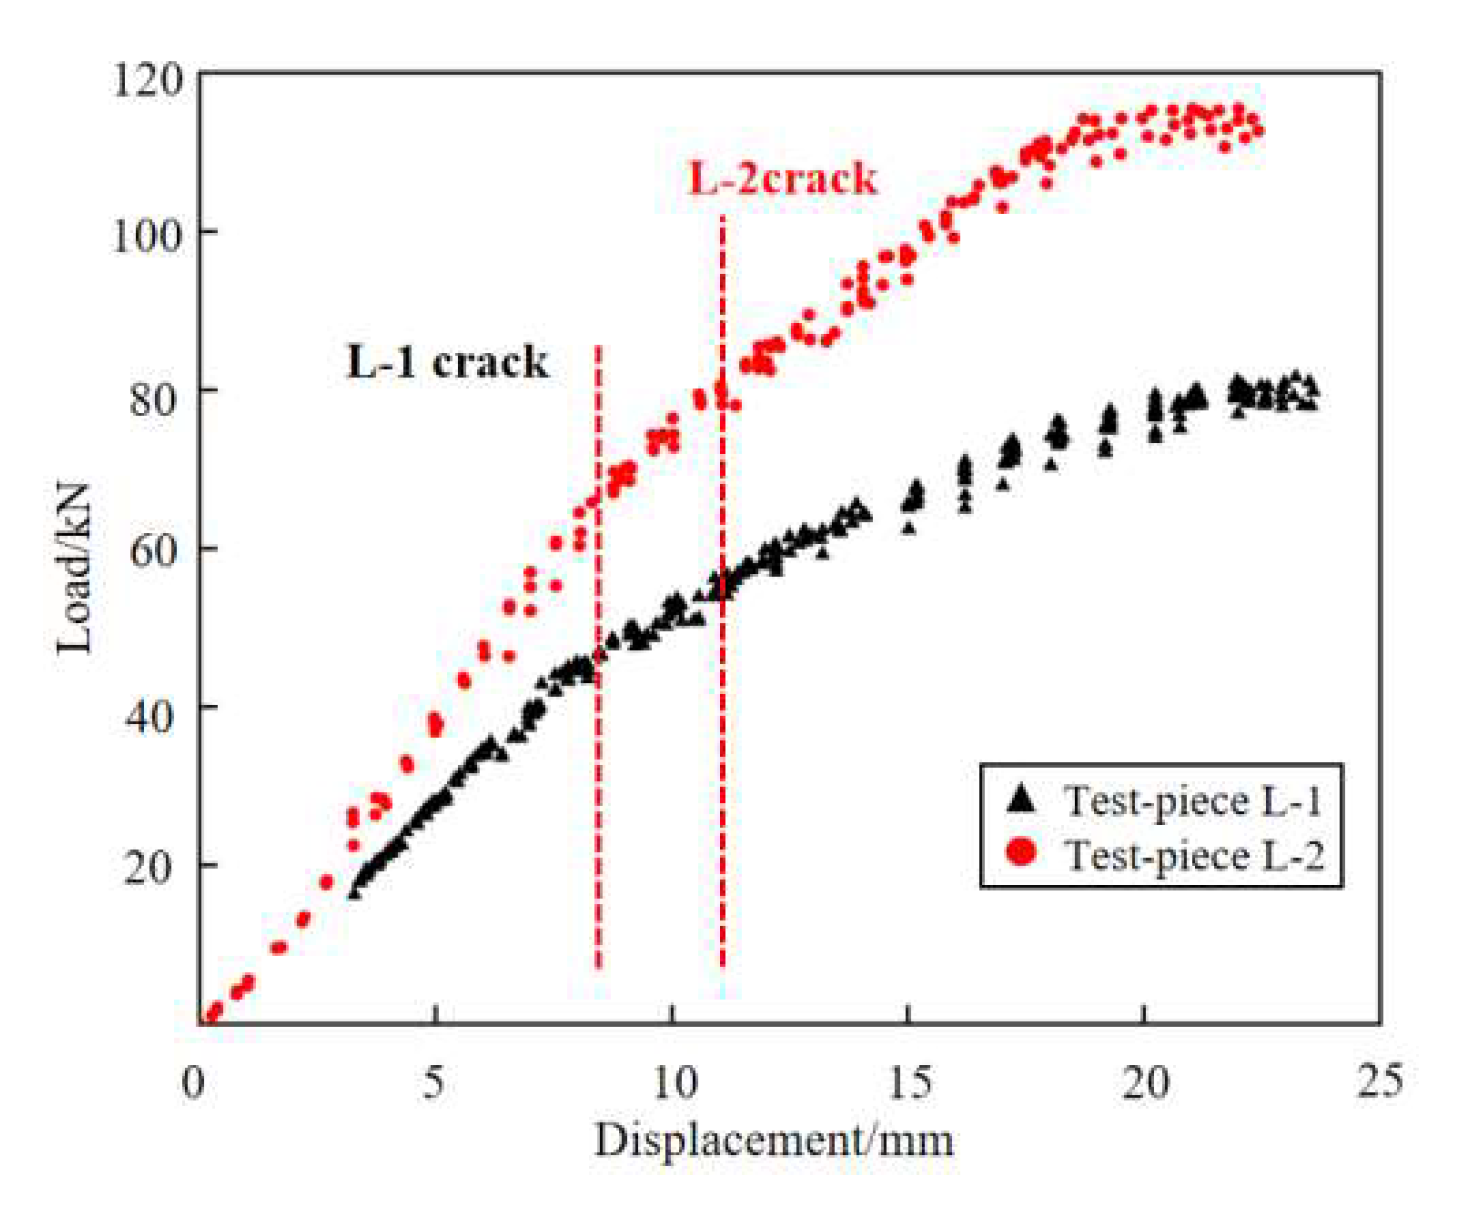
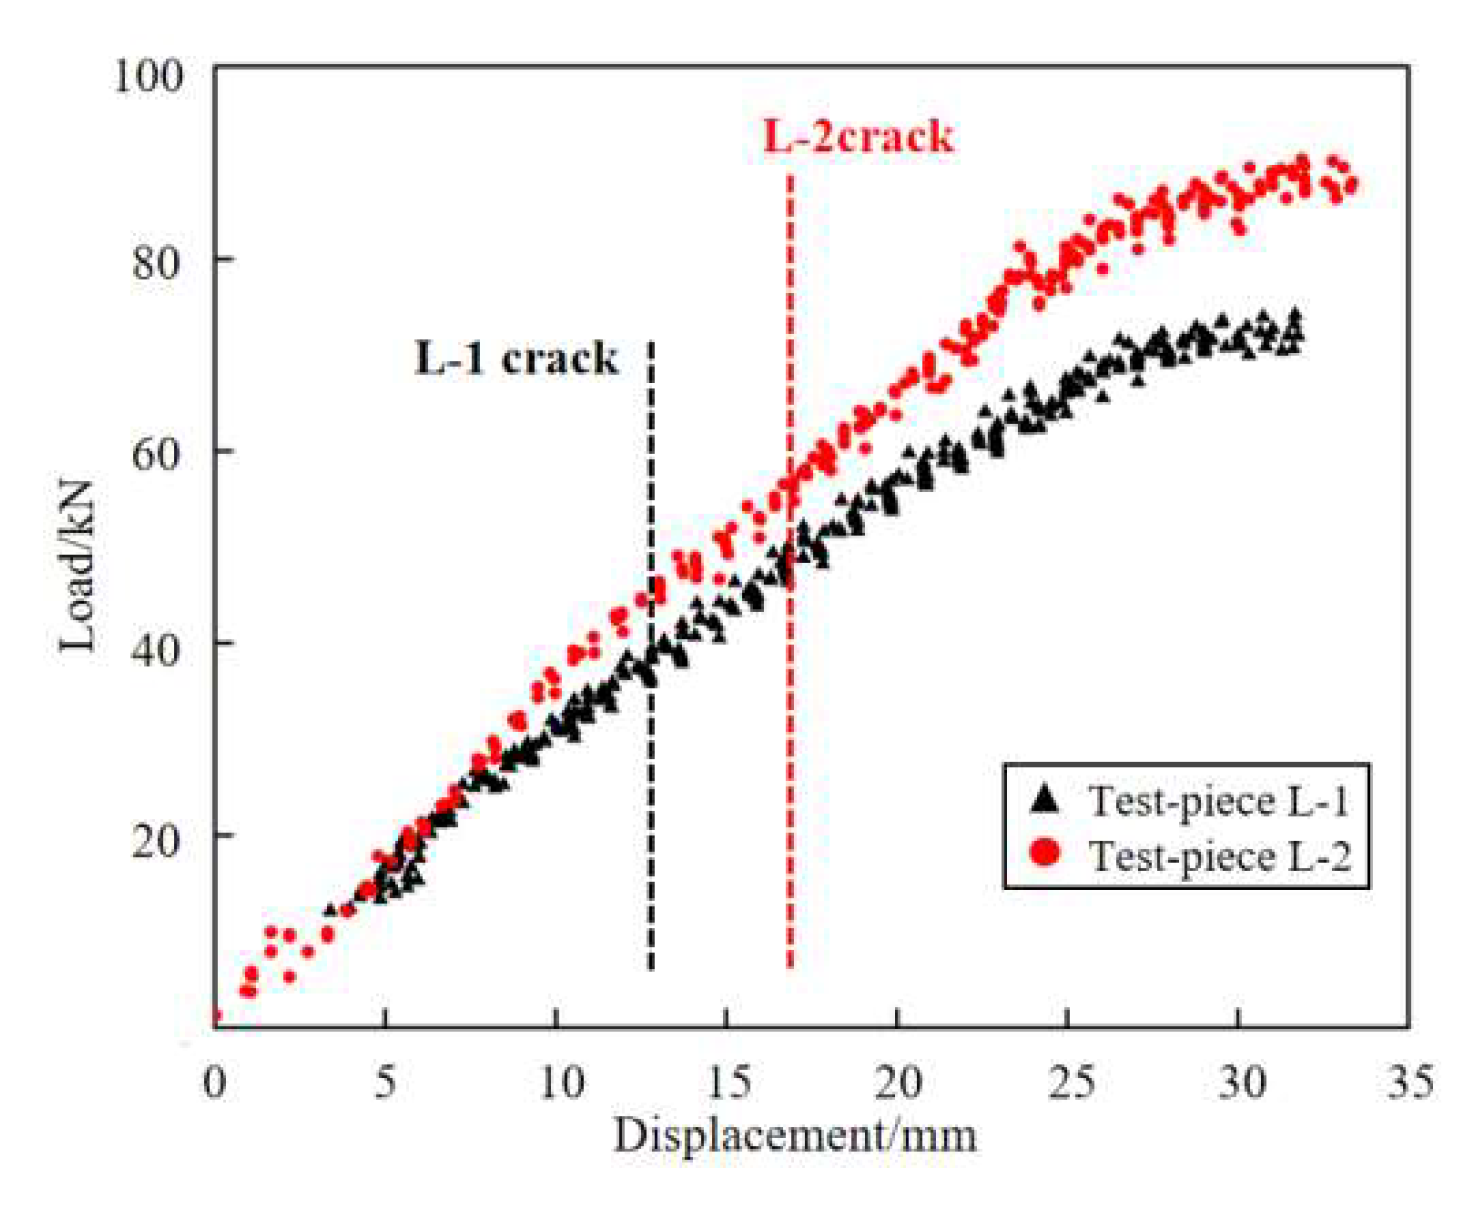
Figure 22.
Load and displacement curves of test pieces L—1 and L—2.
Figure 22.
Load and displacement curves of test pieces L—1 and L—2.
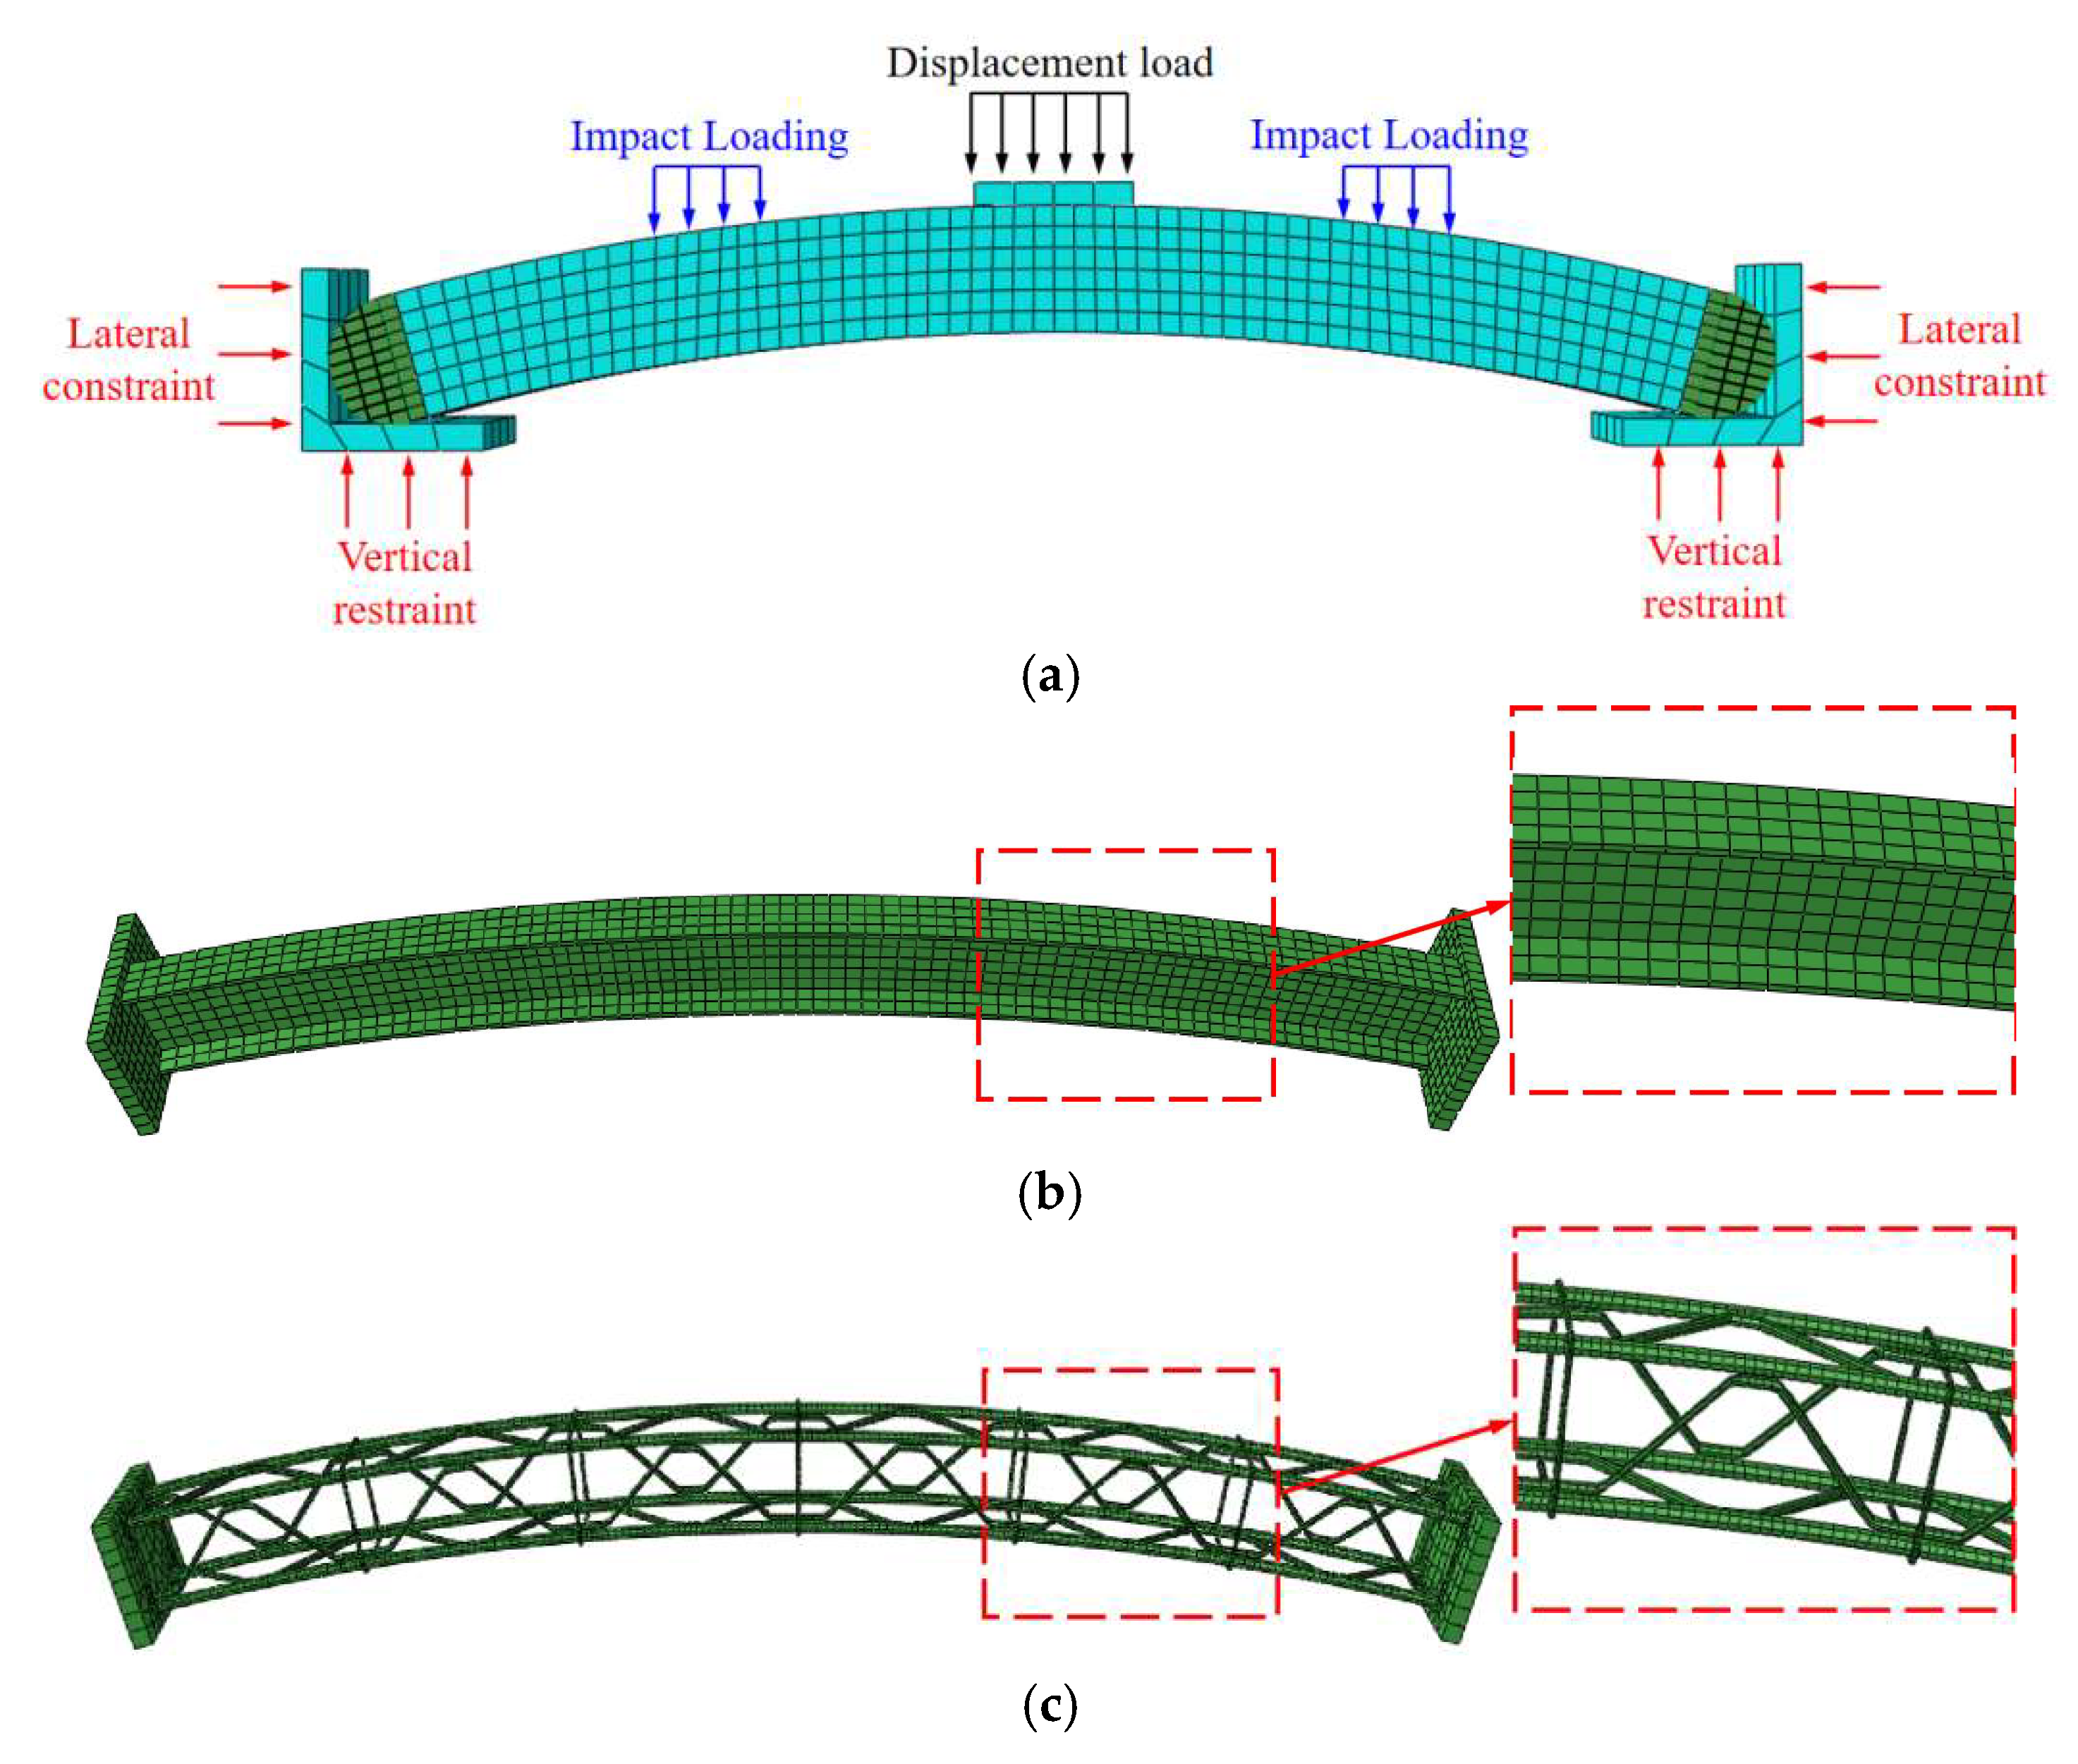
Figure 23.
Establishment of numerical model. (a) Numerical test model, (b) Section steel frame member, (c) Grating steel frame components. (The red box in the figure is a partially enlarged schematic diagram).
Figure 23.
Establishment of numerical model. (a) Numerical test model, (b) Section steel frame member, (c) Grating steel frame components. (The red box in the figure is a partially enlarged schematic diagram).
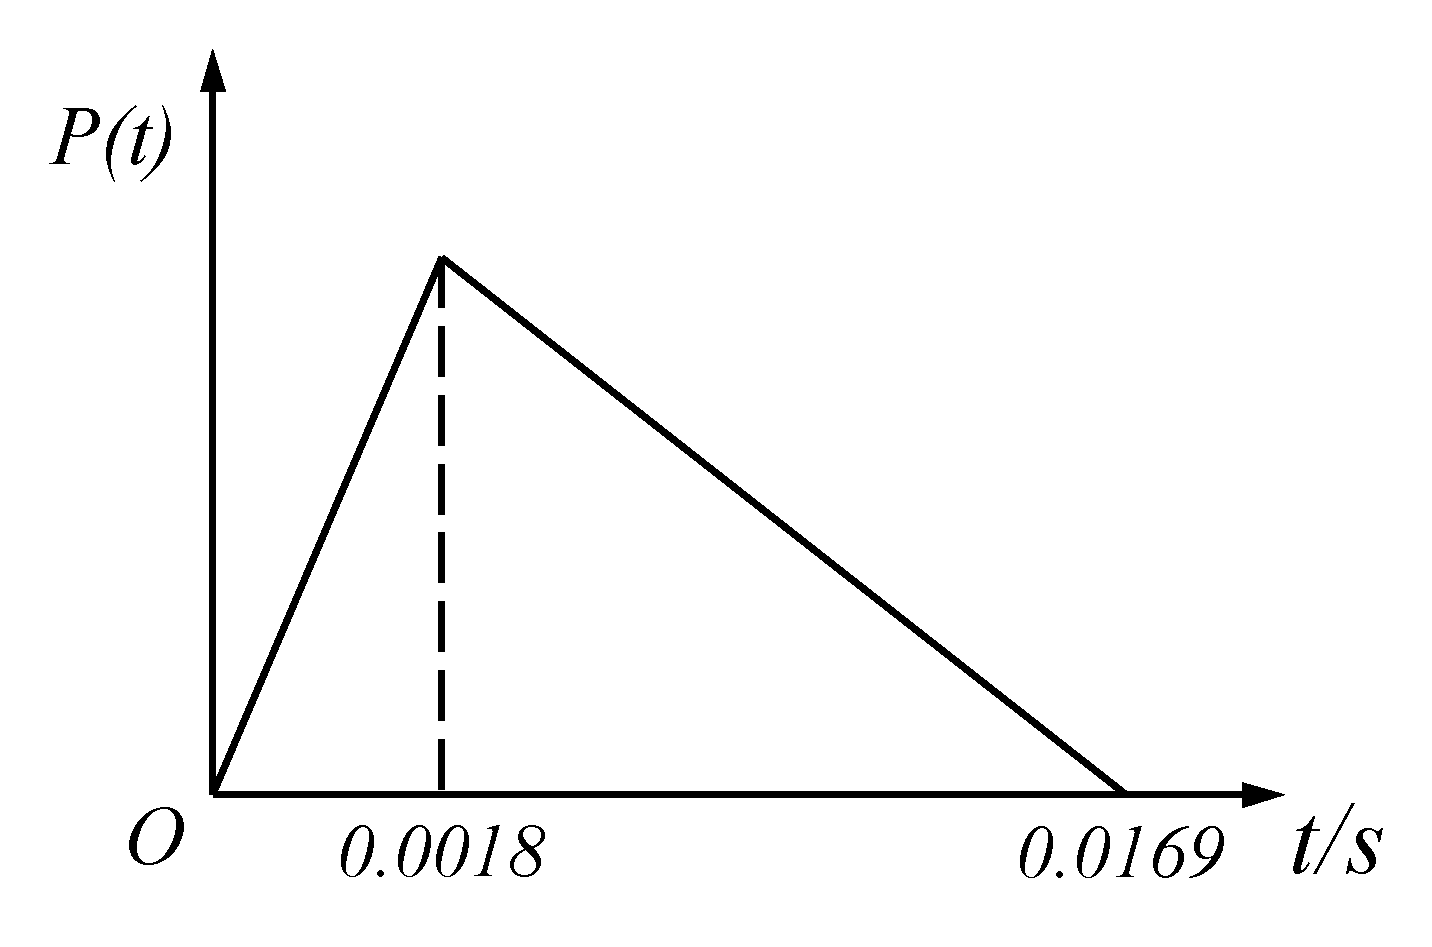
Figure 24.
Impact load application curve.
Figure 24.
Impact load application curve.
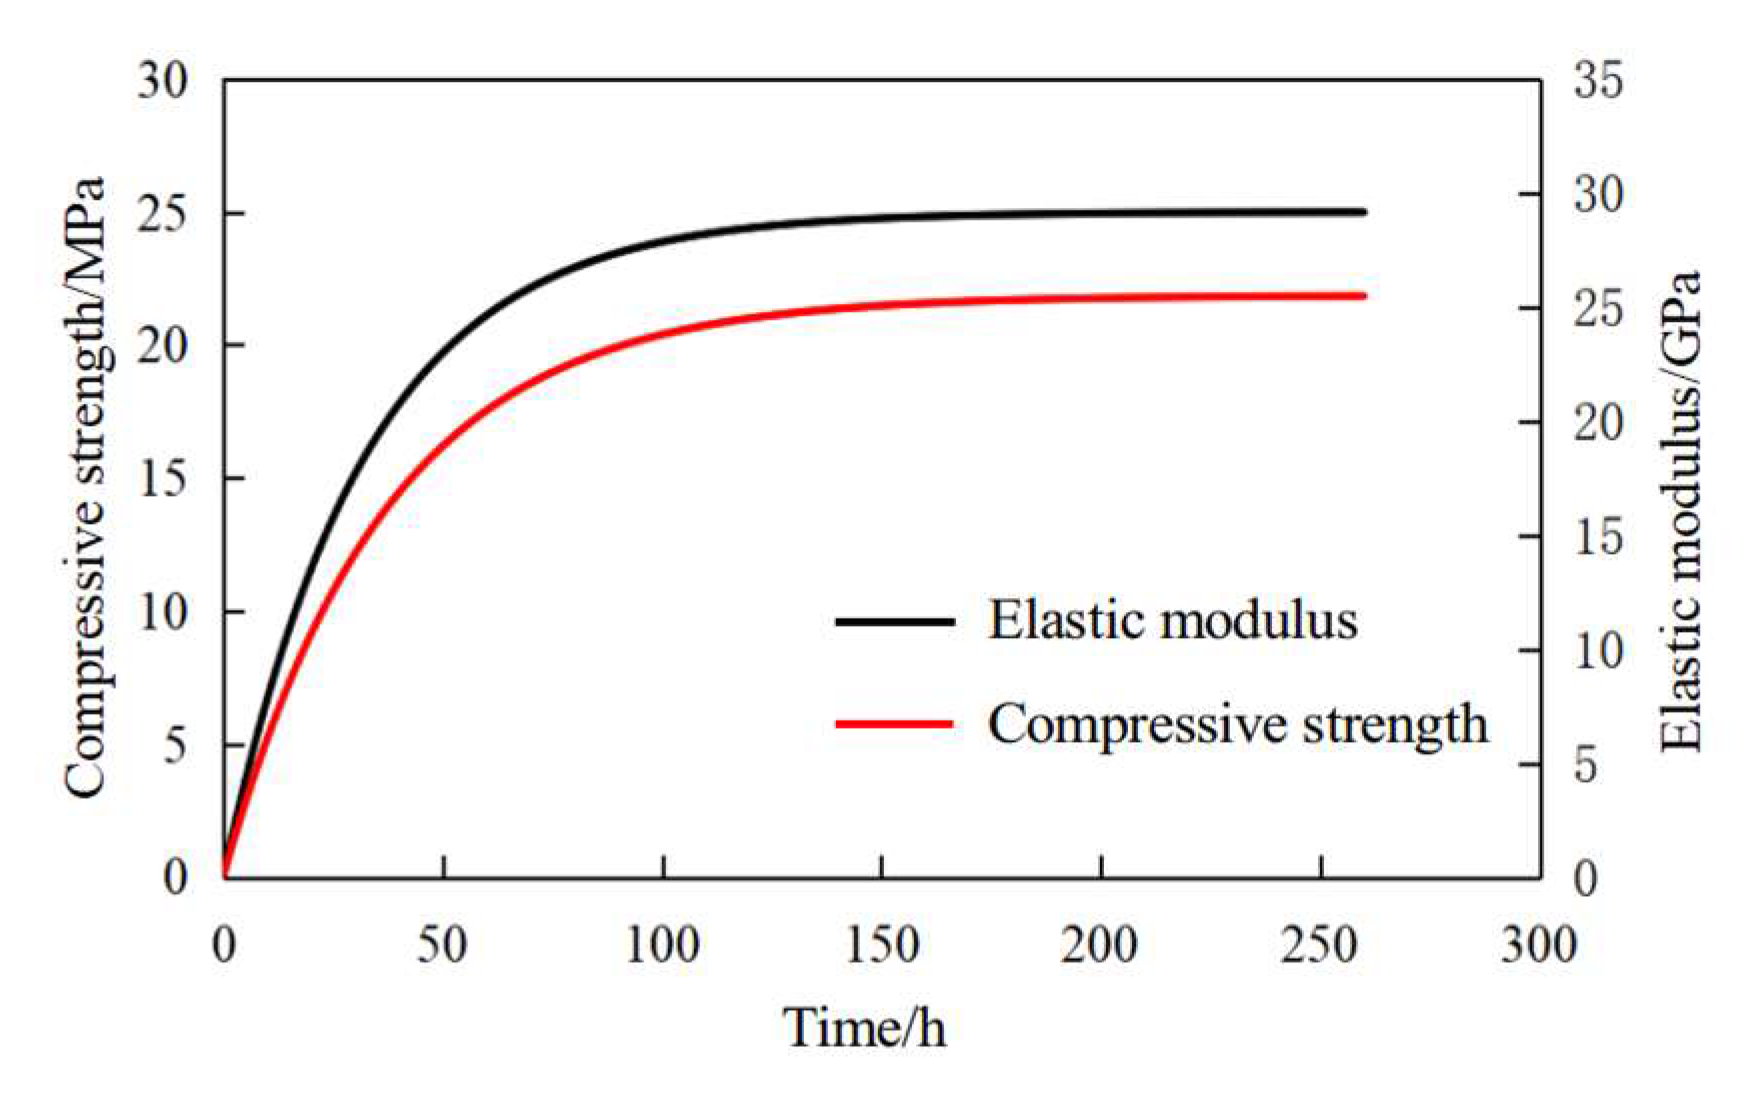
Figure 25.
Mechanical characteristic curve of concrete hardening process.
Figure 25.
Mechanical characteristic curve of concrete hardening process.
Figure 26.
A—S—3 Cloud image after loading. (a) Maximum principal stress of profile steel frame, (b) Maximum principal stress of concrete.
Figure 26.
A—S—3 Cloud image after loading. (a) Maximum principal stress of profile steel frame, (b) Maximum principal stress of concrete.
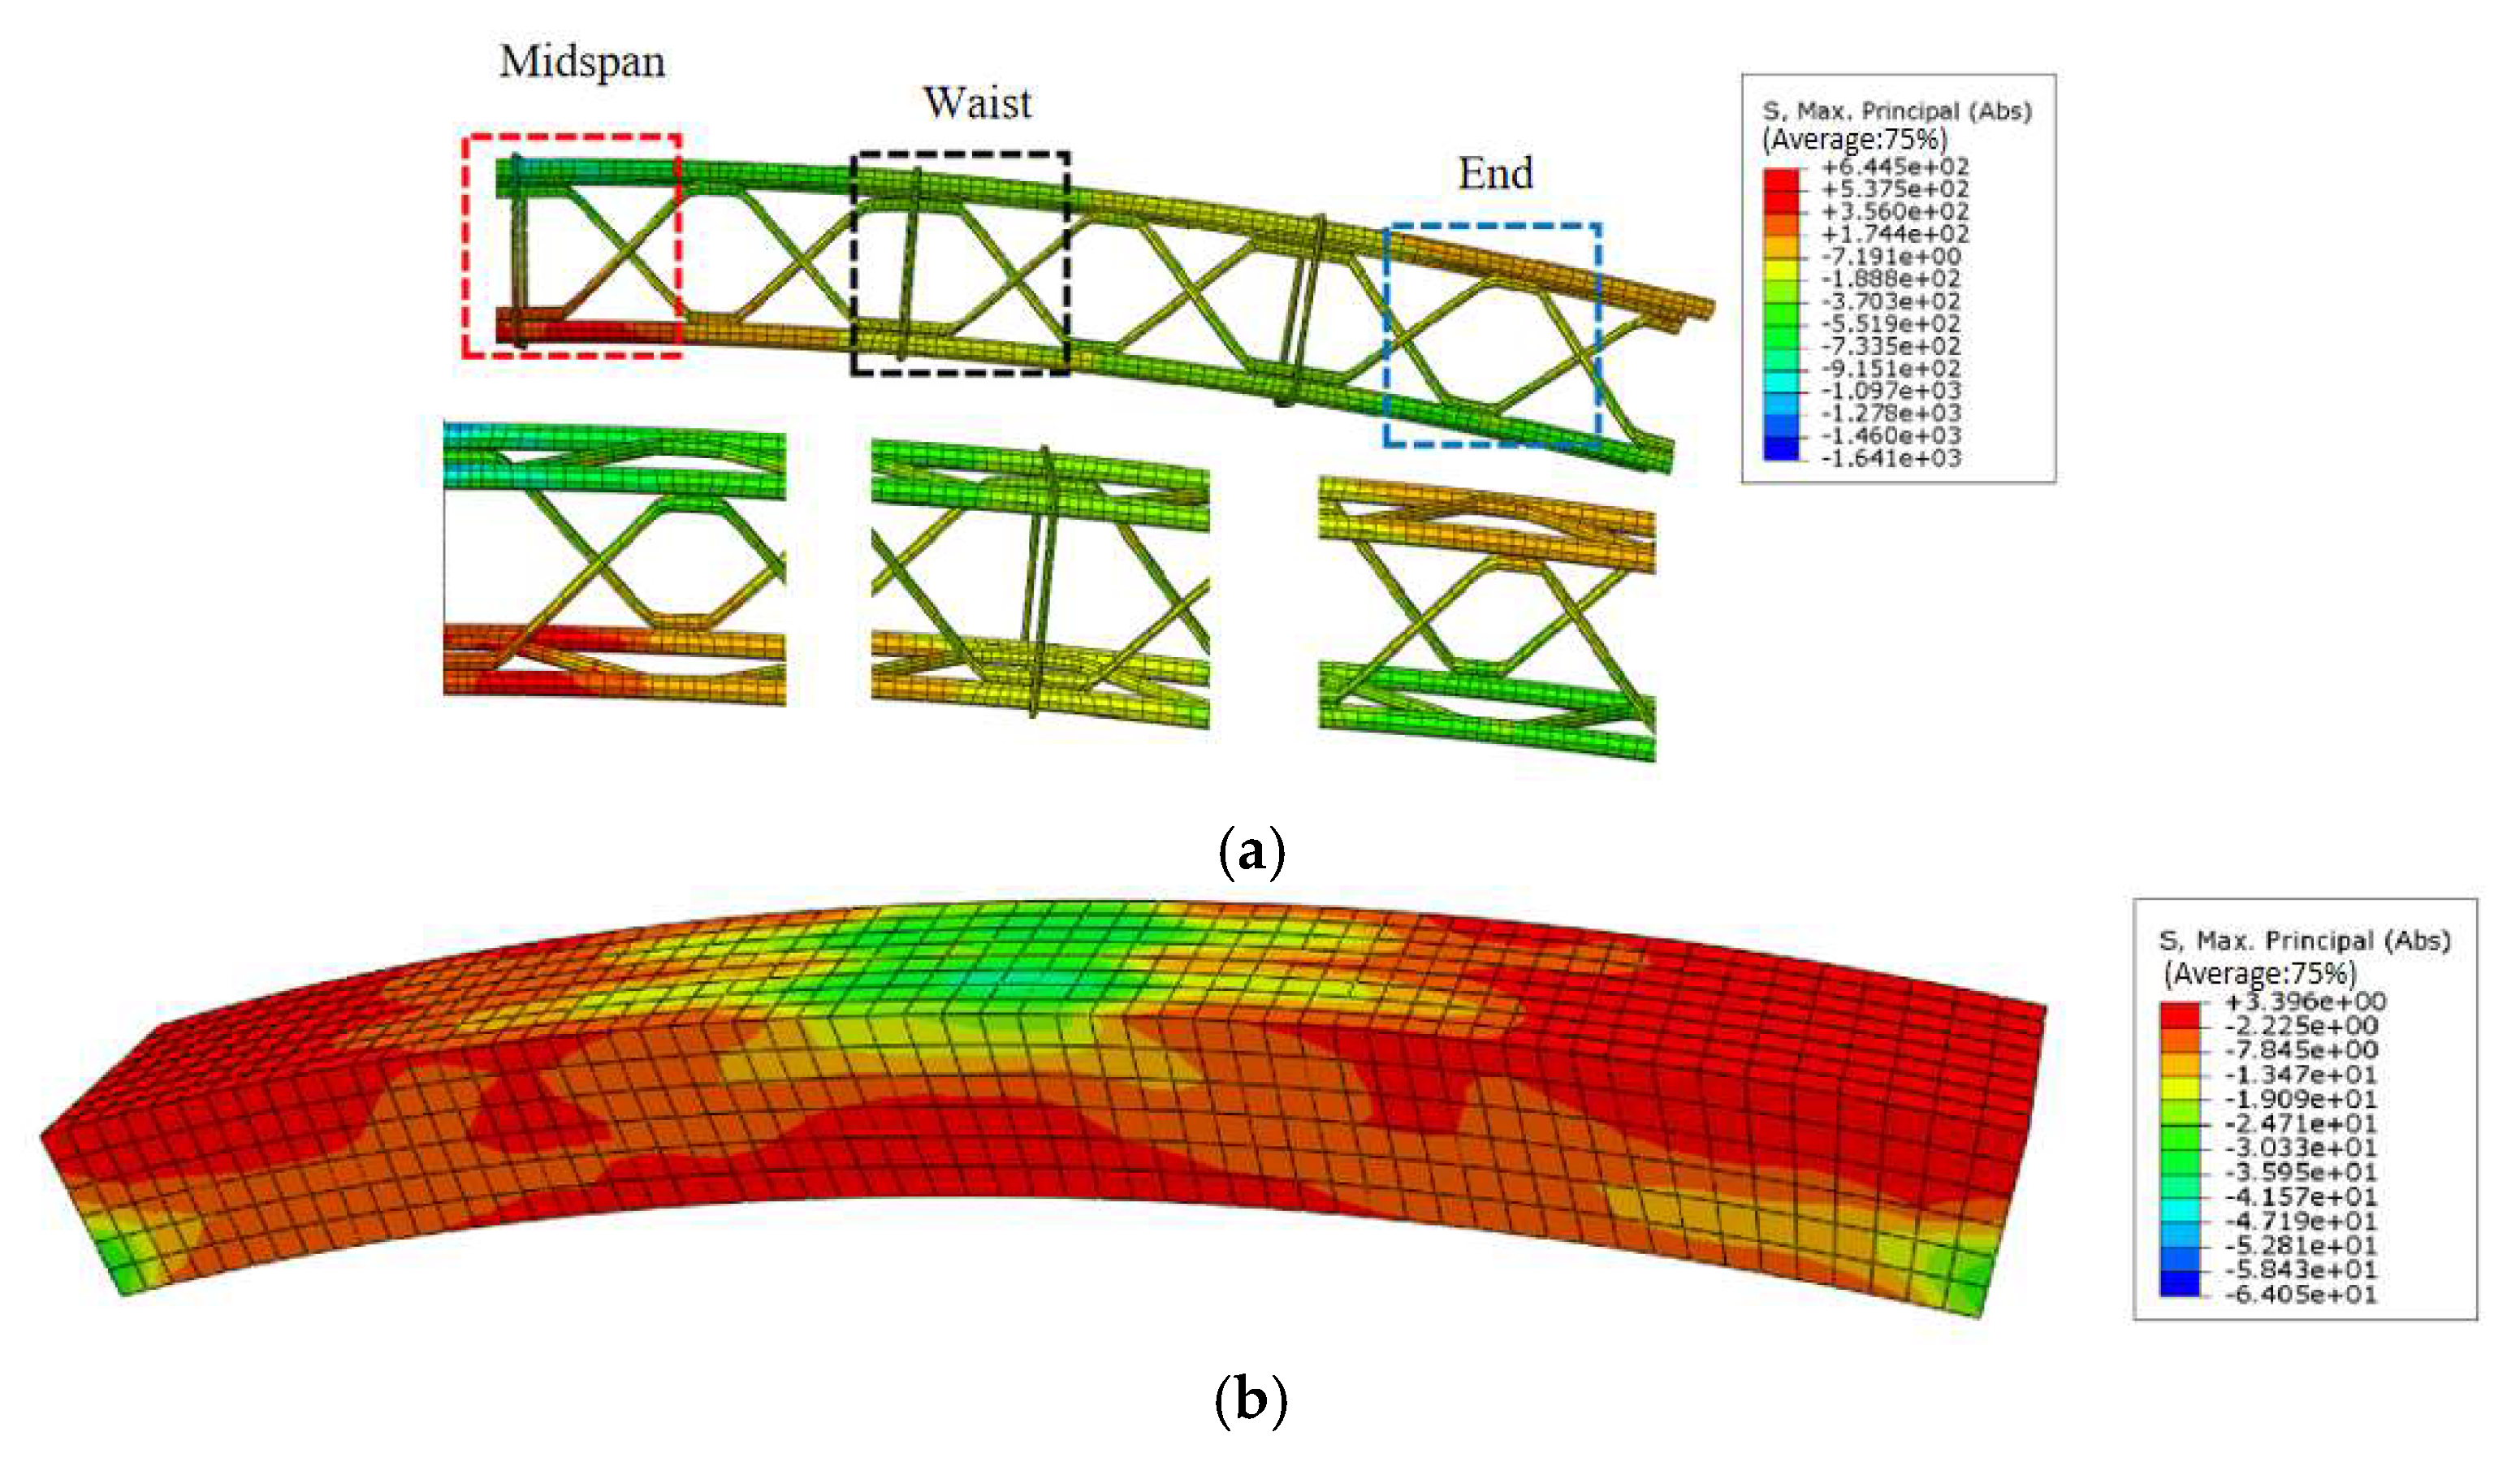
Figure 27.
A-L-3 Cloud image after loading. (a) Maximum principal stress of grid steel frame, (b) Maximum principal stress of concrete.
Figure 27.
A-L-3 Cloud image after loading. (a) Maximum principal stress of grid steel frame, (b) Maximum principal stress of concrete.
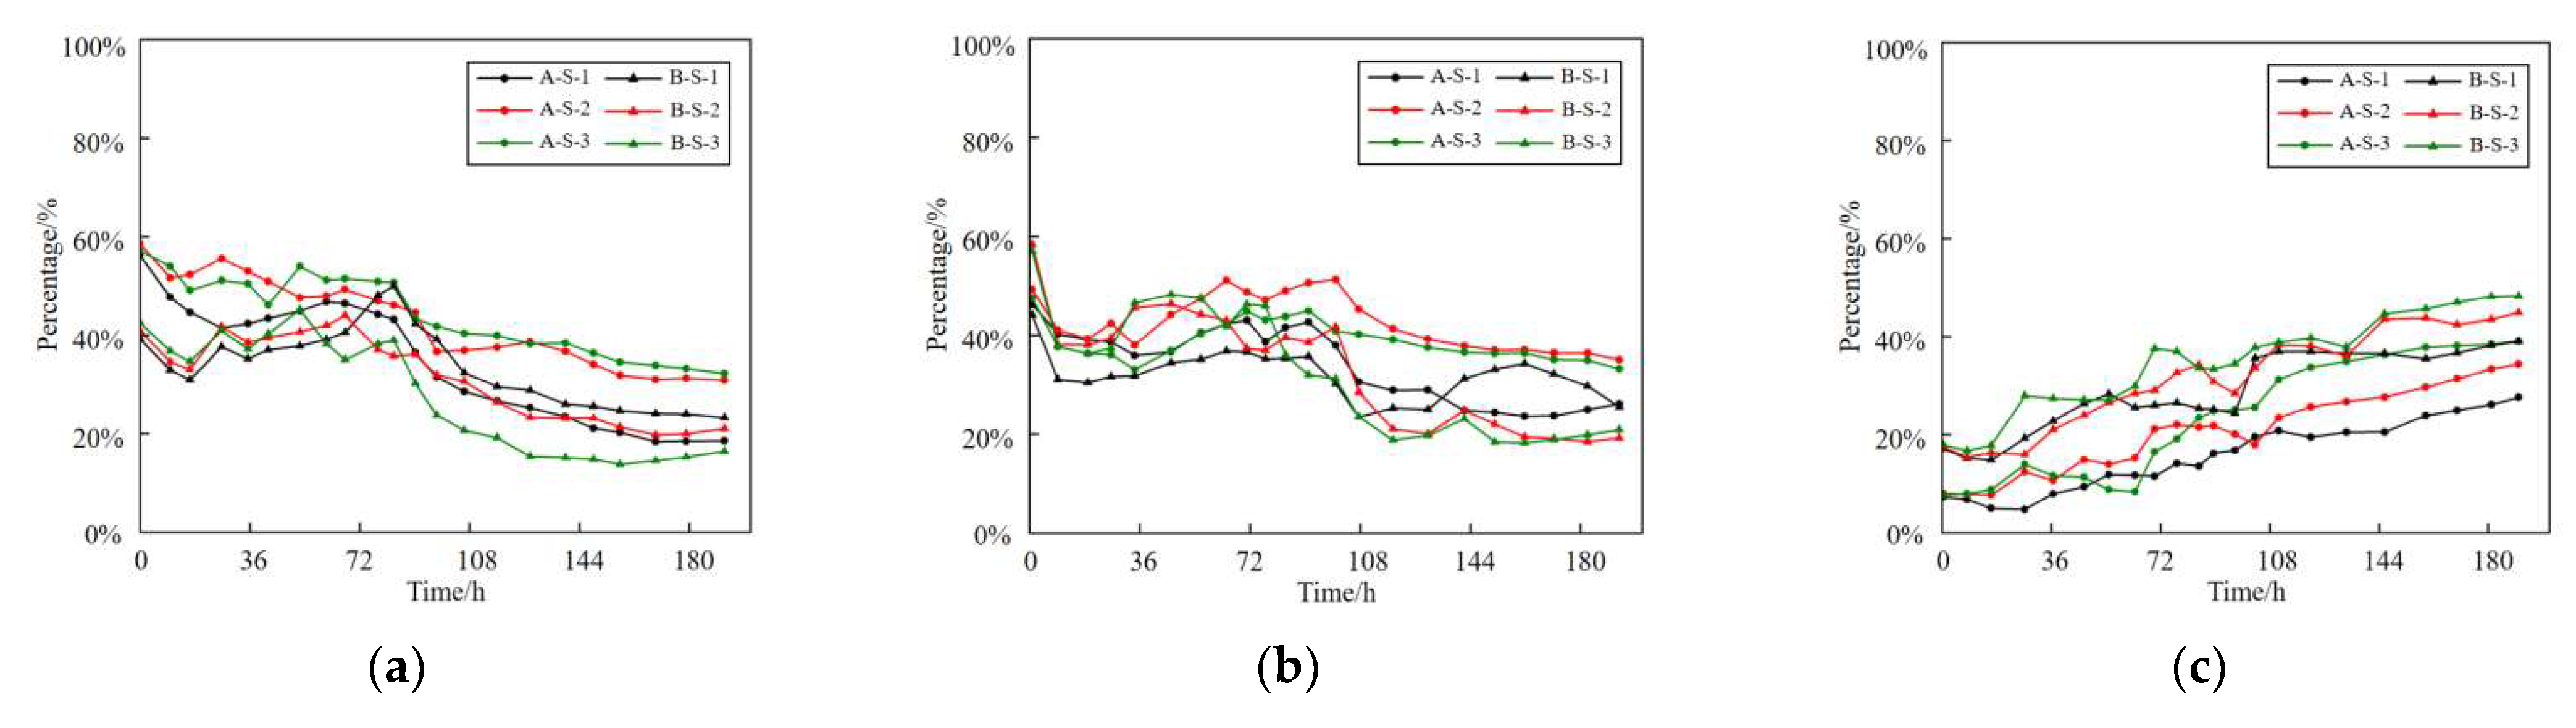
Figure 28.
Axial Stress Ratio of I-steel Frame. (a) Mid span area of test piece, (b) Waist area of test piece, (c) End area of test piece.
Figure 28.
Axial Stress Ratio of I-steel Frame. (a) Mid span area of test piece, (b) Waist area of test piece, (c) End area of test piece.
Figure 29.
Axial stress ratio of grid steel frames. (a) Mid span area of test piece, (b) Waist area of test piece, (c) End area of test piece.
Figure 29.
Axial stress ratio of grid steel frames. (a) Mid span area of test piece, (b) Waist area of test piece, (c) End area of test piece.
Table 1.
Summary table for strength verification of shotcrete in the tunnel blasting.
Table 1.
Summary table for strength verification of shotcrete in the tunnel blasting.
| Monitoring Date | Explosive Charge (kg) | Distance from Measuring Point to Tunnel Face (m) | Maximum Vibration Velocity (cm/s) | Internal Tensile Stress of Shotcrete (MPa) | Tensile Strength of Concrete at This Time (MPa) |
|---|
| 3.23–15:52 | 20.7 | 2 | 8.125 | 1.489 | 0.1334 |
| 3.24–15:01 | 20.7 | 2.75 | 6.467 | 1.185 | 0.3551 |
| 3.25–15:40 | 20.7 | 3.5 | 4.854 | 0.889 | 0.935 |
| 3.26–15:53 | 20.7 | 4.25 | 3.211 | 0.588 | 1.371 |
| 3.27–14:17 | 20.7 | 5.75 | 2.787 | 0.510 | 1.55 |
| 3.28–16:13 | 20.7 | 7.25 | 2.335 | 0.428 | 1.689 |
| 3.29–15:39 | 20.7 | 8.75 | 4.619 | 0.846 | 1.786 |
| 3.30–16:18 | 20.7 | 10.25 | 3.092 | 0.566 | 1.849 |
Table 2.
Dimension of similarity parameters.
Table 2.
Dimension of similarity parameters.
| Parameter | Symbolic Representation | Dimensional Analysis of Force System |
|---|
| Geometric parameter | Line size | L | L |
| Steel frame size | d | L |
| Blasting parameters | Impact force | F | F |
| Vibration velocity | V | LT−1 |
| Timeparameter | Gravitational acceleration | g | LT−2 |
| Time | t | T |
| Material parameter | Material density | ρ | FL−4T2 |
| Poisson’s ratio | μ | / |
Table 3.
Matrix dimension of force system.
Table 3.
Matrix dimension of force system.
| | α1 | α2 | α3 | α4 | α5 | α6 | α7 |
|---|
| | L | d | F | V | g | t | ρ |
| F | 0 | 0 | 1 | 0 | 0 | 0 | 1 |
| L | 1 | 1 | 0 | 1 | 1 | 0 | −4 |
| T | 0 | 0 | 0 | −1 | −2 | 1 | 2 |
Table 4.
Similarity value of each similarity parameter.
Table 4.
Similarity value of each similarity parameter.
| Parameter | Similarity Criterion | Similarity Ratio | Actual Value | Similar Value |
|---|
| Geometric parameter | Impact force | CF = CF | 1 | / | / |
| Vibration velocity | CD = Cg Ct | 1.41 | / | / |
| Blasting parameters | Line size | CL | 2 | / | / |
| Steel frame size | CL | 2 | 2.8 m | 1.4 m |
| Time parameter | Acceleration of gravity | Cg = g | 1 | 10 N/kg | 10 N/kg |
| Blasting interval time | Ct = CL0.5 | 1.41 | 24 h | 16.97 h |
| Material parameter | Material density | Cρ | 1 | 2670 kg/m3 | 2670 kg/m3 |
| Poisson’s ratio | | | 0.24 | 0.24 |
Table 5.
Parameters of steel frame.
Table 5.
Parameters of steel frame.
| Section steel frame | Waist height/mm | Leg width/mm | Waist thickness/mm | Average leg width/mm | Inner arc radius/mm |
| 100 | 50 | 5 | 10 | 3.8 |
| Grille steel frame | Center angle of steel frame/° | Inner contour radius of steel frame/m | Diameter of main reinforcement/mm | Centroid spacing of main reinforcement/mm | Z-Bar diameter/mm | Stirrup diameter/mm | stirrup spacing/mm |
| 30 | 2.74 | 12.5 | 75 | 8 | 5 | 210 |
Table 6.
Concrete arch support specimens loading test scheme.
Table 6.
Concrete arch support specimens loading test scheme.
| Component Group | Component Number | Maintenance Method | Corresponding Test Stage |
|---|
| Test group | S—1, L—1, | Full loading without curing | ①, ② |
| Control group | S—2, L—2 | Standing curing | ② |
Table 7.
Loading scheme for initial load control stage.
Table 7.
Loading scheme for initial load control stage.
| Time/h | Single Loading Displacement | Cumulative Displacement | Impact Loading |
|---|
| 9 | 0.25 mm | 0.25 mm | First time |
| 18 | 0.25 mm | 0.5 mm | |
| 27 | 0.25 mm | 0.75 mm | Second time |
| 36 | 0.25 mm | 1 mm | |
| 45 | 0.25 mm | 1.25 mm | Third time |
| 54 | 0.25 mm | 1.5 mm | |
| 72 | 0.25 mm | 1.75 mm | |
| 90 | 0.25 mm | 2 mm | |
| 108 | 0.25 mm | 2.25 mm | |
| 126 | 0.25 mm | 2.5 mm | |
| 144 | 0.25 mm | 2.75 mm | |
| 162 | 0.25 mm | 3 mm | |
| 180 | 0.25 mm | 3.25 mm | |
| Destruction |
Table 8.
Numerical Test Plan.
Table 8.
Numerical Test Plan.
| Test Piece Number | Length of Test Piece/mm | Arch Radius/m | Radian | Times of Impact Loads |
|---|
| A—S—n | 1660 | 2.74 | π/6 | 1 |
| 2 |
| 3 |
| B—S—n | 1660 | 5.65 | π/12 | 1 |
| 2 |
| 3 |
| A—L—n | 1660 | 2.74 | π/6 | 1 |
| 2 |
| 3 |
| B—L—n | 1660 | 5.65 | π/12 | 1 |
| 2 |
| 3 |


