Article

The Influence of Graphene Oxide on the Performance of Concrete: A Quantitative Analysis of Mechanical and Microstructural Properties

Professional School of Civil Engineering, Universidad Privada San Juan Bautista, Chincha 11702, Peru
*
Author to whom correspondence should be addressed.
Buildings 2025, 15(7), 1082; https://doi.org/10.3390/buildings15071082
Submission received: 7 March 2025 / Revised: 20 March 2025 / Accepted: 24 March 2025 / Published: 27 March 2025

Abstract

The incorporation of graphene oxide (GO) into cementitious materials has gained significant attention due to its potential to enhance both the mechanical and microstructural properties of concrete. This study investigates the effect of GO on the compressive strength, flexural strength, indirect tensile strength, and elastic modulus of concrete with a design strength of 280 kg/cm2. Additionally, scanning electron microscopy (SEM) analysis, energy-dispersive X-ray spectroscopy (EDS), Fourier Transform Infrared Spectroscopy (FTIR), thermogravimetric analysis (TGA), and X-ray diffraction (XRD) were conducted to assess microstructural modifications induced by GO. The results indicate that an optimal GO dosage of 0.05% leads to notable improvements, with increases of 14.61% in compressive strength, 12.33% in indirect tensile strength, 6.09% in flexural strength, and 27.38% in elastic modulus. Microstructural analysis revealed a 16.28% reduction in pore and crack size, which directly contributes to improved structural integrity by enhancing matrix densification and reducing potential crack propagation. Furthermore, a 44.49% increase in the Ca/Si ratio was observed, suggesting improved cement hydration and bond formation. The increase in silicon-based compounds and a reduction in portlandite content indicate improved hydration kinetics. These findings provide valuable insights into the reinforcing mechanisms of GO in cementitious materials and lay the groundwork for future applications in high-performance concrete for sustainable construction.

1. Introduction

Concrete is the second most used material in the world after water, due to its high demand in the construction industry [1]. Its global consumption reaches approximately 30 billion metric tons annually, highlighting its fundamental role in the development of infrastructure worldwide [2].
Conventional concrete is widely used in construction due to its versatility and ease of production. However, it is susceptible to crack formation, especially in massive structures, due to thermal stresses generated by cement hydration, which can compromise its structural integrity [3]. These cracks can originate both from internal stresses and external restraints during the hardening process. On the other hand, porosity is a determining factor in the mechanical behavior of concrete, since it influences its physical and structural properties [4]. In pervious concrete, it has been shown that there is a relationship between the propagation velocity of ultrasonic waves and porosity, which allows its non-destructive evaluation and highlights the importance of controlling this parameter in the design and performance of the material [5].
As a fundamental composite material in modern construction, it has been the subject of numerous investigations to improve its mechanical properties and durability; in the search for high-performance materials, nanotechnology has emerged as a promising solution, offering the possibility of modifying concrete at the micro- and nanoscale level to optimize its characteristics [6,7,8]. In this regard, the search for building materials with improved properties has led to the exploration of various nano-additions in concrete [9,10,11]. One of the most promising nanomaterials is graphene oxide (GO), widely studied due to its exceptional electrical, optical, chemical, and mechanical properties, which make it attractive for various scientific and technological applications [12]. GO is a two-dimensional nanoplatelet derived from graphene, distinguished by the presence of various oxygen functional groups in its structure, which facilitates its dispersion in water and thus in the concrete matrix [9,10,13,14,15]. Its high mechanical strength, large surface area, and good thermal conductivity [9], as well as its high electrical conductivity and thermal stability, make it a promising material for the construction industry [16].
Graphene oxide (GO) has proven to be a promising solution to optimize the properties of concrete, improving its densification at the nanometer level, which increases its homogeneity and quality, reflected in better mechanical and durability characteristics [10,17]. In particular, the addition of GO has been found to significantly improve the compressive strength, flexural strength, and durability of concrete [8]. Within carbon-based nanomaterials, GO stands out as an effective alternative to enhance the mechanical performance of cementitious composites, contributing to the increase in their toughness and strength [18]. Furthermore, it has been observed that the incorporation of nanomaterials such as graphene oxide (GO) has shown significant improvements in the microstructure of concrete. The addition of GO contributes to the inhibition of crack propagation and acts as a nucleation agent in the formation of calcium silicate hydrates (CSHs), which favor the densification of the cementitious matrix and improve its mechanical and durability properties [19].
Porosity reduction is another key factor in the performance of GO-modified concrete. It has been observed that the increase in GO concentration decreases the number of pores in the cementitious matrix, promoting a more compact and less permeable material. This effect is due to the acceleration in the nucleation and growth of cement hydration products, which improves the mechanical strength and reduces the permeability of the structure [10,20,21]. These findings show that the addition of GO in cementitious composites not only optimizes the mechanical strength but also improves the microstructure of the material, increasing its durability and performance against external agents. In addition, the maintenance of concrete structures represents a considerable economic challenge, so the incorporation of reinforcing materials, such as GO, is a viable strategy to improve their properties and reduce costs in the long term [22,23].
The incorporation of GO in concrete has shown significant improvements in several of its mechanical properties, such as compressive strength [9,10,24], flexural strength [9,24,25], fracture toughness [26], modulus of elasticity [9,24,27], and durability [24,28]. These improvements are attributed to several mechanisms such as the filling effect of the nanopores by GO, which densifies the microstructure [7,24,26]; the acceleration of cement hydration, which increases the formation of hydrated products such as calcium silicate hydrate (C-S-H) [7,9,24,27,29,30,31]; and the ability of GO to act as a bridge that inhibits the propagation of microcracks [7,9,26].
Although GO exhibits excellent properties, its high surface energy makes it prone to particle agglomeration during both preparation and application. Additionally, the oxygen-containing functional groups in GO readily cross-link with Ca2+ ions in the cement matrix, leading to granulation and aggregation, which significantly limits its effectiveness [32]. To solve this problem, a variety of methods have been proposed to improve GO dispersion, including ultrasonic dispersion [33,34] and adding surfactants [25,35,36,37,38,39,40].
Previous studies have confirmed that the cracking of mesoscale concrete is controlled by its micromechanical properties, which are directly dependent on the chemical composition and microstructure of the material [26]. In this context, graphene oxide (GO) has captured the attention of the scientific community due to its exceptional properties, including its high mechanical strength, large specific surface area, and ability to enhance cement hydration [24,41,42,43,44,45,46,47,48,49].
This study investigates the influence of graphene oxide (GO) on the mechanical and microstructural properties of concrete with a compressive strength of f’c = 280 kg/cm2. Unlike previous studies that primarily focus on mechanical improvements, this research integrates advanced analytical techniques, including scanning electron microscopy (SEM) and energy-dispersive X-ray spectroscopy (EDS), X-ray diffraction (XRD), Fourier Transform Infrared Spectroscopy (FTIR), and thermogravimetric analysis (TGA), to establish a direct correlation between mechanical performance and microstructural modifications induced by GO. Additionally, it determines the optimal GO dosage to enhance mechanical properties while maintaining workability, a crucial factor for practical implementation. These findings provide new insights into the role of GO in cementitious materials, contributing to the development of durable and sustainable high-performance concrete.

2. Materials and Methods

The present study is framed within quantitative research, according to its approach, and applied, according to its purpose. The research level is explanatory since it seeks to analyze and describe the influence of the incorporation of graphene oxide on the mechanical properties and microstructural characteristics of concrete with f’c = 280 kg/cm2.
The methodology used is based on the Direct Observation Technique, allowing the recording and detailed analysis of the behavior and characteristics of the samples. For data collection, an Observation Guide was used, designed with specific criteria that ensure objectivity and accuracy in the collection of relevant information for the study.
The study population consists of 155 samples, including cylindrical specimens and prismatic beams, made with concrete compressive strength of f’c = 280 kg/cm2 and with the addition of graphene oxide (GO) in different proportions with respect to the weight of cement. The aggregates used come from quarries located in the department of Ica, Peru. The samples are distributed in five groups according to the percentage of GO addition: 0.00% (reference concrete), 0.05%, 0.10%, 0.15%, and 0.20%. The curing process was carried out at 7, 14, and 28 days in order to evaluate the evolution of the material properties. Furthermore, 
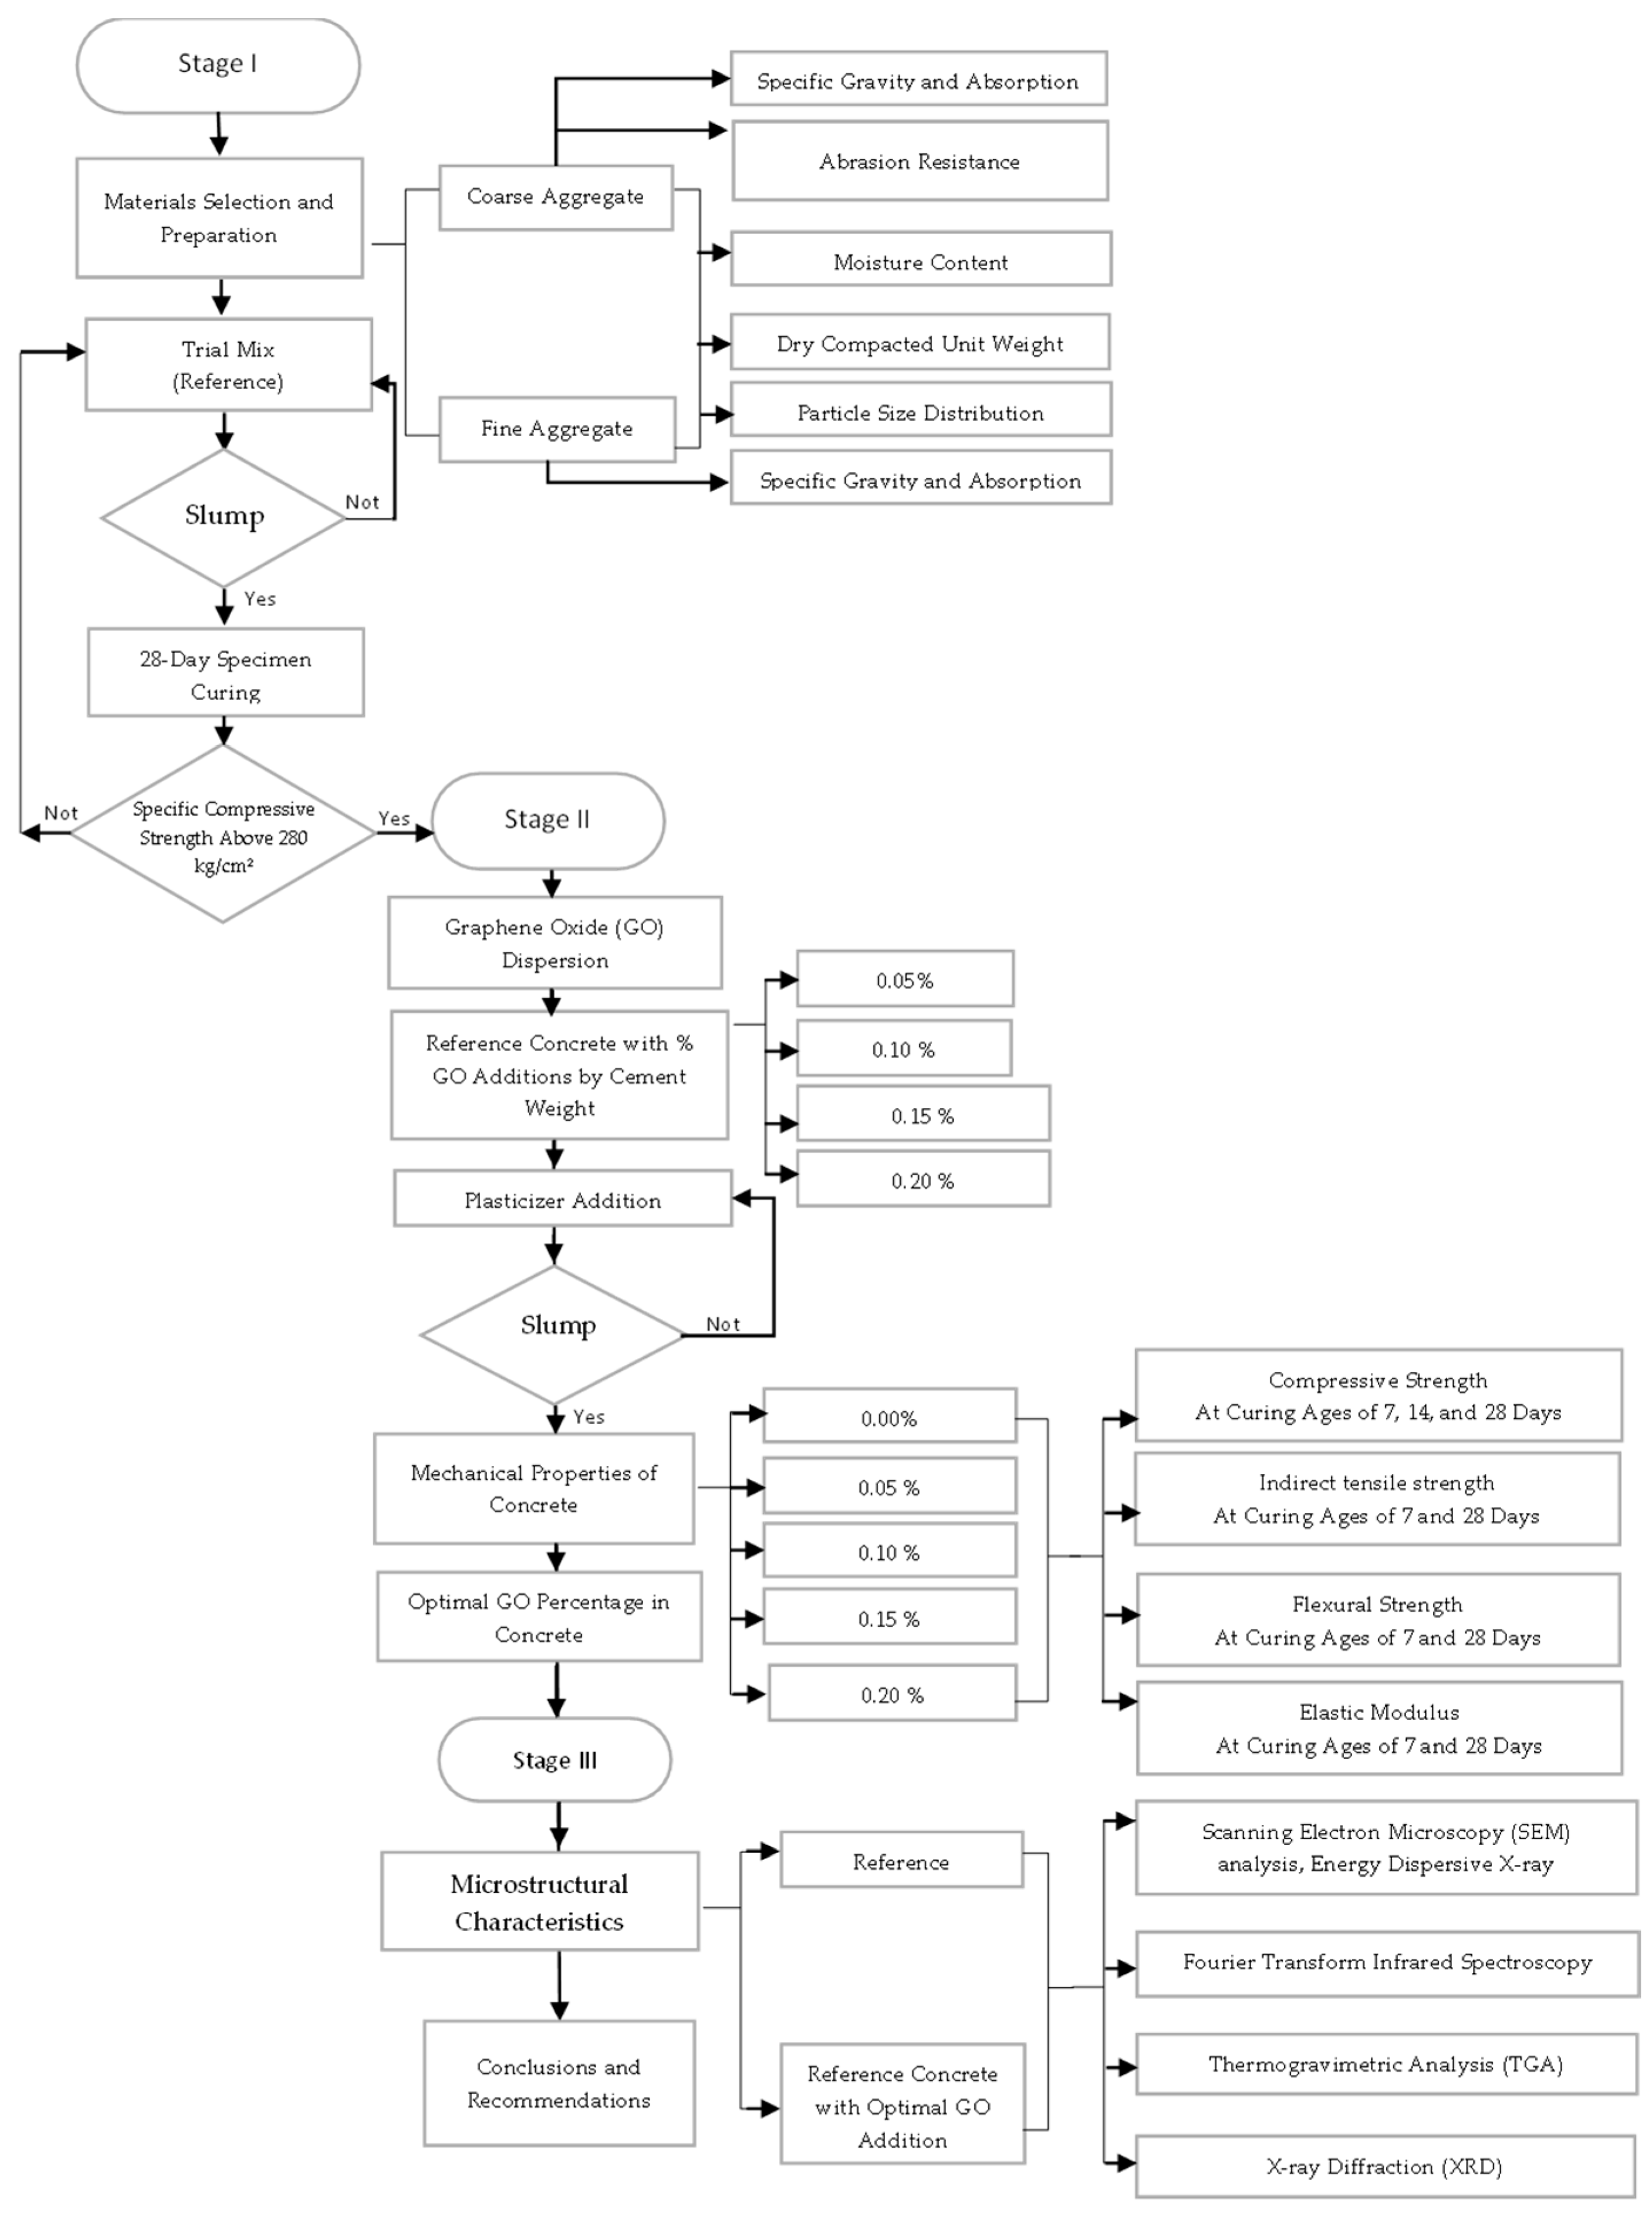
Figure 1 presents the schematic diagram of the experimental study, illustrating the key stages of the research methodology. It outlines the preparation of materials, including GO dispersion, the mixing and curing of concrete specimens, and the mechanical and microstructural characterization techniques employed. This diagram provides a clear overview of the experimental approach, ensuring clarity and reproducibility.

2.1. Characterization of Graphene Oxide: Diameter Size, Thickness, and Chemical Composition

The graphene oxide used in this research was purchased from Jiangsu Xfnano Materials Tech Co., Ltd., Nanjing, China, a well-known Chinese supplier of nanomaterials. According to the product data sheet, GO presents specific physical and chemical properties, which will be complemented with thermogravimetric analysis (TGA) for its detailed characterization. Table 1 compares the properties of the GO used in this study with those reported in previous research, allowing us to contextualize its characteristics according to existing studies.
After receipt of the material, the four percentages of graphene oxide (GO) selected for the research were subjected to a prior dispersion process, with the aim of ensuring a homogeneous distribution within the cementitious matrix and optimizing its interaction with the concrete components.

2.2. Graphene Oxide Dispersion Process

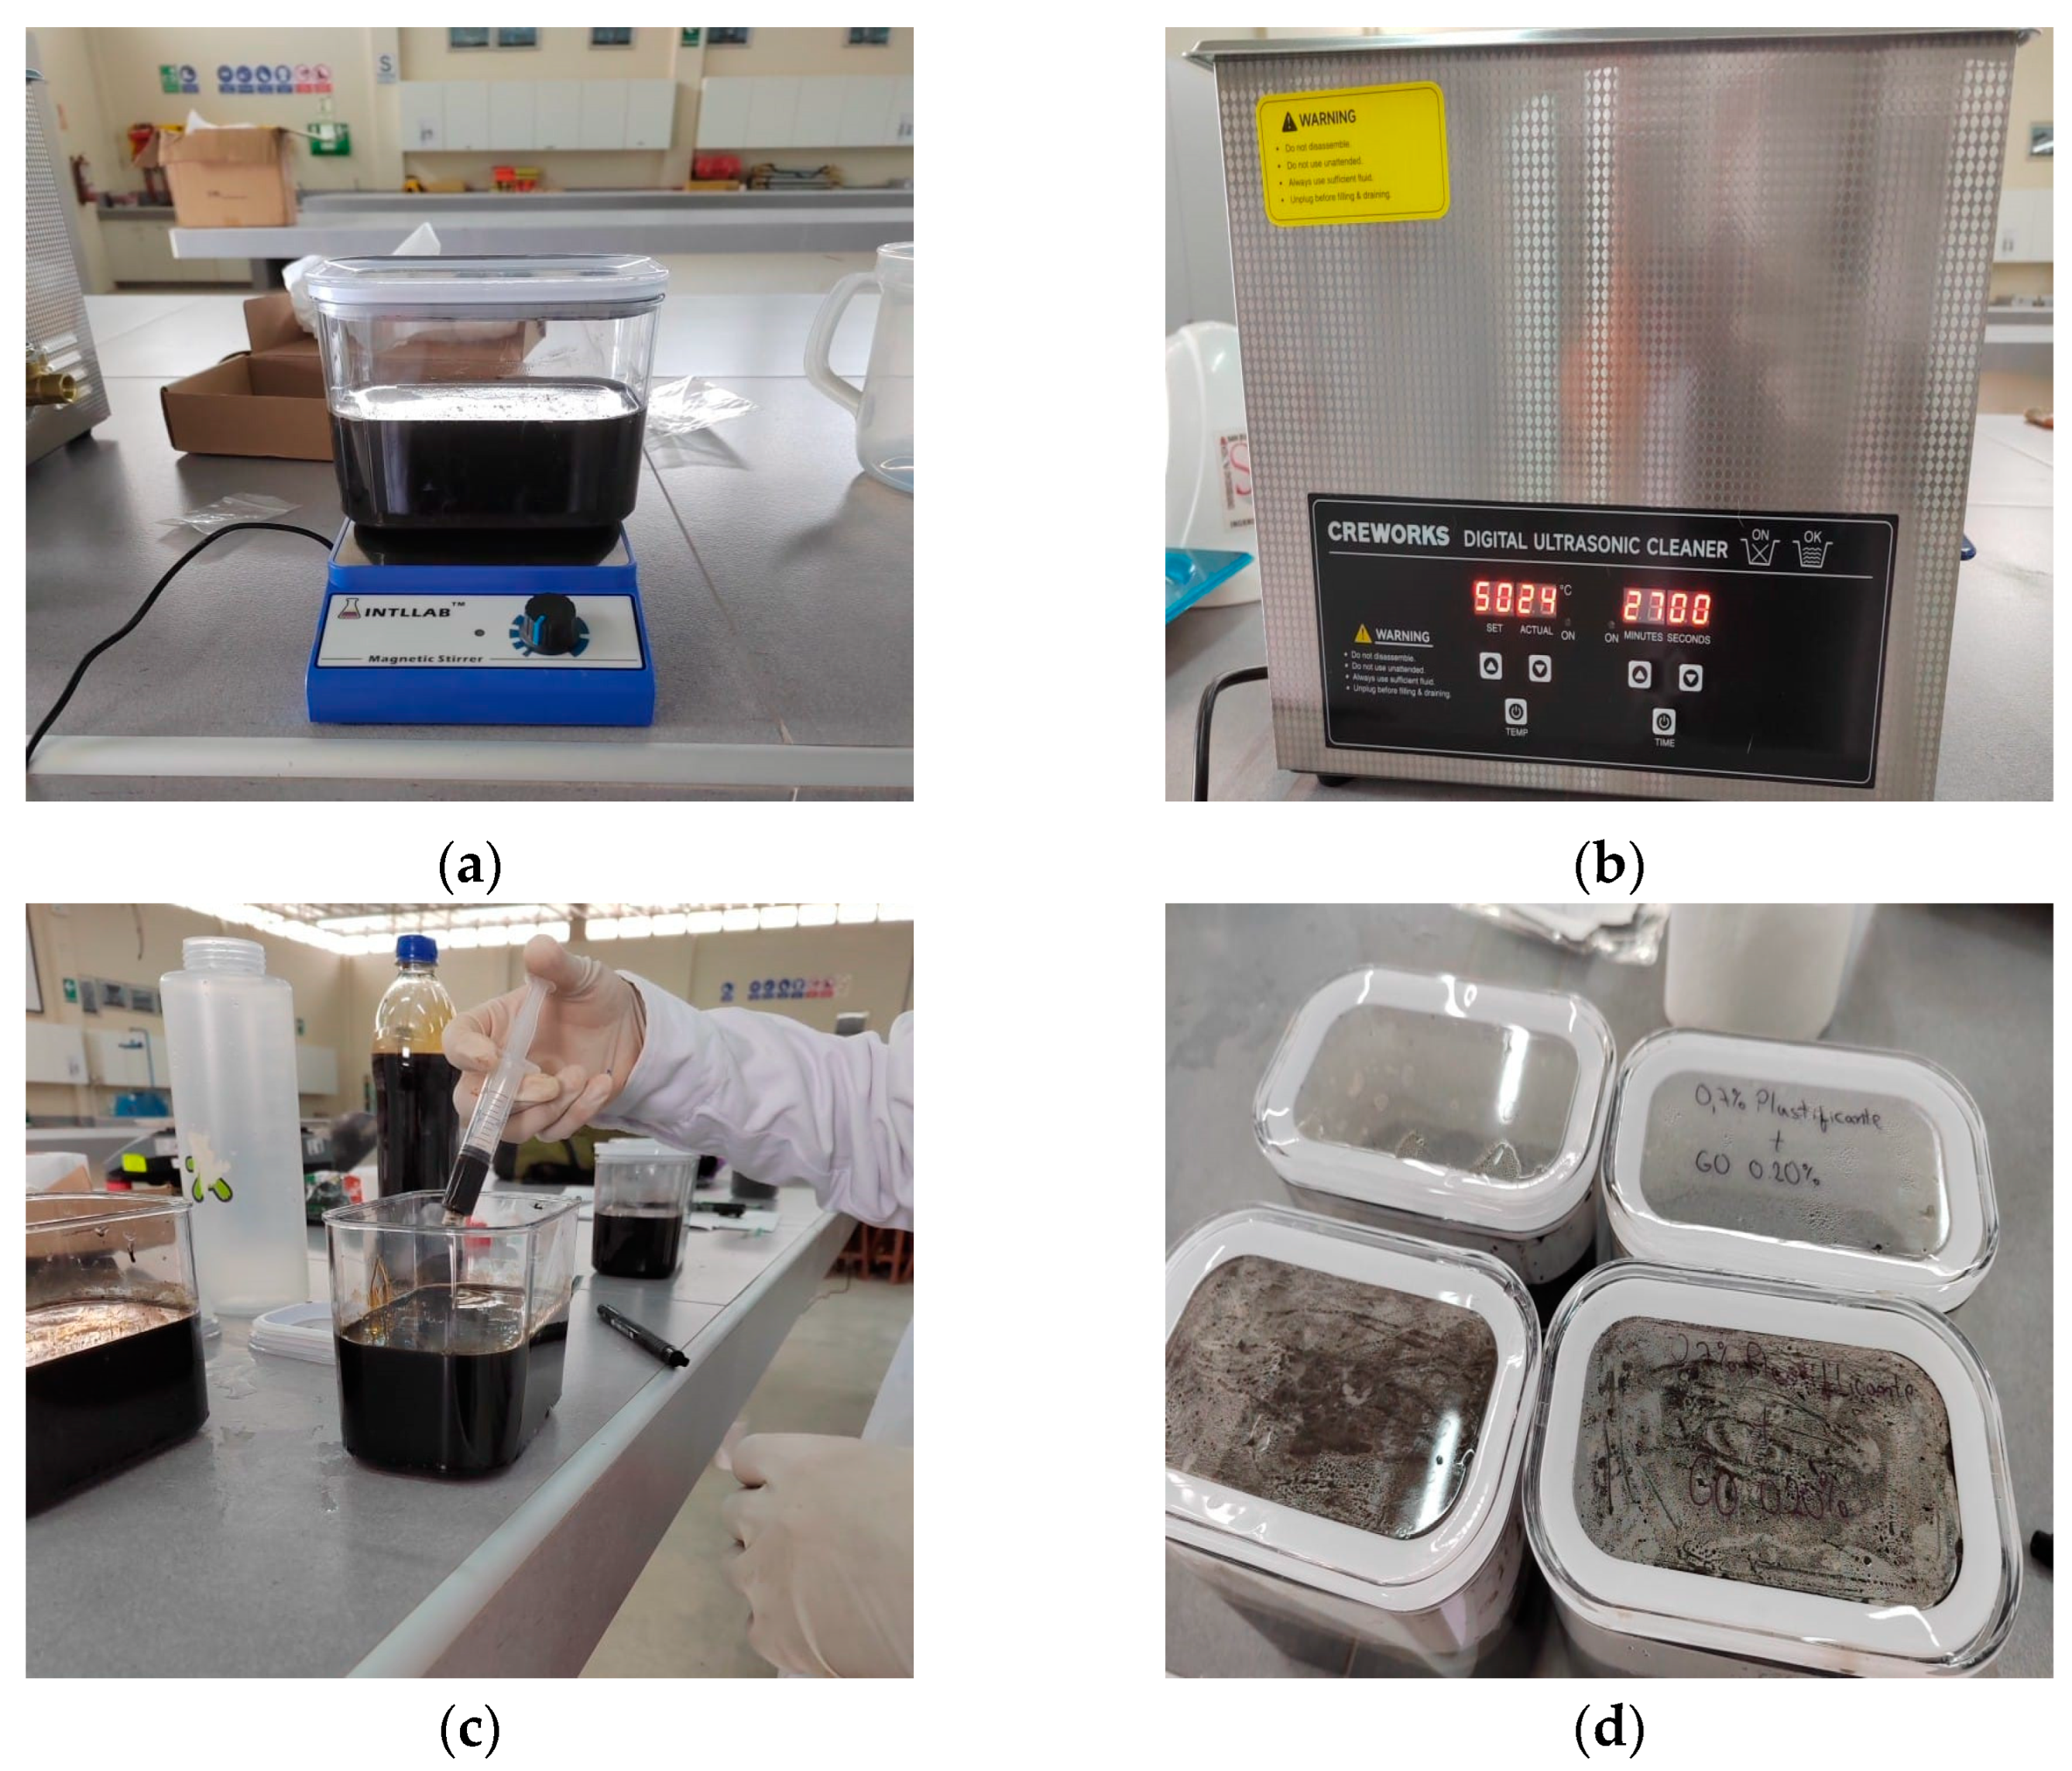
The graphene oxide acquired is composed of sheets or layers, so its adequate dispersion is essential for its incorporation into the concrete matrix. For this purpose, it was initially subjected to a magnetic stirring process, with the purpose of obtaining a homogeneous aqueous solution, thus ensuring a uniform distribution before its addition to the cementitious mixture in a mixer [21]. The correct dispersion of GO depends on key factors such as the amount added, the degree of oxidation, the particle size, and the method of dispersion [50], which directly influences the distribution of nanoparticles within the concrete. Since GO contains functional groups that can affect the interaction between its layers, its dispersion was performed in water and optimized by applying ultrasound waves, reducing the Van Der Waals force and improving its integration into the mixture [6]. In this context, Table 2 presents the bulk density of the GO used in this research in comparison with previous studies, while Table 3 details the degree of purity of the GO acquired and its relation to other similar investigations.
Likewise, after the dispersion of the GO to keep the nanoparticles separated, a surfactant must be added, which, in the case of concrete, are plasticizers and superplasticizers, because several studies showed that the GO decreases the workability of concrete, as shown in Table 4; in this vein, other studies determined suitable percentages of plasticizer for concrete with GO, as shown in Table 5, so that through various field tests, the percentages of the addition of plasticizer Sika-Cem by % GO were determined.
The incorporation of a plasticizer in the graphene oxide (GO) dispersion process serves two complementary mechanisms that are fundamental to the successful modification of concrete. First, the plasticizer acts as a surfactant, preventing the re-agglomeration of GO nanosheets after ultrasonic dispersion by maintaining particle separation through steric and electrostatic repulsion mechanisms. Second, it counteracts the adverse effect of GO on the workability of fresh concrete. As demonstrated in the preliminary tests (Table 6), concrete with 0.20% GO without a plasticizer exhibited a slump of only 1 cm, whereas, with the addition of 1.10% plasticizer, the slump increased to 7.8 cm, restoring the necessary workability for proper placement and compaction. This phenomenon is explained by the hydrophilic nature of GO, whose numerous oxygen functional groups (hydroxyl, carboxyl, carbonyl, and epoxy) exhibit a high affinity for water molecules, significantly reducing the free water available for mixture lubrication [29]. By lowering the surface tension of water and improving cement dispersion, the plasticizer mitigates this negative effect, enabling the benefits of GO on mechanical properties to be fully harnessed without compromising workability.
The following procedure describes the process of GO dispersion in water, following the guidelines recommended by Jiangsu Xfnano Materials Tech Co., Ltd., as well as references from several studies.
-
Preparation of the materials:
Initially, the GO was weighed according to the weight of the cement, and the volume of water corresponding to the mix design was measured, leaving a margin for the prior wetting of the materials in the mixer before the incorporation of the aqueous solution of GO. In this study, we worked with a concentration of 5 mg/mL, recommended by the manufacturer. Table 7 shows the concentrations of GO in water used in different investigations.
-
Initial mixture:
GO and water were combined in a container and subjected to agitation in a magnetic stirrer at 2500 rpm for 2.5 min, reaching a total of 6250 revolutions. This procedure aligned with previous studies, as shown in Table 8, and seeks to ensure a homogeneous predispersion of the solution, as shown in Figure 2a.
-
Ultrasonication:
Subsequently, the aqueous GO solution was subjected to an ultrasonication process with a power of 240 W, as seen in Figure 2b. The power recommended by the manufacturer is 700 W, while the literature reports sonication times of approximately 30 min, as shown in Table 9. However, considering the findings of [25], we chose to apply only 30% of the maximum power to avoid damage to the GO nanoparticles.
The total power required was calculated as follows:
30 % × 700   W × 30 60   s = 378000   J
Based on the power of the equipment purchased (240 W), the sonication time was determined:
378000   J t = 240   W
t = 1575   s
t = 1575   s 60   s
t = 26.5   m i n
Since the ultrasound equipment only allows adjustments in whole minutes, the time was rounded to 27 min.
-
Addition of plasticizer:
Finally, once the dispersion of graphene oxide in water was completed, the Sika-Cem plasticizer was incorporated, as shown in Figure 2c, in order to avoid the agglomeration of the GO nanoparticles and improve the workability of the concrete. According to [25], the addition of the plasticizer at the end of the dispersion process, i.e., after 30 min, favors better stability of the aqueous GO solution compared to its incorporation in intermediate stages (15 min) or at the beginning of the process.
This procedure guarantees an efficient dispersion of GO in the mixture, optimizing its incorporation into the concrete and maximizing its effect on the mechanical and rheological properties of the material.

2.3. Aggregates, Cement, and Additions

Experimental laboratory tests were carried out to characterize the behavior of the reference concrete with a compressive strength of f’c = 280 kg/cm2. Additionally, tests were carried out with the addition of (GO) in proportions of 0.05%, 0.10%, 0.15%, and 0.20% with respect to the weight of cement. The selection of GO concentrations (0.00%, 0.05%, 0.10%, 0.15%, and 0.20%) is based on a comprehensive review of previous studies that have reported improvements in compressive strength within this range, with optimal values generally found between 0.05% and 0.15%, depending on the cementitious matrix used, as evidenced in Table 10. The inclusion of 0.00% serves as a reference without GO, while the incorporation of progressive concentrations allows for the evaluation of trends in mechanical property development and the identification of potential optimum content. Furthermore, this selection enhances comparability with previous research, strengthening the analysis and discussion of the results within a broader scientific context.
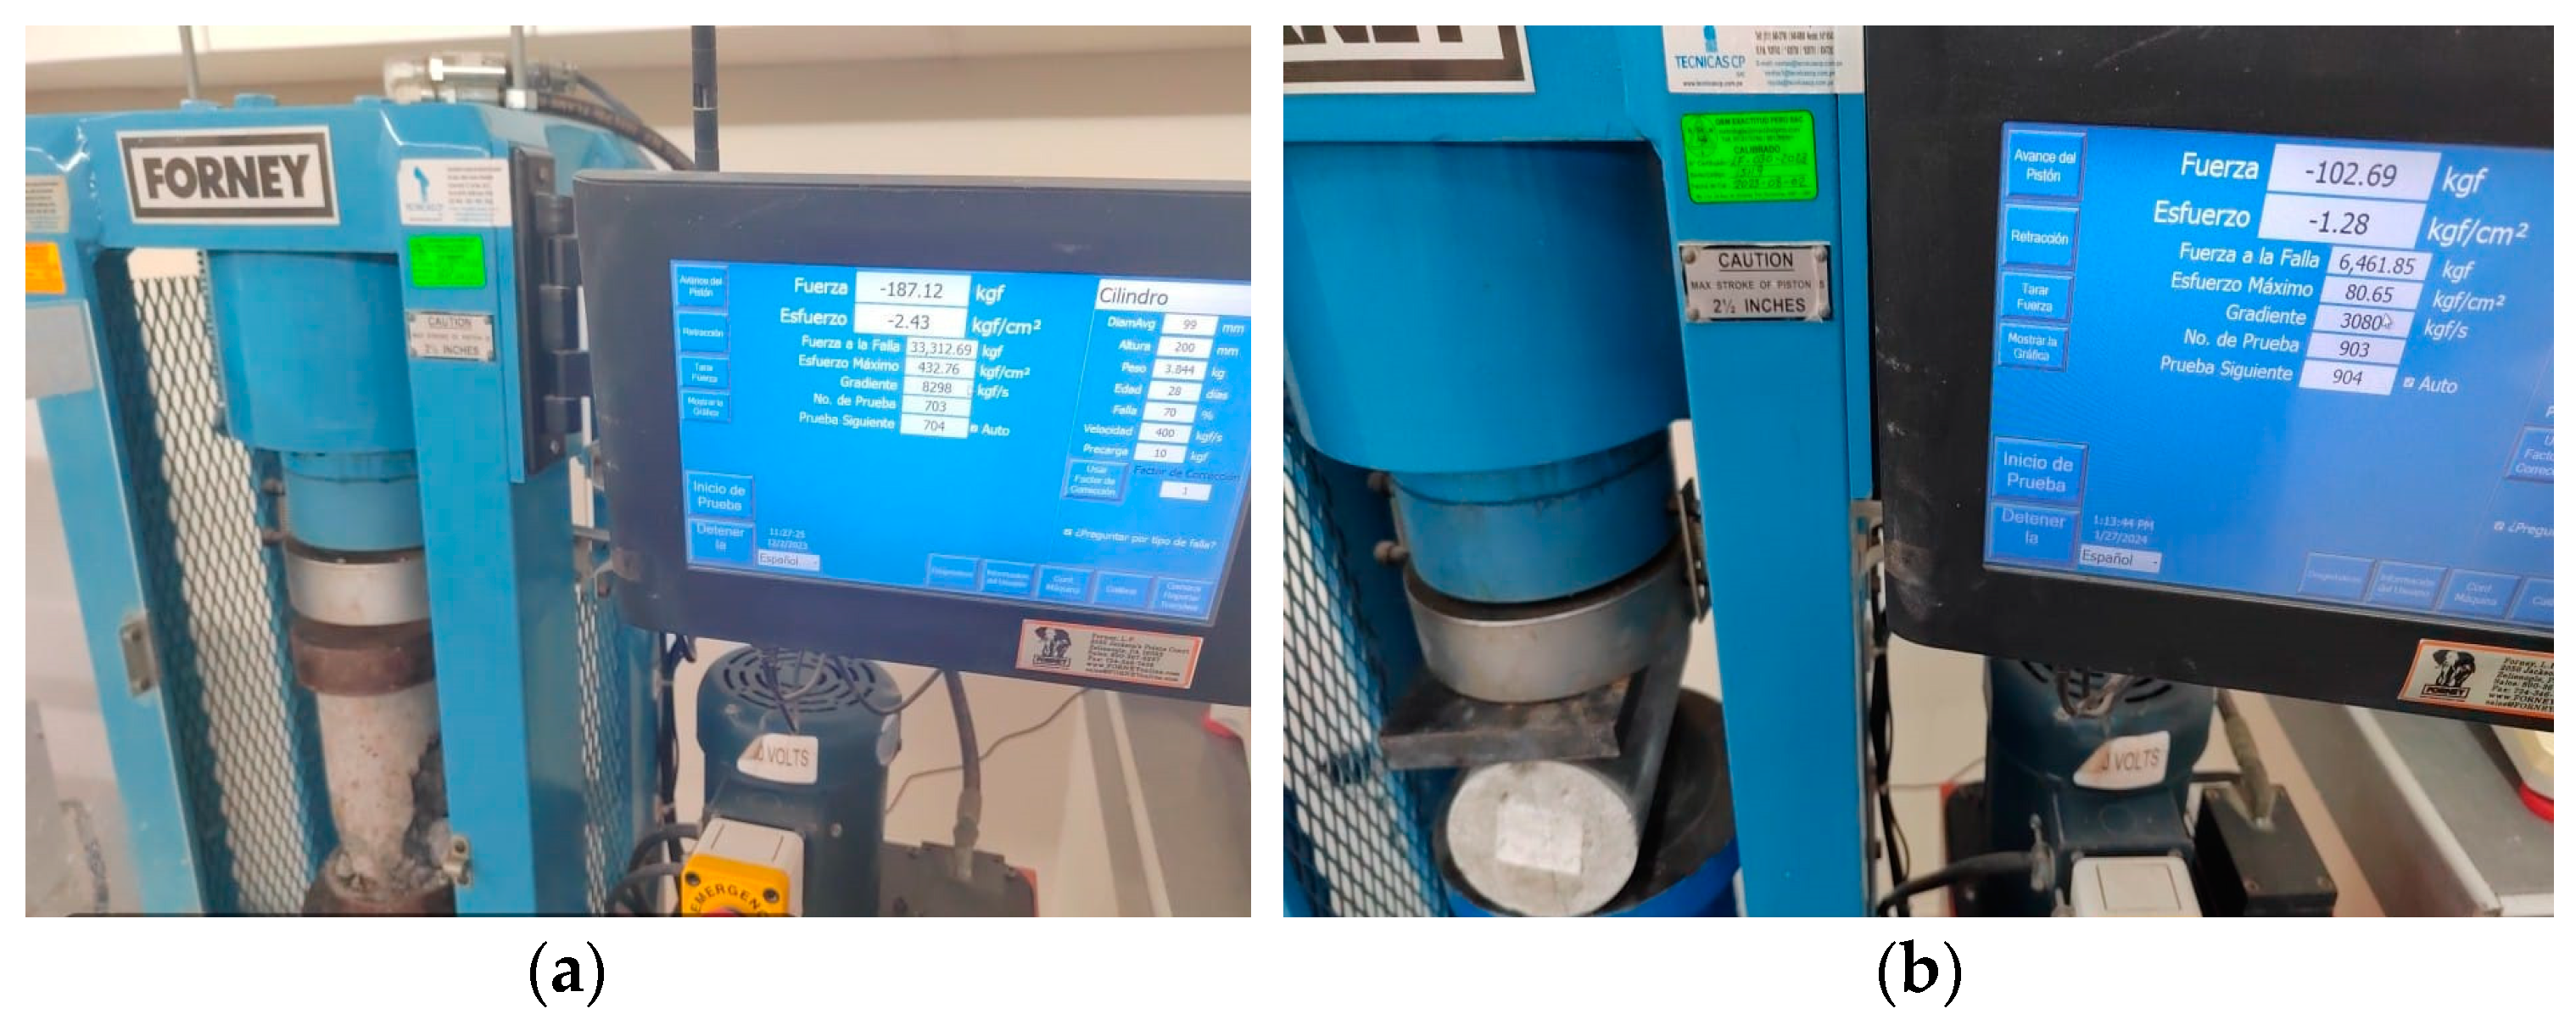
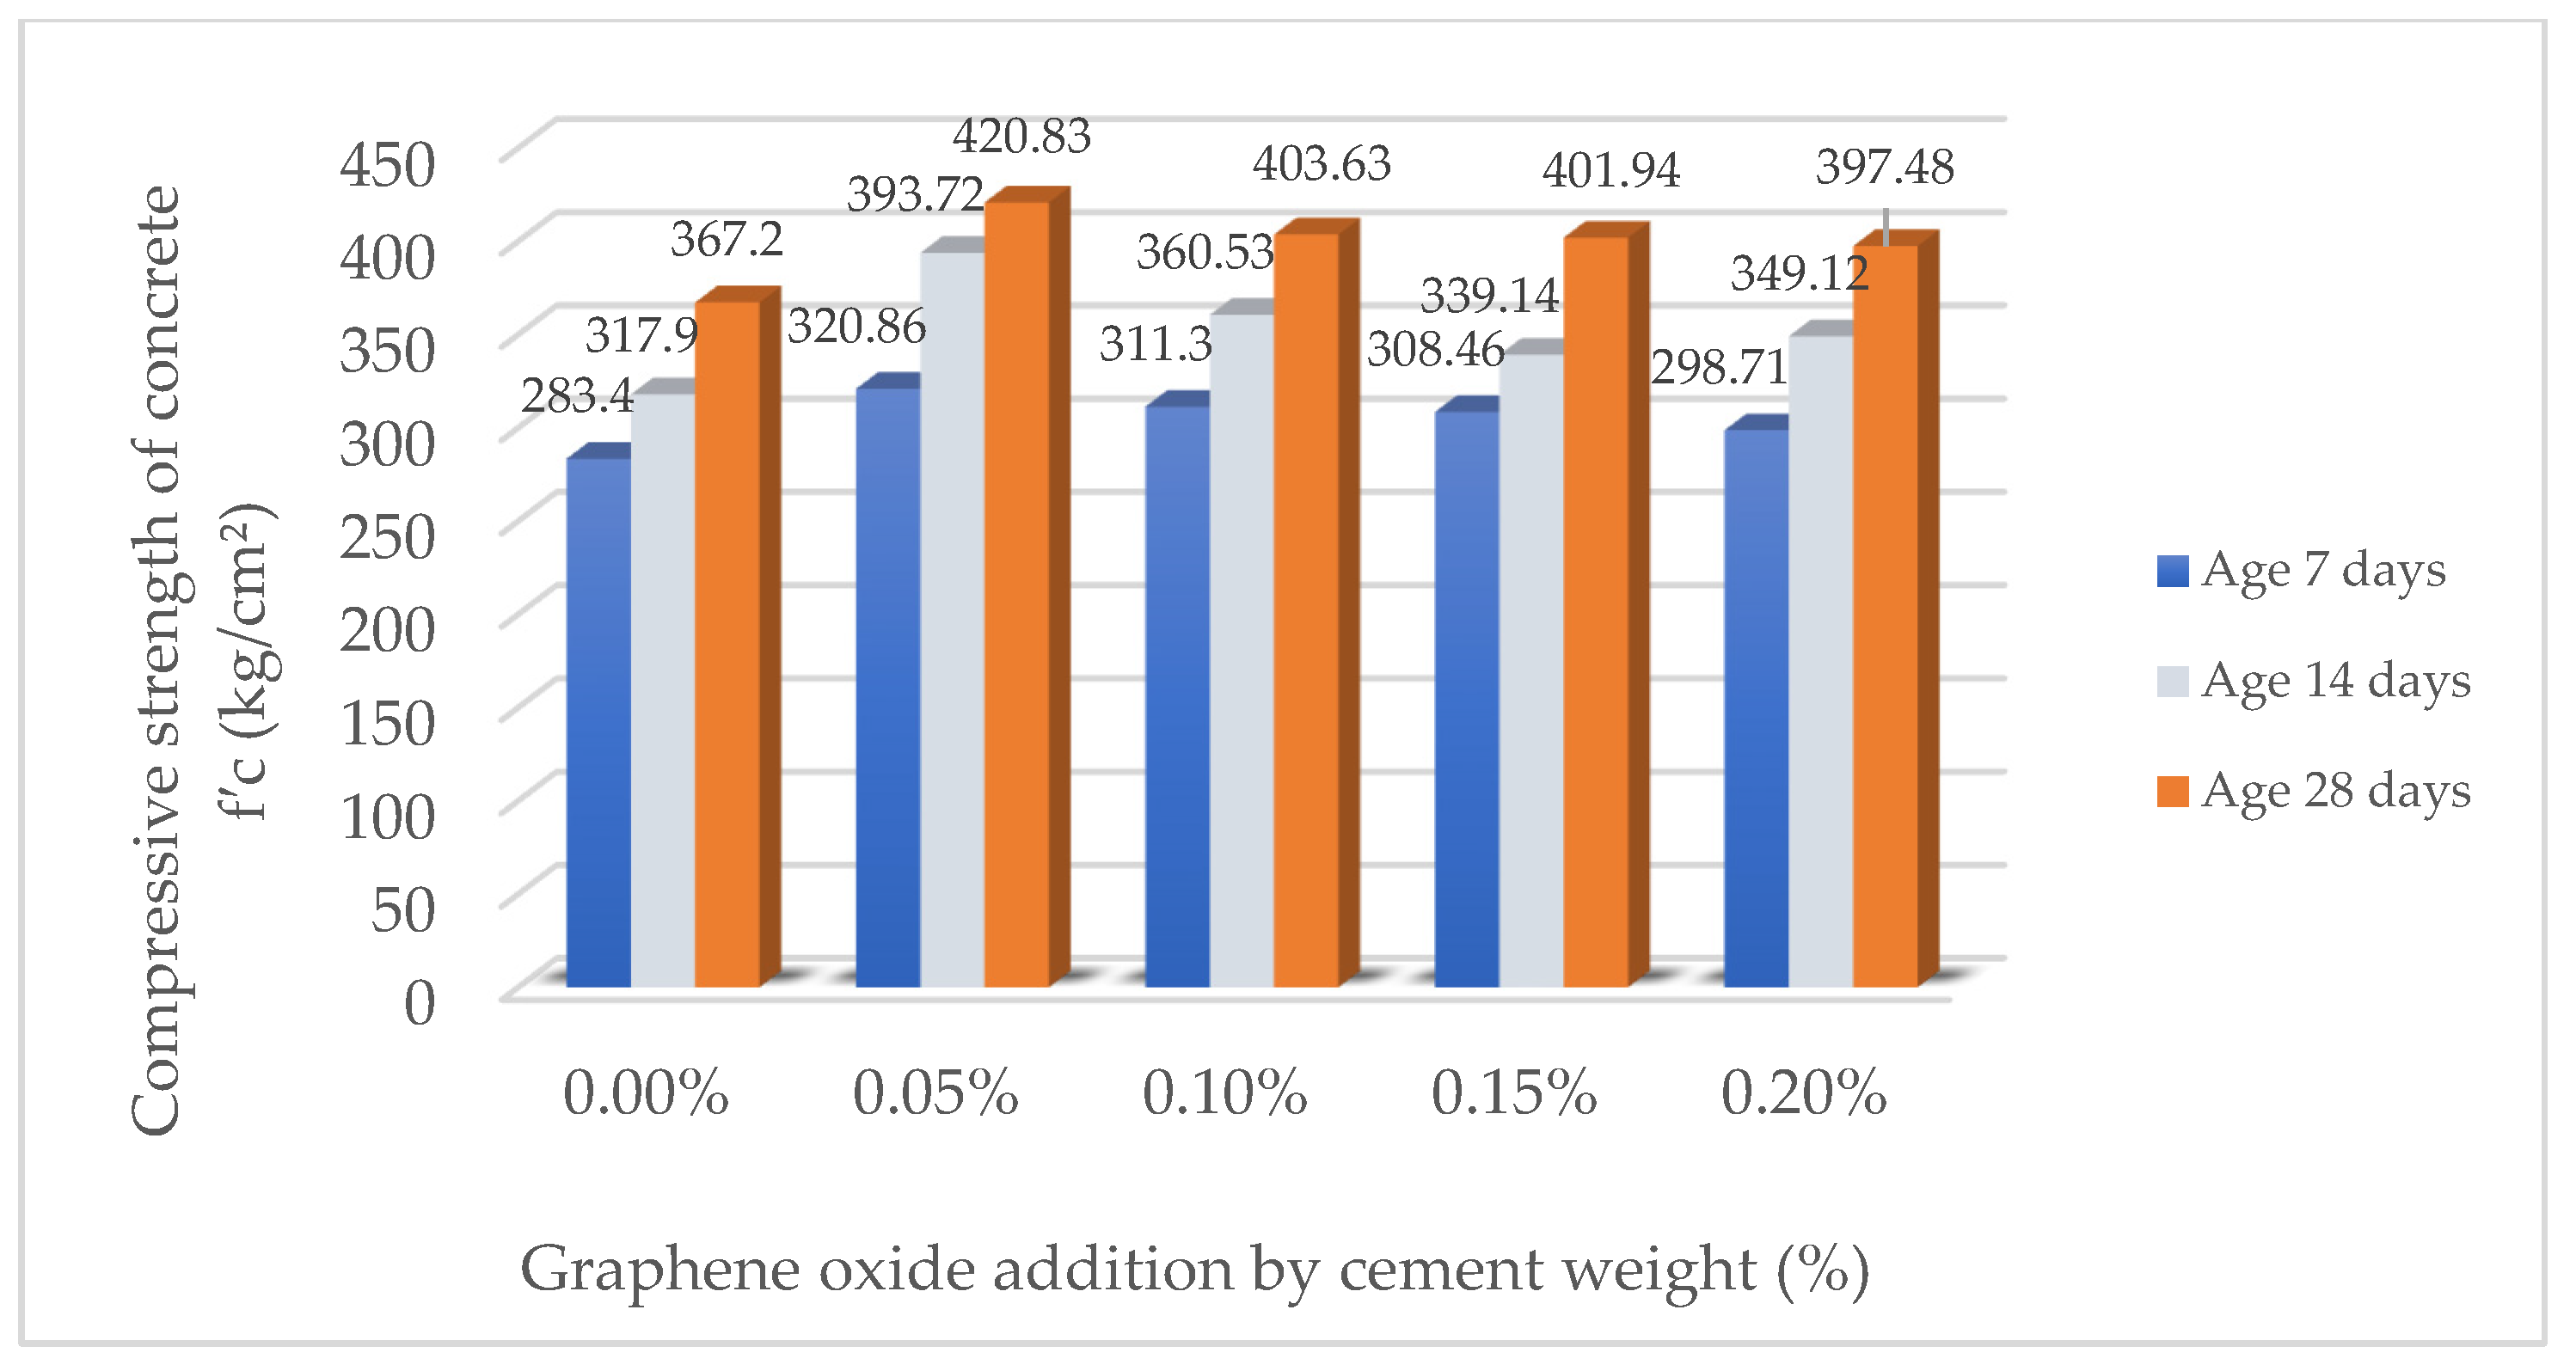
Mechanical tests were carried out in the laboratory in accordance with the corresponding ASTM standards, using standardized specimens distributed at different curing ages to evaluate the performance of concrete with graphene oxide (GO) addition. The compressive strength (Figure 3a) was determined in 50 cylindrical specimens of 10 cm × 20 cm, organized in a series of 3 specimens tested at 7 days, 3 at 14 days, and 4 at 28 days for each percentage of GO, following ASTM C39/C39M-18 [66]. The indirect tensile strength by diametral (Figure 3b) compression was evaluated in 35 cylindrical specimens of 10 cm × 20 cm, distributed in a series of 3 specimens tested at 7 days and 4 at 28 days for each GO dosage, according to ASTM C496/C496M-17 [67]. For flexural strength (Figure 3c), 35 prismatic beams of 15 cm × 15 cm × 51 cm were used, divided into 3 specimens tested at 7 days and 4 at 28 days for each percentage of GO, in accordance with ASTM C293/C293M-16 [68]. Finally, the evaluation of the modulus of elasticity (Figure 3d) was carried out on 35 cylindrical specimens of 10 cm × 30 cm, with a series of 3 specimens tested at 7 days and 4 at 28 days for each GO proportion, following ASTM C469/C469M [69].
Aggregates were obtained from the Palomino-Parcona quarry, located in the department of Ica (Table 11). The cement used was Sol Type I. Table 12 presents the specific amounts of GO, aggregates, cement, water, and additions used in the study.
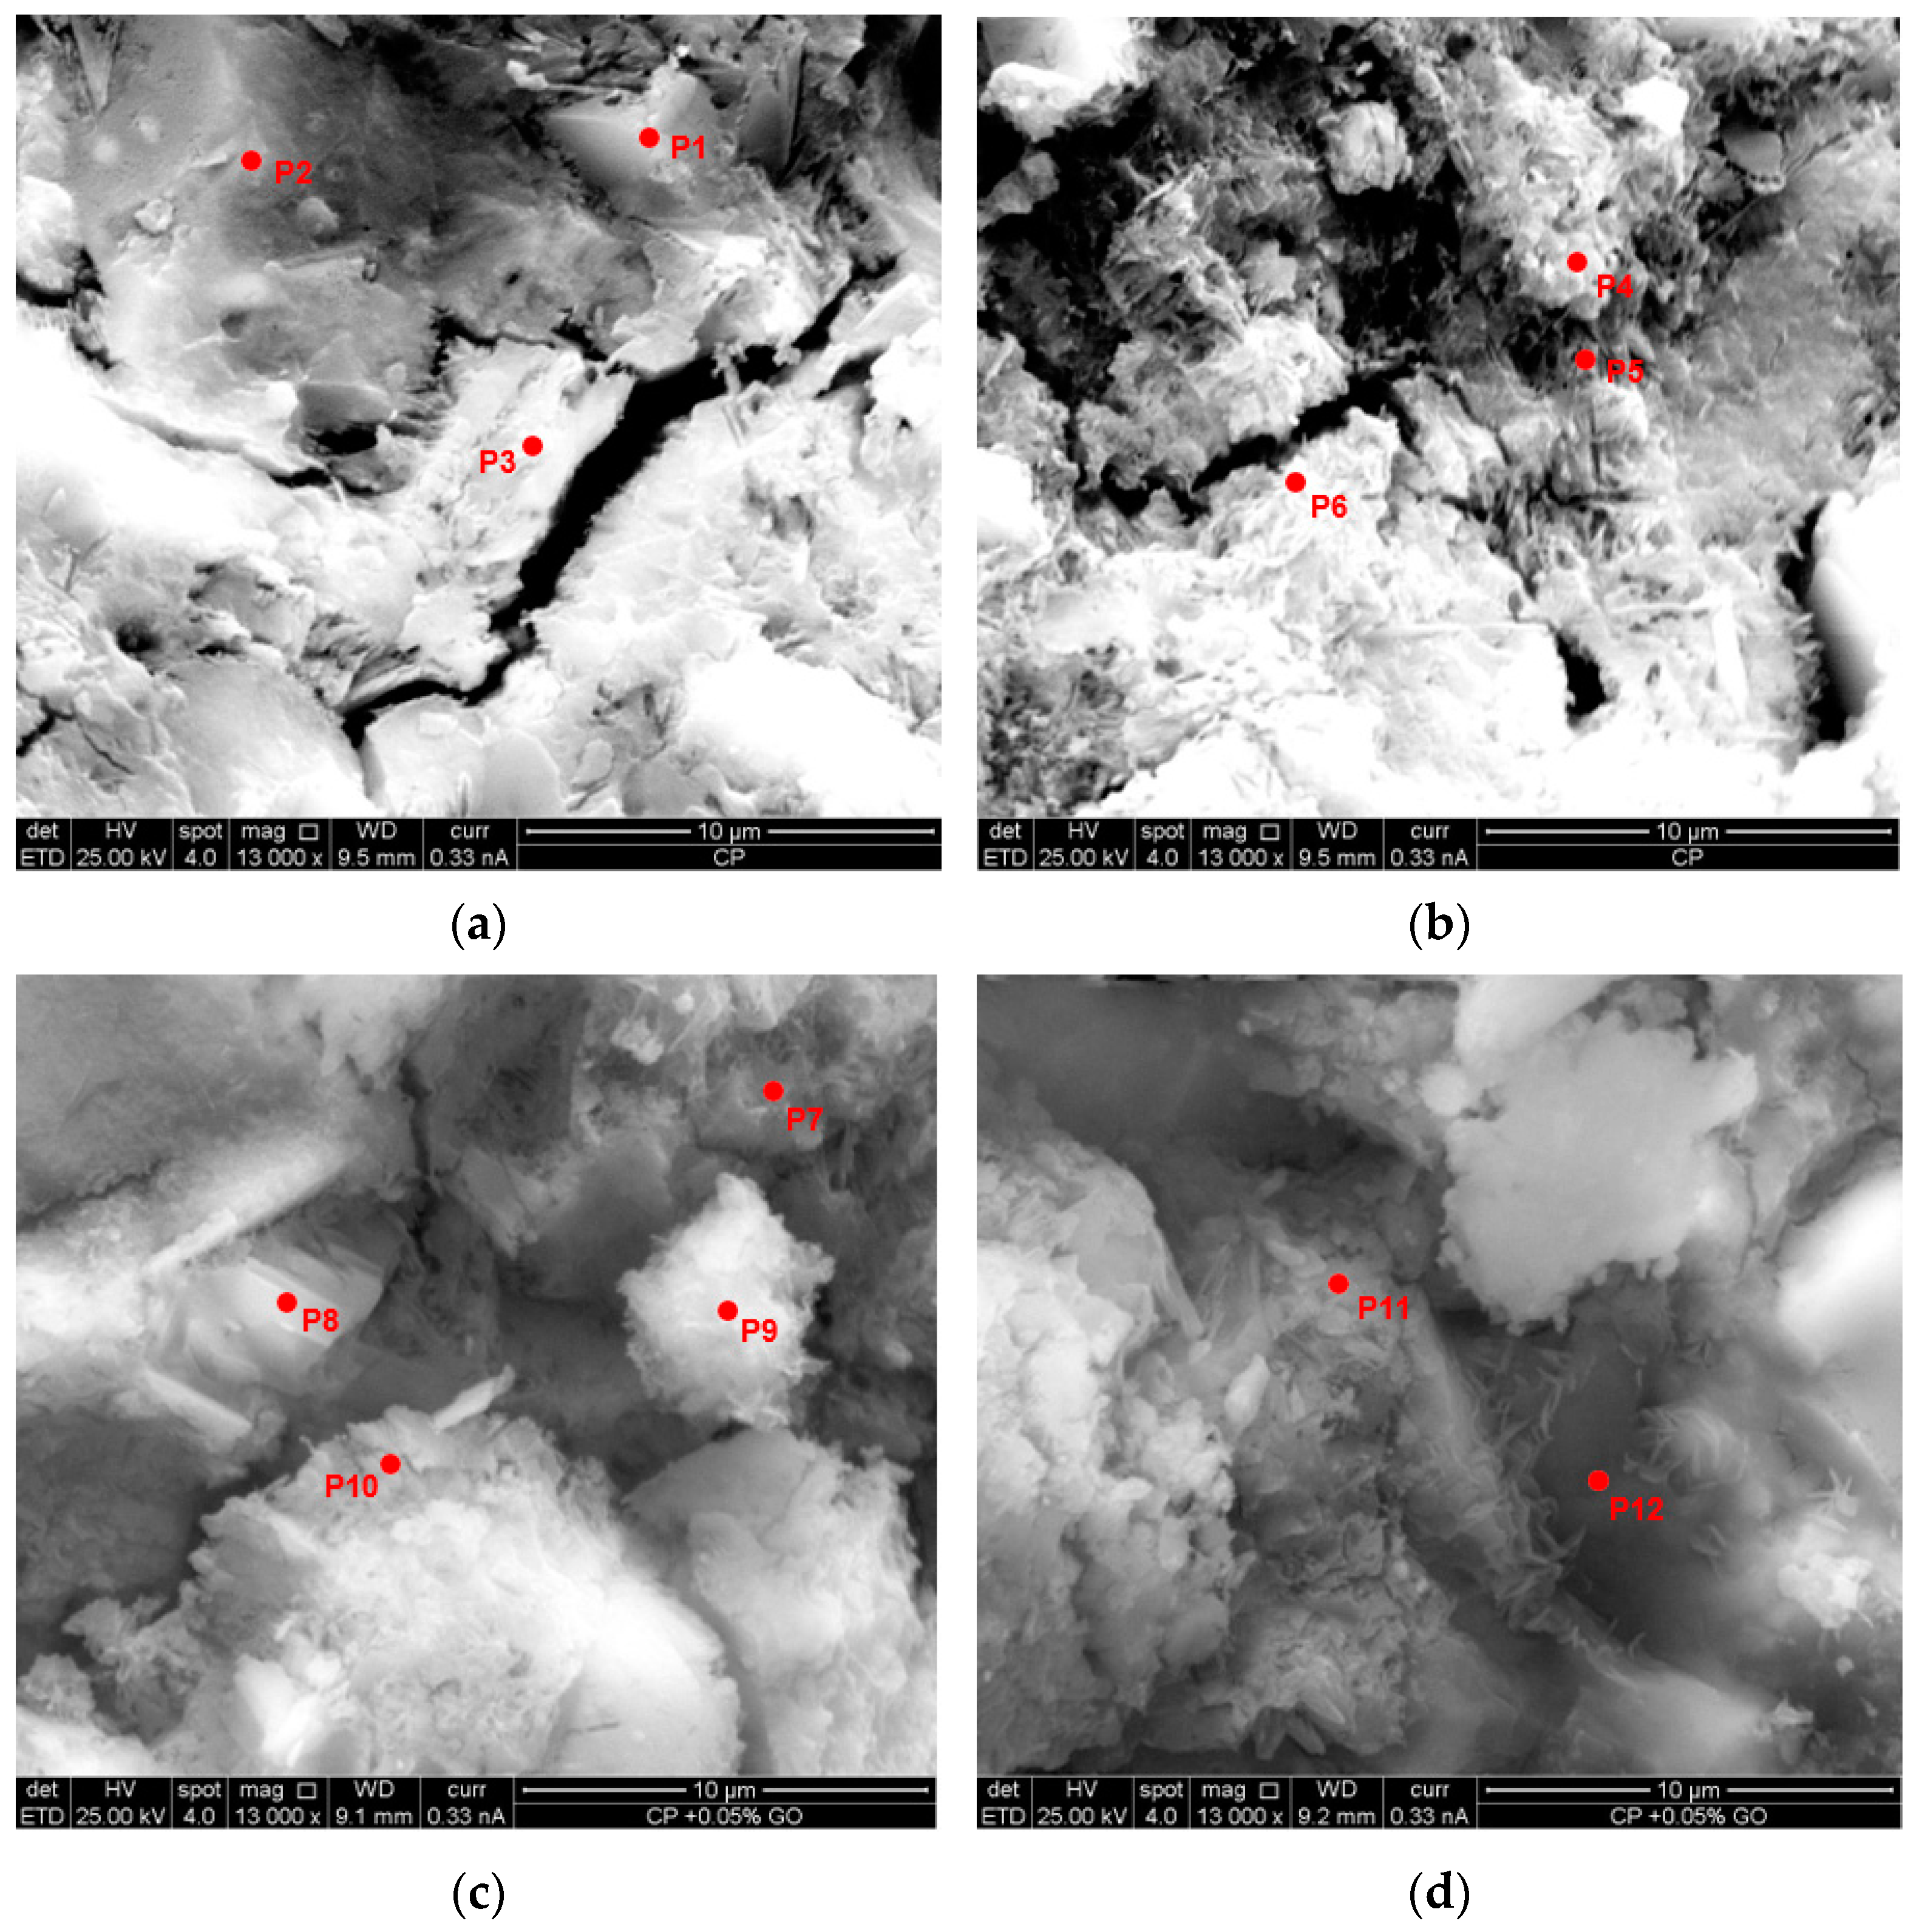
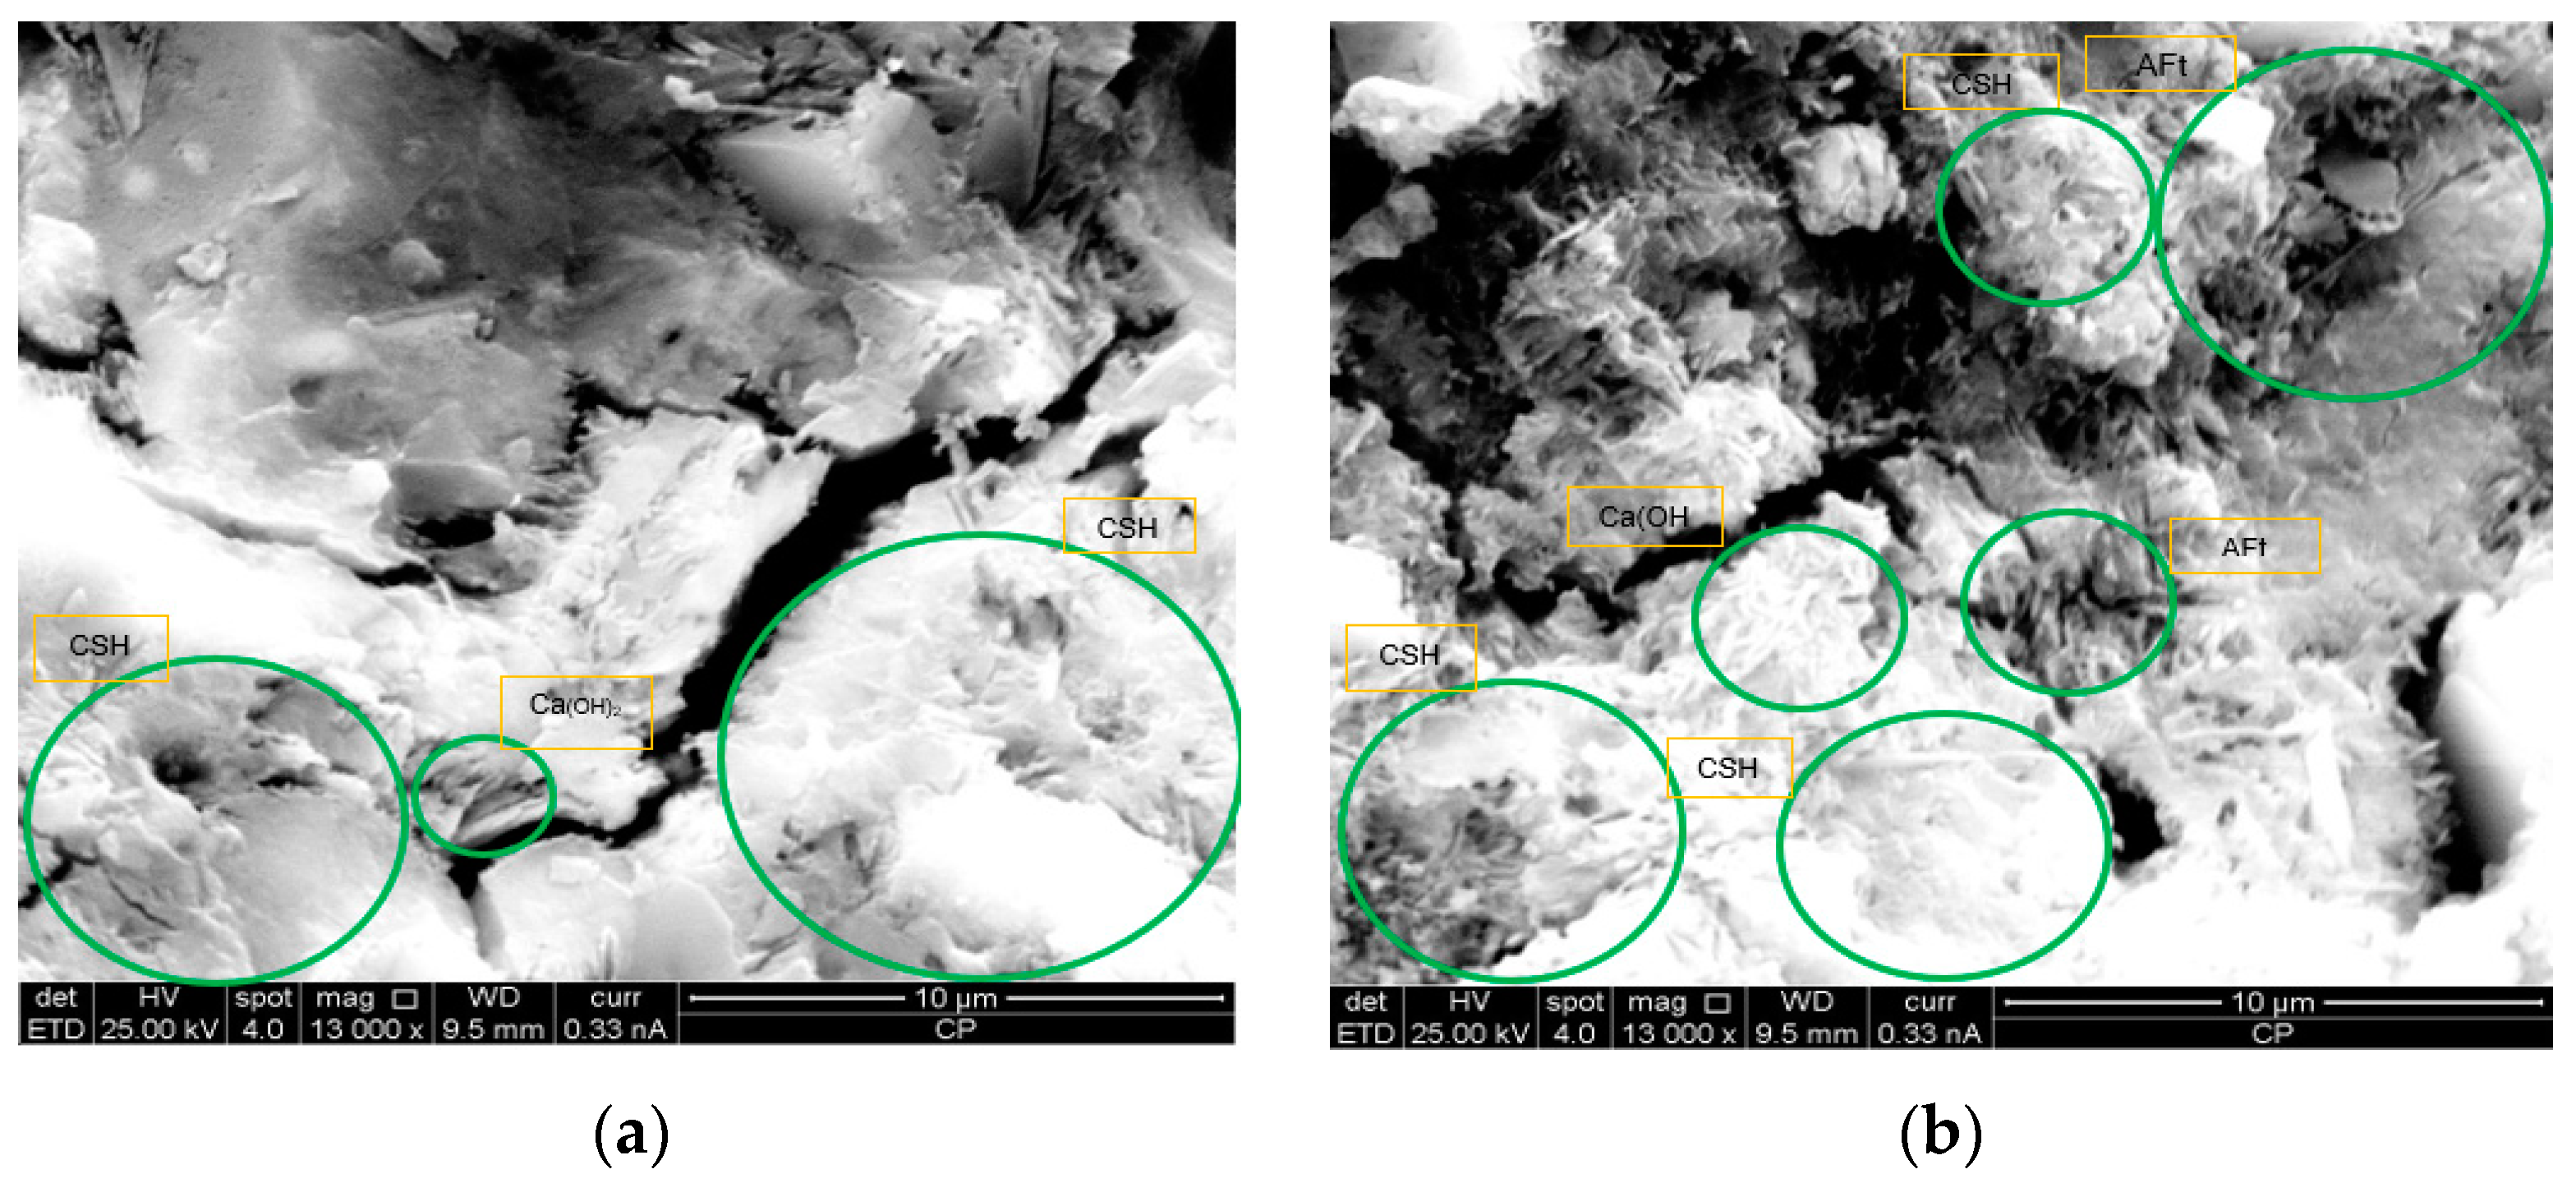
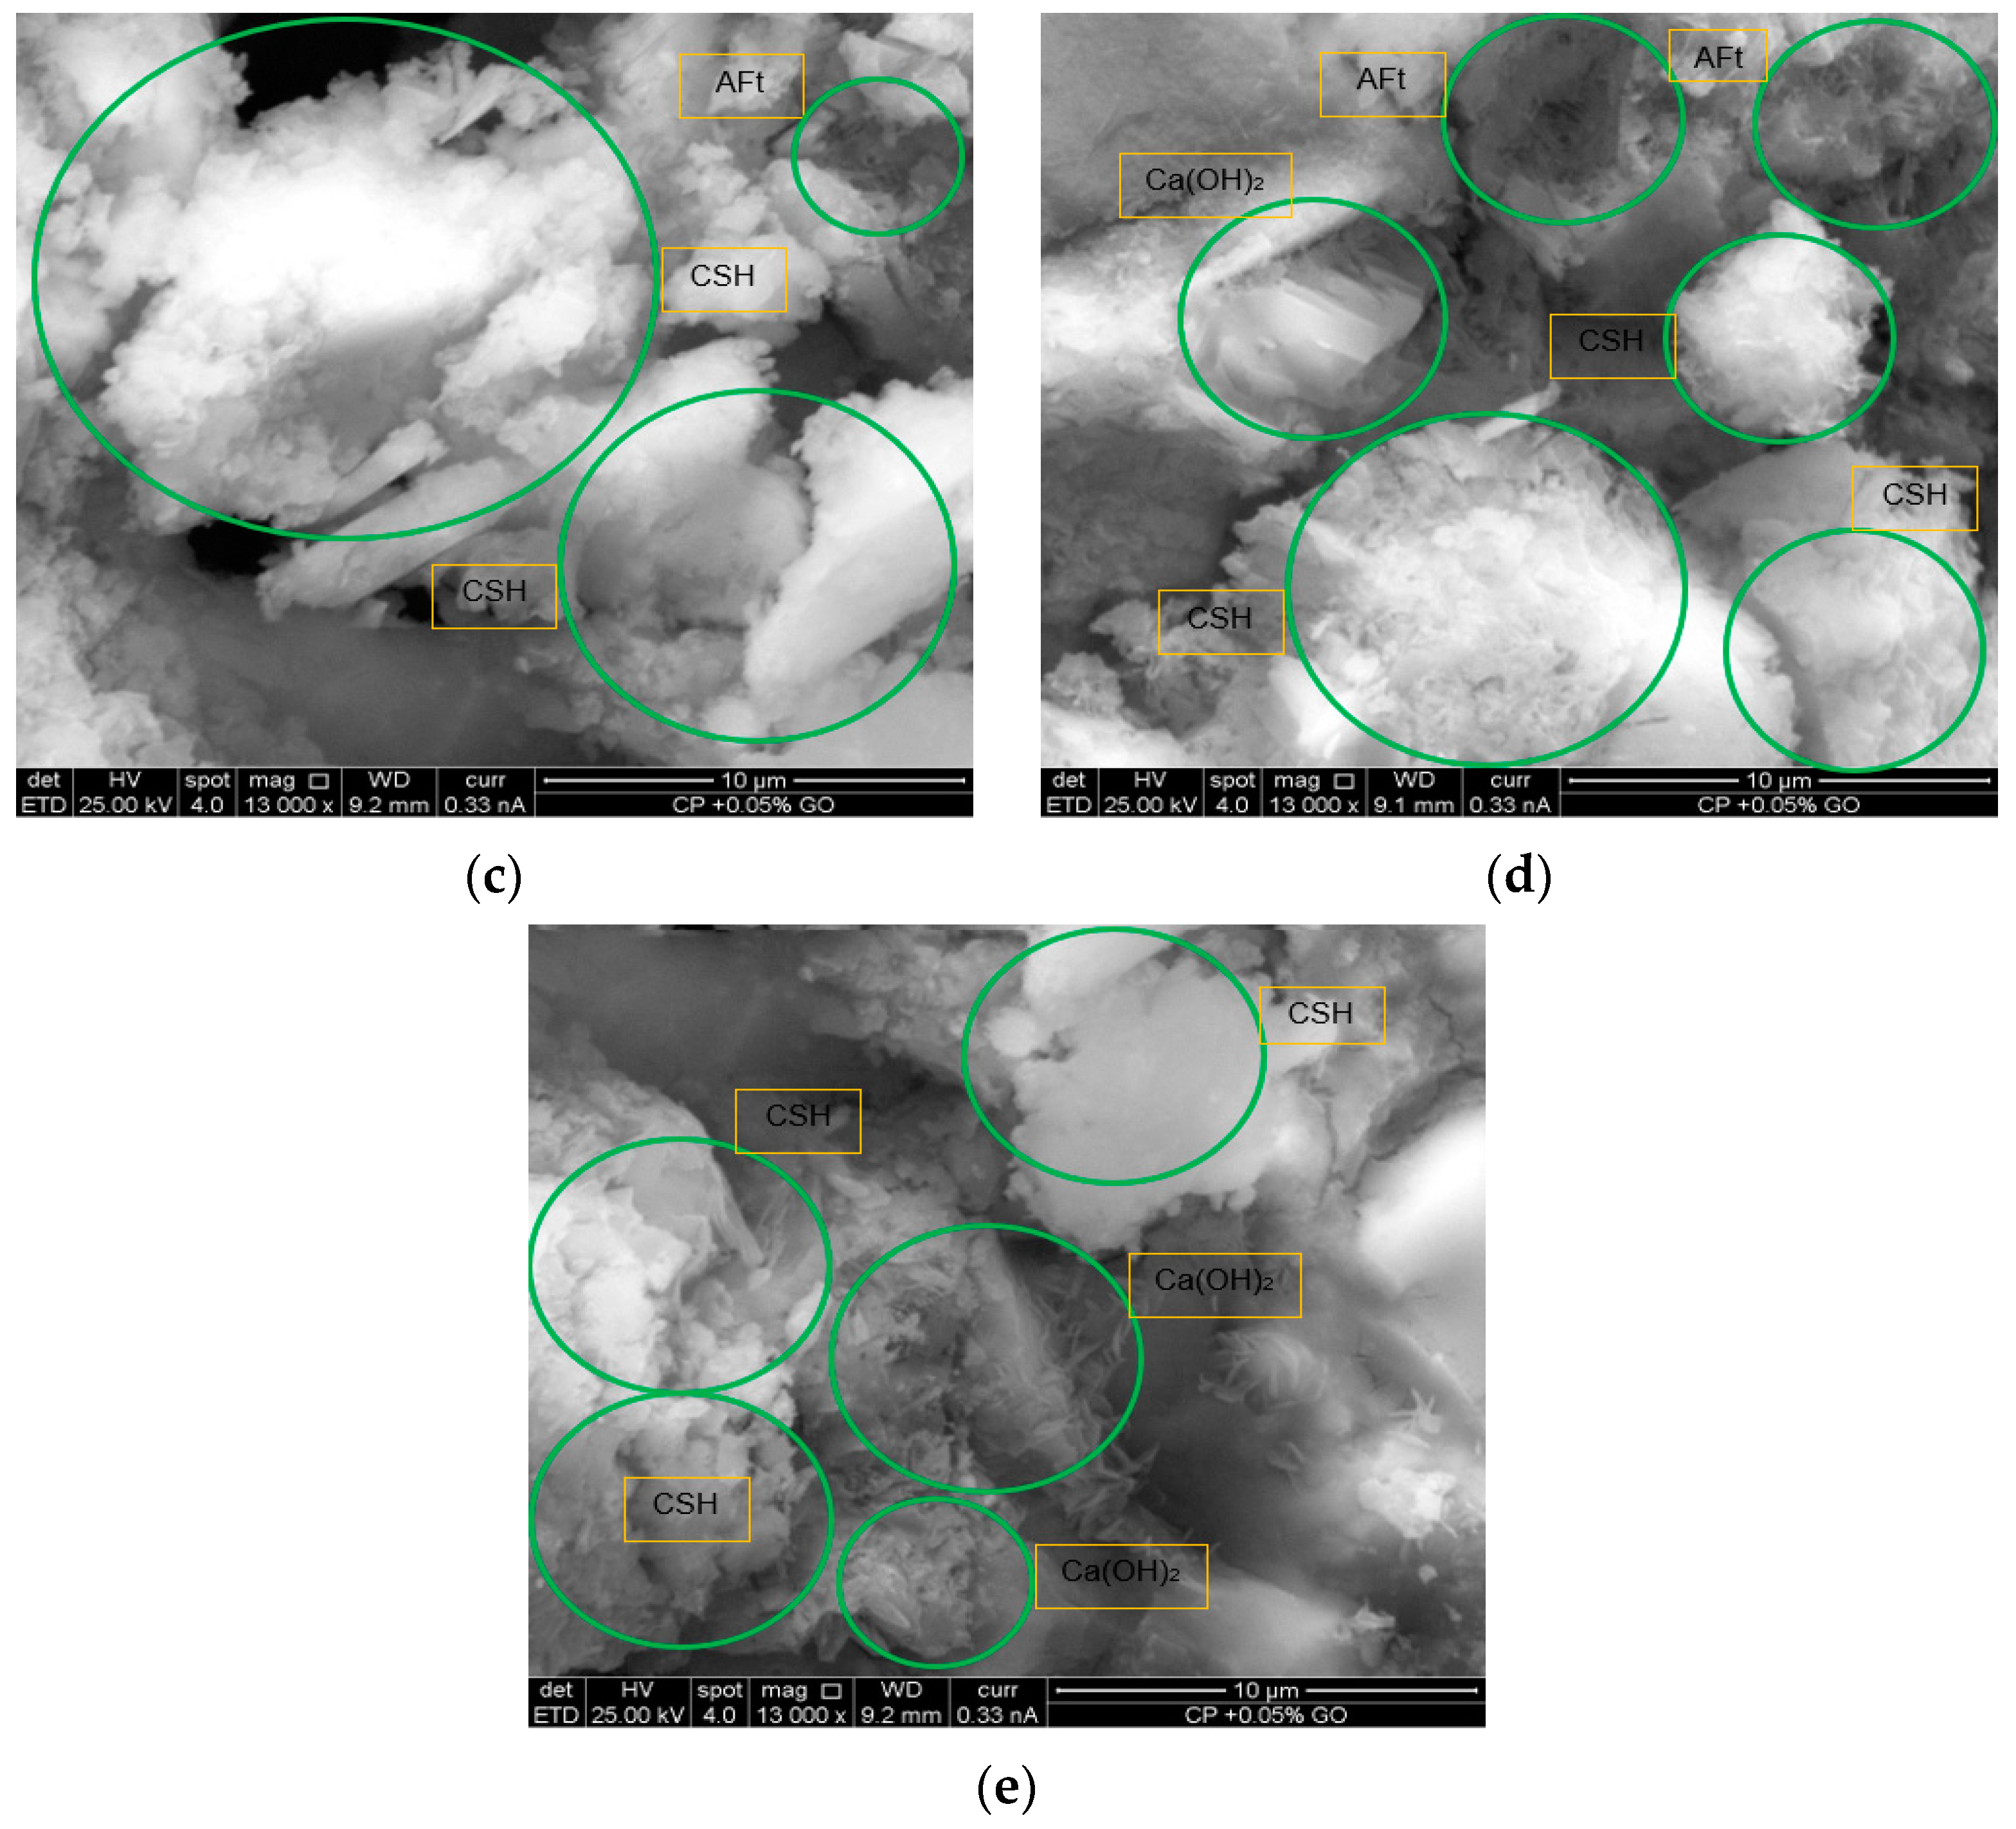
From the identification of the optimum %, samples of the hardened concrete were taken for testing and determination of the microstructural characteristics of the reference concrete contrasted with the concrete with the optimum % of graphene oxide.

3. Results

3.1. Mechanical Properties of Concrete (Compressive Strength, Indirect Tensile Strength, Flexural Strength, and Modulus of Elasticity)

3.1.1. Compressive Strength of Concrete (f′c)

Table 13 presents the results of the compressive strength of the samples with different percentages of GO at 7, 14, and 28 days. It is observed that the incorporation of GO improves the compressive strength with respect to the reference sample (0.00%), reaching the maximum value at a dosage of 0.05%, where a significant increase is recorded throughout the curing time. From a concentration of 0.10%, the strength starts to gradually decrease, suggesting that an excessive amount of GO could negatively affect the microstructure of the material. Figure 4 reinforces these findings by showing the evolution of strength with time, indicating that the benefit of GO is more pronounced at earlier ages and that there is an optimum dosage point before the negative effects manifest themselves. These results demonstrate the importance of the proper control of the amount of GO incorporated to maximize the mechanical performance of the material.

3.1.2. Indirect Tensile Strength of Concrete (ft)

Table 14 and Figure 5 show the evolution of the indirect tensile strength (ft) at 7 and 28 days as a function of the percentage of GO incorporated. It is observed that the maximum strength is reached with an addition of 0.05% GO, registering a value of 26.96 kg/cm2 at 28 days of curing, which represents an increase of 12.33% with respect to the sample without any addition (24.00 kg/cm2). For 0.10% GO, the strength is 23.69 kg/cm2, showing a reduction compared to 0.05%, although it is still higher than the reference. As the GO dosage increases to 0.15% and 0.20%, the strength progressively decreases to 23.47 kg/cm2 and 22.22 kg/cm2, respectively. These results indicate that a controlled GO dosage can significantly improve the tensile strength of concrete, with an optimum point around 0.05%, while higher concentrations could negatively affect the structure of the cementitious matrix.

3.1.3. Flexural Strength of Concrete (fr)

Table 15 and Figure 6 present the results of the flexural strength (fr) of reinforced concrete beams with different percentages of GO, evaluated at 7 and 28 days. It is observed that the incorporation of GO at concentrations of 0.05% and 0.10% improves the flexural strength with respect to the reference sample (0.00% GO), reaching increases of up to 7.39% at 28 days for the 0.05% dosage. However, at higher concentrations (0.15% and 0.20%), the strength decreases significantly, evidencing reductions of up to −14.37% at 28 days with 0.20% GO. These results suggest that there is an optimum dosage of GO to improve the flexural strength of concrete, while high concentrations may induce negative effects on the cementitious matrix.

3.1.4. Modulus of Elasticity (Ec)

Table 16 and Figure 7 present the values of the modulus of elasticity (Ec) obtained from tests on reinforced concrete cylinders with different concentrations of GO at ages 7 and 28 days. It is observed that the addition of GO significantly influences the stiffness of the material, reaching a maximum increase of 19.73% at 7 days and 27.38% at 28 days with a dosage of 0.05% GO compared to the reference sample (0.00% GO). However, as the GO concentration increases, the gain in modulus of elasticity decreases, observing a moderate growth with 0.10% and a progressive reduction with 0.15% and 0.20%, where the final values are close to those of the reference sample. These results indicate that there is an optimum dosage of GO to improve the elastic response of the concrete, while higher concentrations can generate negative effects on the cohesion of the cementitious matrix.
The study of the mechanical properties of concrete with GO addition shows that all the evaluated percentages improve the compressive strength compared to the reference sample (0.00%), highlighting the 0.05% GO with an increase of 14.61% at 28 days. Similarly, the indirect tensile strength presents an increase of 12.33% with 0.05% GO; however, higher concentrations (0.10%, 0.15%, and 0.20%) reduce this beneficial effect. As for flexural strength, an improvement is observed with 0.05% and 0.10% GO, reaching the highest increase with 0.05% (+6.09% at 28 days), while higher concentrations generate a decrease in mechanical performance. Likewise, the modulus of elasticity shows an increasing trend with the addition of GO, obtaining the highest increase of 27.38% with the addition of 0.05% at 28 days, suggesting that this concentration is the most efficient to optimize the mechanical properties of concrete without compromising its structural performance.
To validate that 0.05% is the optimal dosage of graphene oxide (GO), a detailed statistical analysis was conducted using 95% confidence intervals for the evaluated mechanical properties. The results indicate that the compressive strength of concrete with 0.05% GO (420.83 ± 19.41 kg/cm2) exhibits a statistically significant difference compared to the control sample (367.2 ± 12.07 kg/cm2), with a p-value of 0.0081 in Student’s t-test, confirming that the observed improvement is not due to random variation. To further substantiate these findings, reproducibility tests were carried out on three different mix designs while maintaining a constant water-to-cement ratio (0.466) but varying the type of Portland Type I cement from different manufacturers. In all cases, the optimal performance was maintained at the 0.05% GO concentration, with compressive strength increases ranging between 12.8% and 16.2%, validating the robustness of the findings regardless of cement source.
Additionally, the Tukey HSD multiple comparison method was employed to assess the influence of GO on the elastic modulus, yielding statistically significant differences (p < 0.001). Specifically, the sample containing 0.05% GO exhibited an increase of 82,105.49 kg/cm2 compared to the control concrete, with a 95% confidence interval ranging from 64,385.35 to 99,825.62 kg/cm2, confirming that the improvement is real and not a random effect. For further validation, the results obtained in flexural and indirect tensile strength also followed the same trend, consolidating the conclusion that a 0.05% GO concentration represents the optimal threshold for mechanical enhancement in concrete.

3.2. Microstructural Characteristics of the Reference Concrete Sample and the Sample with 0.05% Graphene Oxide Addition

3.2.1. Thermal Degradation and Mass Loss of Graphene Oxide of the Reference Sample and the Reference Sample with Addition of 0.05% GO

Mass loss was obtained using the thermogravimetric analysis technique (TGA), and thermal degradation was determined by thermogravimetric derivative (TGA), according to ASTM E1131-20 [70] and ASTM D3418-21 [71]. The specific heat of the samples was calculated by means of NETZSCH STA 449F3 equipment, manufactured by NETZSCH-Gerätebau GmbH, Selb, Germany, using the Proteus® 6.1 software.
Figure 8a presents the thermal analysis of the graphene oxide sample, Figure 8b presents the reference concrete sample, and Figure 8c presents the reference concrete sample with 0.05% GO by TGA (red line), DTG (green line), and DSC (blue line). The TGA curve evidences the mass loss in three stages for each material. In the graphene oxide, a total loss of 93.9% is observed; these stages correspond to the elimination of volatile compounds, organic functional groups, and carbon. Meanwhile, in the reference concrete sample and reference sample with 0.5% GO total losses of 12.9% and 14.54%, respectively, associated with dehydration processes, the decomposition of components and thermal transformation are observed. The DTG curve allows the identification of critical degradation temperatures, with relevant peaks at 161 °C for the graphene oxide, 70 °C and 444 °C for the reference concrete, and 101 °C and 443 °C for the reference concrete with GO. Finally, the DSC curve evidences key exothermic events, highlighting the graphene oxide at 163 °C, the reference concrete at 446 °C, and the reference concrete with GO at 444 °C, which reflects the energy release and thermal transitions characteristic of each sample.

3.2.2. Absorbance in Fourier Transform Infrared Spectroscopy (FTIR)

The absorbance units and absorption bands were determined using the Fourier Transform Infrared Spectroscopy (FTIR) technique, according to ASTM E1252-98(2021) [72] which allowed the identification of chemical compounds at the absorbance peaks for the reference concrete sample and the reference concrete sample with 0.05% GO. The samples were analyzed using the FTIR Tensor 27, equipped with a diamond ATR accessory (Bruker, Ettlingen, Germany).
In this context, the FTIR spectra of the reference sample and the sample with 0.05% GO are presented, allowing for the analysis of their molecular composition. In Figure 9a, the reference sample exhibits characteristic peaks at 965 cm−1, 874 cm−1, and 1412 cm−1, with intensities of 0.08925, 0.05898, and 0.02271 units, respectively, associated with specific bond vibrations. Figure 9b shows the sample with GO, where the peaks shift slightly to 968 cm−1, 875 cm−1, and 1415 cm−1, with increased intensities of 0.12515, 0.08425, and 0.03564 units, indicating stronger molecular interactions and the possible incorporation of GO functional groups. These shifts suggest enhanced chemical reactivity, particularly in silicate and carbonate bonds, favoring the formation of hydration products such as C-S-H. Additionally, the higher absorbance in the 800–1000 cm−1 region reflects a stronger interaction between GO and the cementitious matrix, without altering its primary chemical structure. Finally, Figure 9c compares both spectra, confirming the absorbance increases in the GO-containing sample while maintaining the main chemical framework. These findings support the hypothesis that GO acts as a hydration promoter, improving microstructural densification and the chemical stability of the system.

3.2.3. Morphological and Compositional Characterization of Concrete Samples by Scanning Electron Microscopy (SEM) and Energy-Dispersive X-Ray Spectroscopy (EDS)

For the preparation of the samples, fragments with appropriate geometry were selected and fixed onto aluminum stubs using carbon conductive adhesive tape and copper tape. Subsequently, a gold coating of 20 to 40 nm was applied via sputter coating to ensure electrical conductivity (Figure 10a), which was necessary for obtaining high-magnification images in electron microscopy.
The morphological and compositional analysis of the samples was performed using scanning electron microscopy (SEM) in conjunction with energy-dispersive X-ray spectroscopy (EDS), according to ASTM C1723-16(2021) [73]. Measurements were conducted with an SEM FEI Quanta 650 (FEI Company, Hillsboro, OR, USA), operating at an accelerating voltage of 25 kV and a spot size of 4, both for imaging and elemental composition analysis. Various areas were examined at magnifications of 13,000×. EDS measurements were carried out using an EDAX detector (EDAX, Ametek Materials Analysis Division, Mahwah, NJ, USA) mounted on the electron microscope, with data processing and elemental composition determination performed using the EDAX TEAM V4.0 software, applying an eZAF matrix correction. Additionally, the average pore and crack size was determined at a scale of 10 µm in the reference sample (Figure 10b) and the sample with 0.05% GO (Figure 10c), under the same experimental conditions.
To evaluate the effect of GO addition on the material’s morphology, a comparative analysis of the characteristic dimensions of pores and cracks observed in the scanning electron microscopy (SEM) images was conducted. Table 17 presents the measured values for the reference sample and the sample with 0.05% GO, allowing the identification of potential variations in the material’s structure and their influence on mechanical properties. Specifically, a 16.27% reduction in the average pore and crack size is observed, suggesting that the incorporation of GO contributes to greater compaction and homogeneity in the material’s microstructure.
The SEM and EDS analysis revealed a homogeneous microstructure across different batches of GO-modified concrete, with an average 16.28% reduction in pore size and a 44.49% increase in the Ca/Si ratio, indicating enhanced C-S-H formation. Although minor variations in residual portlandite content and slight GO agglomerations were observed in some regions, over 95% of the data remained within an expected variability range, ensuring the consistency and reproducibility of the study. These findings confirm that GO acts as a nucleation site, promoting the hydration and densification of the cementitious matrix without significantly affecting result uniformity.

3.2.4. Chemical Composition of the Reference Concrete Sample and the Reference Sample with 0.05% GO

The presented images correspond to micrographs obtained through scanning electron microscopy (SEM) of the analyzed samples, where the selected energy-dispersive spectroscopy (EDS) points for chemical characterization have been marked. In Figure 11a,b, corresponding to the reference sample, structures with the presence of pores and cracks are observed, with six analysis points distributed in different regions of interest. On the other hand, Figure 11c,d, corresponding to the sample with 0.05% GO, reveal a microstructure with smaller pore sizes and greater compaction, where six EDS analysis points have also been identified. These images allow for a comparison of the distribution and chemical composition of the phases present in both samples, as detailed in Table 18 and Table 19.
The atomic percentage composition of the reference sample with 0.05% GO, analyzed by EDS, is presented. An increase of 3.93% in oxygen content is observed in the GO-modified sample compared to the reference sample, accompanied by a 32.32% decrease in calcium content, suggesting a possible modification in hydration or phase distribution within the sample. Likewise, the silicon content shows a slight reduction of 6.11%, while aluminum increases by 57.91%, which could indicate interactions between the cementitious matrix and GO. Finally, the 38.91% reduction in the “others” category suggests a lower presence of impurities or trace elements in the modified sample.

3.2.5. Microstructure Morphology of the Reference Sample and the Reference Sample with 0.05% GO

The images obtained through scanning electron microscopy (SEM) illustrate the microstructural evolution of both the reference sample and the sample modified with 0.05% GO. In Figure 12a, corresponding to the reference sample, a matrix with the presence of hydrated compounds is observed, highlighting products such as calcium silicate hydrate (CSH) and calcium hydroxide (Ca(OH)2) in a lower proportion. In Figure 12b, morphological changes are evident, showing a higher densification of the structure along with the identification of products such as ettringite (AFt), suggesting an alteration in cement hydration.
In Figure 12c,d, a more homogeneous distribution and an increase in the amount of CSH and AFt are observed, indicating that the addition of GO promotes the formation of these compounds, which may enhance the mechanical properties of the material. Additionally, in Figure 12e, the presence of CSH in fibrillar structures and Ca(OH)2 in hexagonal plates is reinforced, confirming the influence of GO in modifying the morphology of hydration products, leading to a more compact and uniform cementitious matrix.

3.2.6. Phase Chemical Composition Analysis by X-Ray Diffraction (XRD)

The chemical compounds were determined using the X-ray diffraction (XRD) test for phase chemical composition, according to UNE-EN 13925-1:2006 [74]. The equipment used was Panalytical—Model AERIS—with a cobalt (Co) anode material and a predetermined K-Alpha wavelength type.
Table 20 presents a comparative analysis of the chemical composition of the reference sample and the sample modified with 0.05% graphene oxide (GO) based on X-ray diffraction (XRD) analysis. The results indicate a significant increase of 26.31% in silicon-based compounds in the GO-modified sample, suggesting the enhanced formation of calcium silicate hydrate (CSH), which is crucial for the mechanical strength development of cementitious materials. Additionally, the portlandite content decreased by 2.06%, indicating a more efficient and complete hydration process in the presence of GO. This reduction, along with the lower proportion of amorphous phases, suggests improved compound reactivity and a denser microstructure.

3.2.7. Summary of the Influence of 0.05% Graphene Oxide Addition on the Mechanical and Microstructural Properties of Concrete

Finally, Table 21 presents a comparative analysis of the physicochemical properties of graphene oxide (GO) and the mechanical and microstructural properties of concrete with a design strength of 280 kg/cm2, with and without the addition of 0.05% GO. In terms of GO characterization, its thickness and chemical composition fall within acceptable ranges. The mass loss due to thermal degradation exhibits a progressive reduction with increasing temperature, indicating stability within the expected intervals. Regarding mechanical properties, the incorporation of GO enhances compressive strength (14.61%), indirect tensile strength (12.33%), and flexural strength (0.9%), with a significant impact on the modulus of elasticity, which increases by 27.38%. At the microstructural level, a 16.28% reduction in the average pore and crack size is observed, along with a 44.49% increase in the Ca/Si ratio, suggesting the greater densification of the cementitious matrix. Additionally, the morphology of the hydration products shows improved definition with GO addition. In terms of chemical composition, an increase in silicon-based compounds and a slight decrease in the proportion of portlandite indicate a higher conversion to stable hydrated products. Finally, the thermal degradation of concrete with GO maintains a mass loss trend within expected ranges, confirming its thermal stability. These results suggest that the incorporation of GO significantly improves the mechanical and microstructural properties of concrete, enhancing its overall performance.

4. Discussion

Several studies have investigated the effect of graphene oxide (GO) addition, relative to cement weight, on the mechanical and microstructural properties of concrete. Ref. [32] reported increases of 20.1%, 29.8%, and 26.2% in compressive, flexural, and tensile strength, respectively, with a 0.06% GO dosage. Additionally, the enhanced hydration of C2S and C2S, reduced pore size, and the formation of denser hydration products were observed through SEM analysis. Similarly, Ref. [51] recorded improvements of 16.04%, 30.50%, 23.40%, and 12.95% in compressive, tensile, and flexural strength, as well as in the elastic modulus, with 0.06% GO, along with a 12.99% reduction in porosity. Likewise, Ref. [24] reported increases of 22.36%, 27.44%, 23.88%, and 22.47% in the same properties, accompanied by a reduction in microcracks and increased C-S-H gel formation.
GO is a nanomaterial with a high specific surface area, which promotes agglomeration and affects its dispersion in fluid media [75]. Its dispersion is influenced by the Peclet number (Pe), which improves as the GO sheet diameter increases, as considered in this study (20 µm) [76]. GO contains oxygen functional groups (hydroxyl, epoxy, carboxyl, and carbonyl), which facilitate hydration and the formation of cementitious products [53,77]. Furthermore, the mass loss of GO occurs in three stages: water evaporation (110–130 °C), the pyrolysis of oxygen-containing groups (~450 °C), and carbon decomposition (>600 °C) [78,79].
GO enhances the mechanical performance of concrete, but its effect is dosage-dependent. Ref. [32] reported a 20.1% increase in compressive strength with 0.05% GO but a reduction at 0.07%. Ref. [7] observed improvements of 23%, 48%, and 57% with 0.01%, 0.03%, and 0.05% GO, respectively. In this study, a 14.61% increase was recorded with 0.05% GO. Regarding indirect tensile strength, some studies [32,51,57] have shown improvements ranging from 22.66% to 27.44%, whereas this study reported a 12.33% increase. For flexural strength, Refs. [7,64] documented enhancements of 41% and 48%, respectively, while this study achieved a 6.09% increase. Finally, the elastic modulus increased by 27.38%, surpassing the values reported in [24,51].
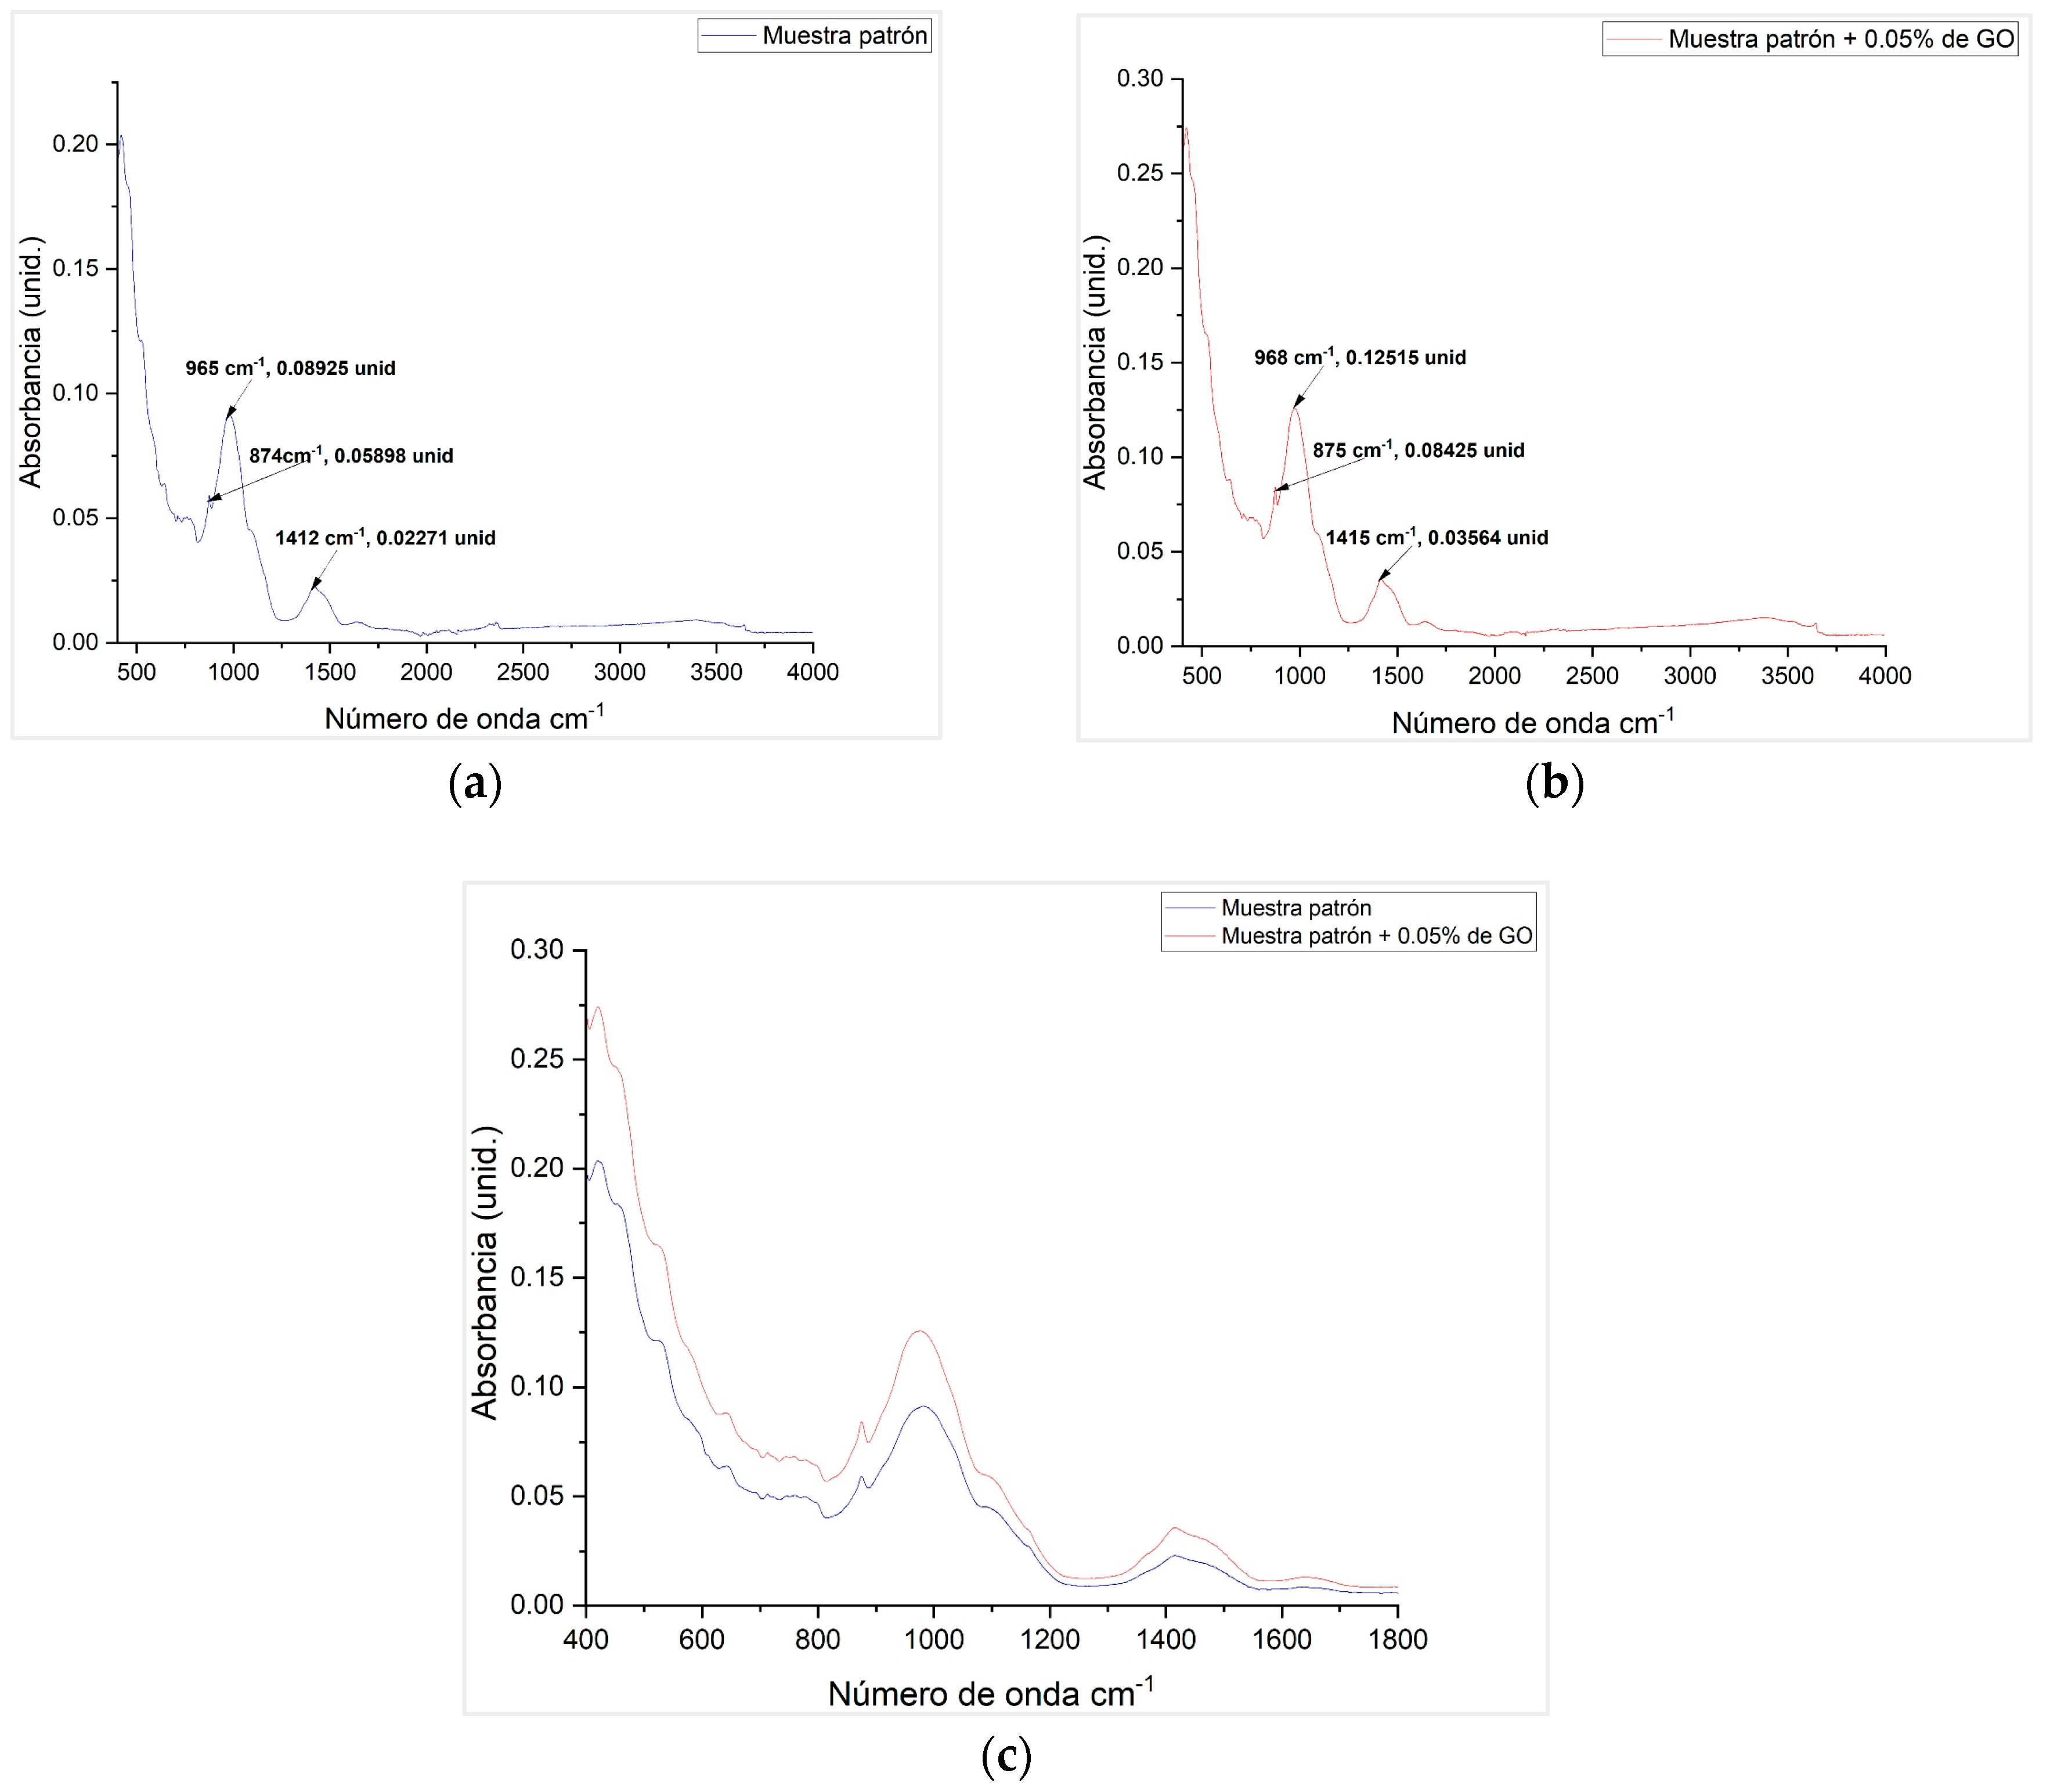
FTIR analysis confirmed the formation of calcium carbonate (CaCO3) at bands between 1402 and 1425 cm−1 [11,80], as well as silicates at bands between 943 and 997 cm−1 [29,81]. The observed pore size reduction in this study (16.27%) was lower compared to the values reported in [32,51], which reached up to 39.88%. The Ca/Si ratio increased in the GO-modified sample, consistent with the findings in [10,25]. SEM analysis in [32,75] revealed denser and more crystalline microstructures in GO-modified concrete, aligning with the results obtained in this study. Lastly, the thermal degradation behavior of GO-modified concrete exhibited consistency with previous studies, indicating mass losses in three stages: water evaporation (<200 °C), portlandite decomposition (~444 °C), and decarbonation (>700 °C) [7,82,83].
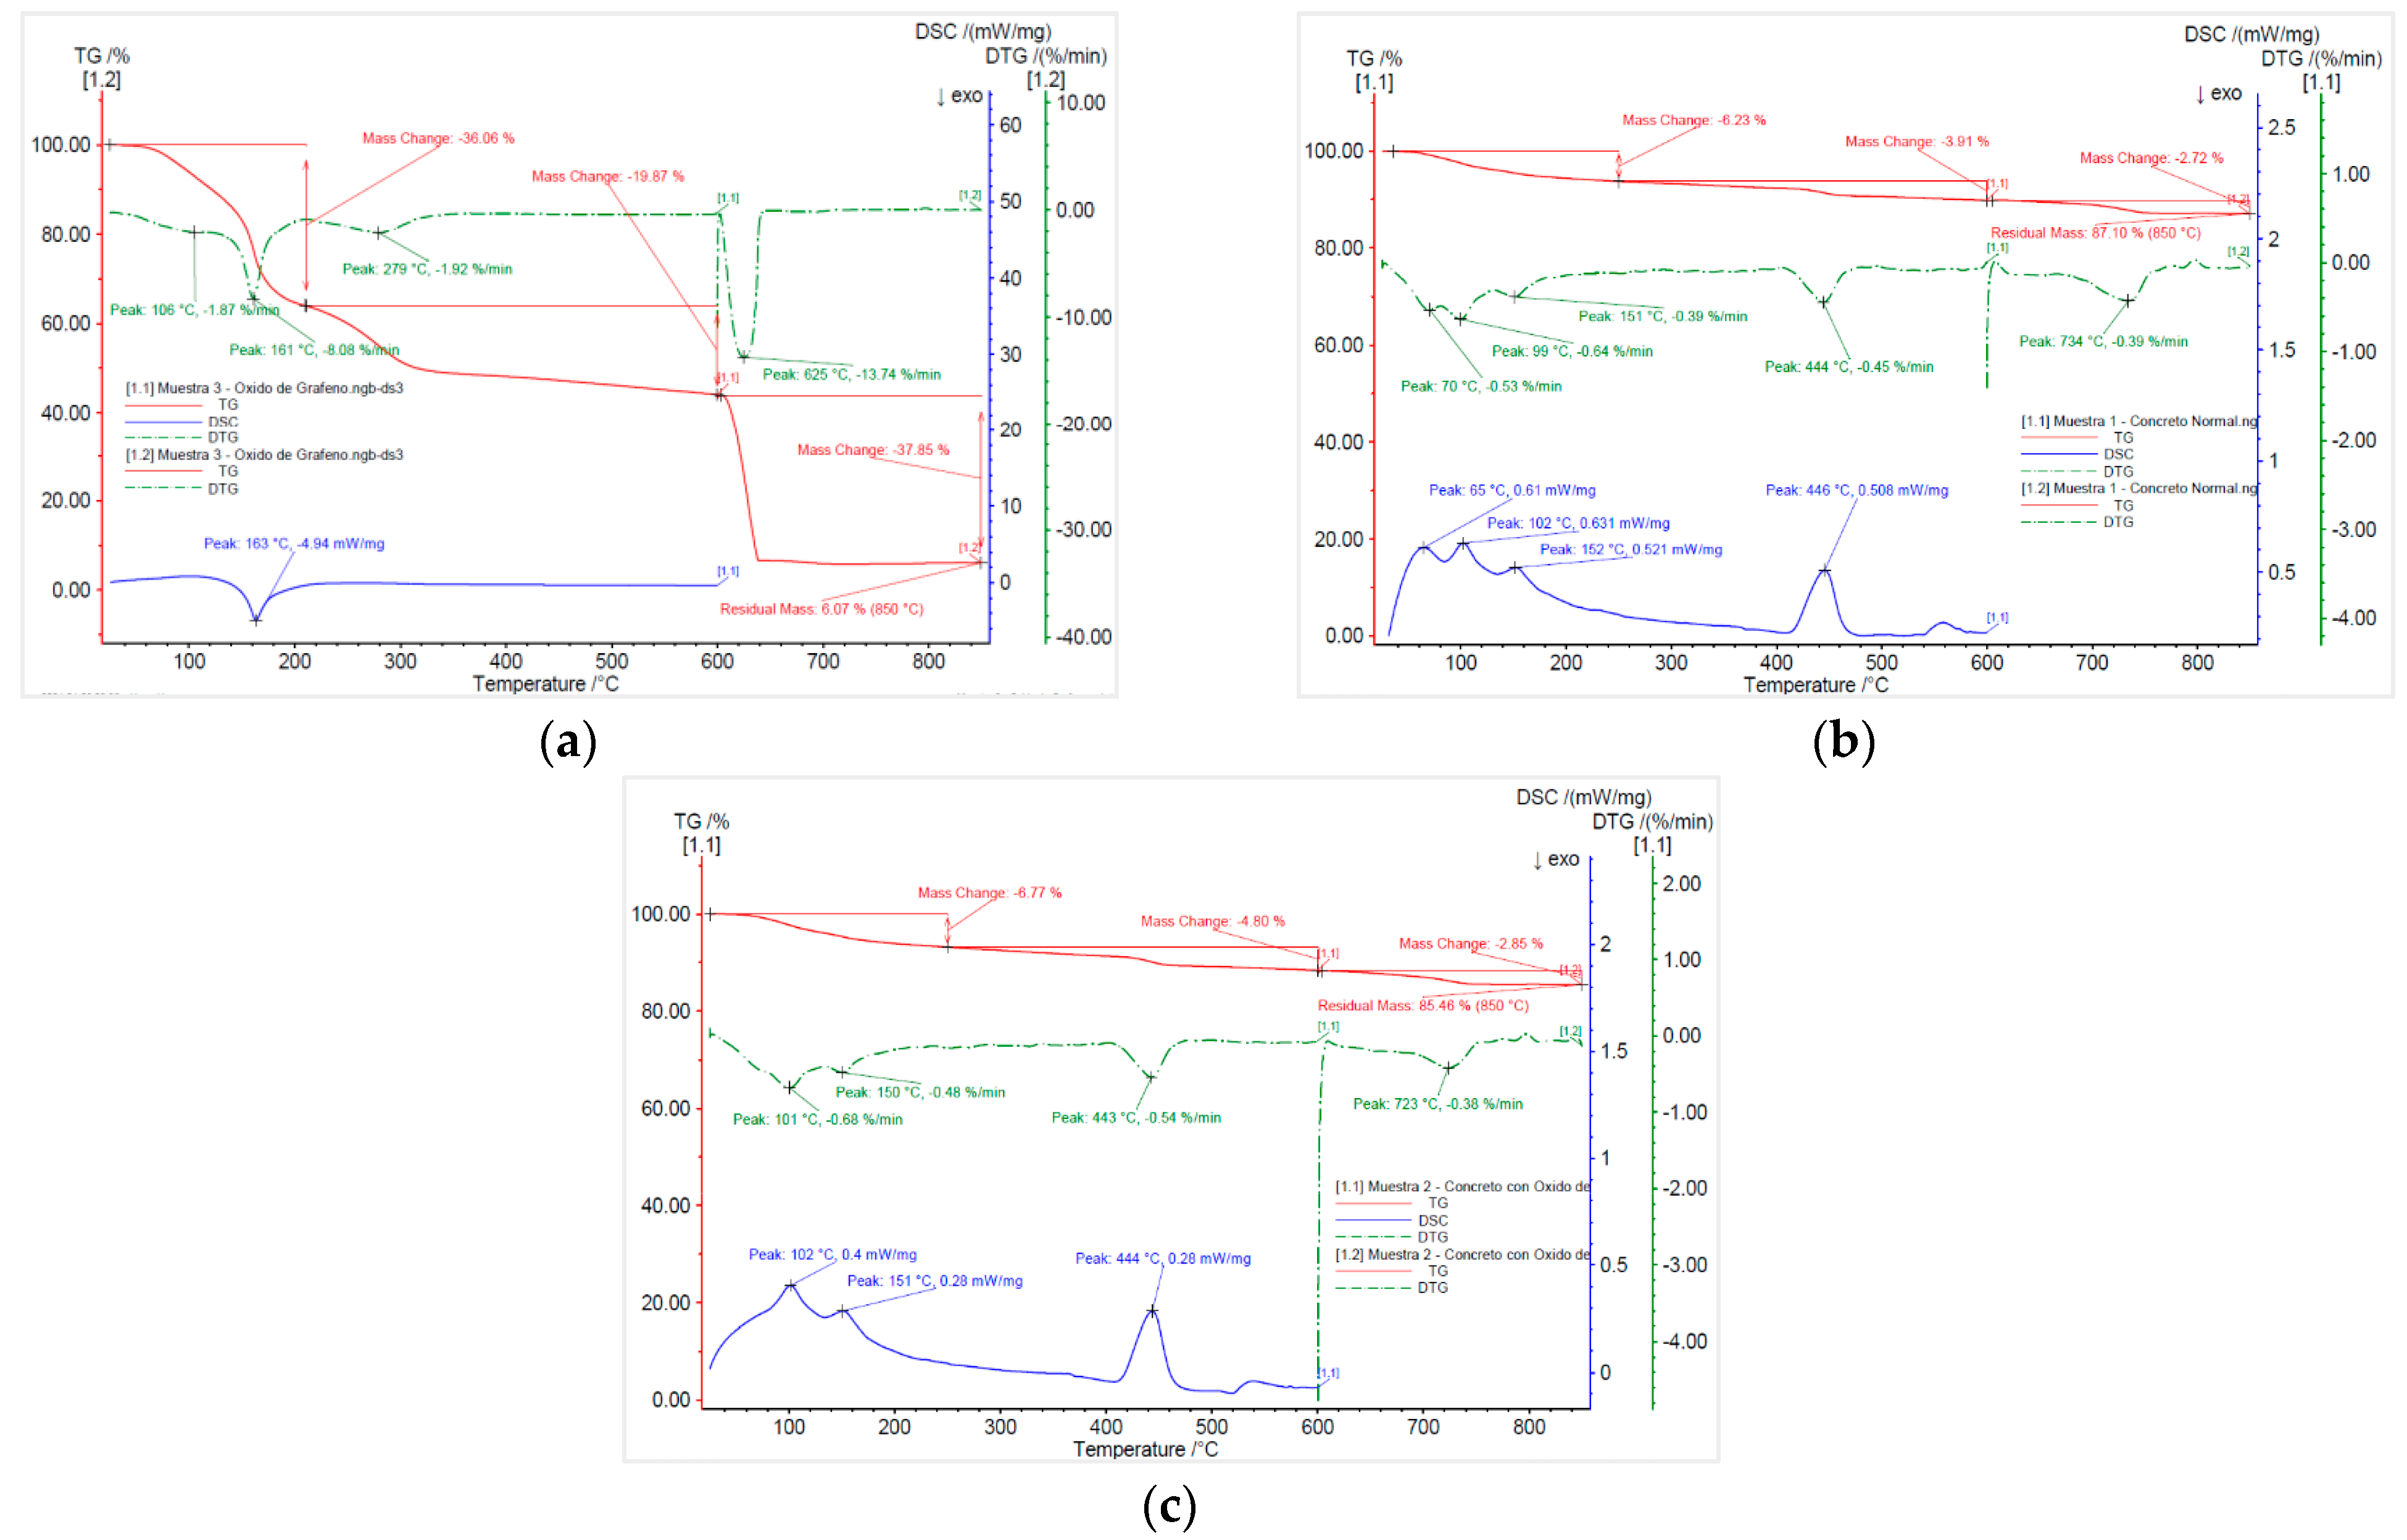
Microstructural analyses (SEM, EDS, FTIR, TGA, and XRD) in this study revealed that incorporating 0.05% GO promotes a denser and more homogeneous microstructure, as evidenced by a 16.28% reduction in average pore and crack size. XRD analysis showed a 26.31% increase in silicon compounds, indicating greater C-S-H formation, while portlandite content decreased by 2.06%, confirming a more complete and efficient hydration process. These findings were supported by FTIR, which showed increased absorption in silicate- and carbonate-related bands, highlighting the higher reactivity of the cementitious matrix with GO. Consequently, mechanical properties improved significantly, with 14.61% higher compressive strength, 12.33% higher indirect tensile strength, 6.09% higher flexural strength, and a 27.38% increase in elastic modulus, suggesting that GO not only enhances late-stage hydration but also reinforces the strength and durability of concrete. In agreement with these results, Ref. [29] analyzed early hydration (1 to 3 days) using TGA, DTG, and SEM, reporting that at 24 h, GO-modified samples exhibited a slight reduction in portlandite (Ca(OH)2) content compared to the control, attributed to the initial absorption of water and Ca2+ by GO, temporarily limiting their availability for hydration product formation. However, this effect was reversed as GO acted as a water reservoir, facilitating a more efficient hydration process. By day 3, compressive strength significantly increased by 24.7%, 30.7%, and 42.3% for GO contents of 0.1%, 0.15%, and 0.20%, respectively, a trend correlated with greater C-S-H formation, confirmed by thermal analysis and electron microscopy. Furthermore, EDS and XRD results confirm that GO primarily acts as a nucleation site for C-S-H formation, as evidenced by the increase in silicon compounds and the reduction in portlandite, suggesting a more efficient conversion of Ca(OH)2 into hydrated products. This effect has been previously reported in studies such as [29], where GO was found to promote the nucleation and growth of C-S-H without altering its chemical structure. Additionally, TGA and DTG analyses demonstrated that GO modifies hydration dynamics by influencing the availability of water and Ca2+, which can temporarily reduce portlandite content in the first 24 h but subsequently accelerate its transformation into C-S-H. Collectively, these findings indicate that GO not only acts as a nucleation center but also modulates the chemical reactions involved in portlandite conversion, optimizing hydration and microstructural densification, which translates into significant improvements in concrete strength and durability. The thermogravimetric analysis (TGA) in this study revealed that GO undergoes a 93.9% mass loss, occurring in three main stages: elimination of volatile compounds (up to 280 °C), decomposition of organic functional groups (280–600 °C), and structural carbon degradation (600–850 °C). In GO-modified concrete, the total mass loss was significantly lower (14.54%), indicating that the cementitious matrix significantly mitigates GO’s thermal degradation. Similarly, the study in [80] reported that TGA showed a significant mass loss between 400 °C and 800 °C, primarily attributed to the progressive decomposition of hydrated compounds, such as C-S-H and portlandite (Ca(OH)2), with reductions of 1.75–1.84% between 400 and 475 °C and 8.90–11.35% between 600 and 800 °C. This thermal degradation directly impacts the mechanical strength of concrete, with losses of up to 28% at 400 °C and 70% at 800 °C, due to the conversion of Ca(OH)2 into CaO and the decomposition of C-S-H. Additionally, an increase in crack and fissure formation was observed from 600 °C onward, which compromises structural stability and increases porosity, reducing the material’s performance under high-temperature exposure.

5. Conclusions

The results of this study demonstrate that the addition of graphene oxide (GO) in low concentrations significantly enhances the mechanical and microstructural properties of concrete with a specified compressive strength of f’c = 280 kg/cm2.
From a physicochemical perspective, the GO used in this study exhibits suitable characteristics for its application in cementitious materials. Its average diameter of 20 µm facilitates homogeneous dispersion in water, optimizing its integration into the concrete matrix. Additionally, its chemical composition (63.40% carbon, 35.49% oxygen, and 1.11% sulfur) falls within the ranges reported in previous studies, ensuring the presence of functional groups that act as nucleation sites for hydration products, promoting a more compact and homogeneous microstructure.
Thermogravimetric analysis (TGA) identified three main stages of mass loss: (i) between 30 °C and 280 °C, associated with the removal of adsorbed water; (ii) between 280 °C and 600 °C, related to the decomposition of organic functional groups; and (iii) between 600 °C and 850 °C, corresponding to structural carbon degradation. The consistency of these results with previous studies validates the thermal stability of GO within the cementitious matrix.
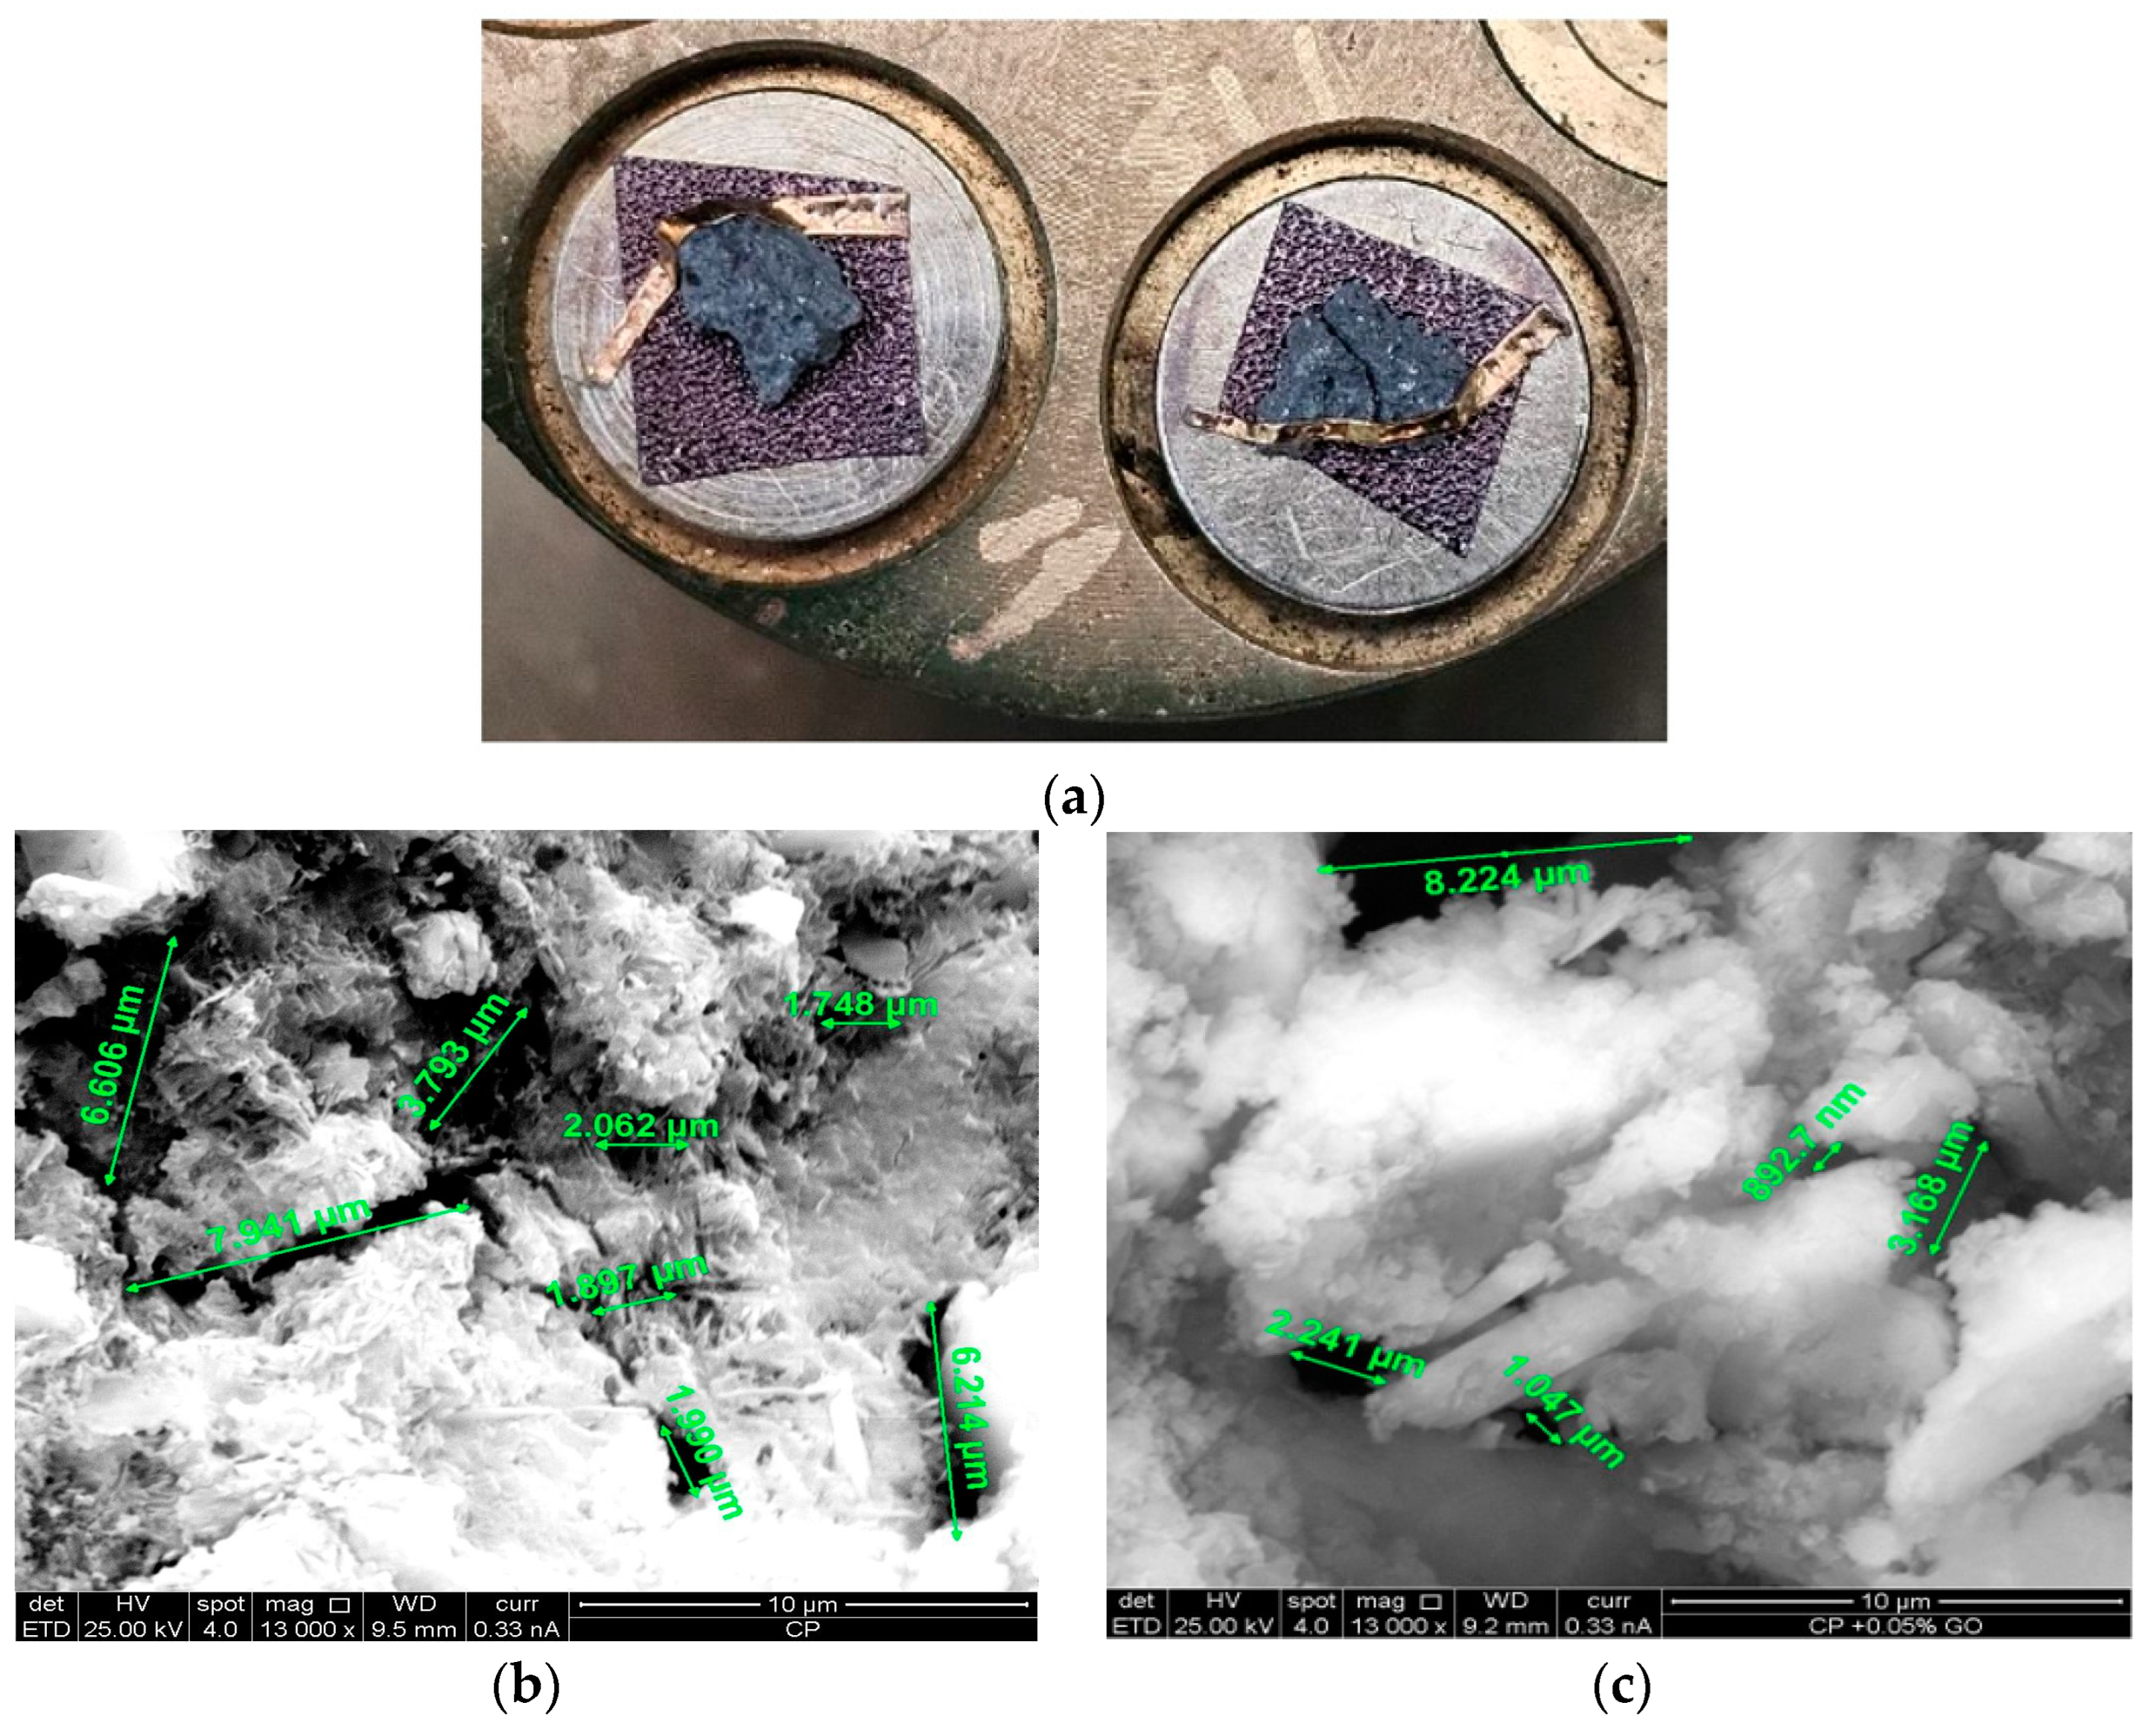
Regarding mechanical properties, the incorporation of GO in proportions of 0.05%, 0.10%, 0.15%, and 0.20% by cement weight exhibited a positive effect, increasing compressive strength, indirect tensile strength, flexural strength, and elastic modulus. The optimal dosage was 0.05%, with respective increases of 14.61%, 12.33%, 6.09%, and 27.38% compared to the reference sample. However, at higher concentrations, mechanical performance showed a decreasing trend, suggesting that at GO dosages equal to or greater than 0.10%, this reduction is primarily due to the agglomeration of nanolayers caused by Van der Waals forces, leading to discontinuities in the cementitious matrix and stress concentrators that compromise its structural integrity, as evidenced in SEM micrographs. Additionally, the high specific surface area of GO increases water absorption, modifying the effective water-to-cement ratio and generating zones with non-uniform hydration, which affects the homogeneous formation of cementitious products, as confirmed by XRD analyses that reveal an imbalance in C-S-H and portlandite formation at higher GO concentrations. Furthermore, excessive GO content reduces concrete workability, requiring additional doses of superplasticizer to mitigate its effect, which may induce segregation and heterogeneity in the microstructure. These inter-related factors explain the decrease in mechanical strength observed in samples with GO concentrations above 0.05%, highlighting the importance of an optimal dosage to maximize benefits without compromising the material’s integrity.
Microstructural analysis confirmed substantial improvements in the sample with 0.05% GO. FTIR spectroscopy revealed shifts and increased intensity in absorption peaks associated with calcium carbonate (CaCO3), silicates, and Al(OH)3, indicating a higher degree of hydration and crystallinity. SEM images showed a denser structure with a 45.43% reduction in average pore and crack size. Additionally, a more uniform distribution of hydration products was observed, with CSH crystals in an expanded sponge-like form, Ca(OH)2 in hexagonal plates, and ettringite (AFt) in needle-like structures.
EDS analysis showed an increase in the Ca/Si ratio from 2.27 to 3.28 in the GO-modified sample, indicating a higher presence of hydrated cementitious products and suggesting improved strength of the material. XRD results confirmed a 26.31% increase in silicon-based compounds (CSH), while portlandite (Ca(OH)2) decreased by 2.06%, evidencing more efficient hydration and reduced susceptibility to carbonation.
Finally, TGA and DTG thermal analyses indicated that the GO-modified sample exhibited greater volatile and free water release at 101 °C, the more efficient decomposition of organic compounds at 150 °C, and portlandite degradation at lower temperatures compared to the reference sample. These findings suggest that GO addition enhances the thermal stability and hydration efficiency of cementitious compounds.

6. Future Recommendations

In terms of durability, it is recommended to conduct additional tests such as chloride penetration resistance, freeze–thaw cycles, water permeability, and sorptivity to evaluate the performance of GO-modified concrete under aggressive environmental conditions. At the microstructural level, it is suggested to complement the analysis with the ultrasonic pulse velocity (UPV) test to assess concrete density and homogeneity, as well as nuclear magnetic resonance (NMR) spectroscopy to characterize the molecular structure of calcium silicate hydrate (CSH) gels and their evolution in the presence of GO. These future studies will contribute to a better understanding of the effect of GO on the cementitious matrix and its potential application in optimizing the mechanical performance and durability of concrete.

Author Contributions

Methodology, A.R.; Formal analysis, C.B.; Investigation, C.B., A.R., J.N. and A.S.; Writing—review & editing, A.R.; Funding acquisition, Y.L., L.L.B., P.P., A.M. and M.M. All authors have read and agreed to the published version of the manuscript.

Funding

This research received no external funding.

Data Availability Statement

The original contributions presented in the study are included in the article, further inquiries can be directed to the corresponding author.

Conflicts of Interest

The authors declare no conflicts of interest.

Abbreviations

The following abbreviations are used in this manuscript:
GOGraphene Oxide
f’cCompressive Strength
SEMScanning Electron Microscopy
EDSEnergy-Dispersive X-ray Spectroscopy
SEMThermogravimetric Analysis
FTIRFourier Transform Infrared Spectroscopy
XRDX-ray Diffraction
CSHCalcium Silicate Hydrate
AFtEttringite
Ca(OH)2Calcium Hydroxide

References

  1. Babalola, O.E.; Awoyera, P.O.; Le, D.H.; Romero, L.B. A Review of Residual Strength Properties of Normal and High Strength Concrete Exposed to Elevated Temperatures: Impact of Materials Modification on Behaviour of Concrete Composite. Constr. Build. Mater. 2021, 296, 123448. [Google Scholar] [CrossRef]
  2. Vázquez-Rowe, I.; Ziegler-Rodriguez, K.; Laso, J.; Quispe, I.; Aldaco, R.; Kahhat, R. Production of Cement in Peru: Understanding Carbon-Related Environmental Impacts and Their Policy Implications. Resour. Conserv. Recycl. 2019, 142, 283–292. [Google Scholar] [CrossRef]
  3. Smolana, A.; Klemczak, B.; Azenha, M.; Schlicke, D. Early Age Cracking Risk in a Massive Concrete Foundation Slab: Comparison of Analytical and Numerical Prediction Models with on-Site Measurements. Constr. Build. Mater. 2021, 301, 124135. [Google Scholar] [CrossRef]
  4. Al-Kheetan, M.J.; Al-Tarawneh, M.; Ghaffar, S.H.; Chougan, M.; Jweihan, Y.S.; Rahman, M.M. Resistance of Hydrophobic Concrete with Different Moisture Contents to Advanced Freeze–Thaw Cycles. Struct. Concr. 2021, 22, E1050–E1061. [Google Scholar] [CrossRef]
  5. Ridengaoqier, E.; Hatanaka, S.; Palamy, P.; Kurita, S. Experimental Study on the Porosity Evaluation of Pervious Concrete by Using Ultrasonic Wave Testing on Surfaces. Constr. Build. Mater. 2021, 300, 123959. [Google Scholar] [CrossRef]
  6. Akarsh, P.K.; Marathe, S.; Bhat, A.K. Influence of Graphene Oxide on Properties of Concrete in the Presence of Silica Fumes and M-Sand. Constr. Build. Mater. 2021, 268, 121093. [Google Scholar] [CrossRef]
  7. Ullah, M.; Imtiazi, S.B.A.; Khushnood, R.A.; Pervaiz, E.; Ahmed, W.; Ullah, A.; Qureshi, Z.A. Synthesis, Characterization and Application of Graphene Oxide in Self Consolidating Cementitious Systems. Constr. Build. Mater. 2021, 296, 123623. [Google Scholar] [CrossRef]
  8. Son, D.-H.; Hwangbo, D.; Suh, H.; Bae, B.-I.; Bae, S.; Choi, C.-S. Mechanical Properties of Mortar and Concrete Incorporated with Concentrated Graphene Oxide, Functionalized Carbon Nanotube, Nano Silica Hybrid Aqueous Solution. Case Stud. Constr. Mater. 2023, 18, e01603. [Google Scholar] [CrossRef]
  9. Bheel, N.; Mohammed, B.S.; Abdulkadir, I.; Liew, M.S.; Zawawi, N.A.W.A. Effects of Graphene Oxide on the Properties of Engineered Cementitious Composites: Multi-Objective Optimization Technique Using RSM. Buildings 2023, 13, 2018. [Google Scholar] [CrossRef]
  10. Devi, S.C.; Khan, R.A. Effect of Graphene Oxide on Mechanical and Durability Performance of Concrete. J. Build. Eng. 2020, 27, 101007. [Google Scholar] [CrossRef]
  11. Khan, K.; Johari, M.A.M.; Amin, M.N.; Iqbal, M. Evaluation of the Mechanical Properties, Microstructure, and Environmental Impact of Mortar Incorporating Metakaolin, Micro and Nano-Silica. Case Stud. Constr. Mater. 2024, 20, e02699. [Google Scholar] [CrossRef]
  12. Liu, J.; Chen, S.; Liu, Y.; Zhao, B. Progress in Preparation, Characterization, Surface Functional Modification of Graphene Oxide: A Review. J. Saudi Chem. Soc. 2022, 26, 101560. [Google Scholar] [CrossRef]
  13. Hong, X.; Lee, J.C.; Qian, B. Mechanical Properties and Microstructure of High-Strength Lightweight Concrete Incorporating Graphene Oxide. Nanomaterials 2022, 12, 833. [Google Scholar] [CrossRef]
  14. Reddy, P.V.R.K.; Ravi Prasad, D.R. A Study on Workability, Strength and Microstructure Characteristics of Graphene Oxide and Fly Ash Based Concrete. Mater. Today Proc. 2022, 62, 2919–2925. [Google Scholar] [CrossRef]
  15. Luo, J.; Zhou, C.; Li, W.; Chen, S.; Habibnejad Korayem, A.; Duan, W. Using Graphene Oxide to Improve Physical Property and Control ASR Expansion of Cement Mortar. Constr. Build. Mater. 2021, 307, 125006. [Google Scholar] [CrossRef]
  16. Muthu, M.S.; Xavier, S.S.J.; Ajith, P.; Anand, D.P. Preparation and Characterization Studies of Nano Graphene Oxide. Mater. Today Proc. 2022, 66, 2449–2454. [Google Scholar] [CrossRef]
  17. Somasri, M.; Narendra Kumar, B. Graphene Oxide as Nano Material in High Strength Self-Compacting Concrete. Mater. Today Proc. 2021, 43, 2280–2289. [Google Scholar] [CrossRef]
  18. Indukuri, C.S.R.; Nerella, R.; Madduru, S.R.C. Effect of Graphene Oxide on Microstructure and Strengthened Properties of Fly Ash and Silica Fume Based Cement Composites. Constr. Build. Mater. 2019, 229, 116863. [Google Scholar] [CrossRef]
  19. Rezakhani, D.; Jafari, A.H.; Hajabassi, M. Durability, Mechanical Properties and Rebar Corrosion of Slag-Based Cement Concrete Modified with Graphene Oxide. Structures 2023, 49, 678–697. [Google Scholar] [CrossRef]
  20. Devi, S.C.; Khan, R.A. Compressive Strength and Durability Behavior of Graphene Oxide Reinforced Concrete Composites Containing Recycled Concrete Aggregate. J. Build. Eng. 2020, 32, 101800. [Google Scholar] [CrossRef]
  21. Prasuna, B.; Ravella, D.P. Durability Assessment of High-Performance Concretes Containing Graphene Oxide. Mater. Today Proc. 2022, 60, 526–533. [Google Scholar] [CrossRef]
  22. Ghouchani, K.; Abbasi, H.; Najaf, E. Some Mechanical Properties and Microstructure of Cementitious Nanocomposites Containing Nano-SiO2 and Graphene Oxide Nanosheets. Case Stud. Constr. Mater. 2022, 17, e01482. [Google Scholar] [CrossRef]
  23. Lazauskas, A.; Marcinauskas, L.; Andrulevicius, M. Photothermal Reduction of Thick Graphene Oxide Multilayer Films via Direct Laser Writing: Morphology, Structural and Chemical Properties. Superlattices Microstruct. 2018, 122, 36–45. [Google Scholar] [CrossRef]
  24. Esmaeili, J.; Romouzi, V.; Kasaei, J.; Andalibi, K. An Investigation of Durability and the Mechanical Properties of Ultra-High Performance Concrete (UHPC) Modified with Economical Graphene Oxide Nano-Sheets. J. Build. Eng. 2023, 80, 107908. [Google Scholar] [CrossRef]
  25. Yan, X.; Zheng, D.; Yang, H.; Cui, H.; Monasterio, M.; Lo, Y. Study of Optimizing Graphene Oxide Dispersion and Properties of the Resulting Cement Mortars. Constr. Build. Mater. 2021, 257, 119477. [Google Scholar] [CrossRef]
  26. Yu, L.; Bai, S.; Guan, X. Effect of Graphene Oxide on Microstructure and Micromechanical Property of Ultra-High Performance Concrete. Cem. Concr. Compos. 2023, 138, 104964. [Google Scholar] [CrossRef]
  27. Maglad, A.M.; Zaid, O.; Arbili, M.M.; Ascensão, G.; Șerbănoiu, A.A.; Grădinaru, C.M.; García, R.M.; Qaidi, S.M.A.; Althoey, F.; de Prado-Gil, J. A Study on the Properties of Geopolymer Concrete Modified with Nano Graphene Oxide. Buildings 2022, 12, 1066. [Google Scholar] [CrossRef]
  28. Bheel, N.; Mohammed, B.S.; Liew, M.S.; Zawawi, N.A.W.A. Effect of Graphene Oxide as a Nanomaterial on the Durability Behaviors of Engineered Cementitious Composites by Applying RSM Modelling and Optimization. Buildings 2023, 13, 2026. [Google Scholar] [CrossRef]
  29. Yang, H.; Monasterio, M.; Cui, H.; Han, N. Experimental Study of the Effects of Graphene Oxide on Microstructure and Properties of Cement Paste Composite. Compos. Part A Appl. Sci. Manuf. 2017, 102, 263–272. [Google Scholar] [CrossRef]
  30. Li, Y.; Yang, C.; Zhang, Y.; Zheng, J.; Guo, H.; Lu, M. Study on Dispersion, Adsorption and Flow Retaining Behaviors of Cement Mortars with TPEG-Type Polyether Kind Polycarboxylate Superplasticizers. Constr. Build. Mater. 2014, 64, 324–332. [Google Scholar] [CrossRef]
  31. Wu, L.; Liu, L.; Gao, B.; Muñoz-Carpena, R.; Zhang, M.; Chen, H.; Zhou, Z.; Wang, H. Aggregation Kinetics of Graphene Oxides in Aqueous Solutions: Experiments, Mechanisms, and Modeling. Langmuir 2013, 29, 15174–15181. [Google Scholar] [CrossRef] [PubMed]
  32. Liu, C.; Hunag, X.; Wu, Y.Y.; Deng, X.; Zheng, Z.; Yang, B. Studies on Mechanical Properties and Durability of Steel Fiber Reinforced Concrete Incorporating Graphene Oxide. Cem. Concr. Compos. 2022, 130, 104508. [Google Scholar] [CrossRef]
  33. Lu, Z.; Chen, B.; Leung, C.Y.; Li, Z.; Sun, G. Aggregation Size Effect of Graphene Oxide on Its Reinforcing Efficiency to Cement-Based Materials. Cem. Concr. Compos. 2019, 100, 85–91. [Google Scholar] [CrossRef]
  34. Liu, H.; Yu, Y.; Liu, H.; Jin, J.; Liu, S. Hybrid Effects of Nano-Silica and Graphene Oxide on Mechanical Properties and Hydration Products of Oil Well Cement. Constr. Build. Mater. 2018, 191, 311–319. [Google Scholar] [CrossRef]
  35. Wang, Q.; Li, S.; Pan, S.; Guo, Z. Synthesis and Properties of a Silane and Copolymer-Modified Graphene Oxide for Use as a Water-Reducing Agent in Cement Pastes. New Carbon Mater. 2018, 33, 131–139. [Google Scholar] [CrossRef]
  36. Wang, Y.; Potemin, I.S.; Zhdanov, A.; Bogdanov, N.; Zhdanov, D.; Livshits, I. Analysis of the Visual Perception Conflicts in Designing Mixed Reality Systems. In Optical Design and Testing VIII; Wang, Y., Tatsuno, K., Kidger, T.E., Eds.; SPIE: Bellingham, WA, USA, 2018; pp. 181–194. [Google Scholar]
  37. Tiwari, S.K.; Hatui, G.; Oraon, R.; De Adhikari, A.; Nayak, G.C. Mixing Sequence Driven Controlled Dispersion of Graphene Oxide in PC/PMMA Blend Nanocomposite and Its Effect on Thermo-Mechanical Properties. Curr. Appl. Phys. 2017, 17, 1158–1168. [Google Scholar] [CrossRef]
  38. Zhao, L.; Guo, X.; Liu, Y.; Ge, C.; Chen, Z.; Guo, L.; Shu, X.; Liu, J. Investigation of Dispersion Behavior of GO Modified by Different Water Reducing Agents in Cement Pore Solution. Carbon 2018, 127, 255–269. [Google Scholar] [CrossRef]
  39. Lu, Z.; Hanif, A.; Ning, C.; Shao, H.; Yin, R.; Li, Z. Steric Stabilization of Graphene Oxide in Alkaline Cementitious Solutions: Mechanical Enhancement of Cement Composite. Mater. Des. 2017, 127, 154–161. [Google Scholar] [CrossRef]
  40. Peng, H.; Ge, Y.; Cai, C.S.; Zhang, Y.; Liu, Z. Mechanical Properties and Microstructure of Graphene Oxide Cement-Based Composites. Constr. Build. Mater. 2019, 194, 102–109. [Google Scholar] [CrossRef]
  41. Zhang, C.; Ren, L.; Wang, X.; Liu, T. Graphene Oxide-Assisted Dispersion of Pristine Multiwalled Carbon Nanotubes in Aqueous Media. J. Phys. Chem. C 2010, 114, 11435–11440. [Google Scholar] [CrossRef]
  42. Hou, D.; Lu, Z.; Li, X.; Ma, H.; Li, Z. Reactive Molecular Dynamics and Experimental Study of Graphene-Cement Composites: Structure, Dynamics and Reinforcement Mechanisms. Carbon 2017, 115, 188–208. [Google Scholar] [CrossRef]
  43. Horszczaruk, E.; Mijowska, E.; Kalenczuk, R.J.; Aleksandrzak, M.; Mijowska, S. Nanocomposite of Cement/Graphene Oxide–Impact on Hydration Kinetics and Young’s Modulus. Constr. Build. Mater. 2015, 78, 234–242. [Google Scholar] [CrossRef]
  44. Kumar, T.N.; Vardhan, K.V.; Krishna, M.H.; Nagaraja, P.V. Effect of Graphene Oxide on Strength Properties of Cementitious Materials: A Review. Mater. Today Proc. 2021, 46, 2157–2160. [Google Scholar] [CrossRef]
  45. Yan, S.; He, P.; Jia, D.; Yang, Z.; Duan, X.; Wang, S.; Zhou, Y. In Situ Fabrication and Characterization of Graphene/Geopolymer Composites. Ceram. Int. 2015, 41, 11242–11250. [Google Scholar] [CrossRef]
  46. Lv, S.; Ma, Y.; Qiu, C.; Sun, T.; Liu, J.; Zhou, Q. Effect of Graphene Oxide Nanosheets of Microstructure and Mechanical Properties of Cement Composites. Constr. Build. Mater. 2013, 49, 121–127. [Google Scholar] [CrossRef]
  47. Anwar, A.; Liu, X.; Zhang, L. Nano-Cementitious Composites Modified with Graphene Oxide—A Review. Thin-Walled Struct. 2023, 183, 110326. [Google Scholar] [CrossRef]
  48. Zaid, O.; Hashmi, S.R.Z.; Aslam, F.; Abedin, Z.U.; Ullah, A. Experimental Study on the Properties Improvement of Hybrid Graphene Oxide Fiber-Reinforced Composite Concrete. Diam. Relat. Mater. 2022, 124, 108883. [Google Scholar] [CrossRef]
  49. Xie, J.; Qi, S.; Ran, Q.; Dong, L. The Preparation of a Novel Hyperbranched Antifouling Material and Application in the Protection of Marine Concrete. Materials 2022, 15, 8402. [Google Scholar] [CrossRef]
  50. Sui, Y.; Liu, S.; Ou, C.; Liu, Q.; Meng, G. Experimental Investigation for the Influence of Graphene Oxide on Properties of the Cement-Waste Concrete Powder Composite. Constr. Build. Mater. 2021, 276, 122229. [Google Scholar] [CrossRef]
  51. Yu, L.; Wu, R. Using Graphene Oxide to Improve the Properties of Ultra-High-Performance Concrete with Fine Recycled Aggregate. Constr. Build. Mater. 2020, 259, 120657. [Google Scholar] [CrossRef]
  52. Reddy, P.V.R.K.; Prasad, D.R. The Role of Graphene Oxide in the Strength and Vibration Characteristics of Standard and High-Grade Cement Concrete. J. Build. Eng. 2023, 63, 105481. [Google Scholar] [CrossRef]
  53. Fonseka, I.; Mohotti, D.; Wijesooriya, K.; Lee, C.K.; Mendis, P. Influence of Graphene Oxide on Abrasion Resistance and Strength of Concrete. Constr. Build. Mater. 2023, 404, 133280. [Google Scholar] [CrossRef]
  54. Cho, B.H.; Nam, B.H. Concrete Composites Reinforced with Graphene Oxide Nanoflake (GONF) and Steel Fiber for Application in Rigid Pavement. Case Stud. Constr. Mater. 2022, 17, e01346. [Google Scholar] [CrossRef]
  55. Cho, B.H.; Nam, B.H.; Khawaji, M. Flexural Fatigue Behaviors and Damage Evolution Analysis of Edge-Oxidized Graphene Oxide (EOGO) Reinforced Concrete Composites. Cem. Concr. Compos. 2021, 122, 104082. [Google Scholar] [CrossRef]
  56. Chintalapudi, K.; Pannem, R.M.R. Strength Properties of Graphene Oxide Cement Composites. Mater. Today Proc. 2019, 45, 3971–3975. [Google Scholar] [CrossRef]
  57. Rajesh, V.; Kumar, B.N. Influence of Nano-Structured Graphene Oxide on Strength and Performance Characteristics of High Strength Fiber Reinforced Self Compacting Concrete. Mater. Today Proc. 2022, 60, 694–702. [Google Scholar] [CrossRef]
  58. Zhao, L.; Guo, X.; Liu, Y.; Zhao, Y.; Chen, Z.; Zhang, Y.; Guo, L.; Shu, X.; Liu, J. Hydration Kinetics, Pore Structure, 3D Network Calcium Silicate Hydrate, and Mechanical Behavior of Graphene Oxide Reinforced Cement Composites. Constr. Build. Mater. 2018, 190, 150–163. [Google Scholar] [CrossRef]
  59. Sheng, K.; Li, D.; Yuan, X. Methyl Orange Assisted Dispersion of Graphene Oxide in the Alkaline Environment for Improving Mechanical Properties and Fluidity of Ordinary Portland Cement Composites. J. Build. Eng. 2021, 43, 103166. [Google Scholar] [CrossRef]
  60. Zhao, W.; Chen, Y.; Liu, Z.; Wang, L.; Li, X. Effects of Surface-Modified Coal-Bearing Metakaolin and Graphene Oxide on the Properties of Cement Mortar. Constr. Build. Mater. 2023, 372, 130796. [Google Scholar] [CrossRef]
  61. Bheel, N.; Ali, M.O.A.; Kırgız, M.S.; Shafiq, N.; Gobinath, R. Effect of Graphene Oxide Particle as Nanomaterial in the Production of Engineered Cementitious Composites Including Superplasticizer, Fly Ash, and Polyvinyl Alcohol Fiber. Mater. Today Proc. 2023. [Google Scholar] [CrossRef]
  62. Shang, Y.; Zhang, D.; Yang, C.; Liu, Y.; Liu, Y. Effect of Graphene Oxide on the Rheological Properties of Cement Pastes. Constr. Build. Mater. 2015, 96, 20–28. [Google Scholar] [CrossRef]
  63. Gholampour, A.; Valizadeh Kiamahalleh, M.; Tran, D.N.H.; Ozbakkaloglu, T.; Losic, D. From Graphene Oxide to Reduced Graphene Oxide: Impact on the Physiochemical and Mechanical Properties of Graphene–Cement Composites. ACS Appl. Mater. Interfaces 2017, 9, 43275–43286. [Google Scholar] [CrossRef] [PubMed]
  64. Pan, Z.; He, L.; Qiu, L.; Korayem, A.H.; Li, G.; Zhu, J.W.; Collins, F.; Li, D.; Duan, W.H.; Wang, M.C. Mechanical Properties and Microstructure of a Graphene Oxide-Cement Composite. Cem. Concr. Compos. 2015, 58, 140–147. [Google Scholar] [CrossRef]
  65. Chougan, M.; Marotta, E.; Lamastra, F.R.; Vivio, F.; Montesperelli, G.; Ianniruberto, U.; Bianco, A. A Systematic Study on EN-998-2 Premixed Mortars Modified with Graphene-Based Materials. Constr. Build. Mater. 2019, 227, 116701. [Google Scholar] [CrossRef]
  66. ASTM C39/C39M-18; Standard Test Method for Compressive Strength of Cylindrical Concrete Specimens. American Society for Testing Materials ASTM: West Conshohocken, PA, USA, 2018.
  67. ASTM C496/C496M-17; Standard Test Method for Splitting Tensile Strength of Cylindrical Concrete Specimens. American Society for Testing Materials ASTM: West Conshohocken, PA, USA, 2017.
  68. ASTM C293/C293M-16; Standard Test Method for Flexural Strength of Concrete (Using Simple Beam with Center-Point Loading). American Society for Testing Materials ASTM: West Conshohocken, PA, USA, 2016.
  69. ASTM C469/C469M; Standard Test Method for Static Modulus of Elasticity and Poisson’s Ratio of Concrete in Compression. American Society for Testing Materials ASTM: West Conshohocken, PA, USA, 2014.
  70. ASTM E1131-20; Standard Test Method for Compositional Analysis by Thermo-gravimetry. American Society for Testing Materials ASTM: West Conshohocken, PA, USA, 2020.
  71. ASTM D3418-21; Standard Test Method for Transition Temperatures of Polymers by Differential Scanning Calorimetry (DSC). American Society for Testing Materials ASTM: West Conshohocken, PA, USA, 2021.
  72. ASTM E1252-98(2021); Standard Practice for General Techniques for Obtaining Infrared Spectra for Qualitative Analysis. American Society for Testing Materials ASTM: West Conshohocken, PA, USA, 2021.
  73. ASTM C1723-16(2021); Standard Guide for Examination of Hardened Concrete Using Scanning Electron Microscopy. American Society for Testing Materials ASTM: West Conshohocken, PA, USA, 2021.
  74. UNE-EN 13925-1:2006; Non-Destructive Testing—X-ray Diffraction from Polycrystalline and Amorphous Materials—Part 1: General Principles. AENOR: Madrid, Spain, 2006.
  75. Zhang, R.; Long, Z.; Long, G.; Wang, J.; Wang, X.; Zhang, X.; Jiang, Y. Mechanism of Graphene Oxide Concrete Macro-Micro Properties Evolution under Large Temperature Difference Freeze-Thaw Action. Constr. Build. Mater. 2024, 415, 135019. [Google Scholar] [CrossRef]
  76. Del Giudice, F.; Shen, A.Q. Shear Rheology of Graphene Oxide Dispersions. Curr. Opin. Chem. Eng. 2017, 16, 23–30. [Google Scholar] [CrossRef]
  77. Mokoena, L.S.; Mofokeng, J.P. Synthesis and Characterization of Graphene Oxide (GO) for the Removal of Lead Ions in Water. Carbon Trends 2024, 15, 100339. [Google Scholar] [CrossRef]
  78. Reshma, R.P.; Abishek, N.S.; Gopalakrishna, K.N. Synthesis and Characterization of Graphene Oxide, Tin Oxide, and Reduced Graphene Oxide-Tin Oxide Nanocomposites. Inorg. Chem. Commun. 2024, 165, 112451. [Google Scholar] [CrossRef]
  79. Bentedlaouti, K.; Belouatek, A.; Kebaili, N. Antibacterial and Antioxidant Activities of Graphene and Graphene Oxide Synthesis Coated Silver Nanoparticules. J. Cryst. Growth 2024, 627, 127527. [Google Scholar] [CrossRef]
  80. Doğruyol, M.; Ayhan, E.; Karaşin, A. Effect of Waste Steel Fiber Use on Concrete Behavior at High Temperature. Case Stud. Constr. Mater. 2024, 20, e03051. [Google Scholar] [CrossRef]
  81. Ezzati, H.R.; Rahmani, H. Sulfuric Acid Attack Neutralizing through Carbonation Curing of Hydrated Lime-Modified Concretes. Constr. Build. Mater. 2024, 417, 135130. [Google Scholar] [CrossRef]
  82. Al-Shwaiter, A.; Awang, H. Effect of Elevated Temperatures on Strength and Microstructural Characteristics of Foam Concrete Containing Palm Oil Fuel Ash as Sand Replacement. Constr. Build. Mater. 2023, 376, 131052. [Google Scholar] [CrossRef]
  83. Meftah, H.; Arabi, N. Effects of Elevated Temperatures’ Exposure on the Properties of Concrete Incorporating Recycled Concrete Aggregates. Constr. Build. Mater. 2024, 411, 134612. [Google Scholar] [CrossRef]
Figure 1. Schematic representation of the experimental study.
Buildings 15 01082 g001
Figure 2. Dispersion of GO: (a) mixing GO with water in the magnetic stirrer; (b) ultrasonic cleaner programmed for 27 min to disperse GO with water; (c) addition of percentages of plasticizer after GO dispersion; (d) resulting aqueous solution of GO with plasticizer.
Buildings 15 01082 g002
Figure 3. Mechanical tests on reference concrete and modified concrete with additions of 0.05%, 0.10%, 0.15%, and 0.20% graphene oxide: (a) compressive strength test of cylindrical concrete specimens (f′c); (b) Splitting Tensile Strength of Cylindrical Concrete Specimens (ft); (c) Flexural Strength of Concrete (Using Simple Beam with Center-Point Loading) (fr); (d) Static Modulus of Elasticity Test for Concrete in Compression (Ec).
Buildings 15 01082 g003aBuildings 15 01082 g003b
Figure 4. Comparison of compressive strength results of concrete (f′c) (kg/cm2).
Buildings 15 01082 g004
Figure 5. Comparison of indirect tensile strength of concrete (ft) (kg/cm2).
Buildings 15 01082 g005
Figure 6. Comparison of flexural strength of concrete (fr) (kg/cm2).
Buildings 15 01082 g006
Figure 7. Comparison of flexural strength of concrete (Ec) (kg/cm2).
Buildings 15 01082 g007
Figure 8. Thermal degradation and mass loss: (a) results of simultaneous thermal analysis (DSC/TGA) in N2 atmosphere of GO; (b) results of simultaneous thermal analysis (DSC/TGA) in N2 atmosphere of the reference concrete sample; (c) results of simultaneous thermal analysis (DSC/TGA) in N2 atmosphere of the reference concrete sample + 0.05% GO.
Buildings 15 01082 g008
Figure 9. Absorbance units and absorption bands: (a) FTIR spectrum of the reference sample; (b) FTIR spectrum of the reference sample with 0.05% GO; (c) comparison of the FTIR spectra of the reference sample and the sample with 0.05% GO.
Buildings 15 01082 g009
Figure 10. Morphological and compositional analysis: (a) SEM-prepared samples after gold thin film deposition; (b) characteristic pore and crack dimensions in the reference concrete sample; (c) characteristic pore and crack dimensions in the reference concrete sample with 0.05% GO.
Buildings 15 01082 g010
Figure 11. Morphological analysis and distribution of energy-dispersive spectroscopy (EDS) points in reference and modified samples with 0.05% GO: (a) distribution of EDS analysis points (P1, P2, and P3) in the reference concrete sample; (b) distribution of EDS analysis points (P4, P5, and P6) in the reference concrete sample; (c) distribution of EDS analysis points (P7, P8, P9, and P10) in the reference concrete sample + 0.05% GO; (d) distribution of EDS analysis points (P11 and P12) in the reference concrete sample + 0.05% GO.
Buildings 15 01082 g011
Figure 12. Microstructure morphology in reference and 0.05% GO-modified Samples: (a) microstructure of the reference sample: formation of CSH and Ca(OH)2; (b) microstructure of the reference sample: formation of CSH, AFt, and Ca(OH)2; (c) microstructure of the 0.05% GO-modified sample: presence of CSH and AFt; (d) microstructure of the 0.05% GO-modified sample: formation of CSH, AFt, and Ca(OH)2; (e) microstructure of the 0.05% GO-modified sample: formation of CSH and Ca(OH)2.
Buildings 15 01082 g012aBuildings 15 01082 g012b
Table 1. Physical and chemical characterization of graphene oxide in this study and previous studies.
ResearchersDiameter Size (μm)Thickness Size (ηm)% Carbon% Oxygen% Sulfur
This study~20≤563.4035.491.11
Sui et al. [50]10–503.4–7.06040<5
Yu and Wu [51]0.2–10~146501.5
Yang et al. [29]2–30.55–3.067.4031.200
Esmaeili et al. [24]3–50.3–246.5345.313.9
Reddy and Prasad [52]5–100.8–273.0226.540
Table 2. Graphene oxide bulk density in this study and previous studies.
ResearchersBulk Compacted Density
This study1.34 g/cm3
Prasuna and Ravella [21] 1.71 g/cm3
Fonseka et al. [53] 0.53 g/cm3
Cho and Nam [54] 1 g/cm3
Cho et al. [55] 1 g/cm3
Table 3. Purity of graphene oxide in this study and in previous studies.
ResearchersPureza
This study>97
Prasuna and Ravella [21]99.9
Sui et al. [50]>90
Yu and Wu [51]>98
H. Yang et al. [29]>97
Reddy and Prasad [52]99
Chintalapudi and Pannem [56]>99
Yan et al. [25]>97
Table 4. Influence of graphene oxide addition on the reduction in concrete workability according to different studies.
ResearchersReference Concrete Slump (mm)Highest GO Addition (%)Reference Concrete Slump Con GO (mm)Reduction in Workability (%)
Rajesh et al. [57]7200.075%60016.67
Sui et al. [50]2100.05%17019.05
Fonseka et al. [53]1550.08%3080.65
Devi and Khan [10]1000.08%955.00
Table 5. Optimum dosage of superplasticizer in graphene oxide concrete mixes according to several studies.
ResearchersWater/Cement RatioGO Percentage with Best PerformanceSuperplasticizer Percentage by Cement Weight (%)
Ullah et al. [7]0.450.050.55
L. Zhao et al. [58]0.500.200.22
Sheng et al. [59]0.370.030.30
C. Liu et al. [32]0.470.050.83
Somasri and Kumar [17]0.340.100.91
Rajesh and Kumar [57]0.280.0751.14
Akarsh et al. [6]0.350.150.60
Yang et al. [29]0.400.200.28
Table 6. Experimental evaluation of the percentage of plasticizer and its influence on the workability of graphene oxide concrete with 0.20% GO by weight of cement.
SampleGO PercentagePlasticizer PercentageSlump Results (inches)Slump Results (cm)
10.20%0.00%0.3941 cm
20.20%0.70%0.5911.5 cm
30.20%0.90%1.5754 cm
40.20%1.10%3.0717.8 cm
Table 7. Concentrations of graphene oxide in aqueous solution reported in the literature.
ResearchersGO Concentration in Water
This study5 mg/mL
Akarsh et al. [6]7 mg/mL
Chintalapudi and Pannem [56]1–30 mg/mL
Zhao et al. [60]4 mg/mL
Reddy and Prasad [52]6 mg/mL
Bheel et al. [61]4 mg/mL
Table 8. Magnetic stirring parameters for graphene oxide dispersion according to several studies.
ResearchersMagnetic Stirrer or Mixer Speed (rpm)Time (min)Total Revolutions
Yang et al. [29]300154500
Akarsh et al. [6]100077000
Yan et al. [25]400156000
Table 9. Power and time of ultrasonication used in graphene oxide dispersion according to previous studies.
ResearchersUltrasonic Wave Dispersion Power (W)Time (min)
Devi and Khan [10]50030
Yang et al. [29]39030
Yan et al. [25]65030
Table 10. Optimum percentage of graphene oxide (GO) for the improvement of compressive strength according to different studies.
Researchers)GO Percentage (%)Optimal GO
Percentage (%)
Compressive Strength Improvement (%)
Ullah et al. [7]0.01, 0.03, 0.050.0557
Zhao et al. [58]0.05, 0.10, 0.20, 0.300.1015.48
Shang et al. [62]0.02, 0.04 0.060.0415.1
Gholampour et al. [63]0.1, 0.15, 0.2, 0.3, 0.40.177.7
Pan et al. [64]0.050.0533
Liu et al. [32]0.01, 0.03, 0.05, 0.070.0520.1
Somasri and Narendra [17]0.02, 0.04, 0.06, 0.08, 0.10.117.38
Akarsh et al. [6]0.05, 0.10, 0.15, 0.200.1529.54
Yang et al. [29]0.10, 0.15, 0.20.211.2
Chougan et al. [65] 0.01, 0.1, 0.20.210
Table 11. Degradation resistance of coarse aggregates in the Palomino-Parcona quarry.
Aggregate SourceMaximum Nominal SizeAggregate GradationInitial Mass Mass Retained on Sieve No. 12Percentage of Wear (Passing Sieve No. 12)
Palomino-Parcona1/2”B5000432613.48%
Table 12. Quantities of aggregates used in the mechanical strength and modulus of elasticity tests for different specimens and beams of the control sample and its variants with 0.10%, 0.15%, and 0.20% of GO.
TestSamplesCement (kg)Fine Agg. (kg)Coarse Agg. (kg)Water (L)Plasticizer (mL)GO (g)
Compressive Strength, Cylindrical Specimens (10 cm × 20 cm)AReference Concrete (CR)7.2812.2013.553.3466.740.00
BCR + 0.05% de GO7.2812.2013.553.3466.743.64
CCR + 0.10% de GO7.2812.2013.553.3466.747.28
DCR + 0.15% de GO7.2812.2013.553.3466.7410.92
ECR + 0.20% de GO7.2812.2013.553.3466.7414.56
Indirect Tensile Strength, Cylindrical Specimens (10 cm × 20 cm)AReference Concrete (CR)5.108.549.482.3446.720.00
BCR + 0.05% de GO5.108.549.482.3446.722.55
CCR + 0.10% de GO5.108.549.482.3446.725.10
DCR + 0.15% de GO5.108.549.482.3446.727.64
ECR + 0.20% de GO5.108.549.482.3446.7210.19
Flexural Strength, Beam Specimens (15 cm × 15 cm × 15 cm)AReference Concrete (CR)37.2362.3869.2917.10341.290.00
BCR + 0.05% de GO37.2362.3869.2917.10341.2918.62
CCR + 0.10% de GO37.2362.3869.2917.10341.2937.23
DCR + 0.15% de GO37.2362.3869.2917.10341.2955.85
ECR + 0.20% de GO37.2362.3869.2917.10341.2974.46
Elastic Modulus, Cylindrical Specimens (15 cm × 30 cm)AReference Concrete (CR)17.2028.8232.017.90157.680.00
BCR + 0.05% de GO17.2028.8232.017.90157.688.60
CCR + 0.10% de GO17.2028.8232.017.90157.6817.20
DCR + 0.15% de GO17.2028.8232.017.90157.6825.80
ECR + 0.20% de GO17.2028.8232.017.90157.6834.40
Table 13. Compressive strength results of concrete (f′c) (kg/cm2).
Graphene Oxide Addition by Cement Weight (%)Curing Age
7 Days14 Days28 Days
0.00% (reference concrete)283.4317.9367.2
0.05%320.86393.72420.83
0.10%311.3360.53403.63
0.15%308.46339.14401.94
0.20%298.71349.12397.48
Table 14. Indirect tensile strength of concrete (ft) (kg/cm2).
Graphene Oxide Addition by Cement Weight (%)Curing Age
7 Days28 Days
0.00% (reference concrete)20.0924.00
0.05%20.7826.96
0.10%23.6923.69
0.15%19.9623.47
0.20%22.1322.22
Table 15. Flexural strength of concrete (fr) (kg/cm2).
Graphene oxide Addition by Cement Weight (%)Curing Age
7 Days28 Days
0.00% (reference concrete)49.5551.08
0.05%50.6054.19
0.10%53.2153.53
0.15%44.0749.56
0.20%42.4345.64
Table 16. Modulus of elasticity of concrete (Ec) (kg/cm2).
Graphene Oxide Addition by Cement Weight (%)Curing Age
7 Days28 Days
0.00% (reference concrete)267,067.88300,983.99
0.05%319,754.00383,089.47
0.10%292,961.93356,797.82
0.15%286,162.43346,503.46
0.20%268,514.35336,725.72
Table 17. Pore and crack measurements in the reference sample without and with 0.05% GO.
IndicatorReference SampleReference Sample + 0.05% GO
Pore or crack size (µm)6.6068.224
7.941
3.7932.241
2.062
1.7481.047
1.897
1.9900.8927
6.214
3.168
Average size (µm)3.7203.1145
Table 18. Chemical composition of the reference concrete sample.
EDS PointsAtomic %
OAlSiCaOthers
P163.973.815.8114.8611.55
P261.461.319.4219.358.46
P366.685.843.2415.478.77
P465.981.297.2613.5711.9
P565.841.568.0915.159.36
P666.671.745.4610.9715.16
Average65.12.596.5514.9010.87
Table 19. Chemical composition of the reference concrete sample + 0.05% GO.
EDS PointsAtomic %
OAlSiCaOthers
P768.351.948.2117.094.41
P867.812.35.8513.7710.27
P9681.898.3218.073.72
P1071.181.572.7419.634.88
P1148.6745.429.1730.086.66
P1253.5911.392.6122.499.92
Average62.934.096.1520.196.64
Table 20. Comparative chemical composition of the reference sample and the sample with 0.05% graphene oxide (GO) based on X-ray diffraction (XRD) analysis.
Chemical CompoundsUnitReference SampleReference Sample + 0.05% GOVariation (%)
Silicon compounds%32.7859.09+26.31
Portlandite%17.3015.24−2.06
Others%17.6112.74−4.87
Amorphous%32.3112.13−20.18
Table 21. Relationship between the physicochemical properties of graphene oxide and the mechanical and microstructural characteristics of 280 kg/cm2 concrete.
PropertiesIndicatorsReference SampleSample + 0.05% GOResults
Physicochemical properties of graphene oxideDiameter size (µm) Range (0.2–50)-~20(Acceptable)
Thickness size (ηm)Range (0.3–7)-≤5(Acceptable)
Chemical composition (%)Range (46–67.40)-63.4(Acceptable)
Range (26.54–50)-35.49(Acceptable)
Range (0–5)-1.11(Acceptable)
Mass loss (%)Volatiles like water 30–280 °C-36.1(Acceptable)
Organics (GO functional groups), 280–600 °C-19.9(Acceptable)
Carbon 600–850 °C-37.9(Acceptable)
Thermal degradation (°C)1° temperature point-106 °C (−1.87%/min)Within mass loss temperature ranges
2° temperature point-161 °C (−8.08%/min)
3° temperature point-279 °C (−1.92%/min)
4° temperature point-625 °C (−13.74%/min)
Mechanical properties and microstructural characteristics of 280 kg/cm2 concreteCompressive strength (kg/cm2)28 days367.2420.83Increase of 14.61%
Indirect tensile strength (kg/cm2)28 days2426.96Increase of 12.33%
Flexural strength (kg/cm2)28 days51.0854.19Increase of 6.09%
Elastic modulus (kg/cm2)28 days300,983.99383,089.47Increase of 27.38% (significant)
Absorbance (unit)Calcium carbonate0.022710.03564Increase of 0.01293 units
Silicates0.089250.12525Increase of 0.03600 units
Aluminum hydroxide0.058980.08425Increase of 0.02527 units
Average pore and crack size (µm)Image at 10 µm3.723.1145Decrease of 16.28%
Chemical composition (%)Ca/Si ratio2.273.28Increase of 44.49%
Morphology (without unit)Image at 10 µmHydration products without defined shapesHydration products with defined shapesImproved hydration products
Chemical compounds (%)Silicon compounds32.7859.09Increase of 26.31%
Portlandite17.315.24Decrease of 2.06%
Mass loss (%)Volatiles like water, 30–250 °C6.26.8Increase of 0.6%
Volatiles like water, 30–250 °C3.94.8Increase of 0.9%
Carbonate calcium, 600–850 °C2.72.9Increase of 0.2%
Thermal degradation (°C)1° temperature point70 °C (−0.53%/min)101 °C −0.68%/minWithin mass loss temperature ranges
2° temperature point99 °C (−0.64%/min)150 °C −0.48%/min
3° temperature point151 °C (−0.39%/min)443 °C −0.54%/min
4° temperature point444 °C (−0.45%/min)723 °C −0.38%/min
5° temperature point734 °C −0.39%/min-
Disclaimer/Publisher’s Note: The statements, opinions and data contained in all publications are solely those of the individual author(s) and contributor(s) and not of MDPI and/or the editor(s). MDPI and/or the editor(s) disclaim responsibility for any injury to people or property resulting from any ideas, methods, instructions or products referred to in the content.

