

Dynamic Maintenance Cost Optimization in Data Centers: An Availability-Based Approach for K-out-of-N Systems


Abstract
1. Introduction
1.1. Literature Review
- Maintenance Management in Industrial Systems and Applications
- Advancements in Predictive Maintenance
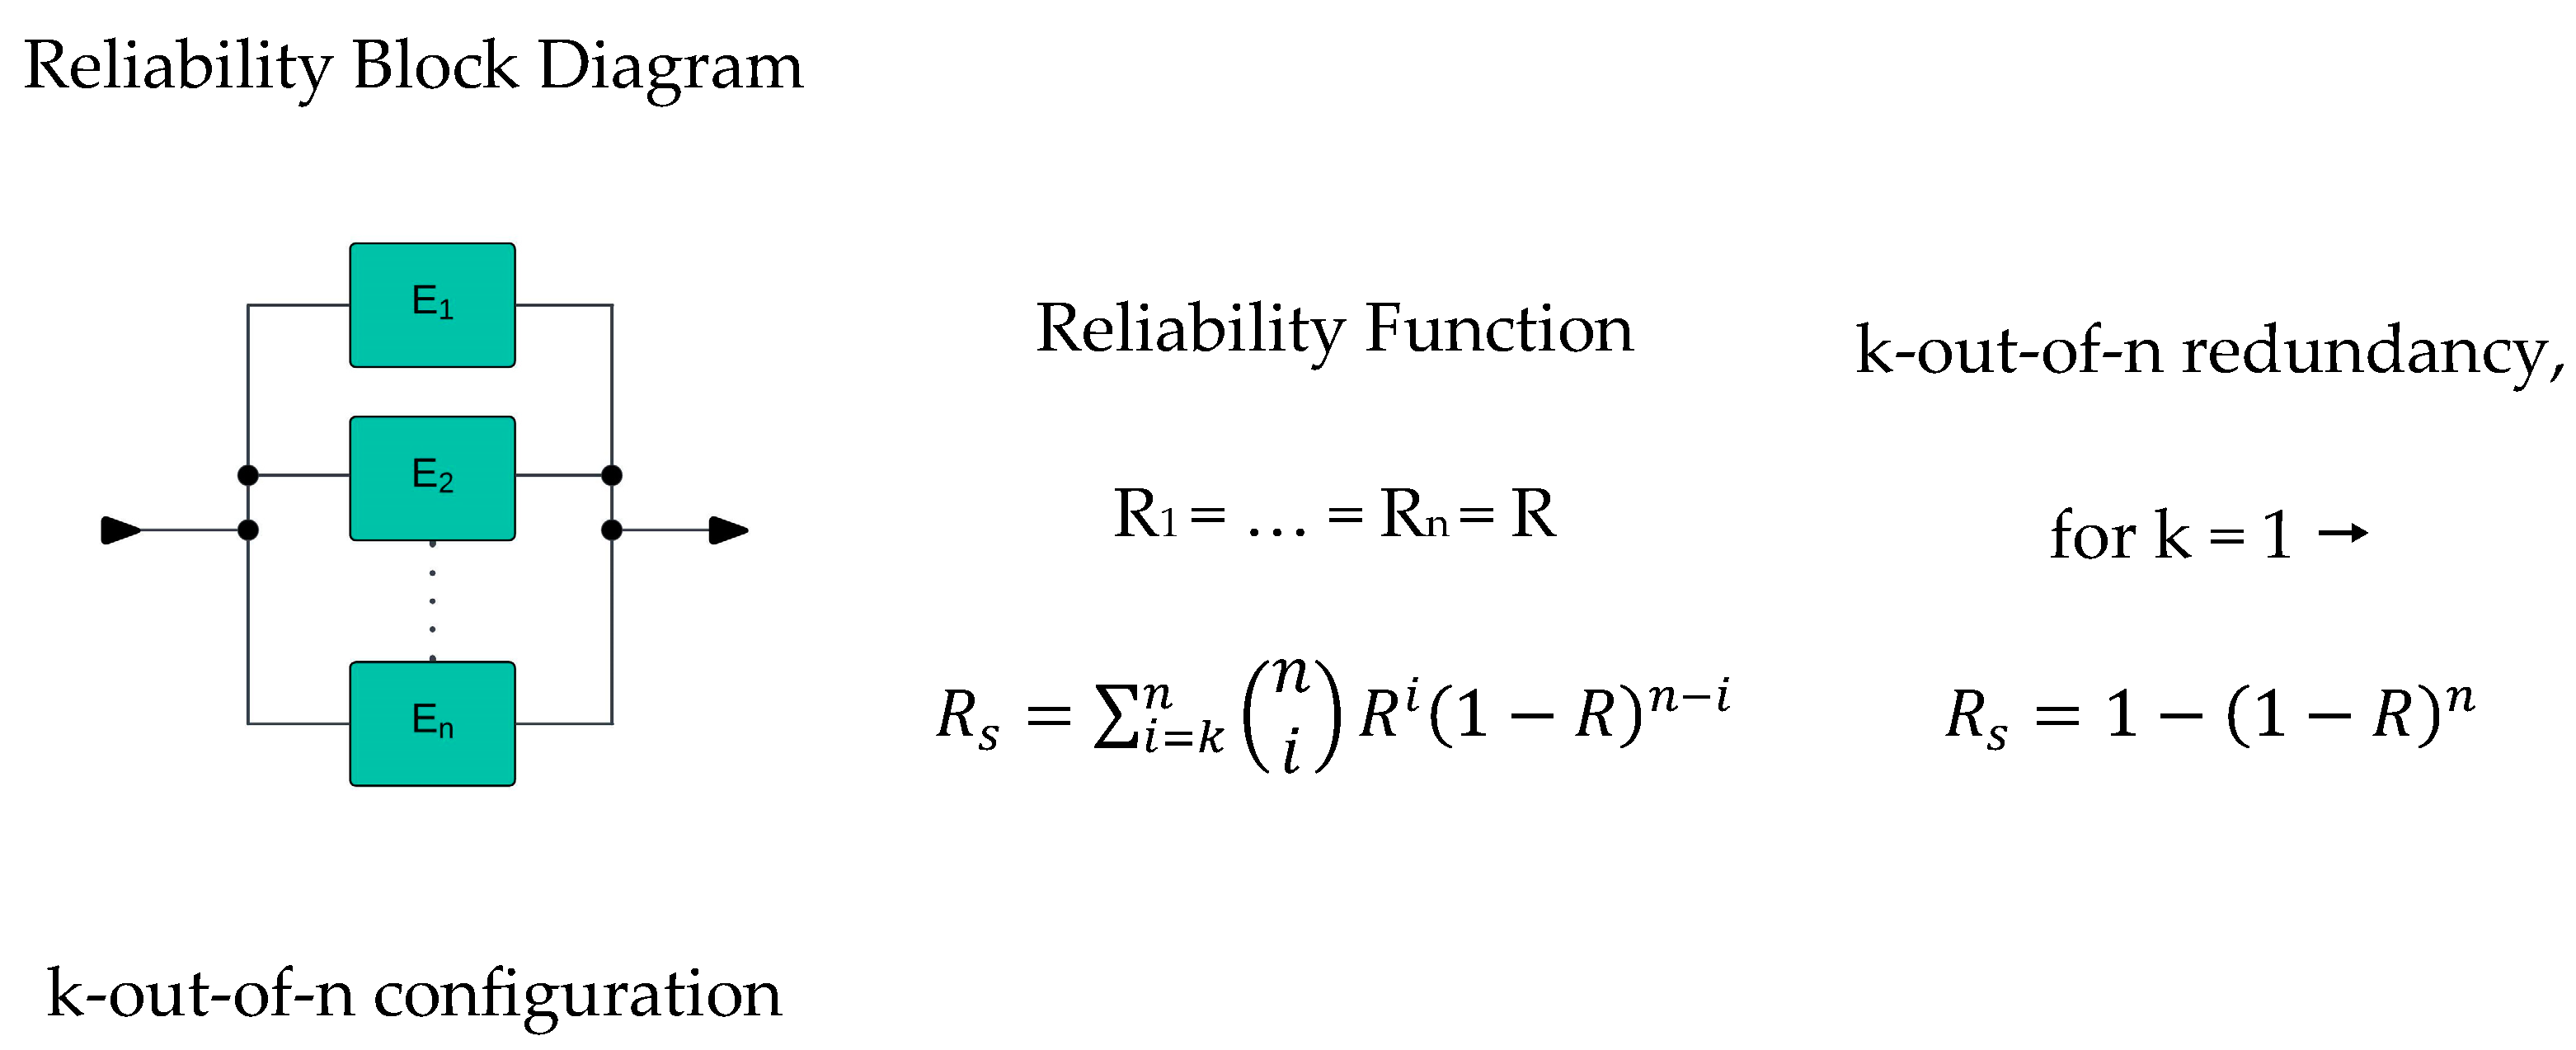
- K-out-of-N Configurations and Fault-Tolerant Frameworks
- Maintenance Optimization in K-out-of-N systems
- Maintenance Management in Data Centers
- Utilization of Dynamic Programming in maintenance management
1.2. Research Gap Analysis
1.3. Research Significance
- Integration of a practical maintenance management model tailored specifically to the components of DCs, addressing the unique challenges and requirements of this critical infrastructure.
- Development of a mathematical optimization model designed to determine optimal solutions for maintenance costs associated with specific components within DCs, considering factors such as the k-out-of-n configuration and obtaining the k optimal components of the model while accounting for specific constraints and requirements, thereby potentially reducing operational expenses and enhancing efficiency.
- Introduction of a DP approach for DC maintenance management, enabling the capture of the recursive and agile nature inherent to maintenance scheduling activities within these complex environments.
- Conducting reliability and availability analysis for DC components, serving as the foundation for formulating the optimization problem and ensuring the robustness of the proposed maintenance strategy.
- Incorporation of system availability constraints derived from international DC standards into the optimization (and the DP) model, thereby guaranteeing adherence to industry-specific availability requirements and thresholds, essential for maintaining uninterrupted operations in DCs.
2. Materials and Methods
2.1. Problem Formulation and Algorithm
- Ci,t represents the maintenance cost of each component at time t.
- Xi,t represents the binary variables for each component, where i ranges from 1 to n and indicates whether a specific component is chosen (1) or not chosen (0) at time t.
- Ai,t: availability of the ith component at time t, which is the probability that the component is operational at time t.
- At,Required: the required system availability threshold at the time, which represents the minimum acceptable level of system availability required for the system to meet its operational objectives.
2.1.1. Model’s Parameters
- Reliability and Failure Rate
- System’s Availability
- Maintenance Costs
- Asset Condition State Index
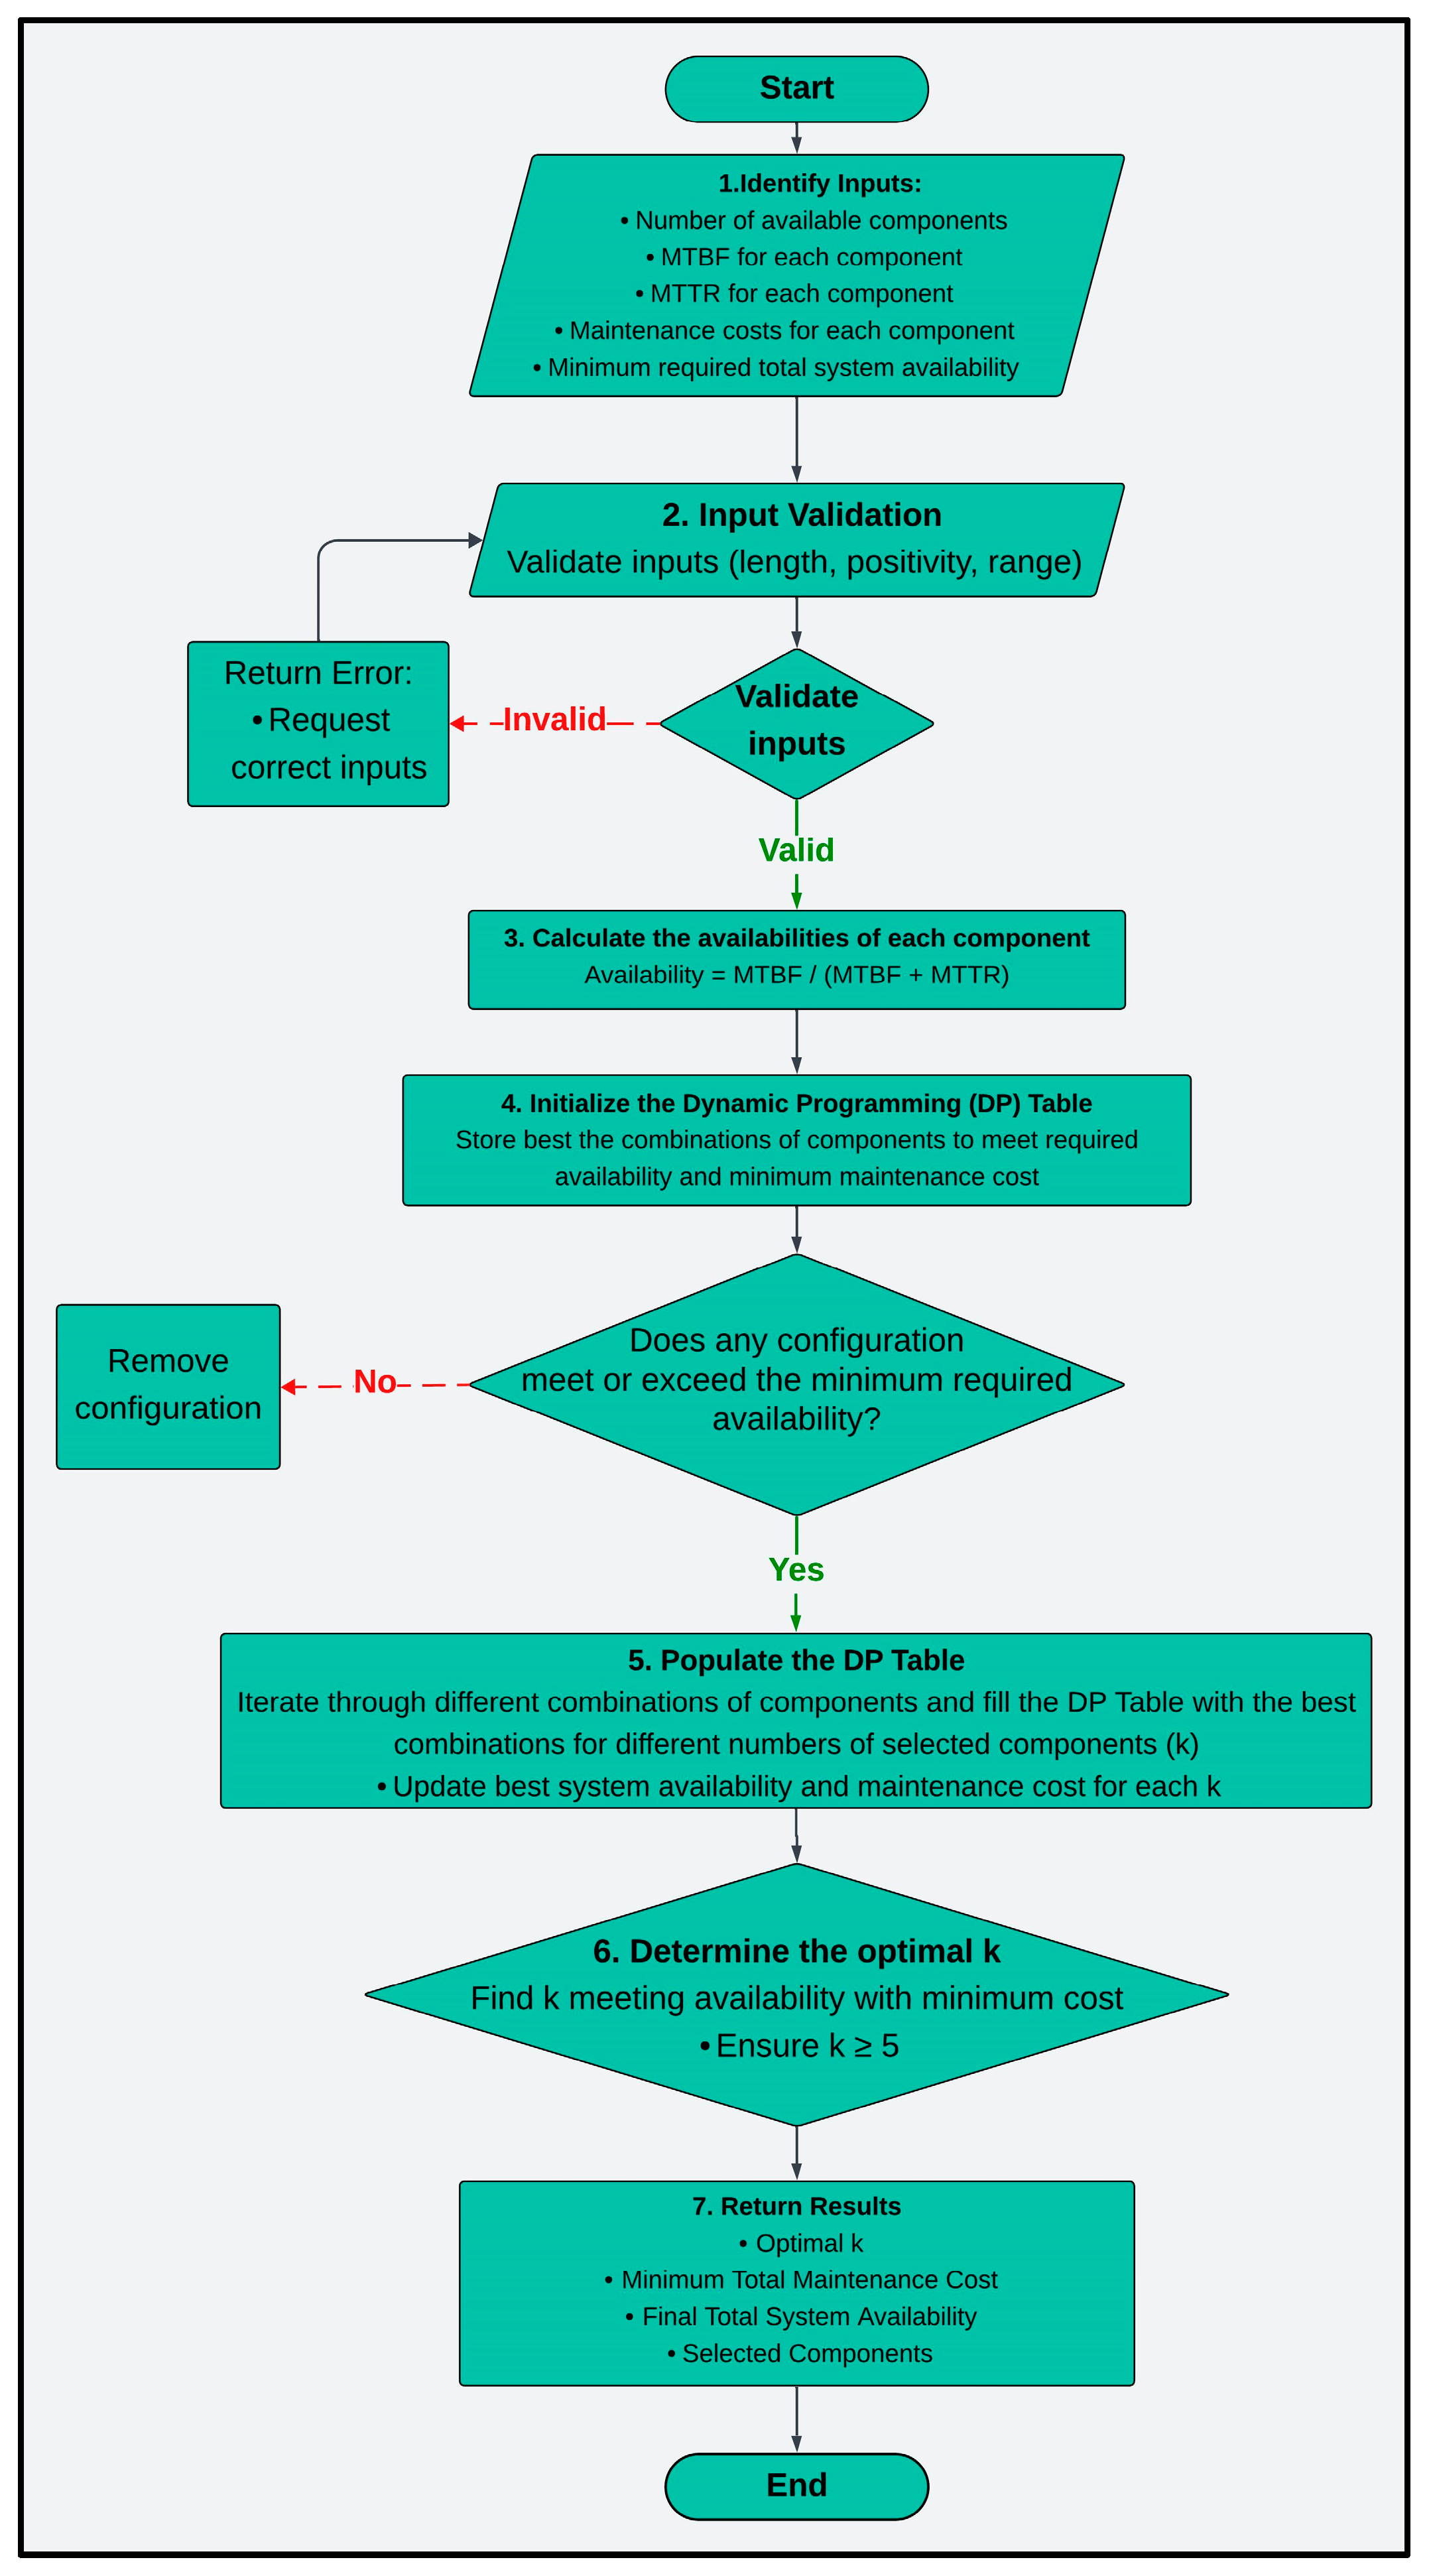
2.1.2. Dynamic Programming Approach
- System Availability: ensures the selected configuration meets or exceeds the availability threshold depending on the selected tier.
- Cost Minimization: selects the configuration with the lowest total maintenance cost while meeting minimum availability requirement.
- DP Table Initialization
- Base Cases
- Filling the DP Table
- -
- In Case 1, the current component is not chosen and dp[i][j] is updated with the minimum cost from the previous row, indicating not choosing the current component.
- -
- In Case 2, the current component is selected and if the current component is chosen (j ≤ i), the system availability is calculated.
- Obtaining the Optimal k and the Minimum Maintenance Costs
- Final Output
| Algorithm 1. Optimal UPS Component Selection. |
1: FUNCTION FindOptimumUPSCombination(components, requiredAvailability): 2: // Validate Inputs 3: FOR each component IN components: 4: IF component.MTBF ≤ 0 OR component.MTTR < 0 OR component.MaintenanceCost < 0: 5: RETURN “Error: Invalid input values.” 6: // Compute Availability for Each Component 7: FOR each component IN components: 8: component.Availability = component.MTBF/(component.MTBF + component.MTTR) 9: // Initialize DP Table 10: DPTable = Array[NumComponents][requiredAvailability + 1] filled with Infinity 11: // Check Feasibility 12: IF no valid configuration exists: 13: RETURN “Error: No valid component configuration found.” 14: // Populate DP Table 15: FOR k FROM 1 TO NumComponents: 16: FOR each combination OF components: 17: totalAvailability = ComputeTotalAvailability(combination) 18: totalCost = ComputeTotalCost(combination) 19: IF totalAvailability ≥ requiredAvailability: 20: DPTable[k][totalAvailability] = MIN(DPTable[k][totalAvailability], totalCost) 21: // Determine Optimal k 22: OptimalK = −1, MinCost = Infinity 23: FOR k FROM 5 TO NumComponents: 24: FOR j FROM requiredAvailability TO 0: 25: IF DPTable[k][j] < MinCost: 26: MinCost = DPTable[k][j] 27: OptimalK = k 28: // Output Results 29: IF OptimalK = −1: 30: RETURN “Error: Required availability cannot be met.” 31: SelectedComponents = RetrieveSelectedComponents(DPTable, OptimalK, MinCost) 32: RETURN OptimalK, MinCost, ComputeTotalAvailability(SelectedComponents), SelectedComponents 33: FUNCTION ComputeTotalAvailability(components): 34: RETURN PRODUCT(component.Availability FOR component IN components) 35: FUNCTION ComputeTotalCost(components): 36: RETURN SUM(component.MaintenanceCost FOR component IN components) 37: FUNCTION RetrieveSelectedComponents(DPTable, OptimalK, MinCost): 38: //Backtrack to retrieve selected components 39: RETURN SelectedComponents |
- Dynamic Maintenance Costs
- -
- Individual asset characteristics: Each asset in the system is characterized by its own Mean Time Between Failures (MTBF) and Mean Time To Repair (MTTR). These parameters define the asset’s failure rate and repair rate, respectively, and serve as a basis for calculating its availability and determining the impact of its failure on the overall system performance.
- -
- Dynamic availability calculation: The availability of each asset is dynamically calculated based on its MTBF and MTTR. Availability represents the probability that the asset will be operational at any given time, considering its historical failure and repair patterns.
- -
- Dynamic maintenance costs: maintenance costs are tied to the condition and reliability of each asset. As the availability of an asset changes dynamically over time, so does the associated maintenance cost. Lower availability, resulting from higher failure rates or longer repair times, leads to increased maintenance costs to restore the asset to operational status.
- -
- DP optimization: The DP approach is used to optimize maintenance costs while ensuring system availability meets specified requirements. By considering different combinations of assets and their associated maintenance costs, the DP algorithm identifies the most cost-effective configuration of assets that satisfies the availability target.
- -
- Cost-effectiveness analysis: the use of variable failure rates and dynamic maintenance costs allows for a more accurate cost-effectiveness analysis of maintenance strategies.
- Variable component aging and failure trends;
- Budget constraints and cost variations for different maintenance actions.
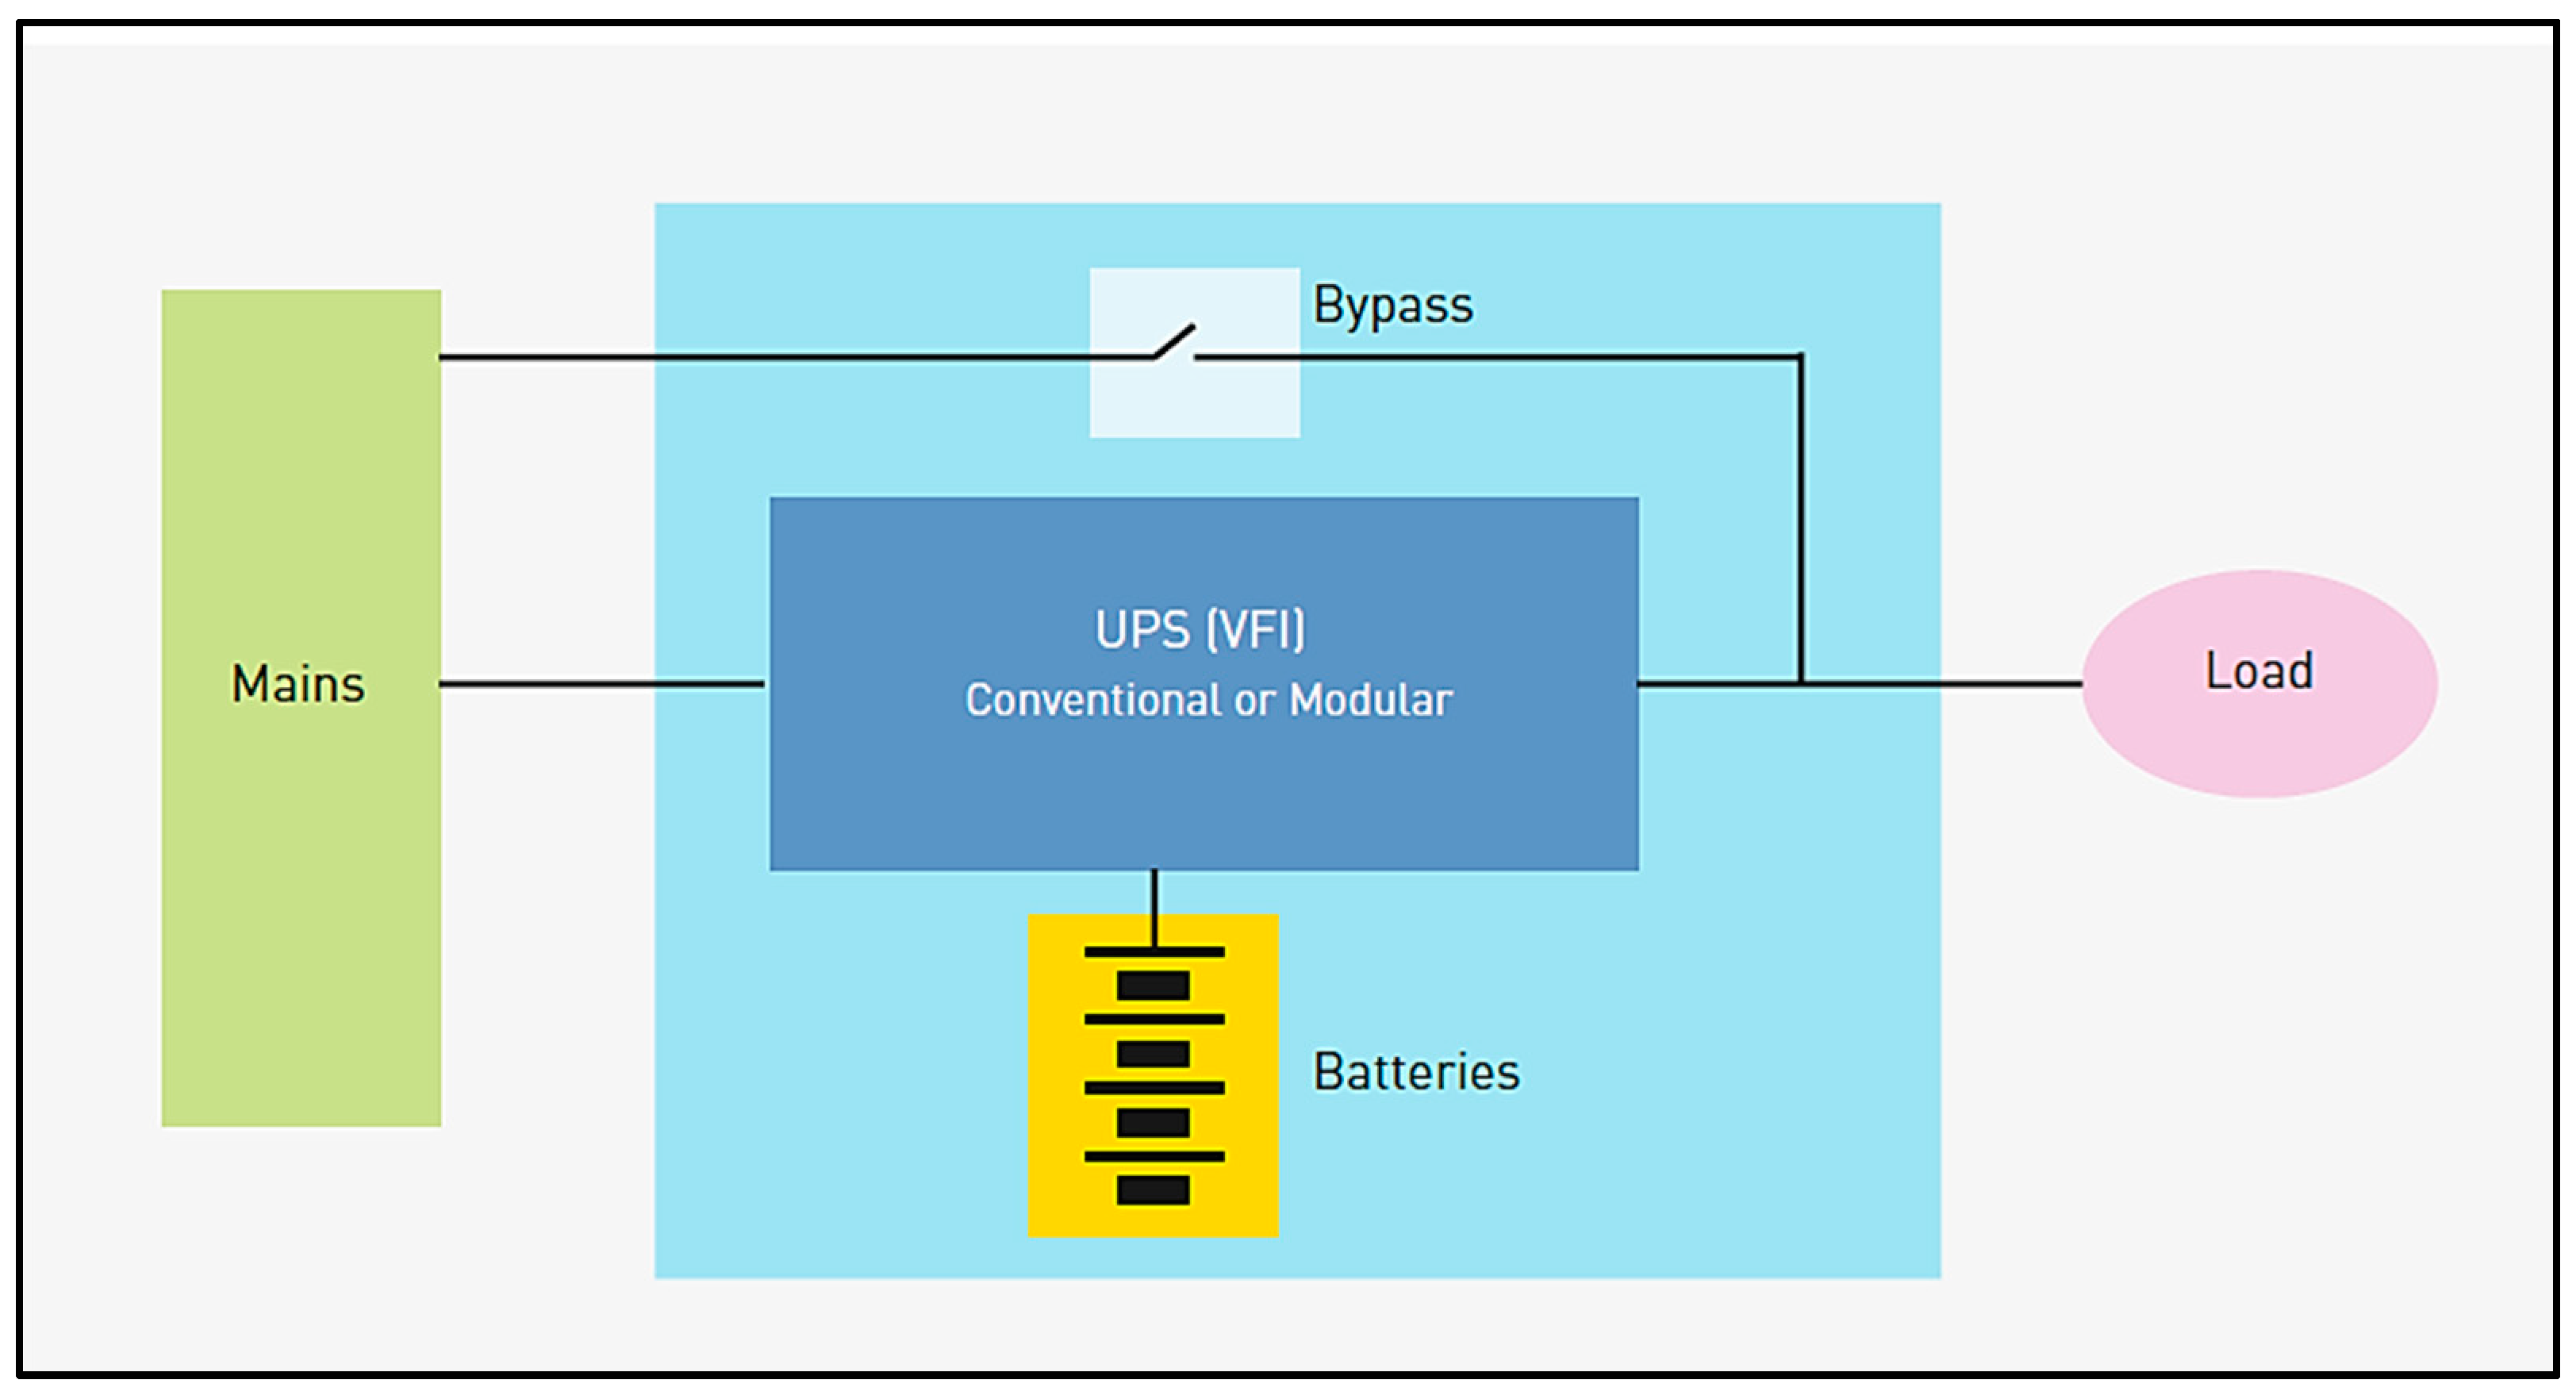
2.2. Case Study Implementation
2.2.1. System and Component Description
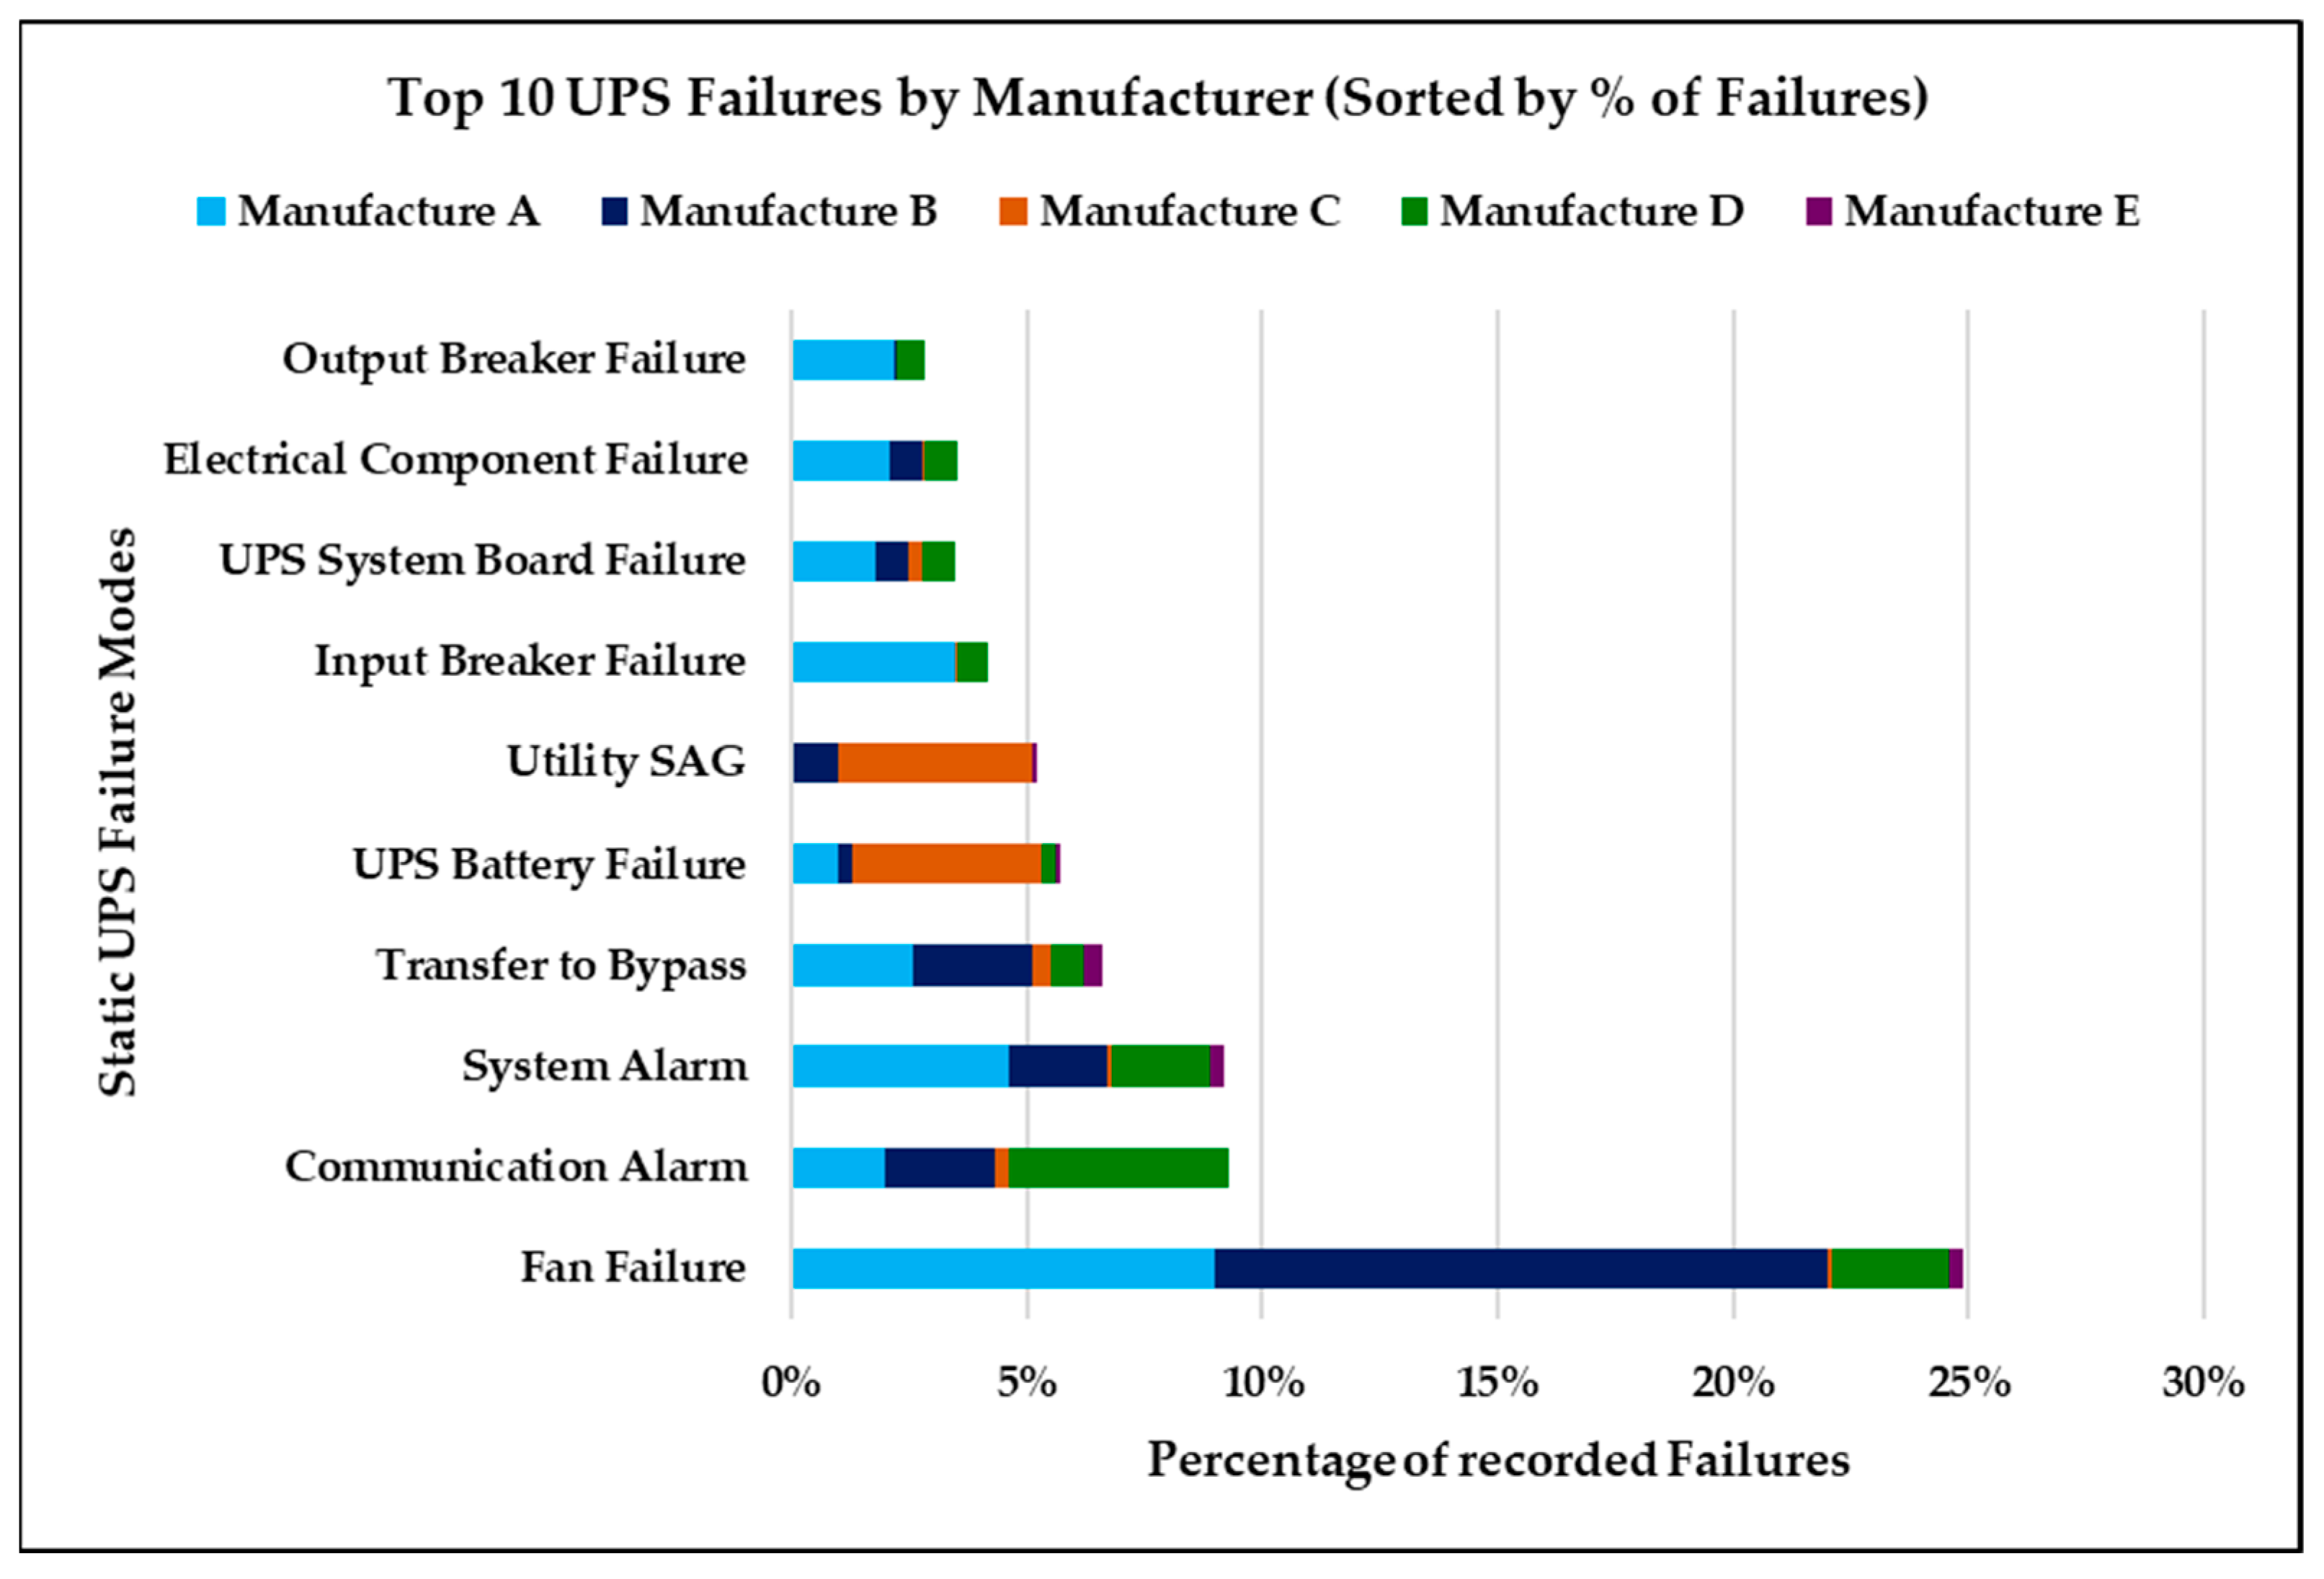
2.2.2. Failure Modes and Condition States
2.2.3. Reliability and Availability Information
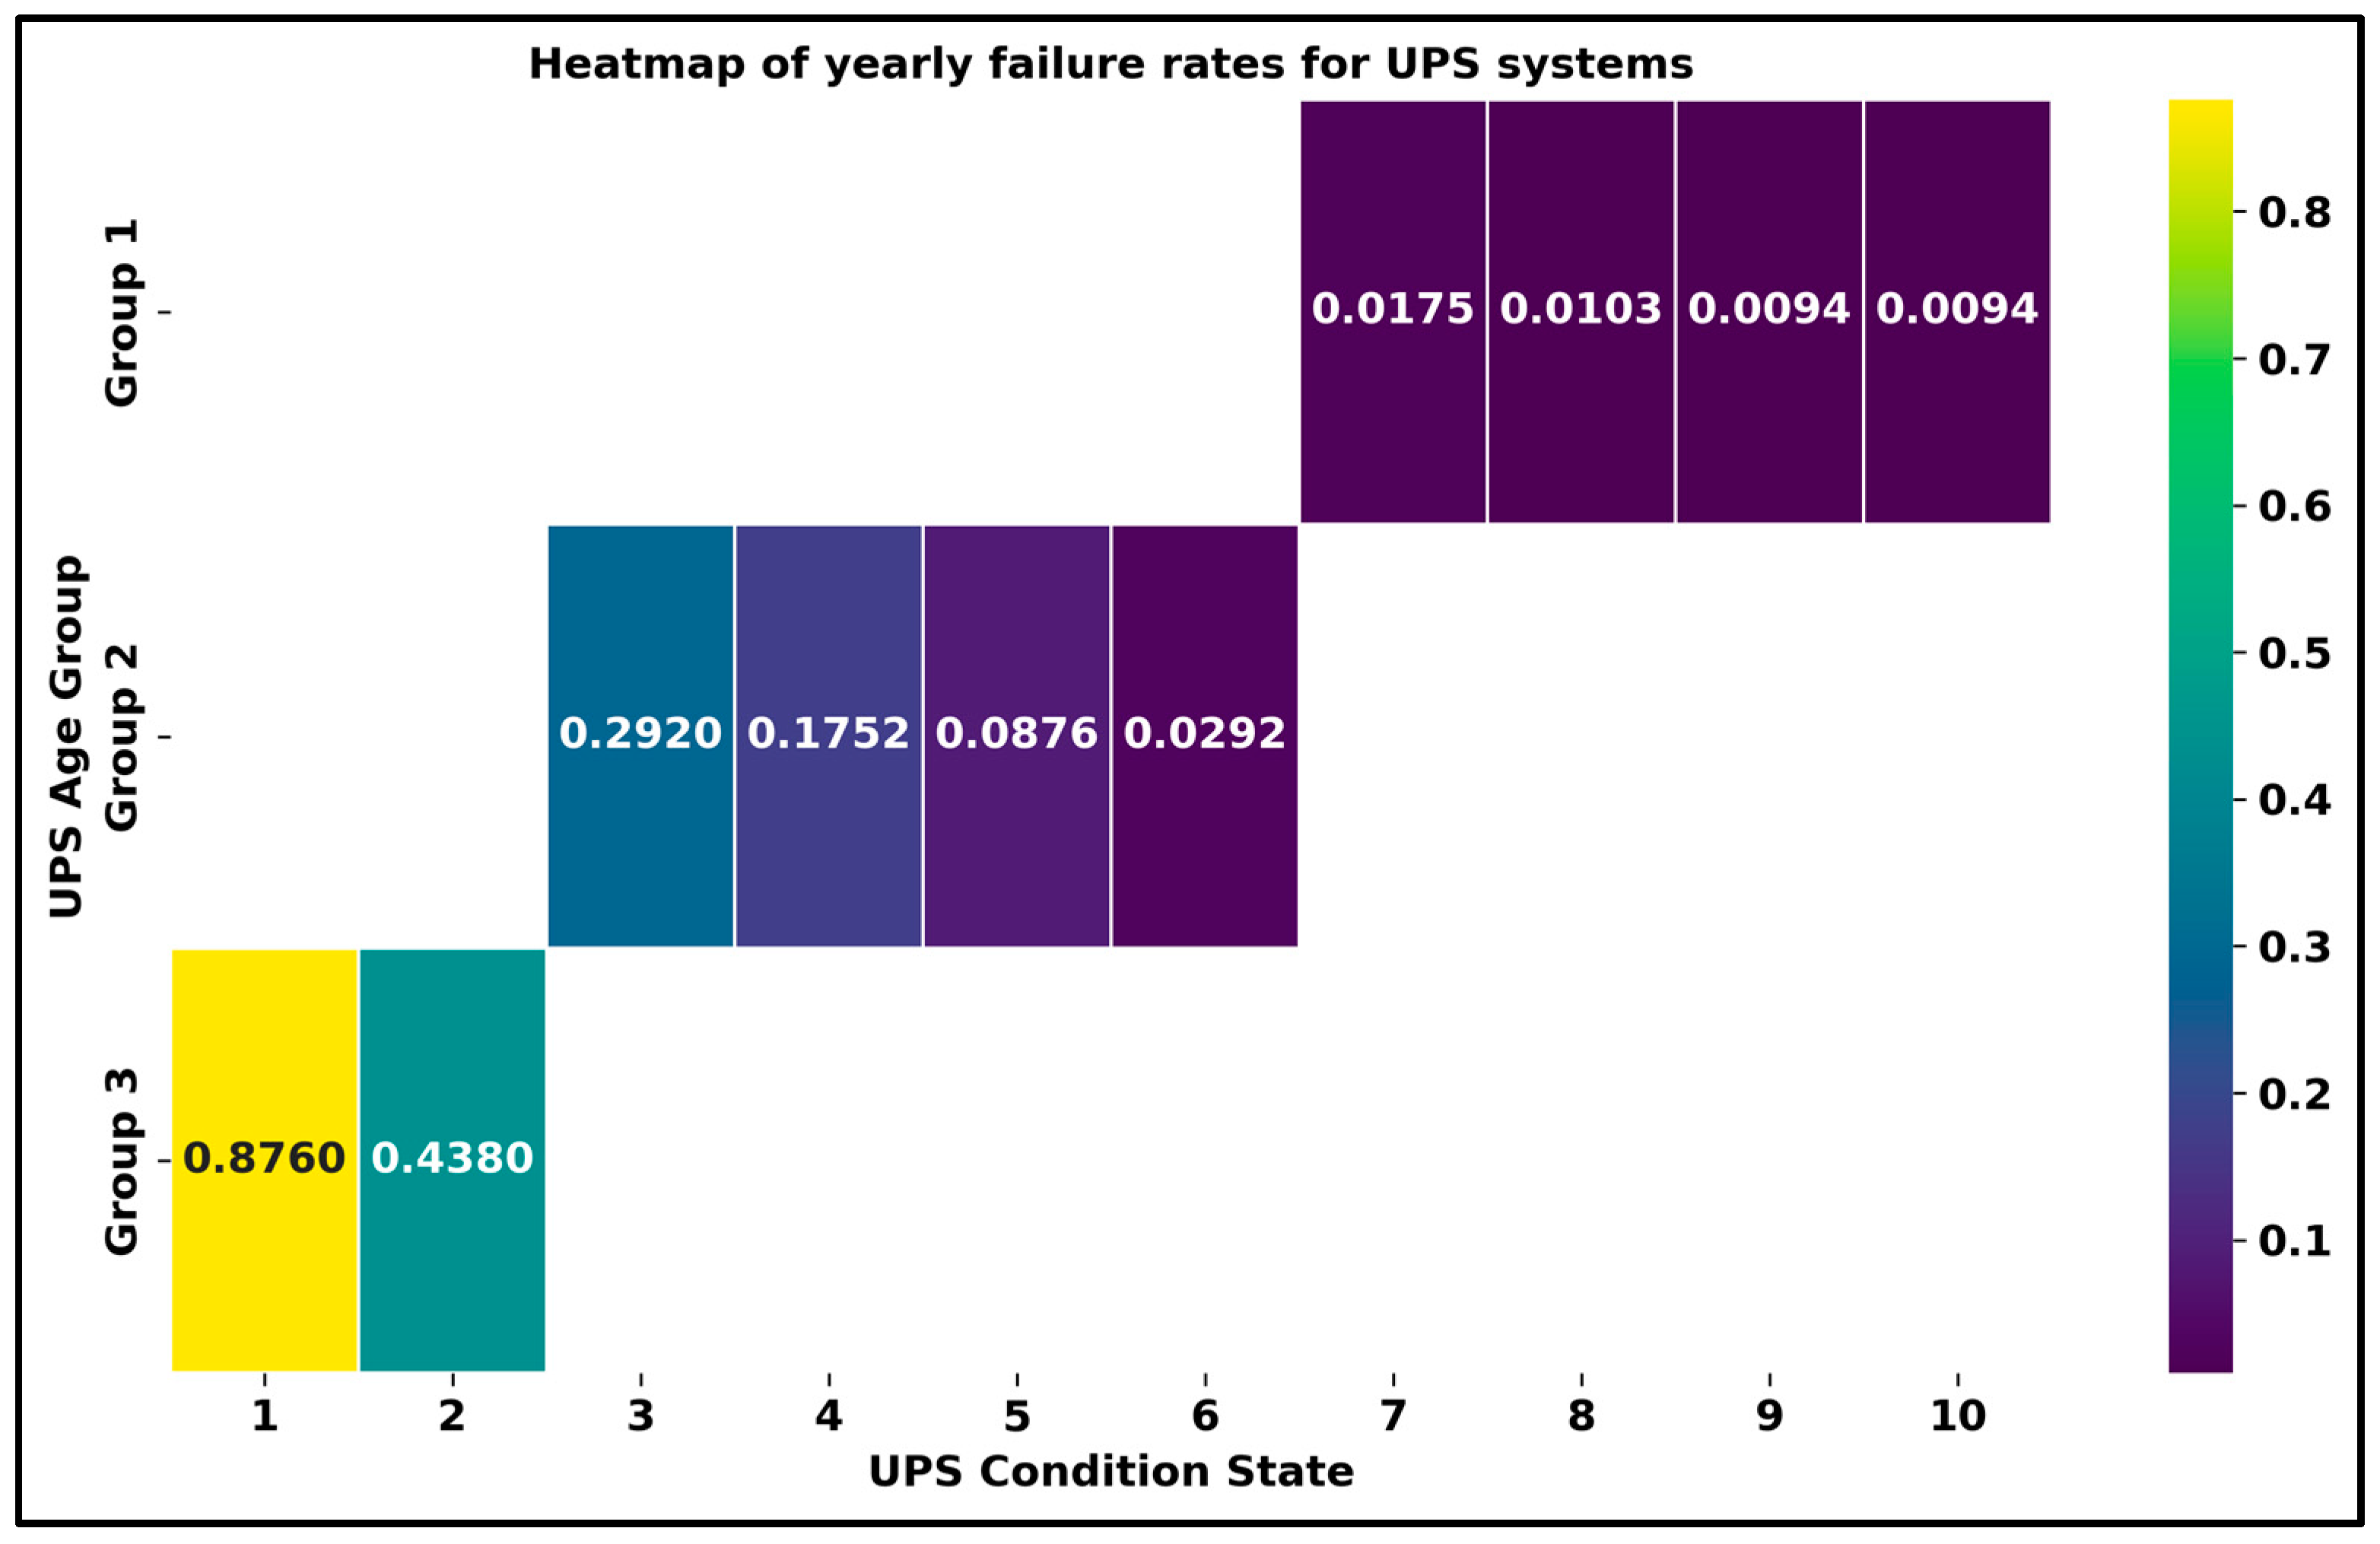
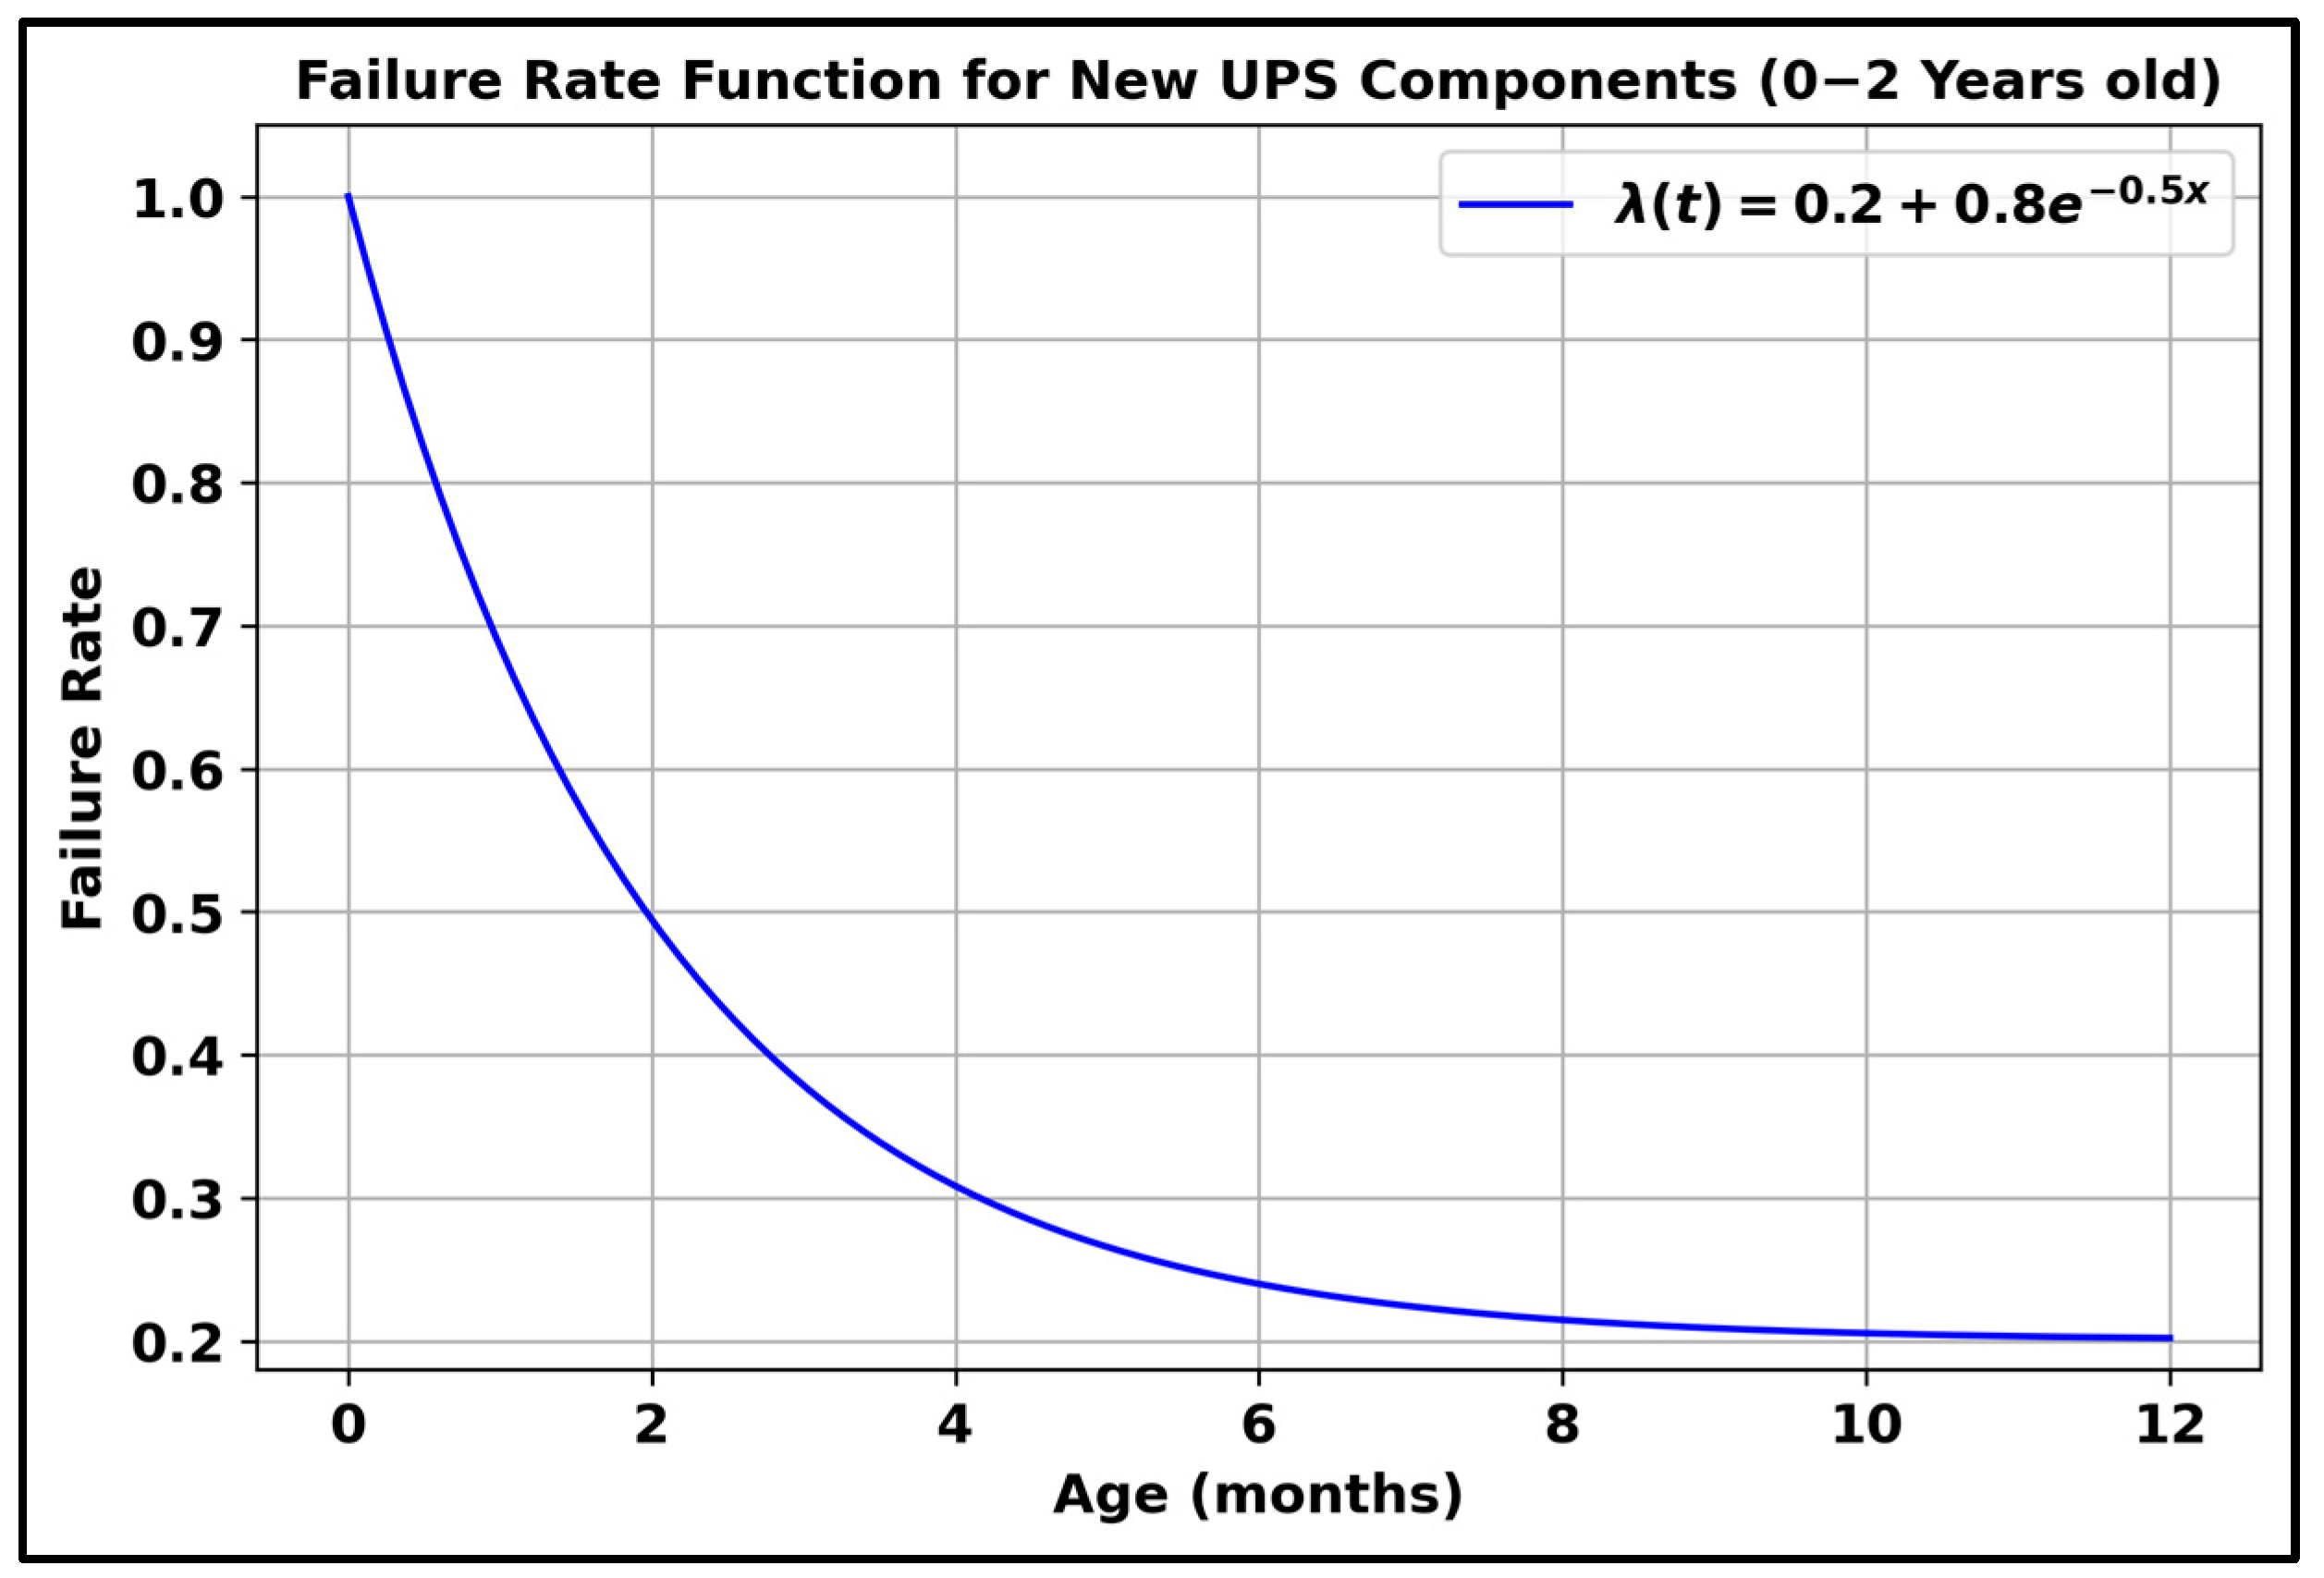
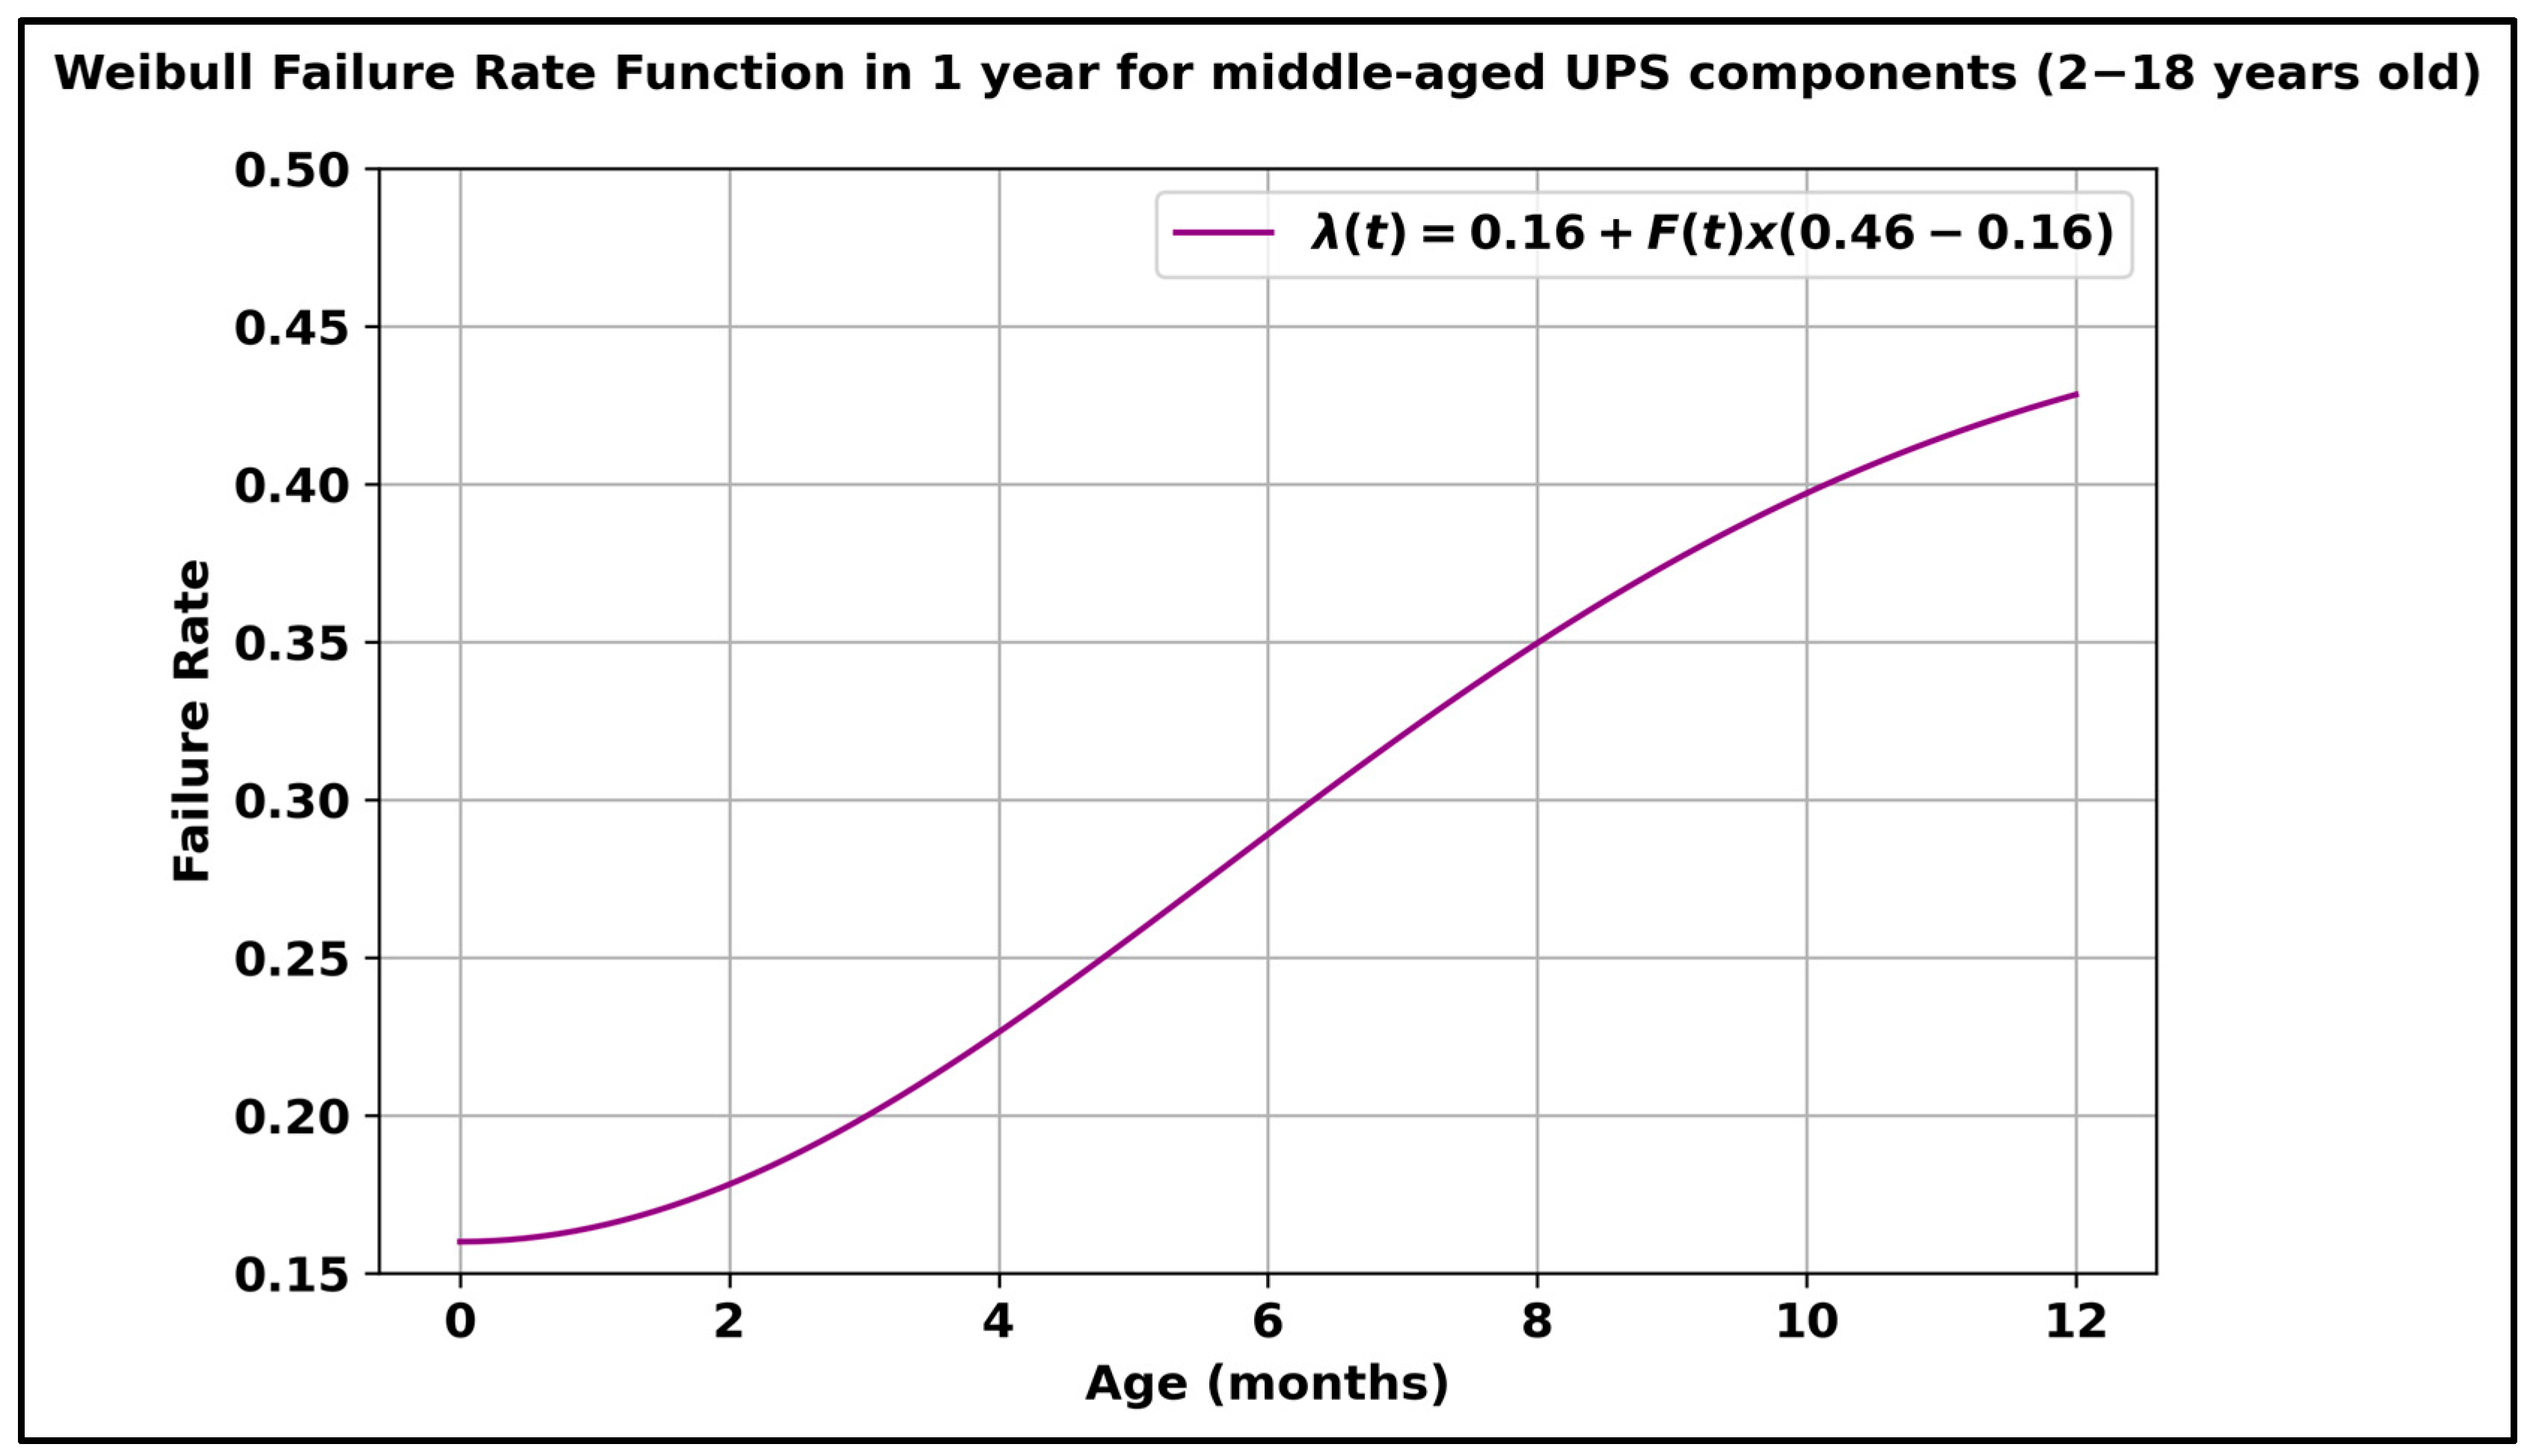
2.2.4. Dynamic Failure Rates and Maintenance Costs
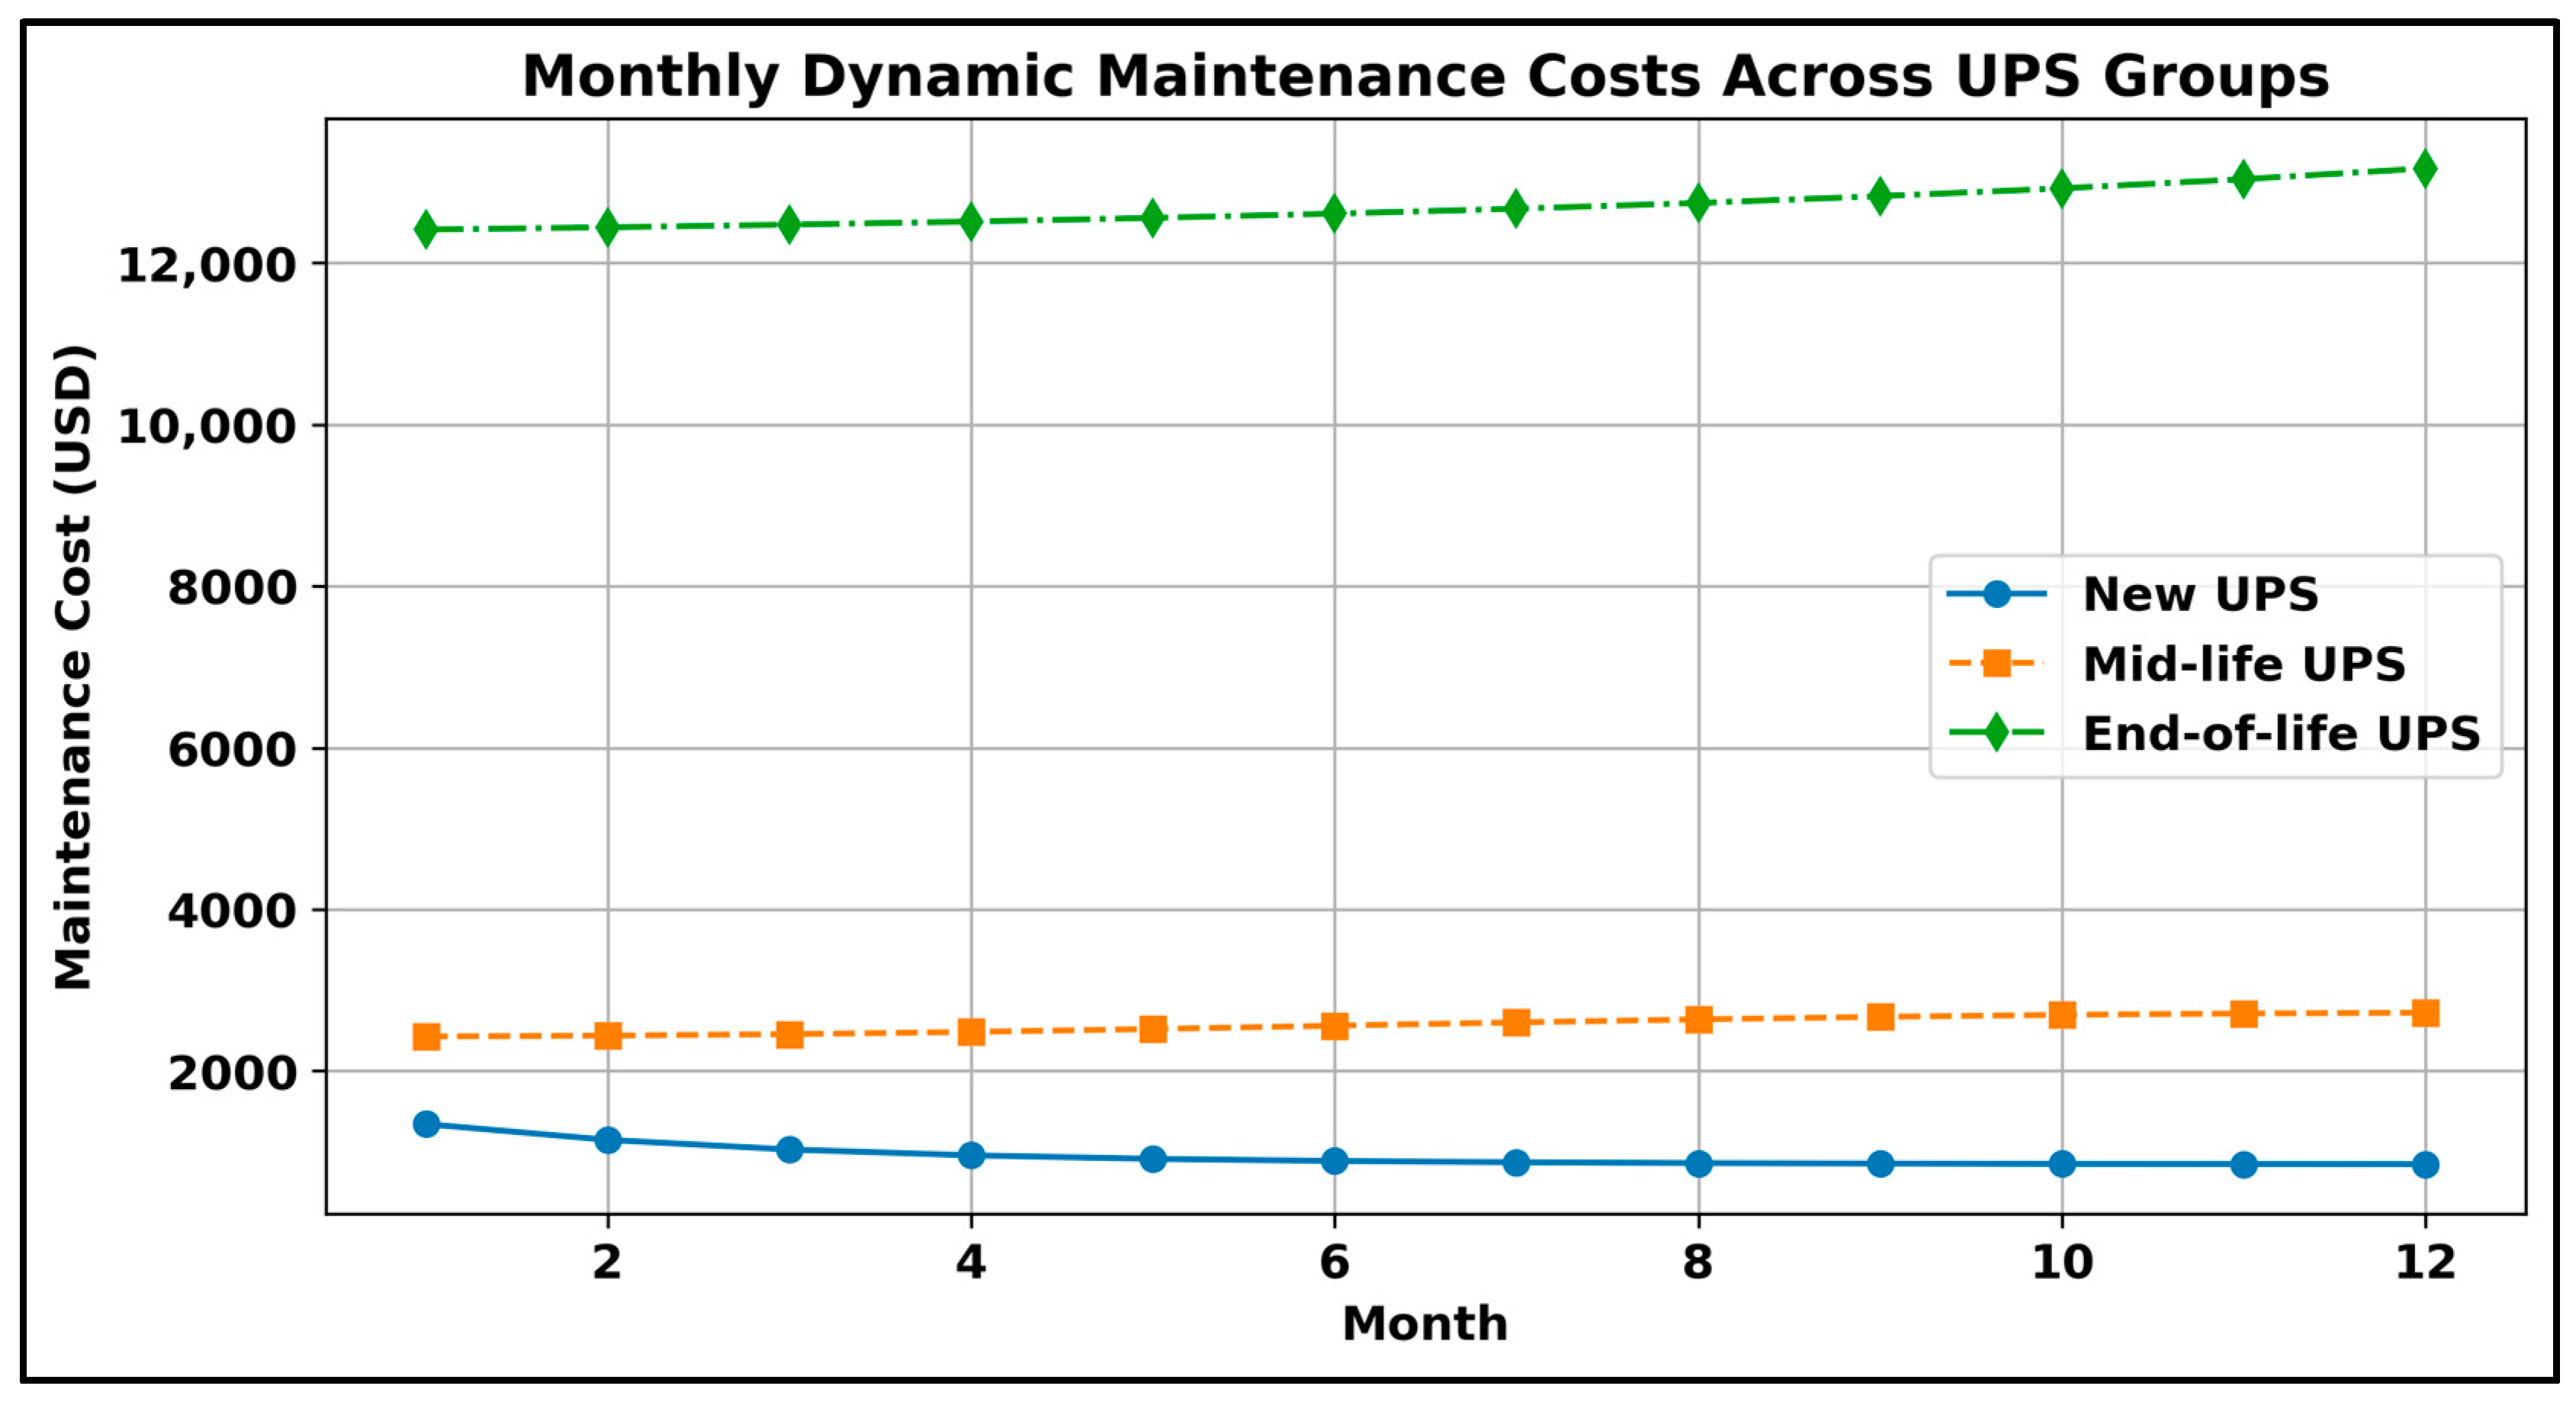
- Group 1—new UPS components (0–2 years old), including condition states 9 and 10:
- Group 2—middle-aged UPS components (2–18 years old), including condition states 3 to 8:
- Group 3—end-of-life UPS components (18–20 years old), including condition states 1 and 2:
- Monthly maintenance costs of Group 1 assets =
- Monthly maintenance costs of Group 2 assets =
- Monthly maintenance costs of Group 3 assets =
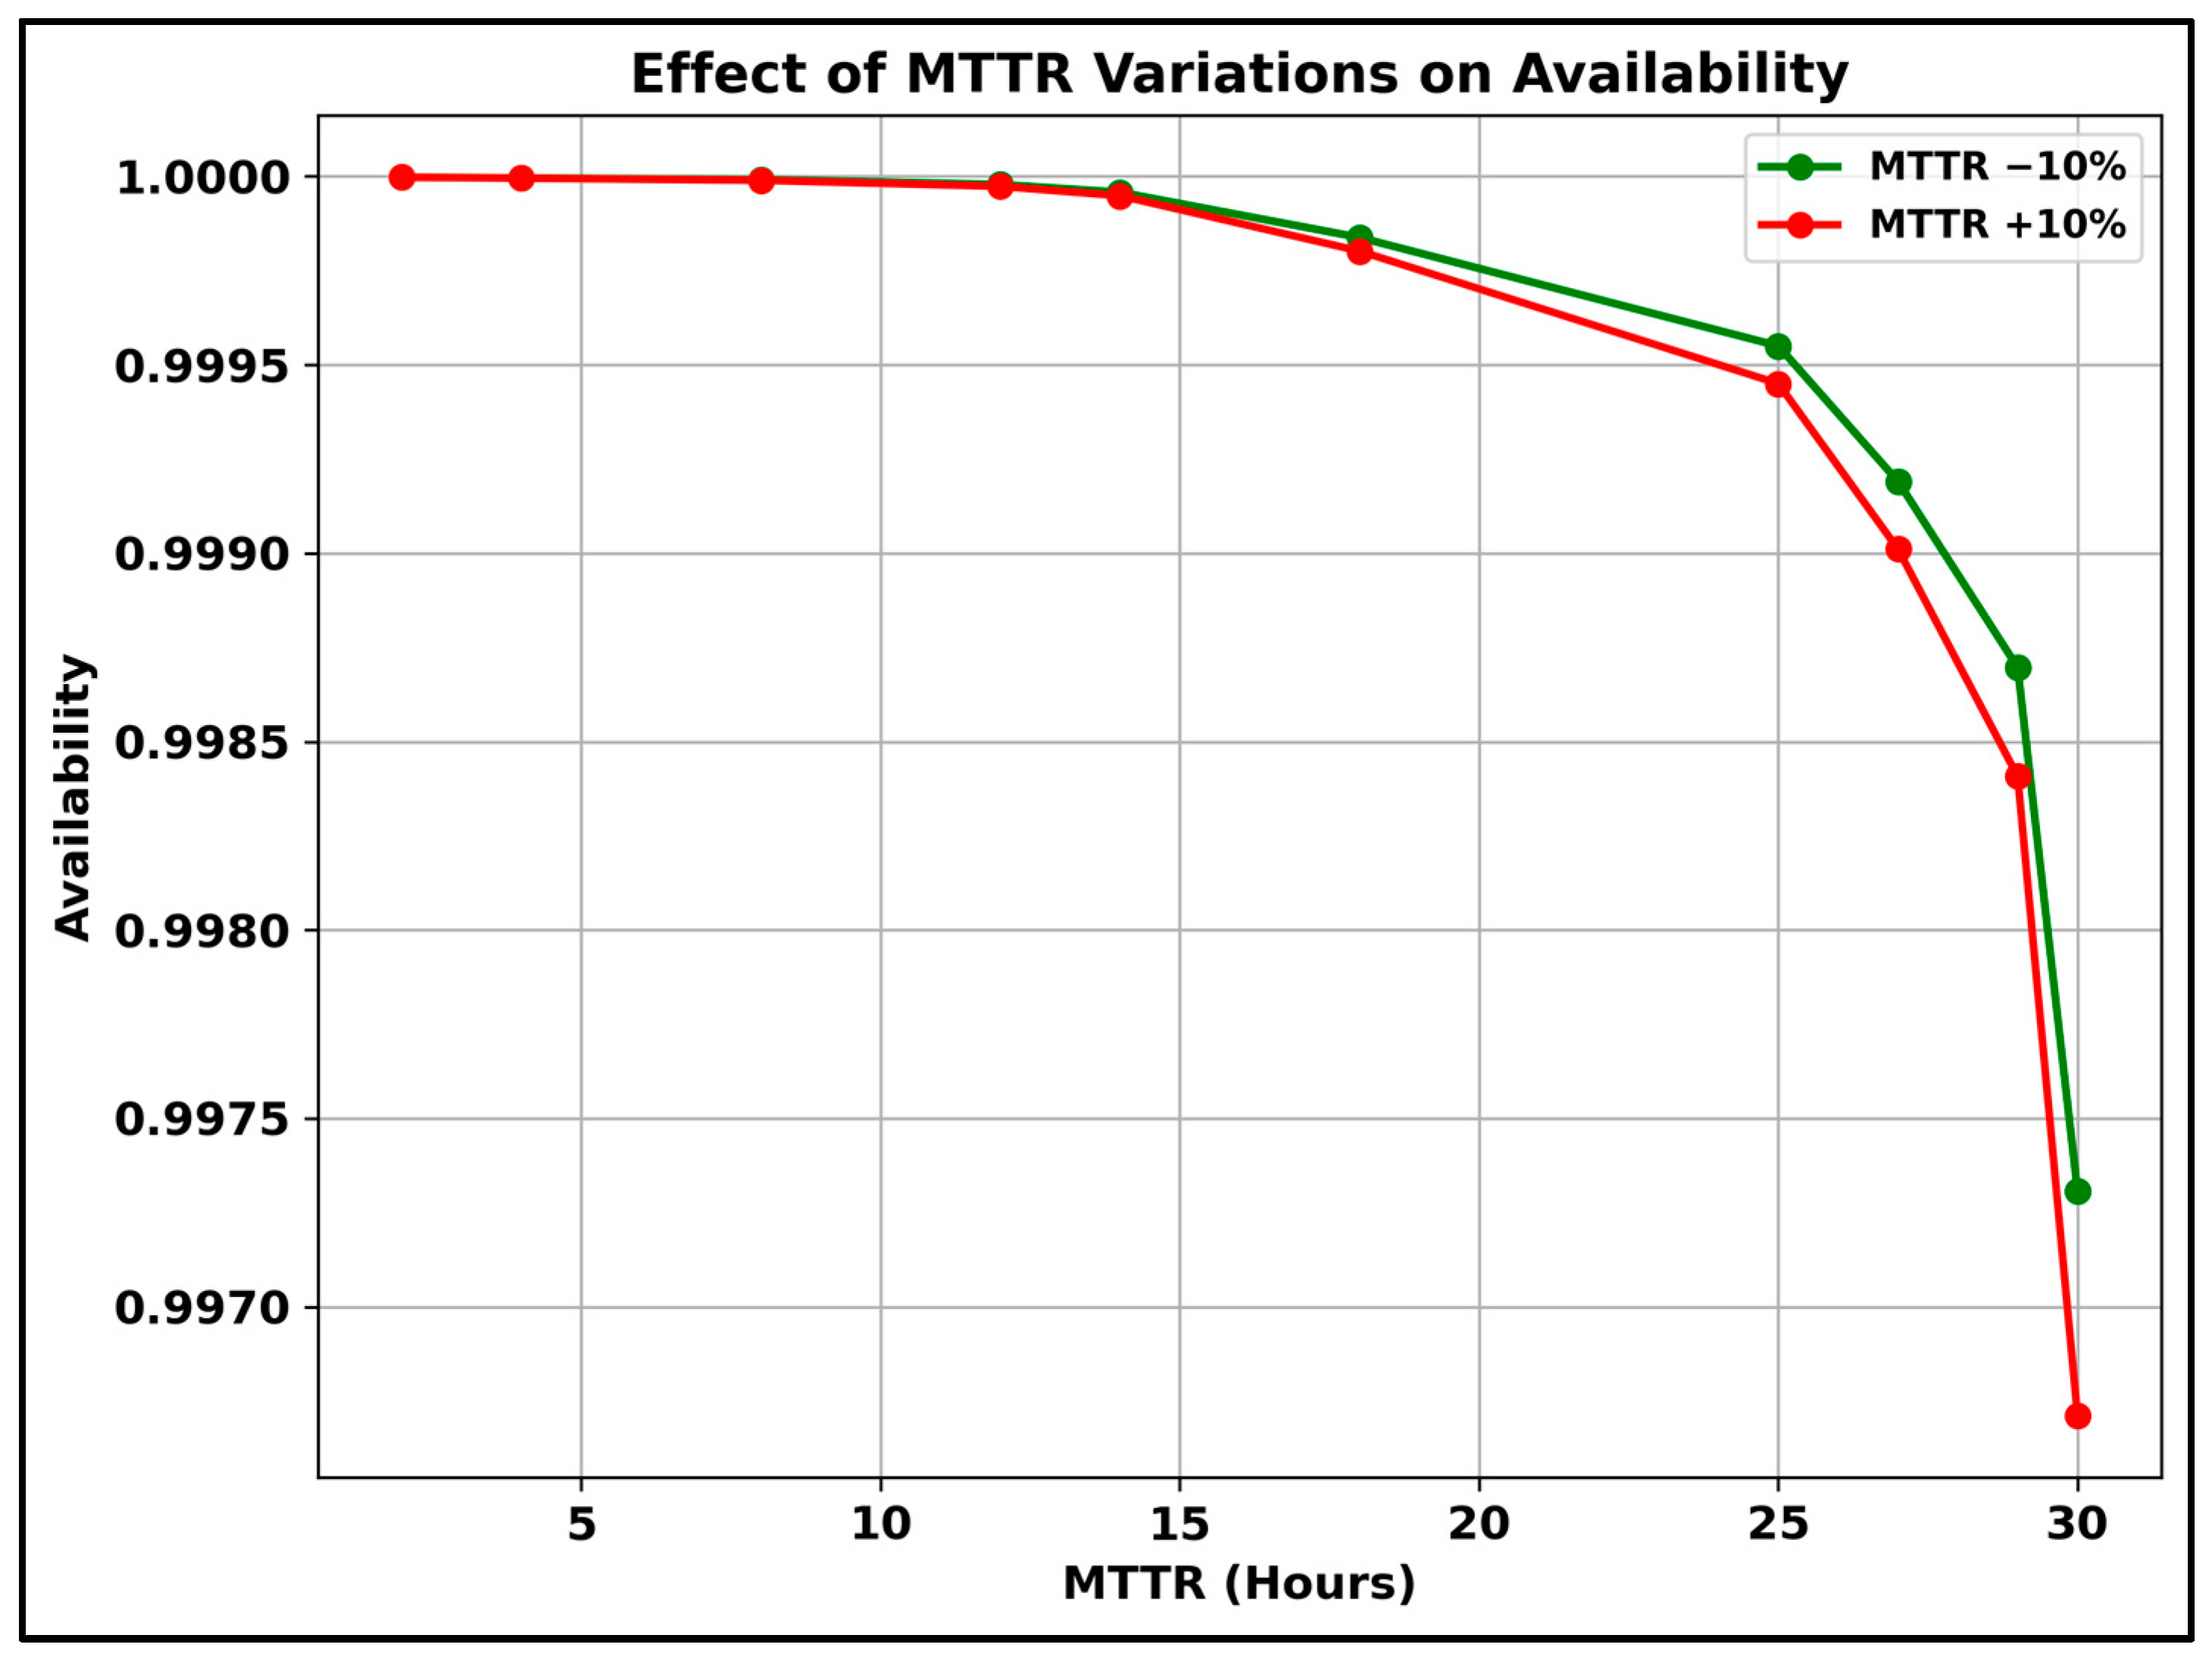
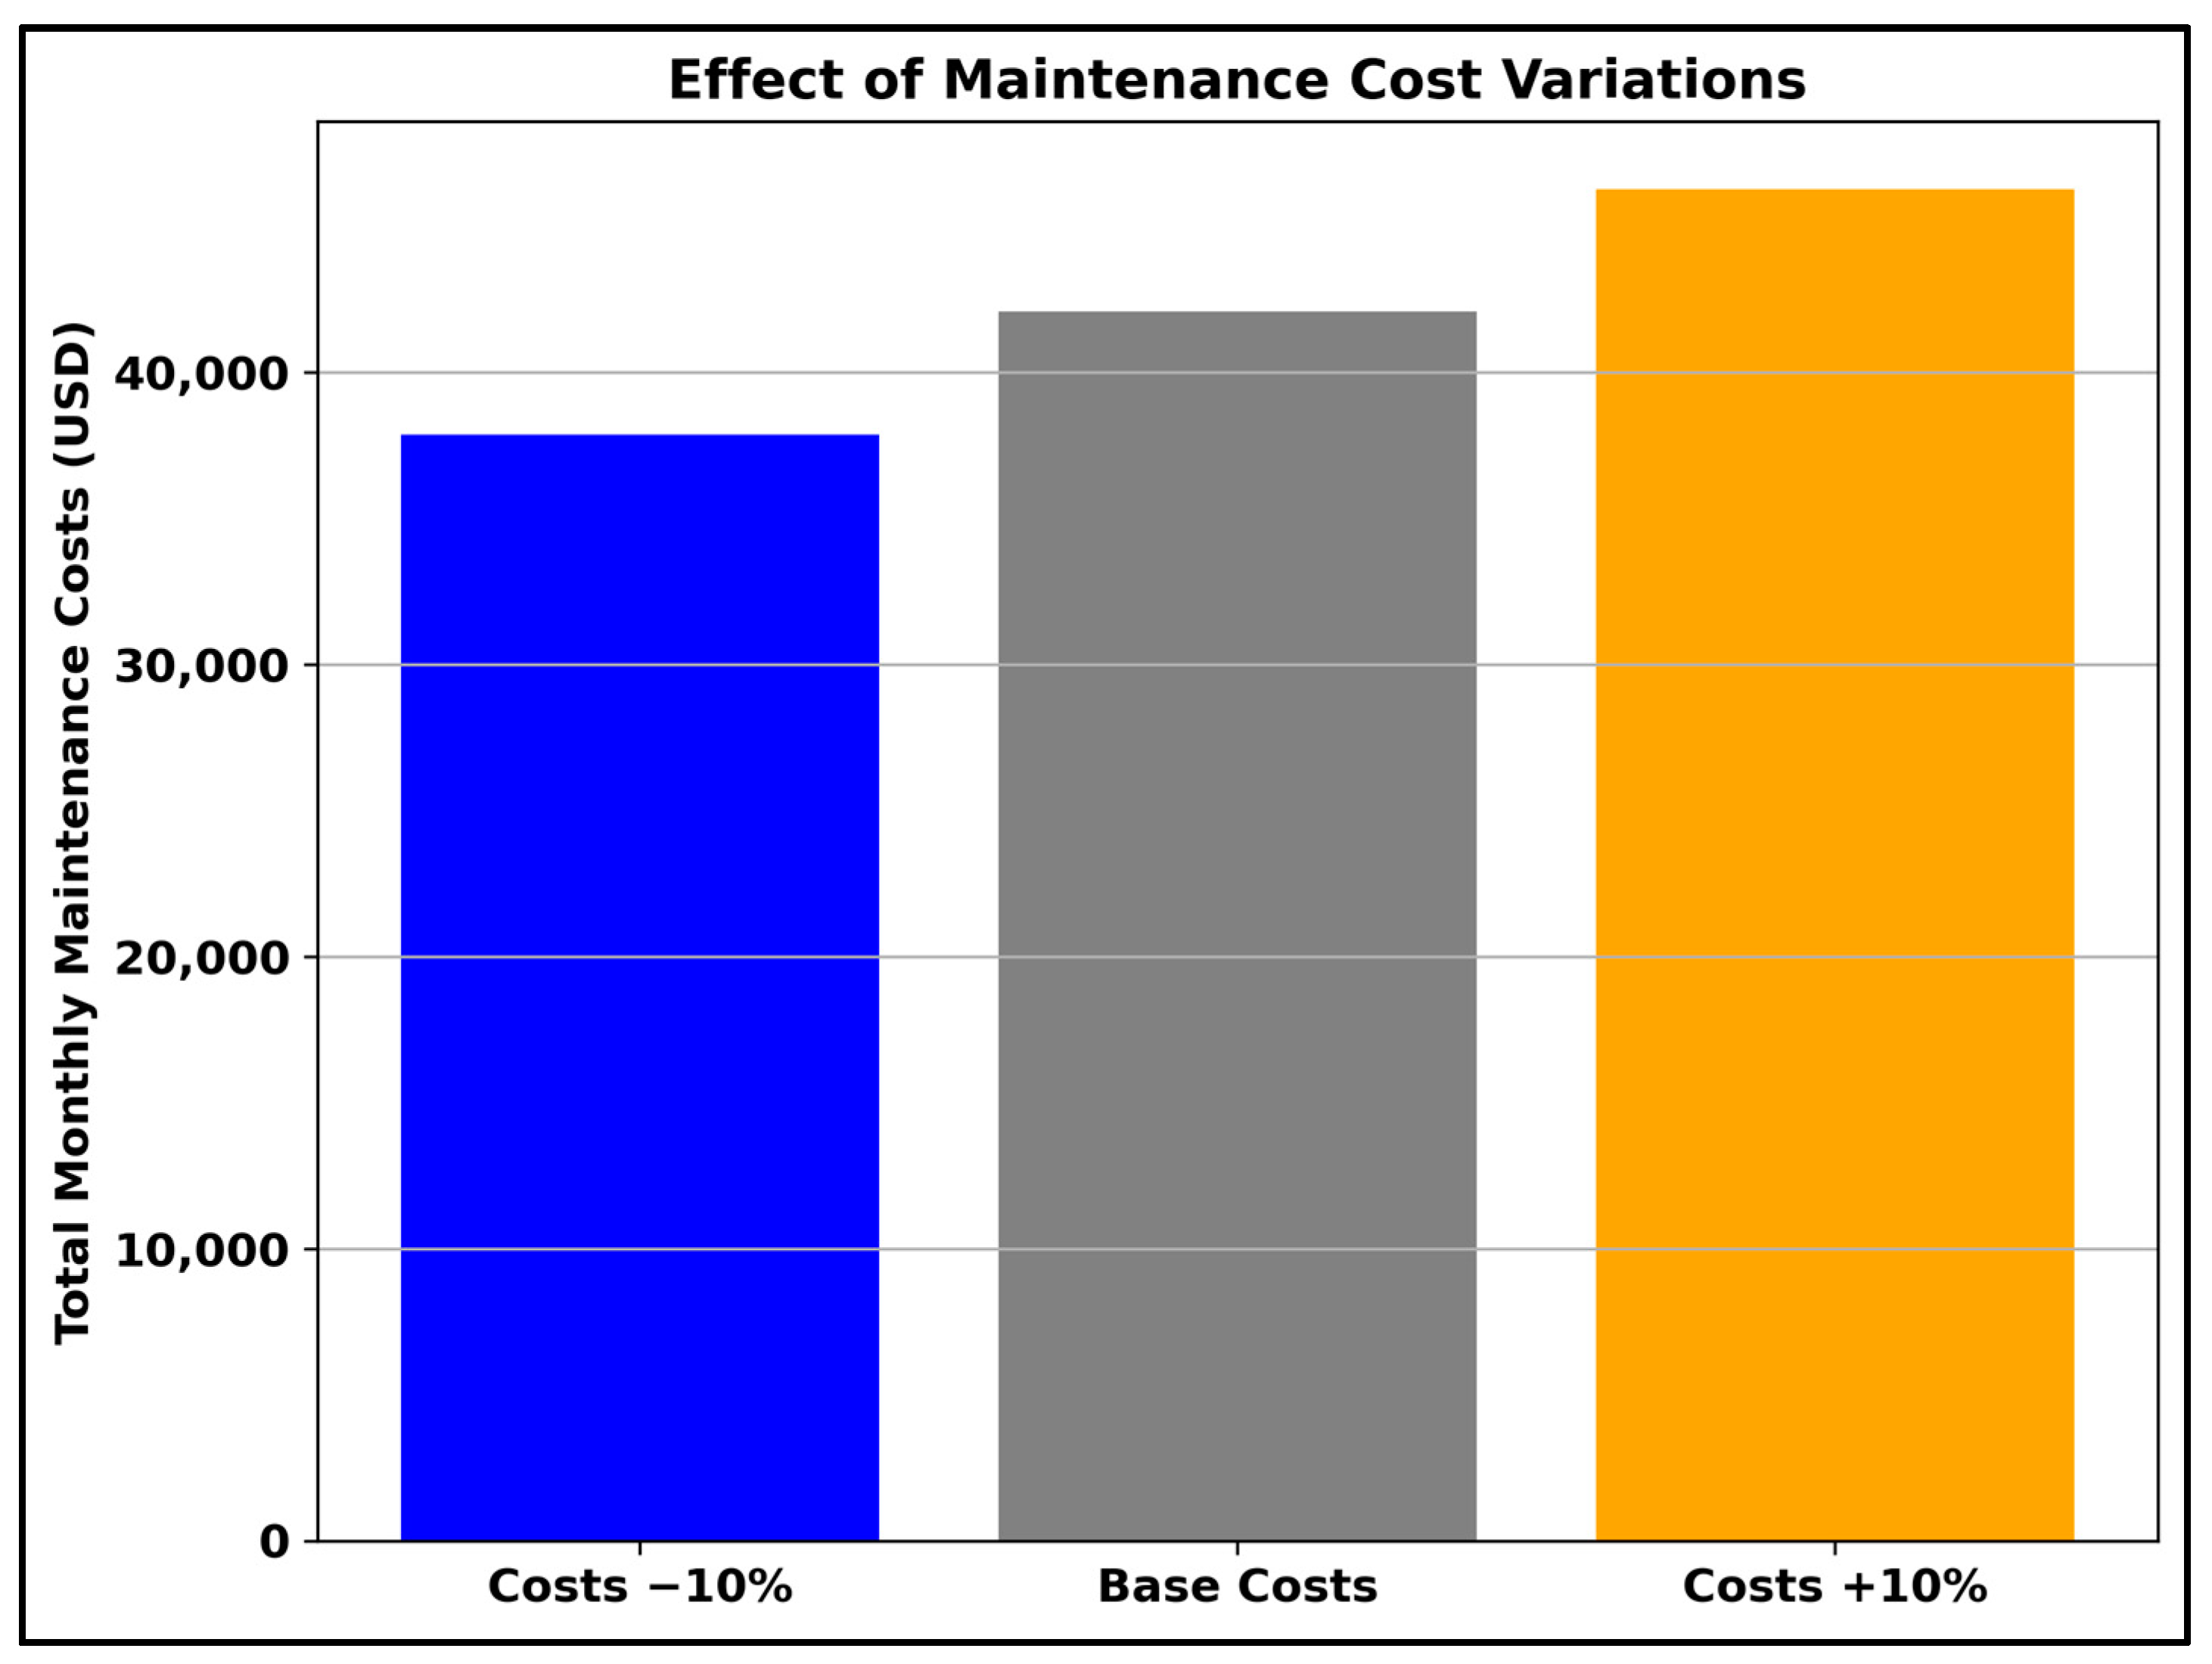
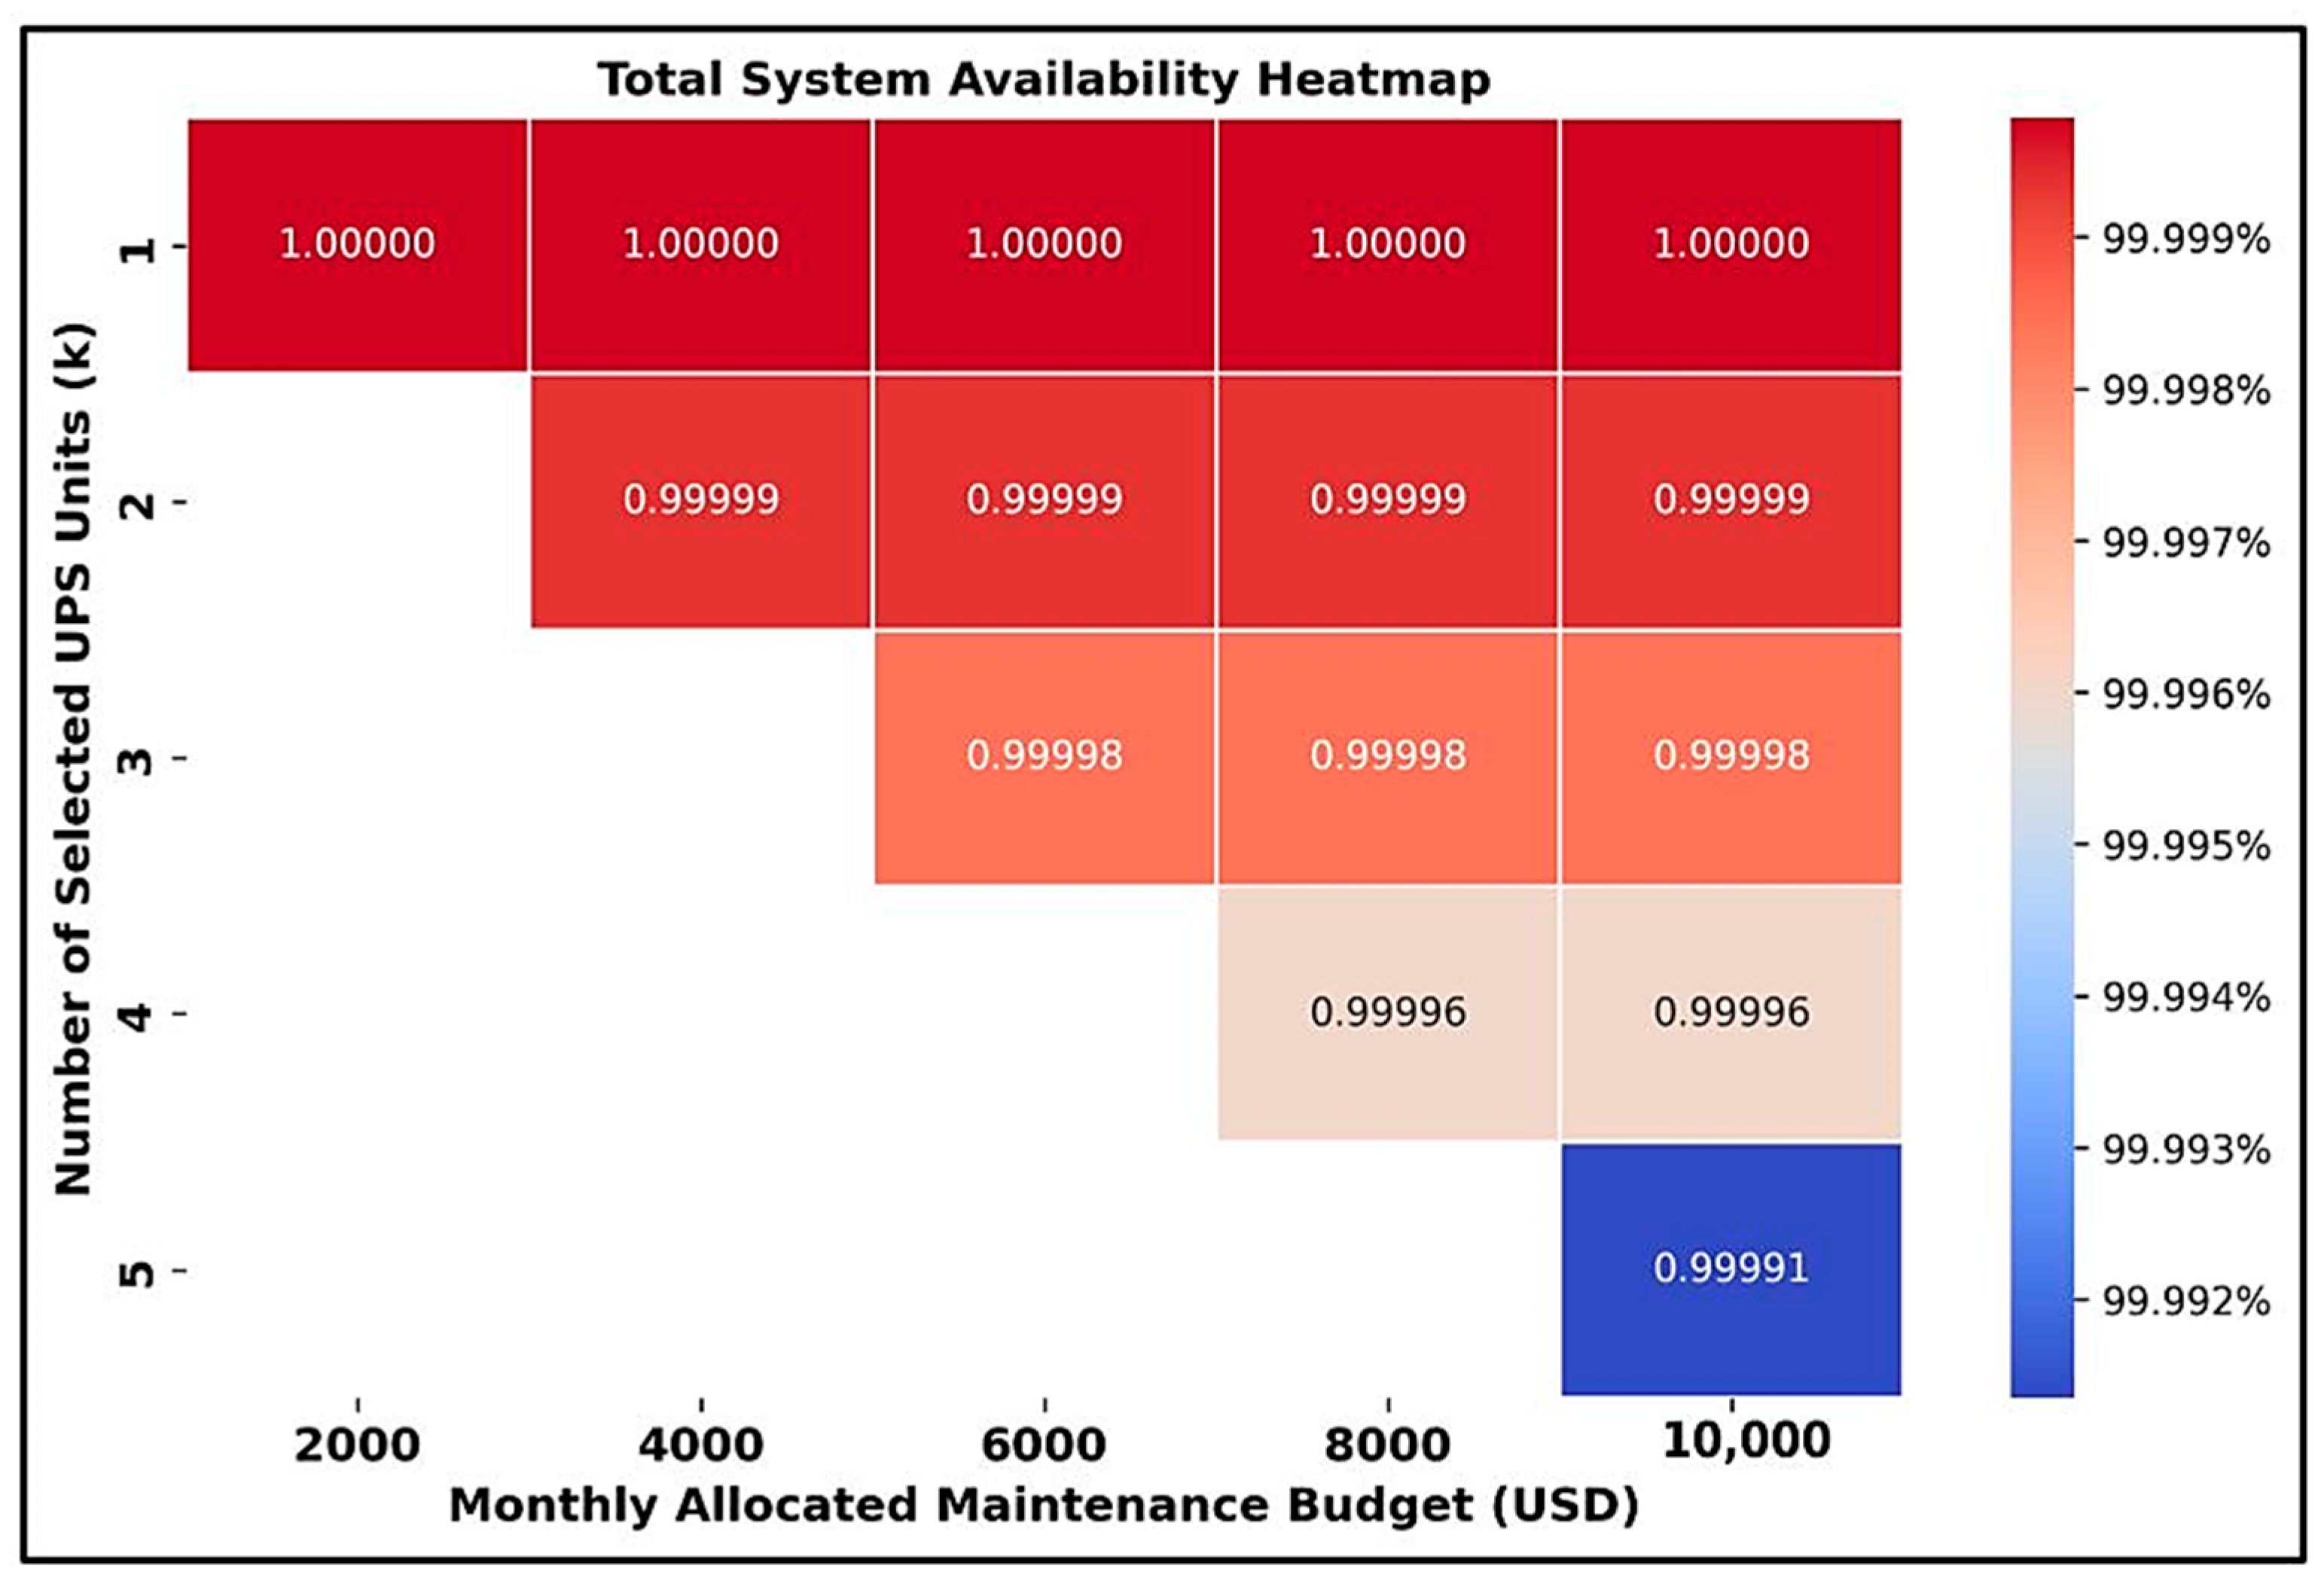
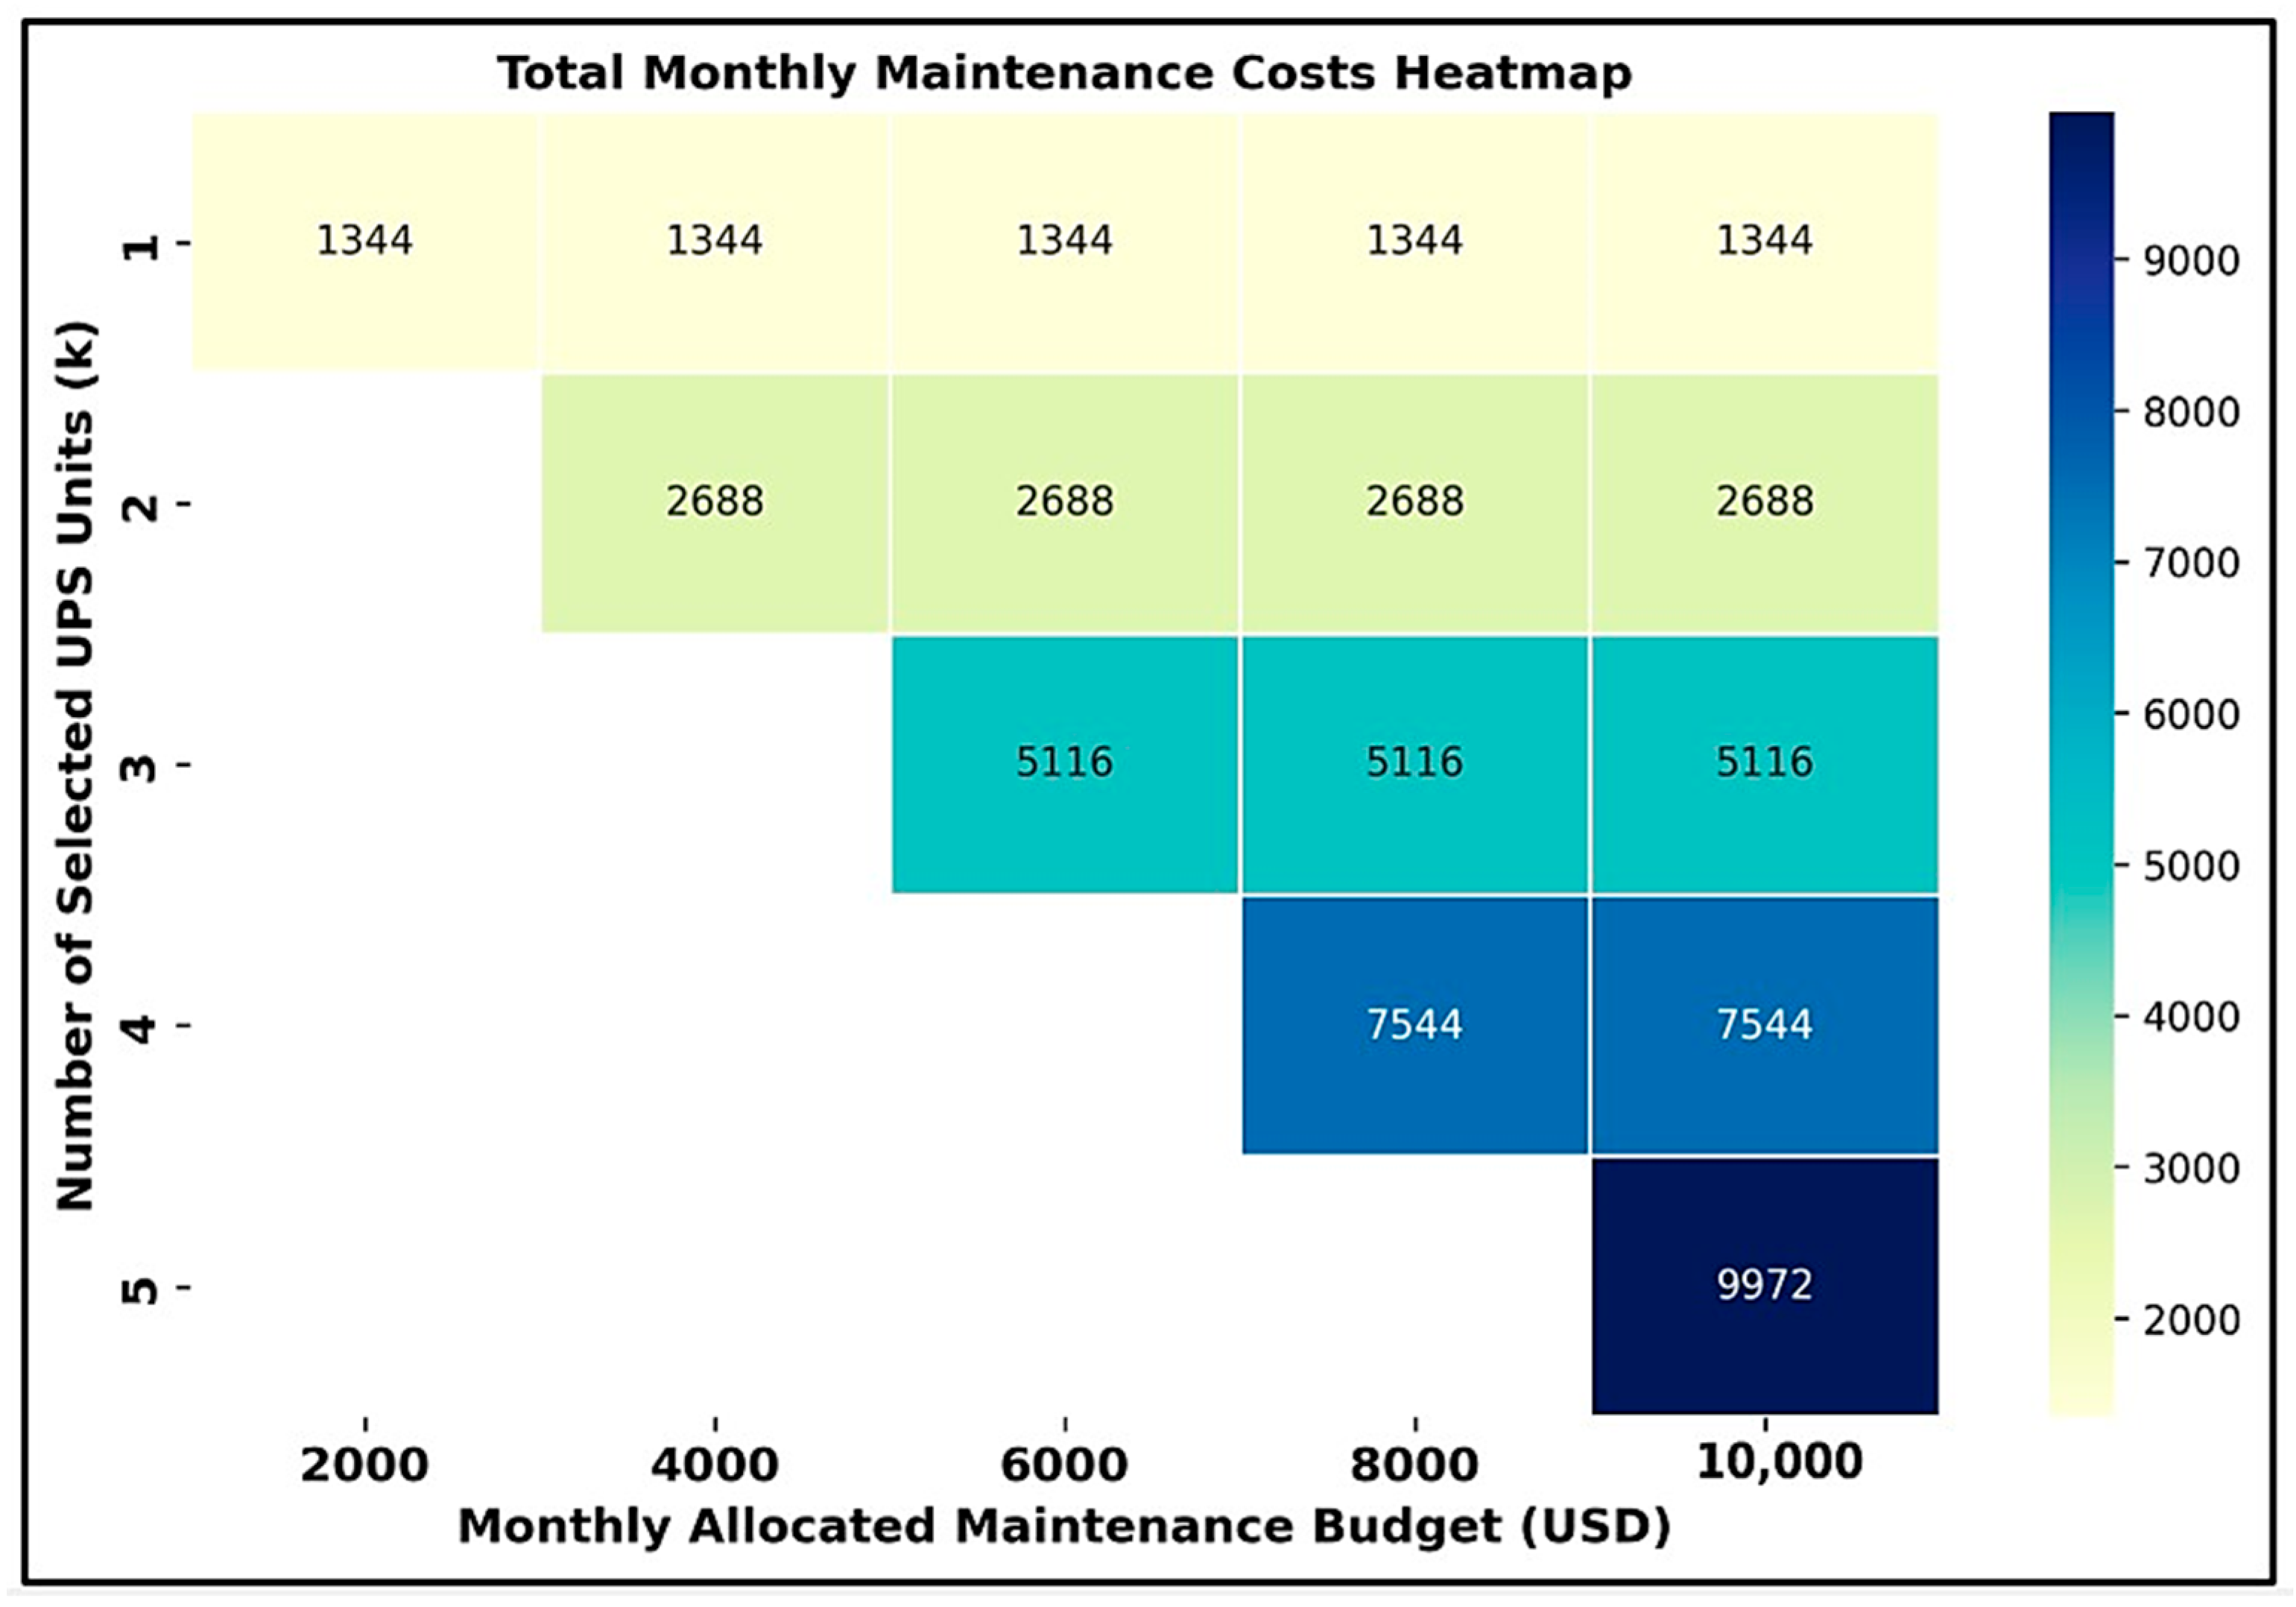
3. Results
4. Discussions
4.1. Challenges in Implementing the Proposed Model
4.2. Key Limitations and Constraints
5. Conclusions
Author Contributions
Funding
Data Availability Statement
Conflicts of Interest
Nomenclature
| DC | Data Center |
| O&M | Operations and Maintenance |
| DP | Dynamic Programming |
| KPIs | Key Performance Indicators |
| RBD | Reliability Block Diagrams |
| FCI | Facility Condition Index |
| IoT | Internet of Things |
| AI | Artificial Intelligence |
| ML | Machine Learning |
| λ | Failure (Hazard) rate showing the number of failures for each year |
| λ(t) | Failure (Hazard) rate function which represents the probability of failures per unit of time (t) |
| At | Component’s availability in timeframe (t) |
| MTTF | Mean Time To Failure |
| MTBF | Mean Time Between Failure |
| MTTR | Mean Time To Repair (Restore or Recover) |
| FCA | Facilities Condition Analysis |
| UPS | Uninterruptible Power Supply |
| FMECA | Failure Modes, Effect and Critically Analysis |
| CF | Costs of Services for each incident/failure |
| CPM | Preventive maintenance Costs |
| CCM | Corrective maintenance Costs |
| CPC | Costs of Power and Cooling services |
| CB | Costs of Battery replacement service |
| CCR | Component Renewal Costs |
| CI | Component Investment Costs |
References
- Informa PLC—AFCOM. State of the Data Center. 2024. Available online: https://afcom.com/events/EventDetails.aspx?id=1820212&group= (accessed on 1 March 2025).
- Abadi, M.F.; Haghighat, F.; Nasiri, F. Data center maintenance: Applications and future research directions. Facilities 2020, 38, 691–714. Available online: https://www.emerald.com/insight/content/doi/10.1108/F-09-2019-0104/full/pdf?title=data-center-maintenance-applications-and-future-research-directions (accessed on 1 March 2025). [CrossRef]
- Alshakhshir, F.S.; Howell, M. Chapter 11 Energy Centered Maintenance in Data Centers. In Energy Centered Maintenance—A Green Maintenance System; River Publishers: Aalborg, Denmark, 2021; pp. 169–172. Available online: https://ieeexplore.ieee.org/document/9549143 (accessed on 13 December 2024).
- Kirkwood, J. What the Reliability Bathtub Curve Means for Your Hardware Refresh Cycles. Service Express. Available online: https://serviceexpress.com/resources/reliability-bathtub-curve/ (accessed on 1 March 2025).
- Camboim, K.; Melo, C.; Araujo, J.; Alencar, F. Availability Evaluation and Maintenance Policy of Data Center Infrastructure. In Proceedings of the Anais Estendidos do X Simpósio Brasileiro de Engenharia de Sistemas Computacionais (SBESC Estendido 2020), Sociedade Brasileira de Computação—SBC, Florianopolis, Brazil, 23–27 November 2020; pp. 198–203. [Google Scholar] [CrossRef]
- Service Express. Data Center & Infrastructure Report: Priorities and Challenges in 2024. 2023. Available online: https://lp.serviceexpress.com/rs/021-JNM-575/images/2024%20Data%20Center%20Infrastructure%20Report.pdf?_gl=1*eqx2ik*_gcl_au*MjIzNTgxMDA3LjE3NDIyNzc3ODg.*_ga*NDQyODMwMzk3LjE3NDIyNzc3ODk.*_ga_1PJY9JWPTZ*MTc0MjI3Nzc4OS4xLjEuMTc0MjI3Nzg5OS4xMS4wLjA (accessed on 5 March 2025).
- Kumar, P. The Future of Data Center Maintenance: Trends and Best Practices for Modern Infrastructure. The Innovations of Data Center. Available online: https://www.linkedin.com/pulse/future-data-center-maintenance-trends-best-practices-modern-kumar/ (accessed on 20 February 2025).
- Technavio. COVID-19 Pandemic Impact on Global Hyperscale Data Center Market 2020–2024|Technavio. 2020. Available online: https://www.businesswire.com/news/home/20200825005097/en/COVID-19-Pandemic-Impact-on-Global-Hyperscale-Data-Center-Market-2020-2024-Technavio (accessed on 8 January 2025).
- Schenkelberg, F. K Out of N. FMS Reliability. Available online: https://accendoreliability.com/k-out-of-n-2/ (accessed on 28 February 2024).
- Birolini, A. Reliability Engineering: Theory and Practice, 8th ed.; Springer: Berlin/Heidelberg, Germany, 2017. [Google Scholar] [CrossRef]
- Abadi, M.F.; Rahdar, M.H.; Nasiri, F.; Haghighat, F. Fault Identification and Fault Impact Analysis of the Vapor Compression Refrigeration Systems in Buildings: A System Reliability Approach. Energies 2022, 15, 5774. [Google Scholar] [CrossRef]
- Bellman, R. The theory of dynamic programming. Bull. Am. Math. Soc. 1954, 60, 503–515. [Google Scholar] [CrossRef]
- Bellman, R.E. Dynamic Programming; Princeton University Press: Princeton, NJ, USA, 1957. [Google Scholar]
- Abadi, M.F.; Haghighat, F.; Nasiri, F. Availability-based maintenance prioritization for data centres: A dynamic programming approach. Saf. Reliab. 2025, 1–36. [Google Scholar] [CrossRef]
- Pourhosseini, O.; Nasiri, F. Availability-Based Reliability-Centered Maintenance Scheduling: Case Study of Domestic (Building-Integrated) Hot Water Systems. ASCE ASME J. Risk Uncertain. Eng. Syst. A Civ. Eng. 2018, 4, 1–13. [Google Scholar] [CrossRef]
- Mirhosseini, M.; Keynia, F. Asset management and maintenance programming for power distribution systems: A review. IET Gener. Transm. Distrib. 2021, 15, 2287–2297. [Google Scholar] [CrossRef]
- Nadaf, S. AI for Predictive Maintenance in Industries. Int. J. Res. Appl. Sci. Eng. Technol. 2024, 12, 2013–2017. [Google Scholar] [CrossRef]
- Cavus, M.; Dissanayake, D.; Bell, M. Next Generation of Electric Vehicles: AI-Driven Approaches for Predictive Maintenance and Battery Management. Energies 2025, 18, 1041. [Google Scholar] [CrossRef]
- Lawal, O.O.; Nawari, N.O.; Lawal, O. AI-Enabled Cognitive Predictive Maintenance of Urban Assets Using City Information Modeling—Systematic Review. Buildings 2025, 15, 690. [Google Scholar] [CrossRef]
- Salihu, C.; Mohandes, S.R.; Kineber, A.F.; Hosseini, M.R.; Elghaish, F.; Zayed, T. A Deterioration Model for Sewer Pipes Using CCTV and Artificial Intelligence. Buildings 2023, 13, 952. [Google Scholar] [CrossRef]
- Shin, W.; Han, J.; Rhee, W. AI-assistance for predictive maintenance of renewable energy systems. Energy 2021, 221, 119775. [Google Scholar] [CrossRef]
- Johanesa, T.V.A.; Equeter, L.; Mahmoudi, S.A. Survey on AI Applications for Product Quality Control and Predictive Maintenance in Industry 4.0. Electronics 2024, 13, 976. [Google Scholar] [CrossRef]
- Kuiti, M.R.; Hazra, N.K.; Finkelstein, M. On Component Redundancy Versus System Redundancy for a k-out-of-n System. arXiv 2017, arXiv:1710.09202. [Google Scholar]
- Aggarwal, V. Reliability of k-out-of-n Data Storage System with Deterministic Parallel and Serial Repair. arXiv 2016, arXiv:1611.08514. [Google Scholar]
- Aghaei, M.; Hamadani, A.Z.; Ardakan, M.A. Redundancy allocation problem for k-out-of-n systems with a choice of redundancy strategies. J. Ind. Eng. Int. 2017, 13, 81–92. [Google Scholar] [CrossRef]
- Byun, J.-E.; Noh, H.-M.; Song, J. Reliability growth analysis of k-out-of-N systems using matrix-based system reliability method. Reliab. Eng. Syst. Saf. 2017, 165, 410–421. [Google Scholar] [CrossRef]
- Kasuya, M.; Jin, L. Structural Properties of Optimal Maintenance Policies for k-out-of-n Systems with Interdependence Between Internal Deterioration and External Shocks. Mathematics 2025, 13, 716. [Google Scholar] [CrossRef]
- Nan, Z.; Liu, Y.; Cai, K.; Jun, Z. Maintenance Optimization of A K-out-of-N System Considering Common Cause Failure and Load Sharing. Oper. Res. Manag. Sci. 2023, 32, 44. [Google Scholar]
- Wu, T.; Wei, F.; Yang, L.; Ma, X.; Hu, L. Maintenance Optimization of k-Out-of-n Load-Sharing Systems Under Continuous Operation. IEEE Trans. Syst. Man Cybern. Syst. 2023, 53, 6329–6341. [Google Scholar]
- Jamali, M.A.; Pham, H. Opportunistic maintenance model for load sharing k-out-of-n systems with perfect PM and minimal repairs. Qual. Eng. 2022, 34, 205–214. [Google Scholar]
- Alshakhshir, F.; Howell, M.T. Data Driven Energy Centered Maintenance, 2nd ed.; River Publishers: Aalborg, Denmark, 2021. [Google Scholar] [CrossRef]
- O’Keeffe, M. The Future of Data Center Maintenance. Data Centre Dynamics Ltd (DCD). Available online: https://www.datacenterdynamics.com/en/opinions/the-future-of-data-center-maintenance/#:~:text=Maximize%20airflow,of%20operational%20efficiency%20and%20resilience (accessed on 20 February 2025).
- Cheng, H.; Li, M.; Cao, W.; Dong, X. Research on Operation and Maintenance Management System of Data Center SDN Network. In Proceedings of the 2023 IEEE International Conference on Sensors, Electronics and Computer Engineering (ICSECE), Jinzhou, China, 18–20 August 2023; IEEE: Piscataway, NJ, USA, 2023; pp. 1254–1258. [Google Scholar]
- Bradley, S.; Hax, A.; Magnati, T. Applied Mathematical Programming; Addison-Wesley: Boston, MA, USA, 1977; Available online: https://web.mit.edu/15.053/www/AMP.htm (accessed on 8 January 2025).
- Zhang, Y. A survey of dynamic programming algorithms. Appl. Comput. Eng. 2024, 35, 183–189. [Google Scholar] [CrossRef]
- Ilinykh, A.S.; Bondarev, E.S. Planning work on railroad track maintenance based on dynamic programming. Transp. Res. Procedia 2022, 61, 699–707. [Google Scholar]
- Albatayneh, O.; Aleadelat, W.; Ksaibati, K. Dynamic programming of 0/1 knapsack problem for network-level pavement asset management system. Can. J. Civ. Eng. 2021, 48, 356–365. [Google Scholar]
- Melo, F.; Andrade, E.; Callou, G. Optimization of electrical infrastructures at data centers through a DoE-based approach. J. Supercomput. 2022, 78, 406–439. [Google Scholar] [CrossRef]
- Jiang, C.; Qiu, Y.; Gao, H.; Fan, T.; Li, K.; Wan, J. An Edge Computing Platform for Intelligent Operational Monitoring in Internet Data Centers. IEEE Access 2019, 7, 133375–133387. [Google Scholar] [CrossRef]
- Loeffler, C.; Spears, E. Uninterruptible Power Supply System. In Data Center Handbook; John Wiley & Sons, Inc.: Hoboken, NJ, USA, 2014; Chapter 27; pp. 495–521. [Google Scholar]
- Riello Elettronica Group. How Is UPS Resilience Measured (MTBF, MTTR, Availability)? Available online: https://www.riello-ups.com/questions/52-how-is-ups-resilience-measured-mtbf-mttr-availability (accessed on 1 March 2025).
- Heising, C. IEEE Recommended Practice for the Design of Reliable Industrial and Commercial Power Systems; IEEE Inc.: New York, NY, USA, 2007. [Google Scholar]
- Kidd, C. MTBF vs. MTTF vs. MTTR: Defining IT Failure; BMC Software Inc.: Houston, TX, USA, 2019; Available online: https://www.bmc.com/blogs/mtbf-vs-mtff-vs-mttr-whats-difference/# (accessed on 1 March 2025).
- Gabriel, C. Data Center Disaster Recovery and High Availability. In Data Center Handbook; John Wiley & Sons, Inc.: Hoboken, NJ, USA, 2014; Chapter 35; pp. 639–657. [Google Scholar]
- Lee, H.; Lee, B. The development of a state-aware equipment maintenance application using sensor data ranking techniques. Sensors 2020, 20, 3038. [Google Scholar] [CrossRef]
- Federal Transit Administration. TAM Facility Performance Measure Reporting Guidebook: Condition Assessment Calculation; Federal Transit Administration: Washington, DC, USA, 2018.
- The Regional Municipality of Durham. The 2019 Regional Municipality of Durham Asset Management Plan; The Regional Municipality of Durham: Durham, ON, Canada, 2019.
- Ahmed, R.; Zayed, T.; Nasiri, F. A hybrid genetic algorithm-based fuzzy markovian model for the deterioration modeling of healthcare facilities. Algorithms 2020, 13, 210. [Google Scholar] [CrossRef]
- Town of Ajax. Corporate Asset Management Plan. 2017. Available online: https://www.ajax.ca/en/inside-townhall/resources/Departments/Ops/2017-Corporate-Asset-Management-Plan.pdf (accessed on 1 September 2023).
- Kuryanov, V.N.; Sultanov, M.M.; Kuryanova, E.V.; Skopova, E.M. Mathematical model of the processes of restoration of power equipment in power systems by criterion of the index of technical condition. J. Phys. Conf. Ser. 2020, 1683, 42041. [Google Scholar]
- DTZ. Facilities Condition Analysis. 2013. Available online: https://cdn.ymaws.com/www.sais.org/resource/resmgr/imported/Facility_Condition_Analysis_Capital_Planning_Merrow_MISBO_Oct2013.pdf (accessed on 1 September 2023).
- IPWEA; NAMS. Condition Assessment and Asset Performance Guidelines. 2012. Available online: https://higherlogicdownload.s3.amazonaws.com/IPWEA/1605183f-a91c-4680-b953-cde30dd2c09a/UploadedImages/Bookshop/PN%20Preamble_lp_v2.pdf (accessed on 1 September 2023).
- MCIM by Fulcrum Collaborations. Benchmarking the Reliability of Static UPS Systems. 2023. Available online: https://info.mcim24x7.com/static-ups-benchmarking (accessed on 1 January 2024).
- de Jonge, B.; Klingenberg, W.; Teunter, R.; Tinga, T. Optimum maintenance strategy under uncertainty in the lifetime distribution. Reliab. Eng. Syst. Saf. 2015, 133, 59–67. [Google Scholar] [CrossRef]
- Geng, H. Data Center Handbook; John Wiley & Sons, Inc.: Hoboken, NJ, USA, 2015. [Google Scholar] [CrossRef]
- Legrand. Reliability & Availability in Legrand UPS. 87045 Limoges Cedex—France. 2021. Available online: https://ups.legrand.com/media/document/reliability-and-availability-in-legrand-ups.pdf (accessed on 1 January 2025).
- APC—Schneider Electric. Symmetra PX 500kW Scalable to 500kW with Maintenance Bypass Left & Distribution. Available online: https://www.apc.com/ca/en/product/SY500K500DL-PD/symmetra-px-500kw-scalable-to-500kw-with-maintenance-bypass-left-distribution/ (accessed on 1 March 2025).
- CDW LLC. APC Symmetra PX 500kW Scalable to 500kW with Right Mounted Maintenance Bypass. Available online: https://www.cdw.com/product/apc-symmetra-px-500kw-scalable-to-500kw-with-right-mounted-maintenance-bypa/1673300#WAR (accessed on 1 September 2023).
- Cologix. Cologix—The Downtown Montréal Carrier Hotel—MTL 3: 1250 René-Lévesque West. 2019. Available online: https://www.cologix.com/wp-content/uploads/2018/12/Montreal-Data-Center-MTL-3.pdf (accessed on 10 February 2025).
- Uptime Institute, LLC. Tier Classification System. Available online: https://uptimeinstitute.com/tiers (accessed on 1 September 2023).
- Rahmat, K.; Jovanovic, S.; Lo, K.L. Reliability Comparison of Uninterruptible Power Supply (UPS) System Configurations. In Proceedings of the Intelec 2013; 35th International Telecommunications Energy Conference, Smart Power and Efficiency, VDE, Hamburg, Germany, 13–17 October 2013; pp. 1–6. [Google Scholar]
- Hummingbird Networks. APC On-Site Service On-Site Warranty Extension—Extended Service Agreement—Parts and Labor. Available online: https://www.hummingbirdnetworks.com/apc-on-site-service-on-site-warranty-extension-extended-service-agreement-parts-and-labor-for-ups-300-500-kva-1-year-on-site-business-hours-response-time-nbd-for-eps-7000-woe1yr-e7-50 (accessed on 1 September 2023).
- OpenAI. ChatGPT (December 2024 Version) [AI Language Model]. Available online: https://openai.com/chatgpt (accessed on 5 December 2024).
- Python Software. Python Software Foundation. Available online: https://www.python.org/ (accessed on 1 September 2024).
- Microsoft Copilot AI. Copilot AI (Response Generated by Microsoft Copilot AI). Microsoft. Available online: https://copilot.cloud.microsoft/ (accessed on 5 December 2024).
- Spyder Website Contributors. Spyder. Available online: https://www.spyder-ide.org/ (accessed on 1 September 2024).


| DC Tier | System’s Description | DC Availability Percentage |
|---|---|---|
| 1 | A single, non-redundant distribution path which supplies power to IT equipment, with no redundant capacity components. | 99.671% |
| 2 | Includes all Tier 1 requirements and adds redundant infrastructure components to enhance availability. | 99.741% |
| 3 | Meets or exceeds all Tier 1 and Tier 2 requirements; multiple independent distribution paths serving the IT equipment. All IT equipment must be dual-powered and fully compatible with the topology of a site’s architecture, concurrently maintainable site infrastructure. | 99.982% |
| 4 | Meets or exceeds all Tier 1, Tier 2, and Tier 3 requirements. All cooling pieces of equipment are individually dual-powered, including chillers and heating, ventilating, and air conditioning (HVAC) systems. Fault-tolerant site infrastructure with electrical power, storage, and distribution facilities. | 99.995% |
| Rank (Rating) | Asset Condition | Condition’s Description | Corresponding Maintenance Action(s) |
|---|---|---|---|
| 1 | Excellent or Very Good | Brand new or nearly new, fully operational. | Only routine and planned (recurring) maintenance is required. |
| 2 | Good | Functional with minor issues or slight defects. | Minor corrective maintenance required (5%)—repairing failed or degraded components/assets |
| 3 | Adequate or Fair | Maintenance required to restore acceptable level of performance. | Significant corrective maintenance required (10–20%)—repairing failed or degraded components/assets |
| 4 | Marginal or Poor | Component renewal is necessary. | Significant renewal/upgrade required (20–40%) |
| 5 | Critical | Approaching end of life—non-functional asset. | Over 50% of asset requires replacement—substitution or exchange of an existing component/asset |
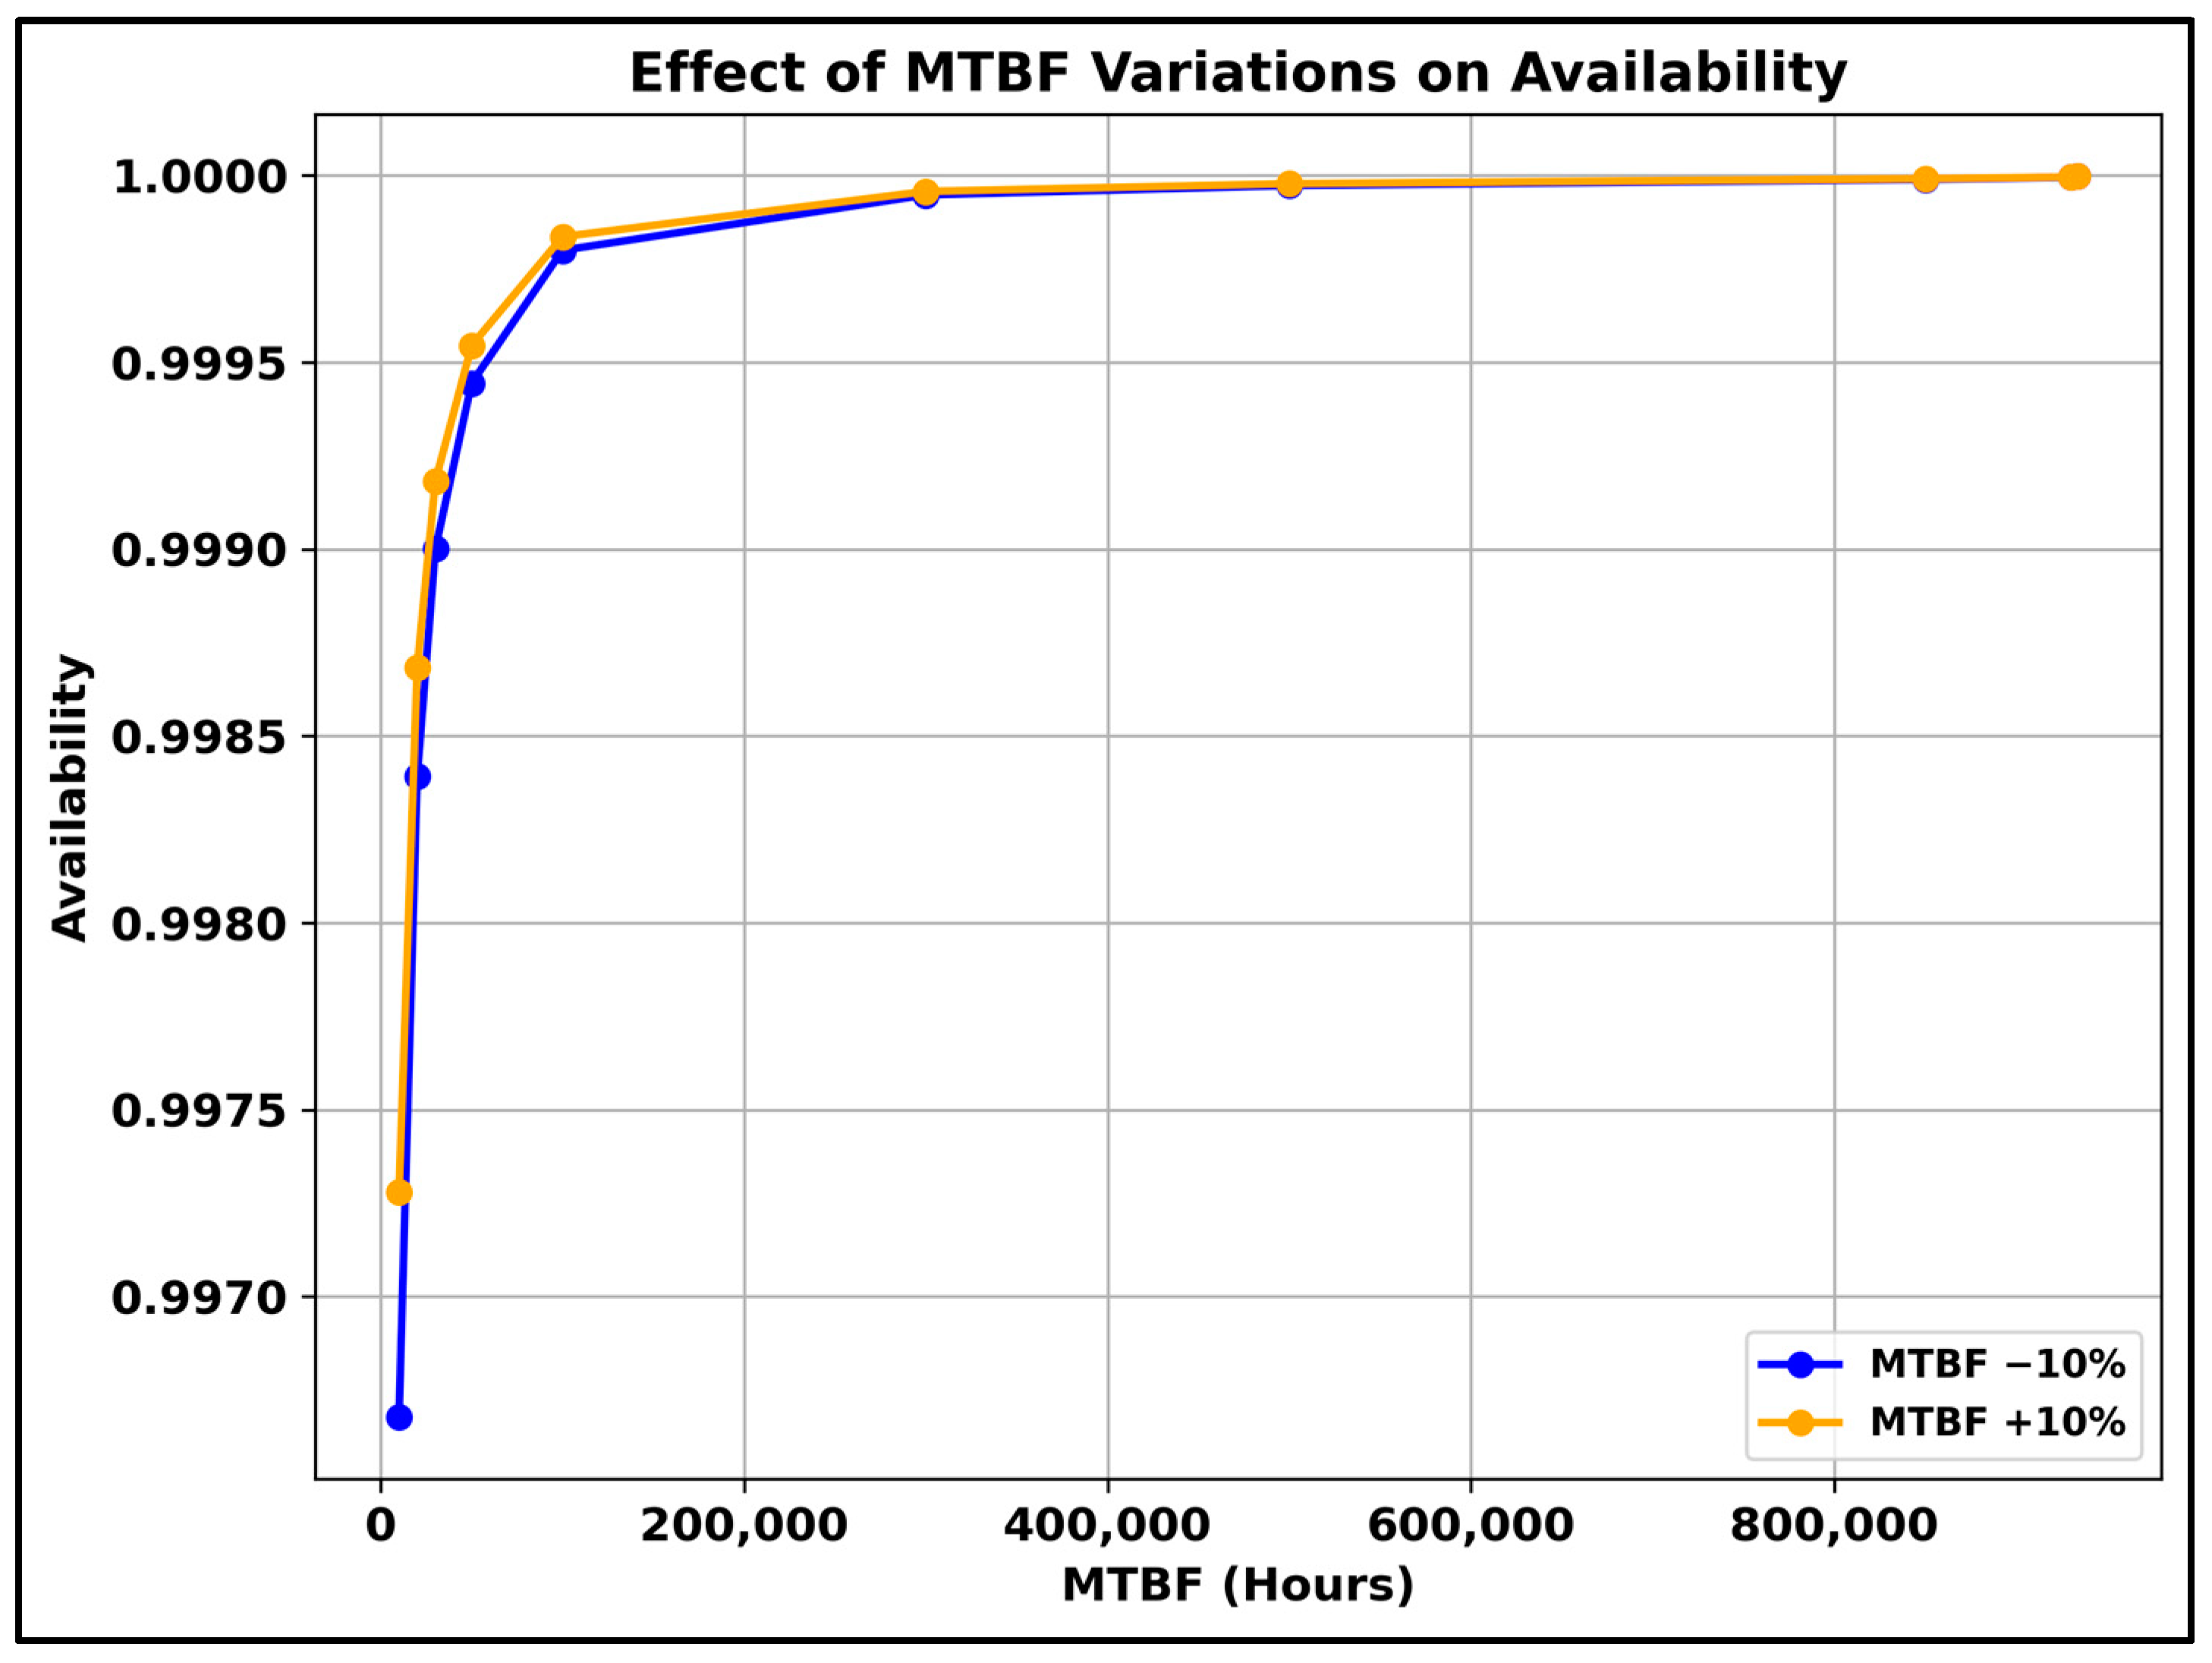
| Asset Condition State | Asset Condition Description | MTBF (Hours) | MTTR (h) | Failure Rate (per Year) | Asset Availability (Percentage) |
|---|---|---|---|---|---|
| 10 | Brand new or near new condition | 933,708 | 2 | 0.009382 | 99.999% |
| 9 | Brand new or near new condition | 930,000 | 4 | 0.009419 | 99.999% |
| 8 | Fully operational asset | 850,000 | 8 | 0.010306 | 99.999% |
| 7 | Partially operational asset with some failures | 500,000 | 12 | 0.017520 | 99.997% |
| 6 | Partially operational asset with some failures | 300,000 | 14 | 0.029200 | 99.995% |
| 5 | Fair condition | 100,000 | 18 | 0.087600 | 99.982% |
| 4 | Poor condition and needs component renewal (battery or other parts) | 50,000 | 25 | 0.175200 | 99.950% |
| 3 | Poor condition and needs component renewal (battery or other parts) | 30,000 | 27 | 0.292000 | 99.910% |
| 2 | Critical condition and near end of life | 20,000 | 29 | 0.438000 | 99.855% |
| 1 | Critical condition and near end of life | 10,000 | 30 | 0.876000 | 99.701% |
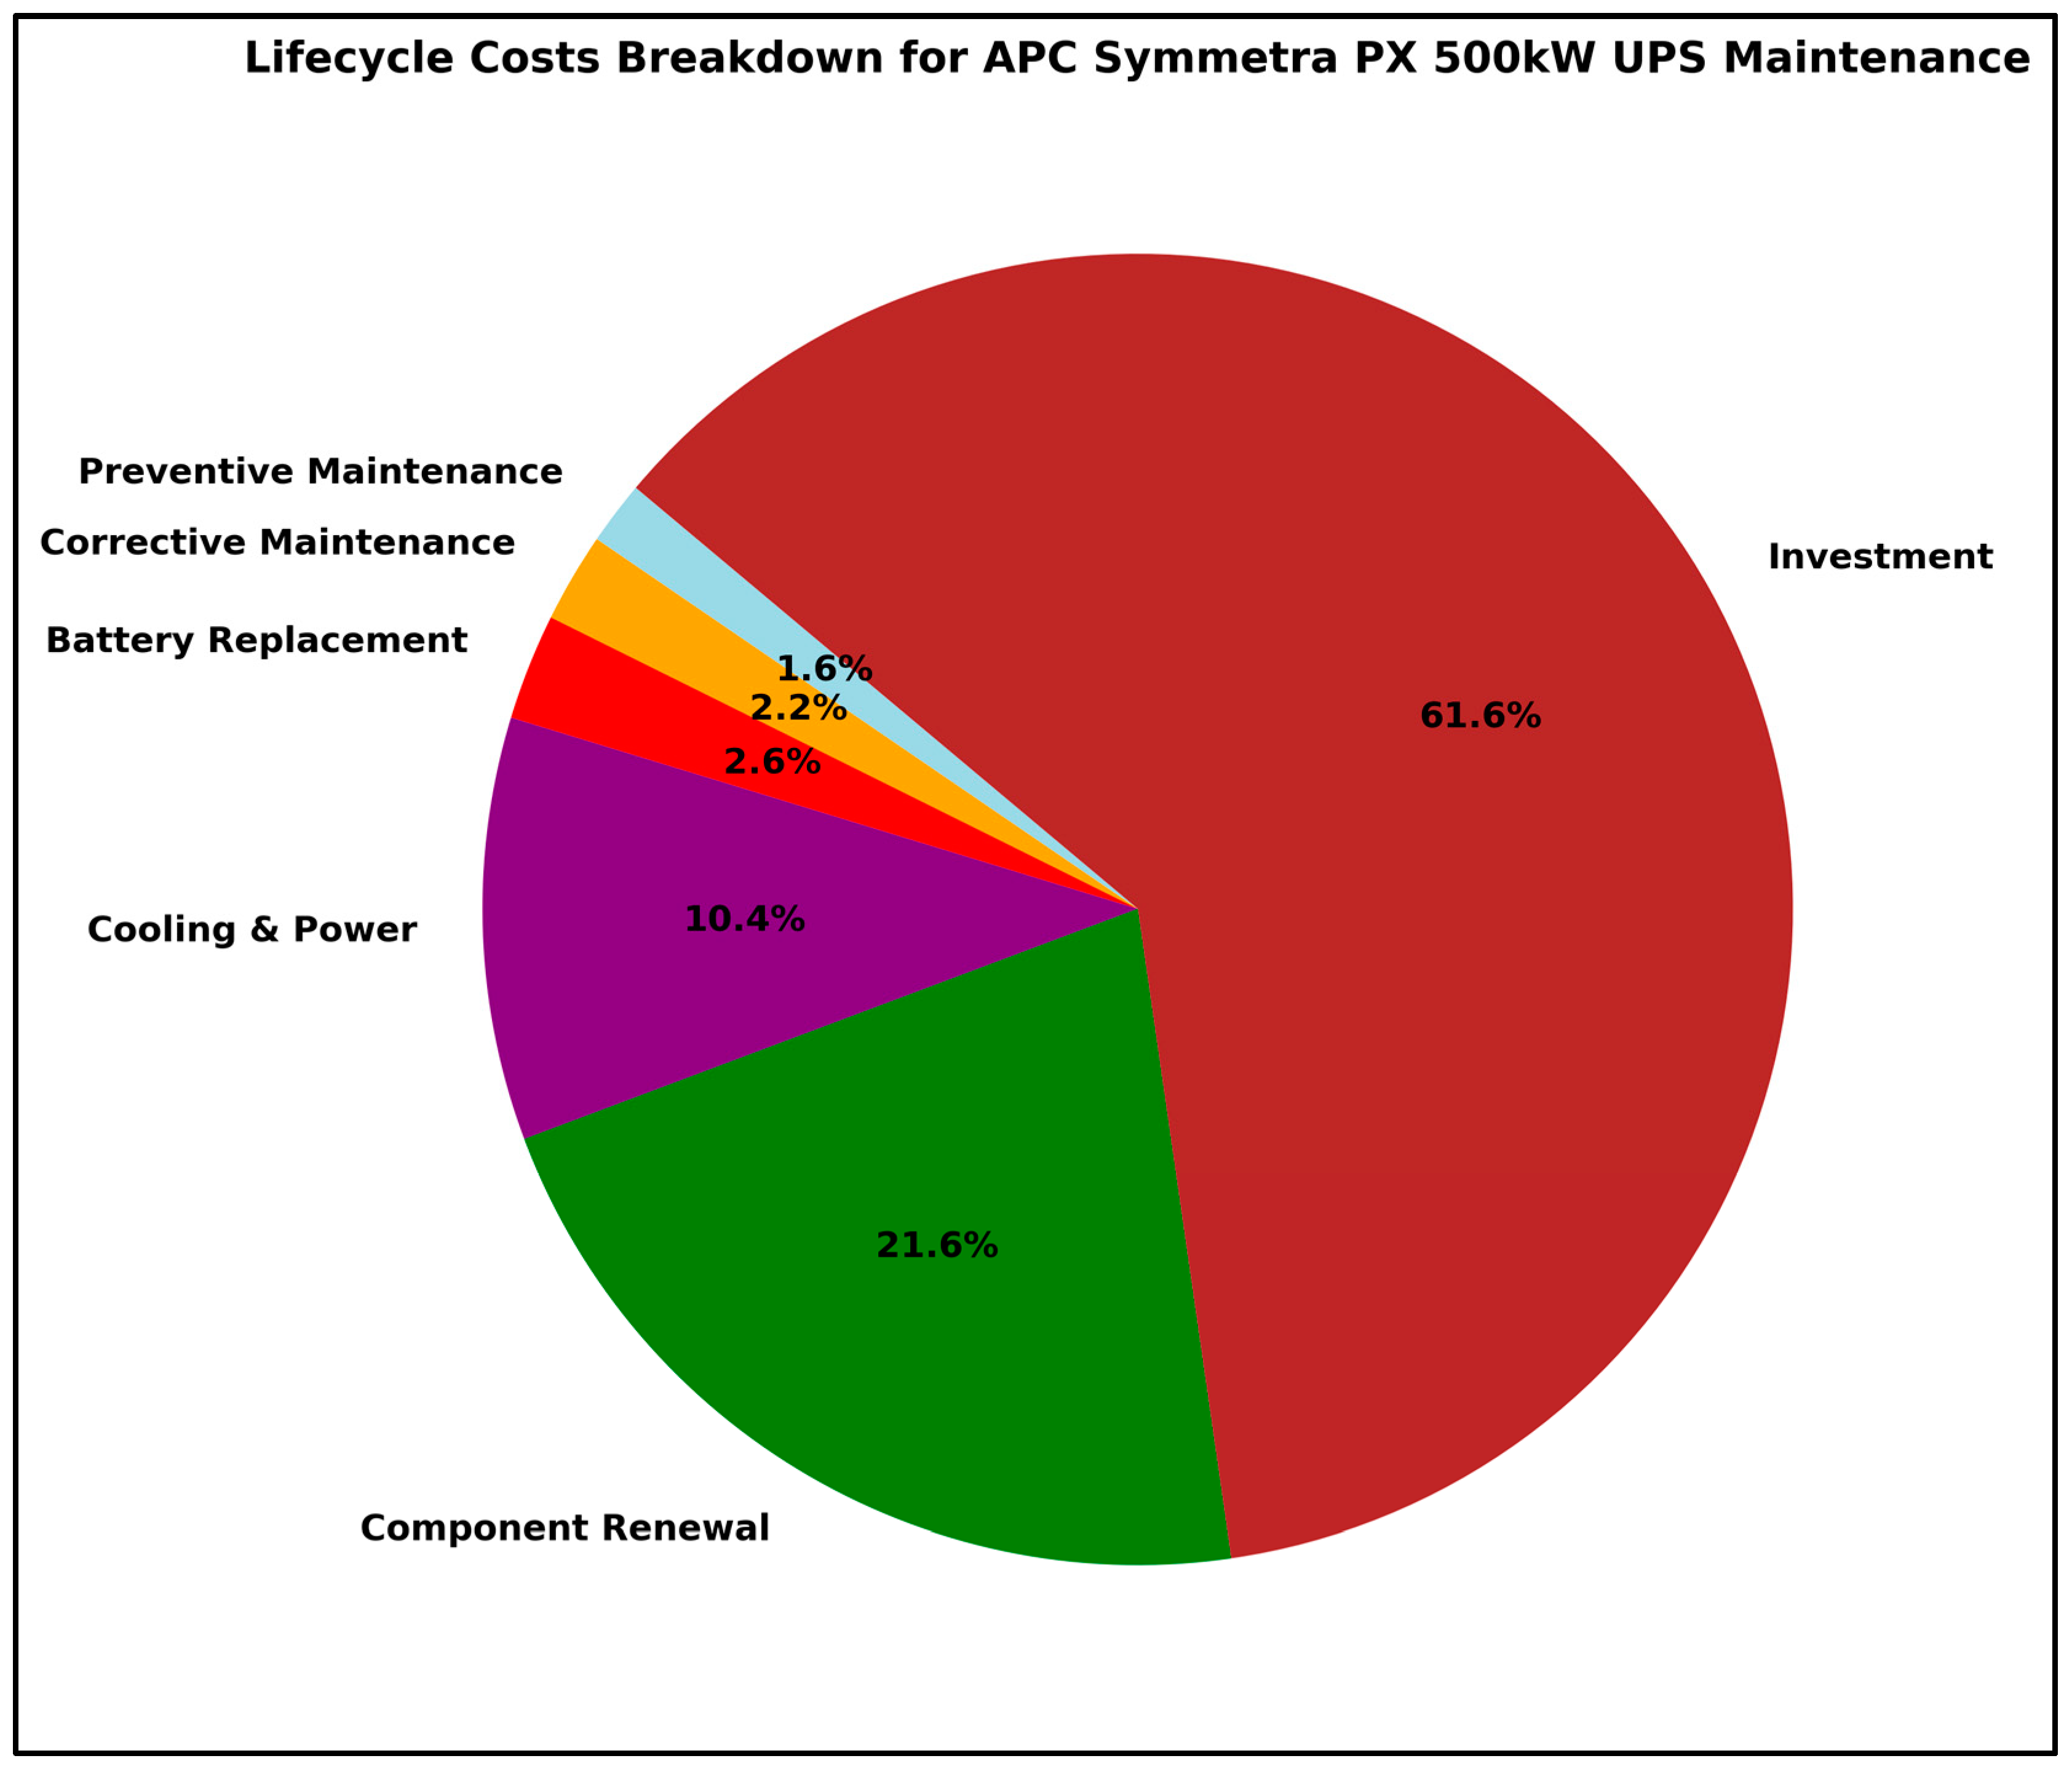
| Manufacturer’s Maintenance Service(s) | Cost per Year (USD) |
|---|---|
| New device (APC Symmetra PX 500 kW) | 261,464 |
| Electric critical power and cooling service advantage ultra service plan—on-site | 44,269 |
| APC modular battery replacement service—installation and configuration—on-site—includes installation, maintenance, replacement, or removal of one UPS battery during business hours | 9049 |
| APC on-site service on-site warranty extension—extended service agreement—parts and labor (for UPS 300–500 KVA)—1 year—on-site—business hours | 6660 |
| On-site service upgrade to factory warranty or existing on-site service contract—4-hour response | 2704 |
| APC modular battery replacement service scheduling upgrade to 7 × 24 (7 days a week and 24 h a day)—installation/configuration (for UPS battery)—on-site | 2073 |
| APC 7 × 24 scheduling upgrade from existing preventive maintenance service—1 incident—on-site | 1027 |
| Type of Maintenance Action | Cost per Year (USD) |
|---|---|
| Service for each incident/failure (CF) | USD 1027 × (yearly failure rate) |
| Preventive maintenance (inspection) (CPM) | USD 6656 |
| Corrective maintenance (CCM) | USD 6656 + USD 2704 = USD 9363.59 |
| Battery replacement service (CB) | USD 9048.99 + USD 2072.99 = USD 11,121.98 |
| Electric critical power and cooling services (CPC) | USD 44,268.99 |
| Component renewal (CCR) (30–40% of purchasing a new device) | 0.35 × USD 261,463.99 = USD 91,500 |
| Investment (new device purchase) (CI) | USD 261,463.99 |
| Asset Group → | Group 1 (UPS_DC_10 and UPS_DC_9) | Group 2 (UPS_DC_3 to UPS_DC_8) | Group 3 (UPS_DC_1 and UPS_DC_2) | |||
|---|---|---|---|---|---|---|
| Month ↓ | Monthly Failures | Monthly Maintenance Costs (USD) | Monthly Failures | Monthly Maintenance Costs (USD) | Monthly Failures | Monthly Maintenance Costs (USD) |
| 1 | 0.68522 | 1344 | 0.16190 | 2428 | 0.16349 | 12,410 |
| 2 | 0.49430 | 1148 | 0.17080 | 2438 | 0.19092 | 12,438 |
| 3 | 0.37850 | 1029 | 0.18890 | 2456 | 0.22295 | 12,471 |
| 4 | 0.30827 | 957 | 0.21630 | 2484 | 0.26035 | 12,509 |
| 5 | 0.26567 | 913 | 0.25130 | 2520 | 0.30403 | 12,554 |
| 6 | 0.23983 | 887 | 0.29080 | 2561 | 0.35504 | 12,607 |
| 7 | 0.22416 | 871 | 0.33070 | 2602 | 0.41461 | 12,668 |
| 8 | 0.21465 | 861 | 0.36740 | 2639 | 0.48417 | 12,739 |
| 9 | 0.20889 | 855 | 0.39800 | 2671 | 0.56541 | 12,823 |
| 10 | 0.20539 | 851 | 0.42150 | 2695 | 0.66027 | 12,920 |
| 11 | 0.20327 | 849 | 0.43780 | 2712 | 0.77104 | 13,034 |
| 12 | 0.20198 | 848 | 0.44820 | 2722 | 0.90040 | 13,167 |
| Condition State | Asset Group | MTBF (Hours) | MTTR (Hours) | Failures (per Month) | UPS Availability (Percentage) |
|---|---|---|---|---|---|
| 10 | Group 1 | 933,708 | 2 | 0.68522 | 99.999% |
| 9 | 930,000 | 4 | 99.999% | ||
| 8 | Group 2 | 850,000 | 8 | 0.16190 | 99.999% |
| 7 | 500,000 | 12 | 99.998% | ||
| 6 | 300,000 | 14 | 99.995% | ||
| 5 | 100,000 | 18 | 99.982% | ||
| 4 | 50,000 | 25 | 99.950% | ||
| 3 | 30,000 | 27 | 99.910% | ||
| 2 | Group 3 | 20,000 | 29 | 0.16349 | 99.855% |
| 1 | 10,000 | 30 | 99.701% |
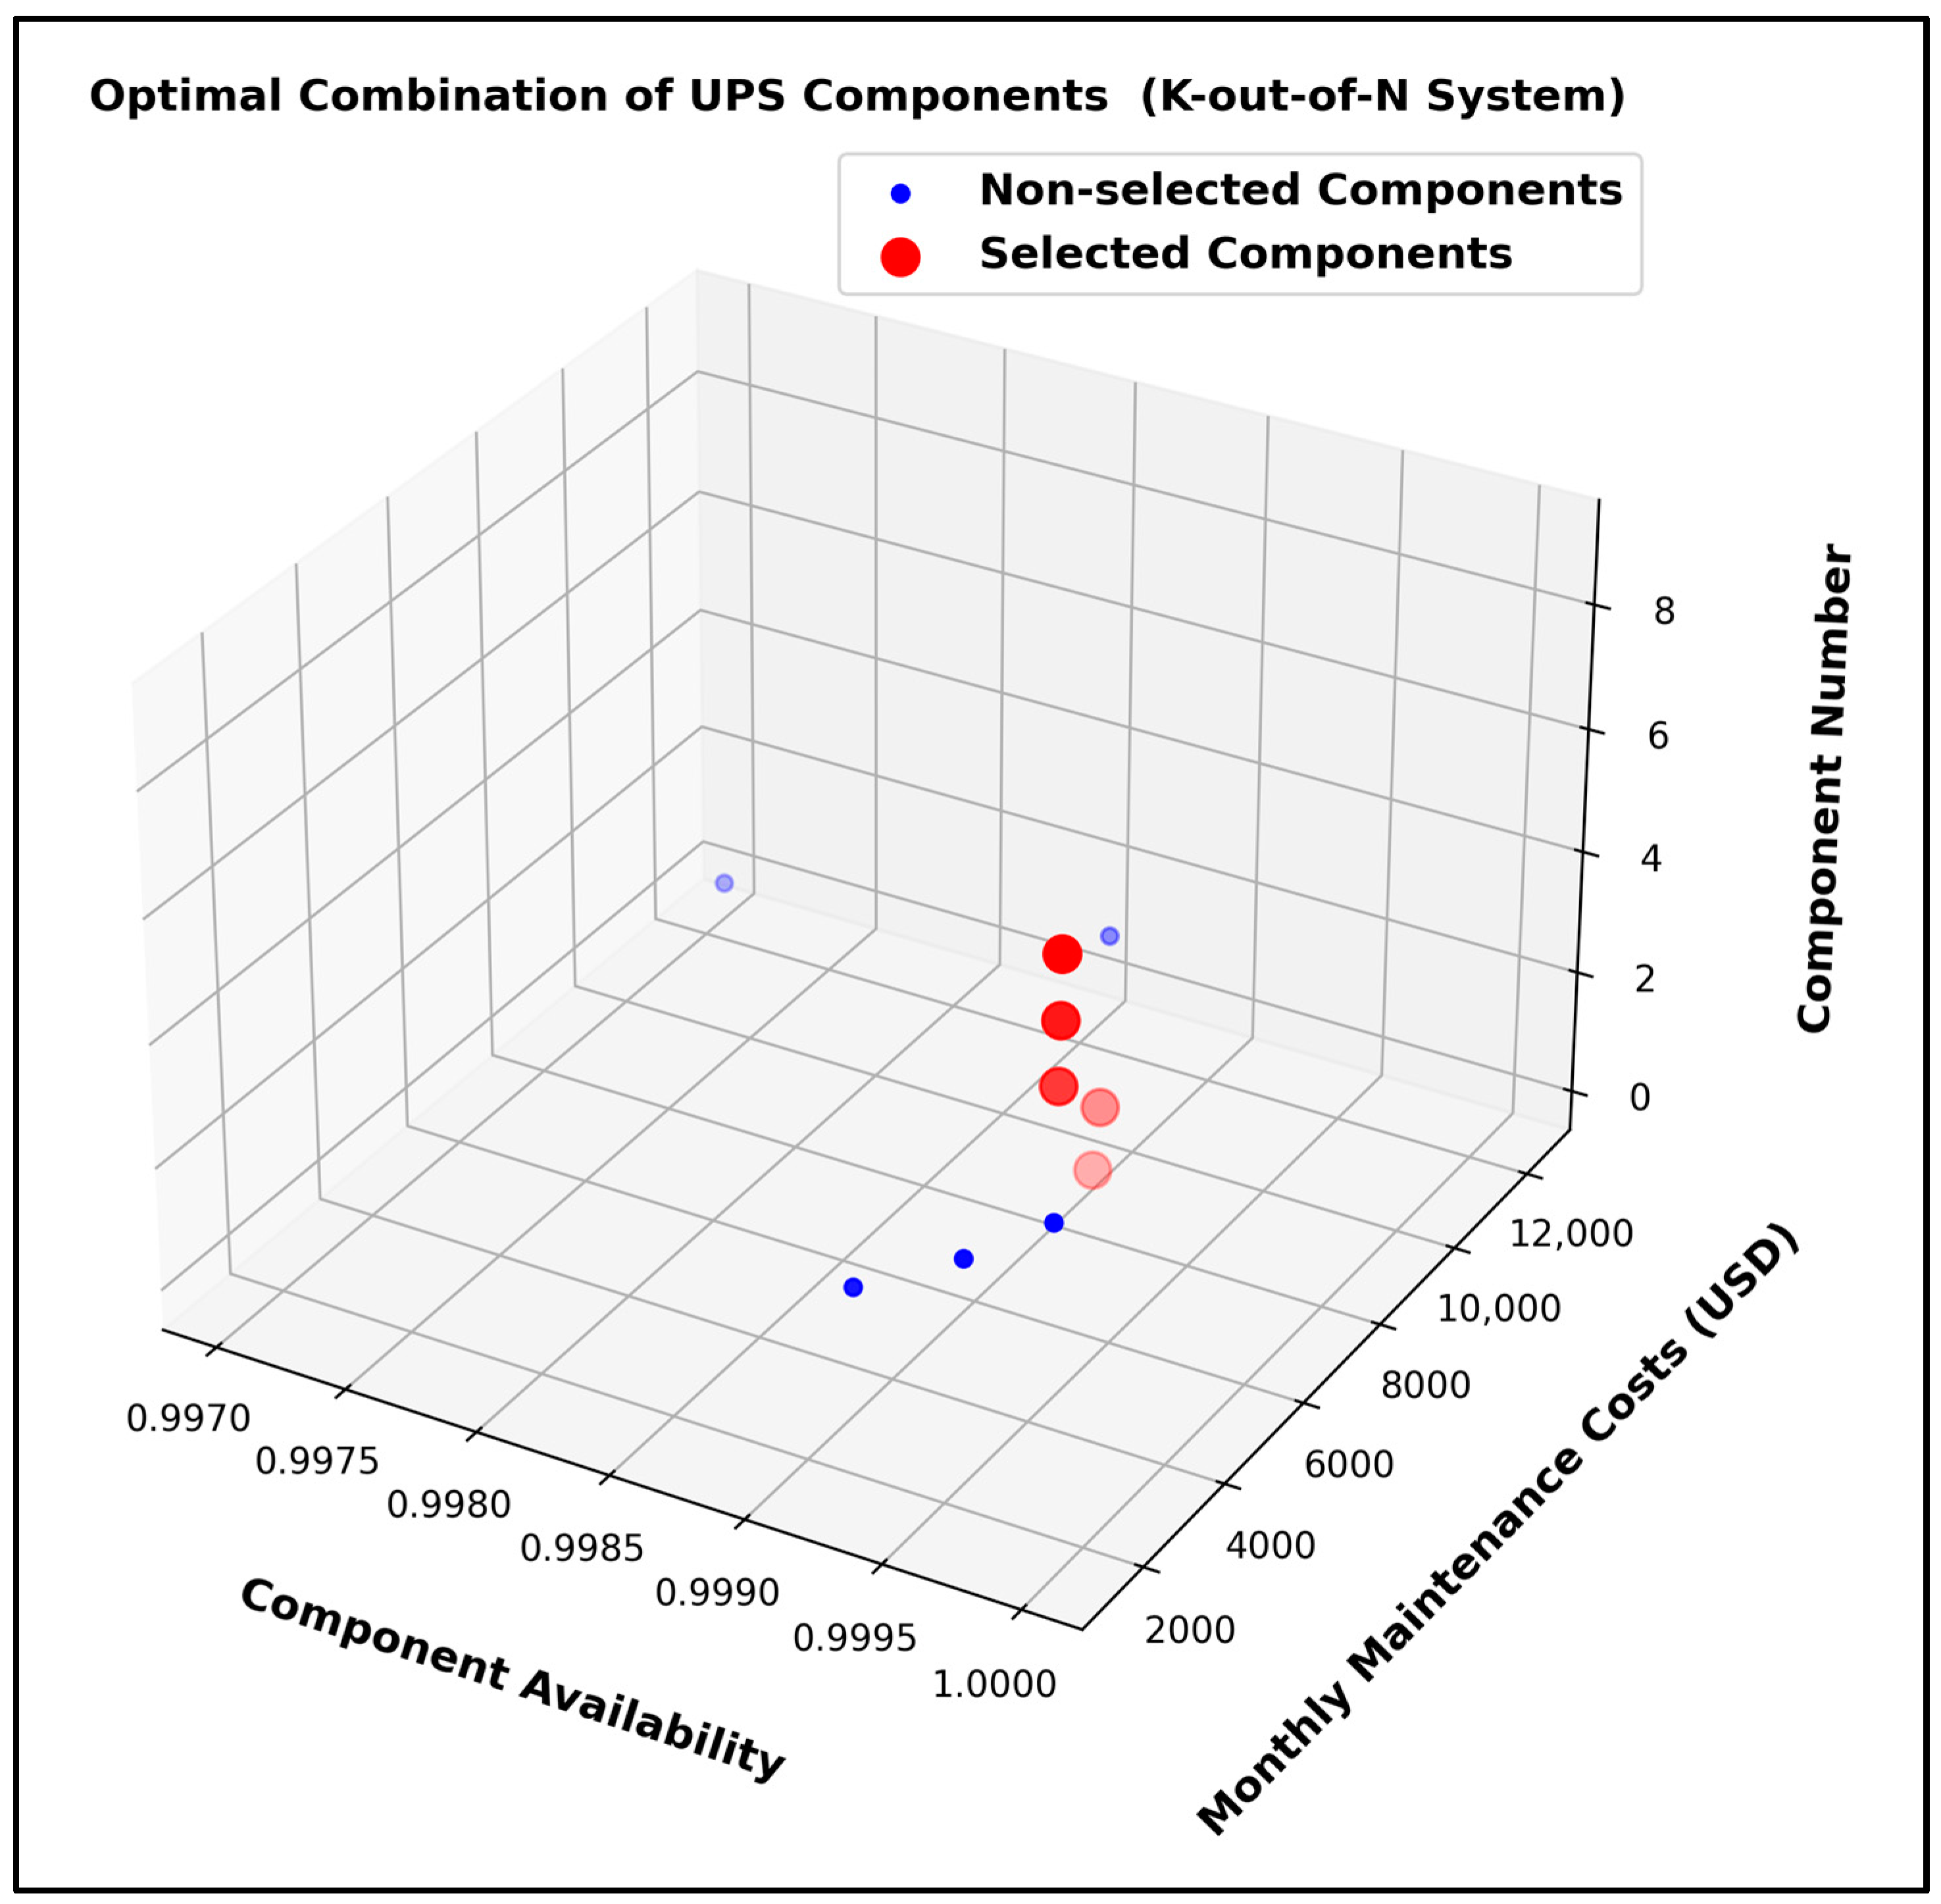
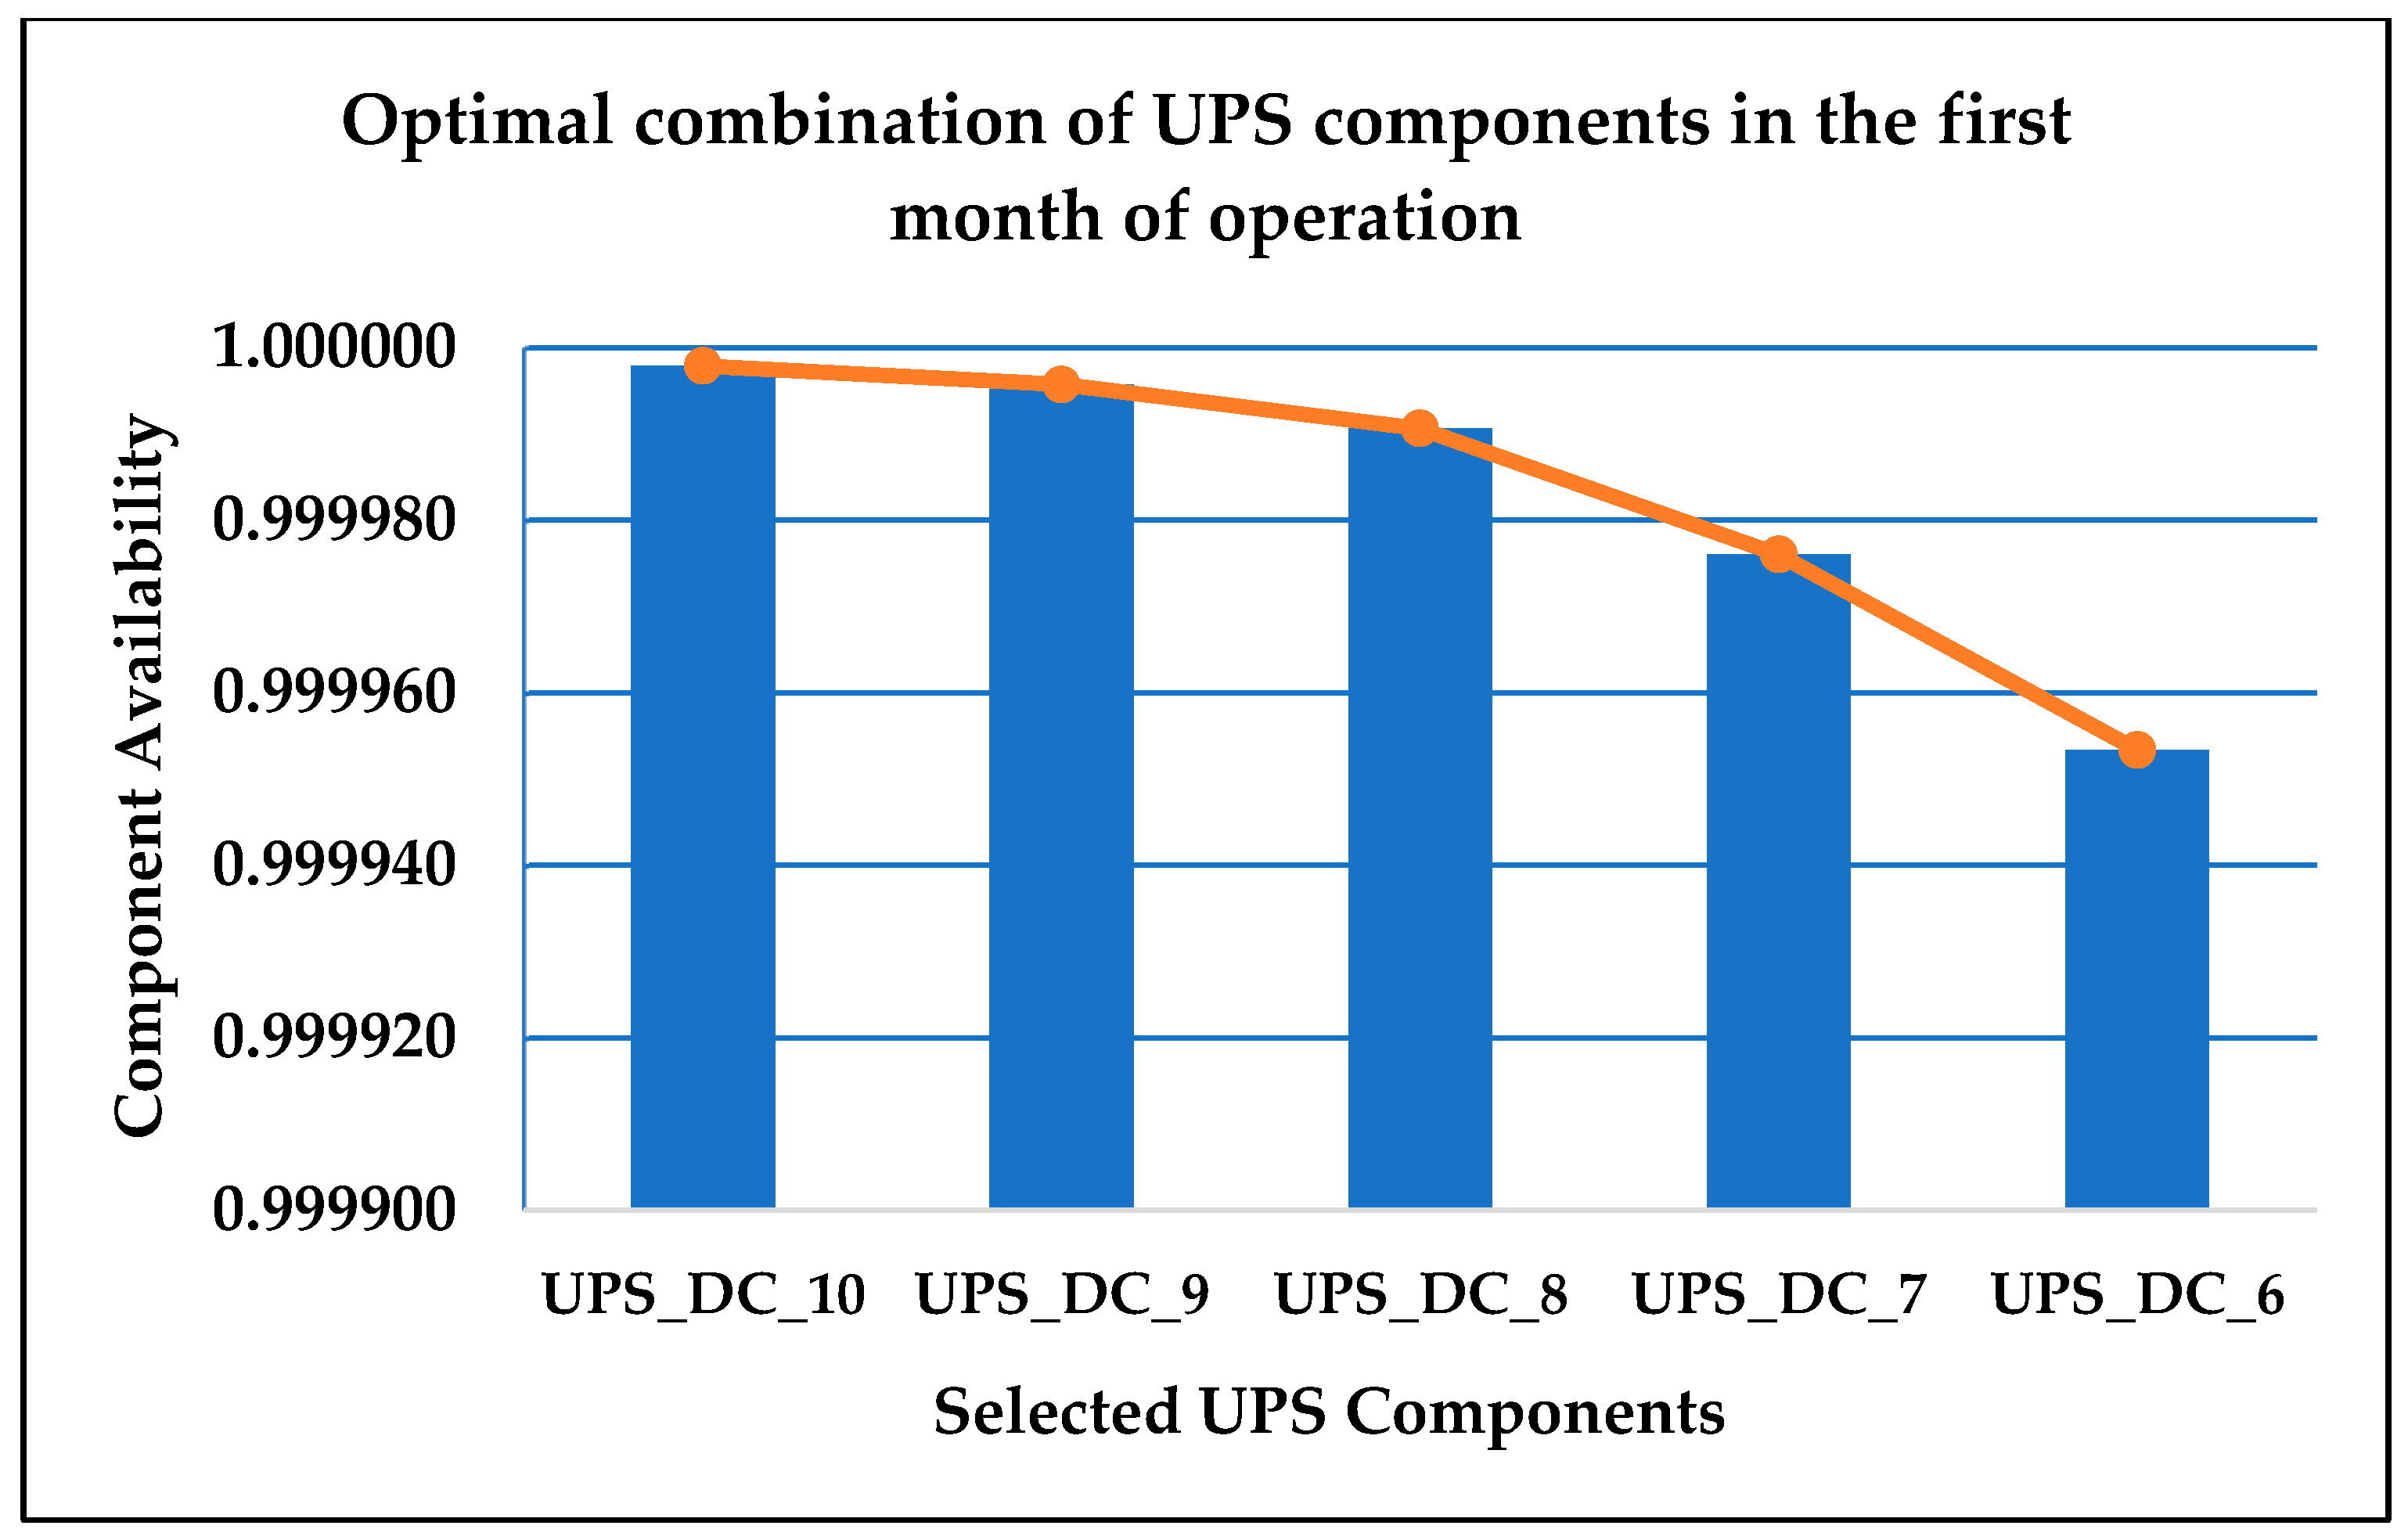
| Component | Asset Condition State | Available Components for Maintenance | Selected Components for Maintenance | Monthly Maintenance Costs for Available (n) Components (USD) | Monthly Maintenance Costs for Selected (k) Components (USD) |
|---|---|---|---|---|---|
| UPS_DC_10 | 10 | 1 | 1 | 1344 | 1344 |
| UPS_DC_9 | 9 | 1 | 1 | 1344 | 1344 |
| UPS_DC_8 | 8 | 1 | 1 | 2428 | 2428 |
| UPS_DC_7 | 7 | 1 | 1 | 2428 | 2428 |
| UPS_DC_6 | 6 | 1 | 1 | 2428 | 2428 |
| UPS_DC_5 | 5 | 1 | 0 | 2428 | 0 |
| UPS_DC_4 | 4 | 1 | 0 | 2428 | 0 |
| UPS_DC_3 | 3 | 1 | 0 | 2428 | 0 |
| UPS_DC_2 | 2 | 1 | 0 | 12,410 | 0 |
| UPS_DC_1 | 1 | 1 | 0 | 12,410 | 0 |
| Total: | 10 | 5 | Total Monthly Maintenance Costs: | 9973 | |
| Total System Availability = 99.991% ≥ 99.671% (Tier 1 DC) ✓ | |||||
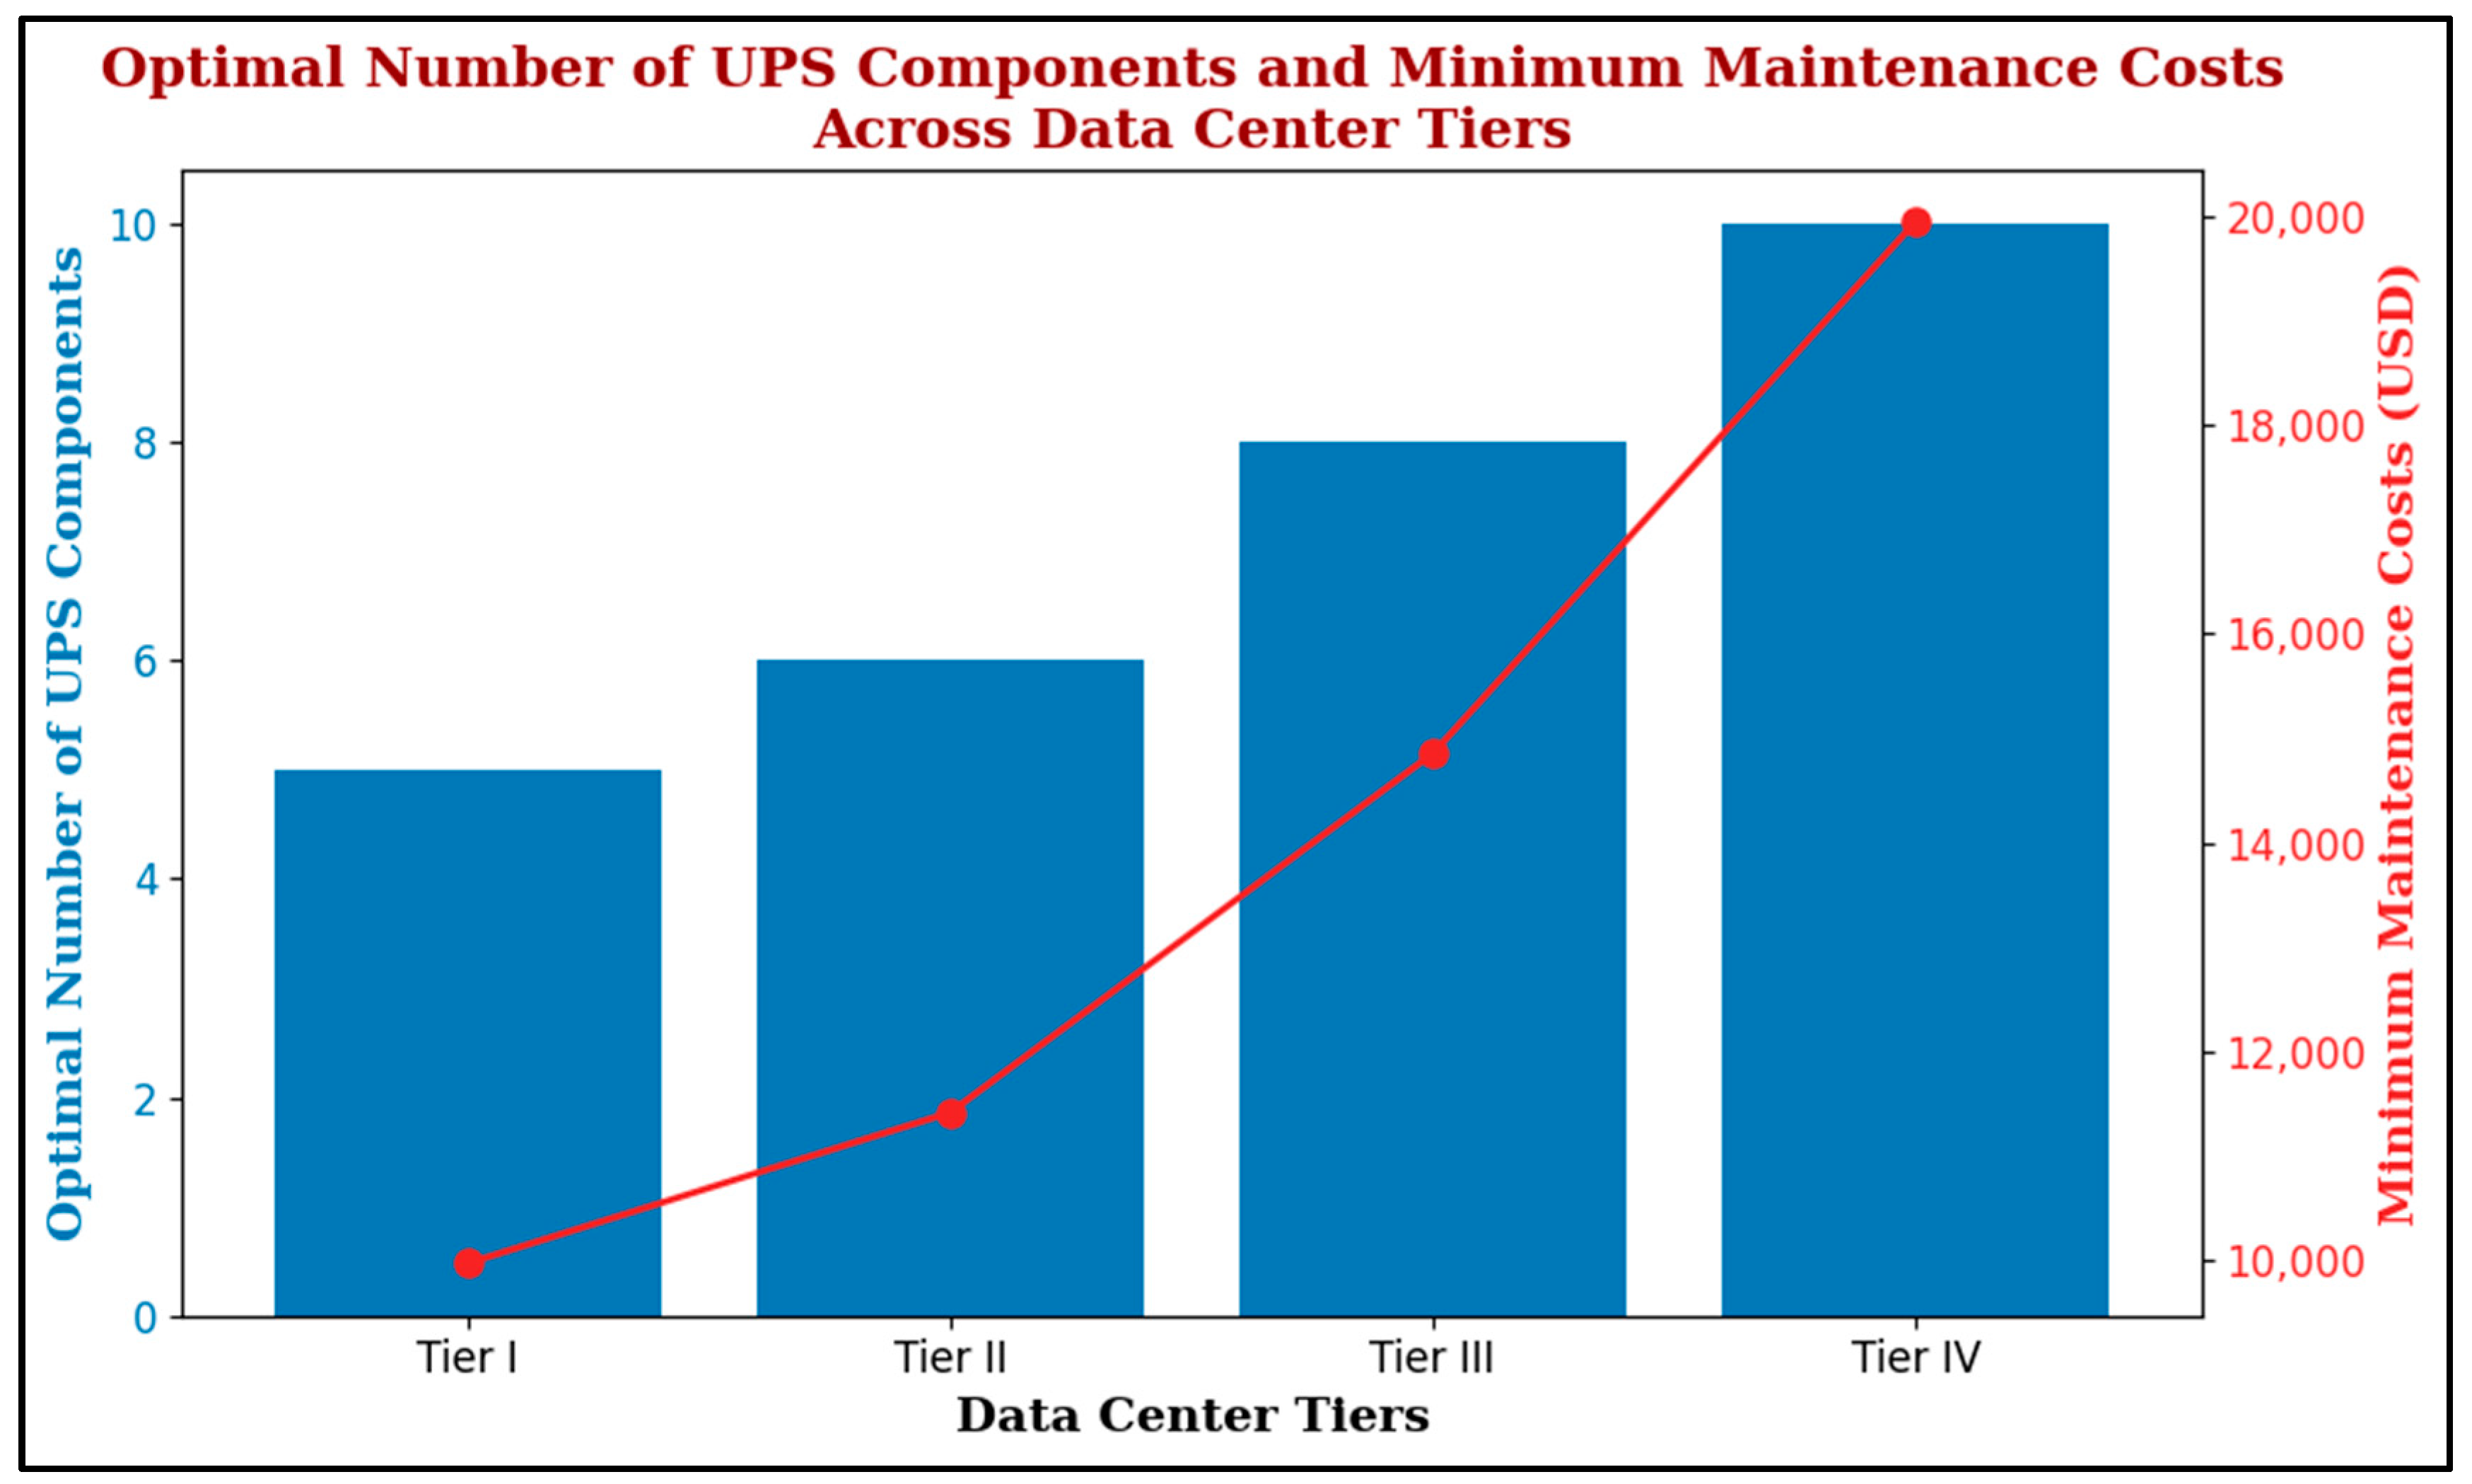
| DC Tier | Availability Requirement | Optimal Number of UPS Units | Minimum Maintenance Cost (USD) |
|---|---|---|---|
| Tier I (1) | 99.671% | 5 | 9973 |
| Tier II (2) | 99.741% | 6 | 11,417 |
| Tier III (3) | 99.982% | 8 | 14,856 |
| Tier IV (4) | 99.995% | 10 | 19,946 |
Disclaimer/Publisher’s Note: The statements, opinions and data contained in all publications are solely those of the individual author(s) and contributor(s) and not of MDPI and/or the editor(s). MDPI and/or the editor(s) disclaim responsibility for any injury to people or property resulting from any ideas, methods, instructions or products referred to in the content. |
© 2025 by the authors. Licensee MDPI, Basel, Switzerland. This article is an open access article distributed under the terms and conditions of the Creative Commons Attribution (CC BY) license (https://creativecommons.org/licenses/by/4.0/).
Share and Cite
Fadaeefath Abadi, M.; Bordbari, M.J.; Haghighat, F.; Nasiri, F. Dynamic Maintenance Cost Optimization in Data Centers: An Availability-Based Approach for K-out-of-N Systems. Buildings 2025, 15, 1057. https://doi.org/10.3390/buildings15071057
Fadaeefath Abadi M, Bordbari MJ, Haghighat F, Nasiri F. Dynamic Maintenance Cost Optimization in Data Centers: An Availability-Based Approach for K-out-of-N Systems. Buildings. 2025; 15(7):1057. https://doi.org/10.3390/buildings15071057
Chicago/Turabian StyleFadaeefath Abadi, Mostafa, Mohammad Javad Bordbari, Fariborz Haghighat, and Fuzhan Nasiri. 2025. "Dynamic Maintenance Cost Optimization in Data Centers: An Availability-Based Approach for K-out-of-N Systems" Buildings 15, no. 7: 1057. https://doi.org/10.3390/buildings15071057
APA StyleFadaeefath Abadi, M., Bordbari, M. J., Haghighat, F., & Nasiri, F. (2025). Dynamic Maintenance Cost Optimization in Data Centers: An Availability-Based Approach for K-out-of-N Systems. Buildings, 15(7), 1057. https://doi.org/10.3390/buildings15071057