Article

Experimental Analysis of Sound Propagation and Room Acoustics in Airport Terminal Piers

State Key Laboratory of Subtropical Building and Urban Science, School of Architecture, South China University of Technology, No. 381, Wushan Rd, Guangzhou 510641, China
*
Author to whom correspondence should be addressed.
Buildings 2025, 15(6), 915; https://doi.org/10.3390/buildings15060915
Submission received: 11 February 2025 / Revised: 4 March 2025 / Accepted: 7 March 2025 / Published: 14 March 2025
(This article belongs to the Section Building Energy, Physics, Environment, and Systems)

Abstract

With the rapid expansion of the aviation industry, pier-style departure lounges have become increasingly prevalent in modern airport terminals. Unlike traditional long enclosures—such as corridors, tunnels, and subway stations—airport terminal piers feature unique geometries, volumes, and interior finishes which complicate sound propagation. To address the paucity of objective acoustic data in these expansive environments, this study performed in situ measurements of impulse responses and sound pressure levels in two piers with distinct shapes and volumes within the same terminal. Key acoustic parameters, including the A-weighted equivalent continuous sound pressure level (LAeq), early decay time (EDT), reverberation time (T30), definition (D50), and speech transmission index (STI), were analyzed. The results reveal that EDT and T30 increase significantly with distance from the sound source, while D50 and STI decrease correspondingly. Specifically, compared to Pier B, which has a smaller cross-sectional area and a single-sided layout, Pier A, characterized by a larger cross-sectional area and a double-sided layout, exhibits a faster sound attenuation when the receiver is positioned closer to the source and a longer reverberation time when the receiver is farther from the source. Notably, STI does not differ significantly between the two piers. These findings enhance the understanding of acoustic behavior in large-span, elongated airport piers and provide valuable guidance for optimizing the acoustic environment of departure lounges to improve passenger comfort.

1. Introduction

The rapid expansion of the aviation industry has placed increasing emphasis on operational efficiency and passenger experience in the design of modern airport terminals [1,2]. Among various terminal layout configurations, the pier-type design has emerged as the most prevalent solution for airport departure concourses [3], as it effectively accommodates high passenger volumes, facilitates smooth circulation, and enables efficient and independent security management [4,5]. However, the unique architectural characteristics of airport terminal piers—characterized by their elongated and spacious geometry, extensive use of hard-surfaced glass curtain walls, and continuous passenger movement throughout the day—set them apart from conventional elongated enclosures. These distinct features introduce complex acoustic challenges, necessitating a systematic investigation of sound propagation in such environments.
Recent research on sound propagation in elongated enclosed spaces [6,7,8,9,10] has made notable progress. However, the majority of research has concentrated on relatively smaller or functionally simpler environments, such as building corridors [11,12,13], highway tunnels [7,14,15], and subway stations [8,16,17]. While highway tunnels exhibit certain geometric similarities with elongated airport concourses, their acoustic environments are predominantly influenced by vehicular noise [18], which contrasts markedly with the soundscape of an airport concourse, thereby constraining direct comparability. Within the domain of elongated public transportation hubs, investigations into the acoustic characteristics of subway stations have been undertaken. For example, Zhao et al. [17] examined sound propagation on subway platforms, demonstrating that the complex geometries of these stations result in greater average sound pressure level (SPL) attenuation and shorter T30 compared to idealized elongated enclosures. Additionally, Shimokura et al. [16] explored the effects of various interior materials and sound source positions on the acoustic environment of subway stations. Nevertheless, subway stations differ substantially from airport piers in terms of spatial geometries, dimensions, boundary conditions, and construction materials. Consequently, the findings from these studies are not directly applicable to airport terminals.
Existing research on the acoustic environment of airport terminals has primarily focused on noise level assessments [19,20] and passengers’ subjective perceptions of the soundscape [21,22,23]. For instance, studies on noise levels in airport waiting areas indicate that indoor noise levels exhibit periodic fluctuations, typically ranging between 55 and 70 dB(A), with peak values reaching 60–70 dB(A) during busy hours [20]. Additionally, to ensure adequate speech intelligibility in public address (PA) systems, a previous study [24] recommended maintaining a signal-to-noise ratio (SNR) of at least 10 dB(A) within terminal spaces. However, passenger satisfaction studies [22,23] regarding terminal soundscapes have revealed that while PA announcements are considered the most welcomed sound source, excessively high PA volumes may cause discomfort among passengers. Existing research underscores the need for a deeper understanding of sound propagation characteristics in airport pier concourses to better balance noise control and speech intelligibility, ultimately enhancing auditory comfort and communication efficiency in terminal spaces. While previous studies have provided valuable insights through noise measurements, subjective evaluations, and computational simulations, they lack comprehensive experimental investigations based on in situ measurements. Given the elongated geometry and unique boundary conditions of pier concourses, these spaces exhibit complex sound propagation behaviors. Therefore, a systematic field study of impulse responses and sound field characteristics is crucial for developing effective acoustic optimization strategies tailored to these specialized terminal environments.
To address this limitation, this study conducts an extensive field measurement campaign in two airport pier concourses of different scales within a major international airport. Specifically, impulse responses and SPL distributions are systematically recorded and analyzed to investigate sound propagation mechanisms in these expansive and elongated environments. The study first introduces the characteristics of the measured airport piers and details the measurement methodology, including measurement positions, equipment, and procedures. The results of impulse response and SPL analyses are then presented, followed by an in-depth discussion on the influence of key spatial parameters such as distance and cross-sectional area on the concourse sound field. Finally, the findings are compared with previous research to explore potential strategies for improving speech intelligibility in airport concourses.

2. Methodology

This section primarily presents the measurement principles and the overall procedures used to obtain impulse responses and spatial sound-energy distributions in the airport departure lounges. Specifically, it introduces the acoustic equipment utilized for the measurements, the software employed for measurement and data analysis, and the methods for measuring impulse responses and sound pressure levels within the departure lounges. In addition, this section provides essential information about two typical pier-style departure lounges—differing in form and capacity—at a Chinese airport, which served as the on-site case studies for the acoustic field measurements.

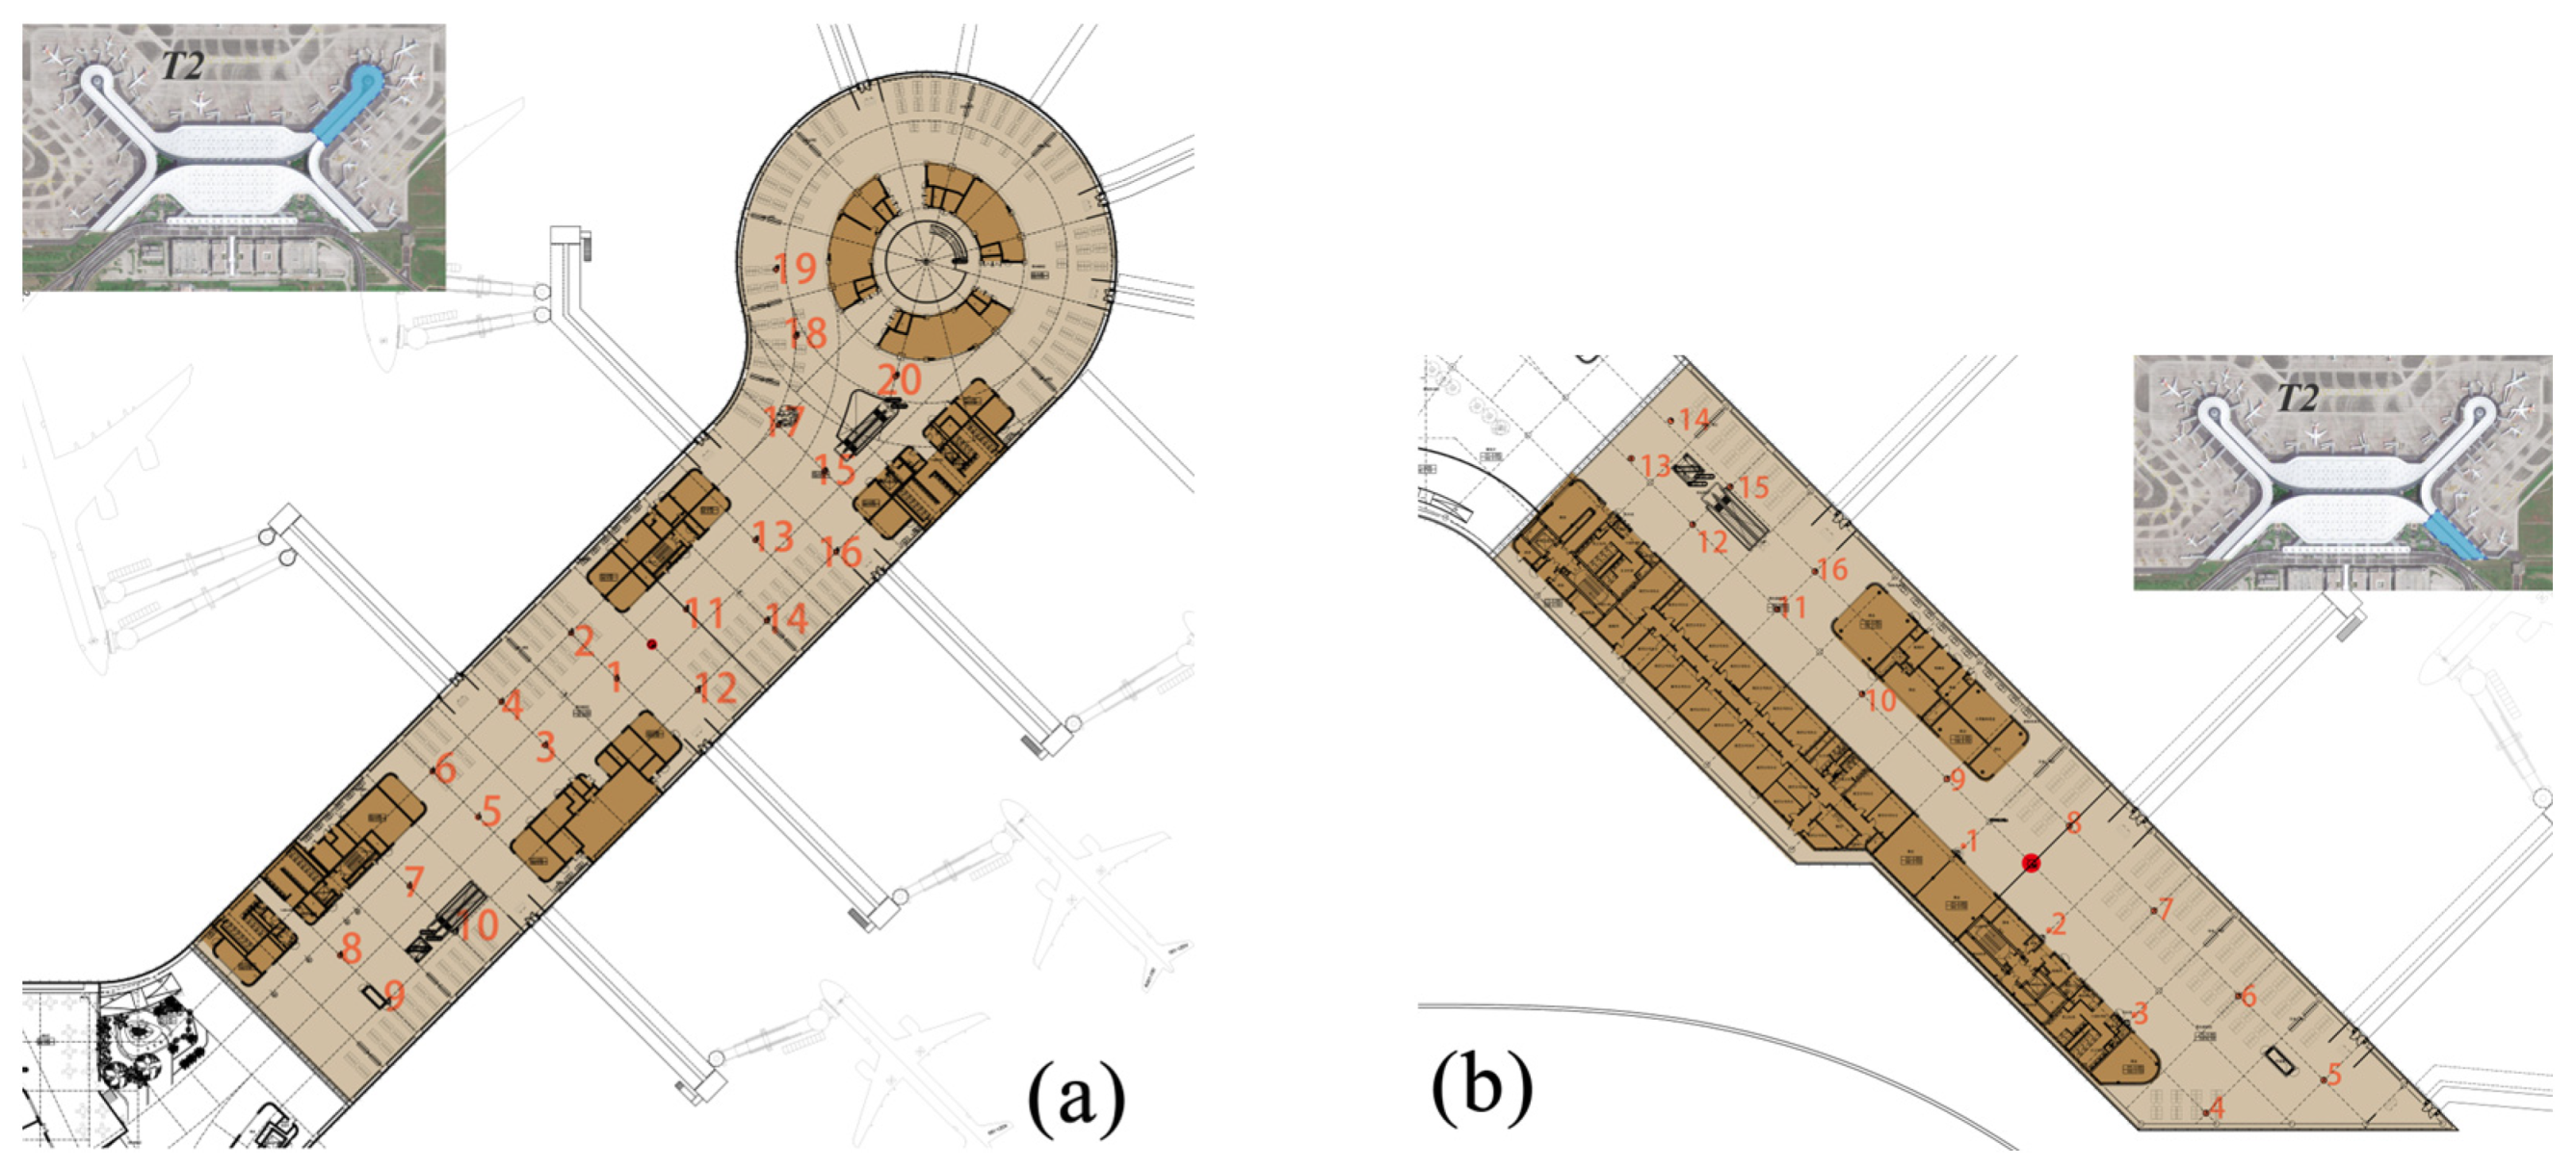
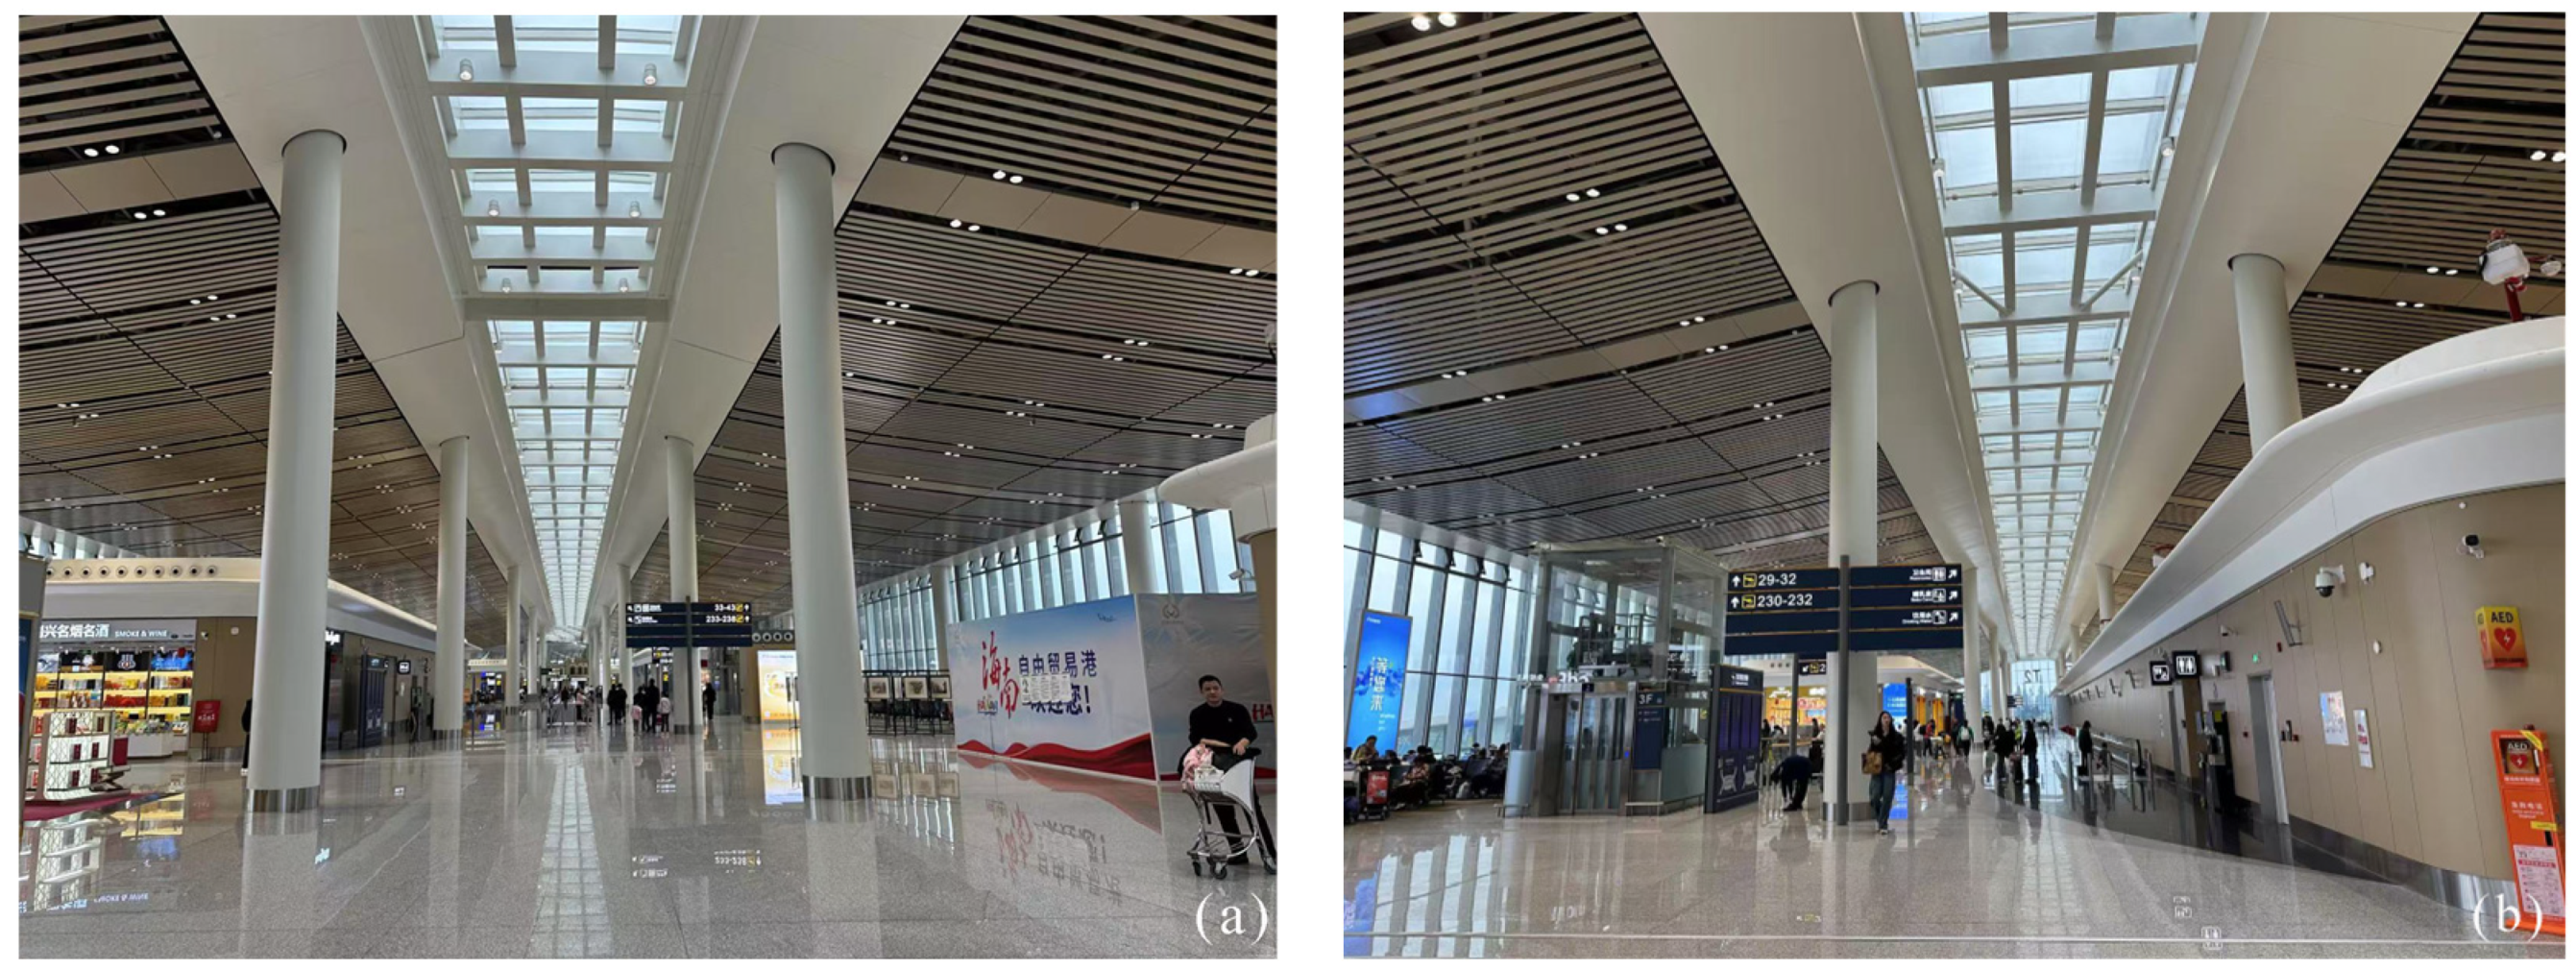
2.1. Measurement Sites in Pier-Style Departure Lounges

The airport selected for this study is Haikou Meilan International Airport (HAK) in China, which spans a total area of 1140 hectares, including an apron area of 1.2502 million square meters. The airport operates two runways and handled a passenger throughput of 24.34 million in 2023 [25]. The terminal complex has a total floor area of approximately 450,000 m2. This study focused on the T2 terminal, which covers 296,000 m2 and began operations on 2 December 2021. The terminal consists of a central main building and four symmetrical piers, accommodating 36 boarding gates.
The acoustic field measurements were carried out in two pier-style departure lounges within T2: Pier A, located in the northeast, and Pier B, located in the southeast.
Pier A serves as a dual-sided departure lounge with boarding gates on both sides. It measures 220 m in length, with a base width of 40 m that expands to 60 m at the far end. The ceiling adopts an arched design, with a central height of 12 m and side heights tapering to 8.2 m. The total area of Pier A is 10,286 m2, and its volume is 98,099 m3. The pier is equipped with longitudinal strip skylights and contains 8 boarding gates. The average sound absorption coefficient for the space is 0.11. In accordance with ISO 3382-2:2008 [26], the sound field measurements included 20 receiver points, as shown in Figure 1a. These points were uniformly distributed throughout the pier, with each located 1.2 m above the floor. The sound source was positioned on the central axis of the pier at a height of 1.5 m.
Pier B is a single-sided departure lounge, with boarding gates located only on one side. It measures 160 m in length, maintaining a base width of 40 m that narrows to 32 m at the far end. Similar to Pier A, the ceiling features an arched design with a maximum height of 12 m and a minimum height of 8.2 m. The total area of Pier B is 5565 m2, and its volume is 60,414 m3. The pier includes central strip skylights and accommodates 4 boarding gates, with an average sound absorption coefficient of 0.11. As shown in Figure 1b, 16 receiver points were arranged uniformly along the pier for the sound field measurements. Each point was positioned 1.2 m above the floor, and the sound source was placed along the pier’s central axis at a height of 1.5 m.

2.2. Acoustic Materials in Pier-Style Departure Lounges

The interior design and material configuration of Pier A and Pier B in the T2 terminal of Haikou Meilan International Airport are consistent. Figure 2 shows the interior decoration of the departure lounges, where Figure (a) represents Pier A, and Figure (b) represents Pier B.
The flooring in the main circulation areas is finished with stone tiles. The seating areas are equipped with high-density polyurethane (PU) seats featuring metal-framed armrests. Carpets are installed beneath the seating areas to enhance comfort and acoustic performance. In localized sections, soft-upholstered sofas or high stools provide additional seating options. The departure lounges feature large glass curtain walls on both sides, allowing ample natural light to illuminate the space. The primary ceiling consists of aluminum slats, each 200 mm wide, with 100 mm gaps between adjacent slats. The central axis of the ceiling is fitted with grid-style skylights made of aluminum panels. In the commercial zones, the sidewalls are clad with wooden panels, while the ceilings use Glass Fiber Reinforced Gypsum (GRG) boards. The average sound absorption coefficient of both departure lounges is approximately 0.11, reflecting the combined effects of the architectural finishes and furnishings.

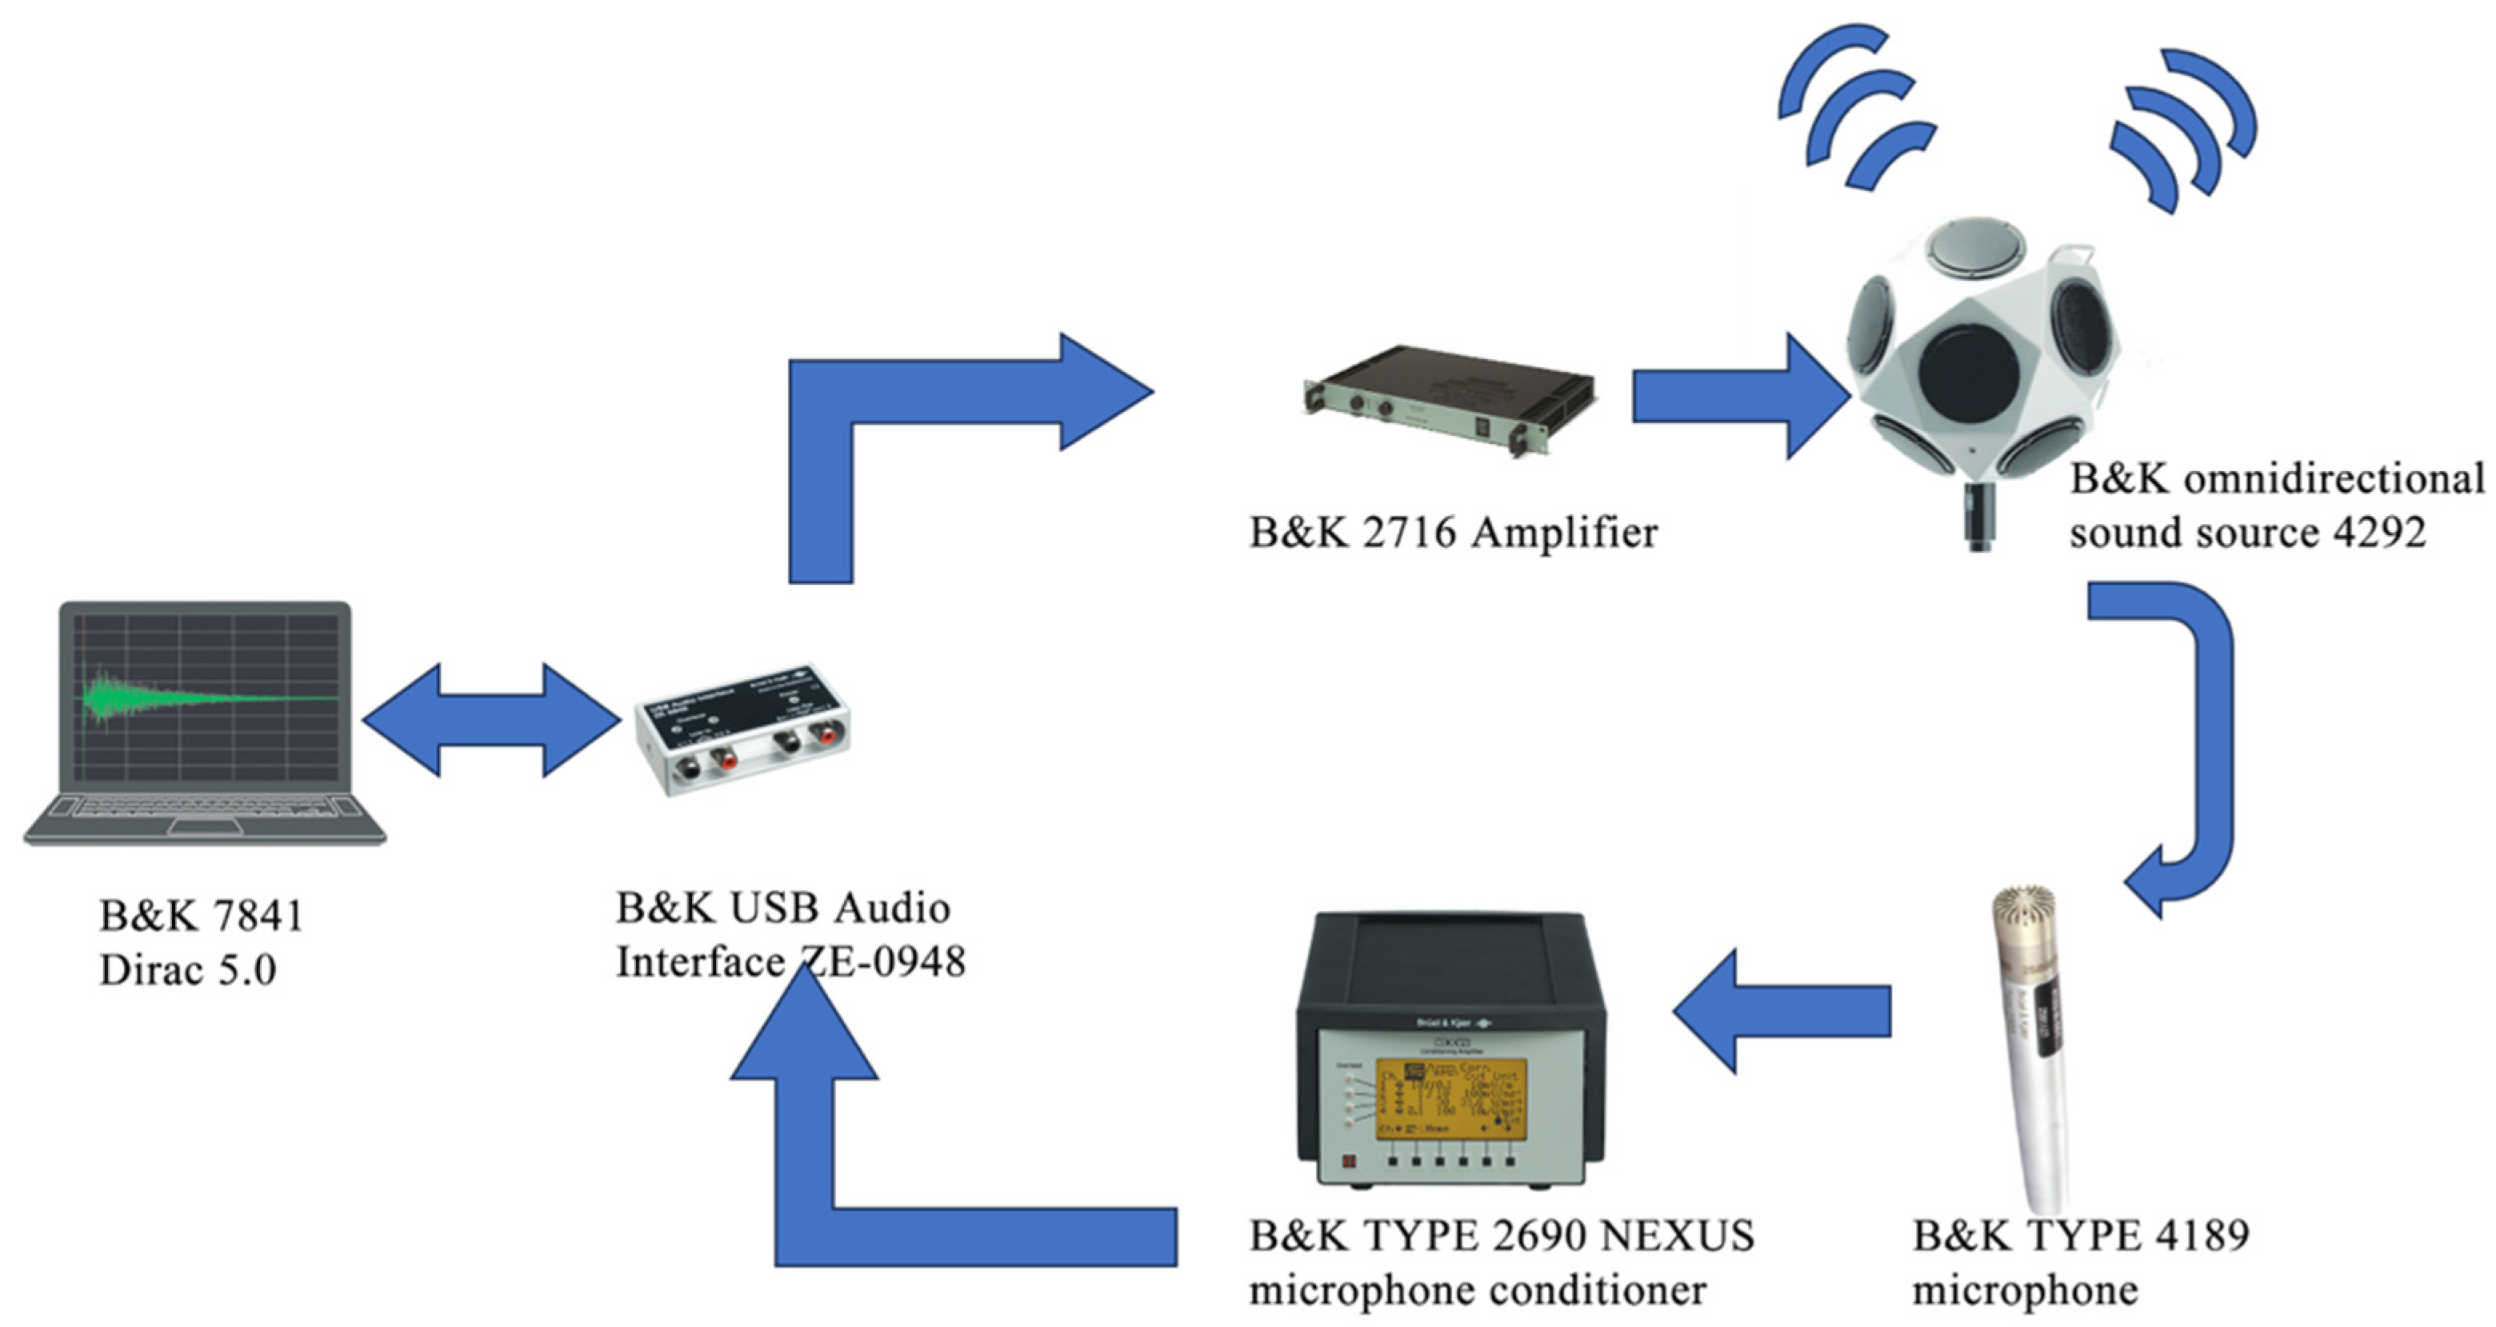
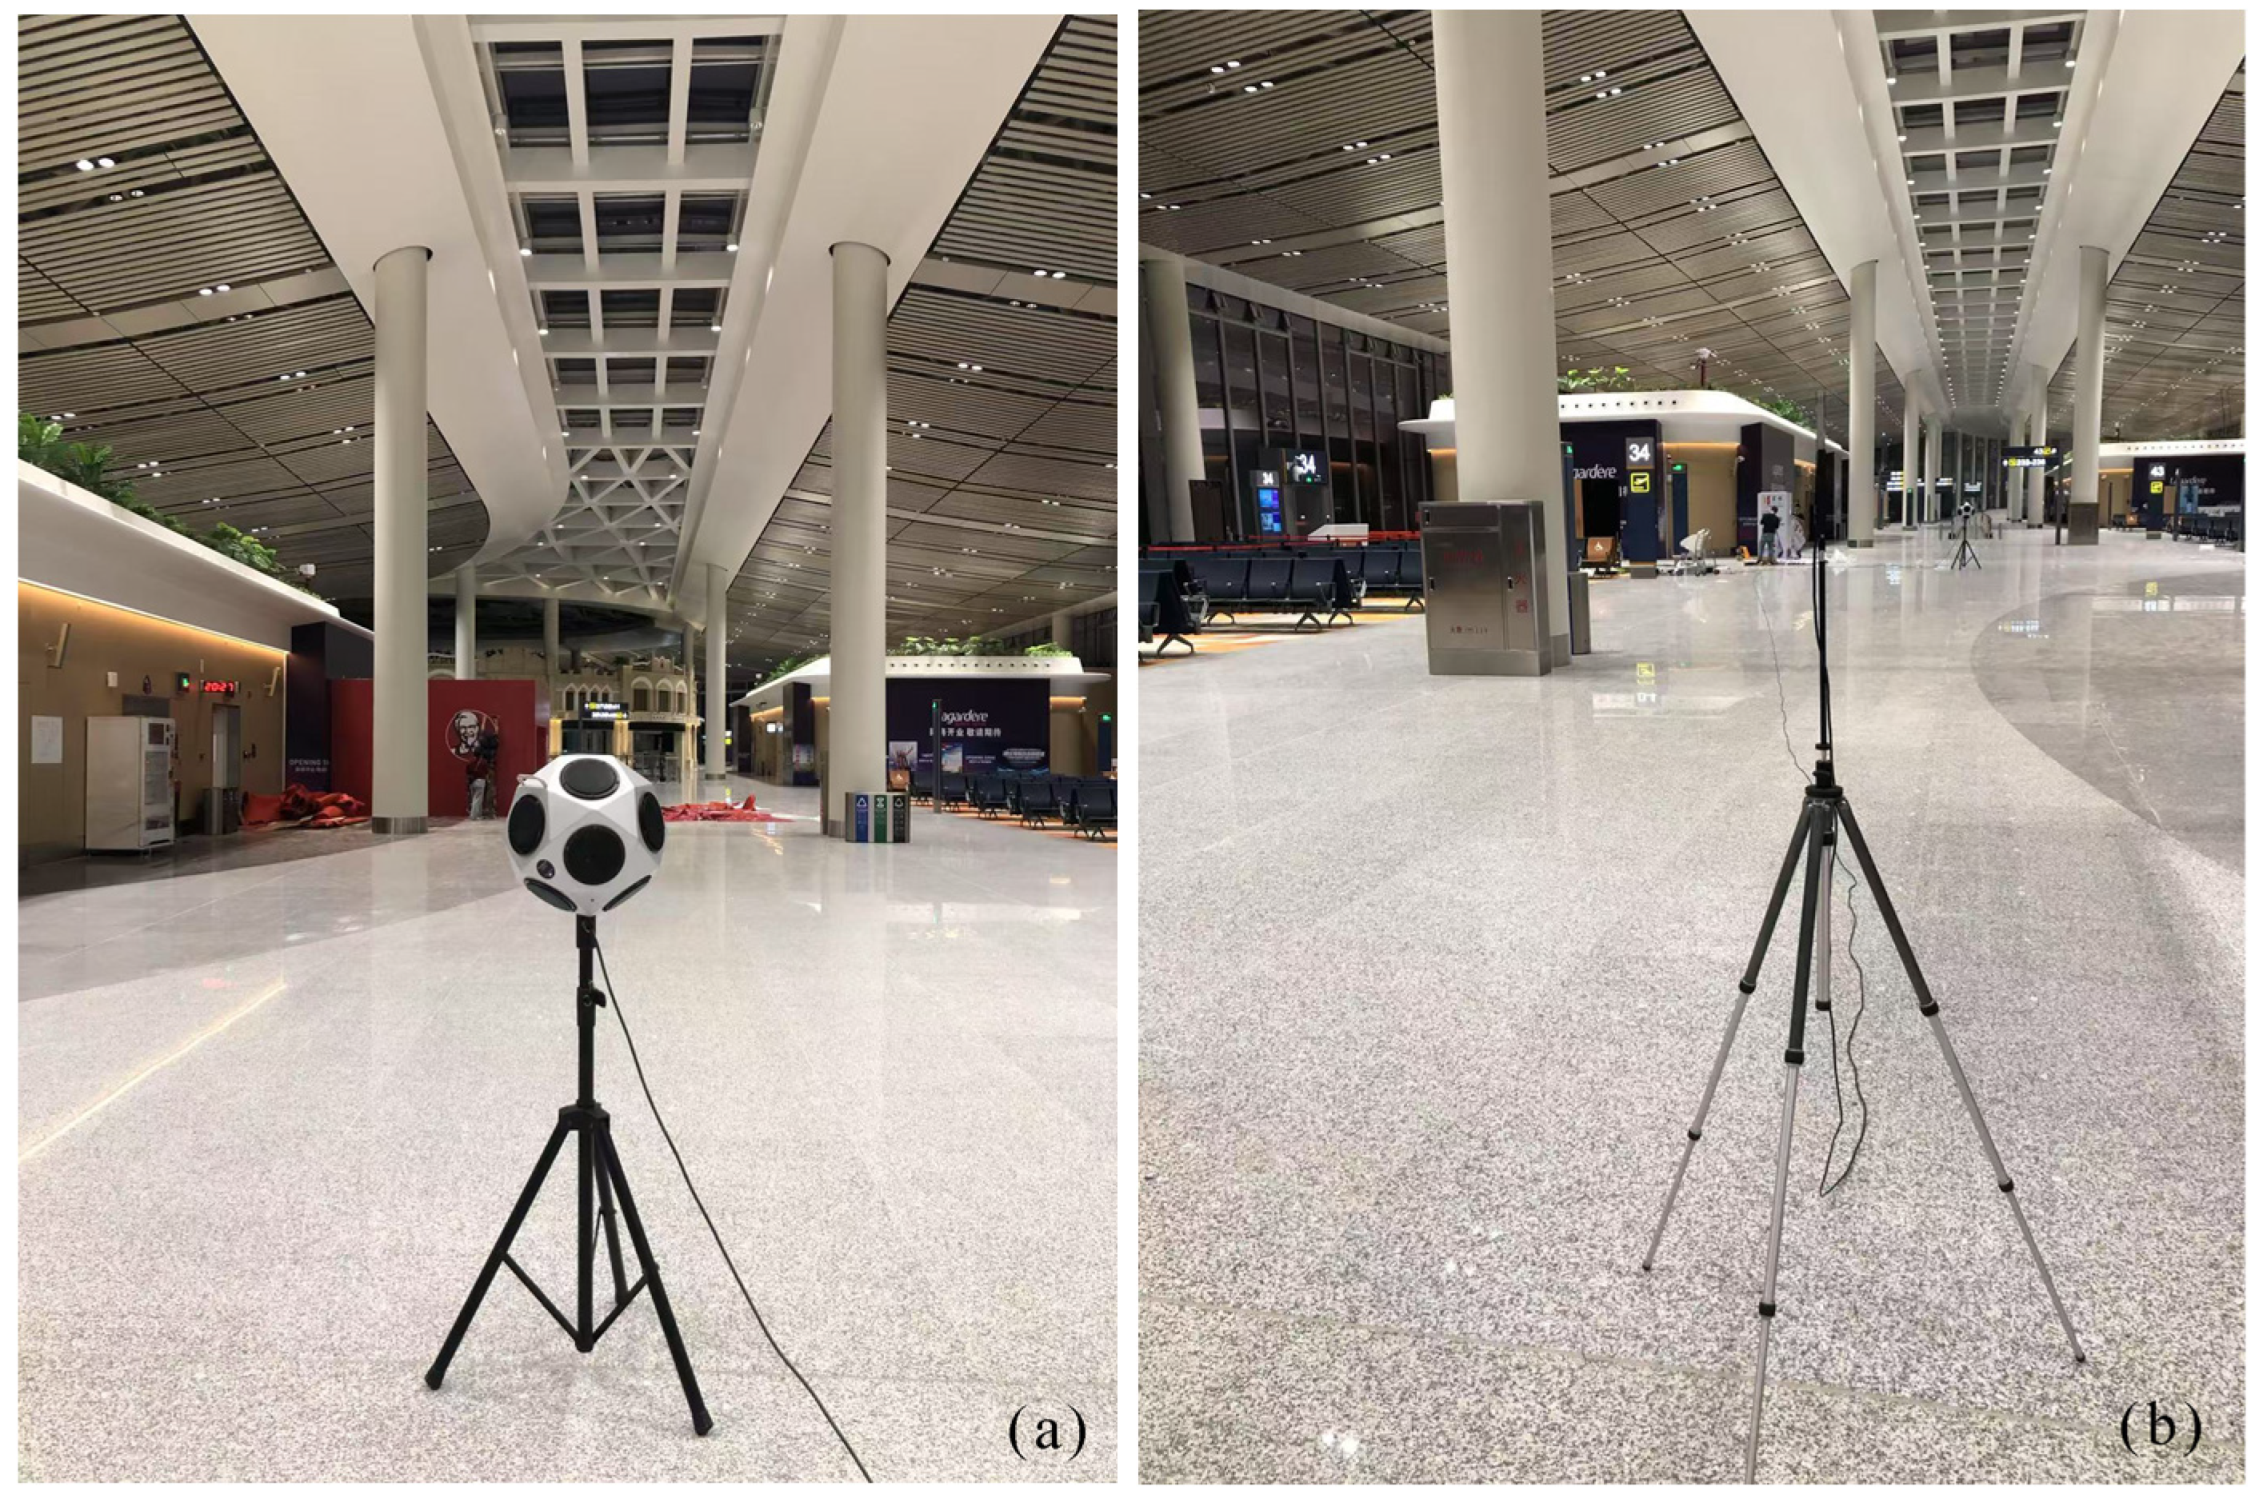
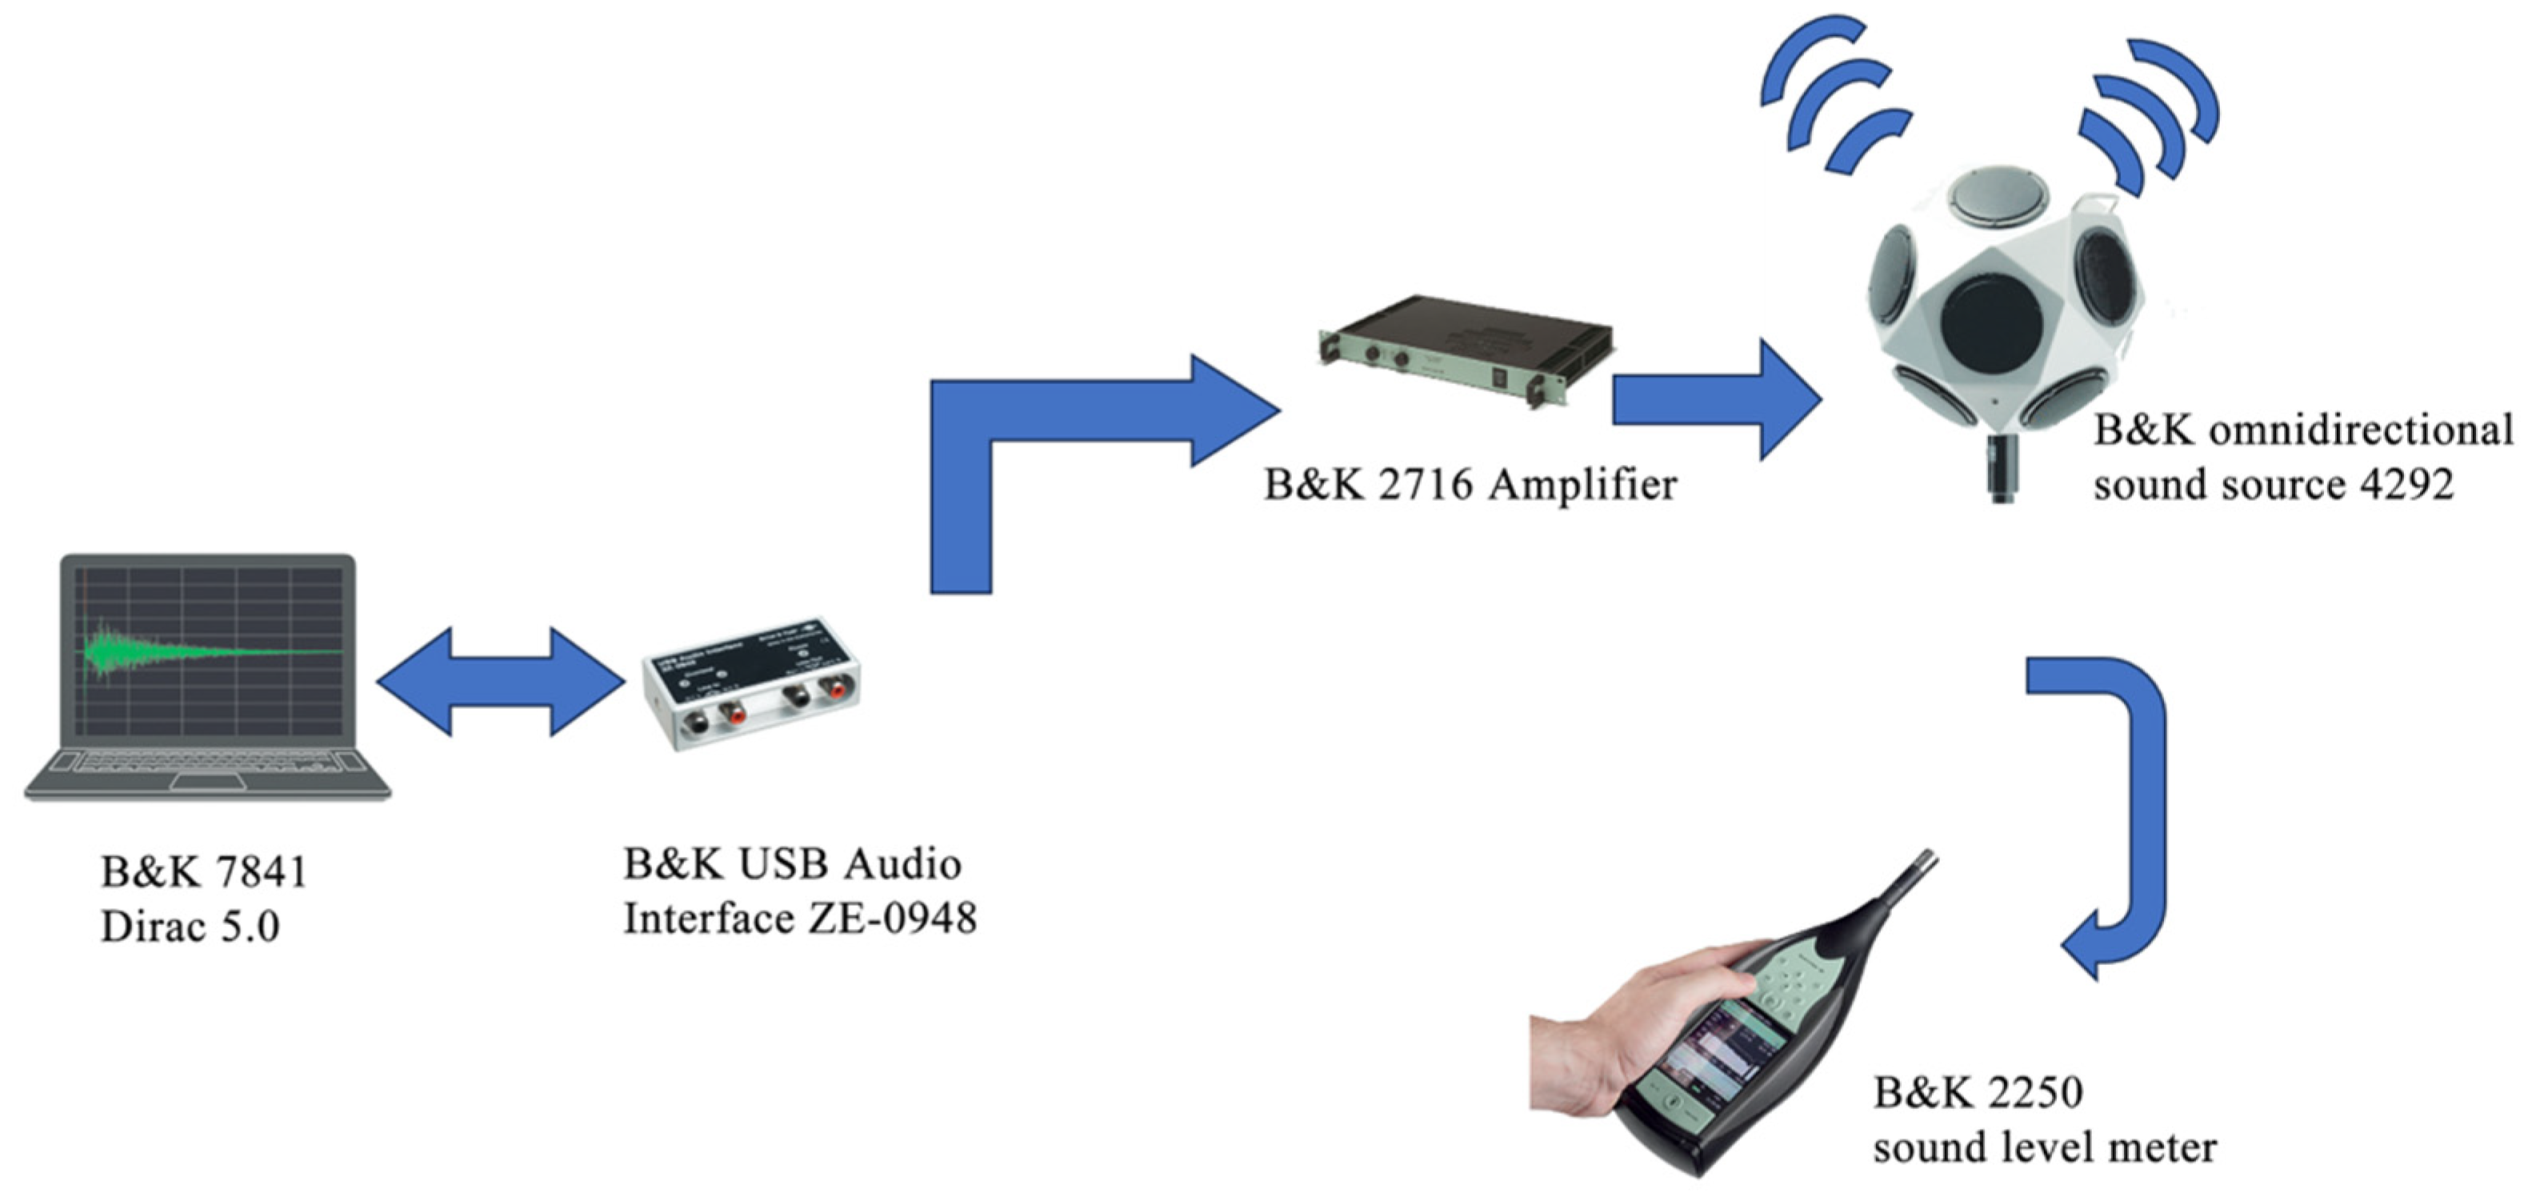
2.3. Impulse Response Measurement Method

This study followed the guidelines of ISO 3382-2:2008 [26] to measure the impulse responses in the pier-style departure lounge of an airport terminal. An omnidirectional sound source, positioned at the center of the lounge, emitted sound signals that were captured by omnidirectional microphones placed at various receiver points throughout the space. The captured signals were processed through the Dirac 5.0 [27] Room Acoustics Software testing system to perform deconvolution and compute single-channel impulse responses for each measurement point. Based on these responses, key acoustic parameters were derived, including early decay time (EDT), reverberation time (T30), definition (D50), and speech transmission index (STI).
The measurement system was configured as follows. A B&K 7841 Dirac 5.0 Room Acoustics Software was used on a computer to generate logarithmic sine-sweep (e-sweep) signals. These signals were amplified using a B&K USB Audio Interface ZE 0948 sound card and a B&K 2716 power amplifier, and then played through a B&K 4292 omnidirectional dodecahedron loudspeaker. After propagating through the lounge, the sound was captured by a B&K 4189 omnidirectional microphone, further amplified using a B&K 2690 Nexus conditioning amplifier, and finally digitized by the ZE 0948 sound card before being transmitted to the computer. The system’s configuration is illustrated in Figure 3. The recorded signals were processed using Dirac 5.0 software to perform deconvolution and obtain the impulse response data for analysis. A detailed list of the instruments and their key specifications, as extracted from the manufacturers’ datasheets, is provided in Table A1 of Appendix A. This table includes model numbers, frequency ranges, dynamic ranges, and other relevant parameters to offer a clear overview of the measurement chain used in this study.
To ensure data accuracy, the measurement system was carefully calibrated before the tests. First, the sound card was calibrated by short-circuiting its input and output ports. Next, a B&K 4231 sound level calibrator was used to calibrate the input levels of the omnidirectional microphone. For each measurement point, three measurements were performed, and the arithmetic mean of the results was used as the final value for that point.
To maintain the reliability of the measurements, environmental noise was strictly controlled. Measurements were conducted when the departure lounge was not in operation, with the air conditioning system turned off and no occupants present. All doors and windows were kept closed to minimize external noise intrusion, ensuring that the background noise level met the NR30 curve requirement. This setup provided a high signal-to-noise ratio and reliable measurement data. Figure 4 shows on-site photos of the sound field measurement, where Figure (a) represents the sound source arrangement, and Figure (b) represents the measurement receiving point.

2.4. Sound Pressure Level Measurement Method

The sound pressure level (SPL) measurements in the departure lounge were conducted using the same audio playback system configuration described in Section 2.1. B&K 7841 Dirac 5.0 Room Acoustics Software was employed to generate Maximum Length Sequence (MLS) signals. These signals were amplified through the B&K USB Audio Interface ZE 0948 sound card and the B&K 2716 power amplifier before being emitted by the B&K 4292 omnidirectional dodecahedron loudspeaker. The sound signals were then captured using a B&K 2250 sound level meter to measure the A-weighted equivalent continuous sound pressure level (LAeq) over a 30-s period at each measurement point. The system’s configuration is illustrated in Figure 5.
Before commencing the measurements, the B&K 2250 sound level meter was calibrated using a B&K 4231 sound level calibrator. During calibration, the allowable deviation was maintained within ±0.3 dB to ensure the accuracy and reliability of the collected data.

3. Results

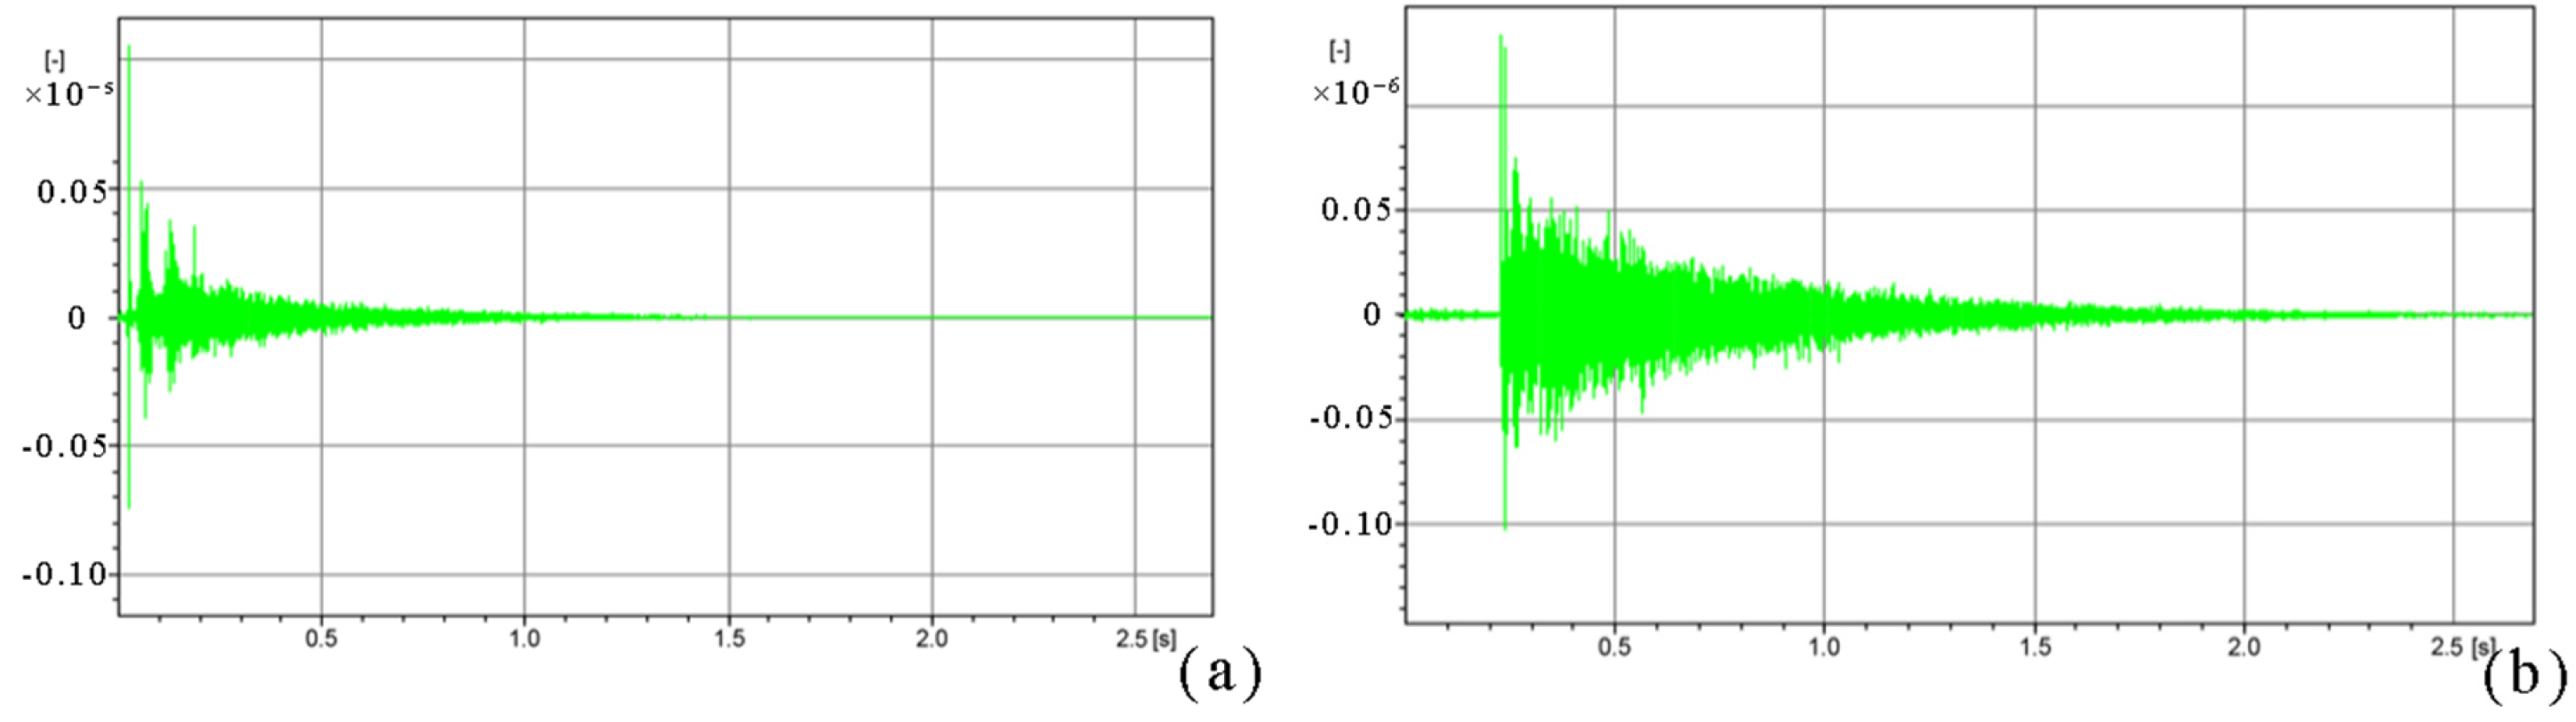
3.1. Impulse Response Results Within the Departure Lounge

In this study, impulse responses were measured at receiver positions both closer to and farther from the sound source, aligned along its central axis, to investigate differences in sound wave propagation characteristics within large, elongated spaces. Figure 6 illustrates the impulse responses at two representative receiver positions in Pier A: Figure 6a represents the receiver position closer to the source (Receiver Point 1), while Figure 6b corresponds to the receiver position farther from the source (Receiver Point 8).
In Figure 6a, the impulse response at the receiver position closer to the source shows an initial peak amplitude of approximately 0.05, indicating a high sound pressure level near the sound source. This impulse response rapidly decays below 0.02 within 0.1 s and stabilizes after approximately 0.3 s. The rapid decay at this location is primarily due to the dominance of direct sound, characterized by a prominent initial peak. Additionally, the proximity to the sound source and surrounding reflective surfaces results in multiple short-path interactions with absorptive materials and obstacles, leading to significant energy absorption and scattering.
In contrast, Figure 6b illustrates the impulse response at the receiver position farther from the source, which exhibits a lower initial peak amplitude of approximately 0.035 and a more gradual decay. Notably, the response maintains a level of about 0.01 even after 1 s. This indicates that at greater distances from the source, the direct sound is relatively weaker, but the sound energy is sustained over a longer period due to richer paths of multiple reflections and diffractions. In the expansive pier-style spaces of large airport terminals, hard surfaces such as glass curtain walls and metal ceilings contribute to frequent sound wave reflections. Additionally, the considerable length of the concourse compared to its width and height creates a waveguide-like effect [9,28,29], providing extended propagation paths for sound energy and slowing its overall decay.
The combined results from measurements at receiver positions closer to and farther from the source reveal significant differences in sound wave propagation characteristics within the departure lounge. At locations closer to the source, the dominance of direct sound leads to a higher initial peak and rapid decay. At greater distances from the source, although the initial sound energy is lower, the presence of multiple reflections and scatterings sustains the energy for a longer duration, resulting in a slower decay rate.

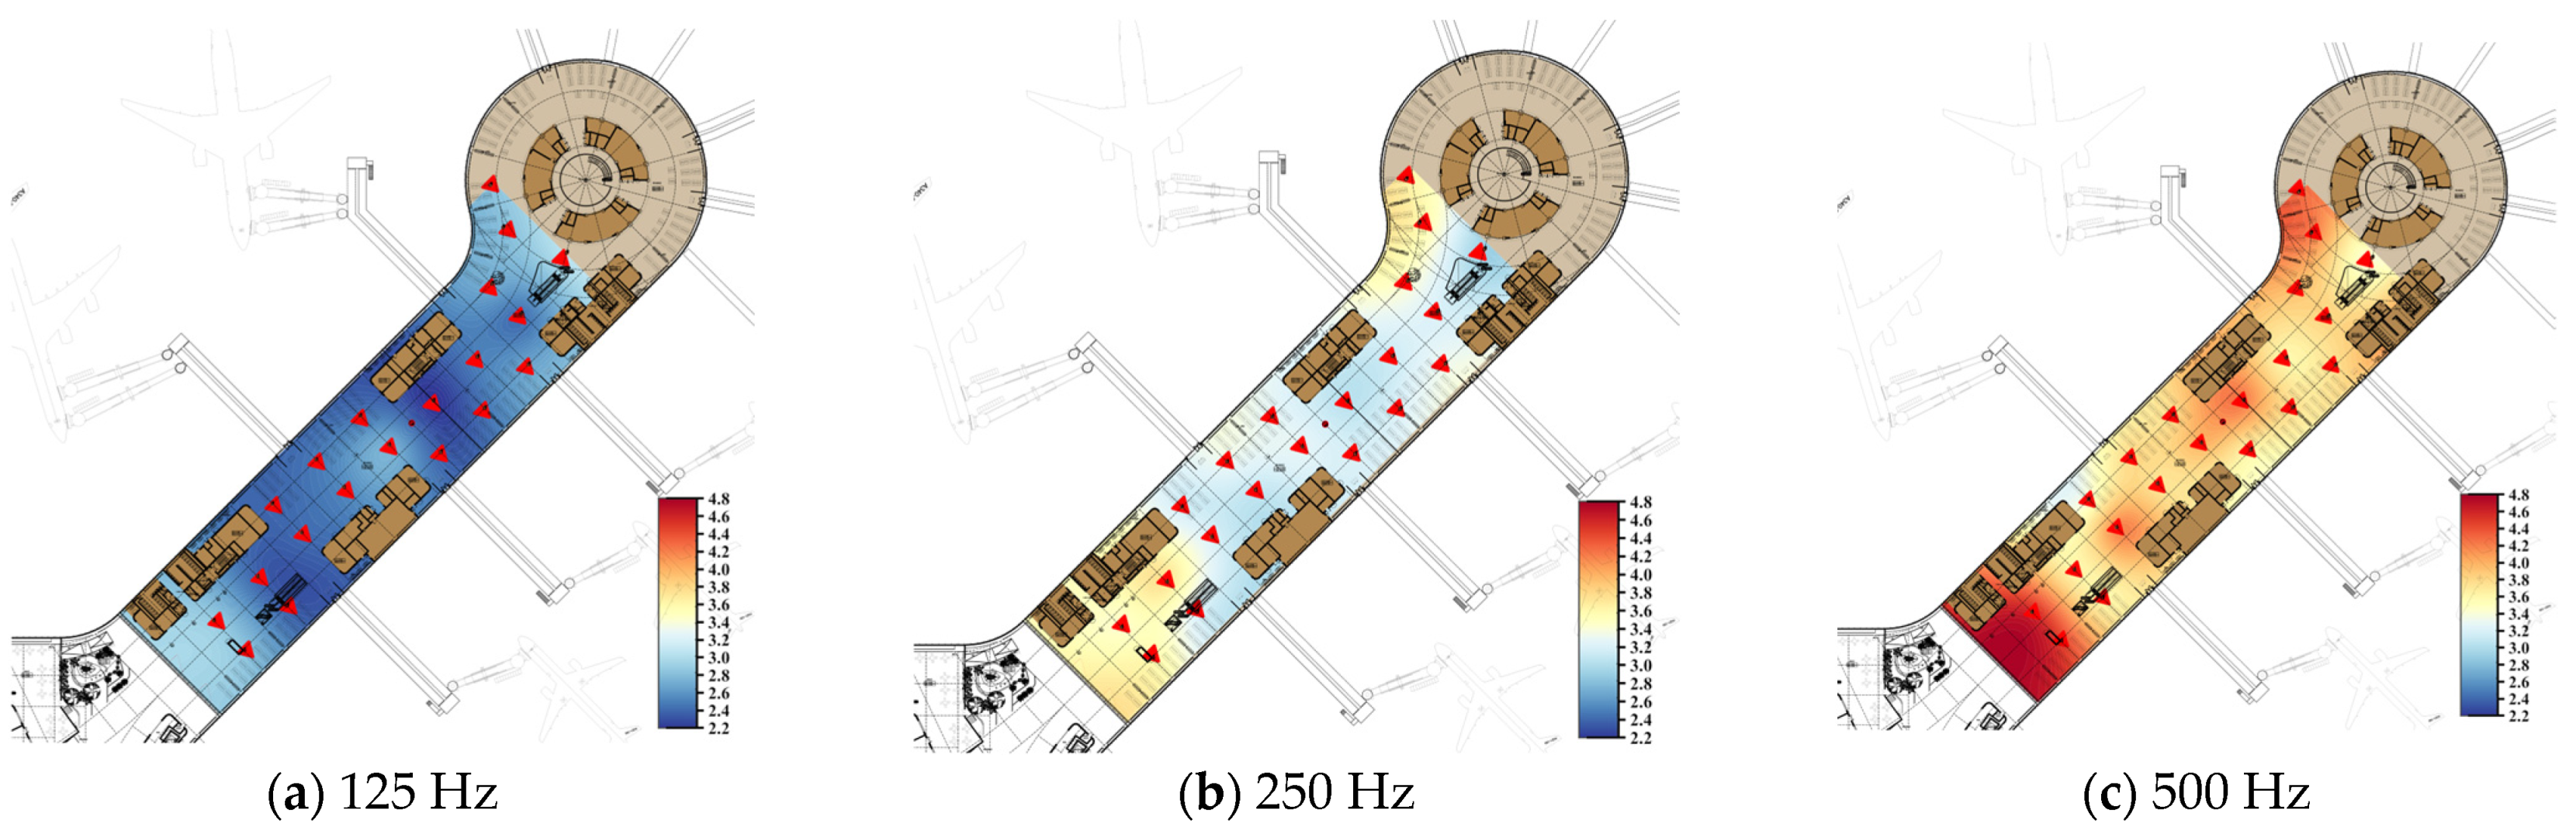
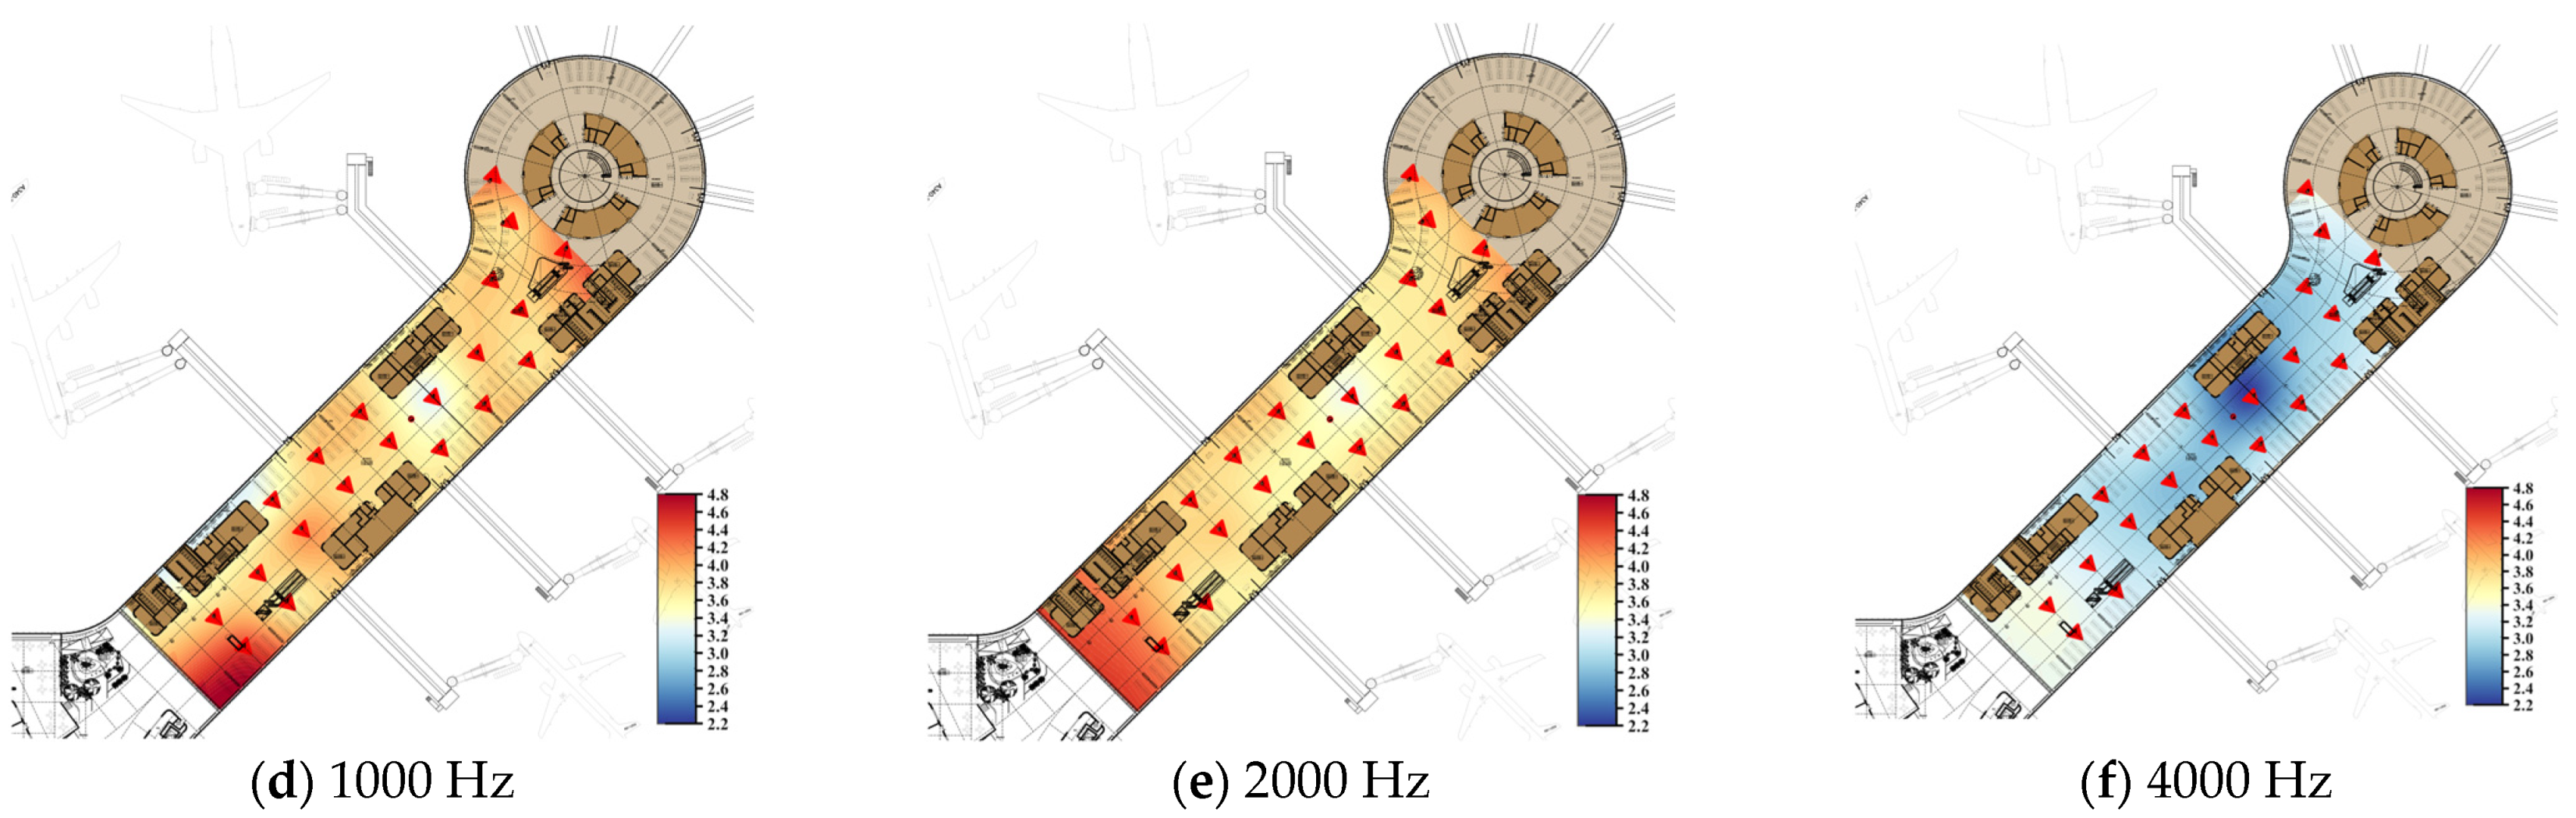
3.2. Room Acoustic Parameters Within the Departure Lounge

The acoustic parameters of the departure lounge were determined by analyzing the impulse responses using DIRAC 5.0 software. The analysis provided key parameters at six octave band center frequencies: 125 Hz, 250 Hz, 500 Hz, 1000 Hz, 2000 Hz, and 4000 Hz. These parameters included EDT, T30, D50, and STI. To provide a more comprehensive and effective assessment of the lounge’s acoustic characteristics, additional averaged parameters were calculated: EDT(500–1k) is the average EDT across the 500 Hz and 1000 Hz octave bands; T30(500–1k) is the average T30 across the 500 Hz and 1000 Hz octave bands; D50(500–4k) is the average D50 across the 500 Hz, 1000 Hz, 2000 Hz, and 4000 Hz octave bands. These frequency-averaged parameters were selected because speech intelligibility is predominantly influenced by these frequency ranges [30,31]. Using these averaged values as single evaluation metrics provides a more intuitive and comprehensive representation of the overall acoustic characteristics of the departure lounge. Moreover, they offer a reliable basis for comparative analysis with previous studies [32].
Appendix B and Appendix C provide detailed acoustic parameter data for Pier A and Pier B, respectively. These parameters include the EDT, T30, and D50 values at each octave band along with their corresponding averages, as well as the STI values, LAeq values, and the distances between each receiver point and the sound source.
The acoustic parameter measurements in Pier A indicate that the EDT(500–1k) across the 20 receiver points ranged from 2.28 s to 4.82 s, with an average value of 3.78 s, while the T30(500–1k) ranged from 3.49 s to 4.59 s, with an average value of 3.93 s. The D50(500–4k) values ranged from 0.02 to 0.42, with an average of 0.21, and the STI values ranged from 0.24 to 0.46, averaging 0.36. The LAeq decreased from 91.1 dB(A) at 9 m from the sound source to 70.9 dB(A) at 81 m. Similarly, for Pier B, the measurements show that the EDT(500–1k) ranged from 2.37 s to 4.75 s, with an average of 3.63 s, and the T30(500–1k) ranged from 2.93 s to 4.20 s, with an average of 3.66 s. The D50(500–4k) ranged from 0.07 to 0.54, with an average of 0.27, and the STI ranged from 0.29 to 0.55, with an average of 0.41. The LAeq values in Pier B decreased from 92.3 dB(A) at a distance of 8 m from the sound source to 72.9 dB(A) at 86 m.
Contour maps of the spatial T30 distribution at different octave band center frequencies were generated for Pier A and Pier B by interpolating scattered data points in MATLAB R2024b using the built-in griddata function with the ‘v4’ method. Figure 7 and Figure 8 present the spatial distributions of T30 for six octave bands centered at 125 Hz, 250 Hz, 500 Hz, 1000 Hz, 2000 Hz, and 4000 Hz in Pier A and Pier B, respectively. Subfigures (a) to (f) correspond to 125 Hz, 250 Hz, 500 Hz, 1000 Hz, 2000 Hz, and 4000 Hz, respectively.
The results indicate that for both Pier A and Pier B, the T30 values at mid-frequency bands (500 Hz and 1000 Hz) are significantly higher than those at low-frequency bands (125 Hz and 250 Hz) and high-frequency bands (2000 Hz and 4000 Hz), suggesting that sound energy in the mid-frequency range persists more strongly within the departure lounge spaces. Additionally, T30 values exhibit an increasing trend with greater distance from the sound source, which aligns with previous research findings [32,33] on large, elongated spaces. This phenomenon may result from the combined effects of spatial geometry and the distribution of sound-absorbing materials, which slow down sound energy attenuation in regions farther from the source, thereby enhancing reverberation effects.

4. Discussion

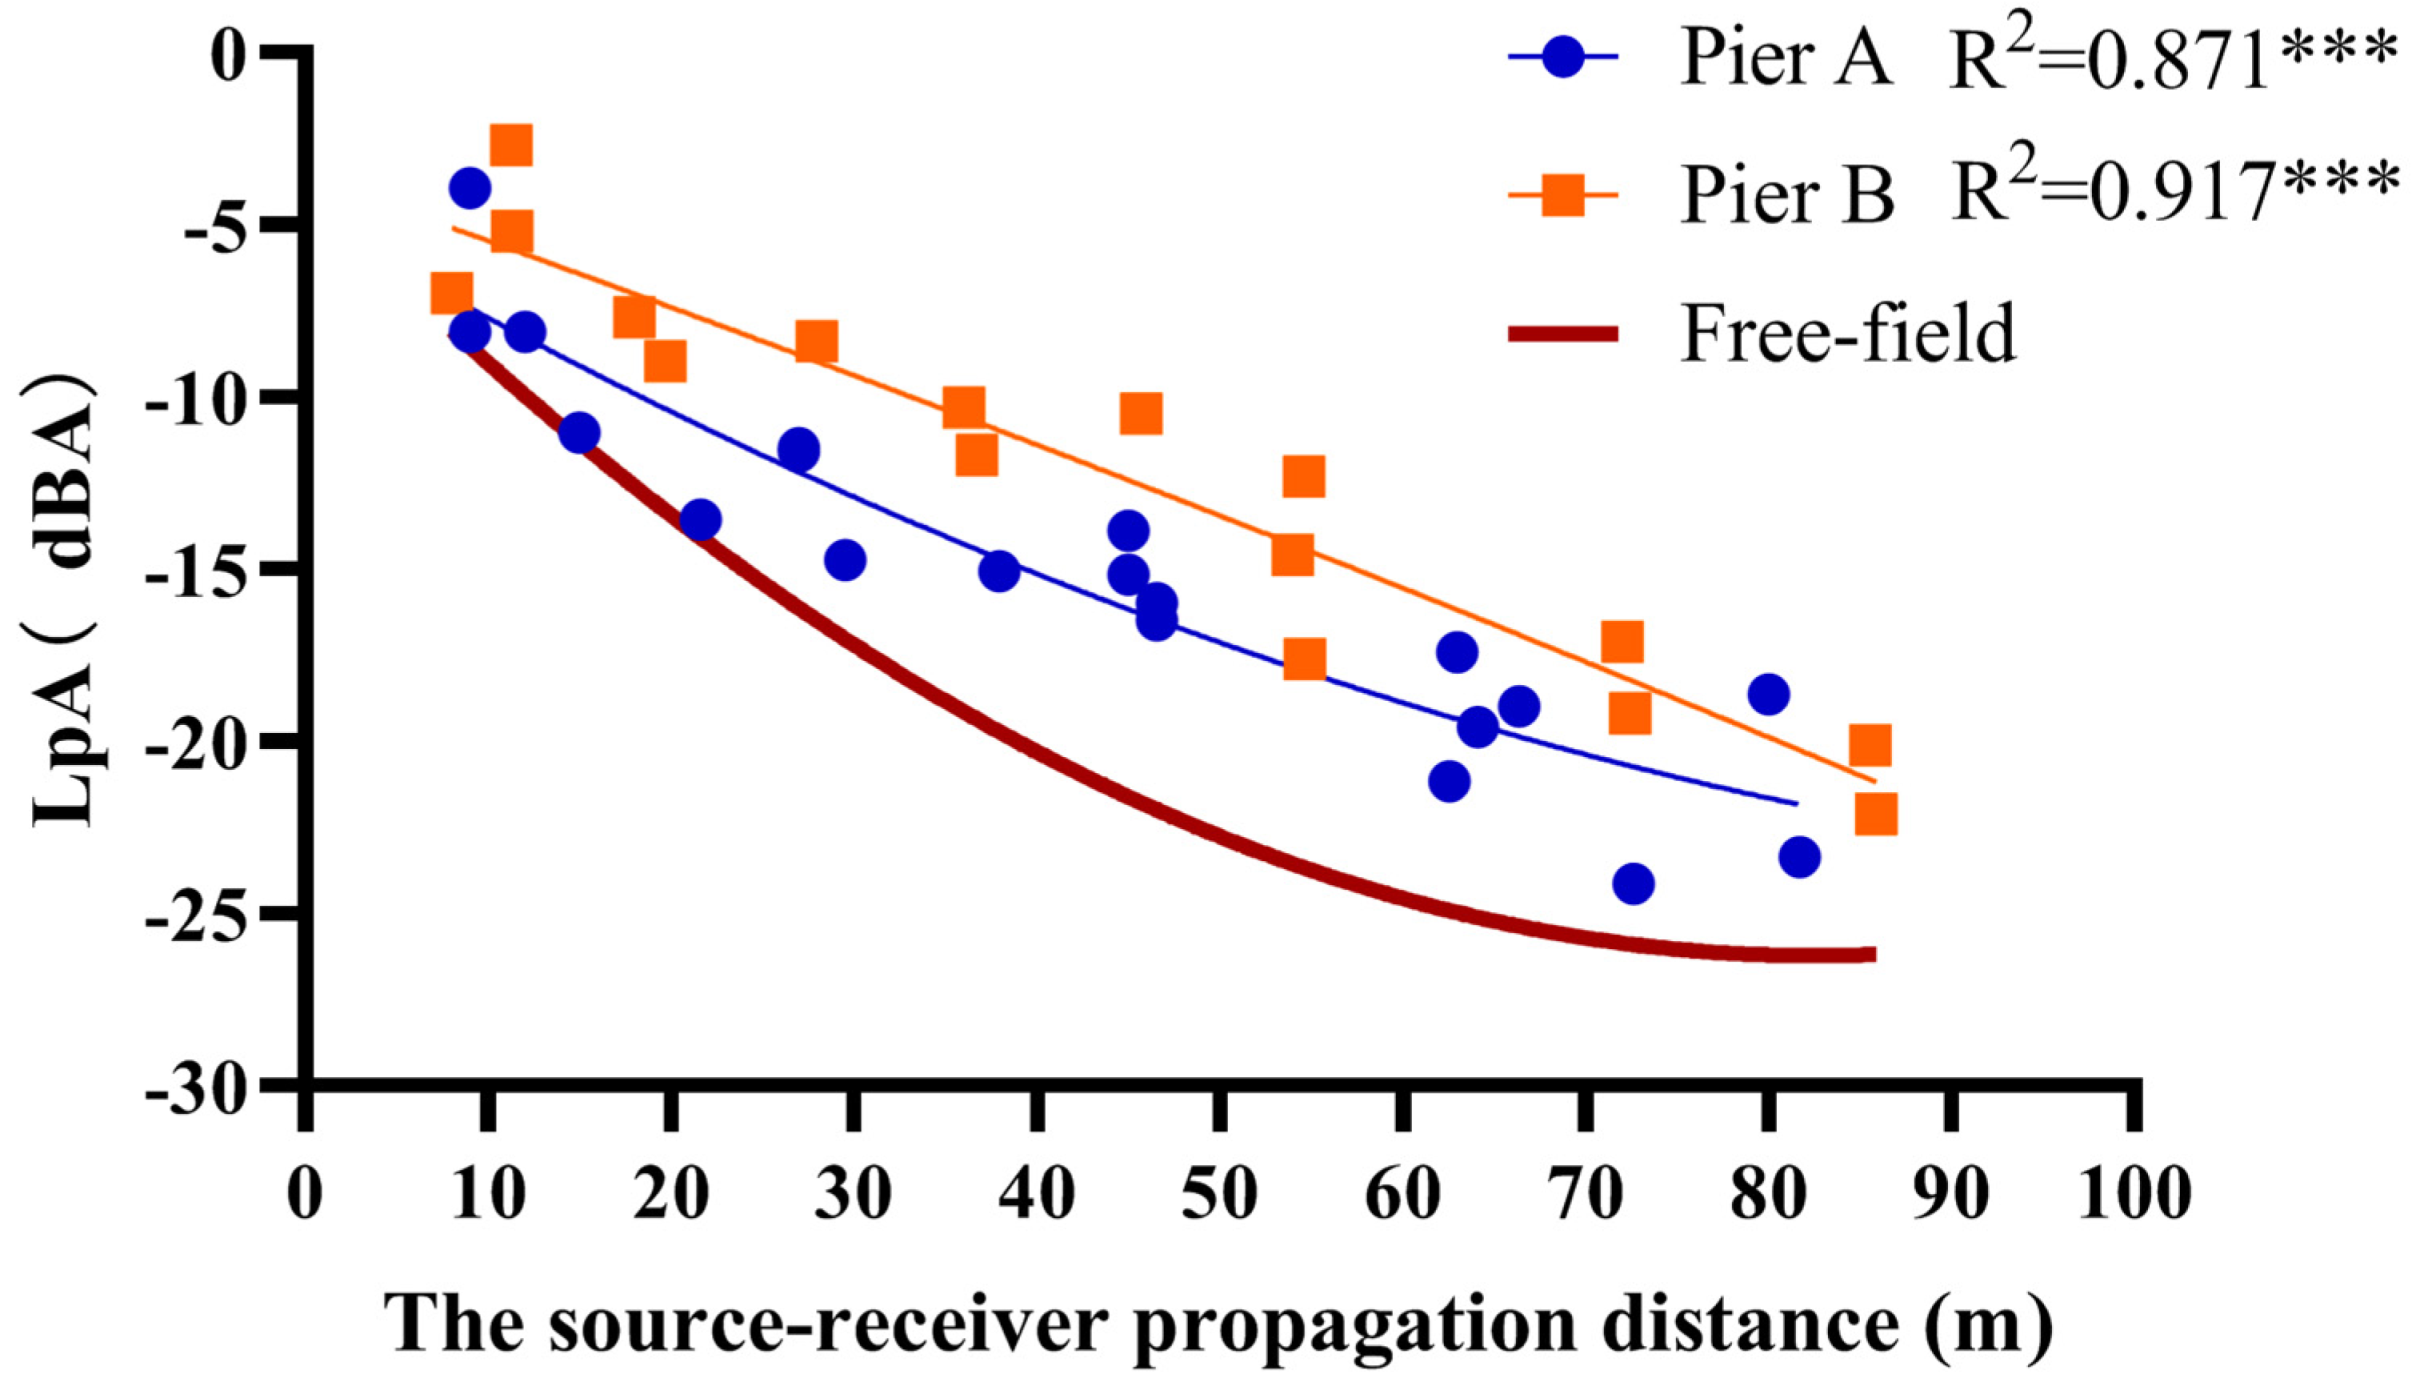
4.1. Sound Attenuation Within the Departure Lounge

To investigate sound attenuation in the departure lounge, this study measured the LAeq at various receiver points in Pier A and Pier B and compared these values with theoretical free-field levels (Figure 9). The results indicate that, in both departure lounges, the sound pressure level decreases as the distance between the receiver point and the sound source increases, reflecting the general principle that sound energy gradually diminishes during propagation due to air damping and reflections [34,35]. Although the overall trend is similar, the attenuation curve in Pier A takes on a more parabolic shape, whereas Pier B’s curve is closer to a straight line. Within 30 m of the source, several receiver points in Pier A nearly coincide with the free-field theoretical values, suggesting that its larger cross-section and dual-sided design provide attenuation behavior in this region that more closely resembles free-field conditions.
To further verify the differences between these two attenuation curves and eliminate the influence of measurement distance, an ANCOVA was conducted with “distance from the sound source” as the covariate. After controlling for distance, the difference in sound pressure levels between Pier A and Pier B remained statistically significant (p < 0.001), indicating a genuine discrepancy in their attenuation characteristics. According to the first-order term (B1) of the quadratic polynomial regression model, free-field conditions exhibit the fastest attenuation (−0.5398), with Pier A (−0.3081) between the free field and Pier B (−0.1868). This implies that Pier A attenuates sound more rapidly than Pier B. The second-order term (B2) further indicates that Pier A may continue to increase its attenuation rate in the far-field region (B2 = 0.00121), while Pier B’s attenuation slows slightly at greater distances (B2 = −0.000212).
Previous research [32,33] has often suggested that a larger cross-sectional area in a long space creates more opportunities for sound reflection and diffusion, typically leading to slower attenuation. However, the measurements in this study reveal that a larger cross-section, dual-sided waiting area (Pier A) instead exhibits a faster attenuation rate. A possible explanation is that Pier A’s more open floor plan enables sound waves in the regions closer to the source and at intermediate distances to propagate more directly to farther areas. In contrast, Pier B’s single-sided layout features a relatively compact arrangement of functional rooms, causing frequent internal reflections and longer sound energy residence time, which ultimately reduces its overall attenuation rate.

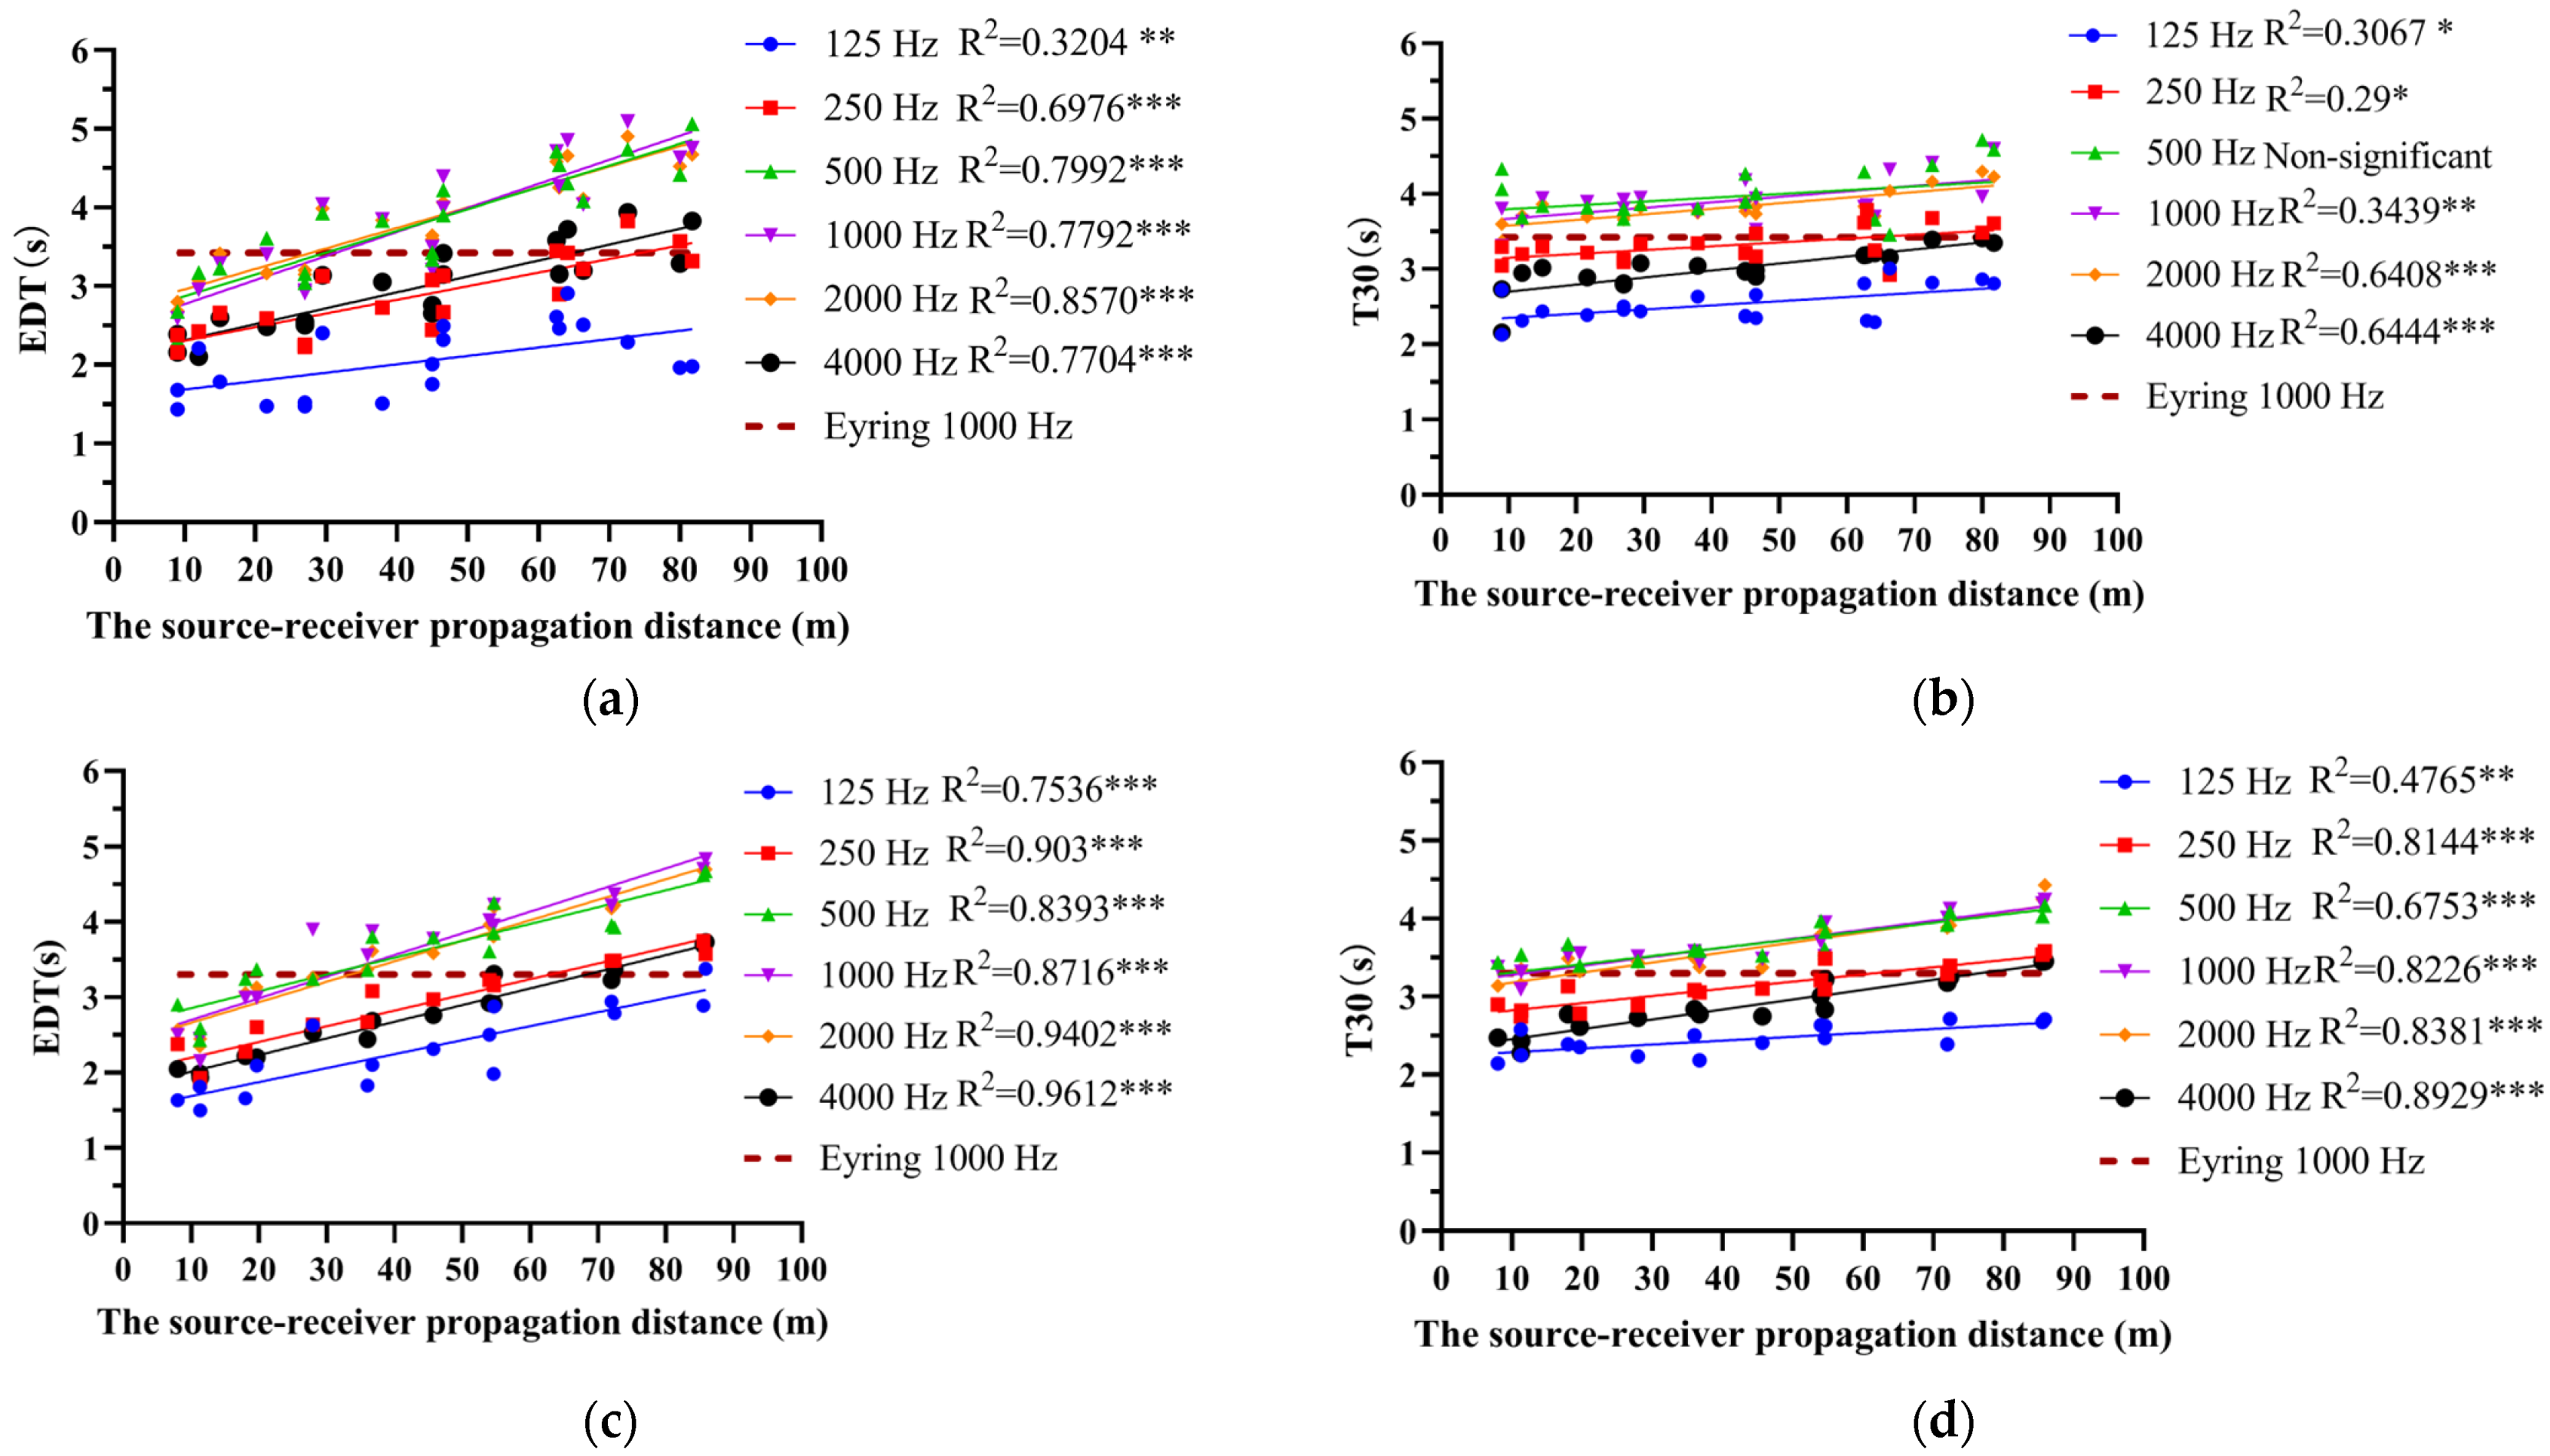
4.2. Variation in Reverberation Time with the Distance Between Receiver Points and the Sound Source

To examine how reverberation time (EDT and T30) changes with increasing distance from the sound source, this study plotted the trends of EDT and T30 against distance for Pier A and Pier B (Figure 10). Figure 10a,b show the changes in EDT and T30 at various octave bands for Pier A, while Figure 10c,d present the corresponding data for Pier B. The results indicate that in both piers, EDT and T30 at each octave band rise slightly as the distance to the sound source increases, aligning with findings in research on long spaces [33] which suggest that reverberation time tends to grow with distance.
Further investigation reveals that in both concourses, EDT and T30 exhibit distinct patterns with distance. Taking the 1000 Hz octave band as an example, in the regions closer to the source (i.e., distances less than 29.5 m in Pier A and less than 28.0 m in Pier B), the EDT(1k) values are noticeably lower than the T30(1k). The difference between the two for Pier A is 0.761 ± 0.267 s, and for Pier B it is 0.637 ± 0.348 s. Moreover, this gap widens in a quadratic manner as distance increases (with Pier A’s fitted model yielding R2 = 0.617 and Pier B’s R2 = 0.825). Once the distance exceeds these thresholds, however, EDT actually surpasses T30, with Pier A exceeding by 0.506 ± 0.333 s and Pier B by 0.369 ± 0.117 s. This phenomenon indicates that in the regions farther from the source of elongated spaces, reflected sound gradually becomes more dominant, leading to a faster increase in the time needed for the initial 10 dB of decay (EDT), eventually causing EDT to exceed T30.
These observations can be explained by differences in sound field formation and the reverberation process. First, EDT measures the time required for the initial 10 dB decay of sound energy, making it especially sensitive to factors in the early sound field. In the regions closer to the source, because direct sound is dominant, its rapid attenuation results in a shorter EDT. In contrast, T30 reflects the full decay process of 30 dB within the entire space and is therefore more influenced by late reverberation, leading to a relatively longer value. As the receiver distance increases, direct sound diminishes significantly, and early reflections together with late reverberation become more influential. In an elongated space, the anisotropic propagation paths and the cumulative effects of multiple reflections mean that sound energy does not dissipate as quickly during the initial 10 dB decay stage as it does near the source, causing the EDT to slow its rate of decay and rise notably at greater distances from the source. Previous studies [25,28,29,36] have observed a marked increase in EDT in more distant regions, which contrasts with the uniform diffuse-field characteristics generally found [37] in small or medium-sized rooms and instead aligns more closely with the complex distribution of sound energy propagation paths in large, elongated spaces.
Additionally, Figure 10 shows that, in both Pier A and Pier B, the reverberation times at mid-frequency bands (500 Hz, 1000 Hz, 2000 Hz) are relatively similar. This may be attributable to the fact that the commonly used building materials in the concourses have comparable absorption coefficients in the 500–2000 Hz range, resulting in relatively uniform boundary absorption across these frequencies. Consequently, the overall energy decay rate is largely determined by the aggregate absorption characteristics, making the reverberation times in these frequency bands closely aligned.
Figure 10 also presents the theoretical reverberation time at 1000 Hz calculated using the Eyring formula. A comparison with the measured T30 values reveals a noticeable discrepancy, particularly pronounced in Pier A, where the waiting area has a larger cross-section and dual-sided design. This discrepancy arises because the Eyring formula assumes uniformly distributed absorption and a sufficiently diffuse sound field. In an airport pier departure lounge with large span, high clearance, and an elongated layout, however, sound waves tend to propagate directionally, and geometric openings—such as boarding gates and connecting corridors—lead to both sound leakage and unevenly distributed reflections. These factors violate the assumption of uniform diffusion and result in divergence between theoretical predictions and actual measurements, further indicating that the conventional uniformly diffuse-field assumption does not hold in such long pier spaces.

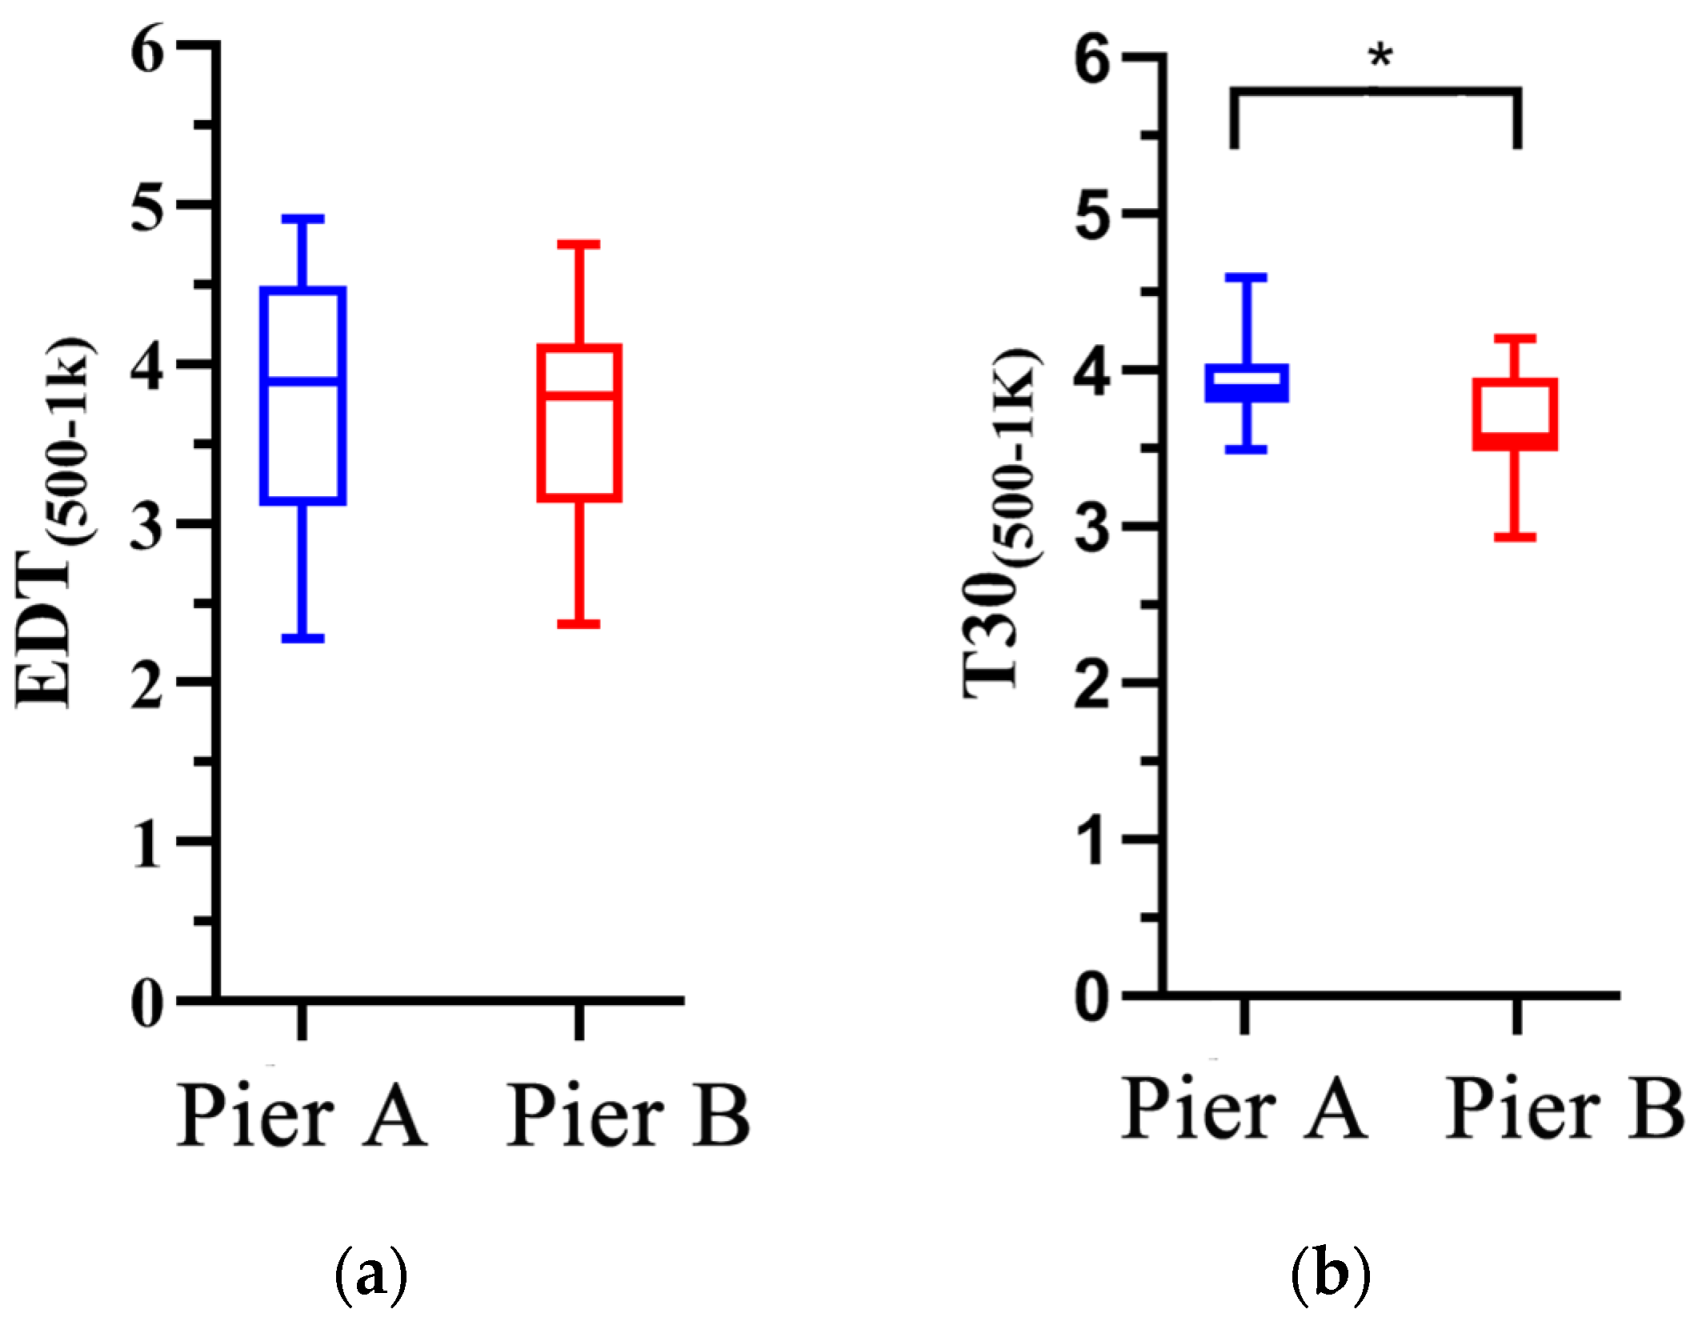
4.3. Relationship Between Reverberation Time and Cross-Sectional Area in the Departure Lounge

To investigate the influence of cross-sectional area on reverberation time in airport pier departure lounges, this study compared the average EDT and T30 values for the 500–1k frequency bands in Pier A and Pier B. An independent sample t-test was conducted using SPSS 26.0 software [38] on data from two pier-style departure lounges within the same airport, both constructed with identical materials but differing in cross-sectional area. As shown in Figure 11, the results revealed a significant difference in the mean T30(500–1k) values between the two piers, with Pier A exhibiting a notably higher mean T30 than Pier B; however, no statistically significant difference was found in the mean EDT(500–1k). This suggests that in large, elongated spaces, early reflections are primarily shaped by spatial geometry and layout, whereas changes in cross-sectional area have a lesser effect.
To further explore how the cross-sectional area affects reverberation in pier-style departure lounges, this study plotted T30(500–1k) against the distance from the sound source for both piers (Figure 12). The results show that the T30 in Pier A (blue circles) demonstrates a more pronounced increase over mid-to-far distances, while the T30 in Pier B (red squares) also rises with increasing distance but at a slower rate. One possible explanation is that Pier A, having a larger cross-sectional area and a dual-sided layout, exposes sound waves to more reflections as they traverse a larger volume, producing a longer “decay tail” in the far-field region and thereby significantly extending T30. In contrast, Pier B, with a smaller cross-sectional area and seating on only one side, has a more limited overall volume. Although some reverberation “tail” also forms in the far end, its overall reverberation level remains relatively low.
A further comparison of the average T30 values in the two piers reveals that Pier A’s T30 is significantly higher than that of Pier B. Given that both piers use the same construction and finishing materials, with essentially identical absorption performance in the same frequency bands, the observed differences in reverberation time primarily reflect variations in geometry and volume distribution. Specifically, Pier A’s large cross-section and dual-sided layout reduce the ratio of effective absorptive surface area to overall volume, making it more difficult for sound energy to dissipate quickly and thus increasing the overall reverberation level. In contrast, Pier B’s smaller cross-section and single-sided seating arrangement result in a relatively higher ratio, leading to a slightly lower T30.
In summary, although both piers exhibit an upward trend in T30 with increasing distance, geometric configuration and volume distribution cause Pier A to accumulate sound energy more readily in the far field, resulting in a substantially higher reverberation time. This finding underscores the significant influence of geometry and volume distribution on reverberation characteristics in large, elongated spaces such as pier-style departure lounges.

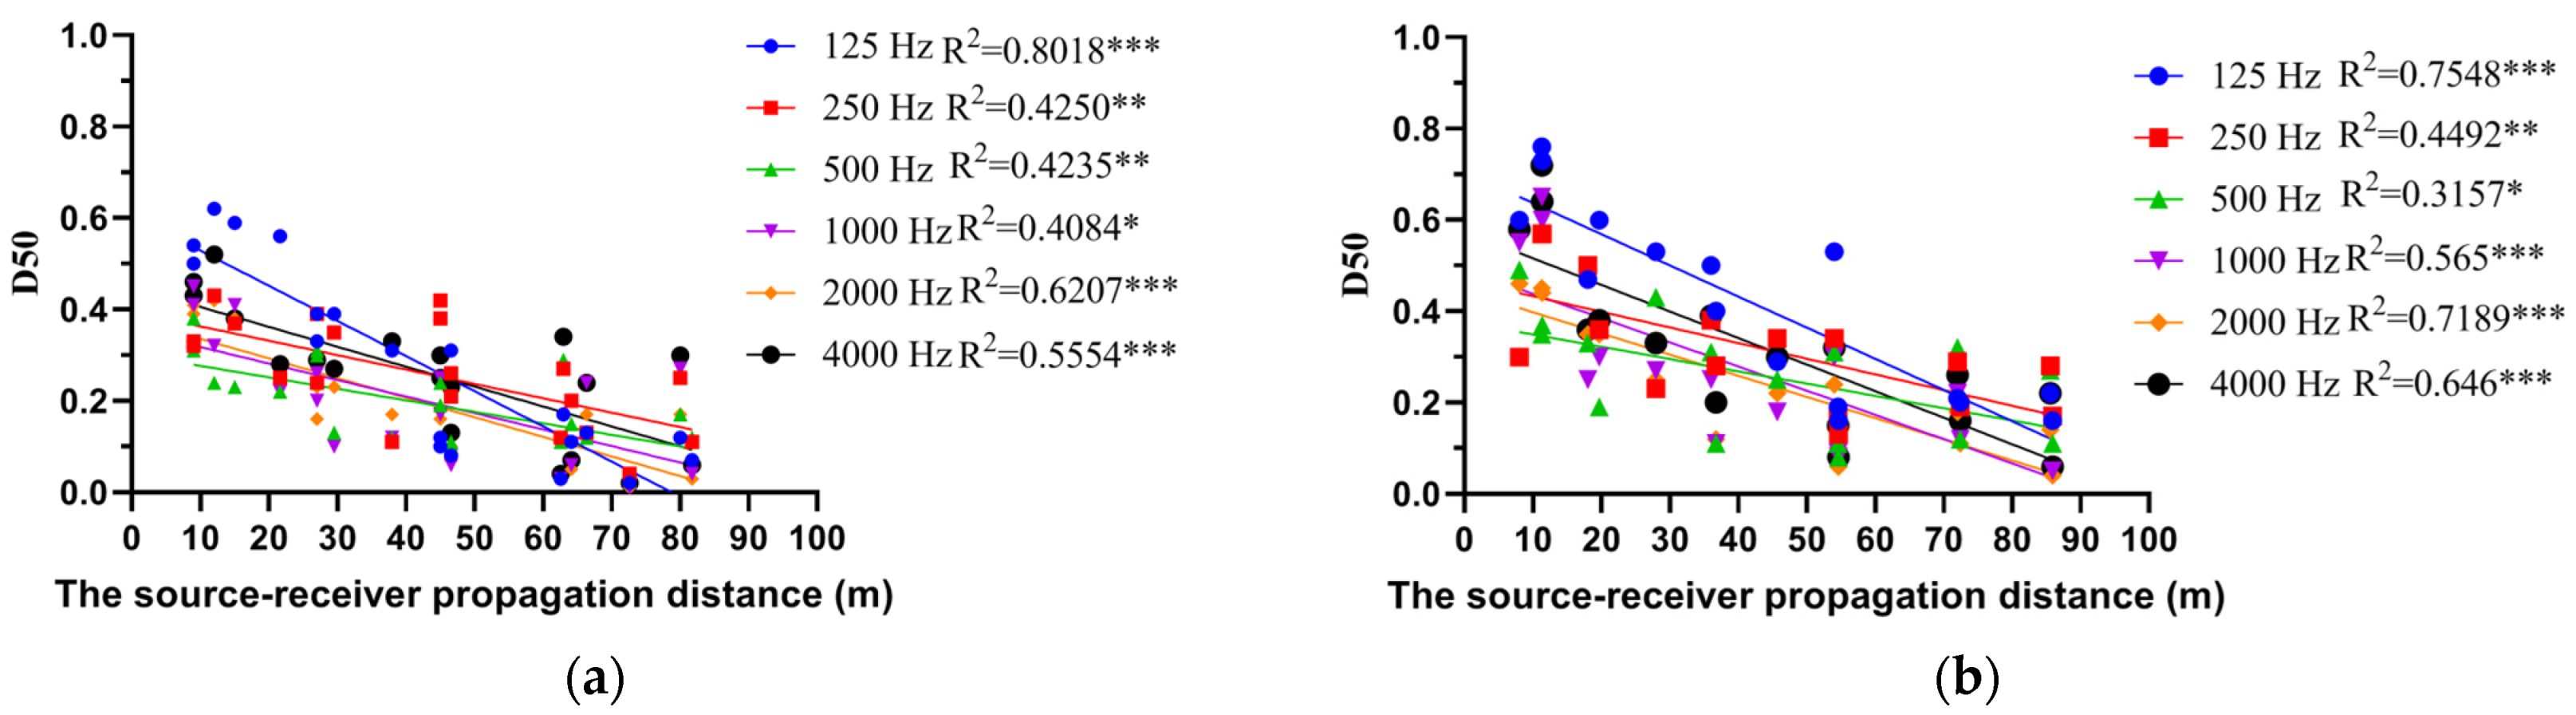
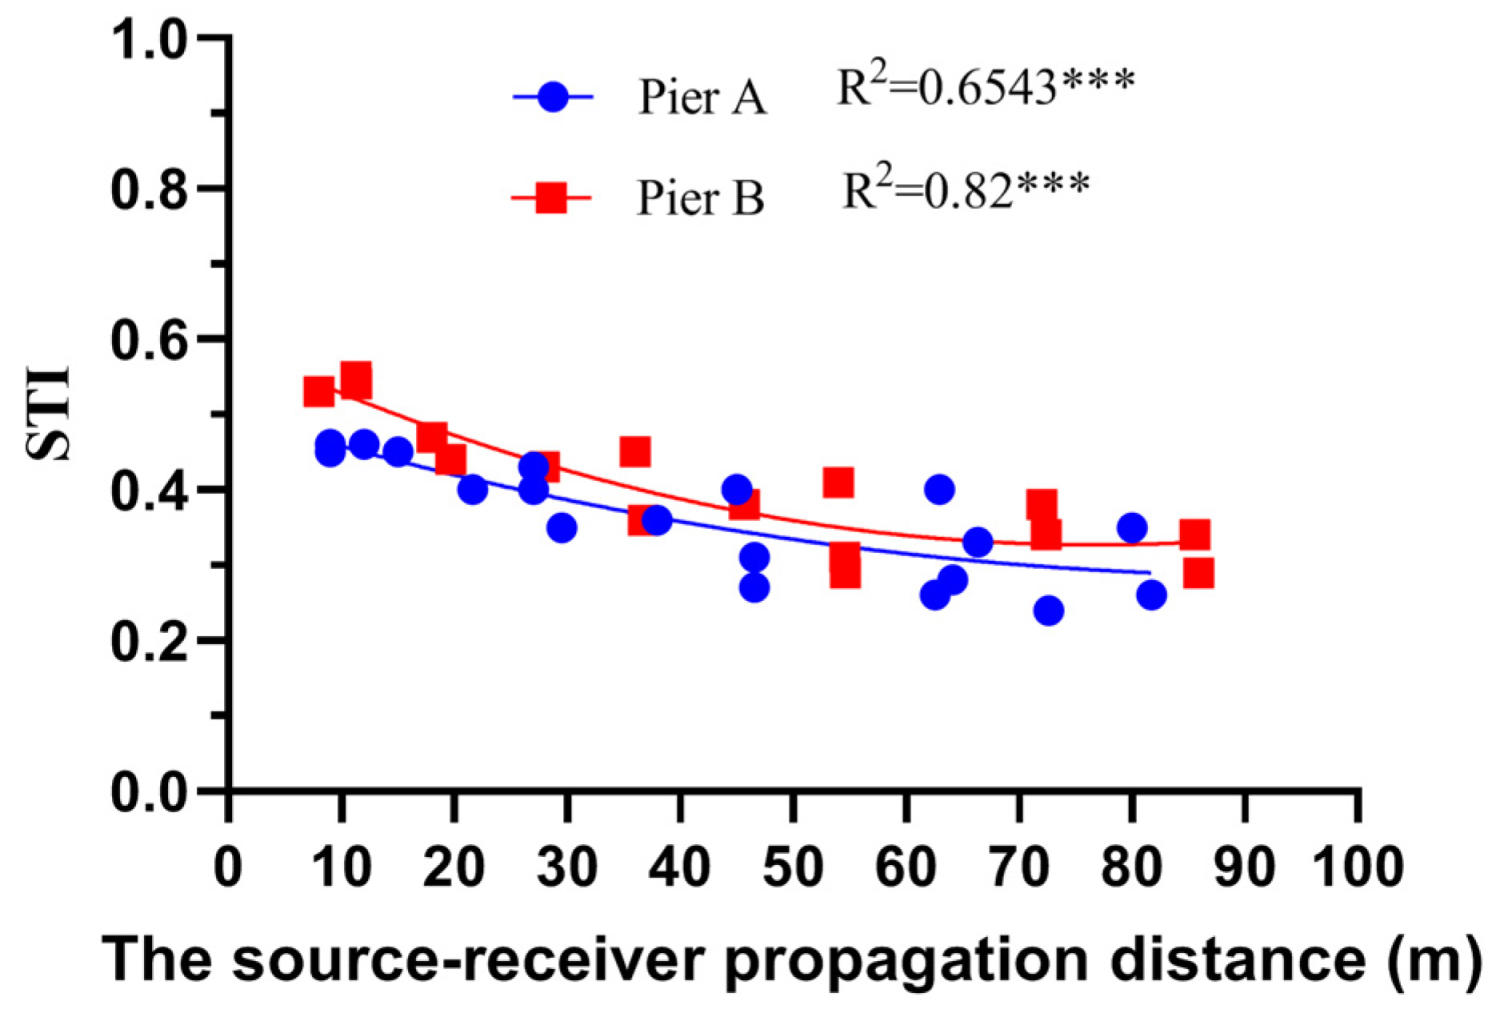
4.4. Changes in Clarity with Increasing Distance from the Sound Source

Building on the investigation of reverberation time (EDT and T30) in pier-style departure lounges, this study further examined how the D50 relates to the spatial volume and configuration of the lounges. D50 represents the proportion of energy arriving within the first 50 ms of the total energy; higher D50 values typically indicate better clarity, as they reflect the dominant contribution of direct sound and early reflections in sound transmission. By analyzing how D50 values vary with distance from the sound source across the 125 Hz to 4 kHz octave bands for Pier A and Pier B (see Figure 13), the results show a gradual decrease in D50 as distance increases. This phenomenon likely arises because, at greater distances, sound waves undergo more absorption and scattering, reducing the share of direct sound and early reflections relative to late reverberation, which in turn lowers the D50 value. Additionally, the data indicate that D50 values at mid-to-high frequencies are generally lower than those at low frequencies. This can be attributed to the longer wavelengths of low-frequency sound, which more easily diffract around obstacles and experience weaker absorption, allowing them to travel farther in the space. In contrast, mid-to-high frequency sounds with shorter wavelengths attenuate more rapidly after multiple reflections from structural elements such as walls and ceilings, resulting in lower D50 values at greater distances.
Furthermore, this study also investigated the variation in STI with receiver distance from the source (Figure 14). The results demonstrate that STI values in both lounges decrease with increasing distance, reflecting the diminishing contribution of direct sound and early reflections to effective speech transmission. However, it is important to note that the current study utilized an omnidirectional sound source for measurement, whereas actual public address (PA) systems in airports employ multiple directional loudspeakers distributed throughout the concourse, which significantly influences speech intelligibility. Directional loudspeakers enhance clarity by directing sound towards target areas while minimizing unnecessary reflections, which can improve STI compared to the worst-case scenario observed in this study. In practical airport applications, PA system configurations, loudspeaker directivity, and ambient noise levels must be considered alongside architectural acoustics to assess intelligibility comprehensively. Future research should incorporate measurements using the actual PA system to better reflect real-world performance.
Additionally, both the Chinese standard GB 50526-2010 [39] and the international standard IEC 60268-16 [40] establish speech intelligibility requirements for PA systems in transportation hubs. For instance, IEC 60268-16 specifies that in highly reverberant or acoustically complex environments, the operational STI of voice alarm (VA) and PA systems should fall within the 0.44–0.48 range. Moreover, prior research [24] has suggested that the STI in pier-style departure lounges should be at least greater than 0.45. This indicates that with appropriate design and implementation, the PA systems within airport pier concourses would likely exceed the worst-case STI values observed in this study.
From an architectural acoustics perspective, several strategies can be employed to improve the acoustic environment in departure lounges. Optimizing the pier geometry can help minimize excessive reverberation and waveguide effects, thereby enhancing speech clarity. Additionally, interior material selection plays a critical role in sound field control. The strategic placement of sound-absorbing panels on ceilings and walls can effectively reduce excessive mid-frequency reverberation while maintaining sufficient reflections for adequate clarity. Moreover, sound masking techniques can be explored to enhance perceived speech intelligibility by managing the spectral balance of background noise.
In summary, both D50 and STI show a declining trend as the distance from the sound source increases, suggesting that enhanced absorption and scattering at greater distances reduce the relative contributions of direct sound and early reflections, thereby diminishing overall clarity. However, these findings must be interpreted with caution, as the actual performance of PA systems in an airport environment is influenced by loudspeaker distribution, directivity, and system tuning. Future studies should incorporate real-world PA system measurements and explore optimized electroacoustic configurations to ensure effective speech intelligibility while balancing acoustic comfort in large-scale airport concourses.

5. Conclusions

This study provides a comprehensive investigation of the acoustic characteristics of two pier-style departure lounges at Haikou Meilan International Airport’s T2 terminal, focusing on reverberation behavior and sound attenuation. The results demonstrate that despite similar interior materials and absorption coefficients, the geometric differences between the two piers significantly influence their acoustic environments.
Both piers exhibit long reverberation times, with T30 values exceeding 3.5 s in mid-frequency bands (500–1000 Hz), highlighting the sustained presence of sound energy due to large volumes and reflective surfaces. Spatial variations in EDT and T30 confirm the impact of distance-dependent sound propagation, where direct sound dominates at near-source positions, while multiple reflections prolong decay times in more distant regions. Additionally, the measured LAeq values decrease with distance from the source, but Pier B’s single-sided layout results in a slower attenuation rate, indicating that deviations from free-field behavior are strongly geometry-dependent.
A key finding is the influence of pier cross-section on sound field characteristics. Despite having a similar absorption coefficient, Pier A—featuring a larger cross-section and a dual-sided layout—exhibits higher average T30, particularly at mid-to-far distances, suggesting that increased volume and open plan configurations foster more complex reflection paths, sustaining sound energy for longer durations. Conversely, differences in cross-section exert less influence on EDT, implying that early sound field characteristics are shaped more by local geometry than by overall pier volume.
The study of speech clarity in the pier-style departure lounges highlights that both D50 and STI decline with increasing receiver distance from the sound source, consistent with reduced contributions of direct sound and early reflections. Future research should incorporate actual PA system configurations, loudspeaker directivity, and ambient noise levels. Integrating electroacoustic design strategies with architectural measures—such as optimized pier geometry and targeted sound-absorbing treatments—will be essential to achieve the desired speech intelligibility in large airport concourses.

Author Contributions

X.L.: writing—original draft, visualization, software, methodology, investigation, formal analysis, data curation, conceptualization. Y.Z.: validation, supervision, methodology, conceptualization. All authors have read and agreed to the published version of the manuscript.

Funding

This research was supported by the National Natural Science Foundation of China (Grant No. 51378215) and the State Key Laboratory of Subtropical Building and Urban Science (Grant No. 2024ZB03).

Data Availability Statement

Data are contained within the article.

Conflicts of Interest

The authors declare no conflicts of interest.

Appendix A

Table A1. Key specifications of measurement instruments.
InstrumentModelKey Specifications (Typical from Datasheets)
Dirac Room Acoustics SoftwareB&K 7841 Dirac 5.0Compliant with ISO 3382 (room acoustics), ISO 18233 (analysis methods) and IEC 60268-16 (speech intelligibility)
USB Audio InterfaceB&K ZE 0948A dedicated calibration procedure allows accurate compensation for the gain (or attenuation) presented by the high-quality sound card.
Power AmplifierB&K 2716Output is approx. 300 W and is relatively independent of load.
Omnidirectional Loudspeaker (Dodecahedron)B&K 4292Type 4292-L uses 12 loudspeakers in a dodecahedral configuration to radiate sound evenly with a spherical distribution.
Omnidirectional Measurement MicrophoneB&K 4189Frequency: 1 Hz to 180 kHzDynamic Range: 6.5 dB to 192 dB
Conditioning AmplifierB&K 2690 NexusHigh input signal range, low noise, and extensive overload facilities.
Sound Level MeterB&K 2250Wide frequency ranges from 5.6 Hz to 20 kHzA-weighted dynamic range of 16.4 dB to 140 dB

Appendix B. Acoustical Characteristics in Pier A

Table A2. Distances from the sound source to each receiving point in Pier A, along with their corresponding STI and LAeq values.
Receiver PointsR1R2R3R4R5R6R7R8R9R10
The source–receiver propagation distance (m)9.0015.0027.0029.5545.0046.5862.9780.0081.7364.13
STI0.460.450.430.350.40.310.40.350.260.28
LAeq (dBA)91.0783.9783.5080.2579.8478.5177.5976.3771.6375.42
Receiver PointsR11R12R13R14R15R16R17R18R19R20
The source–receiver propagation distance (m)9.0312.0027.0021.6445.0037.9546.5762.5872.6466.37
STI0.450.460.410.420.420.360.270.260.240.33
LAeq (dBA)86.8886.983.4181.4381.179.9579.0173.8370.8576.01
Table A3. The EDT, T30, and D50 values for each receiving point in Pier A across different frequency bands, along with their respective averages.
EDT (s)125 Hz250 Hz500 Hz1000 Hz2000 Hz4000 HzAverage (500–1000 Hz)
R11.432.162.682.592.802.392.63
R21.782.663.233.293.412.603.26
R31.522.233.042.943.152.502.99
R42.403.133.934.043.993.143.98
R51.753.083.433.503.642.763.46
R62.322.673.903.994.063.153.95
R72.462.904.544.274.253.154.41
R81.963.574.424.634.523.294.52
R91.983.325.064.754.673.834.91
R102.913.424.314.854.663.724.58
R111.682.382.322.242.682.162.28
R122.212.423.172.953.072.103.06
R131.472.253.162.913.202.553.03
R141.472.593.613.403.162.493.50
R152.012.443.343.203.602.653.27
R161.512.733.833.853.843.053.84
R172.493.134.234.394.063.424.31
R182.613.454.714.714.583.584.71
R192.293.834.745.094.903.944.92
R202.513.224.084.044.113.204.06
T30 (s)125 Hz250 Hz500 Hz1000 Hz2000 Hz4000 HzAverage (500–1000 Hz)
R12.723.294.063.803.602.733.93
R22.443.303.843.943.863.023.89
R32.503.093.803.813.662.793.80
R42.443.333.863.953.823.083.90
R52.373.214.274.183.902.964.23
R62.353.173.473.523.832.983.49
R72.313.793.663.853.853.193.76
R82.863.484.723.964.303.414.34
R92.813.614.594.604.233.354.59
R102.293.253.663.703.703.213.68
R112.133.044.333.313.372.163.82
R122.313.203.693.643.712.953.66
R132.463.133.673.923.692.813.80
R142.393.223.823.893.692.893.85
R152.383.223.903.853.772.983.87
R162.633.343.813.763.753.043.78
R172.663.474.003.943.732.903.97
R182.813.624.293.833.833.184.06
R192.823.684.384.414.163.394.40
R203.012.923.464.324.043.153.89
D50125 Hz250 Hz500 Hz1000 Hz2000 Hz4000 HzAverage (500–4000 Hz)
R10.540.320.380.450.410.430.42
R20.590.370.230.410.380.380.35
R30.390.390.30.260.230.290.27
R40.390.350.130.10.230.270.18
R50.120.420.190.250.160.30.23
R60.310.260.110.080.10.230.13
R70.170.270.290.270.280.340.30
R80.120.250.170.270.170.30.23
R90.070.110.120.040.030.060.06
R100.110.20.150.060.050.070.08
R110.50.330.310.410.390.460.39
R120.620.430.240.320.420.520.38
R130.330.240.310.20.160.290.24
R140.560.250.220.220.240.280.24
R150.10.380.240.170.180.250.21
R160.310.110.120.120.170.330.19
R170.080.210.10.060.070.130.09
R180.030.120.110.030.030.040.05
R190.020.040.030.010.010.020.02
R200.130.130.120.240.170.240.19

Appendix C. Acoustical Characteristics in Pier B

Table A4. Distances from the sound source to each receiving point in Pier B, along with their corresponding STI and LAeq values.
Receiver PointsR1R2R3R4R5R6R7R8R9R10
The source–receiver propagation distance (m)11.3411.2827.9745.7054.5936.7519.688.0018.0036.00
STI0.540.550.430.380.310.360.440.530.470.45
LAeq (dBA)89.8092.3086.6084.5082.7083.3086.0388.0087.3084.70
Receiver PointsR11R12R13R14R15R16
The source–receiver propagation distance (m)54.0072.0085.5685.8972.4454.65
STI0.410.380.340.290.340.29
LAeq (dBA)80.4077.9074.9072.9075.8077.40
Table A5. The EDT, T30, and D50 values for each receiving point in Pier B across different frequency bands, along with their respective averages.
EDT (s)125 Hz250 Hz500 Hz1000 Hz2000 Hz4000 HzAverage (500–1000 Hz)
R11.501.922.582.152.441.932.37
R21.811.872.432.452.341.982.44
R32.632.643.243.893.262.533.57
R42.312.973.793.773.582.763.78
R51.983.193.853.953.802.913.90
R62.103.083.803.873.612.693.84
R72.092.603.372.993.132.203.18
R81.632.382.902.502.572.052.70
R91.652.283.242.993.062.223.12
R101.832.673.363.553.372.443.46
R112.503.233.604.023.962.923.81
R122.943.483.954.224.173.234.08
R132.883.744.624.704.683.704.66
R143.373.574.674.834.693.734.75
R152.793.493.934.374.223.374.15
R162.883.154.254.224.193.314.24
T30 (s)125 Hz250 Hz500 Hz1000 Hz2000 Hz4000 HzAverage (500–1000 Hz)
R12.252.823.543.323.352.433.43
R22.582.742.783.093.162.282.93
R32.232.893.463.513.442.733.49
R42.413.103.533.483.372.753.50
R52.473.093.613.523.482.833.56
R62.183.053.593.453.382.773.52
R72.352.783.403.553.322.613.47
R82.142.903.443.383.142.473.41
R92.393.133.673.543.492.773.60
R102.503.083.603.583.492.843.59
R112.633.213.973.703.793.013.83
R122.393.293.924.013.883.183.97
R132.673.544.034.194.253.454.11
R142.713.584.174.244.433.454.20
R152.713.394.084.123.913.254.10
R162.623.493.833.953.843.223.89
D50125 Hz250 Hz500 Hz1000 Hz2000 Hz4000 HzAverage (500–4000 Hz)
R10.730.570.370.600.440.640.51
R20.760.570.350.650.450.720.54
R30.530.230.430.270.250.330.32
R40.290.340.250.180.220.300.24
R50.190.170.110.090.100.150.11
R60.400.280.110.110.120.200.14
R70.600.360.190.300.350.380.31
R80.600.300.490.550.460.580.52
R90.470.500.330.250.350.360.32
R100.500.380.310.250.380.390.33
R110.530.340.310.300.240.320.29
R120.210.290.320.220.180.260.25
R130.220.280.270.160.140.220.20
R140.160.170.110.050.040.060.07
R150.200.190.120.120.110.160.13
R160.160.130.080.080.060.080.08

References

  1. Edwards, B. The Modern Airport Terminal: New Approaches to Airport Architecture; Taylor & Francis: London, UK, 2004. [Google Scholar]
  2. Kazda, A.; Caves, R.E. Airport Design and Operation; Emerald Group Publishing Limited: Leeds, UK, 2010. [Google Scholar]
  3. Bandara, S.S. Wirasinghe, Optimum geometries for pier-type airport terminals. J. Transp. Eng. 1992, 118, 187–206. [Google Scholar] [CrossRef]
  4. Bandara, S.S. Wirasinghe, Walking distance minimization for airport terminal configurations. Transp. Res. Part A Policy Pract. 1992, 26, 59–74. [Google Scholar] [CrossRef]
  5. Hanaoka, S.; Saraswati, B. Low cost airport terminal locations and configurations. J. Air Transp. Manag. 2011, 17, 314–319. [Google Scholar] [CrossRef]
  6. Liu, J.C.-C.; Lu, P.-C. Sound field prediction in long enclosures with branches: A combined method. Appl. Acoust. 2010, 71, 306–314. [Google Scholar] [CrossRef]
  7. Li, K.M.; Iu, K.K. Propagation of sound in long enclosures. J. Acoust. Soc. Am. 2004, 116, 2759–2770. [Google Scholar] [CrossRef]
  8. Nowicka, E. Initial acoustic assessment of long underground enclosures for designers. Tunn. Undergr. Space Technol. 2020, 105, 103577. [Google Scholar] [CrossRef]
  9. Picaut, J.; Simon, L.; Polack, J.D. Sound field in long rooms with diffusely reflecting boundaries. Appl. Acoust. 1999, 56, 217–240. [Google Scholar] [CrossRef]
  10. Jing, Y.; Larsen, E.W.; Xiang, N. One-dimensional transport equation models for sound energy propagation in long spaces: Theory. J. Acoust. Soc. Am. 2010, 127, 2312–2322. [Google Scholar] [CrossRef]
  11. Redmore, T.L. A method to predict the transmission of sound through corridors. Appl. Acoust. 1982, 15, 133–146. [Google Scholar] [CrossRef]
  12. Davies, H.G. Noise propagation in corridors. J. Acoust. Soc. Am. 1973, 53, 1253–1262. [Google Scholar] [CrossRef]
  13. Yamamoto, T. On the distribution of sound in a corridor. J. Acoust. Soc. Jpn. 1961, 17, 286–292. [Google Scholar]
  14. Imaizumi, H.; Kunimatsu, S.; Isei, T. Sound propagation and speech transmission in a branching underground tunnel. J. Acoust. Soc. Am. 2000, 108, 632–642. [Google Scholar] [CrossRef] [PubMed]
  15. Li, K.M.; Iu, K.K. Full-scale measurements for noise transmission in tunnels. J. Acoust. Soc. Am. 2005, 117, 1138–1145. [Google Scholar] [CrossRef]
  16. Shimokura, R.; Soeta, Y. Sound field characteristics of underground railway stations—Effect of interior materials and noise source positions. Appl. Acoust. 2012, 73, 1150–1158. [Google Scholar] [CrossRef]
  17. Zhao, W.; Zhu, X.; Kang, J.; Xu, H. Sound field of subway platforms with complex forms. Tunn. Undergr. Space Technol. 2024, 147, 105701. [Google Scholar] [CrossRef]
  18. Law, M.K.; Li, K.M.; Leung, C.W. Noise reduction in tunnels by hard rough surfaces. J. Acoust. Soc. Am. 2008, 124, 961–972. [Google Scholar] [CrossRef]
  19. Geng, Y.; Yu, J.; Lin, B.; Wang, Z.; Huang, Y. Impact of individual IEQ factors on passengers’ overall satisfaction in Chinese airport terminals. Build. Environ. 2017, 112, 241–249. [Google Scholar] [CrossRef]
  20. van Wijngaarden, S.J.; Atsma, R. Ambient noise inside airport terminals: A detailed survey of the background noise at Amsterdam Airport Schiphol. In INTER-NOISE and NOISE-CON Congress and Conference Proceedings; Institute of Noise Control Engineering: Grand Rapids, MA, USA, 2020; pp. 1588–1595. [Google Scholar]
  21. Wang, Z.; Zhao, H.; Lin, B.; Zhu, Y.; Ouyang, Q.; Yu, J. Investigation of indoor environment quality of Chinese large-hub airport terminal buildings through longitudinal field measurement and subjective survey. Build. Environ. 2015, 94, 593–605. [Google Scholar] [CrossRef]
  22. Li, X.; Zhao, Y. Evaluation of sound environment in departure lounges of a large hub airport. Build. Environ. 2023, 232, 110046. [Google Scholar] [CrossRef]
  23. Liu, M.; Gao, Z.; Chang, F.; Zhao, W.; Wang, J.; Ma, H.; Wang, C. Passengers’ Perception of Acoustic Environment in the Airport Terminal: A Case Study of Tianjin Binhai International Airport. Buildings 2023, 13, 2585. [Google Scholar] [CrossRef]
  24. Li, X.; Zhao, Y. Exploring Factors Influencing Speech Intelligibility in Airport Terminal Pier-Style Departure Lounges. Buildings 2025, 15, 426. [Google Scholar] [CrossRef]
  25. Fitzroy, D. Reverberation Formula Which Seems to Be More Accurate with Nonuniform Distribution of Absorption. J. Acoust. Soc. Am. 1959, 31, 893–897. [Google Scholar] [CrossRef]
  26. Edition 1. ISO 9921:2003; Ergonomics—Assessment of Speech Communication. ISO: Geneva, Switzerland, 2003.
  27. Dirac Room Acopustics Software—7841. Available online: https://www.hbkworld.com/en/products/instruments/handheld/hand-held-software/desktop-applications/dirac-room-acoustics-software-7841#!ref_bksv.com (accessed on 10 January 2025).
  28. Li, K.M.; Lam, P.M. Prediction of reverberation time and speech transmission index in long enclosures. J. Acoust. Soc. Am. 2005, 117, 3716–3726. [Google Scholar] [CrossRef] [PubMed]
  29. Visentin, C.; Prodi, N.; Valeau, V.; Picaut, J. Experimental analysis of the relationship between reverberant acoustic intensity and energy density inside long rooms. J. Acoust. Soc. Am. 2015, 138, 181–192. [Google Scholar] [CrossRef] [PubMed]
  30. Riener, K.R.; Warren, R.M.; Bashford, J.A., Jr. Novel findings concerning intelligibility of bandpass speech. J. Acoust. Soc. Am. 1992, 91 (Suppl. S4), 2339. [Google Scholar] [CrossRef]
  31. Stickney, G.S.; Assmann, P.F. Intelligibility of bandpass-filtered speech. J. Acoust. Soc. Am. 1997, 102 (Suppl. S5), 3134. [Google Scholar] [CrossRef]
  32. Kang, J. Sound attenuation in long enclosures. Build. Environ. 1996, 31, 245–253. [Google Scholar] [CrossRef]
  33. Kang, J. Reverberation in Rectangular Long Enclosures with Geometrically Reflecting Boundaries. Acta Acust. 1996, 82, 509–516. [Google Scholar]
  34. Lambert, R.F. A Study of the Factors Influencing the Damping of an Acoustical Cavity Resonator. J. Acoust. Soc. Am. 1953, 25, 1068–1083. [Google Scholar] [CrossRef]
  35. Bradfield, G. Damping of surface (sound) waves by the air. Electron. Lett. 1968, 4, 95–96. [Google Scholar] [CrossRef]
  36. Kang, J. Acoustics in long enclosures with multiple sources. J. Acoust. Soc. Am. 1996, 99, 985–989. [Google Scholar] [CrossRef]
  37. Sabine, W.C. Collected Papers on Acoustics; Harvard University Press: Cambridge, MA, USA, 1922. [Google Scholar]
  38. IBM SPSS Software. Available online: https://www.ibm.com/spss (accessed on 10 January 2025).
  39. GB 50526-2010; Technical Code for Public Address System Engineering. DSPPA: Beijing, China, 2010.
  40. Editi on 5.0. IEC 60286-16; Sound System Equipment-Part 16: Objective Rating of Speech Intelligibility by Speech Transmission Index. IEC: Geneva, Switzerland, 2020.
Figure 1. Floor plan and sound field measurement point layout diagram of pier-style departure lounges. (a) Floor plan and sound field measurement point in Pier A. (b) Floor plan and sound field measurement point in Pier B.
Buildings 15 00915 g001
Figure 2. The interior decoration of the departure lounges. (a) The interior decoration in Pier A. (b) The interior decoration in Pier B.
Buildings 15 00915 g002
Figure 3. System configuration of impulse response measurement in airport terminal.
Buildings 15 00915 g003
Figure 4. On-site photos of the sound field measurement. (a) The sound source of the sound field measurement. (b) The measurement receiving point.
Buildings 15 00915 g004
Figure 5. System configuration of sound pressure level measurement in airport terminal.
Buildings 15 00915 g005
Figure 6. Normalized impulse responses at two representative receiver points in Pier A. (a) Receiver Point 1 impulse responses. (b) Receiver Point 8 impulse responses.
Buildings 15 00915 g006
Figure 7. Spatial distributions of T30 in Pier A for six octave bands: (a) 125 Hz, (b) 250 Hz, (c) 500 Hz, (d) 1000 Hz, (e) 2000 Hz, and (f) 4000 Hz.
Buildings 15 00915 g007aBuildings 15 00915 g007b
Figure 8. Spatial distributions of T30 in Pier B for six octave bands: (a) 125 Hz, (b) 250 Hz, (c) 500 Hz, (d) 1000 Hz, (e) 2000 Hz, and (f) 4000 Hz.
Buildings 15 00915 g008
Figure 9. Comparison of the measured relative sound pressure levels in Pier A and Pier B with the theoretical values calculated for a free sound field. (***: p < 0.001).
Buildings 15 00915 g009
Figure 10. Graphs illustrating the variation in 125–4000 Hz EDT and T30 with distance from the sound source at each receiving point in Pier A and Pier B. (*: p < 0.05, **: p < 0.01, ***: p < 0.001). (a) The dependence of EDT on propagation distance in Pier A; (b) The dependence of T30 on propagation distance in Pier A; (c) The dependence of EDT on propagation distance in Pier B; (d) The dependence of T30 on propagation distance in Pier B.
Buildings 15 00915 g010
Figure 11. Comparison of EDT(500–1k) and T30(500–1k) averages in Pier A and Pier B. (*: p < 0.05). (a) Comparison of EDT(500–1k) in Pier A and Pier B. (b) Comparison of T30(500–1k) in Pier A and Pier B.
Buildings 15 00915 g011
Figure 12. Graphs illustrating the variation in T30(500–1k) with distance from the sound source at each receiving point in Pier A and Pier B. (**: p < 0.01, ***: p < 0.001).
Buildings 15 00915 g012
Figure 13. Graphs illustrating the variation in 125–4000 Hz D50 with distance from the sound source at each receiving point in Pier A and Pier B. (*: p < 0.05, **: p < 0.01, ***: p < 0.001). (a) The dependence of D50 on propagation distance in Pier A. (b) The dependence of D50 on propagation distance in Pier B.
Buildings 15 00915 g013
Figure 14. Graphs illustrating the variation in STI with distance from the sound source at each receiving point in Pier A and Pier B. (***: p < 0.001).
Buildings 15 00915 g014
Disclaimer/Publisher’s Note: The statements, opinions and data contained in all publications are solely those of the individual author(s) and contributor(s) and not of MDPI and/or the editor(s). MDPI and/or the editor(s) disclaim responsibility for any injury to people or property resulting from any ideas, methods, instructions or products referred to in the content.

