Article

Design Optimization Approach for Residential Outdoor Environments Based on Seasonal Variations in Local Thermal Perception

1
China Academy of Building Research, Beijing 100013, China
2
Zhongguancun Institute of Human Settlements Engineering and Materials, Beijing 100083, China
3
School of Architecture, Tsinghua University, Beijing 100084, China
*
Author to whom correspondence should be addressed.
Buildings 2025, 15(6), 876; https://doi.org/10.3390/buildings15060876
Submission received: 9 February 2025 / Revised: 28 February 2025 / Accepted: 8 March 2025 / Published: 12 March 2025
(This article belongs to the Section Building Energy, Physics, Environment, and Systems)

Abstract

Outdoor thermal environments significantly influence residents’ outdoor activities, yet current urban design often lacks sufficient attention to thermal comfort, and existing design methods remain inadequate. This study addresses these gaps by first demonstrating the crucial impact of outdoor thermal environments on human activity through a combination of field measurements and resident surveys. Using the Yangtze River Delta region as a case study, we propose a set of design optimization strategies based on local residents’ thermal perception characteristics. By conducting a quantitative analysis of local residents’ thermal perception, this study identifies their seasonal thermal comfort needs and translates these insights into refined outdoor space optimization strategies. The results highlight significant seasonal variations in outdoor thermal preferences, with autumn providing the highest satisfaction, followed by winter and summer. Based on these findings, we propose precision-driven design optimizations that align outdoor spatial configurations with residents’ comfort thresholds. Strategies such as dynamic shading arrangements for summer cooling and wind-shielding structures for winter warmth were tailored to actual usage patterns, enhancing the functionality and livability of outdoor spaces. This research offers a data-driven approach to climate-responsive and human-centered residential outdoor space design, providing valuable guidance for urban planners and designers.

1. Introduction

Outdoor spaces, vital venues for public activities, serve as essential indicators of urban livability and vitality [1,2,3]. Among the various factors influencing the quality of these spaces, the thermal environment plays a pivotal role [4,5]. It not only directly impacts residents’ physical and mental well-being [6,7], but also affects the duration, type, and frequency of outdoor activities [8,9,10,11,12].
Research on the relationship between outdoor thermal environments and human behavior can be traced back to the 1930s [13,14,15]. However, it was not until the 1970s that Fanger and his colleagues developed an efficient and practical method for assessing thermal comfort [16,17,18]. Their work identified six key factors: air temperature, radiant temperature, relative humidity, wind speed, clothing insulation, and physical activity. This pioneering research transitioned the field from qualitative assessments to quantitative analysis by integrating both environmental and physiological variables. Over the past decade, advances in urban climatology, heat exchange physics, and computer science have significantly accelerated progress in this field [19,20,21]. Outdoor thermal perception indices are now commonly categorized into rational and empirical indices. Rational indices, grounded in thermodynamic and physiological modeling [22,23], include widely used measures such as the Predicted Mean Vote (PMV) [24], Standard Effective Temperature (SET*) [25], Outdoor Standard Effective Temperature (OUT_SET*) [26], Physiologically Equivalent Temperature (PET) [27,28], and Universal Thermal Climate Index (UTCI) [29]. Among these, the OUT_SET*, PET, and UTCI are most commonly applied in outdoor thermal environment research [30]. Empirical indices, on the other hand, focus on detailed investigations of climatic parameters affecting outdoor thermal perception [31,32,33], employing methods such as field measurements [34,35] and multivariate regression analysis [34,36,37,38].
Cities function as complex, open macro-systems where the dynamic and often unpredictable interaction of various factors influencing outdoor thermal perception profoundly impacts the sustainable development of urban resources, society, and environmental systems [39,40,41,42]. Addressing these challenges necessitates research across four key dimensions: physical, physiological, psychological, and social behavior [8,14,33,43,44]. Physiological adaptations, encompassing the regulation of core body temperature, sweating rate, and skin temperature, are influenced by factors such as air temperature, activity level, clothing insulation, relative humidity, wind speed, short-wave solar radiation, and long-wave terrestrial radiation. However, these variables adapt slowly to climatic changes and are not the primary focus of outdoor thermal perception studies. In contrast, psychological adaptation and social behavioral adjustments have a significant impact on thermal perception [45,46,47]. Numerous studies conducted worldwide across various climate zones, including Gothenburg, Sweden [48], Montreal, Canada [49], Matsue, Japan [50], Taiwan, China [46,51], and Hong Kong, China [52,53], have investigated outdoor thermal perception and associated behavioral patterns. These studies not only indicate that seasonal climatic variations and outdoor spatial configurations greatly influence individuals’ perceptions of thermal environments [33], but also demonstrate that residents adjust their expectations of outdoor thermal perception in response to seasonal changes [7,43]. Therefore, understanding the characteristics and preferences of outdoor thermal perception and behavioral patterns in relation to seasonal variations holds significant academic value.
Currently, many older urban residential areas in the Yangtze River Delta region are experiencing a significant decline in thermal environment quality, particularly in outdoor public spaces [54]. This deterioration in thermal comfort has led to a loss of vitality in these spaces, posing a substantial risk to urban development. As a result, optimizing outdoor residential space to enhance the thermal environment provides city planners with a new governance approach. This approach transcends traditional aesthetic considerations, prioritizing instead the integration of resident activity patterns and thermal perception needs within the urban planning process [36,55,56].
In this context, the study aimed to achieve the following objectives: (1) to summarize the optimal thermal environment for outdoor activities, (2) to characterize resident behavioral responses to thermal environments across varying activity types, age groups, and genders, and (3) to identify the relationship between outdoor thermal environments and residents’ activity behaviors through comparative experiments. Building upon these objectives, this study introduces a novel approach by integrating seasonal variations in outdoor thermal comfort with residents’ temporal activity patterns. Instead of solely focusing on static thermal comfort metrics, we emphasize the dynamic relationship between thermal perception and activity timing, ensuring that outdoor spaces remain functional and comfortable throughout the year. This integration provides valuable insights for urban planning and climate-responsive design, laying a foundation for more precise and adaptive outdoor space optimization strategies in future research.

2. Materials and Methods

To comprehensively understand residents’ perceptions of outdoor thermal environments and their behavioral characteristics in residential areas of the Yangtze River Delta, this study conducted behavioral observations, questionnaire surveys, and field measurements in typical residential areas during summer [20,57,58,59,60], the transitional season (autumn) [61,62], and winter [20,63,64,65], which were chosen for their representative climatic characteristics. The workflow is shown in Figure 1.

2.1. Case Study and Seasonal Selection Justification

The Yangtze River Delta is one of China’s most developed urban agglomerations, distinguished by a long history of urbanization and diverse city morphology. With a high population density and limited urban space, public outdoor areas experience significant usage pressure. Additionally, the region exhibits distinct seasonal climate variations, characterized by hot, humid summers and cool, dry winters. These pronounced seasonal transitions make it an ideal setting for studying the effects of seasonal thermal environment changes on outdoor activities and thermal comfort.
Research indicates that meteorological factors such as temperature, humidity, and wind direction show considerable overlap between spring and autumn in the Yangtze River Delta, resulting in minimal seasonal differences in outdoor thermal perception [66,67,68]. To ensure research precision and avoid redundant data collection, this study focuses on summer, autumn (a transitional season), and winter [69,70,71]. This approach facilitates a more detailed analysis of seasonal outdoor thermal environments and their impact on human thermal comfort.

2.2. Questionnaire Survey

This study employed a questionnaire survey to investigate urban residents’ outdoor activities and thermal perceptions. The questionnaire was designed based on existing frameworks [9,35,72] and consisted of three main sections: (1) objective information, which gathered demographic data such as age, gender, clothing, and length of residence; (2) subjective perceptions, which used ASHRAE’s standardized scales, including the seven-point thermal sensation vote (TSV) and the four-point thermal comfort vote (TCV) [73,74,75], to capture participants’ evaluations of thermal perception and comfort in outdoor spaces; (3) seasonal preferences, which assessed residents’ preferences for outdoor activity times across different seasons. Surveys were conducted on clear, sunny days to ensure the reliability and representativeness of the data [20,70,76,77,78]. Respondents were screened for local residency to avoid potential data contamination from non-residents. In total, 1165 valid questionnaires were collected, with 635 from summer, 271 from the transitional season (autumn), and 259 from winter.
Although there are significant differences in sample sizes across seasons (summer: 635, autumn: 271, winter: 259), effect size analysis, specifically the calculation of Cohen’s d, reveals that the Cohen’s d between summer and both autumn and winter is greater than 0.5. This indicates that the differences in thermal comfort perception between the seasons are statistically significant, even with unequal sample sizes. Therefore, the disparity in sample sizes across seasons does not significantly affect the validity of the study’s findings.

2.3. Questionnaire Surveys

Microclimate data were collected using a Kestrel 5400 portable weather station (USA) and an HD32.3 heat stress meter (Delta Ohm, Padova, Italy), which was equipped with a TP3276.2 black globe temperature probe and an AP3203.2 omnidirectional hot-wire anemometer [79]. These instruments measured key microclimate parameters, including air temperature (Ta/°C), relative humidity (RH/%), wind speed (Va, m/s), and black globe temperature (Tg/°C) [12,70,80]. All instruments were mounted at a standardized height of 1.5 m at designated measurement points. The mean radiant temperature (Tmrt) was calculated using air temperature, relative humidity, wind speed, and black globe temperature [18,79,80,81,82], following calculation methods specified in international standards ISO 7726-1998 [83] and ASHRAE 55-2017 [84]. The formula for calculating Tmrt is as follows:
T mrt = [ ( T g + 273.15 ) 4 + 1.1 × 10 8 V a 0.6 ε D 0.4 × ( T g T a ) ] 1 4 273.15

2.4. Behavioral Observation

Behavioral observation is a research method that involves directly monitoring subjects to collect data relevant to the study’s objectives [46,85]. In this study, behavioral observation was combined with survey questionnaires to evaluate residents’ preferences for outdoor activity timing. On-site observations and photographic documentation were utilized to record participant numbers and activity statuses in outdoor spaces, enabling an analysis of residents’ spatial preferences during outdoor activities.

2.5. Data Analysis

The Universal Thermal Climate Index (UTCI) is a comprehensive tool for assessing human thermal comfort in outdoor environments. It effectively captures variations in environmental factors such as air temperature, relative humidity, wind speed, and solar radiation [29,86,87,88,89,90], simulating the physiological response of the human body to these conditions. This study adopts the UTCI for outdoor seasonal thermal stress analysis due to its outdoor-specific adaptability [91]. Unlike the PMV (designed for steady indoor conditions), UTCI’s multi-node thermoregulation model dynamically simulates transient solar-wind interactions critical for outdoor heat flux (e.g., shade radiation shifts, gust cooling) [66]. While PET relies on the Munich Model (calibrated with European parameters requiring Asian metabolic adjustments), the UTCI’s globally validated framework eliminates geographical biases, aligning with cross-climate universal analysis needs.
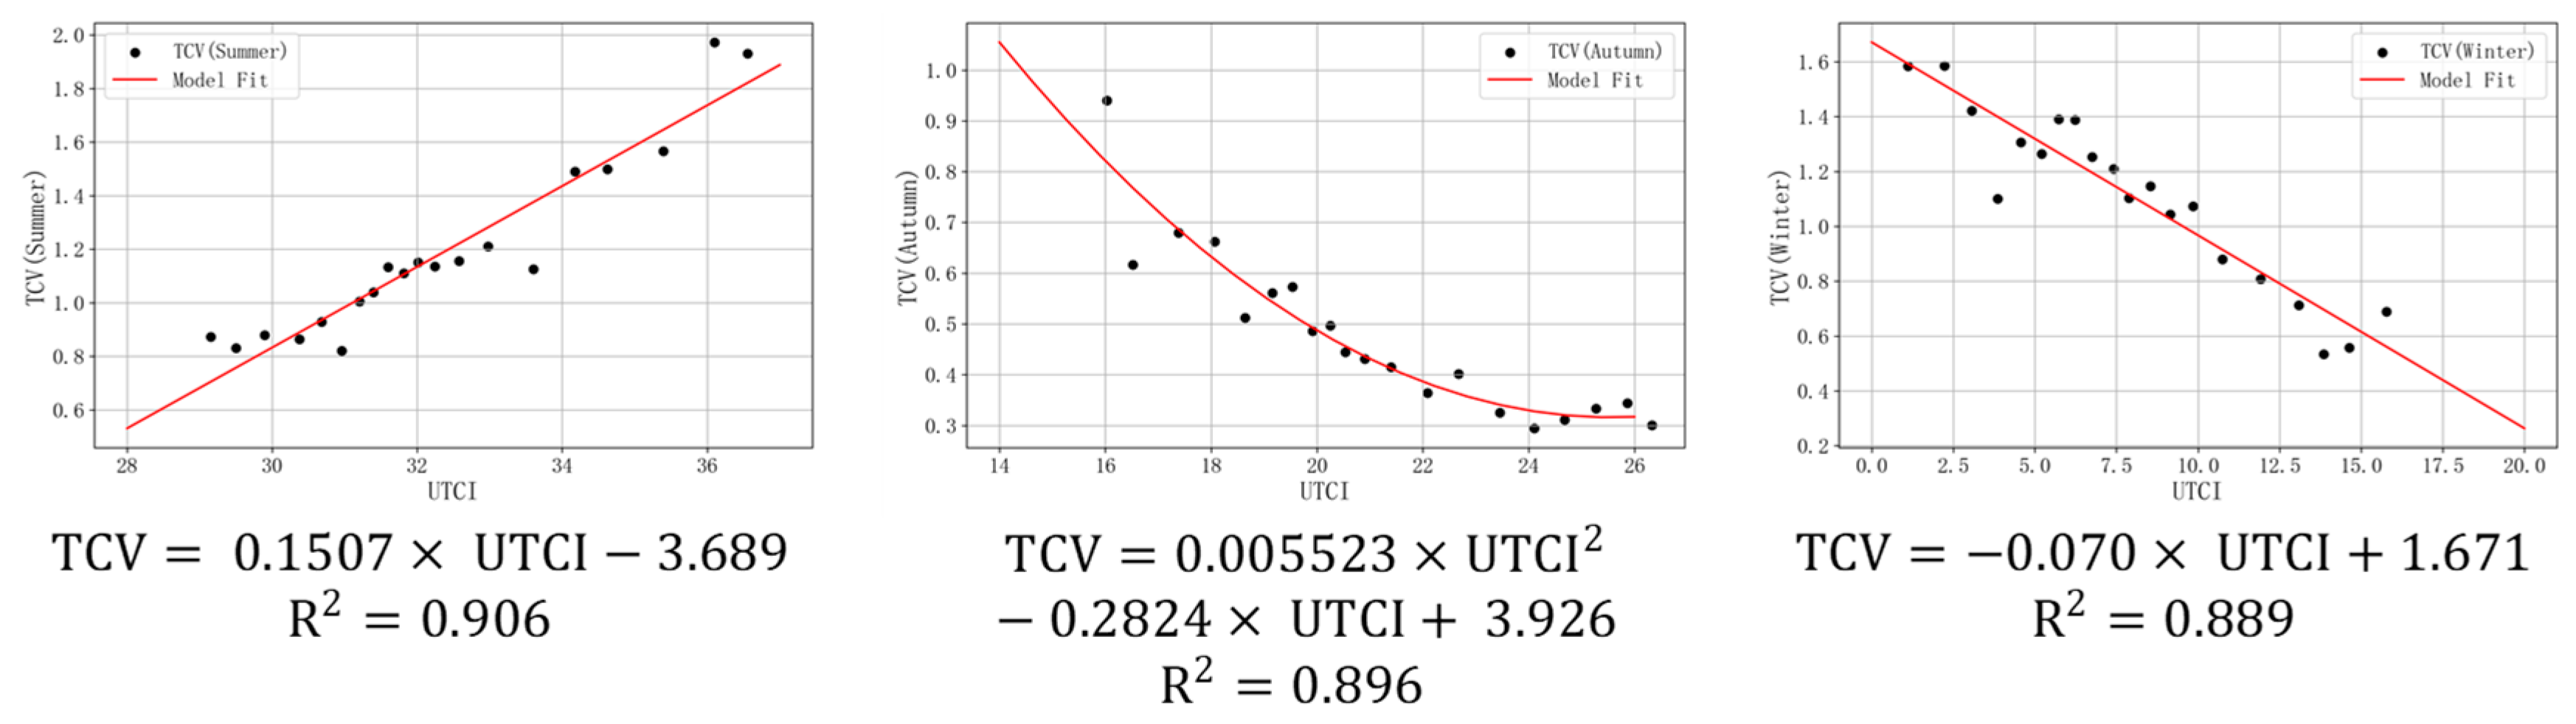
To define the thermal comfort ranges corresponding to seasonal UTCI values, the temperature–frequency method was applied. K-means clustering [92,93,94,95,96] was utilized to categorize UTCI values for each season [97,98]. This study calculated the mean TSV for each cluster and conducted linear regression analysis to explore the relationships between UTCI values, mean TSV, and TCV values. Further regression analysis determined the neutral and comfort UTCI ranges for each season.
Unlike the UTCI, the TSV model incorporates multiple parameters, including air temperature, relative humidity, wind speed, and radiant temperature, offering greater flexibility for thermal comfort assessments [73,74,99]. This model is well suited to diverse environmental conditions and scenarios, offering a more accurate reflection of individual thermal perceptions. This flexibility enables more precise recommendations for optimizing thermal environments. In this study, both the UTCI and the TSV model were employed to quantitatively assess residents’ subjective thermal comfort preferences and perceptions in the survey samples.
Figure 1. Research workflow.
Buildings 15 00876 g001

3. Results

A total of 1165 valid questionnaires were collected, including 635 from summer, 271 from the transitional season (autumn), and 259 from winter. The detailed survey results are provided in Table 1.

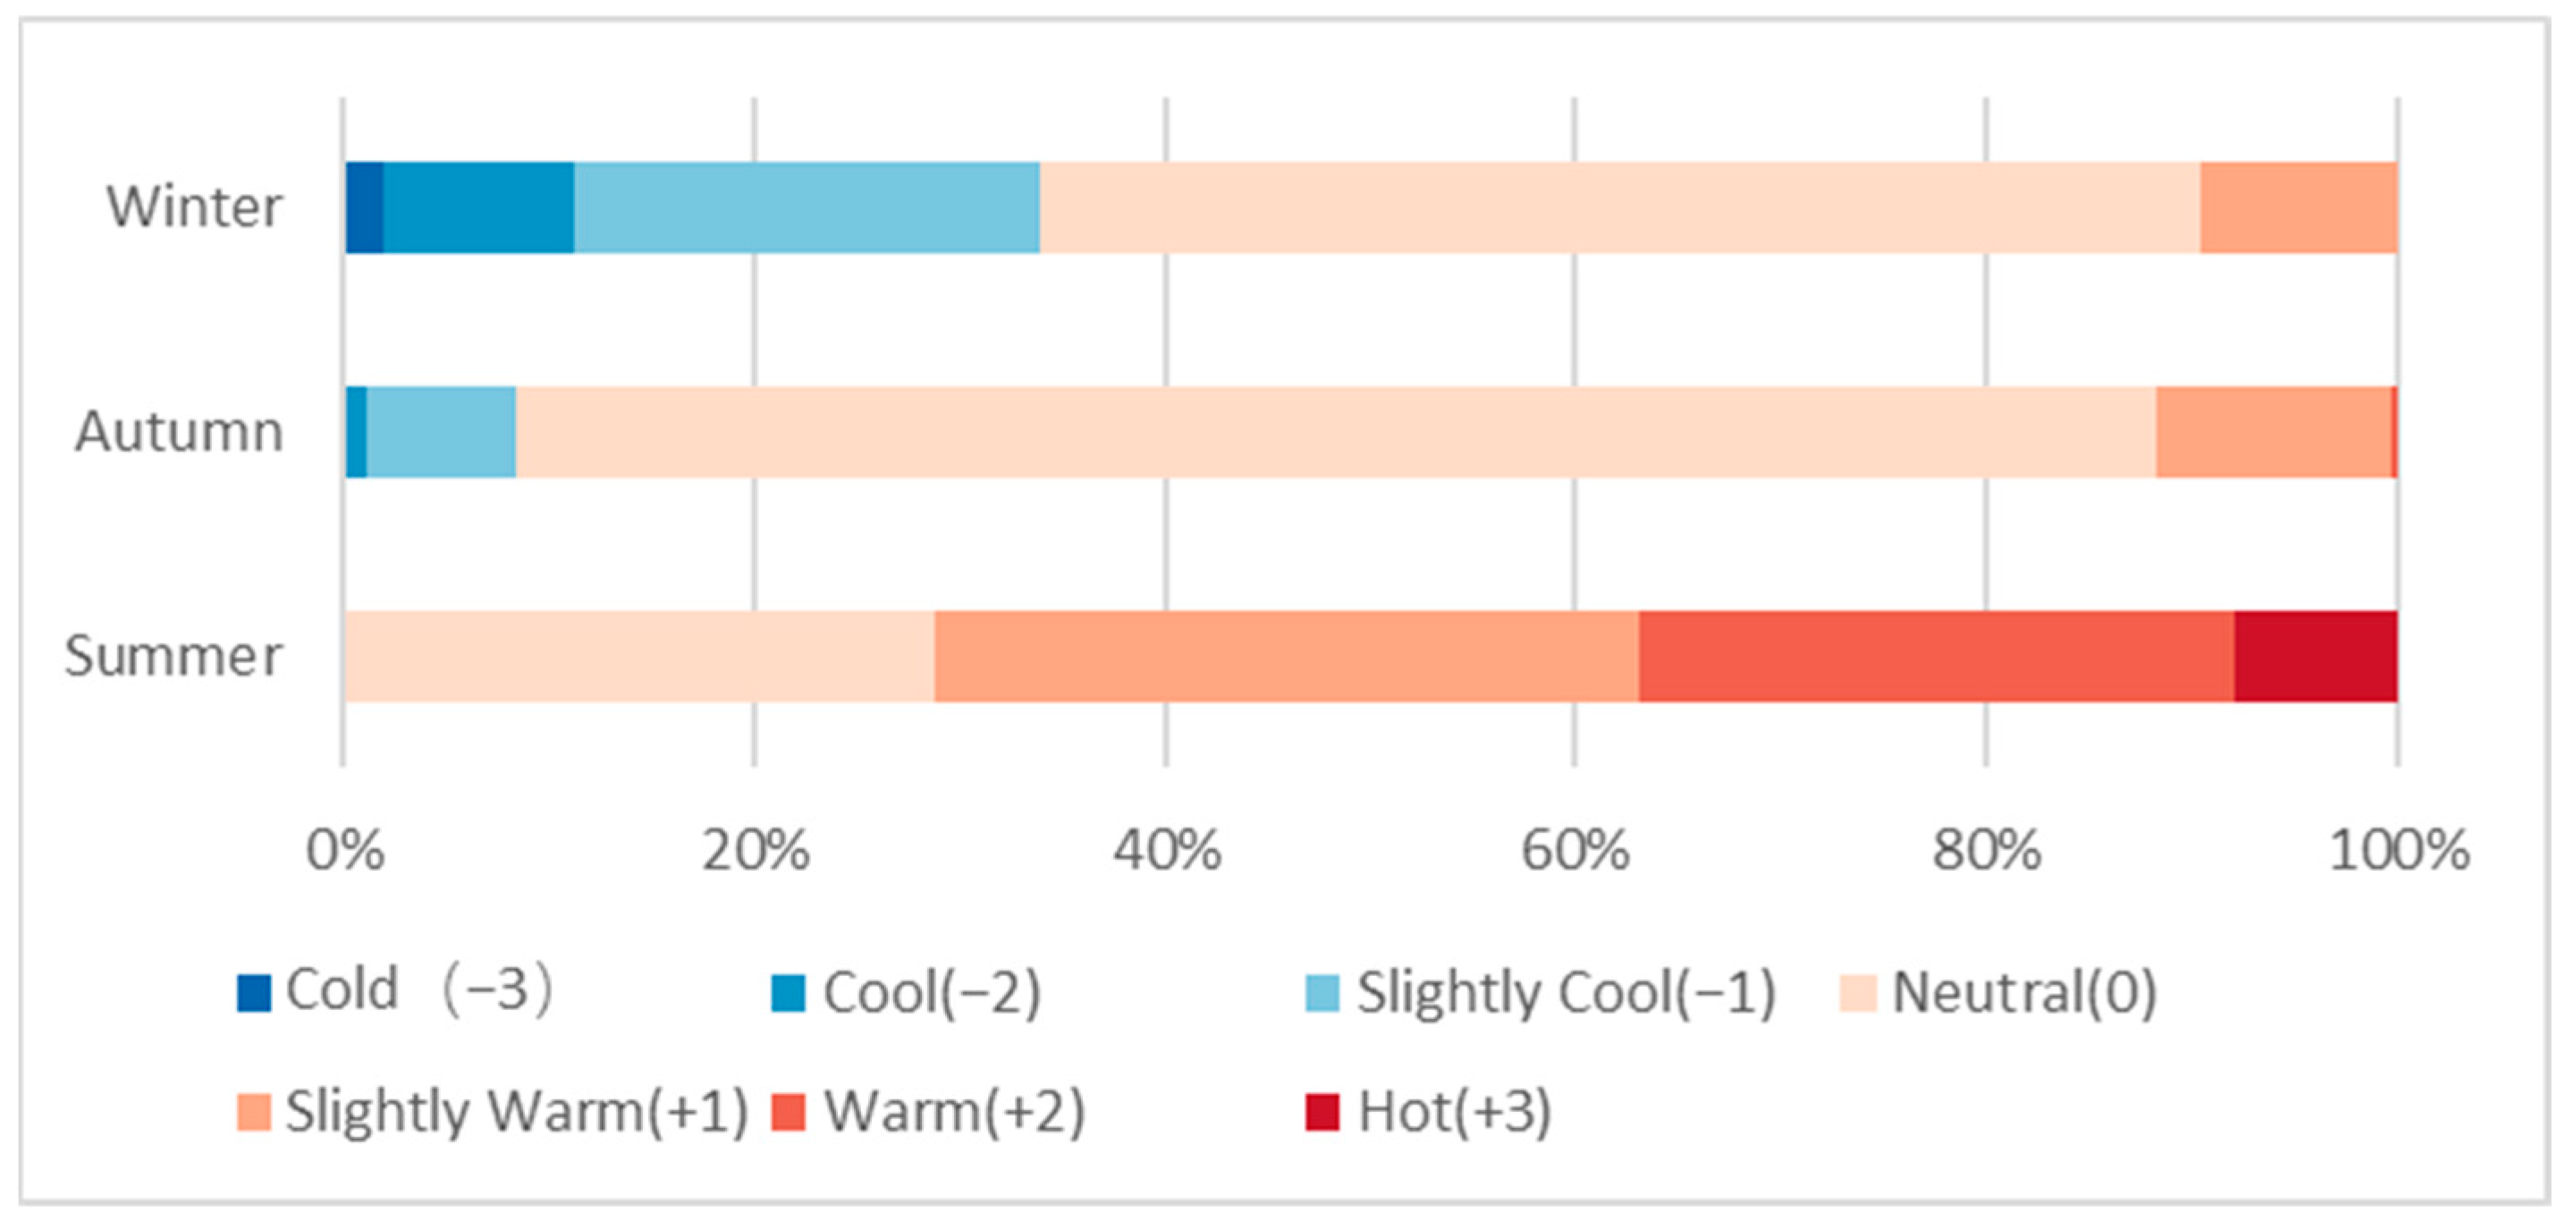
3.1. Outdoor Thermal Sensation Vote (TSV)

TSV results for respondents’ outdoor environmental perceptions across different seasons are summarized in Table 2, with the proportional distribution illustrated in Figure 2.
In summer, among the 635 valid questionnaires collected, 182 respondents (28.66%) selected “neutral (0)”, 217 respondents (34.17%) chose “slightly warm (+1)”, 184 respondents (28.98%) indicated “warm (+2)”, and 51 respondents (8.03%) selected “hot (+3)”. Only one respondent (0.16%) selected “slightly cool (−1)”, while no respondents chose “cool (−2)” or “cold (−3)”. Overall, 400 respondents (62.99%) reported a “neutral thermal sensation”, defined by TSV results within the range of [−1, 1]. In the transitional season (autumn), 271 valid questionnaires were collected. Of these, 182 respondents (79.70%) selected “neutral (0)”, 31 respondents (11.44%) chose “slightly warm (+1)”, 20 respondents (7.38%) selected “slightly cool (−1)”, and 4 respondents (1.48%) chose either “cool (−2)” or “warm (+2)”. No respondents selected “cold (−3)” or “hot (+3)”. In total, 266 respondents (98.52%) were classified as experiencing a “neutral thermal sensation”, based on TSV results within the [−1, 1] range. In winter, 259 valid questionnaires were analyzed. Among these, 146 respondents (56.37%) chose “neutral (0)”, 59 respondents (22.78%) selected “slightly cool (−1)”, 24 respondents (9.27%) chose “cool (−2)”, and 5 respondents (1.93%) selected “cold (−3)”. Additionally, 25 respondents (9.65%) indicated “slightly warm (+1)”, while no respondents chose “warm (+2)” or “hot (+3)”. A total of 230 respondents (88.80%) were categorized as having a “neutral thermal sensation”, as indicated by TSV results within the [−1, 1] range.

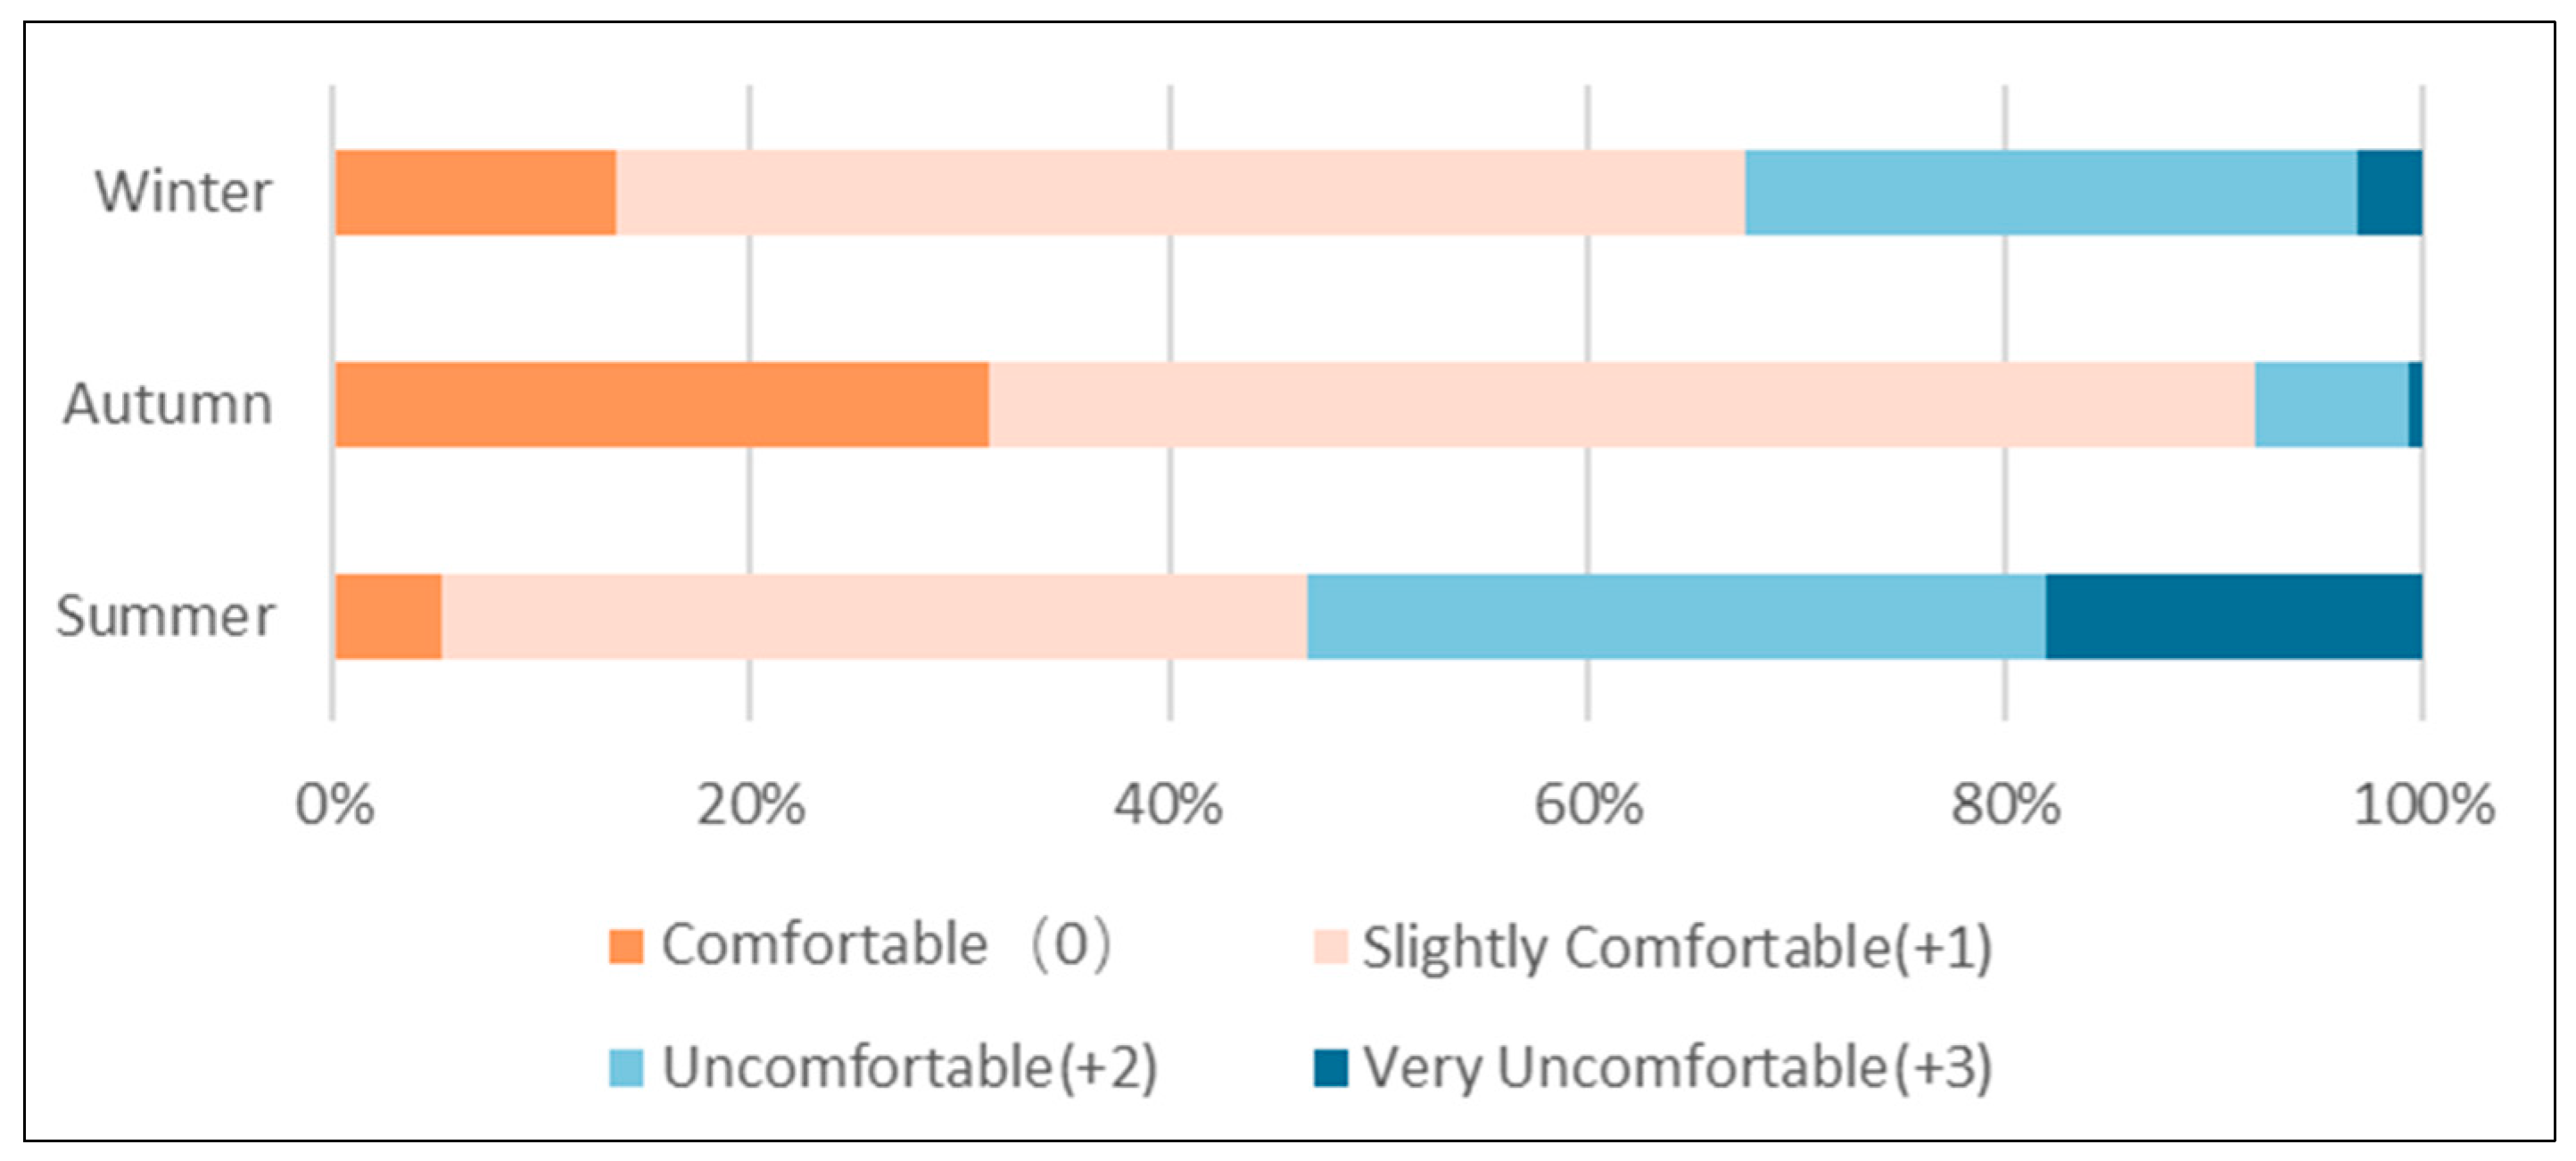
3.2. Outdoor Thermal Comfort Vote (TCV)

The TCV results of the respondents’ outdoor environmental perceptions across different seasons are summarized in Table 3, with the proportional distribution illustrated in Figure 3.
In summer, only 33 respondents (5.20%) selected “comfortable (0),” while 263 respondents (41.42%) chose “slightly comfortable (+1)”. Together, these two groups, classified as “generally satisfied” with the outdoor thermal comfort, accounted for 46.62%, the lowest proportion among the three seasons surveyed. Additionally, 224 respondents (35.28%) rated the environment as “uncomfortable (+2)”, and 115 respondents (18.11%) selected “very uncomfortable (+3)”, the highest proportions observed across the seasons. In the transitional season (autumn), 85 respondents (31.37%) rated the thermal environment as “comfortable (0)”, and 164 respondents (60.52%) chose “slightly comfortable (+1)”. The combined proportion of “generally satisfied” respondents reached 91.88%, the highest among the three seasons. Only 20 respondents (7.38%) selected “uncomfortable (+2)”, and just 2 respondents (0.74%) chose “very uncomfortable (+3)”, representing the lowest proportions observed. In winter, 35 respondents (13.51%) selected “comfortable (0)”, while 164 respondents (54.05%) chose “slightly comfortable (+1)”. The combined proportion of “generally satisfied” respondents was 67.57%, lower than in autumn but higher than in summer. Meanwhile, 76 respondents (29.34%) rated the environment as “uncomfortable (+2)”, and 8 respondents (3.09%) selected “very uncomfortable (+3)”, both lower than in summer but higher than in autumn.

3.3. Outdoor Thermal Environment

During the summer daytime survey period, outdoor air temperatures in the test area ranged from 26.29 °C to 35.98 °C, with an average of 30.58 °C. The relative humidity varied between 59.63% and 84.67%, averaging 74.53%. Wind speeds fluctuated from 0 m/s to 2.47 m/s, with an average of 0.48 m/s. The average radiant temperature measured across multiple points ranged from 27.36 °C to 59.73 °C, with an average of 36.26 °C.
During the transitional season (autumn) daytime survey period, outdoor air temperatures ranged from 15.2 °C to 22.5 °C, with an average of 18.85 °C. Relative humidity fluctuated between 43.1% and 82.1%, averaging 60.13%. Wind speeds varied from 0 m/s to 3.02 m/s, with an average of 0.33 m/s. The average radiant temperature measured across multiple points ranged from 15.23 °C to 41.23 °C, with an average of 23.44 °C.
During the winter daytime survey period, outdoor air temperatures ranged from 4.75 °C to 12.63 °C, with an average of 8.83 °C. The relative humidity ranged from 50.82% to 76.83%, averaging 61.49%. Wind speeds fluctuated between 0 m/s and 2.52 m/s, with an average of 0.33 m/s. The average radiant temperature measured across multiple points ranged from 7.25 °C to 27.36 °C, with an average of 12.68 °C.
The measurement results of the outdoor thermal environment are shown in Table 4.

3.4. Residents’ Seasonal Preferences for Outdoor Activity Time

This study identified residents’ preferred times for outdoor activities across different seasons, drawing upon both survey responses and on-site observations. Table 5 summarizes the key findings, while Figure 4 illustrates the proportional distribution of residents’ activity time preferences for each season.
In summer, outdoor activities were primarily concentrated between 8:00 and 11:00 am and 2:00 and 6:00 pm, with a slight preference for the morning. The peak activity time occurred between 9:00 and 10:00 am, representing 16.38% of the summer sample. In the transitional season (autumn), outdoor activities were most commonly scheduled between 9:00 and 11:00 am and 3:00 and 5:00 pm, with nearly equal participation in both morning and afternoon periods. The highest proportion of respondents (19.56%) selected the 10:00–11:00 am time slot. In winter, outdoor activities were mainly concentrated between 10:00 and 12:00 am and 2:00 and 5:00 pm, with a clear preference for the afternoon. The highest proportion of activity occurred from 3:00 to 4:00 pm, accounting for 22.39% of the winter sample.

3.5. Residents’ Seasonal Preferences for Outdoor Activity Spaces

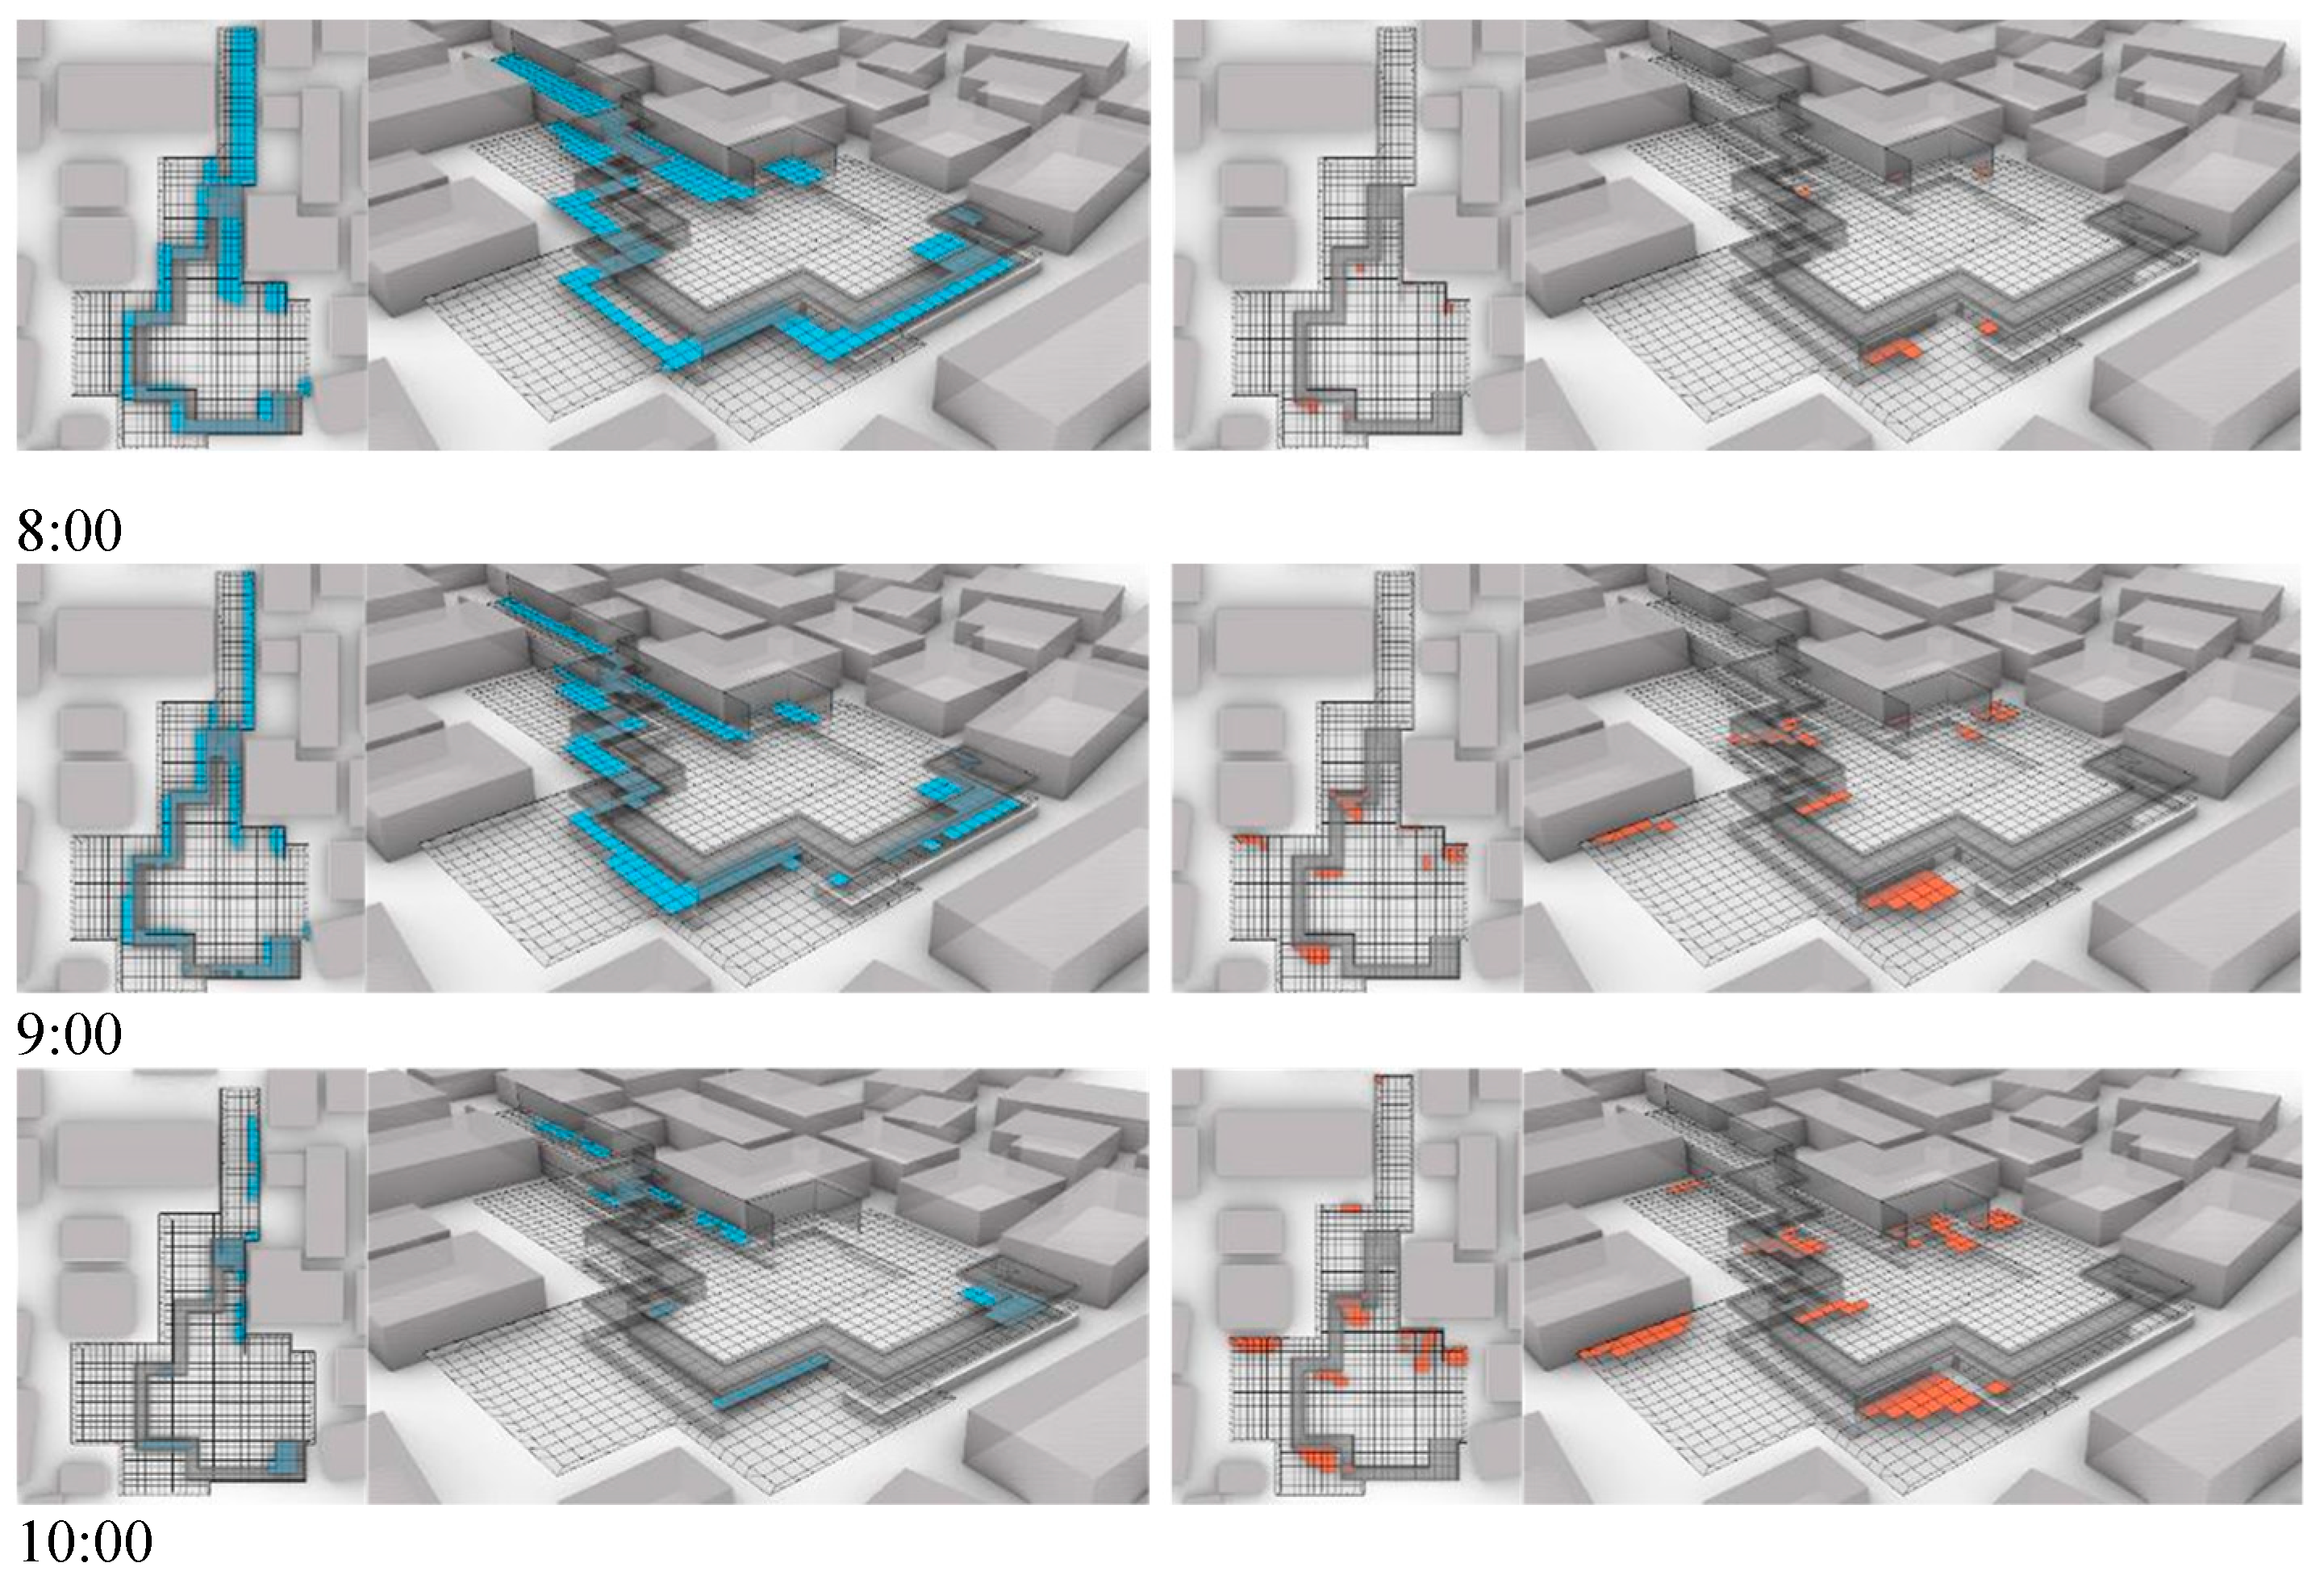
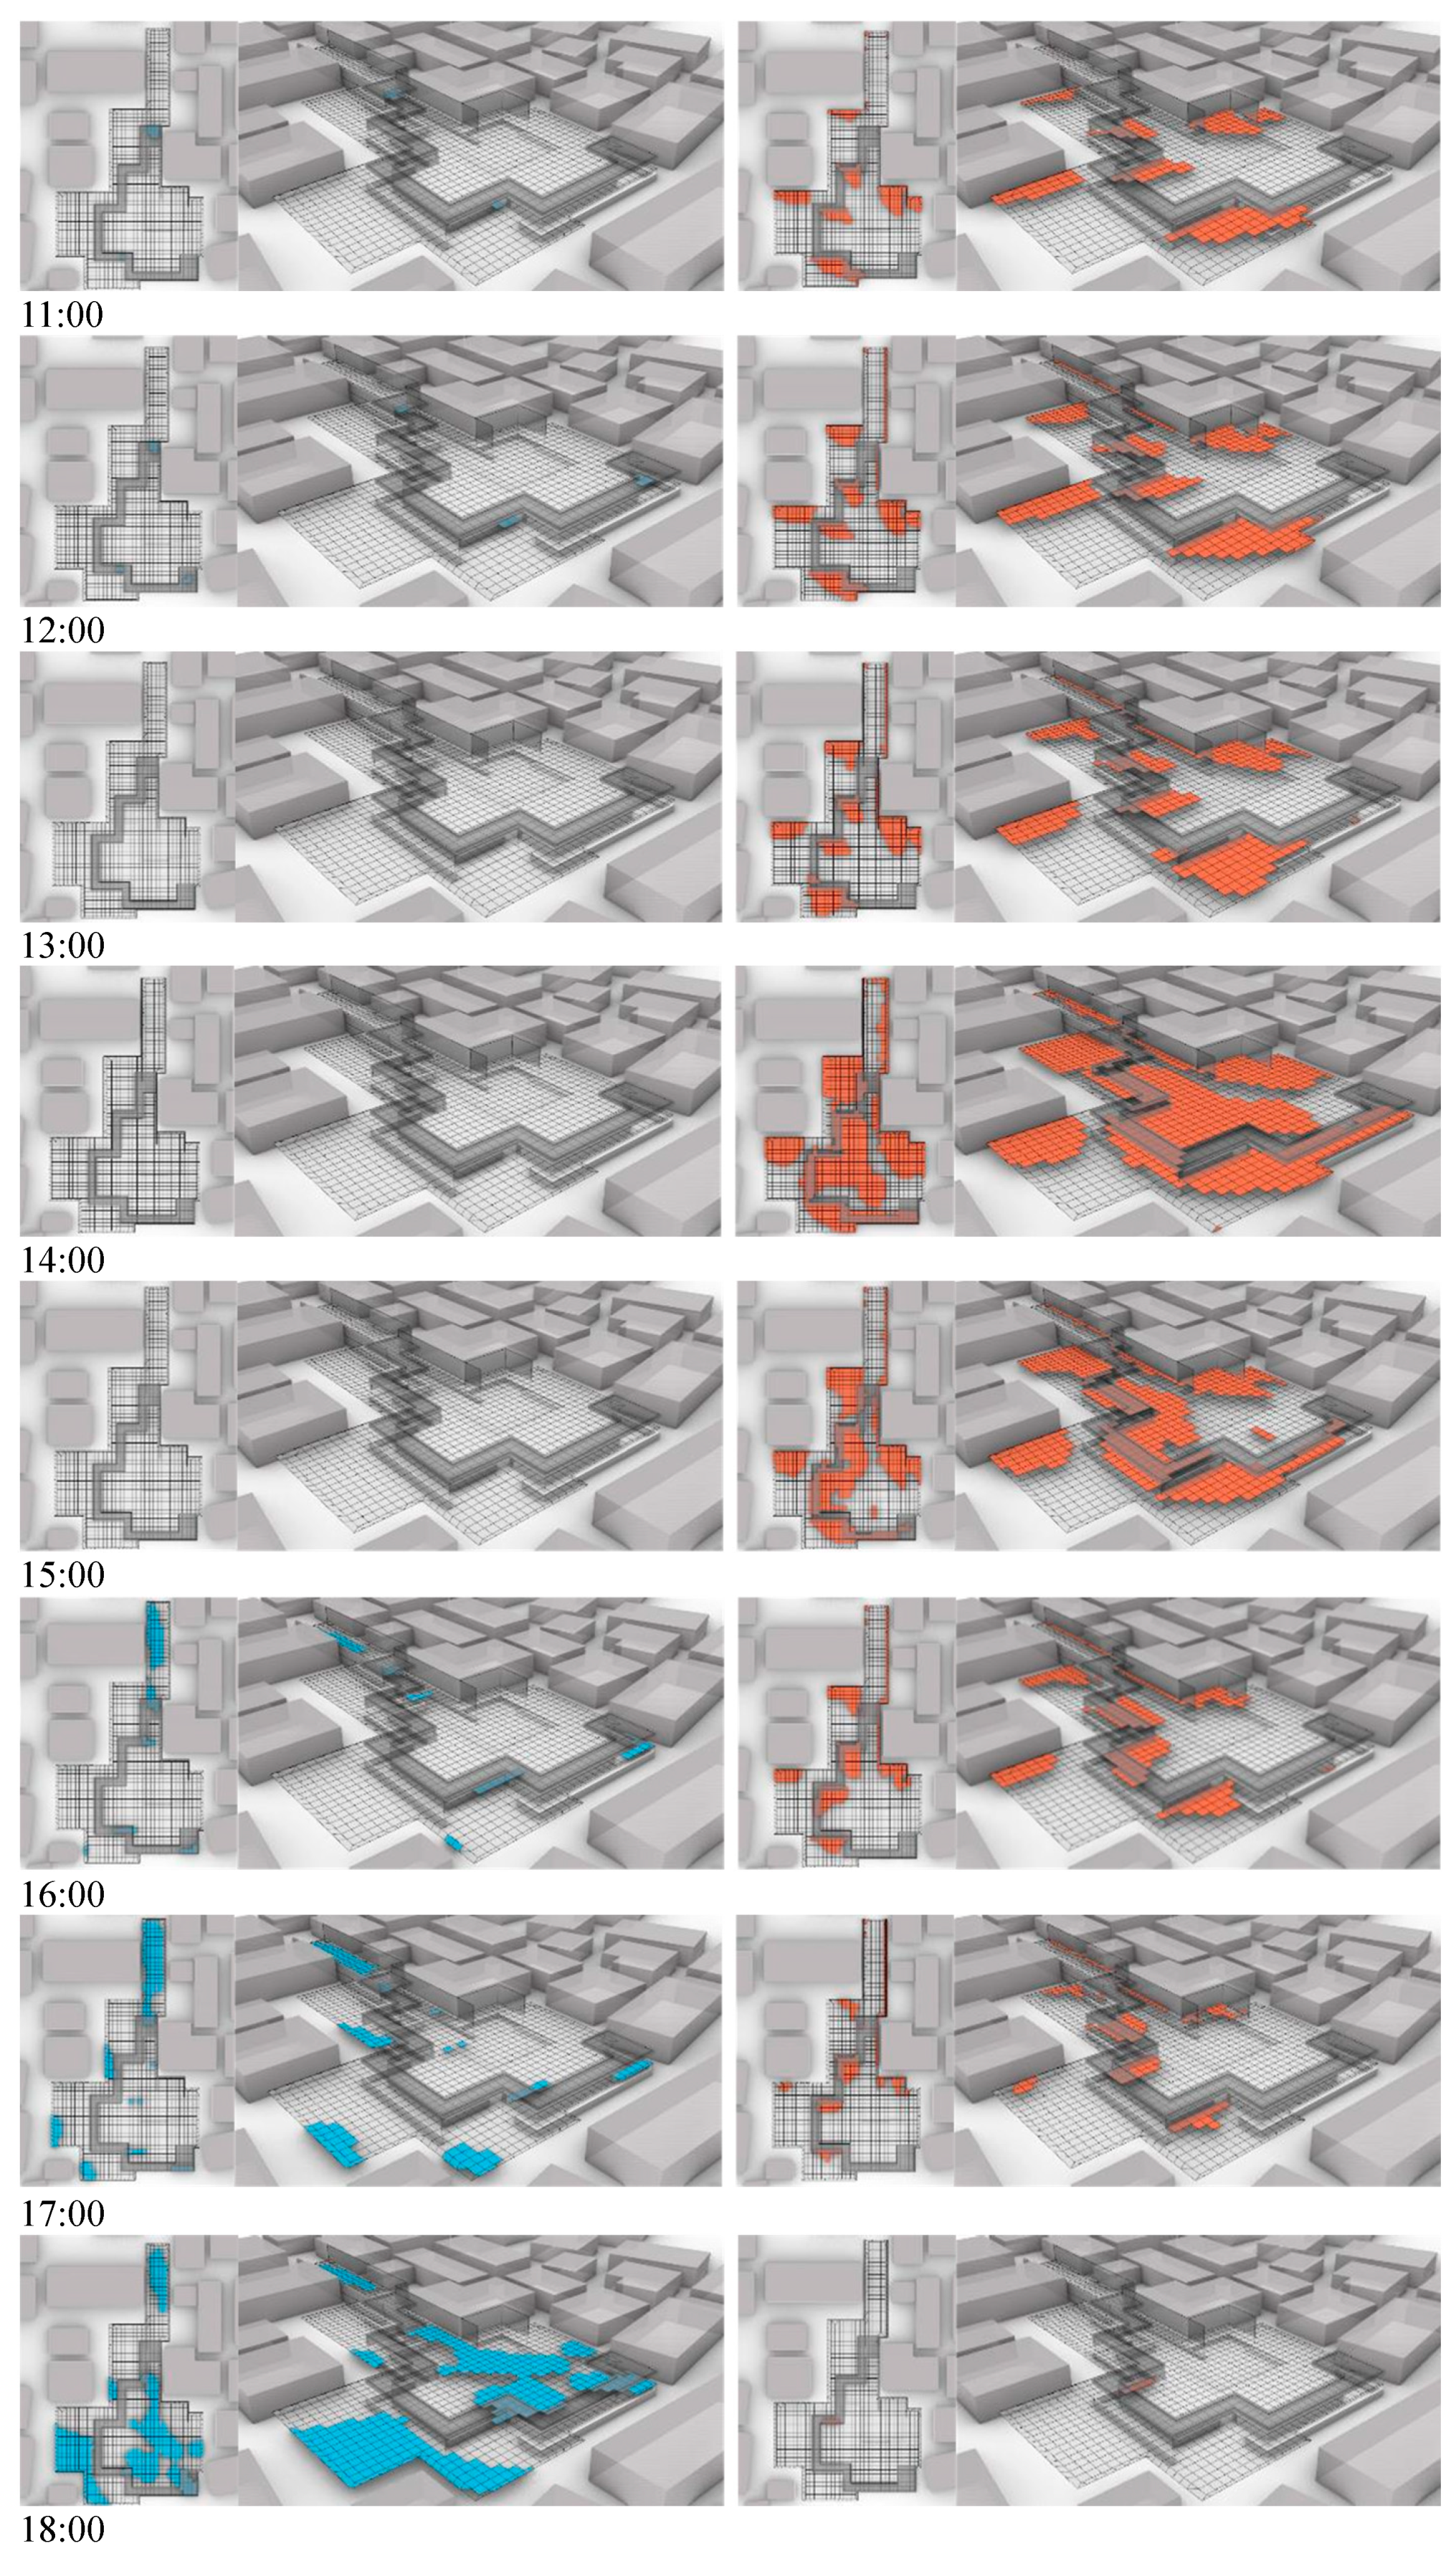
On-site observations in the Yangtze River Delta region revealed distinct seasonal shifts in resident preferences for outdoor activity spaces. In summer, with high temperatures and calm winds, residents preferred shaded areas to avoid direct sunlight, preferring outdoor spaces that are open, well ventilated, and offer substantial shade. In the transitional season (autumn), with its clear and mild weather, resident preferences for outdoor spaces exhibited greater diversity. Choices were largely influenced by individual preferences, resulting in a more dispersed selection of outdoor activity areas. In winter, characterized by cold and damp conditions, residents tended to gravitate toward areas with stronger solar radiation and lower wind speeds, such as the edges of walls or sunlit building corners. Overall, residents in the Yangtze River Delta region prioritized cool, well-ventilated environments in summer to mitigate the heat, while in winter, they favored sunlit spaces with lower wind speeds. As a transitional season, autumn demonstrated greater variability in space preferences, with individual differences playing a significant role, and preferences often fluctuating at the beginning and end of the season.
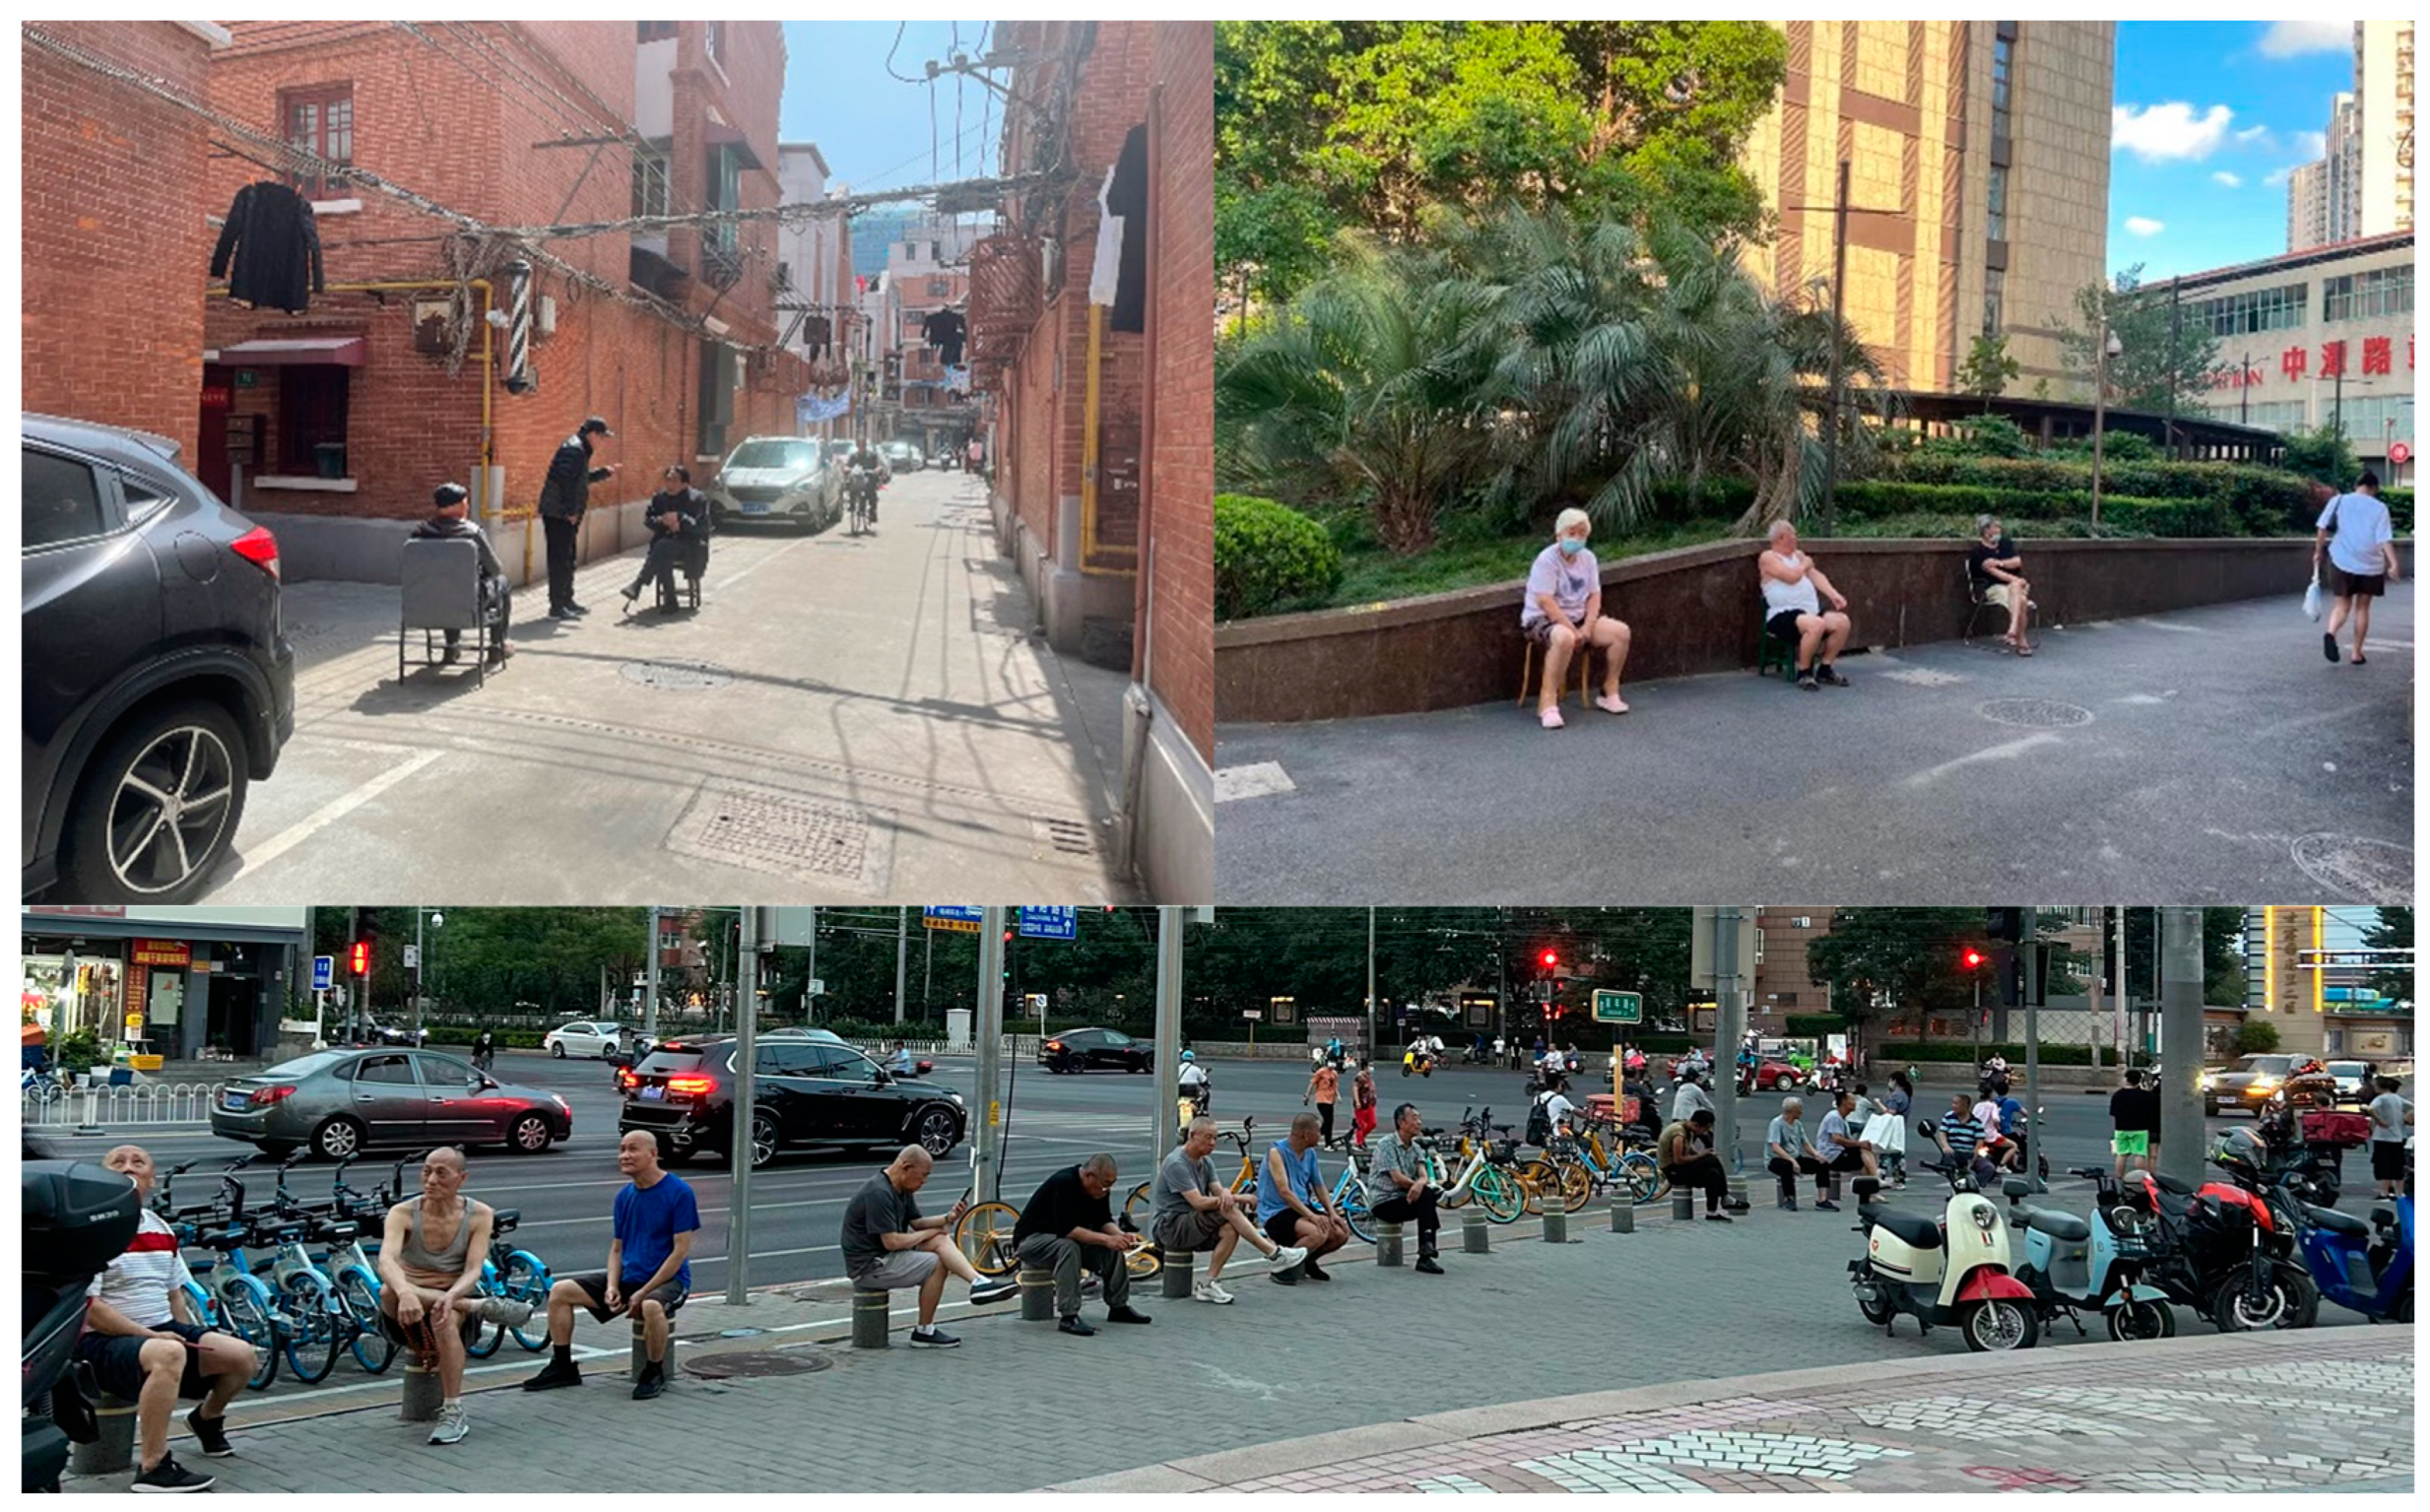
The study also found that many architect-designed “activity spaces” in residential areas were underused due to unfavorable thermal environments. In contrast, several unplanned “other spaces” that provide more comfortable thermal environments emerged as popular, spontaneous gathering spots for residents (Figure 5).

4. Discussion

4.1. UTCI and Thermal Perception

This study employed the UTCI as a quantitative assessment metric to assess thermal perception in outdoor public spaces [100,101,102,103] within the Yangtze River Delta region. By integrating field measurement data and subjective thermal perception from questionnaires, the study aimed to better understand residents’ thermal perception across different seasons and provide valuable insights for designing thermally comfortable outdoor public spaces in the region [64,104,105,106]. Linear regression analysis was performed to establish numerical relationships between the UTCI and the mean values of the TSV and TCV across different seasons. Figure 6 illustrates the scatterplots and regression lines indicating the relationship between the UTCI and TSV, while Figure 7 presents the relationship between the UTCI and TCV.
Using the derived regression model, this study calculated the neutral and comfort UTCI values for residents’ thermal perception of outdoor environments in the Yangtze River Delta region during the summer, winter, and transitional season (autumn) by setting the TSV and TCV to 0 in the respective formulas [107,108,109,110,111]. To enhance the applicability of the findings, this study further calculated the UTCI value ranges corresponding to intervals of negative TSV and TCV values, specifically for TSV∈[−0.5, 0.5] and TCV ≤ 1 [76,108,112,113,114]. The results are presented in Table 6.

4.2. TSV Model

This study systematically matched the questionnaire results with corresponding field-measured meteorological data seasonally and examined the factors influencing the TSV and their intrinsic correlations, which are presented in the product–moment correlation matrices in Table 7, Table 8 and Table 9 [115,116,117,118]. A strong negative correlation was observed between air temperature and relative humidity across all three seasons, indicating a collinearity relationship between these two variables [118,119,120]. Given the stronger correlation between air temperature and TSV compared to that between relative humidity and TSV, air temperature was selected as an independent variable for the multiple linear regression model, alongside wind speed and mean radiant temperature. These variables were then used to develop the TSV model for multivariate linear regression prediction.
To evaluate the relative influence of various thermal environmental factors on residents’ thermal perception in the Yangtze River Delta region, multiple linear regression analyses were performed using the least squares method. Separate models were developed for the three seasons, incorporating variables such as wind speed, air temperature, mean radiant temperature (MRT), and TSV. These models were used to rank the relative influence of these thermal factors on perceived thermal comfort, as summarized in Table 10, Table 11 and Table 12. Detailed model statistics are provided in Table 13.

4.3. Summary

4.3.1. Fundamental Impact of Seasonal Changes on Residents’ Outdoor Thermal Perception

The outdoor thermal perception among residents in the Yangtze River Delta region exhibited significant seasonal variation. The TCV results indicated that residents’ satisfaction with the summer outdoor thermal environment was markedly lower than in other seasons, with only 46.62% of residents reporting a sense of basic comfort. In winter, 67.57% of residents felt “generally satisfied”, while autumn was perceived as the most comfortable season, with 91.88% of residents finding the outdoor microclimate comfortable. This highlighted the significant impact of seasonal changes on perceptions of outdoor thermal environments, with autumn’s moderate temperatures and lower humidity contributing to higher comfort levels. Although most residents perceived the outdoor environment as neutral across all seasons, autumn exhibited the highest proportion of neutral perceptions (98.52%), suggesting a greater consistency in comfort levels during this season.
An analysis of TSV and TCV results revealed that residents exhibit higher sensitivity to outdoor thermal conditions in summer compared to winter. In summer, the proportion of residents reporting a neutral thermal sensation was 16.37% higher than those reporting basic thermal comfort, while this difference increased to 21.23% in winter. This suggested that a greater number of residents experienced discomfort due to heat in the summer, while outdoor thermal sensations in the winter, despite generally lower overall comfort, tended to remain more neutral. These findings provided valuable insights for the future design of outdoor public spaces in the Yangtze River Delta region. Urban planners should prioritize improving the regulation of outdoor thermal environments in both summer and winter to better accommodate residents’ needs for outdoor activities.

4.3.2. Influencing Factors and Seasonal Preferences in Residents’ Thermal Perception

The analysis of the multiple linear regression model (TSV model) revealed significant variations in how thermal environment factors influence residents’ outdoor thermal perception across different seasons. In the summer, air temperature was the most significant factor influencing residents’ outdoor thermal perception, followed by MRT and wind speed. By contrast, in autumn and winter, wind speed became the dominant factor influencing thermal sensation, with the impacts of air temperature and MRT being relatively less pronounced.
This research offered valuable insights for urban planners and designers, aiding in the creation of comfortable and engaging outdoor residential areas in the Yangtze River Delta region. Effective thermal environment regulation in summer and winter required strategies tailored to distinct environmental parameters, respectively. For summer-focused designs, emphasis should be placed on optimizing shading arrangements and minimizing reflective elements to reduce the impact of short-wave solar radiation and long-wave radiation from environmental reflections. In contrast, winter-focused designs should prioritize shielding against cold winds and enhancing thermal comfort through thoughtful spatial layout and design.

4.3.3. Seasonal Variations in Residents’ Outdoor Activity Times and Space Preferences

Residents’ outdoor activity patterns exhibited a bimodal distribution with notable seasonal variations. In summer, the majority of activities occurred in two distinct periods: from 8:00 to 11:00 and from 14:00 to 18:00, with the peak activity observed between 9:00 and 10:00. In winter, activities demonstrated a more limited timeframe, primarily occurring from 10:00 to 12:00 and from 14:00 to 17:00. Notably, afternoon participation significantly exceeded morning participation, with the period between 15:00 and 16:00 being especially prominent.
Seasonal differences were also evident in the selection of outdoor activity spaces. In summer, residents favor open, well-ventilated areas with ample shade to protect themselves from the sun. In the transitional season, with its clear and mild weather, outdoor space preferences exhibited greater diversity, reflecting individual tastes and resulting in a more dispersed selection of favored locations. In winter, due to damp and cold conditions, residents favored locations that receive direct sunlight and experience low wind speeds, such as the areas near walls and sunlit building corners.
The outdoor thermal environment determines residents’ choice of outdoor activity spaces. Residents pick spaces based on thermal comfort, yet current urban outdoor designs seldom consider this, leading to designs not meeting their needs. So, residents choose areas with better thermal conditions. This highlights the importance of aligning design with thermal characteristics and integrating behavior, conditions, and design. Residents’ seasonal activity time preferences help optimize thermal environment. Despite varying heat and cold prevention strategies, targeted designs can be made. In summer mornings, prioritize heat prevention like shading structures, proper materials, and vegetation placement. In winter afternoons, use windproof barriers and renewable energy or thermal storage. Adopting a time-adaptive design meets residents’ needs and enhances urban outdoor space quality.

4.4. Application of Data Conclusions and Design Strategies

Informed by the research findings on resident preferences for outdoor thermal perception and activity patterns in the Yangtze River Delta region, a new design was developed for the outdoor residential area, covering approximately 1176.2 square meters. The development of the design scheme involved multiple stages of generation and optimization. The design was guided by the key findings of the preceding text, specifically considering residents’ thermal environment perceptions and usage needs across different seasons. It incorporated various strategies such as shaded corridors and landscape walls, to optimize the outdoor microclimate, addressing key factors like summer shading and wind direction control (Figure 8).
Following the space optimization, during summer mornings, when outdoor activities were most common, the retaining walls and corridor roofs effectively provided shade to designated areas. Combined with the diversion of summer prevailing winds by the walls, a relatively comfortable outdoor space for summer activities was created. For the midday and afternoon periods suitable for outdoor activities in winter, walls were strategically placed to reflect solar radiation, increase long-wave radiation, and reduce energy loss, while effectively blocking cold winds. This design created a comfortable space for residents’ outdoor activities during the winter.
Thermal environment simulations were conducted at various stages during the design optimization process. The hourly UTCI distribution for both summer and winter was determined, taking into account the outdoor thermal perception characteristics and needs of residents in the Yangtze River Delta region. Based on the evaluation criteria of UTCI ≤ 31.11 °C in summer and UTCI ≥ 9.59 °C in winter, the hourly UTCI calculation results of each test point in summer and winter were categorized. Values were then assigned, and colors were applied to represent the comfortable areas, creating a distribution map of the UTCI comfort zone for both seasons, with blue indicating the comfortable areas in summer and red representing those in winter (Figure 9). By summing the color-marked areas, the total comfortable zone based on the UTCI index was calculated. Table 14 shows the statistical data for the overall comfortable area in the final design. It clearly indicates that during the morning period preferred by residents for summer activities, the comfortable area accounts for over 30% of the total space. In contrast, during the afternoon period favored by residents in winter, the comfortable area increased significantly, exceeding 50% of the total space.
This study explored seasonal variations in outdoor thermal perception, and proposed design strategies for optimizing residential areas in the Yangtze River Delta region, breaking away from traditional aesthetics-focused limitations. This multi-seasonal adaptive design approach seamlessly integrated microclimate regulation with residents’ seasonal activity needs through refined spatial layouts and advanced environmental control measures, resulting in more human-centered and sustainable outdoor space designs for residential areas.

5. Conclusions

This study highlights the critical role of outdoor thermal environments in shaping residents’ outdoor activities and offers novel insights into how climate-responsive design strategies can be optimized based on seasonal variations in thermal perception. Unlike conventional approaches that rely on generalized climate adaptation principles, our research integrates empirical data from on-site surveys to assess the impact of outdoor thermal conditions on residents’ behavior. This empirical approach allows us to refine outdoor design interventions that are directly aligned with the specific needs and preferences of residents across different seasons and activity periods.
The key innovation of this study lies in the targeted optimization of outdoor spaces, designed to maximize comfort during peak activity times in both summer and winter within the same space. By accounting for seasonal variations and residents’ thermal comfort preferences, we ensure that outdoor environments support residents’ activities in both hot and cold seasons, thus enhancing the usability and livability of urban spaces throughout the year. While our proposed interventions, such as dynamic shading and wind barriers, are grounded in widely recognized principles of climate-adaptive design, their application in this study is distinguished by the consideration of specific activity patterns and the temporal dynamics of thermal comfort. This novel integration of seasonal activity timing with thermal comfort optimization provides a framework for future research to explore more precise, innovative design solutions suited to diverse environmental contexts.
This study contributes to the growing field of climate-responsive urban design, providing practical, data-driven strategies to improve outdoor thermal comfort while addressing the behavioral and environmental needs of residents. However, it is important to acknowledge the limitations of using the thermal sensation vote (TSV) questionnaire, which relies on subjective assessments of thermal comfort. The inherent subjectivity of this tool introduces variability in responses, influenced by individual biases and external factors, which may not fully capture the complexities of thermal perception. Additionally, the reliance on self-reported data may introduce potential biases that affect the accuracy of the findings. Future research will build upon these insights, exploring more innovative and adaptive design strategies for outdoor thermal environments. Beyond integrating more objective measures of thermal comfort, such as physiological responses, future studies will focus on exploring new spatial design techniques for outdoor spaces. The current study primarily employs conventional design strategies, but future research will investigate more efficient and novel spatial configurations, incorporating cutting-edge materials and layouts that better optimize thermal comfort. This approach will help create more resilient and sustainable urban outdoor environments, capable of meeting the evolving needs of urban communities in the face of changing climates and diverse behavioral patterns.

Author Contributions

Conceptualization, Y.Y.; methodology, Y.Y. and Q.W.; software, Y.S.; validation, Y.Y.; formal analysis, Y.Y.; investigation, Y.Y. and Y.S.; resources, H.Z.; data curation, Y.Y.; writing—original draft preparation, Y.Y.; writing—review and editing, Y.S. and H.Z.; visualization, Y.S.; supervision, Q.W.; project administration, Q.W.; funding acquisition, H.Z. All authors have read and agreed to the published version of the manuscript..

Funding

This research was funded by [National Natural Science Foundation of China] grant number [No. 52078475] And The APC was funded by [China Academy of Building Research].

Data Availability Statement

The data presented in this study are available on request from the corresponding author.

Acknowledgments

Thanks to Dexuan Song for directional inspiration and technical support in this research.

Conflicts of Interest

Author Yikai Yan, Qingqin Wang and Haizhu Zhou were employed by the company China Academy of Building Research. The remaining authors declare that the research was conducted in the absence of any commercial or financial relationships that could be construed as a potential conflict of interest. The sponsors had no role in the design, execution, interpretation, or writing of the study.

References

  1. Carr, S.; Francis, M.; Rivlin, L.G.; Stone, A.M. Needs in Public Space. In Urban Design Reader; Routledge: Abingdon-on-Thames, UK, 2007; pp. 230–240. [Google Scholar]
  2. Gehl, J.; Gemzøe, L. Public Spaces—Public Life; Arkitektens Forlag: Oslo, Kongeriket Norge, 2004. [Google Scholar]
  3. Maruani, T.; Amit-Cohen, I. Open Space Planning Models: A Review of Approaches and Methods. Landsc. Urban Plan. 2007, 81, 1–13. [Google Scholar] [CrossRef]
  4. Coccolo, S.; Kämpf, J.; Scartezzini, J.-L.; Pearlmutter, D. Building Environment Control. Urban Clim. 2016, 18, 33–57. [Google Scholar] [CrossRef]
  5. Song, D. Building Environment Control; Southeast University Press: Nanjing, China, 2023; ISBN 978-7-5765-0503-0. [Google Scholar]
  6. Han, S.; Song, D.; Xu, L.; Ye, Y.; Yan, S.; Shi, F.; Zhang, Y.; Liu, X.; Du, H. Behaviour in Public Open Spaces: A Systematic Review of Studies with Quantitative Research Methods. Build. Environ. 2022, 223, 109444. [Google Scholar] [CrossRef]
  7. Lai, D.; Guo, D.; Hou, Y.; Lin, C.; Chen, Q. Studies of Outdoor Thermal Comfort in Northern China. Build. Environ. 2014, 77, 110–118. [Google Scholar] [CrossRef]
  8. Chen, L.; Ng, E. Outdoor Thermal Comfort and Outdoor Activities: A Review of Research in the Past Decade. Cities 2012, 29, 118–125. [Google Scholar] [CrossRef]
  9. Li, K.; Zhang, Y.; Zhao, L. Outdoor Thermal Comfort and Activities in the Urban Residential Community in a Humid Subtropical Area of China. Energy Build. 2016, 133, 498–511. [Google Scholar] [CrossRef]
  10. Huang, J.; Zhou, C.; Zhuo, Y.; Xu, L.; Jiang, Y. Outdoor Thermal Environments and Activities in Open Space: An Experiment Study in Humid Subtropical Climates. Build. Environ. 2016, 103, 238–249. [Google Scholar] [CrossRef]
  11. Lai, D.; Chen, B.; Liu, K. Quantification of the Influence of Thermal Comfort and Life Patterns on Outdoor Space Activities. In Proceedings of the Building Simulation; Springer: Berlin/Heidelberg, Germany, 2020; Volume 13, pp. 113–125. [Google Scholar]
  12. Deng, Y.; Gan, D.; Tang, N.; Cai, Z.; Li, X.; Chen, S.; Li, X. Research on Outdoor Thermal Comfort and Activities in Residential Areas in Subtropical China. Atmosphere 2022, 13, 1357. [Google Scholar] [CrossRef]
  13. Ahmed, K.S. Comfort in Urban Spaces: Defining the Boundaries of Outdoor Thermal Comfort for the Tropical Urban Environments. Energy Build. 2003, 35, 103–110. [Google Scholar] [CrossRef]
  14. Brager, G.S.; De Dear, R.J. Thermal Adaptation in the Built Environment: A Literature Review. Energy Build. 1998, 27, 83–96. [Google Scholar] [CrossRef]
  15. Nagara, K.; Shimoda, Y.; Mizuno, M. Evaluation of the Thermal Environment in an Outdoor Pedestrian Space. Atmos. Environ. 1996, 30, 497–505. [Google Scholar] [CrossRef]
  16. Fanger, P.O. Assessment of Man’s Thermal Comfort in Practice. Occup. Environ. Med. 1973, 30, 313–324. [Google Scholar] [CrossRef] [PubMed]
  17. Fanger, P.O. Fundamentals of Thermal Comfort. In Advances in Solar Energy Technology; Elsevier: Amsterdam, The Netherlands, 1988; pp. 3056–3061. [Google Scholar]
  18. Mayer, H.; Hoppe, P. Thermal Comfort of Man in Different Urban Environments. Theor. Appl. Climatol. 1987, 38, 43–49. [Google Scholar] [CrossRef]
  19. Kumar, P.; Sharma, A. Study on Importance, Procedure, and Scope of Outdoor Thermal Comfort—A Review. Sustain. Cities Soc. 2020, 61, 102297. [Google Scholar] [CrossRef]
  20. Lai, D.; Liu, W.; Gan, T.; Liu, K.; Chen, Q. A Review of Mitigating Strategies to Improve the Thermal Environment and Thermal Comfort in Urban Outdoor Spaces. Sci. Total Environ. 2019, 661, 337–353. [Google Scholar] [CrossRef]
  21. Potchter, O.; Cohen, P.; Lin, T.-P.; Matzarakis, A. Outdoor Human Thermal Perception in Various Climates: A Comprehensive Review of Approaches, Methods and Quantification. Sci. Total Environ. 2018, 631–632, 390–406. [Google Scholar] [CrossRef]
  22. Cohen, P.; Potchter, O.; Matzarakis, A. Human Thermal Perception of Coastal Mediterranean Outdoor Urban Environments. Appl. Geogr. 2013, 37, 1–10. [Google Scholar] [CrossRef]
  23. Höppe, P. Different Aspects of Assessing Indoor and Outdoor Thermal Comfort. Energy Build. 2002, 34, 661–665. [Google Scholar] [CrossRef]
  24. Gagge, A.P.; Fobelets, A.P.; Berglund, L. A Standard Predictive Index of Human Response to the Thermal Environment. Ashrae Trans. 1986, 92, 709–731. [Google Scholar]
  25. Gonzalez, R.R.; Nishi, Y.; Gagge, A.P. Experimental Evaluation of Standard Effective Temperature a New Biometeorological Index of Man’s Thermal Discomfort. Int. J. Biometeorol. 1974, 18, 1–15. [Google Scholar] [CrossRef]
  26. Pickup, J.; de Dear, R. An Outdoor Thermal Comfort Index (OUT_SET*)-Part I-the Model and Its Assumptions. In Proceedings of the Biometeorology and Urban Climatology at the Turn of the Millenium, Selected Papers from the Conference ICB-ICUC, Sydney, Australia, 8–12 November 1999; Volume 99, pp. 279–283. [Google Scholar]
  27. Matzarakis, A.; Mayer, H.; Iziomon, M.G. Applications of a Universal Thermal Index: Physiological Equivalent Temperature. Int. J. Biometeorol. 1999, 43, 76–84. [Google Scholar] [CrossRef] [PubMed]
  28. Höppe, P. The Physiological Equivalent Temperature–a Universal Index for the Biometeorological Assessment of the Thermal Environment. Int. J. Biometeorol. 1999, 43, 71–75. [Google Scholar] [CrossRef] [PubMed]
  29. Jendritzky, G.; de Dear, R.; Havenith, G. UTCI—Why Another Thermal Index? Int. J. Biometeorol. 2012, 56, 421–428. [Google Scholar] [CrossRef] [PubMed]
  30. Spagnolo, J.; Dear, R. de A Field Study of Thermal Comfort in Outdoor and Semi-Outdoor Environments in Subtropical Sydney Australia. Build. Environ. 2003, 38, 721–738. [Google Scholar] [CrossRef]
  31. Matzarakis, A.; Amelung, B. Physiological Equivalent Temperature as Indicator for Impacts of Climate Change on Thermal Comfort of Humans. In Seasonal Forecasts, Climatic Change and Human Health; Thomson, M.C., Garcia-Herrera, R., Beniston, M., Eds.; Springer: Dordrecht, The Netherlands, 2008; pp. 161–172. ISBN 978-1-4020-6876-8. [Google Scholar]
  32. Mishra, A.K.; Ramgopal, M. Field Studies on Human Thermal Comfort—an Overview. Build. Environ. 2013, 64, 94–106. [Google Scholar] [CrossRef]
  33. Nikolopoulou, M.; Baker, N.; Steemers, K. Thermal Comfort in Outdoor Urban Spaces: Understanding the Human Parameter. Sol. Energy 2001, 70, 227–235. [Google Scholar] [CrossRef]
  34. Elnabawi, M.H.; Hamza, N. Behavioural Perspectives of Outdoor Thermal Comfort in Urban Areas: A Critical Review. Atmosphere 2019, 11, 51. [Google Scholar] [CrossRef]
  35. Johansson, E.; Thorsson, S.; Emmanuel, R.; Krüger, E. Instruments and Methods in Outdoor Thermal Comfort Studies–The Need for Standardization. Urban Clim. 2014, 10, 346–366. [Google Scholar] [CrossRef]
  36. Aghamolaei, R.; Azizi, M.M.; Aminzadeh, B.; O’Donnell, J. A Comprehensive Review of Outdoor Thermal Comfort in Urban Areas: Effective Parameters and Approaches. Energy Environ. 2023, 34, 2204–2227. [Google Scholar] [CrossRef]
  37. de Freitas, C.R.; Grigorieva, E.A. A Comprehensive Catalogue and Classification of Human Thermal Climate Indices. Int. J. Biometeorol. 2015, 59, 109–120. [Google Scholar] [CrossRef]
  38. Epstein, Y.; Moran, D.S. Thermal Comfort and the Heat Stress Indices. Ind. Health 2006, 44, 388–398. [Google Scholar] [CrossRef] [PubMed]
  39. Dorahaki, S.; Muyeen, S.M.; Amjady, N. A Stackelberg Game Theory Model for Integrated Community Energy Storage Systems. IEEE Access 2024, 12, 152908–152920. [Google Scholar] [CrossRef]
  40. Dorahaki, S.; Rashidinejad, M.; Ardestani, S.F.F.; Abdollahi, A.; Salehizadeh, M.R. Probabilistic/Information Gap Decision Theory-based Bilevel Optimal Management for Multi-carrier Network by Aggregating Energy Communities. IET Renew. Power Gen. 2023, 17, 1436–1465. [Google Scholar] [CrossRef]
  41. Dorahaki, S.; MollahassaniPour, M.; Rashidinejad, M.; Siano, P.; Shafie-khah, M. A Flexibility-Oriented Model for a Sustainable Local Multi-Carrier Energy Community: A Hybrid Multi-Objective Probabilistic-IGDT Optimization Approach. Appl. Energy 2025, 377, 124678. [Google Scholar] [CrossRef]
  42. Dorahaki, S.; MollahassaniPour, M.; Rashidinejad, M. Optimizing Energy Payment, User Satisfaction, and Self-Sufficiency in Flexibility-Constrained Smart Home Energy Management: A Multi-Objective Optimization Approach. e-Prime-Adv. Electr. Eng. Electron. Energy 2023, 6, 100385. [Google Scholar] [CrossRef]
  43. Hwang, R.-L.; Lin, T.-P. Thermal Comfort Requirements for Occupants of Semi-Outdoor and Outdoor Environments in Hot-Humid Regions. Archit. Sci. Rev. 2007, 50, 357–364. [Google Scholar] [CrossRef]
  44. Nikolopoulou, M.; Steemers, K. Thermal Comfort and Psychological Adaptation as a Guide for Designing Urban Spaces. Energy Build. 2003, 35, 95–101. [Google Scholar] [CrossRef]
  45. Knez, I.; Thorsson, S.; Eliasson, I.; Lindberg, F. Psychological Mechanisms in Outdoor Place and Weather Assessment: Towards a Conceptual Model. Int. J. Biometeorol. 2009, 53, 101–111. [Google Scholar] [CrossRef]
  46. Lin, T.-P. Thermal Perception, Adaptation and Attendance in a Public Square in Hot and Humid Regions. Build. Environ. 2009, 44, 2017–2026. [Google Scholar] [CrossRef]
  47. Nakano, J.; Tanabe, S.-I. Thermal Comfort and Adaptation in Semi-Outdoor Environments. Ashrae Trans. 2004, 110, 543. [Google Scholar]
  48. Thorsson, S.; Lindqvist, M.; Lindqvist, S. Thermal Bioclimatic Conditions and Patterns of Behaviour in an Urban Park in Göteborg, Sweden. Int. J. Biometeorol. 2004, 48, 149–156. [Google Scholar] [CrossRef] [PubMed]
  49. Zacharias, J.; Stathopoulos, T.; Wu, H. Microclimate and Downtown Open Space Activity. Environ. Behav. 2001, 33, 296–315. [Google Scholar] [CrossRef]
  50. Thorsson, S.; Honjo, T.; Lindberg, F.; Eliasson, I.; Lim, E.-M. Thermal Comfort and Outdoor Activity in Japanese Urban Public Places. Environ. Behav. 2007, 39, 660–684. [Google Scholar] [CrossRef]
  51. Lin, T.-P.; Tsai, K.-T.; Hwang, R.-L.; Matzarakis, A. Quantification of the Effect of Thermal Indices and Sky View Factor on Park Attendance. Landsc. Urban Plan. 2012, 107, 137–146. [Google Scholar] [CrossRef]
  52. Cheng, V.; Ng, E.; Chan, C.; Givoni, B. Outdoor Thermal Comfort Study in a Sub-Tropical Climate: A Longitudinal Study Based in Hong Kong. Int. J. Biometeorol. 2012, 56, 43–56. [Google Scholar] [CrossRef]
  53. Niu, J.; Liu, J.; Lee, T.; Lin, Z.J.; Mak, C.; Tse, K.-T.; Tang, B.; Kwok, K.C. A New Method to Assess Spatial Variations of Outdoor Thermal Comfort: Onsite Monitoring Results and Implications for Precinct Planning. Build. Environ. 2015, 91, 263–270. [Google Scholar] [CrossRef]
  54. Ma, H.; Zhang, M.; Chen, H.; Wang, Y. Impacts of Roof/Ground Mitigation Strategies on Improving the Urban Thermal Environment and Human Comfort over the Yangtze River Delta, China. J. Meteorol. Res. 2024, 38, 108–125. [Google Scholar] [CrossRef]
  55. Cortesão, J.; Alves, F.B.; Corvacho, H.; Rocha, C. Retrofitting Public Spaces for Thermal Comfort and Sustainability. Indoor Built Environ. 2016, 25, 1085–1095. [Google Scholar] [CrossRef]
  56. Golany, G.S. Urban Design Morphology and Thermal Performance. Atmos. Environ. 1996, 30, 455–465. [Google Scholar] [CrossRef]
  57. Huang, K.-T.; Lin, T.-P.; Lien, H.-C. Investigating Thermal Comfort and User Behaviors in Outdoor Spaces: A Seasonal and Spatial Perspective. Adv. Meteorol. 2015, 2015, 423508. [Google Scholar] [CrossRef]
  58. Xi, T.; Li, Q.; Mochida, A.; Meng, Q. Study on the Outdoor Thermal Environment and Thermal Comfort around Campus Clusters in Subtropical Urban Areas. Build. Environ. 2012, 52, 162–170. [Google Scholar] [CrossRef]
  59. Yin, J.; Zheng, Y.; Wu, R.; Tan, J.; Ye, D.; Wang, W. An Analysis of Influential Factors on Outdoor Thermal Comfort in Summer. Int. J. Biometeorol. 2012, 56, 941–948. [Google Scholar] [CrossRef] [PubMed]
  60. Zhao, L.; Zhou, X.; Li, L.; He, S.; Chen, R. Study on Outdoor Thermal Comfort on a Campus in a Subtropical Urban Area in Summer. Sustain. Cities Soc. 2016, 22, 164–170. [Google Scholar] [CrossRef]
  61. Guo, F.; Wang, Z.; Dong, J.; Zhang, H.; Lu, X.; Lau, S.S.Y.; Miao, Y. Spatial Differences in Outdoor Thermal Comfort during the Transition Season in Cold Regions of China. Buildings 2022, 12, 720. [Google Scholar] [CrossRef]
  62. Liu, S.; Xie, Y.; Zhu, Y.; Lin, B.; Cao, B.; Wong, N.H.; Niu, J.; Fang, Z.; Lai, D.; Liu, W. Comparative Analysis on Indoor and Outdoor Thermal Comfort in Transitional Seasons and Summer Based on Multiple Databases: Lessons Learnt from the Outdoors. Sci. Total Environ. 2022, 848, 157694. [Google Scholar] [CrossRef]
  63. An, L.; Hong, B.; Cui, X.; Geng, Y.; Ma, X. Outdoor Thermal Comfort during Winter in China’s Cold Regions: A Comparative Study. Sci. Total Environ. 2021, 768, 144464. [Google Scholar] [CrossRef]
  64. Cao, B.; Zhu, Y.; Ouyang, Q.; Zhou, X.; Huang, L. Field Study of Human Thermal Comfort and Thermal Adaptability during the Summer and Winter in Beijing. Energy Build. 2011, 43, 1051–1056. [Google Scholar] [CrossRef]
  65. Xu, M.; Hong, B.; Mi, J.; Yan, S. Outdoor Thermal Comfort in an Urban Park during Winter in Cold Regions of China. Sustain. Cities Soc. 2018, 43, 208–220. [Google Scholar] [CrossRef]
  66. Asghari, M.; Teimori, G.; Abbasinia, M.; Shakeri, F.; Tajik, R.; Ghannadzadeh, M.J.; Ghalhari, G.F. Thermal Discomfort Analysis Using UTCI and MEMI (PET and PMV) in Outdoor Environments: Case Study of Two Climates in Iran (Arak & Bandar Abbas). Weather 2019, 74, S57–S64. [Google Scholar] [CrossRef]
  67. Wu, J.; Li, X.; Li, S.; Liu, C.; Yi, T.; Zhao, Y. Spatial Heterogeneity and Attribution Analysis of Urban Thermal Comfort in China from 2000 to 2020. Int. J. Environ. Res. Public Health 2022, 19, 5683. [Google Scholar] [CrossRef]
  68. Xie, Z.; Du, Y.; Zeng, Y. Impact of Urbanization on Regional Temperature Change in the Yangtze River Delta. Acta Geogr. Sin.-Chin. Ed. 2007, 62, 717. [Google Scholar]
  69. Du, Y.; Xie, Z.; Zeng, Y.; Shi, Y.; Wu, J. Impact of Urban Expansion on Regional Temperature Change in the Yangtze River Delta. J. Geogr. Sci. 2007, 17, 387–398. [Google Scholar] [CrossRef]
  70. Liu, J.; Niu, J. Assessment on Seasonal Variations of Outdoor Thermal Comfort with On-Site Monitoring in a Precinct. Procedia Eng. 2017, 198, 321–331. [Google Scholar] [CrossRef]
  71. Xu, C.; Li, S. Influence of Perceived Control on Thermal Comfort in Winter, A Case Study in Hot Summer and Cold Winter Zone in China. J. Build. Eng. 2021, 40, 102389. [Google Scholar] [CrossRef]
  72. Johansson, E.; Emmanuel, R. The Influence of Urban Design on Outdoor Thermal Comfort in the Hot, Humid City of Colombo, Sri Lanka. Int. J. Biometeorol. 2006, 51, 119–133. [Google Scholar] [CrossRef]
  73. Lala, B.; Biju, A.; Rastogi, A.; Dahiya, K.; Kala, S.M.; Hagishima, A. The Challenge of Multiple Thermal Comfort Prediction Models: Is TSV Enough? Buildings 2023, 13, 890. [Google Scholar] [CrossRef]
  74. Wu, Y.-C.; Mahdavi, A. Assessment of Thermal Comfort under Transitional Conditions. Build. Environ. 2014, 76, 30–36. [Google Scholar] [CrossRef]
  75. Zhou, X.; Ouyang, Q.; Zhu, Y.; Feng, C.; Zhang, X. Experimental Study of the Influence of Anticipated Control on Human Thermal Sensation and Thermal Comfort. Indoor Air 2014, 24, 171–177. [Google Scholar] [CrossRef]
  76. Jing, W.; Qin, Z.; Mu, T.; Ge, Z.; Dong, Y. Evaluating Thermal Comfort Indices for Outdoor Spaces on a University Campus. Sci. Rep. 2024, 14, 21253. [Google Scholar] [CrossRef]
  77. Liu, J. Design for Outdoor Thermal Comfort: On-Site Monitoring and Modeling of Airflow in Building Surroundings. Ph.D. Thesis, The Hong Kong Polytechnic University, Hong Kong, China, 2017. [Google Scholar]
  78. Xu, M.; Hong, B.; Jiang, R.; An, L.; Zhang, T. Outdoor Thermal Comfort of Shaded Spaces in an Urban Park in the Cold Region of China. Build. Environ. 2019, 155, 408–420. [Google Scholar] [CrossRef]
  79. Thorsson, S.; Lindberg, F.; Eliasson, I.; Holmer, B. Different Methods for Estimating the Mean Radiant Temperature in an Outdoor Urban Setting. Int. J. Climatol. 2007, 27, 1983–1994. [Google Scholar] [CrossRef]
  80. Kralikova, R.; Sokolova, H.; Wessely, E.; Polak, J. Approaches to Assessment of Hot Environment. In DAAAM International Scientific Book; DAAAM International Vienna: Vienna, Austria, 2013; pp. 317–328. [Google Scholar]
  81. Fanger, P.O. Thermal Comfort: Analysis and Applications in Environmental Engineering; Danish Technical Press: Copenhagen, Denmark, 1970; ISBN 978-87-571-0341-0. [Google Scholar]
  82. Walikewitz, N.; Jänicke, B.; Langner, M.; Meier, F.; Endlicher, W. The Difference between the Mean Radiant Temperature and the Air Temperature within Indoor Environments: A Case Study during Summer Conditions. Build. Environ. 2015, 84, 151–161. [Google Scholar] [CrossRef]
  83. ISO 7726:1998—Ergonomics of the Thermal Environment—Instruments for Measuring Physical Quantities. Available online: https://www.iso.org/standard/14562.html (accessed on 27 February 2025).
  84. Simmonds, P. Using ASHRAE Standard 55 Adaptive Comfort Method for Practical Applications. In Proceedings of the CLIMA 2022 Conference, Rotterdam, The Netherlands, 22–25 May 2022. [Google Scholar]
  85. Lai, D.; Zhou, C.; Huang, J.; Jiang, Y.; Long, Z.; Chen, Q. Outdoor Space Quality: A Field Study in an Urban Residential Community in Central China. Energy Build. 2014, 68, 713–720. [Google Scholar] [CrossRef]
  86. Blazejczyk, K.; Epstein, Y.; Jendritzky, G.; Staiger, H.; Tinz, B. Comparison of UTCI to Selected Thermal Indices. Int. J. Biometeorol. 2012, 56, 515–535. [Google Scholar] [CrossRef]
  87. Błażejczyk, K.; Jendritzky, G.; Bröde, P.; Fiala, D.; Havenith, G.; Epstein, Y.; Psikuta, A.; Kampmann, B. An Introduction to the Universal Thermal Climate Index (UTCI). Geogr. Pol. 2013, 86, 5–10. [Google Scholar] [CrossRef]
  88. Bröde, P.; Fiala, D.; Błażejczyk, K.; Holmér, I.; Jendritzky, G.; Kampmann, B.; Tinz, B.; Havenith, G. Deriving the Operational Procedure for the Universal Thermal Climate Index (UTCI). Int. J. Biometeorol. 2012, 56, 481–494. [Google Scholar] [CrossRef]
  89. Krüger, E.L. Literature Review on UTCI Applications. In Applications of the Universal Thermal Climate Index UTCI in Biometeorology; Krüger, E.L., Ed.; Springer International Publishing: Cham, Switzerland, 2021; pp. 23–65. ISBN 978-3-030-76715-0. [Google Scholar]
  90. Park, S.; Tuller, S.E.; Jo, M. Application of Universal Thermal Climate Index (UTCI) for Microclimatic Analysis in Urban Thermal Environments. Landsc. Urban Plan. 2014, 125, 146–155. [Google Scholar] [CrossRef]
  91. Zare, S.; Hasheminejad, N.; Shirvan, H.E.; Hemmatjo, R.; Sarebanzadeh, K.; Ahmadi, S. Comparing Universal Thermal Climate Index (UTCI) with Selected Thermal Indices/Environmental Parameters during 12 Months of the Year. Weather. Clim. Extrem. 2018, 19, 49–57. [Google Scholar] [CrossRef]
  92. Ahmed, M.; Seraj, R.; Islam, S.M.S. The K-Means Algorithm: A Comprehensive Survey and Performance Evaluation. Electronics 2020, 9, 1295. [Google Scholar] [CrossRef]
  93. Hamerly, G.; Elkan, C. Learning the k in K-Means. In Proceedings of the Advances in Neural Information Processing Systems; Thrun, S., Saul, L., Schölkopf, B., Eds.; MIT Press: Cambridge, MA, USA, 2003; Volume 16. [Google Scholar]
  94. Hartigan, J.A.; Wong, M.A. A K-Means Clustering Algorithm. Appl. Stat. 1979, 28, 100–108. [Google Scholar] [CrossRef]
  95. Krishna, K.; Murty, M.N. Genetic K-Means Algorithm. IEEE Trans. Syst. Man Cybern. Part B (Cybernetics) 1999, 29, 433–439. [Google Scholar] [CrossRef] [PubMed]
  96. Likas, A.; Vlassis, N.; Verbeek, J.J. The Global K-Means Clustering Algorithm. Pattern Recognit. 2003, 36, 451–461. [Google Scholar] [CrossRef]
  97. Bröde, P.; Fiala, D.; Kampmann, B. Application of Statistical Learning Algorithms in Thermal Stress Assessment in Comparison with the Expert Judgment Inherent to the Universal Thermal Climate Index (UTCI). Atmosphere 2024, 15, 703. [Google Scholar] [CrossRef]
  98. Wu, F.; Yang, X.; Shen, Z. Regional and Seasonal Variations of Outdoor Thermal Comfort in China from 1966 to 2016. Sci. Total Environ. 2019, 665, 1003–1016. [Google Scholar] [CrossRef] [PubMed]
  99. Zhao, Q.; Lian, Z.; Lai, D. Thermal Comfort Models and Their Developments: A Review. Energy Built Environ. 2021, 2, 21–33. [Google Scholar] [CrossRef]
  100. Talhi, A.; Barlet, A.; Bruneau, D.; Aichour, B. Towards a Prediction of Outdoor Human Thermal Comfort Adapted for Designers of Urban Spaces: Examining UTCI and APCI in the Context of Algiers (Algeria). Int. J. Biometeorol. 2020, 64, 651–662. [Google Scholar] [CrossRef]
  101. Silva, T.J.V.; Hirashima, S.Q.S. Predicting Urban Thermal Comfort from Calibrated UTCI Assessment Scale-A Case Study in Belo Horizonte City, Southeastern Brazil. Urban Clim. 2021, 36, 100652. [Google Scholar] [CrossRef]
  102. Lucchese, J.R.; Mikuri, L.P.; de Freitas, N.V.; Andreasi, W.A. Application of Selected Indices on Outdoor Thermal Comfort Assessment in Midwest Brazil. Int. J. Energy Environ. 2016, 7, 291. [Google Scholar]
  103. Bröde, P.; Krüger, E.L.; Fiala, D. UTCI: Validation and Practical Application to the Assessment of Urban Outdoor Thermal Comfort. Geogr. Pol. 2013, 86, 11–20. [Google Scholar] [CrossRef]
  104. Wei, D.; Lian, Z.; Liu, B. A Field Study of Outdoor Human Thermal Perception in Three Seasons in Shanghai, China. Buildings 2022, 12, 1453. [Google Scholar] [CrossRef]
  105. Shooshtarian, S.; Ridley, I. Determination of Acceptable Thermal Range in Outdoor Built Environments by Various Methods. Smart Sustain. Built Environ. 2016, 5, 352–371. [Google Scholar] [CrossRef]
  106. Huang, H.; Peng, M. The Outdoor Thermal Comfort of Urban Square: A Field Study in a Cold Season in Chongqing. In Proceedings of the IOP Conference Series: Earth and Environmental Science; IOP Publishing: Bristol, UK, 2020; Volume 467, p. 012215. [Google Scholar]
  107. Bian, G.; Gao, X.; Zou, Q.; Cheng, Q.; Sun, T.; Sha, S.; Zhen, M. Effects of Thermal Environment and Air Quality on Outdoor Thermal Comfort in Urban Parks of Tianjin, China. Environ. Sci. Pollut. Res. 2023, 30, 97363–97376. [Google Scholar] [CrossRef] [PubMed]
  108. He, Y.; Zhong, H.; Fan, Y.; Lau, S.S.Y.; Cui, G. A Calibration Framework for Outdoor Thermal Comfort Index and Neutral Range: Application in Subtropical Hot-Humid Campus. Indoor Built Environ. 2024, 1420326X241303732. [Google Scholar] [CrossRef]
  109. Li, S.; Zhang, Y.; Zhang, Q.; Xue, P.; Wu, H.; Xu, W.; Ye, J.; Chen, L.; He, T.; Zheng, Y. Exploring the Multi-Sensory Coupling Relationship of Open Space on a Winter Campus. Forests 2024, 15, 876. [Google Scholar] [CrossRef]
  110. Li, Z.; Zhou, L.; Hong, X.; Qiu, S. Outdoor Thermal Comfort and Activities in Urban Parks: An Experiment Study in Humid Subtropical Climates. Build. Environ. 2024, 253, 111361. [Google Scholar] [CrossRef]
  111. Xing, Y.; Wang, Y. Research on the Comfort of Outdoor Thermal Environment in Old Communities in Mild Climate Areas. In Proceedings of the 2023 International Conference on Green Building, Civil Engineering and Smart City; Guo, W., Qian, K., Tang, H., Gong, L., Eds.; Lecture Notes in Civil Engineering; Springer Nature: Singapore, 2024; Volume 328, pp. 652–664. [Google Scholar]
  112. Jin, Y.; Jin, H.; Kang, J. Combined Effects of the Thermal-Acoustic Environment on Subjective Evaluations in Urban Squares. Build. Environ. 2020, 168, 106517. [Google Scholar] [CrossRef]
  113. Li, J.; Niu, J.; Mak, C.M.; Huang, T.; Xie, Y. Exploration of Applicability of UTCI and Thermally Comfortable Sun and Wind Conditions Outdoors in a Subtropical City of Hong Kong. Sustain. Cities Soc. 2020, 52, 101793. [Google Scholar] [CrossRef]
  114. Li, K.; Liu, X.; Bao, Y. Evaluating the Performance of Different Thermal Indices on Quantifying Outdoor Thermal Sensation in Humid Subtropical Residential Areas of China. Front. Environ. Sci. 2022, 10, 1071668. [Google Scholar] [CrossRef]
  115. Abdulgader, M.; Lashhab, F. Energy-Efficient Thermal Comfort Control in Smart Buildings. In Proceedings of the 2021 IEEE 11th Annual Computing and Communication Workshop and Conference (CCWC), Virtual, 27–30 January 2021; IEEE: Piscataway, NJ, USA, 2021; pp. 0022–0026. [Google Scholar]
  116. Peng, Z.; Bardhan, R.; Ellard, C.; Steemers, K. Urban Climate Walk: A Stop-and-Go Assessment of the Dynamic Thermal Sensation and Perception in Two Waterfront Districts in Rome, Italy. Build. Environ. 2022, 221, 109267. [Google Scholar] [CrossRef]
  117. Xiao, A.; Cheng, B.; Zhang, J.; Peng, H.; Lai, Y.; Zeng, F.; Liu, T.; Zhu, F. A Study of Acoustic-Light-Thermal Effects on Pedestrians’ Overall Comfort in a Cfa-Climate Campus during the Summer. J. Therm. Biol. 2024, 121, 103839. [Google Scholar] [CrossRef]
  118. Zhao, S.; He, L.; Wu, X.; Xu, G.; Xie, J.; Cai, S. Evaluation of Thermal Comfort in Air-Conditioned Rooms Based on Structure/Control-Related Parameters and Data-Mining Method. Int. J. Air-Cond. Ref. 2023, 31, 4. [Google Scholar] [CrossRef]
  119. Liu, T.; Wang, S.; Zhang, J.; He, L.; Cheng, B.; Peng, H.; Liu, F.; Tan, B.; Shang, X.; Liu, F. Investigating the Impact of a Large River and Its Surrounding Contextual Conditions on Pedestrians’ Summer Thermal Perceptions in a Cfa-Climate City. Sci. Rep. 2024, 14, 13833. [Google Scholar] [CrossRef] [PubMed]
  120. Miao, S.; Gangolells, M.; Tejedor, B. Improving the Thermal Comfort Model for Students in Naturally Ventilated Schools: Insights from a Holistic Study in the Mediterranean Climate. Build. Environ. 2024, 258, 111622. [Google Scholar] [CrossRef]
Figure 2. Proportional distribution of residents’ TSV responses.
Buildings 15 00876 g002
Figure 3. Proportional distribution of residents’ TCV responses.
Buildings 15 00876 g003
Figure 4. Proportional distribution of residents’ seasonal preferences for outdoor activity time.
Buildings 15 00876 g004
Figure 5. Several unplanned “other spaces” providing comfortable thermal environments.
Buildings 15 00876 g005
Figure 6. Scatterplots and regression lines showing the relationship between the UTCI and TSV.
Buildings 15 00876 g006
Figure 7. Scatterplots and regression lines showing the relationship between the UTCI and TCV.
Buildings 15 00876 g007
Figure 8. Generation of outdoor residential area.
Buildings 15 00876 g008
Figure 9. Distribution of the UTCI comfort zone for summer (left) and winter (right).
Buildings 15 00876 g009aBuildings 15 00876 g009b
Table 1. Detailed information of survey questionnaires.
GenderAgeResidence Year
MaleFemaleMinMaxAverageMinMaxAverage
Summer33829768946.3808936.53
Transitional season (autumn)10416788946.5108618.92
Winter11214778851.2108323.65
Table 2. Outdoor thermal sensation vote (TSV) results.
SummerTransitional Season
(Autumn)
Winter
Cold (−3)count005
percentage0.00%0.00%1.93%
Cool (−2)count0324
percentage0.00%1.11%9.27%
Slightly Cool (−1)count12059
percentage0.16%7.38%22.78%
Neutral (0)count182216146
percentage28.66%79.70%56.37%
Slightly Warm (+1)count2173125
percentage34.17%11.44%9.65%
Warm (+2)count18410
percentage28.98%0.37%0.00%
Hot (+3)count5100
percentage8.03%0.00%0.00%
Total Participants/635271259
Table 3. Outdoor thermal comfort vote (TCV) results.
SummerTransitional Season (Autumn)Winter
Comfortable (0)count338535
percentage5.20%31.37%13.51%
Slightly Comfortable (+1)count263164140
percentage41.42%60.52%54.05%
Uncomfortable (+2)count2242076
percentage35.28%7.38%29.34%
Very Uncomfortable (+3)count11528
percentage18.11%0.74%3.09%
Total Participants/635271259
Table 4. Outdoor thermal environment.
Microclimate ParametersMinimumMaximumAverage
SummerAir Temperature (°C)26.2935.9830.58
Relative Humidity (%)59.6384.6774.53
Wind Speed (m/s)02.470.48
MRT (°C)27.3659.7336.26
Transitional season (autumn)Air Temperature (°C)15.222.520.41
Relative Humidity (%)43.182.160.13
Wind Speed (m/s)03.020.33
MRT (°C)15.2341.2323.44
WinterAir Temperature (°C)4.7512.638.83
Relative Humidity (%)50.8276.8361.49
Wind Speed (m/s)02.520.33
MRT (°C)7.2527.3612.68
Table 5. Residents’ seasonal preferences for outdoor activity time.
Activity PeriodSummerTransitional Season (Autumn)Winter
CountPercentageCountPercentageCountPercentage
08:00–09:006710.55228.1283.09
09:00–10:0010416.383613.28145.41
10:00–11:007211.345319.562710.42
11:00–12:00365.67217.753111.97
12:00–13:00121.8941.4872.7
13:00–14:00182.8362.2193.47
14:00–15:007311.5238.494617.76
15:00–16:009314.653914.395822.39
16:00–17:008713.74215.54216.22
17:00–18:007311.5259.23176.56
Total Participants635271259
Table 6. Relationships between the UTCI and the mean values of the TSV and TCV.
TSVTCV
Neutral UTCINeutral UTCI RangesComfortable UTCIComfortable UTCI Ranges
Summer23.164 °C18.62–27.71 °C24.48 °C≤31.11
Transitional season
(autumn)
25.756 °C18.33–34.27 °C26.998 °C19.474–30.694 °C
Winter21.14 °C11.33–30.94 °C23.87 °C≥9.59 °C
Table 7. Product–moment correlation matrix (Summer).
TSVAir TemperatureRelative HumidityWind SpeedMRT
TSV1.0000.615−0.3140.1420.869
Air Temperature0.6151.000−0.8800.3000.192
Relative Humidity−0.314−0.8801.000−0.3440.042
Wind Speed0.1420.300−0.3441.0000.167
MRT0.8690.1920.0420.1671.000
Table 8. Product–moment correlation matrix (Autumn).
TSVAir TemperatureRelative HumidityWind SpeedMRT
TSV1.0000.421−0.208−0.3270.868
Air Temperature0.4211.000−0.924−0.2960.017
Relative Humidity−0.208−0.9241.0000.2820.179
Wind Speed−0.327−0.2960.2821.0000.048
MRT0.8680.0170.1790.0481.000
Table 9. Product–moment correlation matrix (Winter).
TSVAir TemperatureRelative HumidityWind SpeedMRT
TSV1.0000.231−0.026−0.6340.734
Air Temperature0.2311.000−0.9370.141−0.052
Relative Humidity−0.026−0.9371.000−0.1700.277
Wind Speed−0.6340.141−0.1701.000−0.092
MRT0.734−0.0520.277−0.0921.000
Table 10. Multiple linear regression on TSV (summer).
CoefStd ErrtP > |t|Collinearity
Const−1.2000.253−4.7400.000ToleranceVIF
Air Temperature0.0310.0093.3870.0010.8901.124
Wind Speed−0.0180.022−2.7900.0300.8981.114
MRT0.0300.00214.0610.0000.9501.053
No. observations: 635; R2 = 0.724; F-statistic: 178.59; P: 0.000.
Table 11. Multiple linear regression on TSV (autumn).
CoefStd ErrtP > |t|Collinearity
Const−1.2940.138−9.3410.000ToleranceVIF
Air Temperature0.0280.0074.0540.0000.9111.097
Wind Speed−0.0430.016−2.7450.0060.9091.100
MRT0.0220.00114.6850.0000.9971.003
No. observations: 271; R2 = 0.531; F-statistic: 82.65; P: 0.000.
Table 12. Multiple linear regression data for TSV (winter).
CoefStd Errt P > |t|Collinearity
Const−1.090 0.049 −22.108 0.000 ToleranceVIF
Air Temperature0.025 0.006 4.420 0.000 0.978 1.022
Wind Speed−0.099 0.013 −7.666 0.000 0.973 1.028
MRT0.019 0.002 9.990 0.000 0.990 1.010
No. observations: 259; R2 = 0.649; F-statistic: 60.35; P: 0.000.
Table 13. TSV model regression analysis results in different seasons.
TSV ModelRanking of Influencing Factors
SummerTSV = 0.0306 Ta − 0.0177V + 0.0302MRT − 1.1996Air temperature–MRT–Wind speed
Transitional season (autumn)TSV = 0.0276Ta − 0.0430V + 0.0218MRT − 1.2936Wind speed–Air temperature–MRT
WinterTSV = 0.0251Ta − 0.0985V + 0.0185MRT − 1.0901Wind speed–Air temperature–MRT
Table 14. Total comfortable areas based on UTCI.
SummerWinter
TimeTotal Area of Comfort Zone (m2)Proportion of Comfort ZoneTotal Area of Comfort Zone (m2)Proportion of Comfort Zone
8:00352.3731.19%8.220.73%
9:00302.6626.79%41.553.68%
10:00234.9920.80%79.637.05%
11:0056.575.01%173.6115.36%
12:0090.818.04%264.8123.44%
13:007.700.68%275.2524.36%
14:007.700.68%653.9757.88%
15:007.700.68%463.5041.02%
16:00102.969.11%213.9718.94%
17:00189.9016.81%114.7610.16%
18:00776.5068.72%4.820.43%
Disclaimer/Publisher’s Note: The statements, opinions and data contained in all publications are solely those of the individual author(s) and contributor(s) and not of MDPI and/or the editor(s). MDPI and/or the editor(s) disclaim responsibility for any injury to people or property resulting from any ideas, methods, instructions or products referred to in the content.

