1. Introduction
Outdoor spaces, vital venues for public activities, serve as essential indicators of urban livability and vitality [
1,
2,
3]. Among the various factors influencing the quality of these spaces, the thermal environment plays a pivotal role [
4,
5]. It not only directly impacts residents’ physical and mental well-being [
6,
7], but also affects the duration, type, and frequency of outdoor activities [
8,
9,
10,
11,
12].
Research on the relationship between outdoor thermal environments and human behavior can be traced back to the 1930s [
13,
14,
15]. However, it was not until the 1970s that Fanger and his colleagues developed an efficient and practical method for assessing thermal comfort [
16,
17,
18]. Their work identified six key factors: air temperature, radiant temperature, relative humidity, wind speed, clothing insulation, and physical activity. This pioneering research transitioned the field from qualitative assessments to quantitative analysis by integrating both environmental and physiological variables. Over the past decade, advances in urban climatology, heat exchange physics, and computer science have significantly accelerated progress in this field [
19,
20,
21]. Outdoor thermal perception indices are now commonly categorized into rational and empirical indices. Rational indices, grounded in thermodynamic and physiological modeling [
22,
23], include widely used measures such as the Predicted Mean Vote (PMV) [
24], Standard Effective Temperature (SET*) [
25], Outdoor Standard Effective Temperature (OUT_SET*) [
26], Physiologically Equivalent Temperature (PET) [
27,
28], and Universal Thermal Climate Index (UTCI) [
29]. Among these, the OUT_SET*, PET, and UTCI are most commonly applied in outdoor thermal environment research [
30]. Empirical indices, on the other hand, focus on detailed investigations of climatic parameters affecting outdoor thermal perception [
31,
32,
33], employing methods such as field measurements [
34,
35] and multivariate regression analysis [
34,
36,
37,
38].
Cities function as complex, open macro-systems where the dynamic and often unpredictable interaction of various factors influencing outdoor thermal perception profoundly impacts the sustainable development of urban resources, society, and environmental systems [
39,
40,
41,
42]. Addressing these challenges necessitates research across four key dimensions: physical, physiological, psychological, and social behavior [
8,
14,
33,
43,
44]. Physiological adaptations, encompassing the regulation of core body temperature, sweating rate, and skin temperature, are influenced by factors such as air temperature, activity level, clothing insulation, relative humidity, wind speed, short-wave solar radiation, and long-wave terrestrial radiation. However, these variables adapt slowly to climatic changes and are not the primary focus of outdoor thermal perception studies. In contrast, psychological adaptation and social behavioral adjustments have a significant impact on thermal perception [
45,
46,
47]. Numerous studies conducted worldwide across various climate zones, including Gothenburg, Sweden [
48], Montreal, Canada [
49], Matsue, Japan [
50], Taiwan, China [
46,
51], and Hong Kong, China [
52,
53], have investigated outdoor thermal perception and associated behavioral patterns. These studies not only indicate that seasonal climatic variations and outdoor spatial configurations greatly influence individuals’ perceptions of thermal environments [
33], but also demonstrate that residents adjust their expectations of outdoor thermal perception in response to seasonal changes [
7,
43]. Therefore, understanding the characteristics and preferences of outdoor thermal perception and behavioral patterns in relation to seasonal variations holds significant academic value.
Currently, many older urban residential areas in the Yangtze River Delta region are experiencing a significant decline in thermal environment quality, particularly in outdoor public spaces [
54]. This deterioration in thermal comfort has led to a loss of vitality in these spaces, posing a substantial risk to urban development. As a result, optimizing outdoor residential space to enhance the thermal environment provides city planners with a new governance approach. This approach transcends traditional aesthetic considerations, prioritizing instead the integration of resident activity patterns and thermal perception needs within the urban planning process [
36,
55,
56].
In this context, the study aimed to achieve the following objectives: (1) to summarize the optimal thermal environment for outdoor activities, (2) to characterize resident behavioral responses to thermal environments across varying activity types, age groups, and genders, and (3) to identify the relationship between outdoor thermal environments and residents’ activity behaviors through comparative experiments. Building upon these objectives, this study introduces a novel approach by integrating seasonal variations in outdoor thermal comfort with residents’ temporal activity patterns. Instead of solely focusing on static thermal comfort metrics, we emphasize the dynamic relationship between thermal perception and activity timing, ensuring that outdoor spaces remain functional and comfortable throughout the year. This integration provides valuable insights for urban planning and climate-responsive design, laying a foundation for more precise and adaptive outdoor space optimization strategies in future research.
2. Materials and Methods
To comprehensively understand residents’ perceptions of outdoor thermal environments and their behavioral characteristics in residential areas of the Yangtze River Delta, this study conducted behavioral observations, questionnaire surveys, and field measurements in typical residential areas during summer [
20,
57,
58,
59,
60], the transitional season (autumn) [
61,
62], and winter [
20,
63,
64,
65], which were chosen for their representative climatic characteristics. The workflow is shown in
Figure 1.
2.1. Case Study and Seasonal Selection Justification
The Yangtze River Delta is one of China’s most developed urban agglomerations, distinguished by a long history of urbanization and diverse city morphology. With a high population density and limited urban space, public outdoor areas experience significant usage pressure. Additionally, the region exhibits distinct seasonal climate variations, characterized by hot, humid summers and cool, dry winters. These pronounced seasonal transitions make it an ideal setting for studying the effects of seasonal thermal environment changes on outdoor activities and thermal comfort.
Research indicates that meteorological factors such as temperature, humidity, and wind direction show considerable overlap between spring and autumn in the Yangtze River Delta, resulting in minimal seasonal differences in outdoor thermal perception [
66,
67,
68]. To ensure research precision and avoid redundant data collection, this study focuses on summer, autumn (a transitional season), and winter [
69,
70,
71]. This approach facilitates a more detailed analysis of seasonal outdoor thermal environments and their impact on human thermal comfort.
2.2. Questionnaire Survey
This study employed a questionnaire survey to investigate urban residents’ outdoor activities and thermal perceptions. The questionnaire was designed based on existing frameworks [
9,
35,
72] and consisted of three main sections: (1) objective information, which gathered demographic data such as age, gender, clothing, and length of residence; (2) subjective perceptions, which used ASHRAE’s standardized scales, including the seven-point thermal sensation vote (TSV) and the four-point thermal comfort vote (TCV) [
73,
74,
75], to capture participants’ evaluations of thermal perception and comfort in outdoor spaces; (3) seasonal preferences, which assessed residents’ preferences for outdoor activity times across different seasons. Surveys were conducted on clear, sunny days to ensure the reliability and representativeness of the data [
20,
70,
76,
77,
78]. Respondents were screened for local residency to avoid potential data contamination from non-residents. In total, 1165 valid questionnaires were collected, with 635 from summer, 271 from the transitional season (autumn), and 259 from winter.
Although there are significant differences in sample sizes across seasons (summer: 635, autumn: 271, winter: 259), effect size analysis, specifically the calculation of Cohen’s d, reveals that the Cohen’s d between summer and both autumn and winter is greater than 0.5. This indicates that the differences in thermal comfort perception between the seasons are statistically significant, even with unequal sample sizes. Therefore, the disparity in sample sizes across seasons does not significantly affect the validity of the study’s findings.
2.3. Questionnaire Surveys
Microclimate data were collected using a Kestrel 5400 portable weather station (USA) and an HD32.3 heat stress meter (Delta Ohm, Padova, Italy), which was equipped with a TP3276.2 black globe temperature probe and an AP3203.2 omnidirectional hot-wire anemometer [
79]. These instruments measured key microclimate parameters, including air temperature (Ta/°C), relative humidity (RH/%), wind speed (Va, m/s), and black globe temperature (Tg/°C) [
12,
70,
80]. All instruments were mounted at a standardized height of 1.5 m at designated measurement points. The mean radiant temperature (Tmrt) was calculated using air temperature, relative humidity, wind speed, and black globe temperature [
18,
79,
80,
81,
82], following calculation methods specified in international standards ISO 7726-1998 [
83] and ASHRAE 55-2017 [
84]. The formula for calculating Tmrt is as follows:
2.4. Behavioral Observation
Behavioral observation is a research method that involves directly monitoring subjects to collect data relevant to the study’s objectives [
46,
85]. In this study, behavioral observation was combined with survey questionnaires to evaluate residents’ preferences for outdoor activity timing. On-site observations and photographic documentation were utilized to record participant numbers and activity statuses in outdoor spaces, enabling an analysis of residents’ spatial preferences during outdoor activities.
2.5. Data Analysis
The Universal Thermal Climate Index (UTCI) is a comprehensive tool for assessing human thermal comfort in outdoor environments. It effectively captures variations in environmental factors such as air temperature, relative humidity, wind speed, and solar radiation [
29,
86,
87,
88,
89,
90], simulating the physiological response of the human body to these conditions. This study adopts the UTCI for outdoor seasonal thermal stress analysis due to its outdoor-specific adaptability [
91]. Unlike the PMV (designed for steady indoor conditions), UTCI’s multi-node thermoregulation model dynamically simulates transient solar-wind interactions critical for outdoor heat flux (e.g., shade radiation shifts, gust cooling) [
66]. While PET relies on the Munich Model (calibrated with European parameters requiring Asian metabolic adjustments), the UTCI’s globally validated framework eliminates geographical biases, aligning with cross-climate universal analysis needs.
To define the thermal comfort ranges corresponding to seasonal UTCI values, the temperature–frequency method was applied. K-means clustering [
92,
93,
94,
95,
96] was utilized to categorize UTCI values for each season [
97,
98]. This study calculated the mean TSV for each cluster and conducted linear regression analysis to explore the relationships between UTCI values, mean TSV, and TCV values. Further regression analysis determined the neutral and comfort UTCI ranges for each season.
Unlike the UTCI, the TSV model incorporates multiple parameters, including air temperature, relative humidity, wind speed, and radiant temperature, offering greater flexibility for thermal comfort assessments [
73,
74,
99]. This model is well suited to diverse environmental conditions and scenarios, offering a more accurate reflection of individual thermal perceptions. This flexibility enables more precise recommendations for optimizing thermal environments. In this study, both the UTCI and the TSV model were employed to quantitatively assess residents’ subjective thermal comfort preferences and perceptions in the survey samples.
Figure 1.
Research workflow.
Figure 1.
Research workflow.
3. Results
A total of 1165 valid questionnaires were collected, including 635 from summer, 271 from the transitional season (autumn), and 259 from winter. The detailed survey results are provided in
Table 1.
3.1. Outdoor Thermal Sensation Vote (TSV)
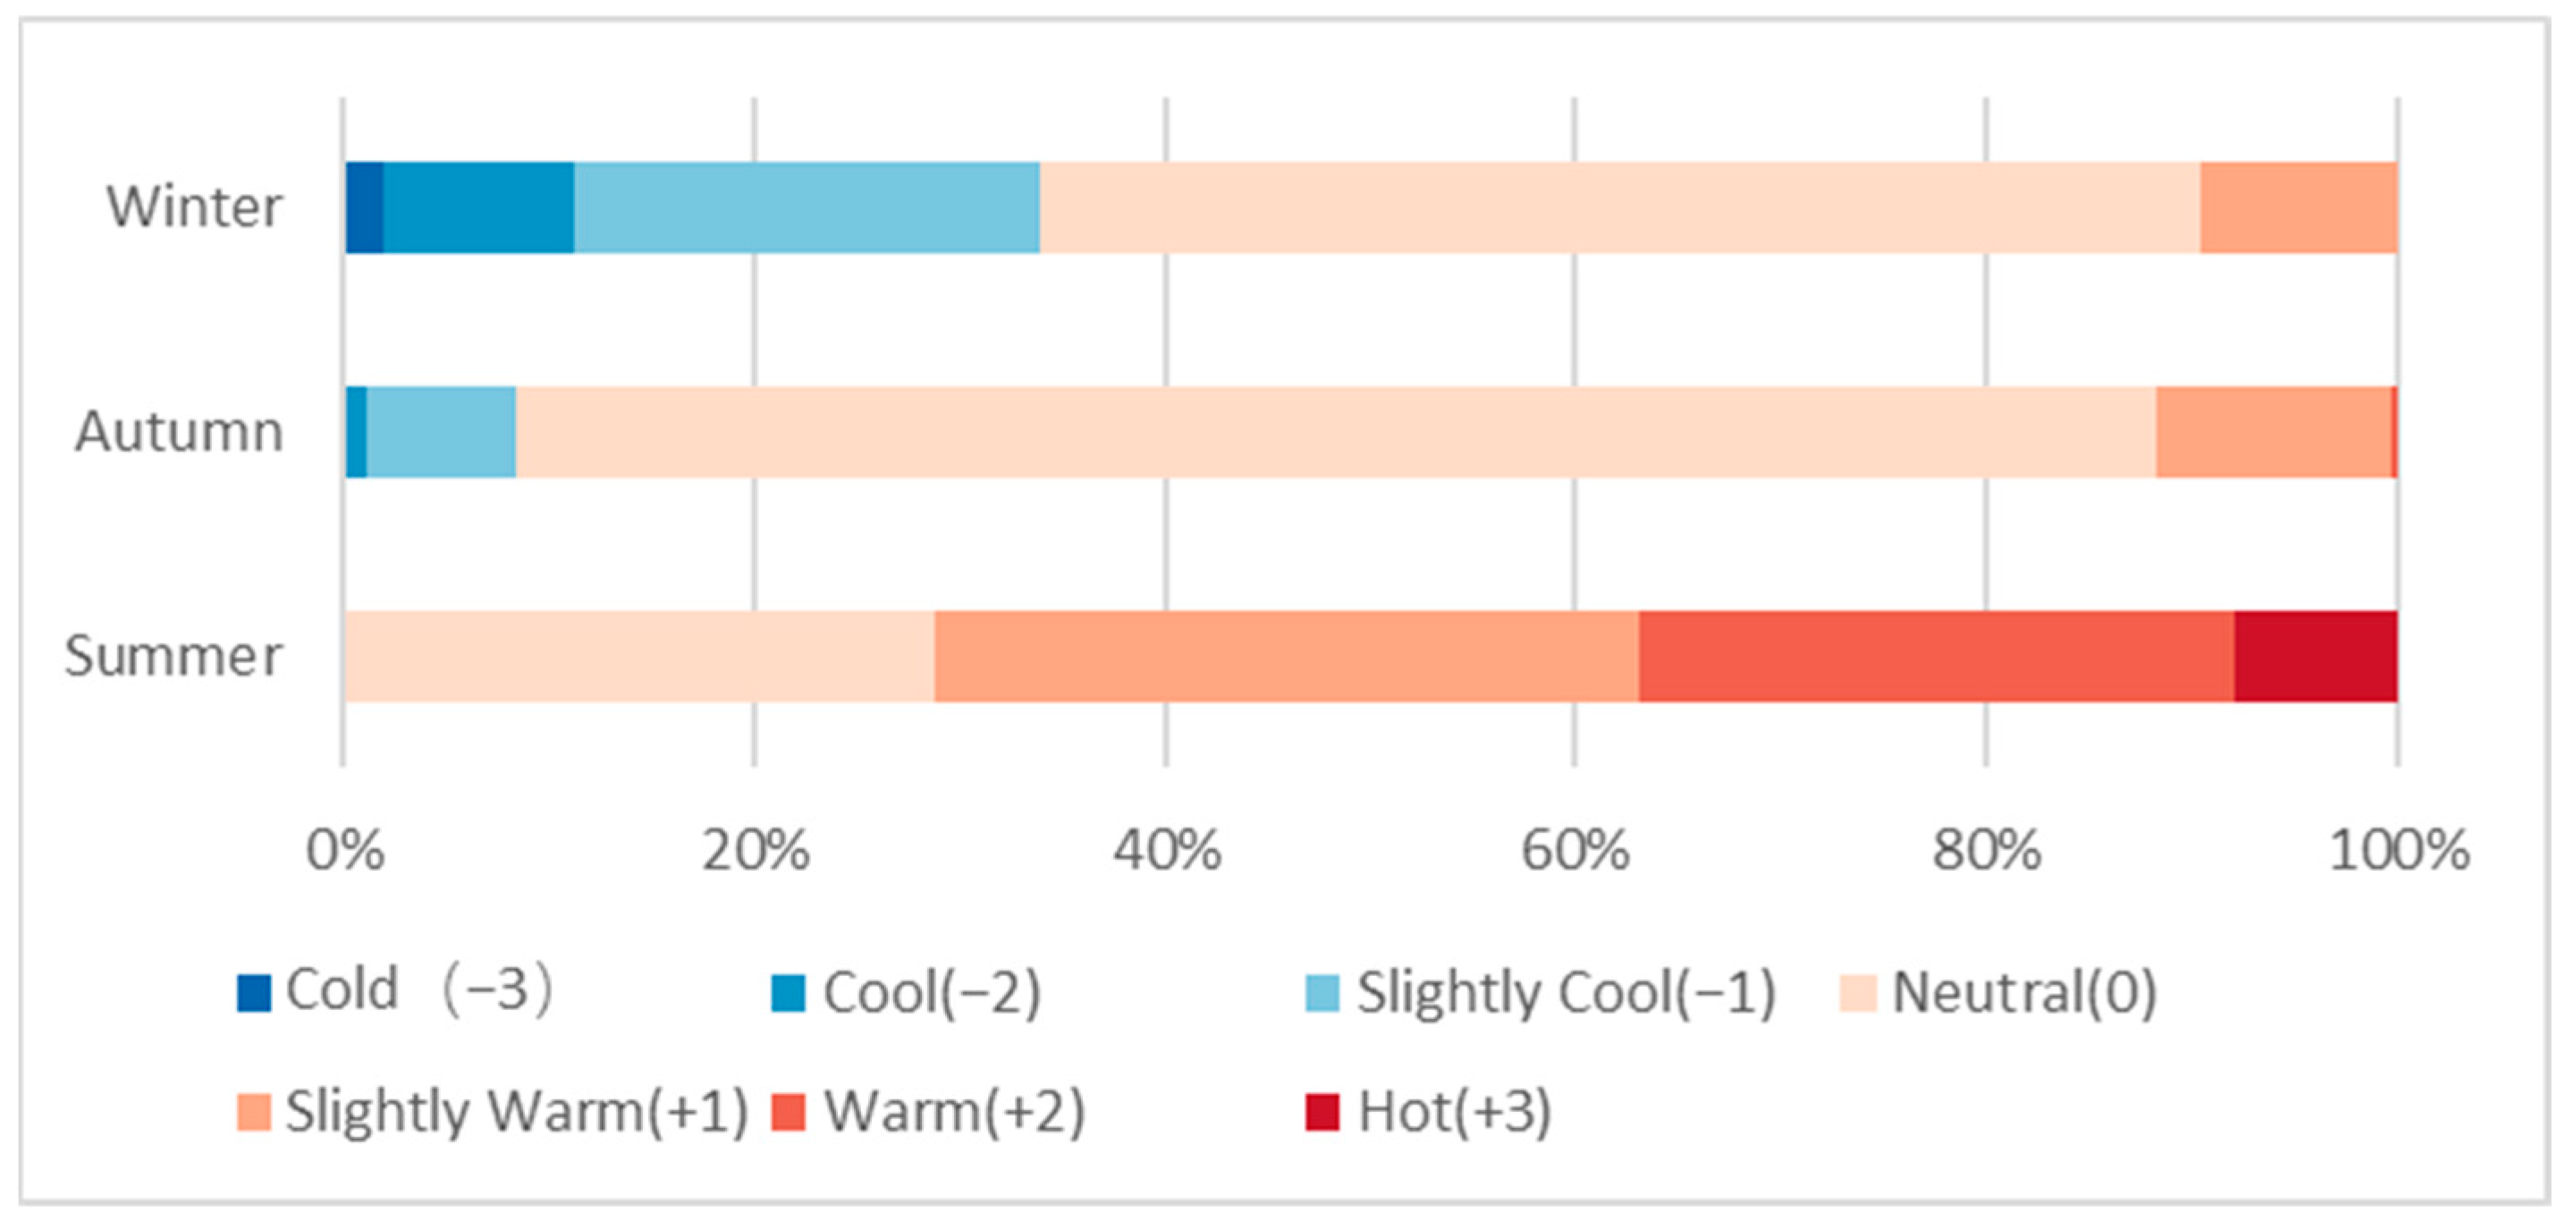
TSV results for respondents’ outdoor environmental perceptions across different seasons are summarized in
Table 2, with the proportional distribution illustrated in
Figure 2.
In summer, among the 635 valid questionnaires collected, 182 respondents (28.66%) selected “neutral (0)”, 217 respondents (34.17%) chose “slightly warm (+1)”, 184 respondents (28.98%) indicated “warm (+2)”, and 51 respondents (8.03%) selected “hot (+3)”. Only one respondent (0.16%) selected “slightly cool (−1)”, while no respondents chose “cool (−2)” or “cold (−3)”. Overall, 400 respondents (62.99%) reported a “neutral thermal sensation”, defined by TSV results within the range of [−1, 1]. In the transitional season (autumn), 271 valid questionnaires were collected. Of these, 182 respondents (79.70%) selected “neutral (0)”, 31 respondents (11.44%) chose “slightly warm (+1)”, 20 respondents (7.38%) selected “slightly cool (−1)”, and 4 respondents (1.48%) chose either “cool (−2)” or “warm (+2)”. No respondents selected “cold (−3)” or “hot (+3)”. In total, 266 respondents (98.52%) were classified as experiencing a “neutral thermal sensation”, based on TSV results within the [−1, 1] range. In winter, 259 valid questionnaires were analyzed. Among these, 146 respondents (56.37%) chose “neutral (0)”, 59 respondents (22.78%) selected “slightly cool (−1)”, 24 respondents (9.27%) chose “cool (−2)”, and 5 respondents (1.93%) selected “cold (−3)”. Additionally, 25 respondents (9.65%) indicated “slightly warm (+1)”, while no respondents chose “warm (+2)” or “hot (+3)”. A total of 230 respondents (88.80%) were categorized as having a “neutral thermal sensation”, as indicated by TSV results within the [−1, 1] range.
3.2. Outdoor Thermal Comfort Vote (TCV)
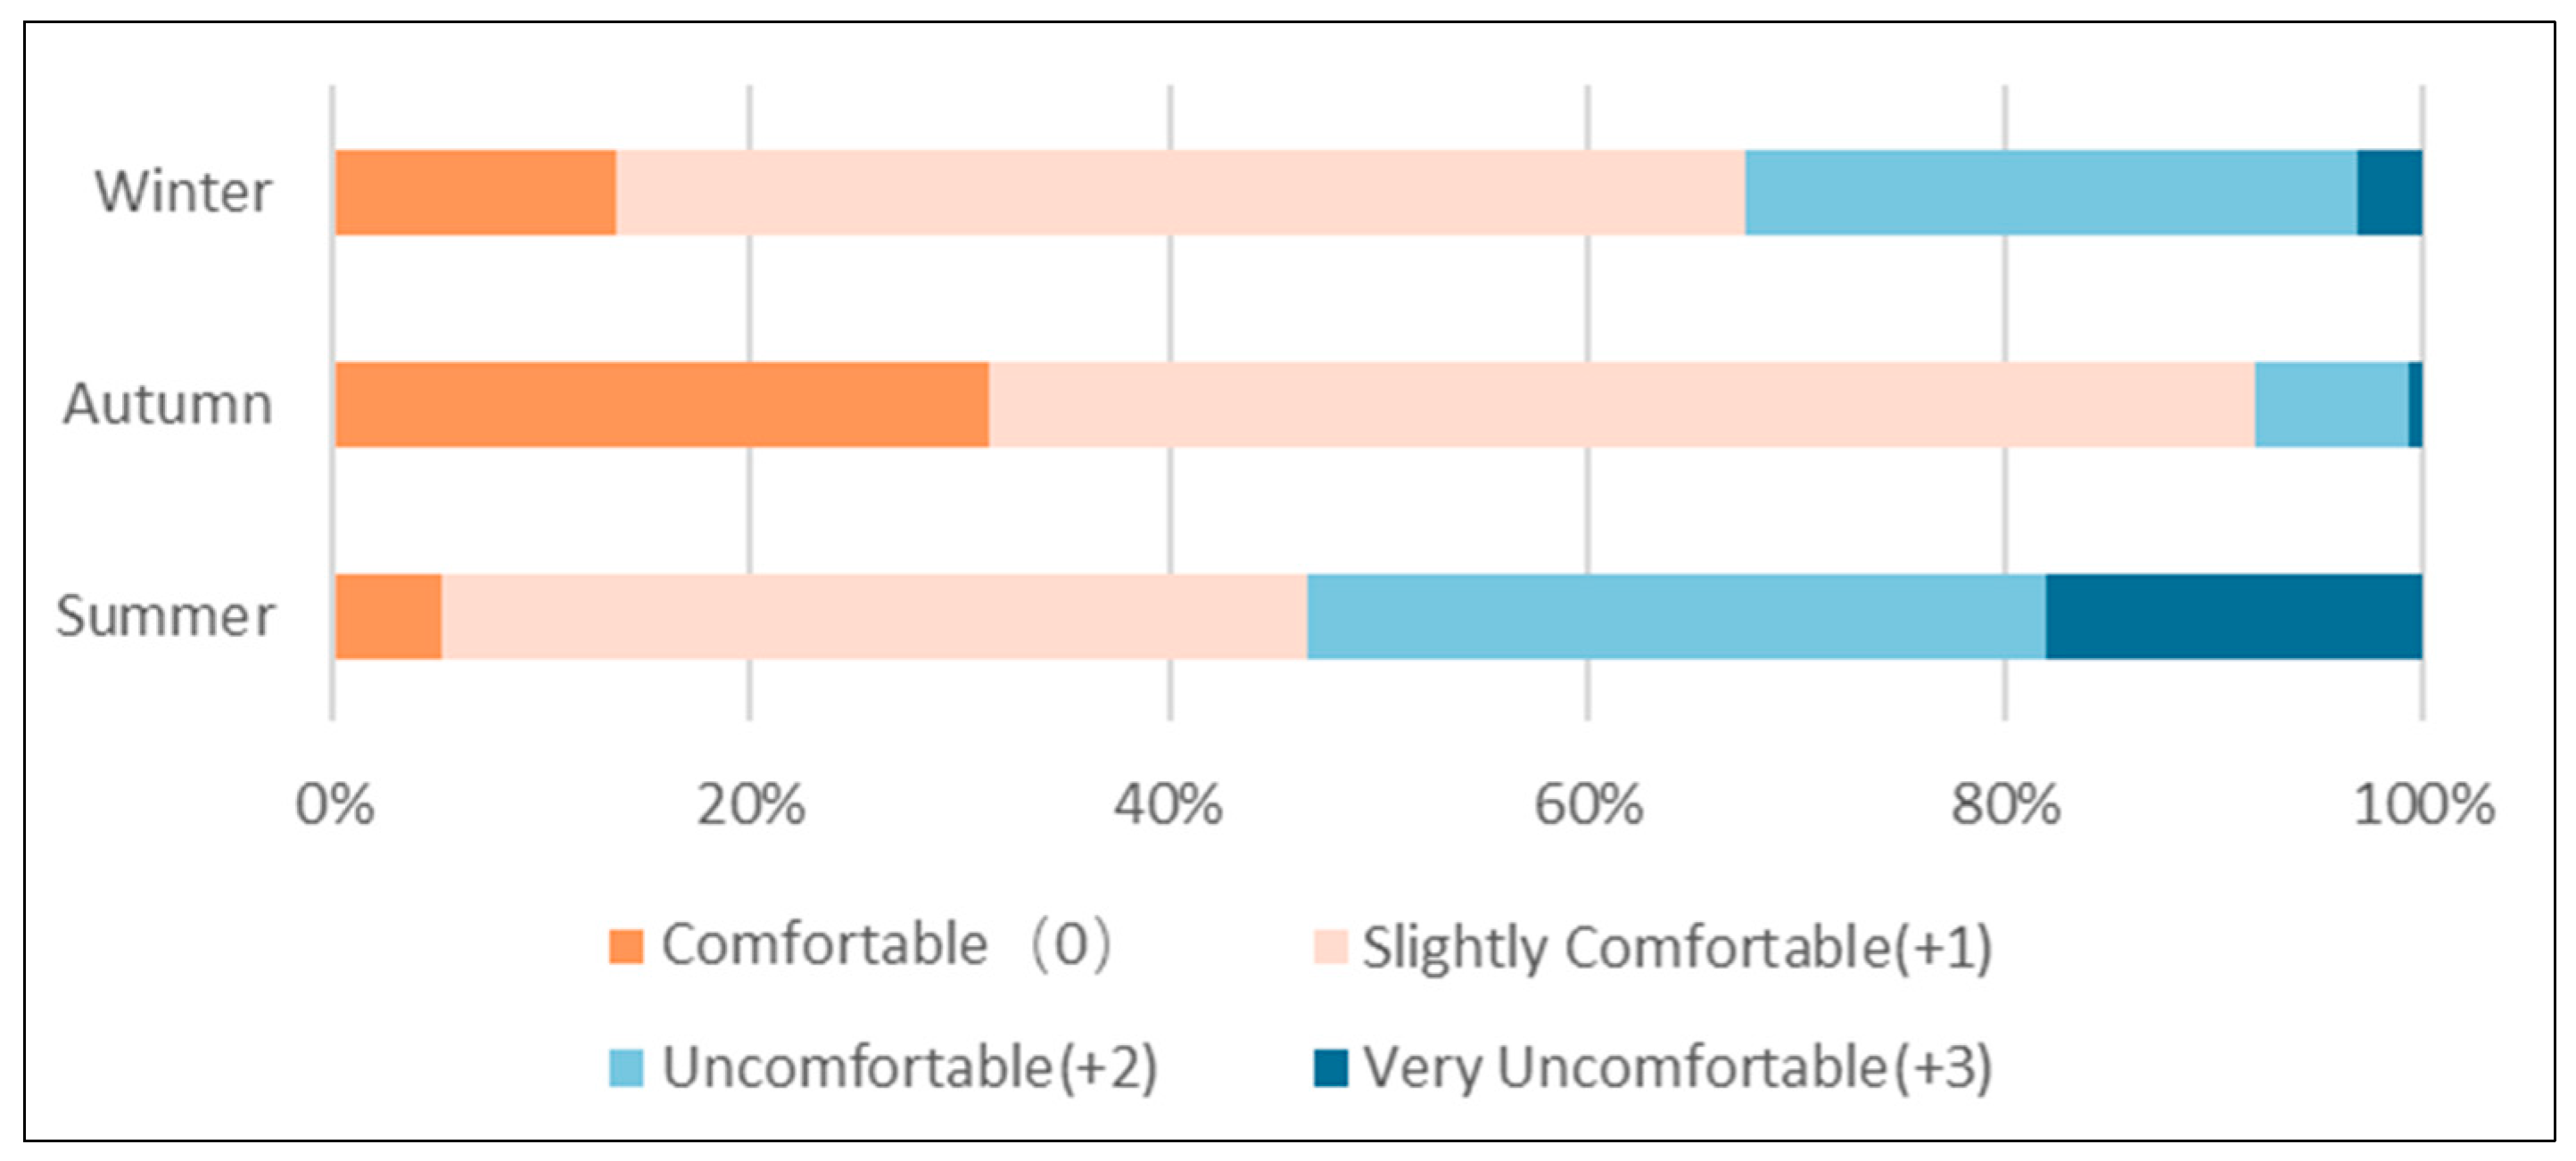
The TCV results of the respondents’ outdoor environmental perceptions across different seasons are summarized in
Table 3, with the proportional distribution illustrated in
Figure 3.
In summer, only 33 respondents (5.20%) selected “comfortable (0),” while 263 respondents (41.42%) chose “slightly comfortable (+1)”. Together, these two groups, classified as “generally satisfied” with the outdoor thermal comfort, accounted for 46.62%, the lowest proportion among the three seasons surveyed. Additionally, 224 respondents (35.28%) rated the environment as “uncomfortable (+2)”, and 115 respondents (18.11%) selected “very uncomfortable (+3)”, the highest proportions observed across the seasons. In the transitional season (autumn), 85 respondents (31.37%) rated the thermal environment as “comfortable (0)”, and 164 respondents (60.52%) chose “slightly comfortable (+1)”. The combined proportion of “generally satisfied” respondents reached 91.88%, the highest among the three seasons. Only 20 respondents (7.38%) selected “uncomfortable (+2)”, and just 2 respondents (0.74%) chose “very uncomfortable (+3)”, representing the lowest proportions observed. In winter, 35 respondents (13.51%) selected “comfortable (0)”, while 164 respondents (54.05%) chose “slightly comfortable (+1)”. The combined proportion of “generally satisfied” respondents was 67.57%, lower than in autumn but higher than in summer. Meanwhile, 76 respondents (29.34%) rated the environment as “uncomfortable (+2)”, and 8 respondents (3.09%) selected “very uncomfortable (+3)”, both lower than in summer but higher than in autumn.
3.3. Outdoor Thermal Environment
During the summer daytime survey period, outdoor air temperatures in the test area ranged from 26.29 °C to 35.98 °C, with an average of 30.58 °C. The relative humidity varied between 59.63% and 84.67%, averaging 74.53%. Wind speeds fluctuated from 0 m/s to 2.47 m/s, with an average of 0.48 m/s. The average radiant temperature measured across multiple points ranged from 27.36 °C to 59.73 °C, with an average of 36.26 °C.
During the transitional season (autumn) daytime survey period, outdoor air temperatures ranged from 15.2 °C to 22.5 °C, with an average of 18.85 °C. Relative humidity fluctuated between 43.1% and 82.1%, averaging 60.13%. Wind speeds varied from 0 m/s to 3.02 m/s, with an average of 0.33 m/s. The average radiant temperature measured across multiple points ranged from 15.23 °C to 41.23 °C, with an average of 23.44 °C.
During the winter daytime survey period, outdoor air temperatures ranged from 4.75 °C to 12.63 °C, with an average of 8.83 °C. The relative humidity ranged from 50.82% to 76.83%, averaging 61.49%. Wind speeds fluctuated between 0 m/s and 2.52 m/s, with an average of 0.33 m/s. The average radiant temperature measured across multiple points ranged from 7.25 °C to 27.36 °C, with an average of 12.68 °C.
The measurement results of the outdoor thermal environment are shown in
Table 4.
3.4. Residents’ Seasonal Preferences for Outdoor Activity Time
This study identified residents’ preferred times for outdoor activities across different seasons, drawing upon both survey responses and on-site observations.
Table 5 summarizes the key findings, while
Figure 4 illustrates the proportional distribution of residents’ activity time preferences for each season.
In summer, outdoor activities were primarily concentrated between 8:00 and 11:00 am and 2:00 and 6:00 pm, with a slight preference for the morning. The peak activity time occurred between 9:00 and 10:00 am, representing 16.38% of the summer sample. In the transitional season (autumn), outdoor activities were most commonly scheduled between 9:00 and 11:00 am and 3:00 and 5:00 pm, with nearly equal participation in both morning and afternoon periods. The highest proportion of respondents (19.56%) selected the 10:00–11:00 am time slot. In winter, outdoor activities were mainly concentrated between 10:00 and 12:00 am and 2:00 and 5:00 pm, with a clear preference for the afternoon. The highest proportion of activity occurred from 3:00 to 4:00 pm, accounting for 22.39% of the winter sample.
3.5. Residents’ Seasonal Preferences for Outdoor Activity Spaces
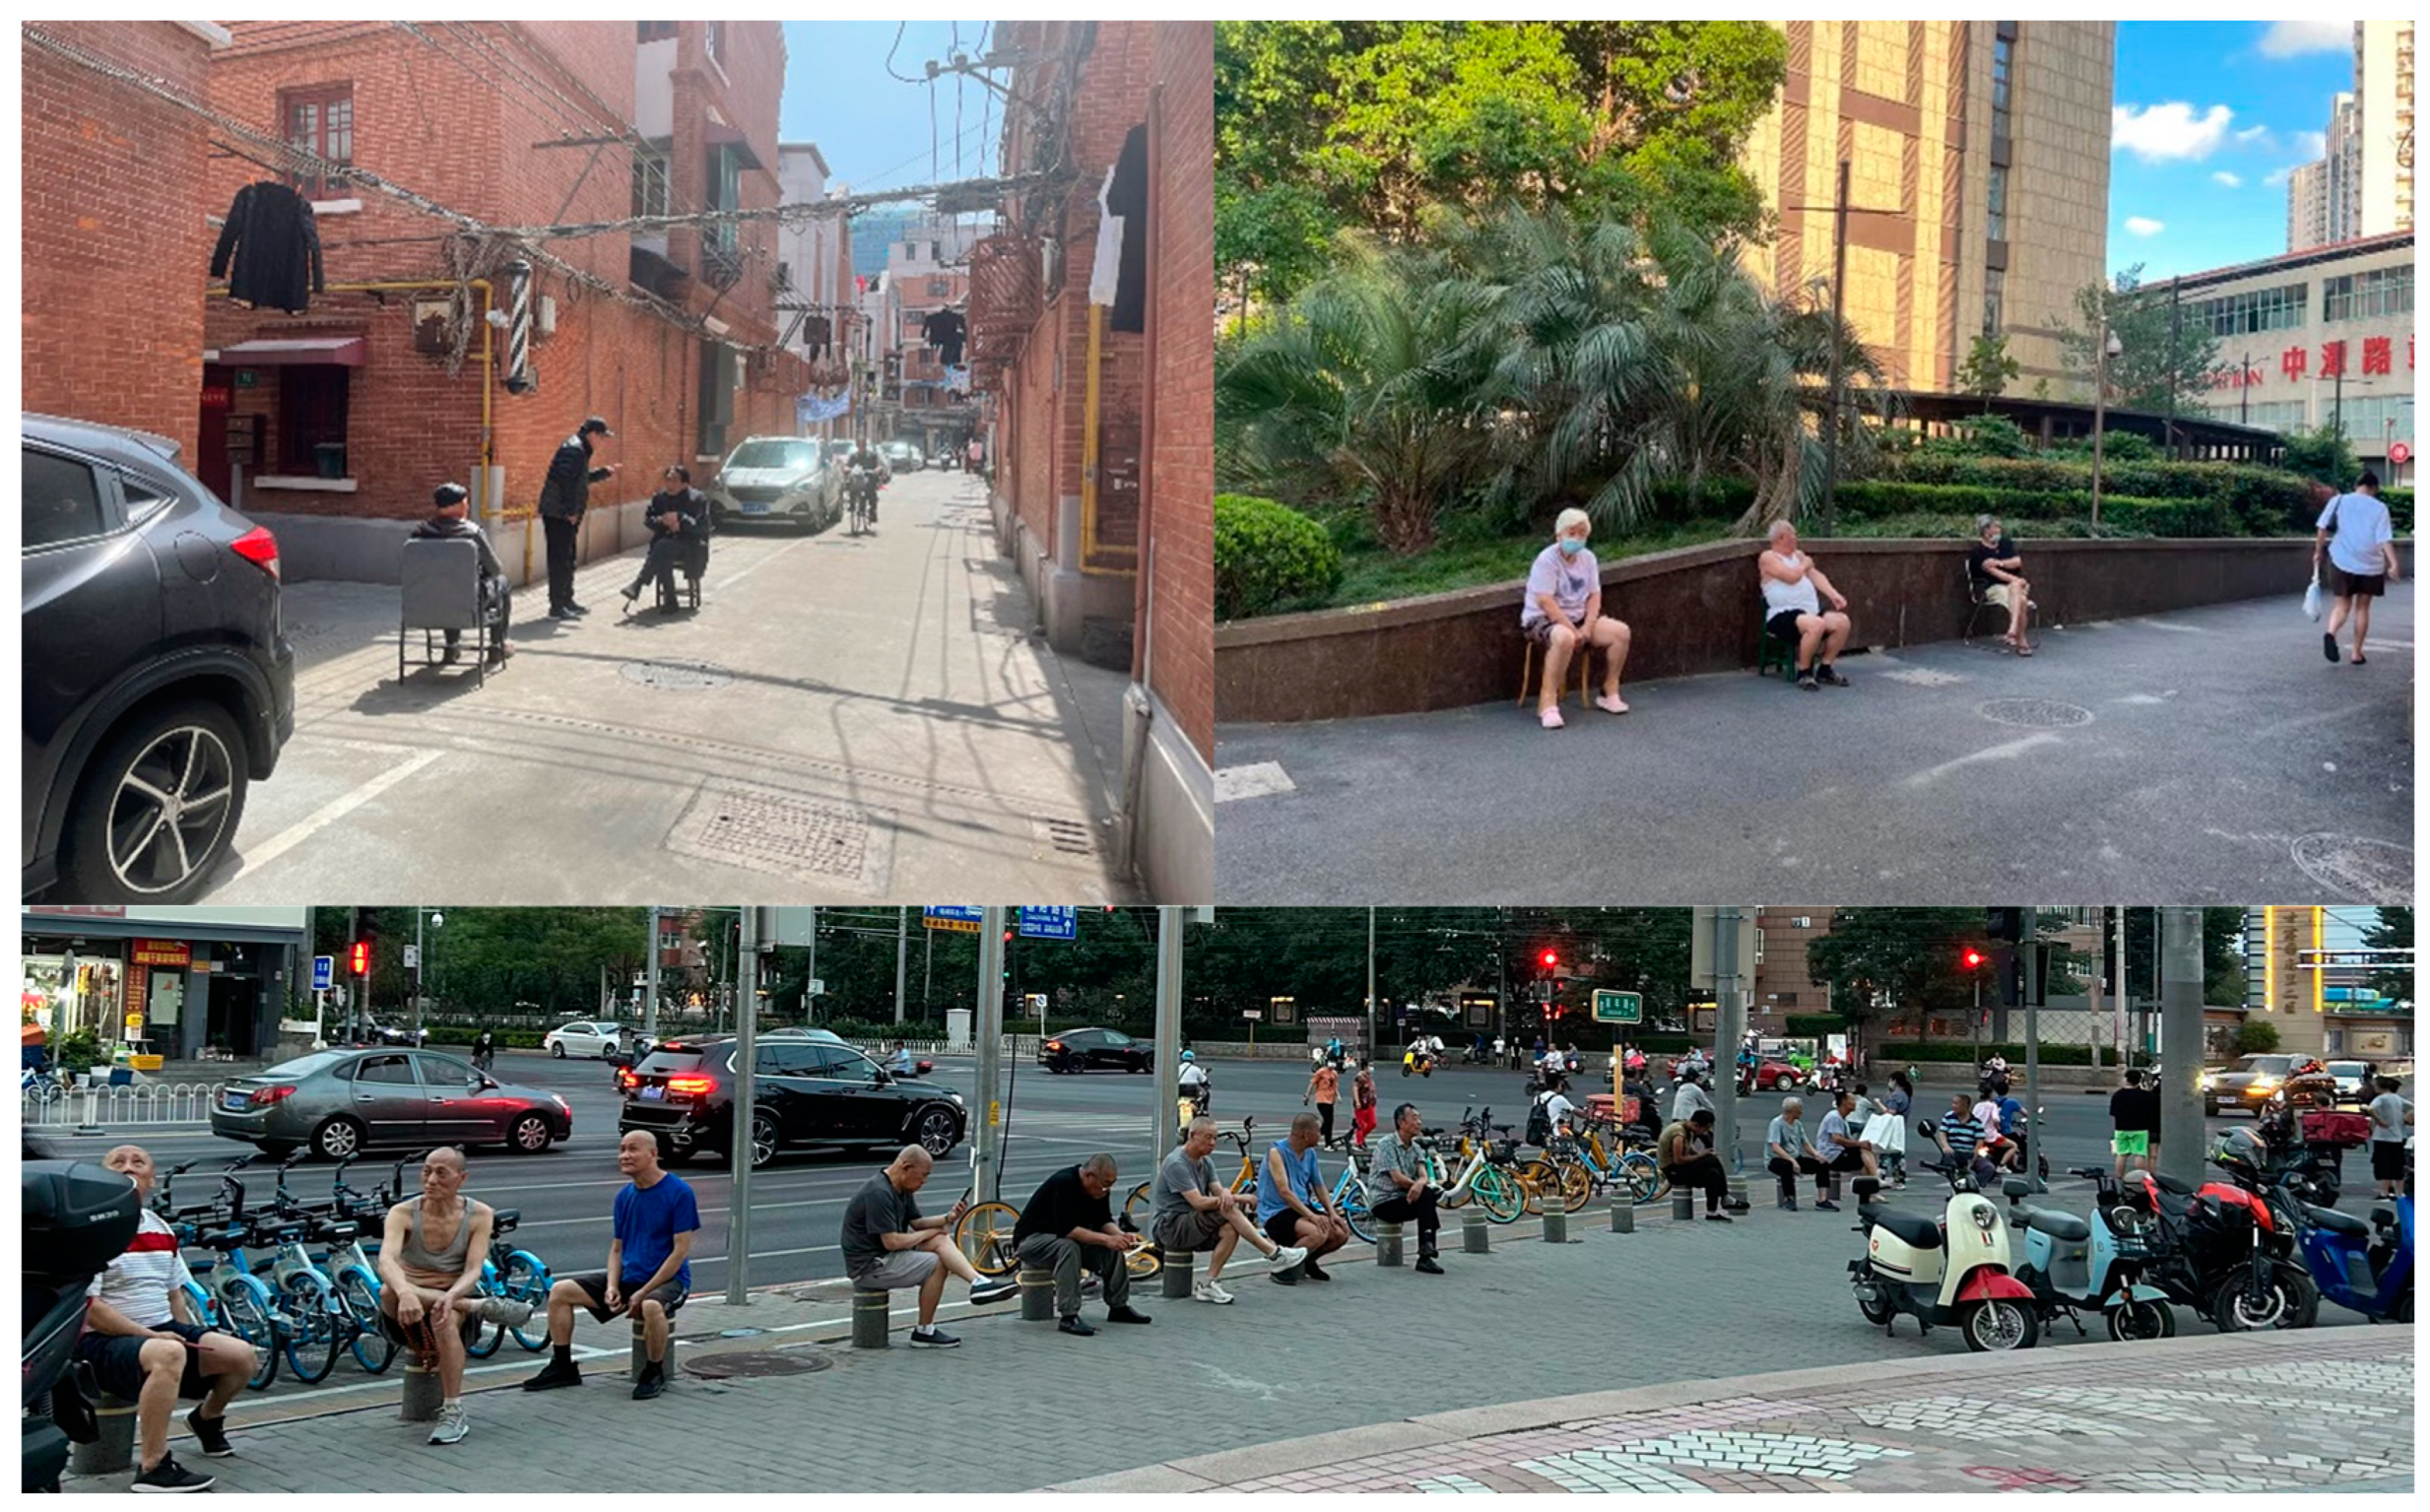
On-site observations in the Yangtze River Delta region revealed distinct seasonal shifts in resident preferences for outdoor activity spaces. In summer, with high temperatures and calm winds, residents preferred shaded areas to avoid direct sunlight, preferring outdoor spaces that are open, well ventilated, and offer substantial shade. In the transitional season (autumn), with its clear and mild weather, resident preferences for outdoor spaces exhibited greater diversity. Choices were largely influenced by individual preferences, resulting in a more dispersed selection of outdoor activity areas. In winter, characterized by cold and damp conditions, residents tended to gravitate toward areas with stronger solar radiation and lower wind speeds, such as the edges of walls or sunlit building corners. Overall, residents in the Yangtze River Delta region prioritized cool, well-ventilated environments in summer to mitigate the heat, while in winter, they favored sunlit spaces with lower wind speeds. As a transitional season, autumn demonstrated greater variability in space preferences, with individual differences playing a significant role, and preferences often fluctuating at the beginning and end of the season.
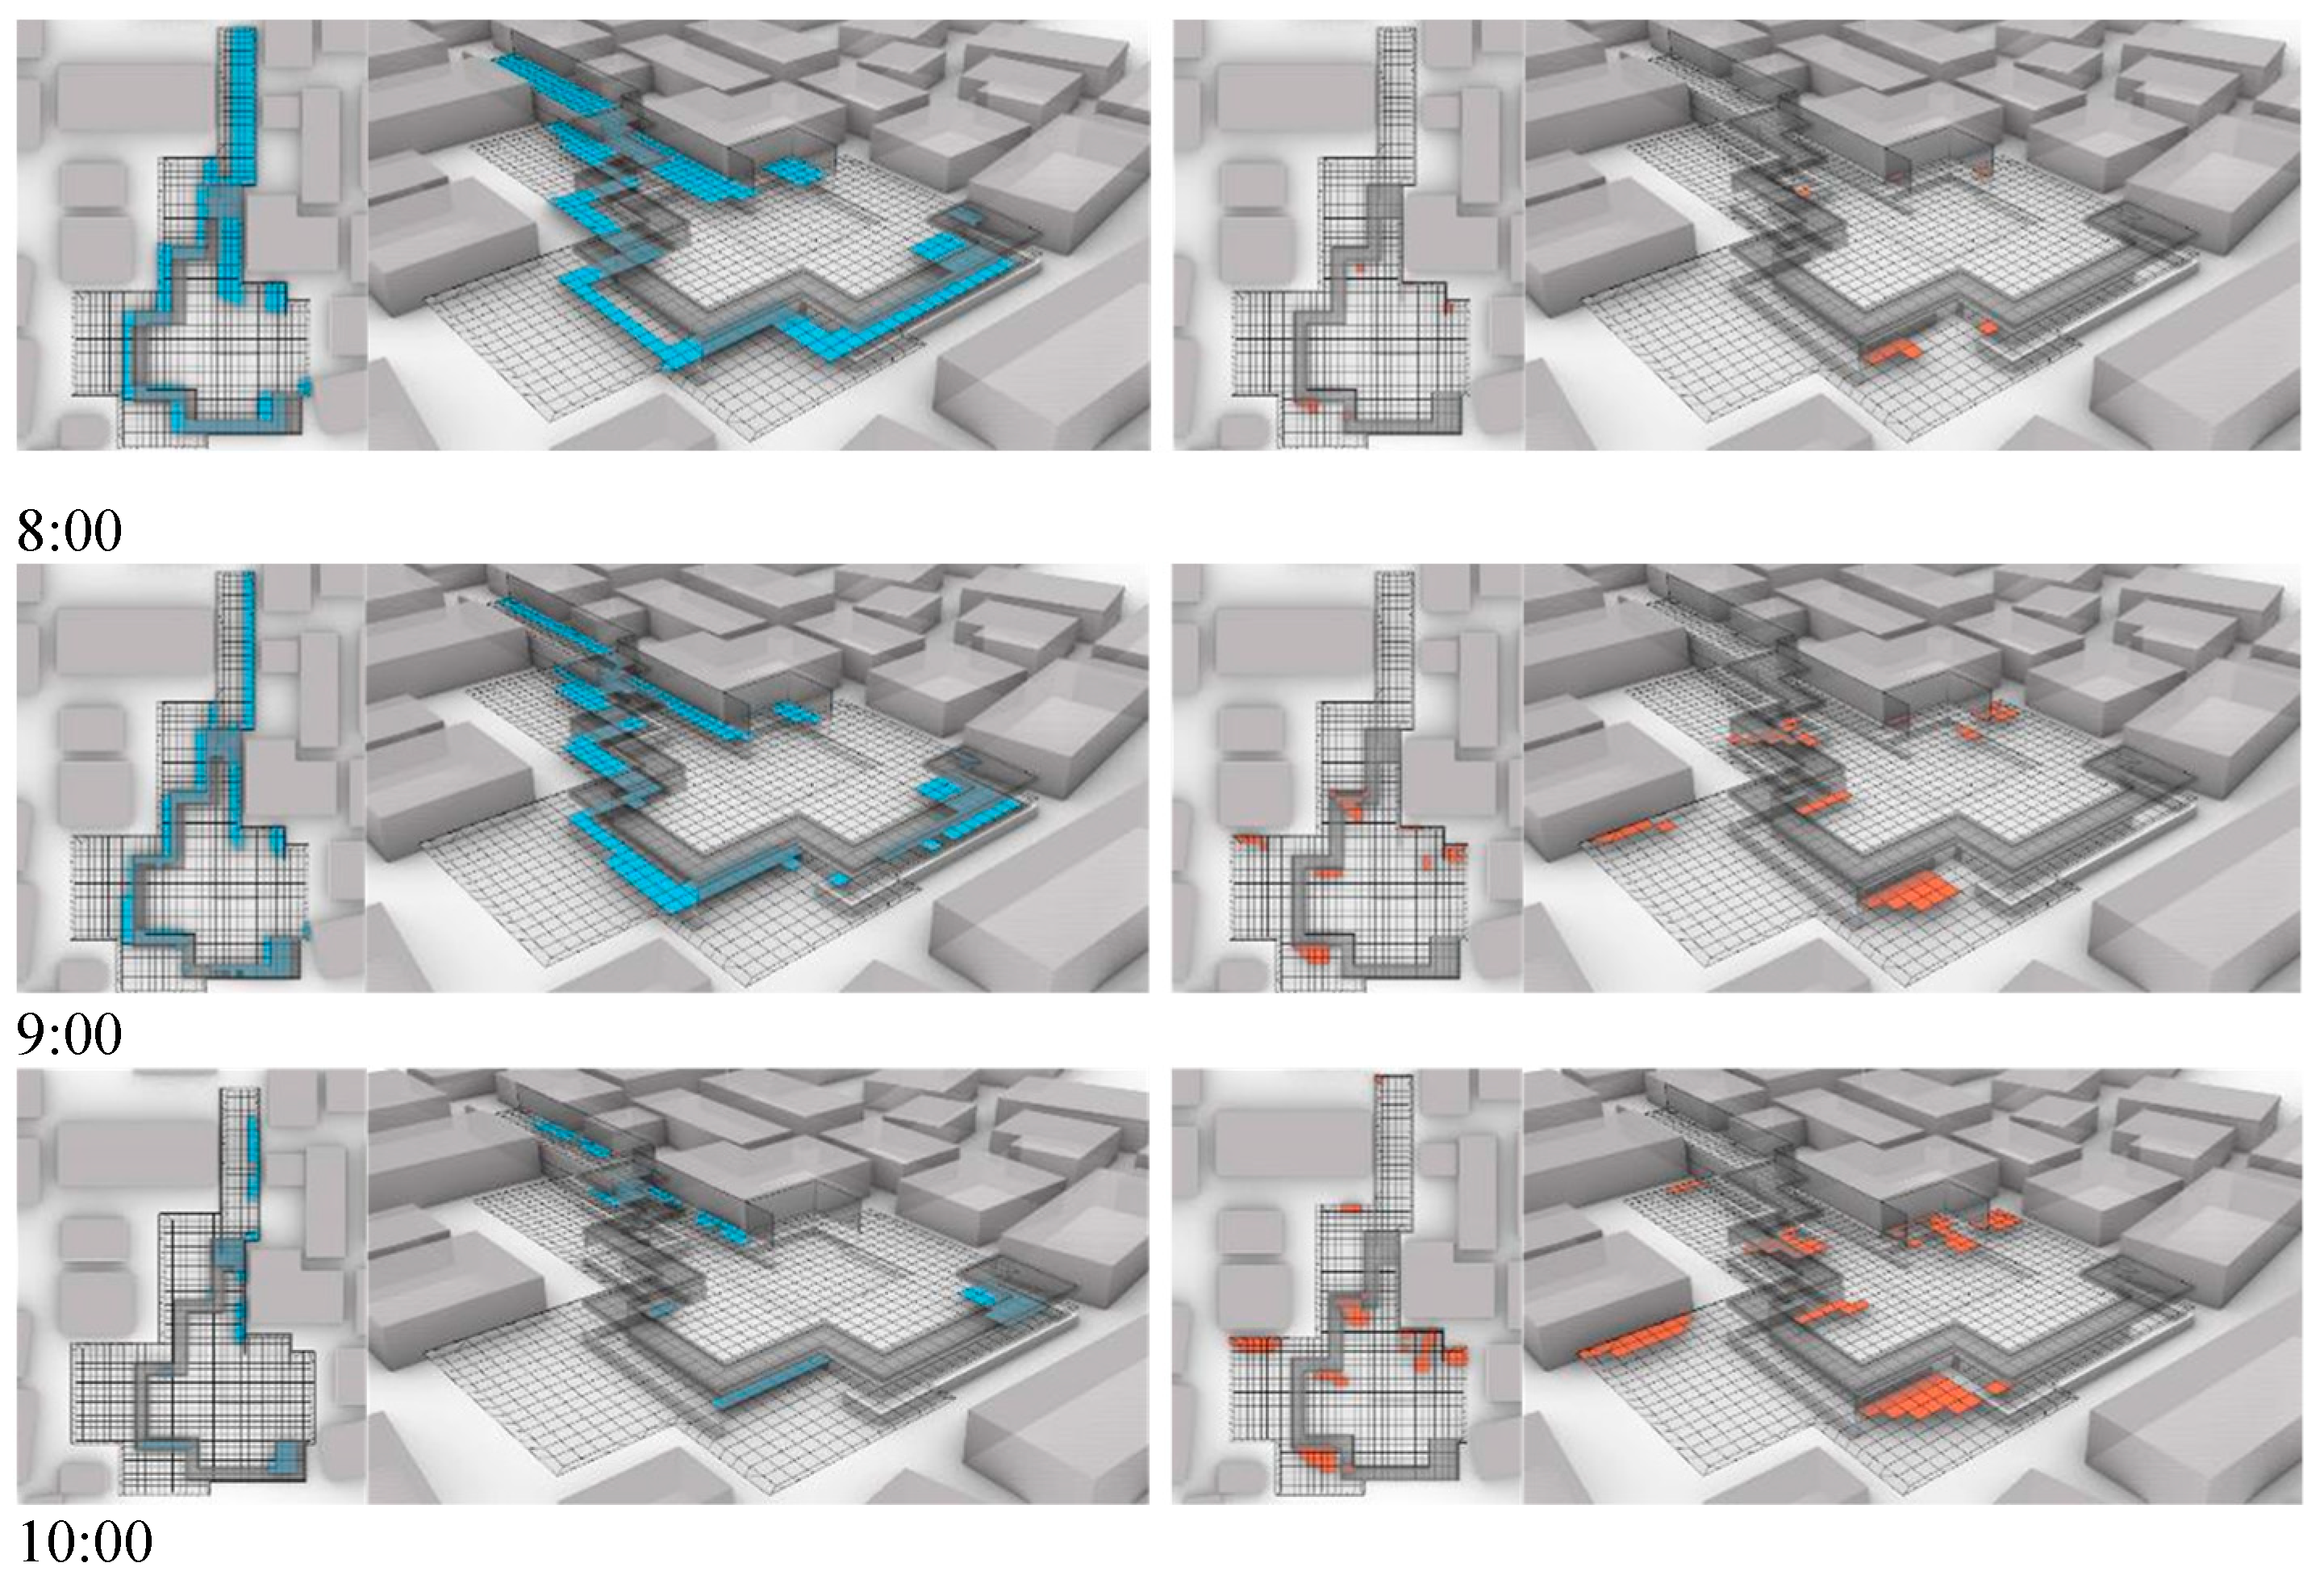
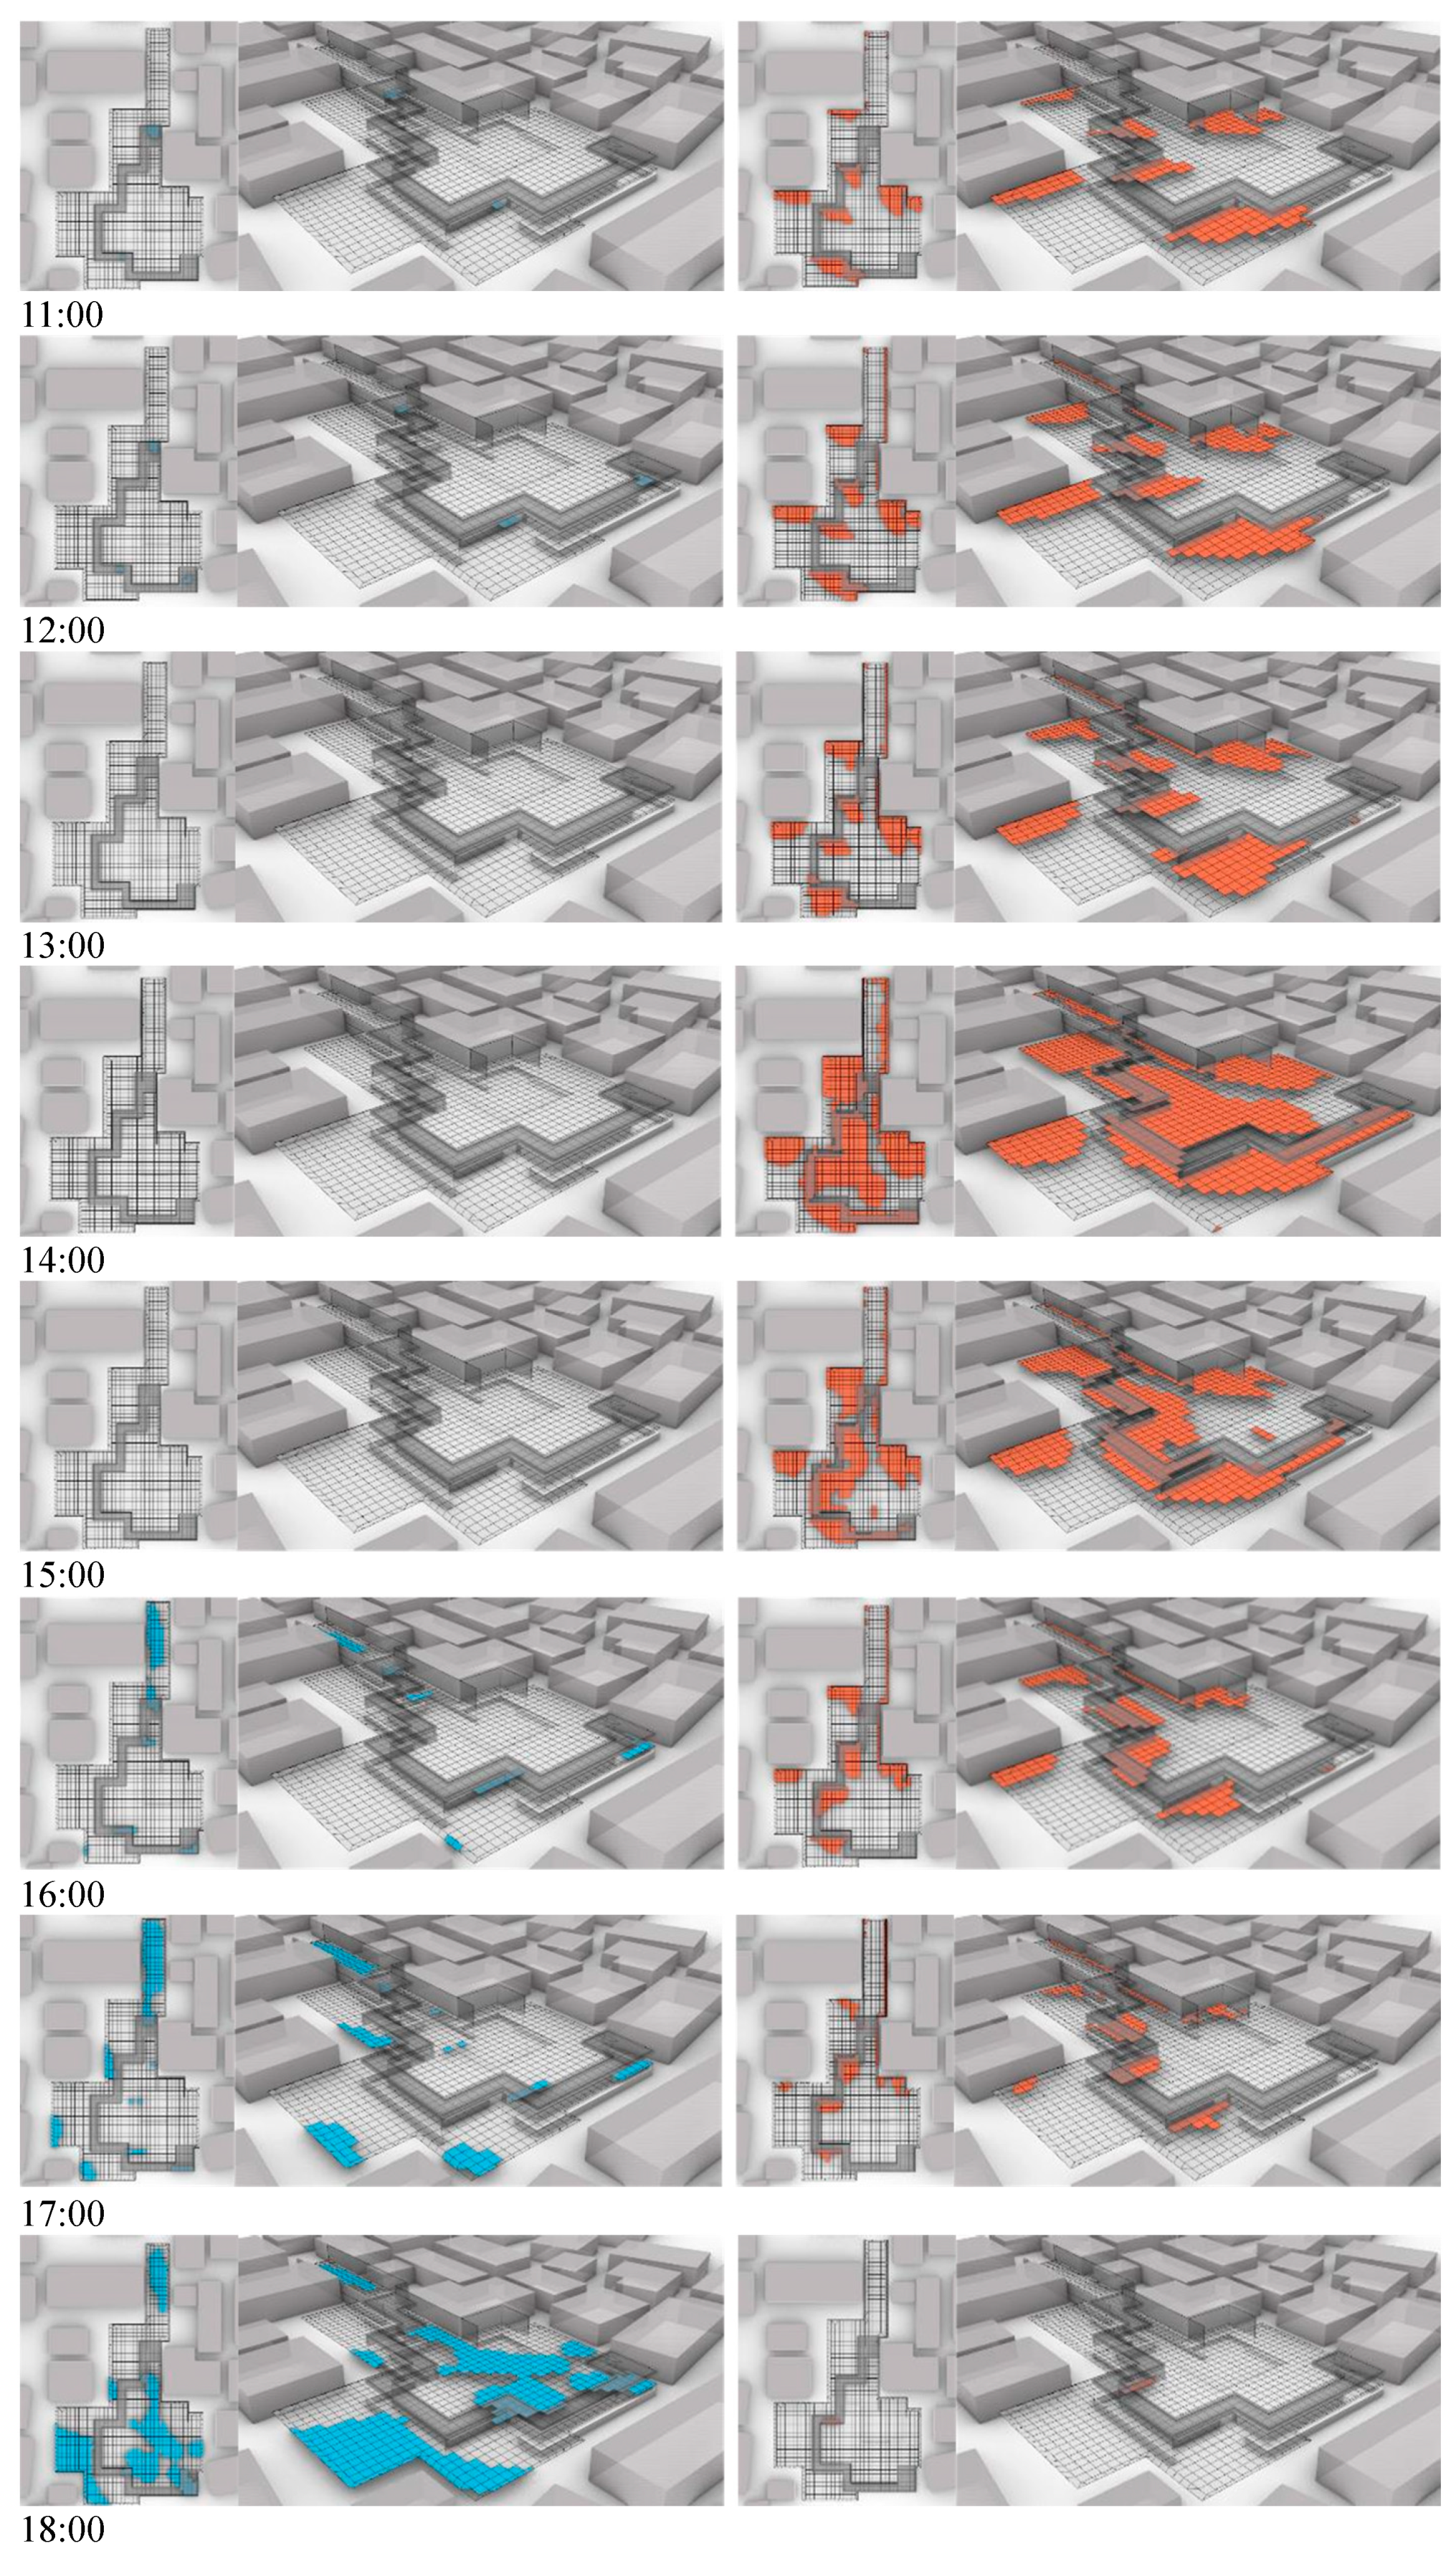
The study also found that many architect-designed “activity spaces” in residential areas were underused due to unfavorable thermal environments. In contrast, several unplanned “other spaces” that provide more comfortable thermal environments emerged as popular, spontaneous gathering spots for residents (
Figure 5).
5. Conclusions
This study highlights the critical role of outdoor thermal environments in shaping residents’ outdoor activities and offers novel insights into how climate-responsive design strategies can be optimized based on seasonal variations in thermal perception. Unlike conventional approaches that rely on generalized climate adaptation principles, our research integrates empirical data from on-site surveys to assess the impact of outdoor thermal conditions on residents’ behavior. This empirical approach allows us to refine outdoor design interventions that are directly aligned with the specific needs and preferences of residents across different seasons and activity periods.
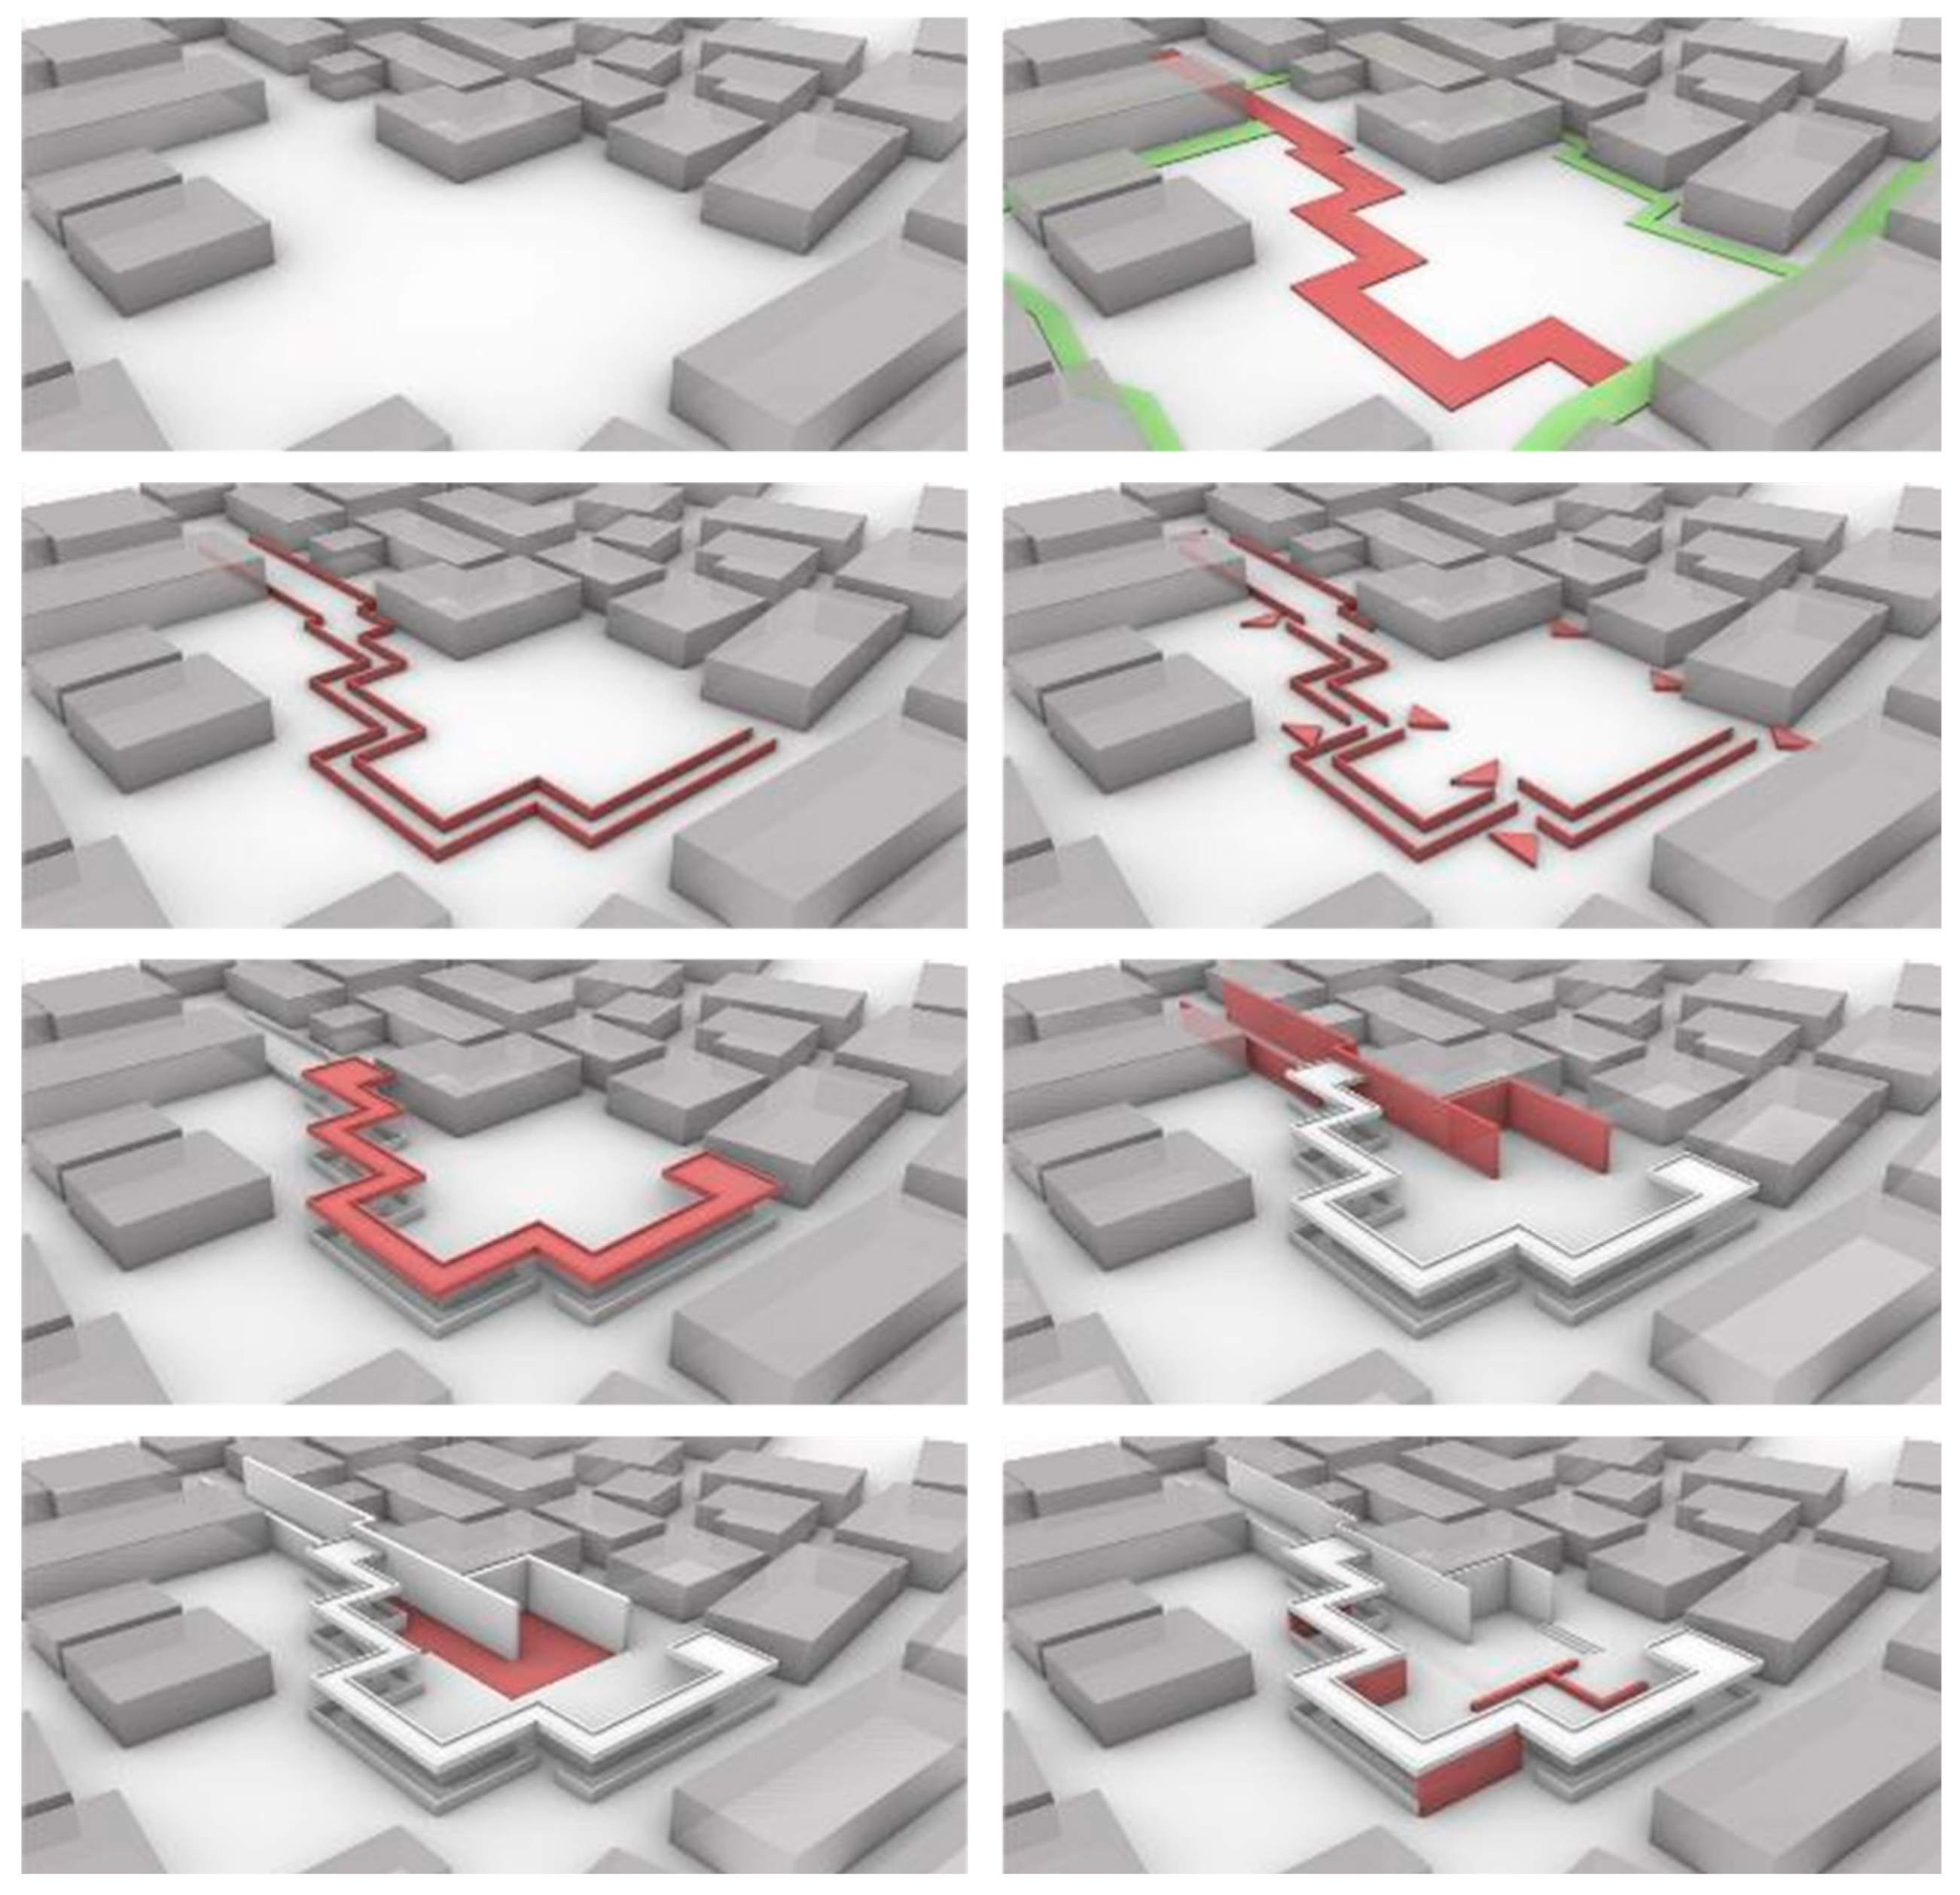
The key innovation of this study lies in the targeted optimization of outdoor spaces, designed to maximize comfort during peak activity times in both summer and winter within the same space. By accounting for seasonal variations and residents’ thermal comfort preferences, we ensure that outdoor environments support residents’ activities in both hot and cold seasons, thus enhancing the usability and livability of urban spaces throughout the year. While our proposed interventions, such as dynamic shading and wind barriers, are grounded in widely recognized principles of climate-adaptive design, their application in this study is distinguished by the consideration of specific activity patterns and the temporal dynamics of thermal comfort. This novel integration of seasonal activity timing with thermal comfort optimization provides a framework for future research to explore more precise, innovative design solutions suited to diverse environmental contexts.
This study contributes to the growing field of climate-responsive urban design, providing practical, data-driven strategies to improve outdoor thermal comfort while addressing the behavioral and environmental needs of residents. However, it is important to acknowledge the limitations of using the thermal sensation vote (TSV) questionnaire, which relies on subjective assessments of thermal comfort. The inherent subjectivity of this tool introduces variability in responses, influenced by individual biases and external factors, which may not fully capture the complexities of thermal perception. Additionally, the reliance on self-reported data may introduce potential biases that affect the accuracy of the findings. Future research will build upon these insights, exploring more innovative and adaptive design strategies for outdoor thermal environments. Beyond integrating more objective measures of thermal comfort, such as physiological responses, future studies will focus on exploring new spatial design techniques for outdoor spaces. The current study primarily employs conventional design strategies, but future research will investigate more efficient and novel spatial configurations, incorporating cutting-edge materials and layouts that better optimize thermal comfort. This approach will help create more resilient and sustainable urban outdoor environments, capable of meeting the evolving needs of urban communities in the face of changing climates and diverse behavioral patterns.

