Article

Experimental Study and Numerical Analysis of Hydration Heat Effect on Precast Prestressed Concrete Box Girder

1
College of Civil Engineering and Architecture, Zhejiang University, Hangzhou 310058, China
2
China Railway Major Bridge Engineering Group Co., Ltd., Wuhan 430050, China
*
Author to whom correspondence should be addressed.
Buildings 2025, 15(6), 859; https://doi.org/10.3390/buildings15060859
Submission received: 4 February 2025 / Revised: 2 March 2025 / Accepted: 5 March 2025 / Published: 10 March 2025

Abstract

Large-span precast prestressed concrete box girders have been widely used in bridge construction near or across the sea. However, this would easily lead to a hydration heat problem, including large initial tensile stress and concrete cracks during the stage of concrete pouring. A 5 m long segment of the prestressed concrete box girder for the Hangzhou Bay Cross-Sea Railway Bridge was continuously monitored to investigate the hydration heat effect on the long-span concrete box girder during the pouring stage of construction. The initial temperature variation and stress distribution of the concrete in the segment were analyzed through finite element analysis based on the experimental data and temperature monitoring results. A suitable concrete pouring and maintenance plan for the box girder was proposed after the comparison of several construction schemes. The results indicate that the primary cause of initial tensile stress is the temperature difference between the inner and outer surfaces of the long-span precast concrete box girder. By adding some ventilation inside the box girder with suitable maintenance measures, the initial tensile stress in the concrete can be effectively reduced, thus mitigating the risk of early cracking.

1. Introduction

Large-span precast prestressed concrete box girders, which are increasingly used in bridge construction, have the advantages of high structural stiffness, good structural integrity, strong bearing capacity, and a short construction period [1,2]. With the increase in span, the size of the box girder members would become much larger. In addition, the prestressed concrete uses high-strength concrete and the amount of cement is large, and the temperature rise caused by the hydration heat in the concrete hardening process will be higher, which would lead to temperature stress cracks in the box girder due to the large temperature difference between the interior and the surface [3,4,5]. Therefore, it is necessary to study the development law of hydration heat temperature and cracking mechanism [6,7].
Previous studies have primarily focused on the time-history variation in the temperature field in early cast-in-place concrete structures through numerical simulations and experiments. Several studies have investigated the early hydration heat process of box girder structures [8,9,10,11], bridge decks [12,13], and test sections [14,15]. However, limited research has been conducted on the hydration heat process specific to precast mass concrete box girders, and fundamental thermal parameters related to this process remain inadequately understood or documented. Zhang et al. [16] conducted research on the temperature field, incorporating factors such as solar radiation and atmospheric convection. The researchers proposed a novel approach to model the vertical temperature difference during concrete hydration for the first time in the context of three-cell box girders. Wei et al. [17] demonstrated that the cement hydration process is most intense during the initial reaction stage, with heat release increasing as the cement-to-sand ratio and slurry concentration rise, based on their study of the factors influencing the hydration heat of cemented tailing backfill. Schutter et al. [18] identified the degree of hydration as a key parameter for linking changes in material properties to the evolution of the chemical reaction. In their study of early hydration heat thermal conductivity, Dai et al. [19] examined how parameters such as the water-to-binder ratio, initial air content, and fly ash content affect the thermal conductivity during the hydration process. Lim et al. [20] presented an innovative approach for predicting the adiabatic temperature rise characteristics of large-scale concrete with excellent prediction capability. The proposed method combined a simulated semi-adiabatic process with numerical simulation to comprehensively analyze and predict the thermal behavior during the hardening phase.
The accurate simulation of the temperature field and stress field is the basis of research on the hydration thermal control of box girders and the analysis of the maintenance scheme, which could be very difficult in terms of the accurate simulation of the hydration thermal stress field for large concrete box girders. Some studies have used methods such as the uniaxial restraint test [21] and the digital image correlation method [22] to assess early concrete cracking behavior and cracking risk. Cai et al. [23] developed the “UMATHT” subroutine using “ABAQUS” software (2022), conducting numerical simulations and temperature monitoring tests on a 50 m precast box girder. By varying the concrete pouring temperature, cement dosage, and insulation material thickness, the variation law of the early temperature field of the box girder was studied. Tu et al. [24] developed the “UCRST” subroutine for early creep and thermal stress analysis, and studied the effects of pouring time, pouring season (summer and winter), initial temperature changes in concrete, and insulation on the risk of cracking in early cast-in-place box girder sections. Considering the evolution of hardening concrete over time and space, Qiao et al. [25] simulated the thermal stress distribution and development of the entire pouring process based on the user development subroutine of “ANSYS” software (2021).
Proper maintenance conditions can help prevent early cracking in large-volume box girders to some extent. However, the effect of curing methods on the temperature field of precast box girders has not been extensively studied. Liu et al. [26] undertook extensive temperature measurements and finite element modeling on a combined girder bridge, following a rigorous validation of the finite element method prior to implementing parametric studies to investigate the hydration temperature distribution patterns over space and time. Yu et al. [27] carried out a numerical analysis to identify the primary factors influencing mass concrete cracking, taking into account engineering practices. Lee et al. [28] summarized a generalized rate constant model for predicting the compressive strength of early prestressed concrete by testing high-early-strength concrete with different conditions. Zeng et al. [29] analyzed the pros and cons of two innovative combined curing methods, ultimately recommending the mold paste and automatic water spray method for summer curing operations by examining temperature time-history curves at key nodes in a box girder’s inner and outer surfaces.
In this work, the hydration heat temperature of the concrete in a 5 m long segment of a precast box girder is continuously monitored. Using both the monitoring data and in situ measurements of the concrete’s early-age mechanical properties, a time-varying model is developed using the finite element method. This model is subsequently employed to analyze the hydration heat characteristics of concrete while exploring the evolution mechanisms of temperature and stress fields generated by hydration. Through the comparison of various pouring and maintenance schemes, on-site implementation suggestions for the construction of precast concrete box girders are proposed.

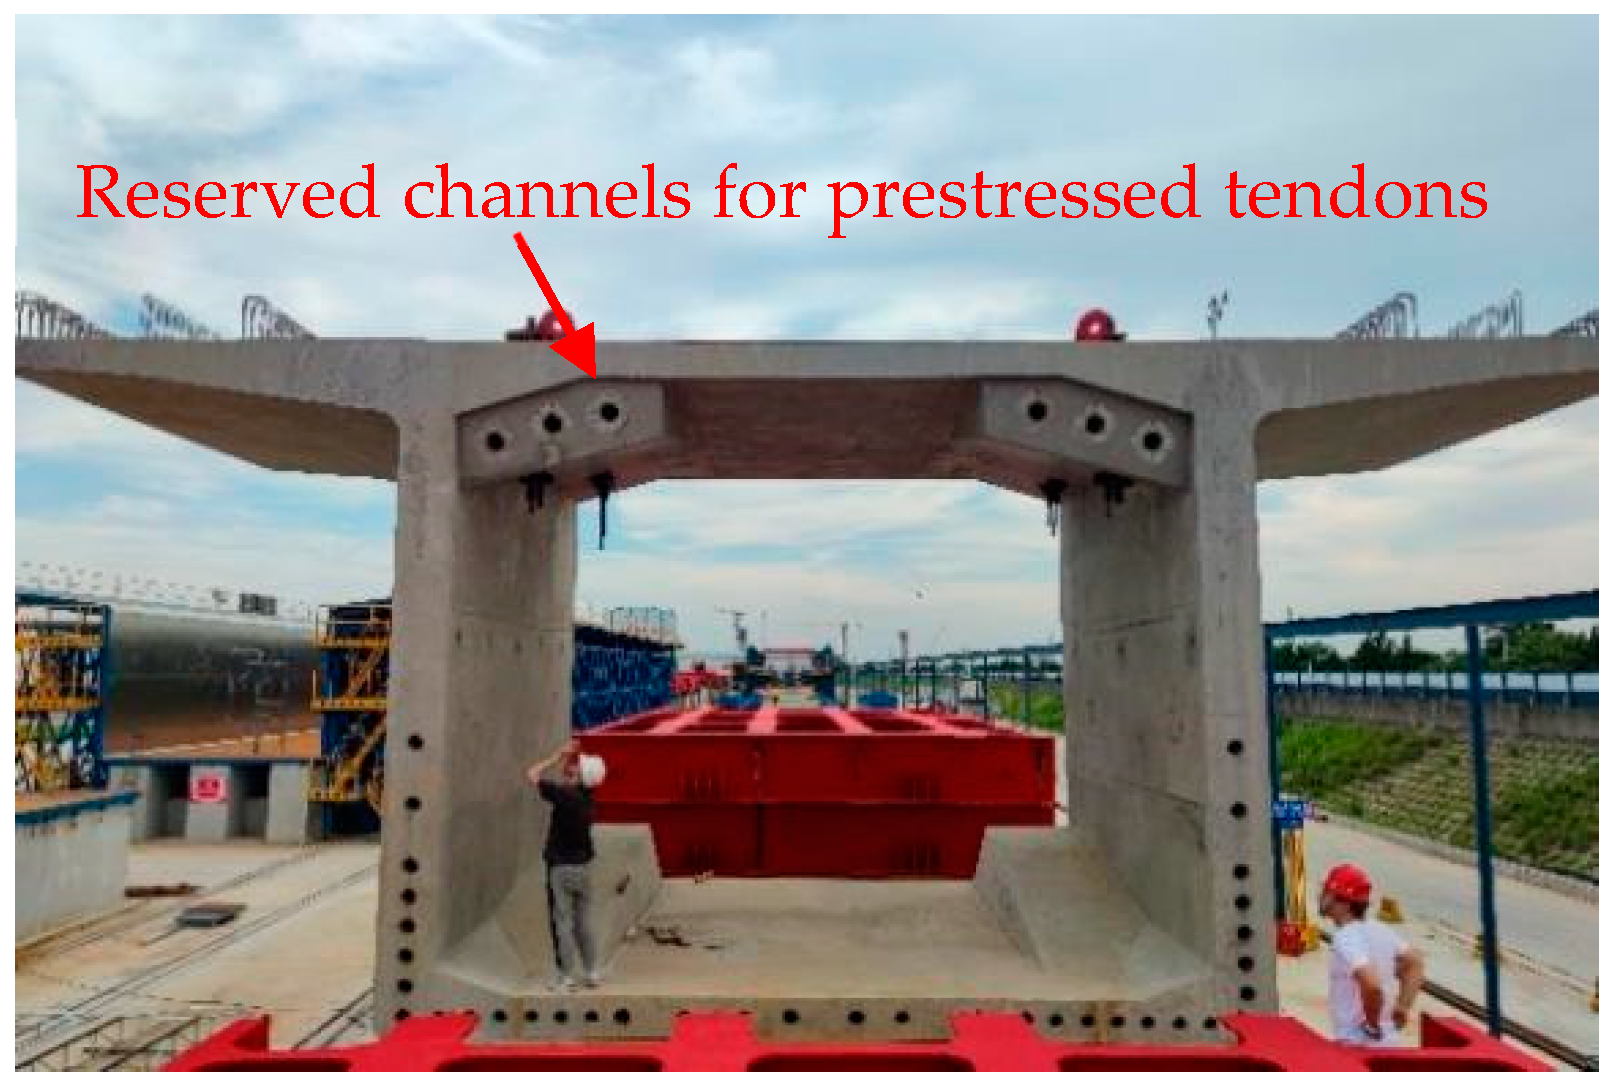
2. Background of the Project

The total length of the approach bridge of Hangzhou Bay Cross-Sea Railway Bridge is about 17,900 m. The upper structure adopts 80 m/60 m concrete continuous beams. The span arrangement is 60 + n × 80 + 60 m. The whole bridge has 10 links. The longest link is 3080 m. First, simple support and then continuous construction is adopted for the whole prefabrication. The 80 m/60 m precast box girder adopts a prestressed reinforced concrete structure with a design strength of C55. The roof thickness of the mid-span section is 0.285 m, with a bottom thickness of 0.3 m, and a web thickness of 0.43 m, as shown in Figure 1.
The substantial dimensions of the precast box girder components and the high-strength concrete material present notable quality control challenges during the following critical construction phases: steel reinforcement fabrication/installation, formwork setup, concrete pouring, and curing processes. As shown in Figure 2, a 5 m long prestressed concrete segment was built to conduct the experimental investigation. The high-strength concrete formulation, characterized by elevated cement content, a reduced water–binder ratio, and rapid hydration heat generation, induced shrinkage and thermal stresses that primarily led to early-stage cracking in the box girders. Consequently, temperature monitoring was conducted during the initial curing phase of the concrete.

3. Experimental Investigation

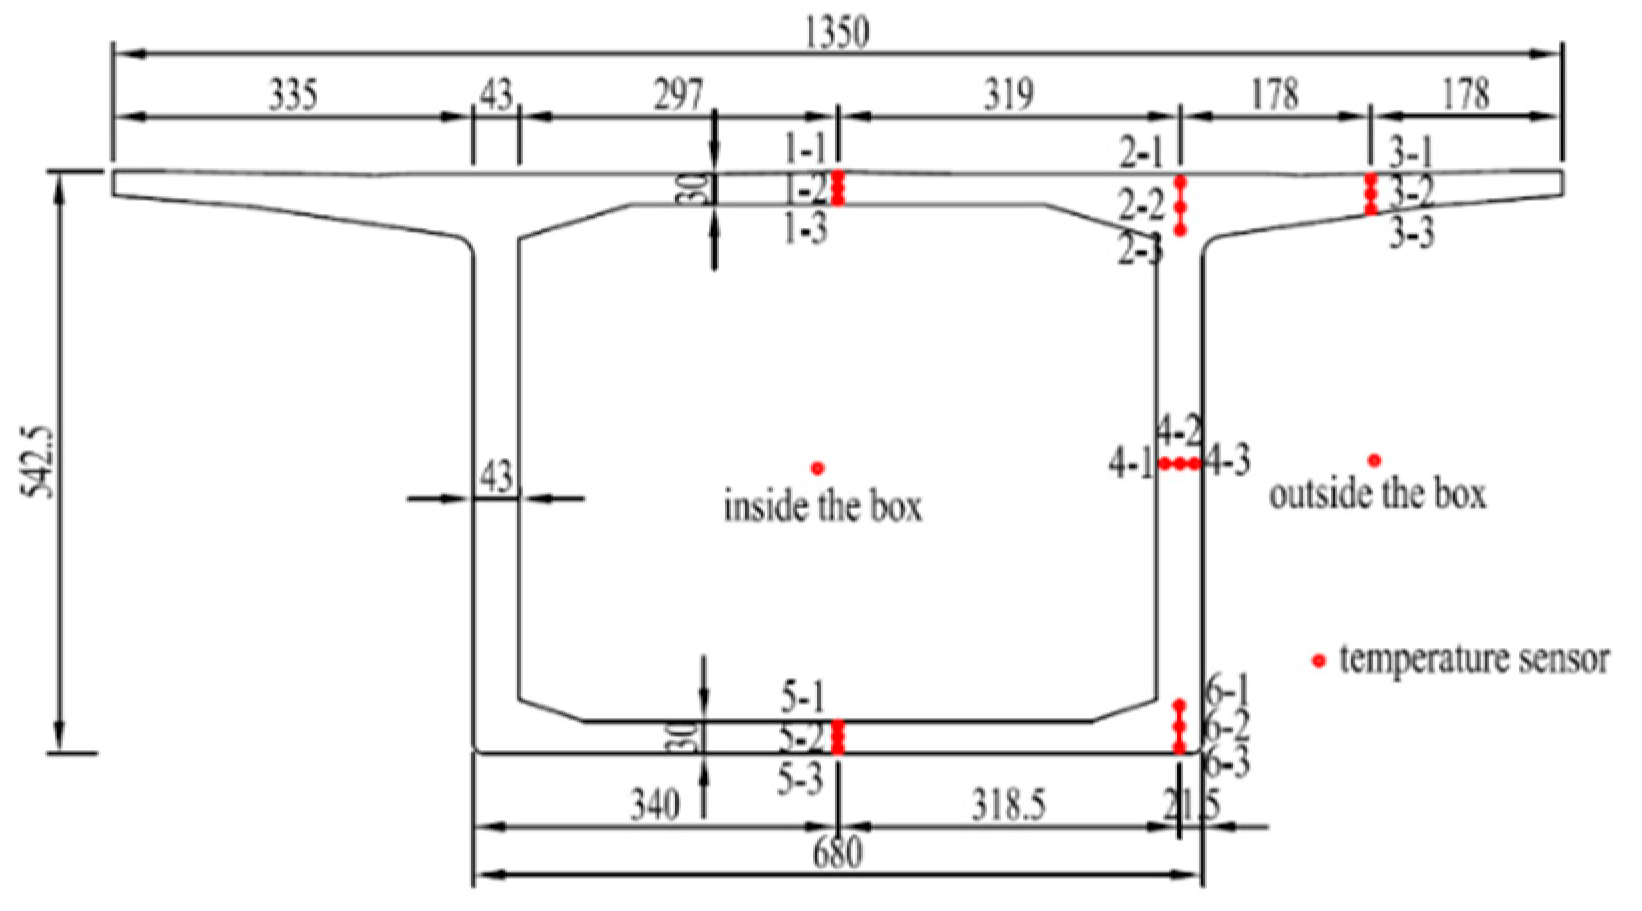
3.1. Distribution of Temperature Measurement Points

The hydration heat monitoring section of box girder concrete was arranged in the middle section of the 5 m long beam section. According to the symmetry of the box girder section, half a box girder was selected as the monitoring object and divided into six characteristic parts. The six monitoring divisions were located in the top plate, the top of the web, the flange plate, the middle of the web, the bottom of the web, and the bottom plate. Three measurement points were arranged in each part, resulting in eighteen temperature measurement points all together. Furthermore, temperature measurement points were installed individually at both internal and external locations of the box girder. Main technical parameters of the temperature sensors: sensitivity: 0.1 °C; accuracy: ±0.5 °C; measuring range: −30 °C~120 °C. The devices at each measurement point were set to collect and upload temperature monitoring data every 10 min. In Figure 1, the detailed arrangement plan is illustrated.

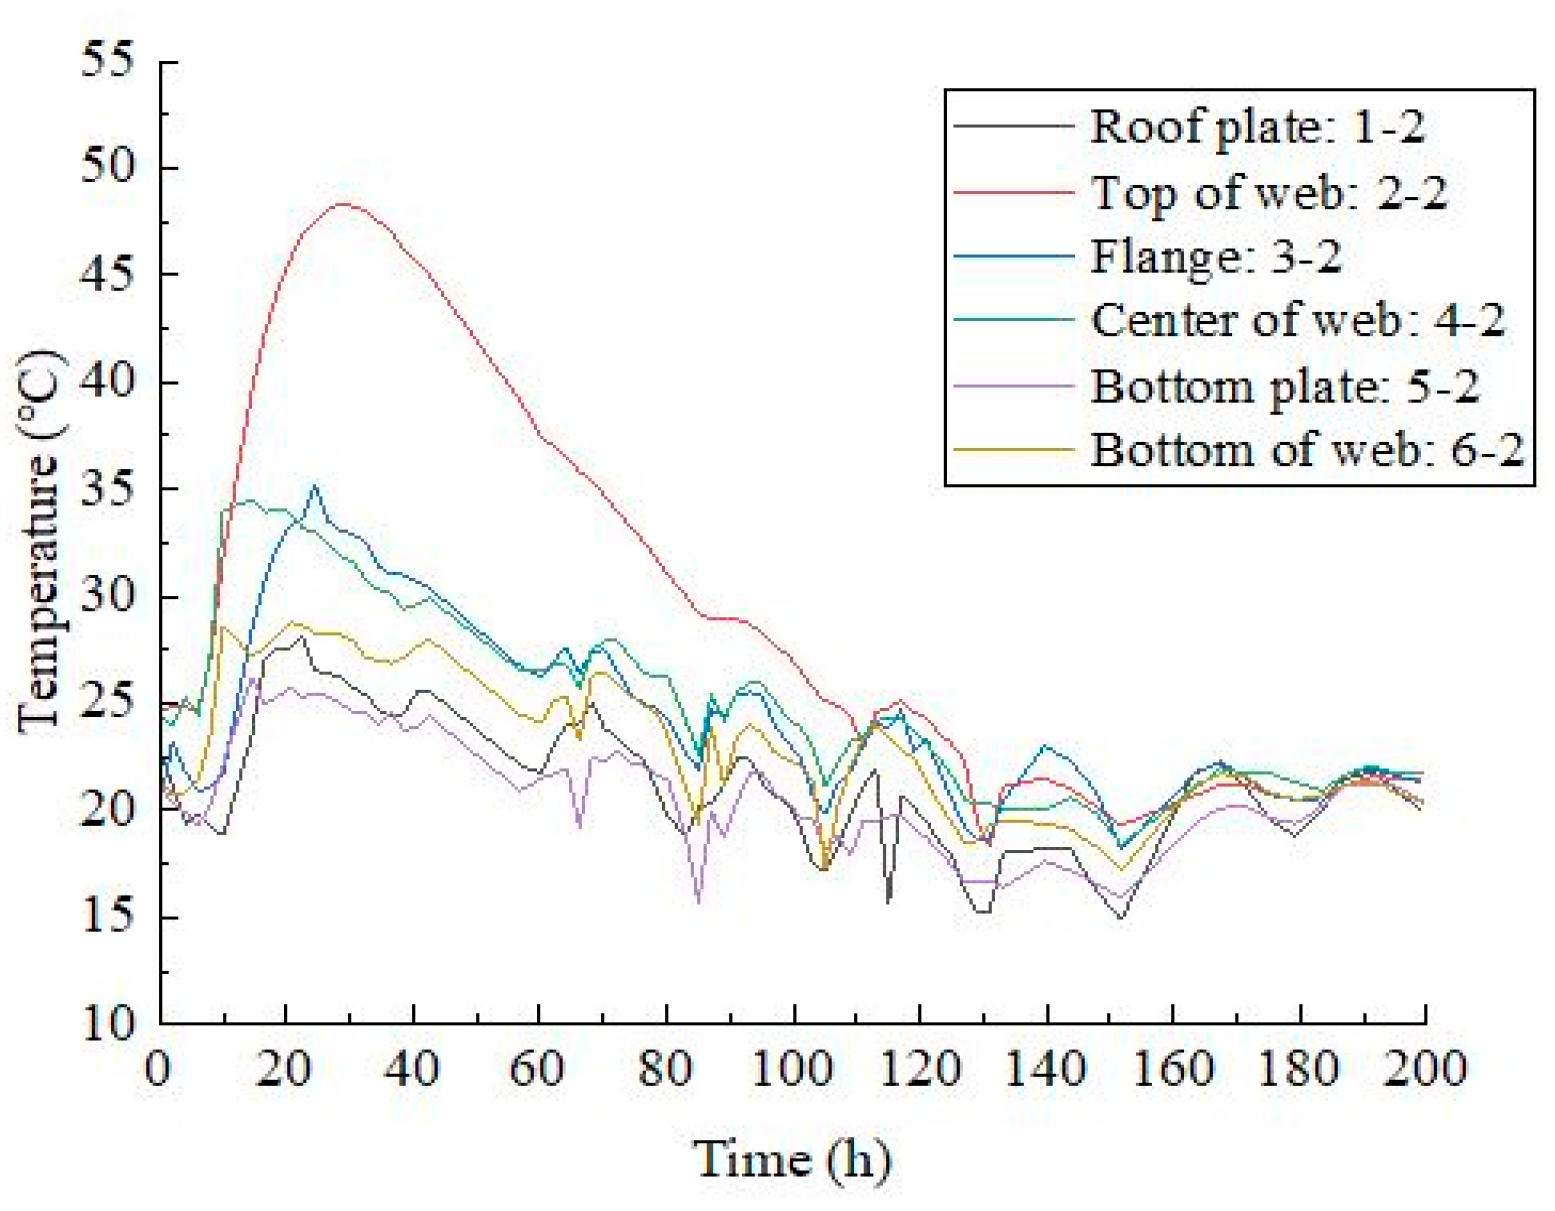
3.2. Results of Temperature Monitoring Points

The highest-temperature measurement points from six monitoring zones were selected to generate temperature time-history curves, as shown in Figure 3. Analysis revealed that measurement point 2-2 reached the maximum recorded temperature of 48.3 °C at 28.5 h post-pouring, representing the peak temperature observed throughout the segment’s curing process relative to the initial concrete placement temperature of 24 °C, which corresponds to a temperature increase of 24.3 °C. The temperature of measurement point 2-2 is significantly higher than that of the other measurement points. This indicates that the temperature generated by the hydration heat of concrete is related to the size of the component, which means that the larger the size, the higher the temperature. The time taken by the measurement point to reach the peak temperature is essentially proportional to the distance between the measurement point and the component surface. The smaller the distance, the shorter the time to reach the peak temperature. These observed patterns align with fundamental heat transfer principles.
Figure 4 shows the time-history curve of temperature difference on the inner surface of each measurement area. According to Figure 4, the temperature difference in the monitoring area 2 is the largest, reaching 10.5 °C, which appears earlier than in other areas. This phenomenon indicates that the internal temperature of concrete in the early stage of hydration heat rises sharply, resulting in a sudden increase in the temperature difference between the interior and the surface of the measurement points in each measurement area of concrete. Following peak thermal differentials, the external ambient temperature induced fluctuations in concrete core-surface temperature gradients. In summary, all measurement zones maintained core-surface differentials below 15 °C throughout the monitoring period, complying with established specification limits.

4. Finite Element Analysis

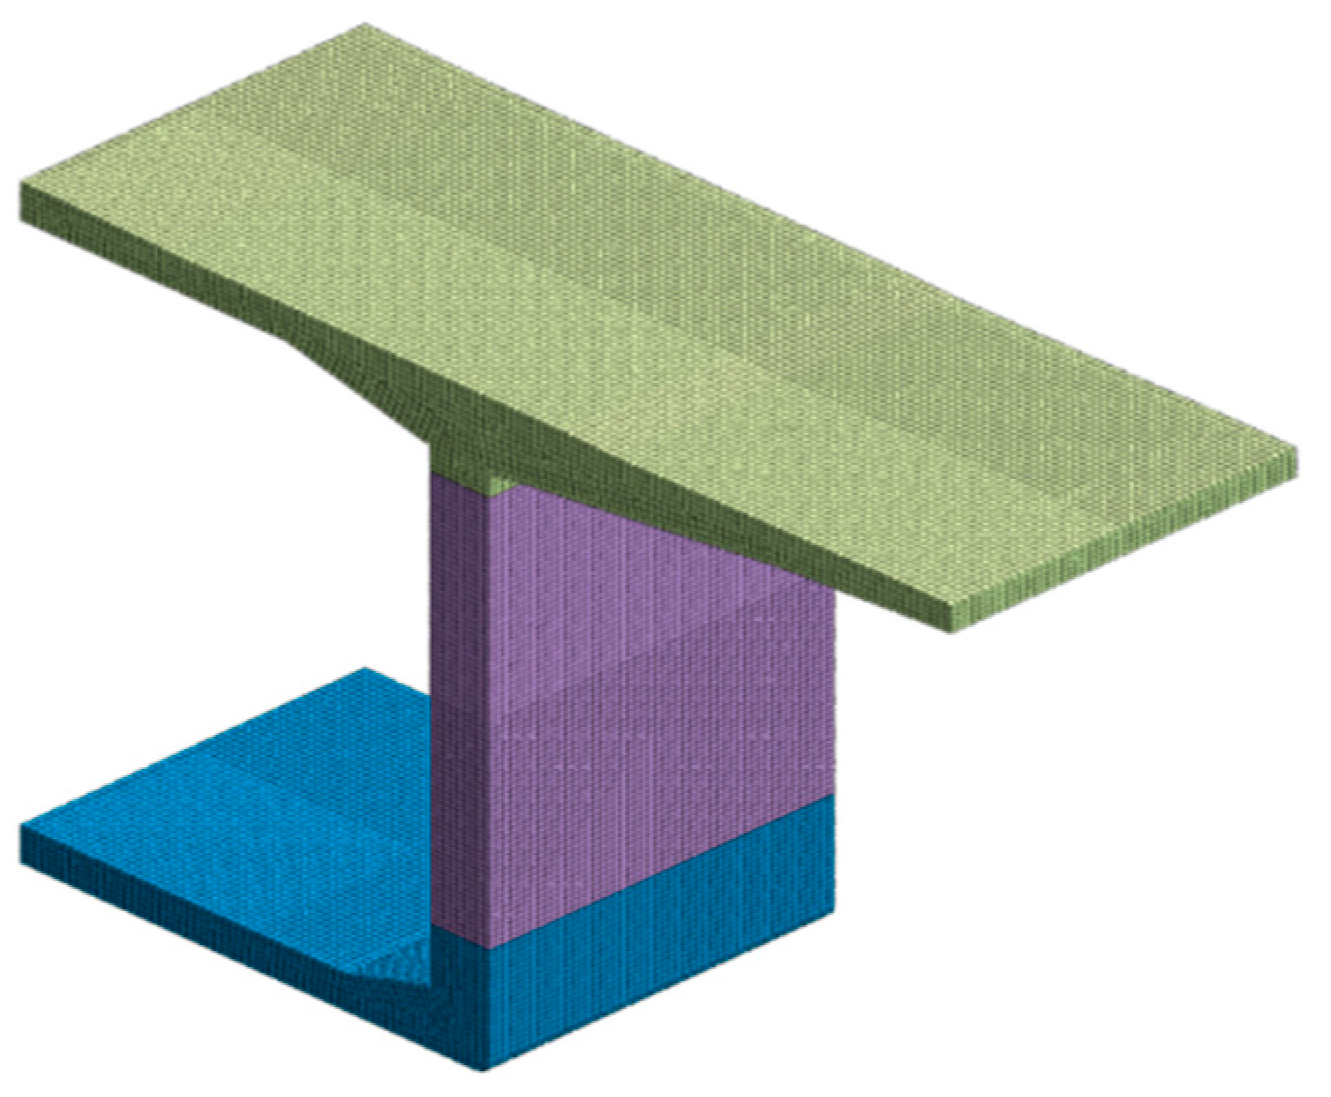
4.1. Finite Element Model

The experimental segment featured a 5 m concrete pour. According to the symmetry principles, a quarter-scale 3D model of the box girder section was developed. Thermal material properties were defined in Midas FEA NX software (2022) using concrete coefficient specifications. The three-dimensional solid model was established using a hexahedron-dominated hybrid grid element with a unit size of 50 mm, containing 122,935 nodes and 109,030 cells, among which there were 3916 steel bar joints and 3500 steel bar elements. The finite element modeling framework of the box girder with prefabricated segments is demonstrated in Figure 5.
The displacement boundary conditions in the model are simplified according to the actual field situation: the underside of the bottom plate is restricted only in the upward direction, and the symmetric surface is restricted only in the direction perpendicular to the section.

4.2. Model Parameters

4.2.1. Concrete Characteristics

The precast box girder is made of C55 concrete, and the mix ratio parameters and thermal parameters determined after monitoring are shown in Table 1. According to Table 1, the concrete thermal conductivity λ = 2.521   W / ( m · ° C ) and the specific heat capacity C = 0.923   k J / ( k g · ° C ) . The coefficient of thermal expansion is 1.0 × 10⁻⁵. The detailed material properties are shown in Table 2.
The compressive strength, tensile strength, elastic modulus, shrinkage, and creep of concrete are defined as time-dependent functions according to the norm literature [30].

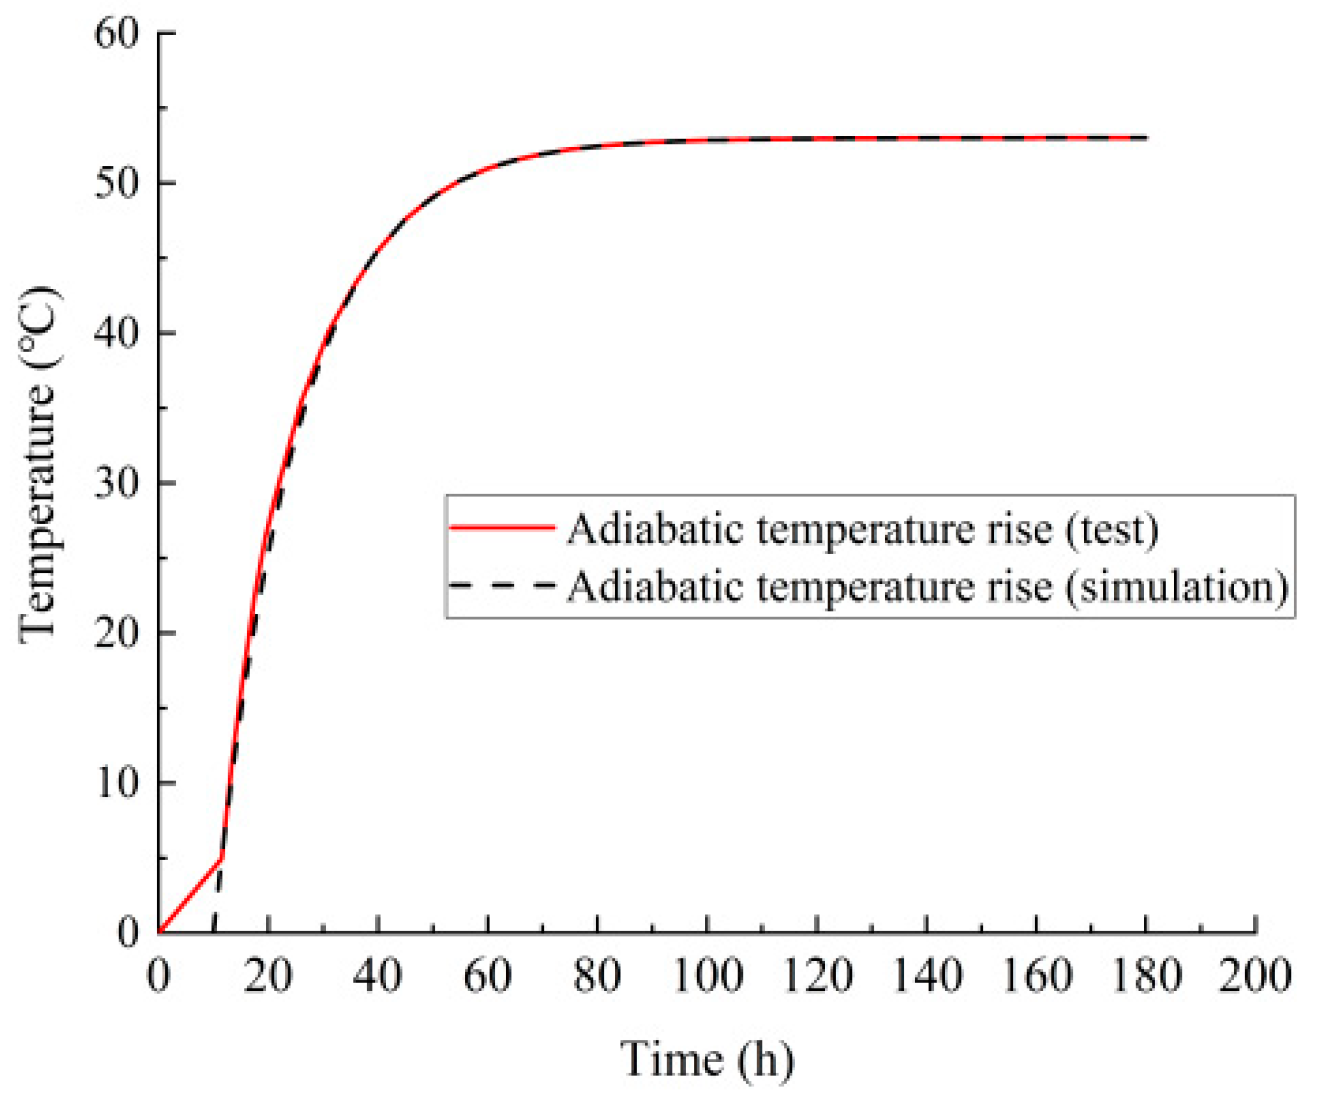
4.2.2. Thermodynamic Parameters of Concrete

In the analysis of the temperature field, the heat released by cement hydration was assumed as the heat source in the hydration heat simulation. The experimental adiabatic temperature rise curve was determined through experimental monitoring. The heat source generated by cement hydration was calculated according to the heat source function, as shown in Equation (1):
Q ( t ) = Q i n t ( 1 e r ( t t 0 ) )
where Q t is the concrete temperature at time t ; Q i n t is the maximum adiabatic temperature appreciation, which is determined by experiments and whose value is 53 °C; r is the reaction speed coefficient, and the fitting value is 0.06516 ( 1 / h ) according to the experimental data, as shown in Figure 6; and t 0 is the starting time of the heat source.
The equivalent convection coefficient was used in the finite element software to represent the heat exchange capacity between the cast and the convection boundary template. The heat transfer coefficient was calculated as Equation (2) [31]:
β s = 1 R s ,   R s = i = 1 n δ i λ i + 1 β u
where β s is the total heat transfer coefficient, R s is the total thermal resistance of the insulation layer, λ i is the thermal conductivity of layer i of the insulation material, β u is the heat transfer coefficient of solids in air, and δ i is the thickness of layer i of the insulation material.

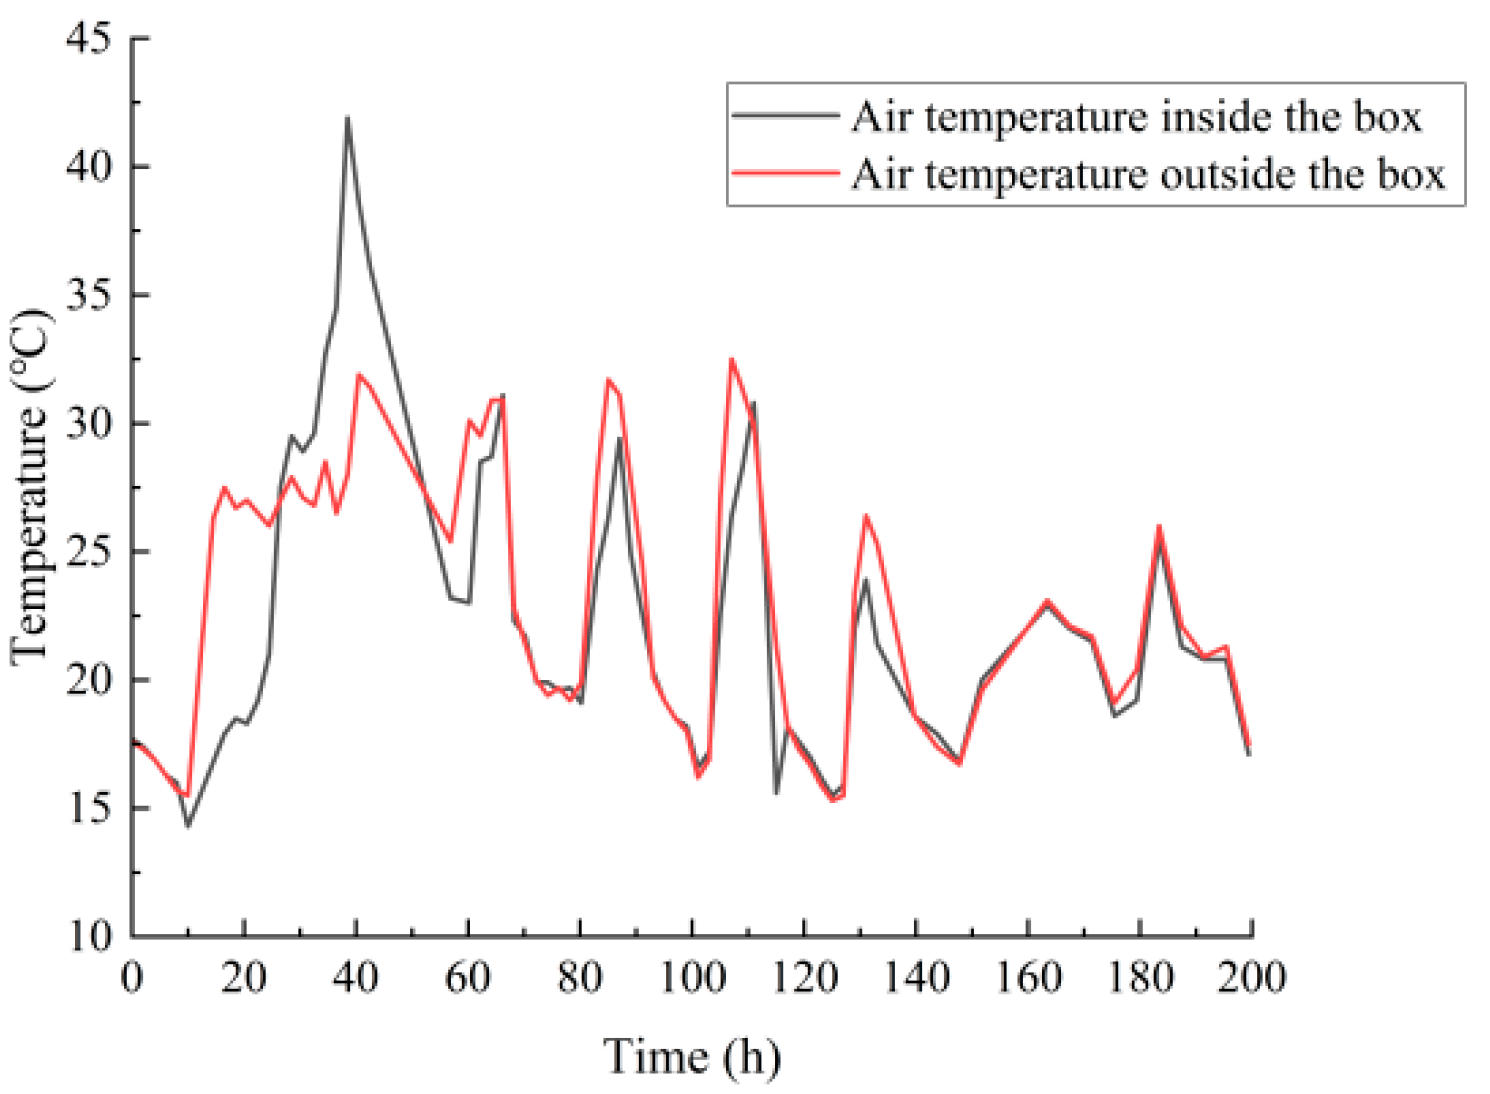
4.2.3. Measurement of Environmental Temperature

The fluctuation of the external environment has significant influence on the early hydration heat process of concrete. To accurately simulate thermal boundary conditions, the model incorporated empirical thermal profiles from the box girder’s internal and external monitoring systems. Figure 7 shows the measured time-history curve values of the external and internal ambient temperature of the box girder in 200 h during concrete pouring.

4.3. Construction Phase

The hydration heat construction stage can be divided into four parts: floor pouring stage, web pouring stage, roof pouring stage, and maintenance stage, of which the maintenance stage is subdivided into two periods, a total of 204 h. The pouring temperature was set at 24 °C. The simulation duration and size of each step are shown in Table 3.

4.4. Analysis of Calculation Results

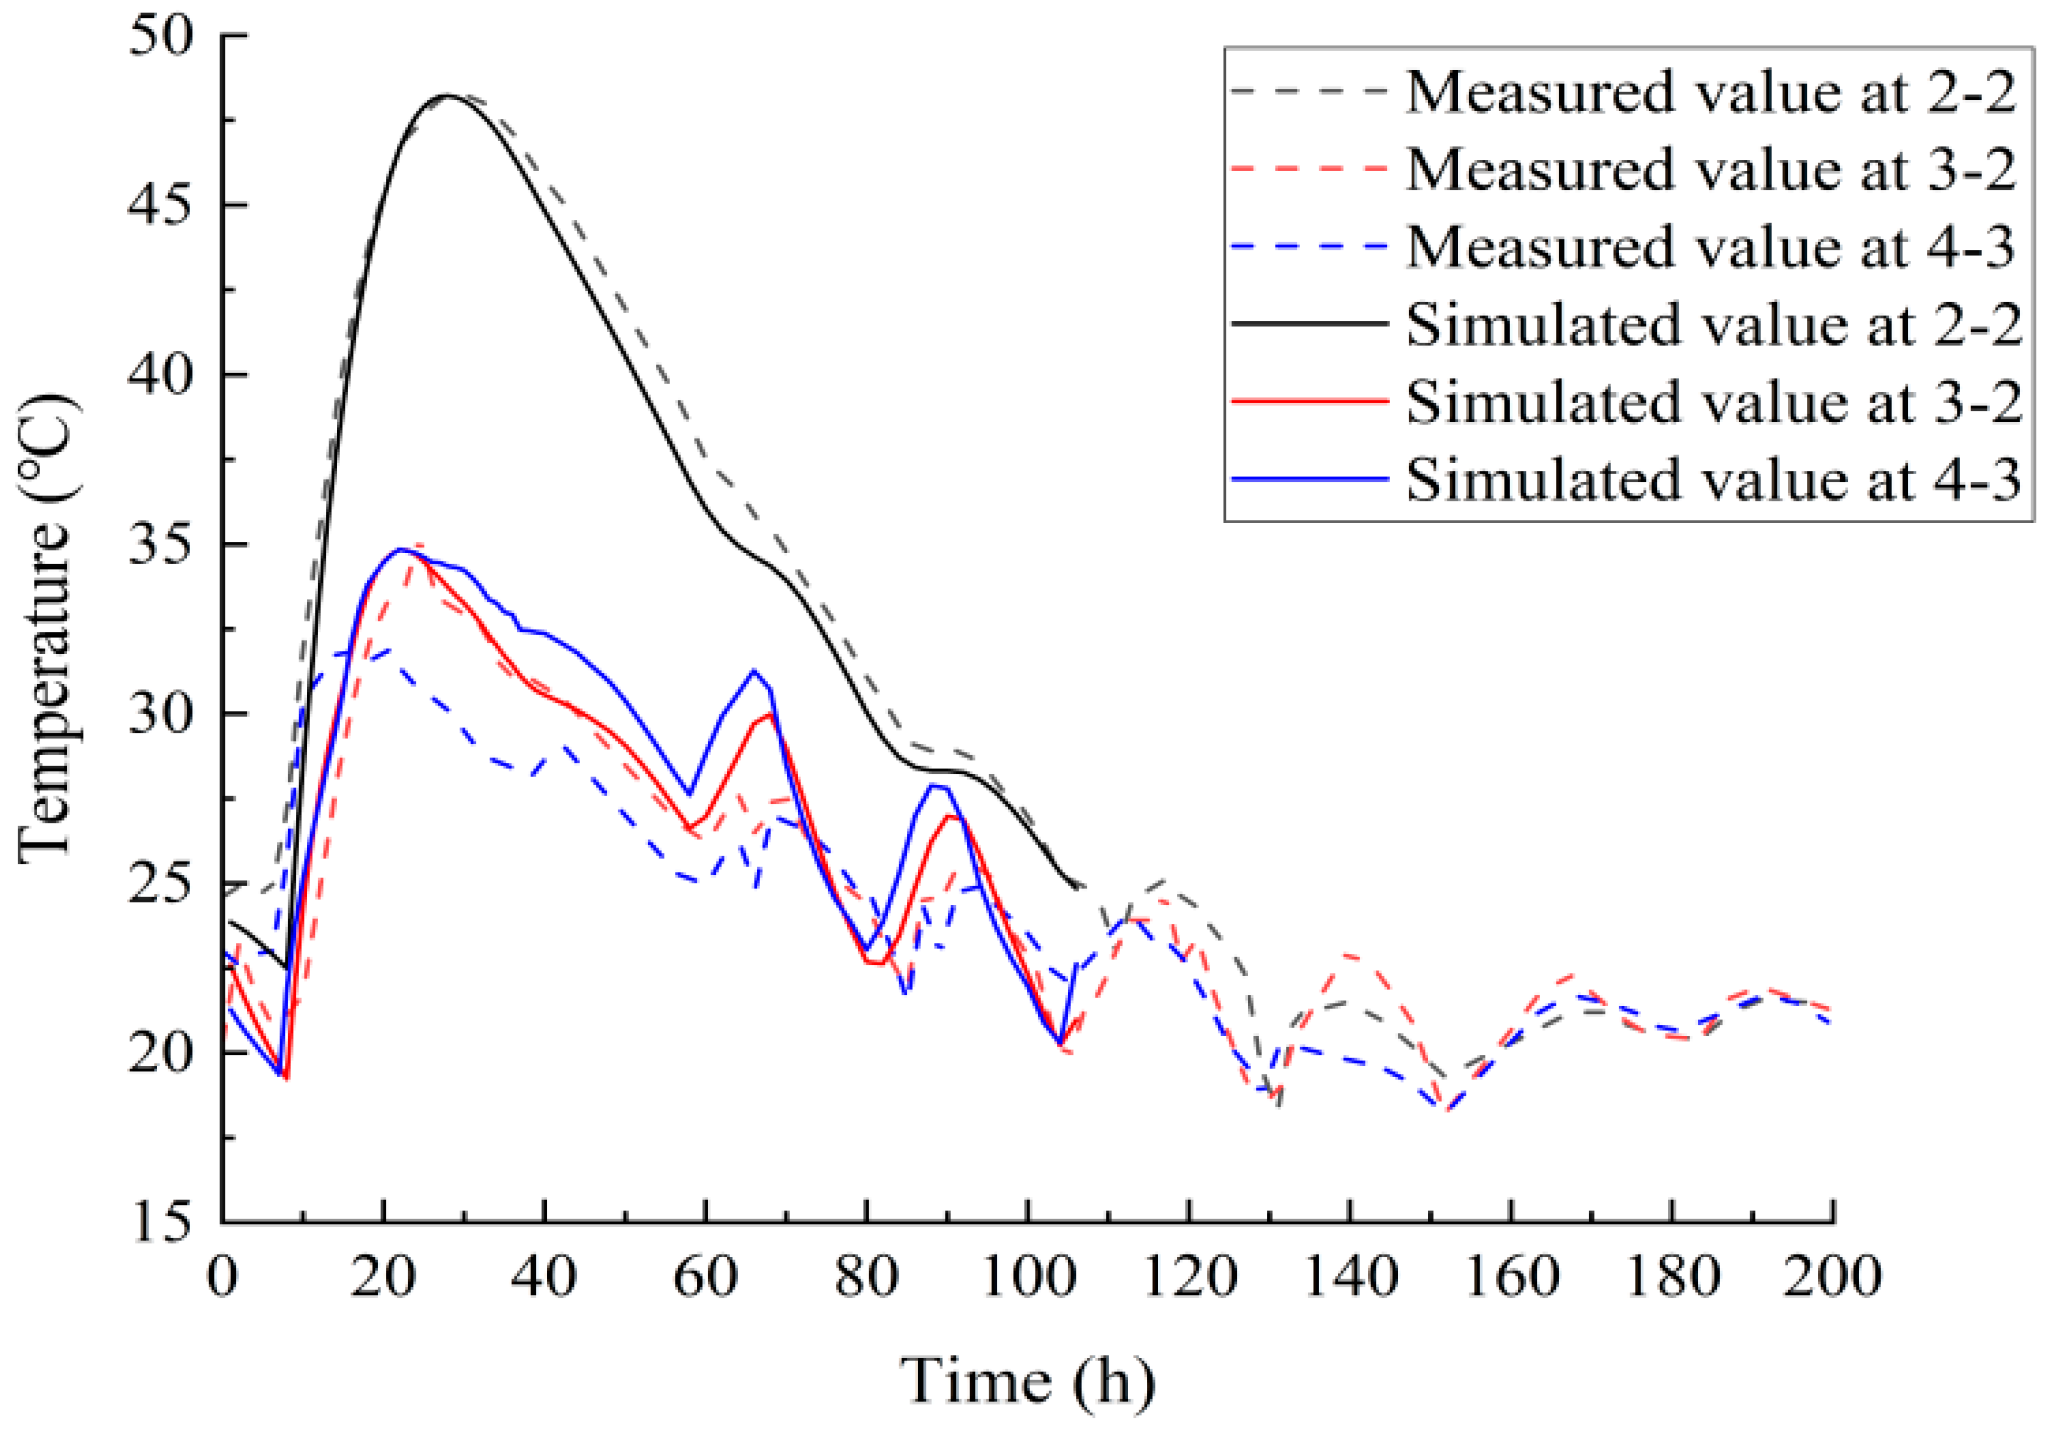
4.4.1. Analysis of Temperature Time History

Figure 8 shows the comparison between the measured temperature and the time-history curves of the finite element calculation at measurement points 2-2, 3-2, and 4-3. As depicted in Figure 8, the computed temperature distributions at three key locations show a strong correspondence with the experimentally measured time histories. Notably, node No. 367179 in the model reaches the highest temperature of 48.36 °C 28 h after concrete pouring, with an error of only 0.12% compared with the measured value at measurement point 2-2, while maintaining temporal synchronization in maximum temperature occurrence. It is shown that the finite element model established in this paper can well simulate the actual temperature effect of hydration heat and its development process in the 5 m long segment of the box girder, and can provide reference for the subsequent analysis of the hydration heat of an 80 m concrete box girder.

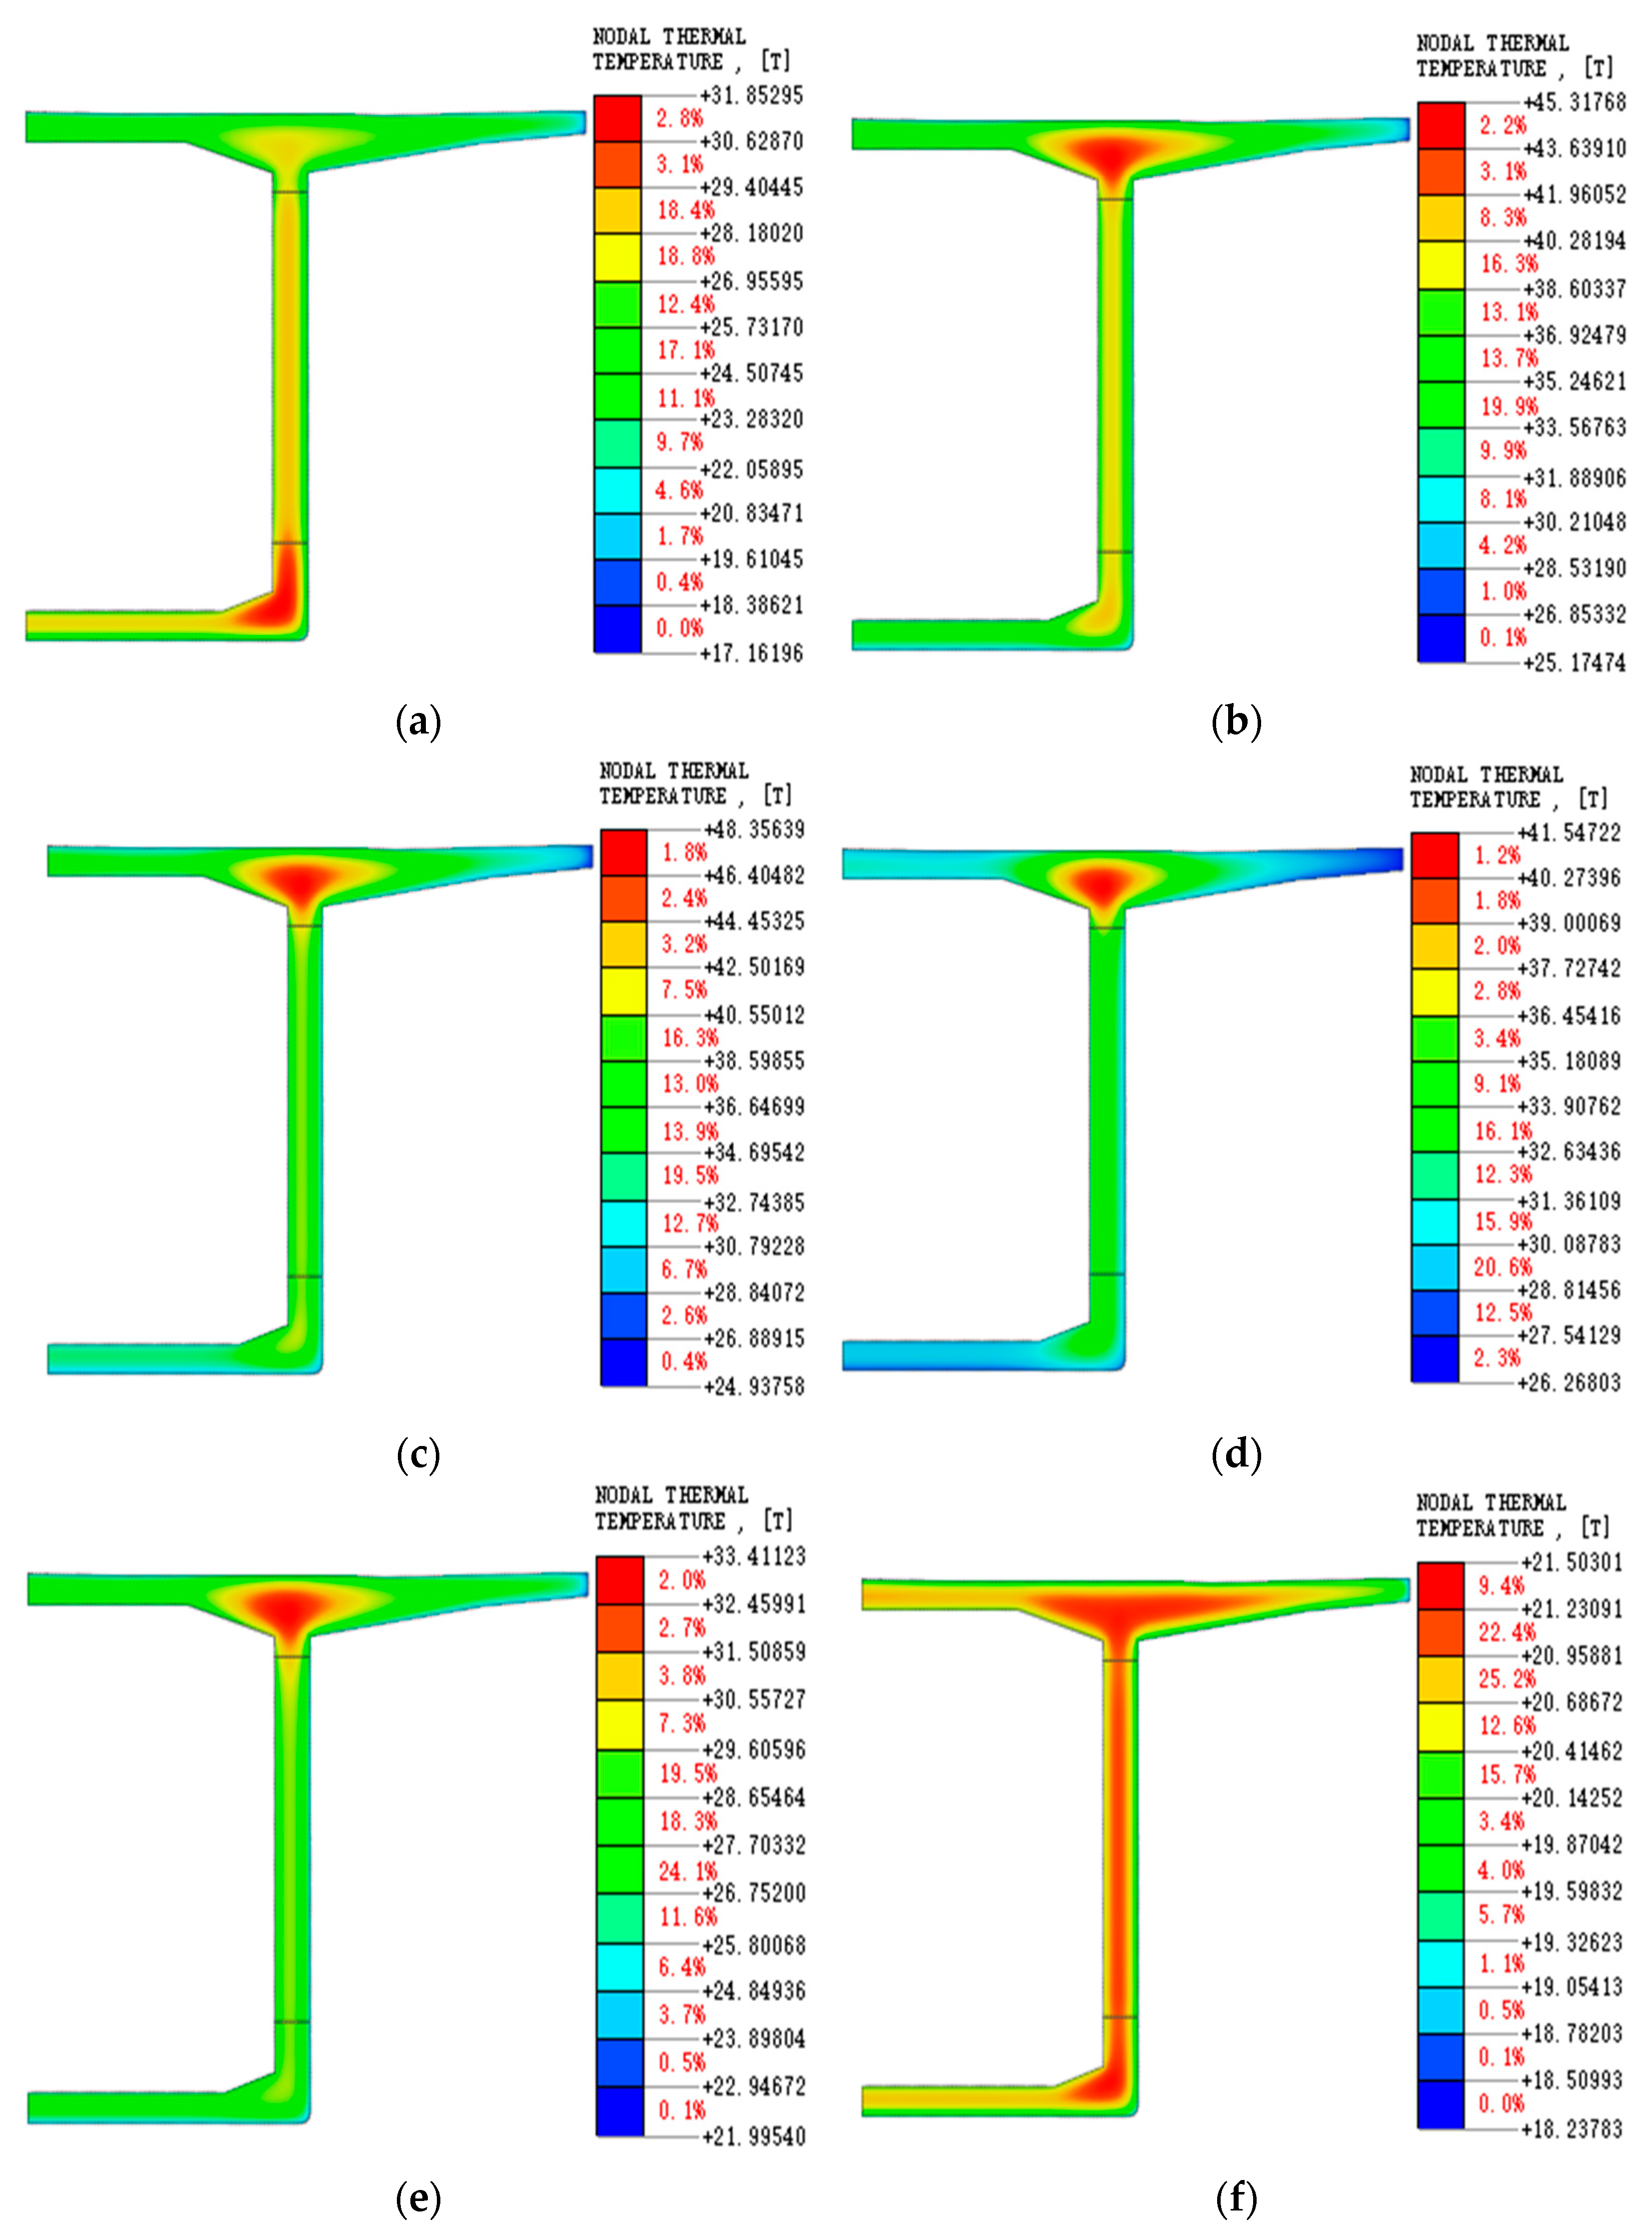
4.4.2. Temperature Field Distribution

The temperature field distribution of the box girder at 10 h, 20 h, 28 h, 48 h, 72 h, and 200 h, as extracted from the model, is shown in Figure 9.
As evidenced in Figure 9, the concrete begins to release a great deal of heat after pouring, and the peak temperature and temperature rise rate are different at different locations of the same section. The bottom concrete is poured first, and the highest temperature appears at the junction between the bottom and the web at 10 h. After 20 h, the highest temperature appears at the junction between the web and the roof. Due to the thickness of the concrete at this part, the heat generated by cement hydration after pouring cannot be released in a short period of time. Meanwhile, the accumulated heat temperature gradually rises. The maximum temperature of the section is located at the center of the top plate. The temperature rises to the maximum value of 48.36 °C 28 h after pouring. Then, the temperature gradually decreases over time, showing a downward trend. After 72 h of pouring, the temperature of the other parts of the structure is gradually close to the ambient temperature and tends to be stable, except that the center temperature of the roof is still high.

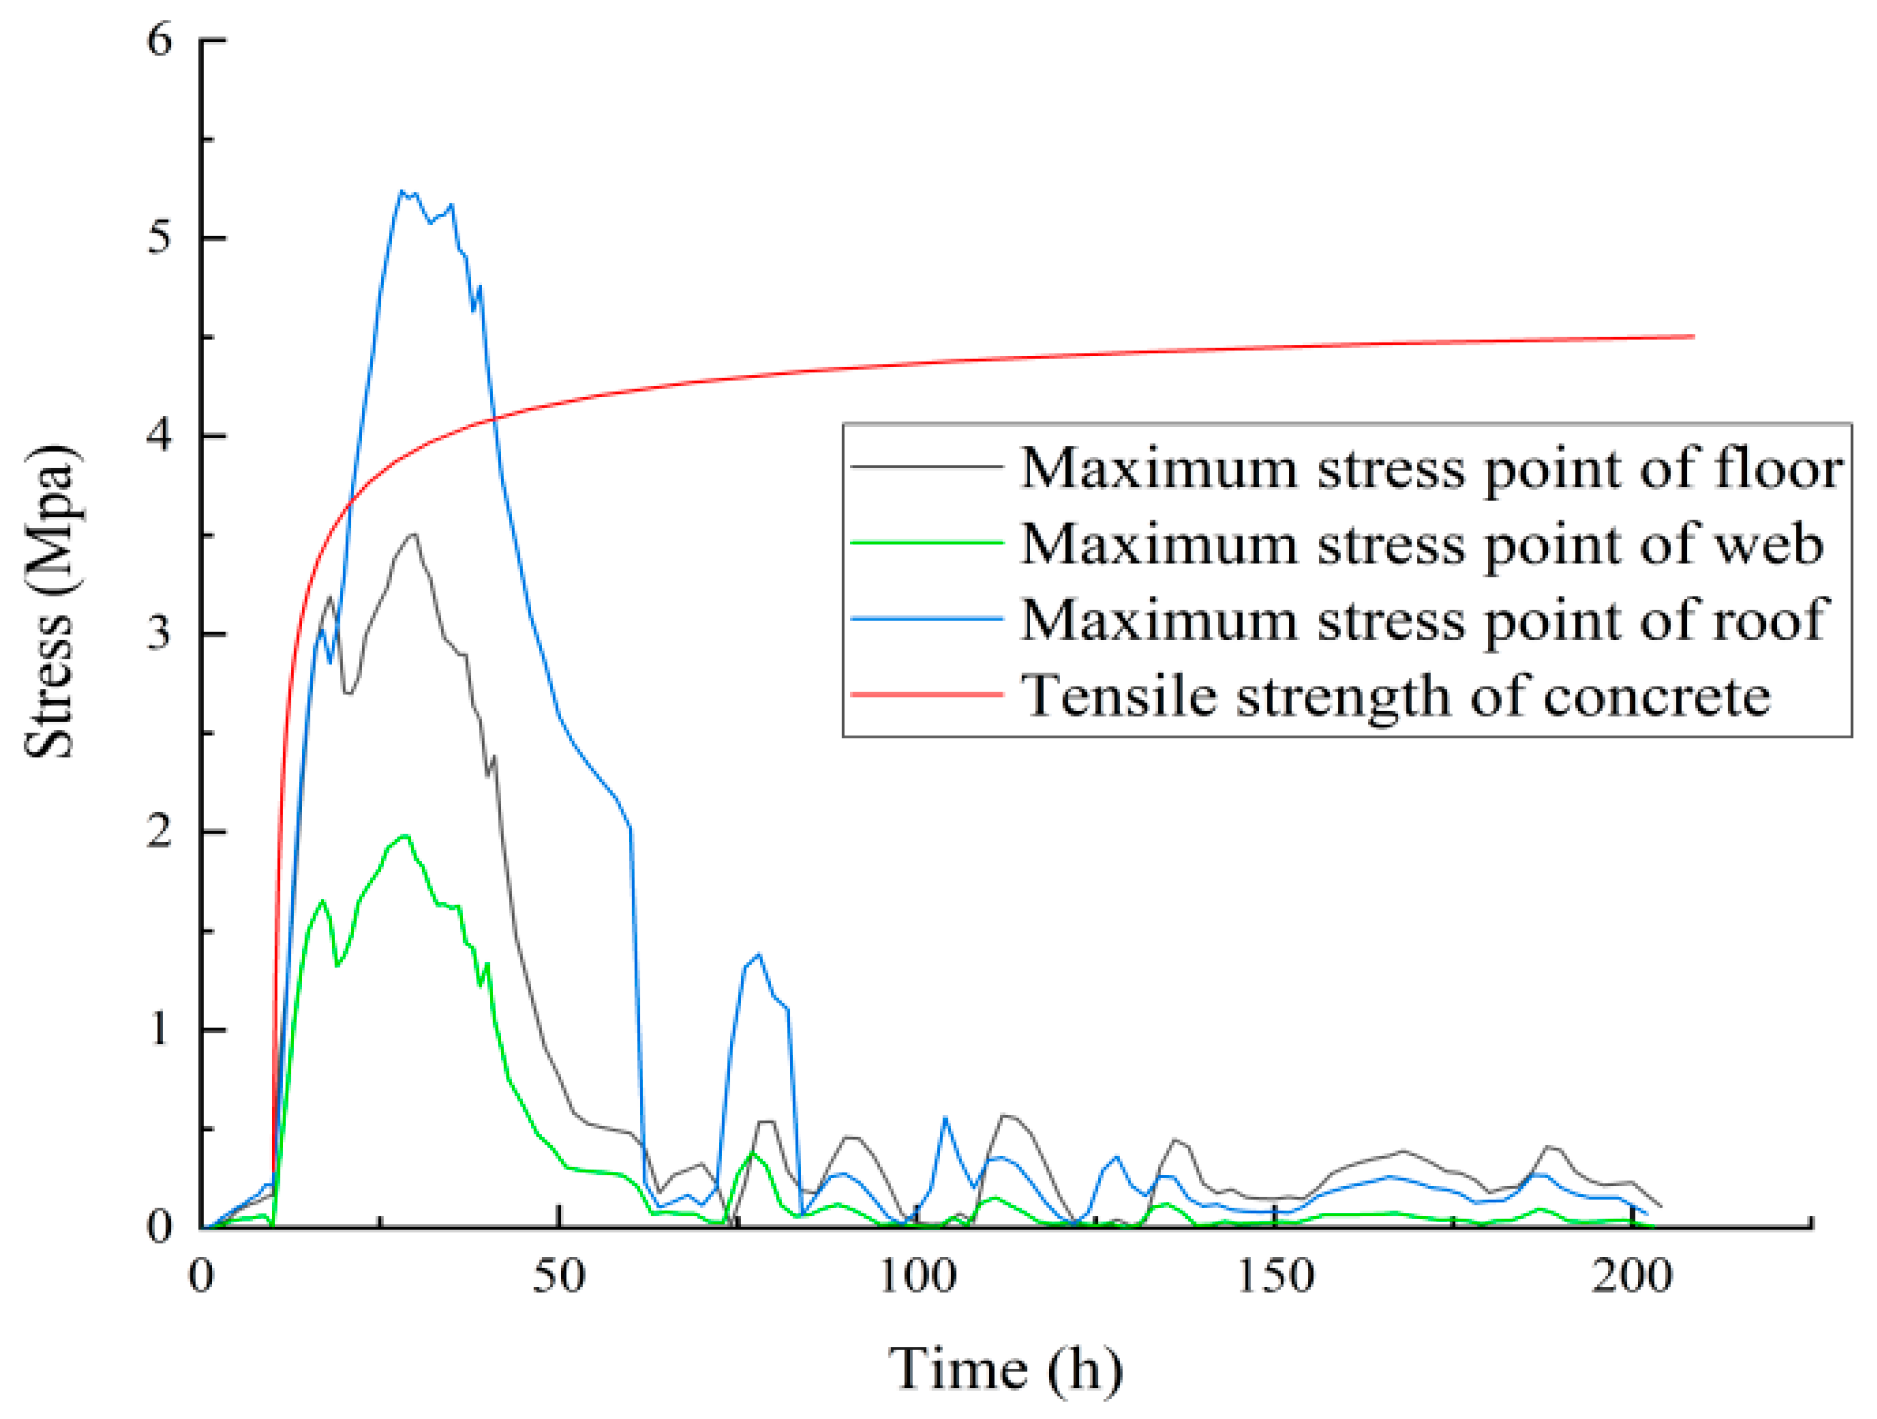
4.4.3. Stress Field Distribution

In the process of hydration heat of concrete, stress development is affected by multiple factors: temperature stress, creep stress, and shrinkage contraction. Through the finite element model, we obtained the stress distribution figure of the whole pouring process. By comparing and analyzing the transient stress fields derived from finite element simulation, the stress distribution diagram at the time of the maximum global stress (26 h after pouring) was selected, as shown in Figure 10.
According to Figure 10, the maximum stress at the moment of maximum stress along the bridge occurs on the outer surface of the bottom plate, with a value of 1.33 MPa, and the maximum stress at the moment of maximum stress of the first principal stress occurs on the outer surface of the upper chamfer, with a value of 4.65 MPa.

4.4.4. Stress Simulation Analysis

To assess the early-age cracking potential, a comparison was conducted between the maximum tensile stresses in floor, web, and roof zones and the concrete’s time-dependent tensile strength during the hydration heat temperature change stage, as shown in Figure 11. This methodology evaluates crack initiation risk through strength–stress temporal correlation across structural subsystems.
The red line in Figure 11 shows the growth curve of concrete tensile strength over time. The tensile strength of concrete is obtained by fitting the axial tensile strength data obtained by tests. When the thermal stress of concrete exceeds the tensile strength of concrete, it is considered that there is a risk of cracking. As is shown in Figure 11, for the first principal stress time history, the thermal stress at the maximum stress position of the roof surface exceeds the estimated tensile strength of the concrete during 23–42 h, indicating that there is a risk of cracking during this period.

5. Comparison of Construction Schemes

To control the adverse effects of hydration heat of the box girder, field-adaptable thermal regulation strategies including changing the mold temperature and the internal ventilation of the concrete box girder were implemented based on site-specific constraints, with the detailed curing performance assessment described in Table 4.

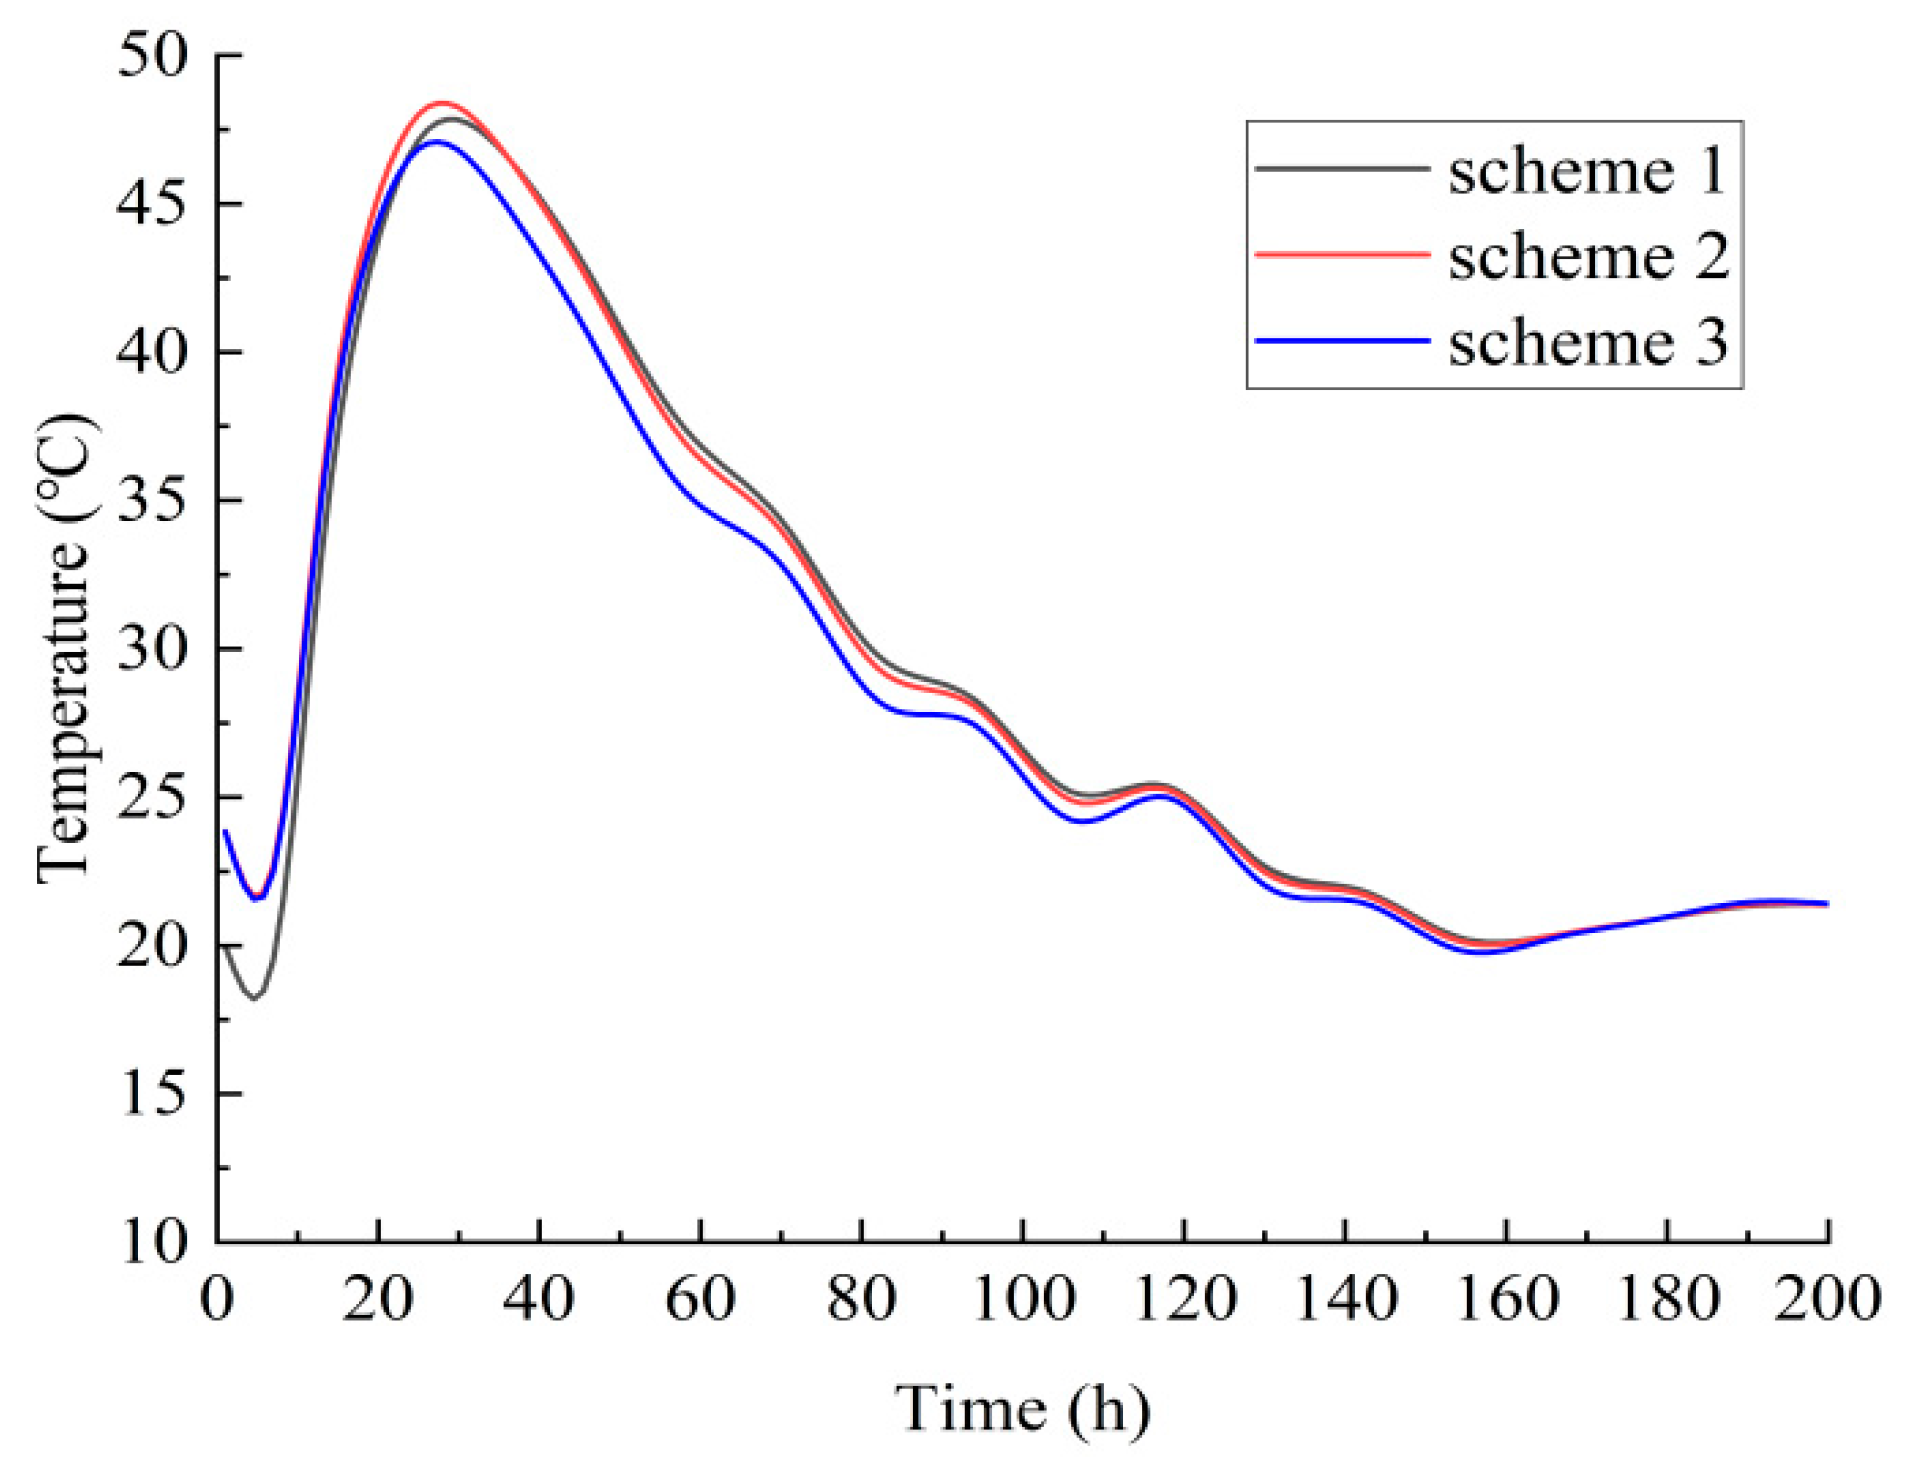
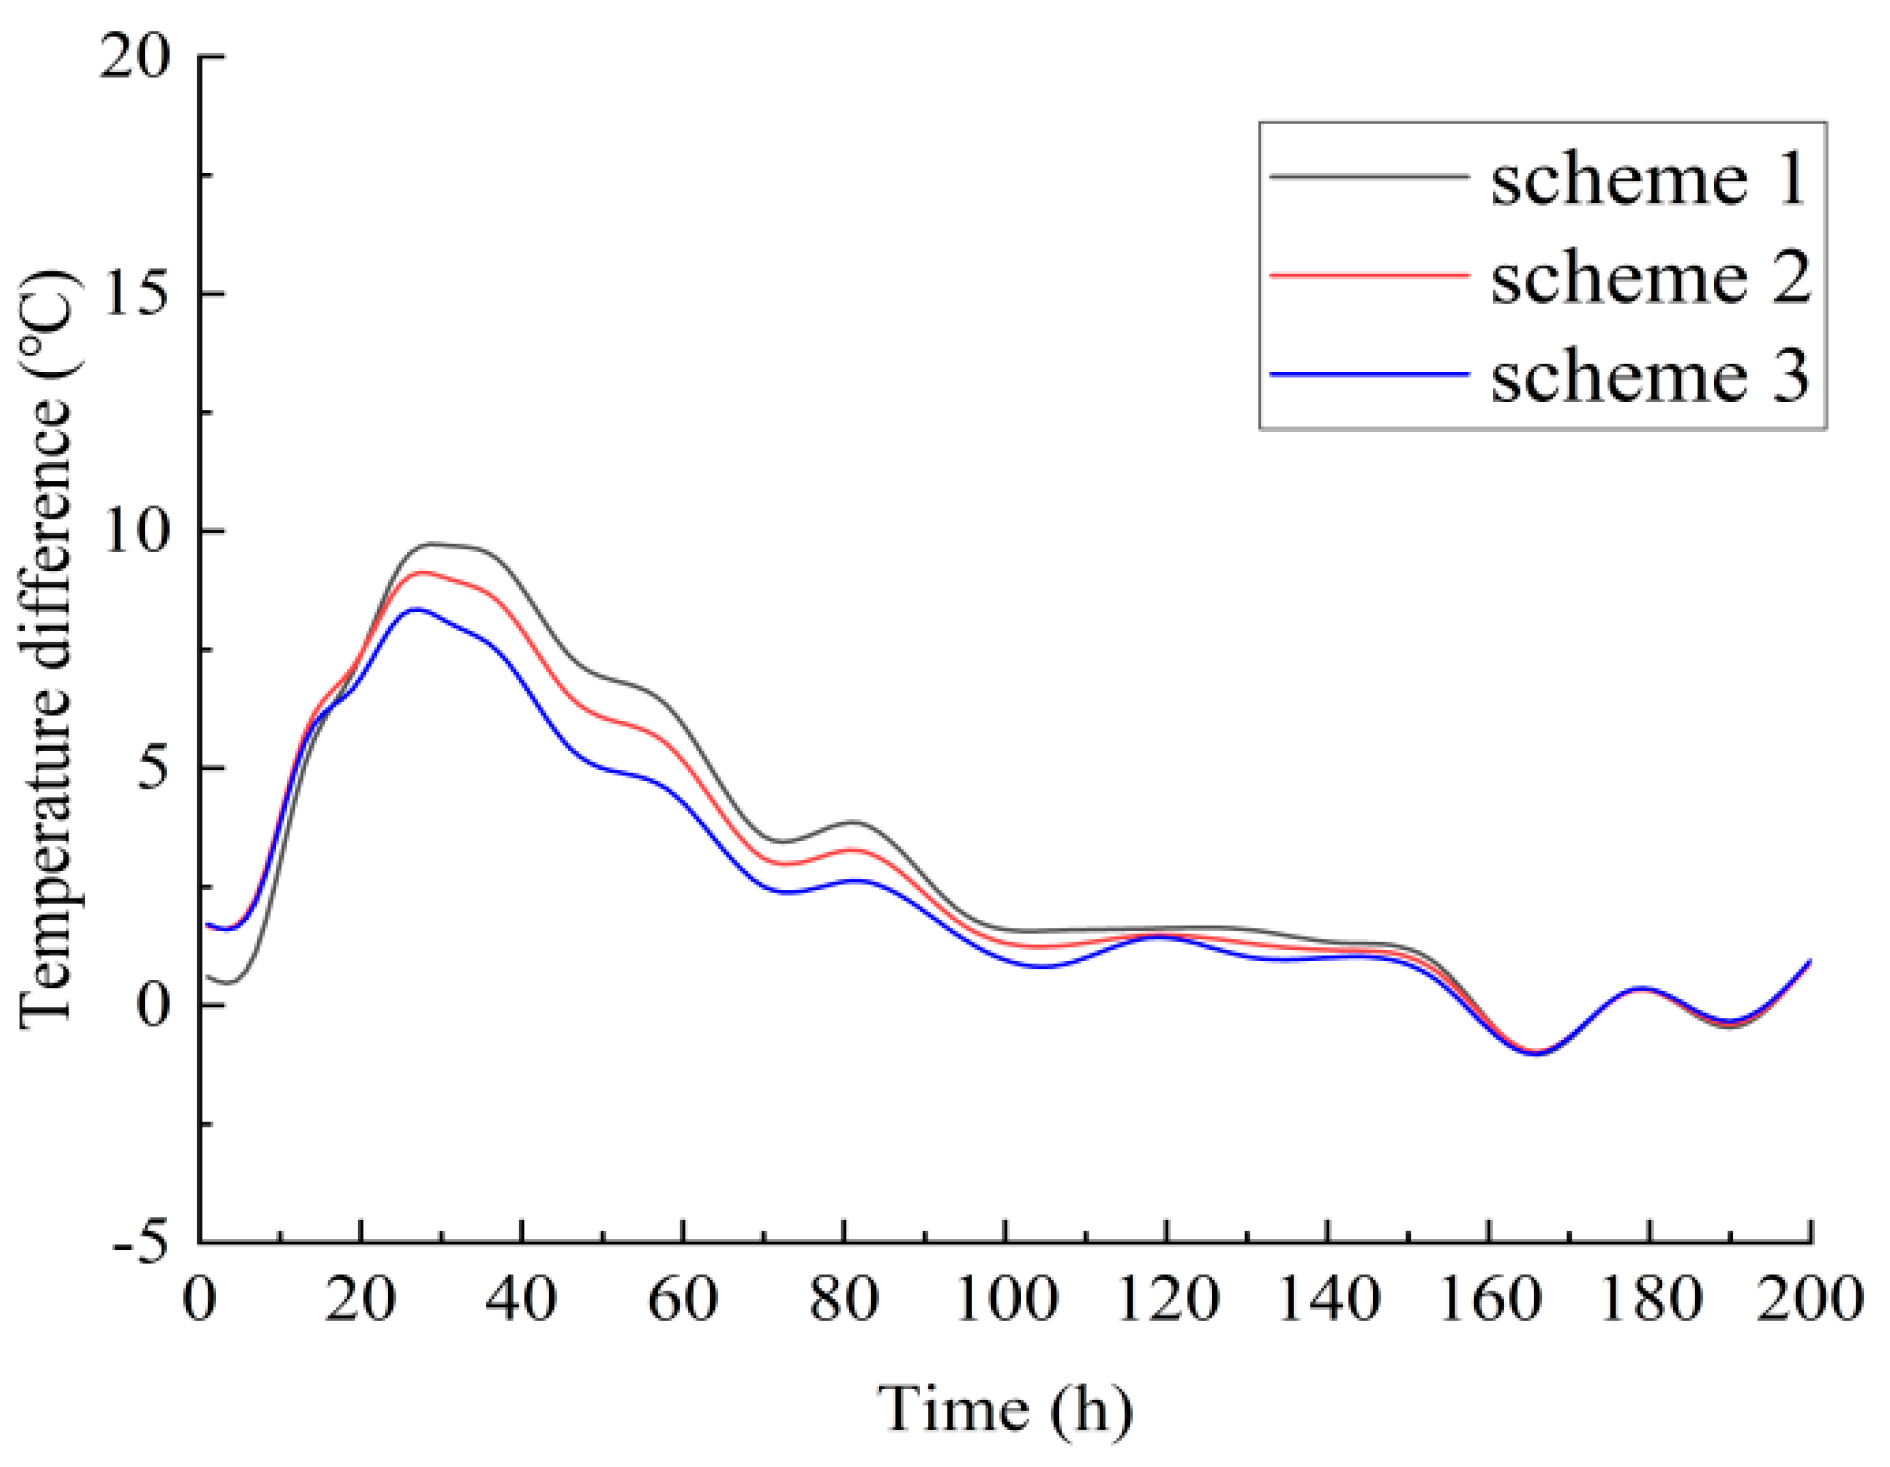
5.1. Temperature Effect Evaluation

The three schemes were simulated by the finite element method, and the node with the maximum temperature effect of hydration heat was selected for temperature time-history analysis, as demonstrated in Figure 12. The internal surface node and the external surface node at the top of the web were selected for temperature difference time-history analysis, as shown in Figure 13.
As illustrated in Figure 12, the maximum temperatures across all three schemes are relatively comparable, but the thermal stratification between the interior and the surface of the concrete in Figure 13 is quite different. Although the pouring temperature of the concrete in scheme 1 is relatively low, the peak temperature difference between the interior and the surface of the concrete is larger than that in schemes 2 and 3. The pouring temperature in scheme 2 is close to the ambient temperature, resulting in a small temperature difference. The pouring temperature for scheme 3 is the same as that for scheme 2, and therefore, it can be observed that at the beginning of the time-history curve, the two curves nearly coincide. However, due to the incorporation of ventilation measures inside the box girder in scheme 3, not only is the maximum internal temperature of the box girder reduced by 1.5 °C, but the temperature difference in concrete between the interior and the surface of the box girder is also effectively reduced.

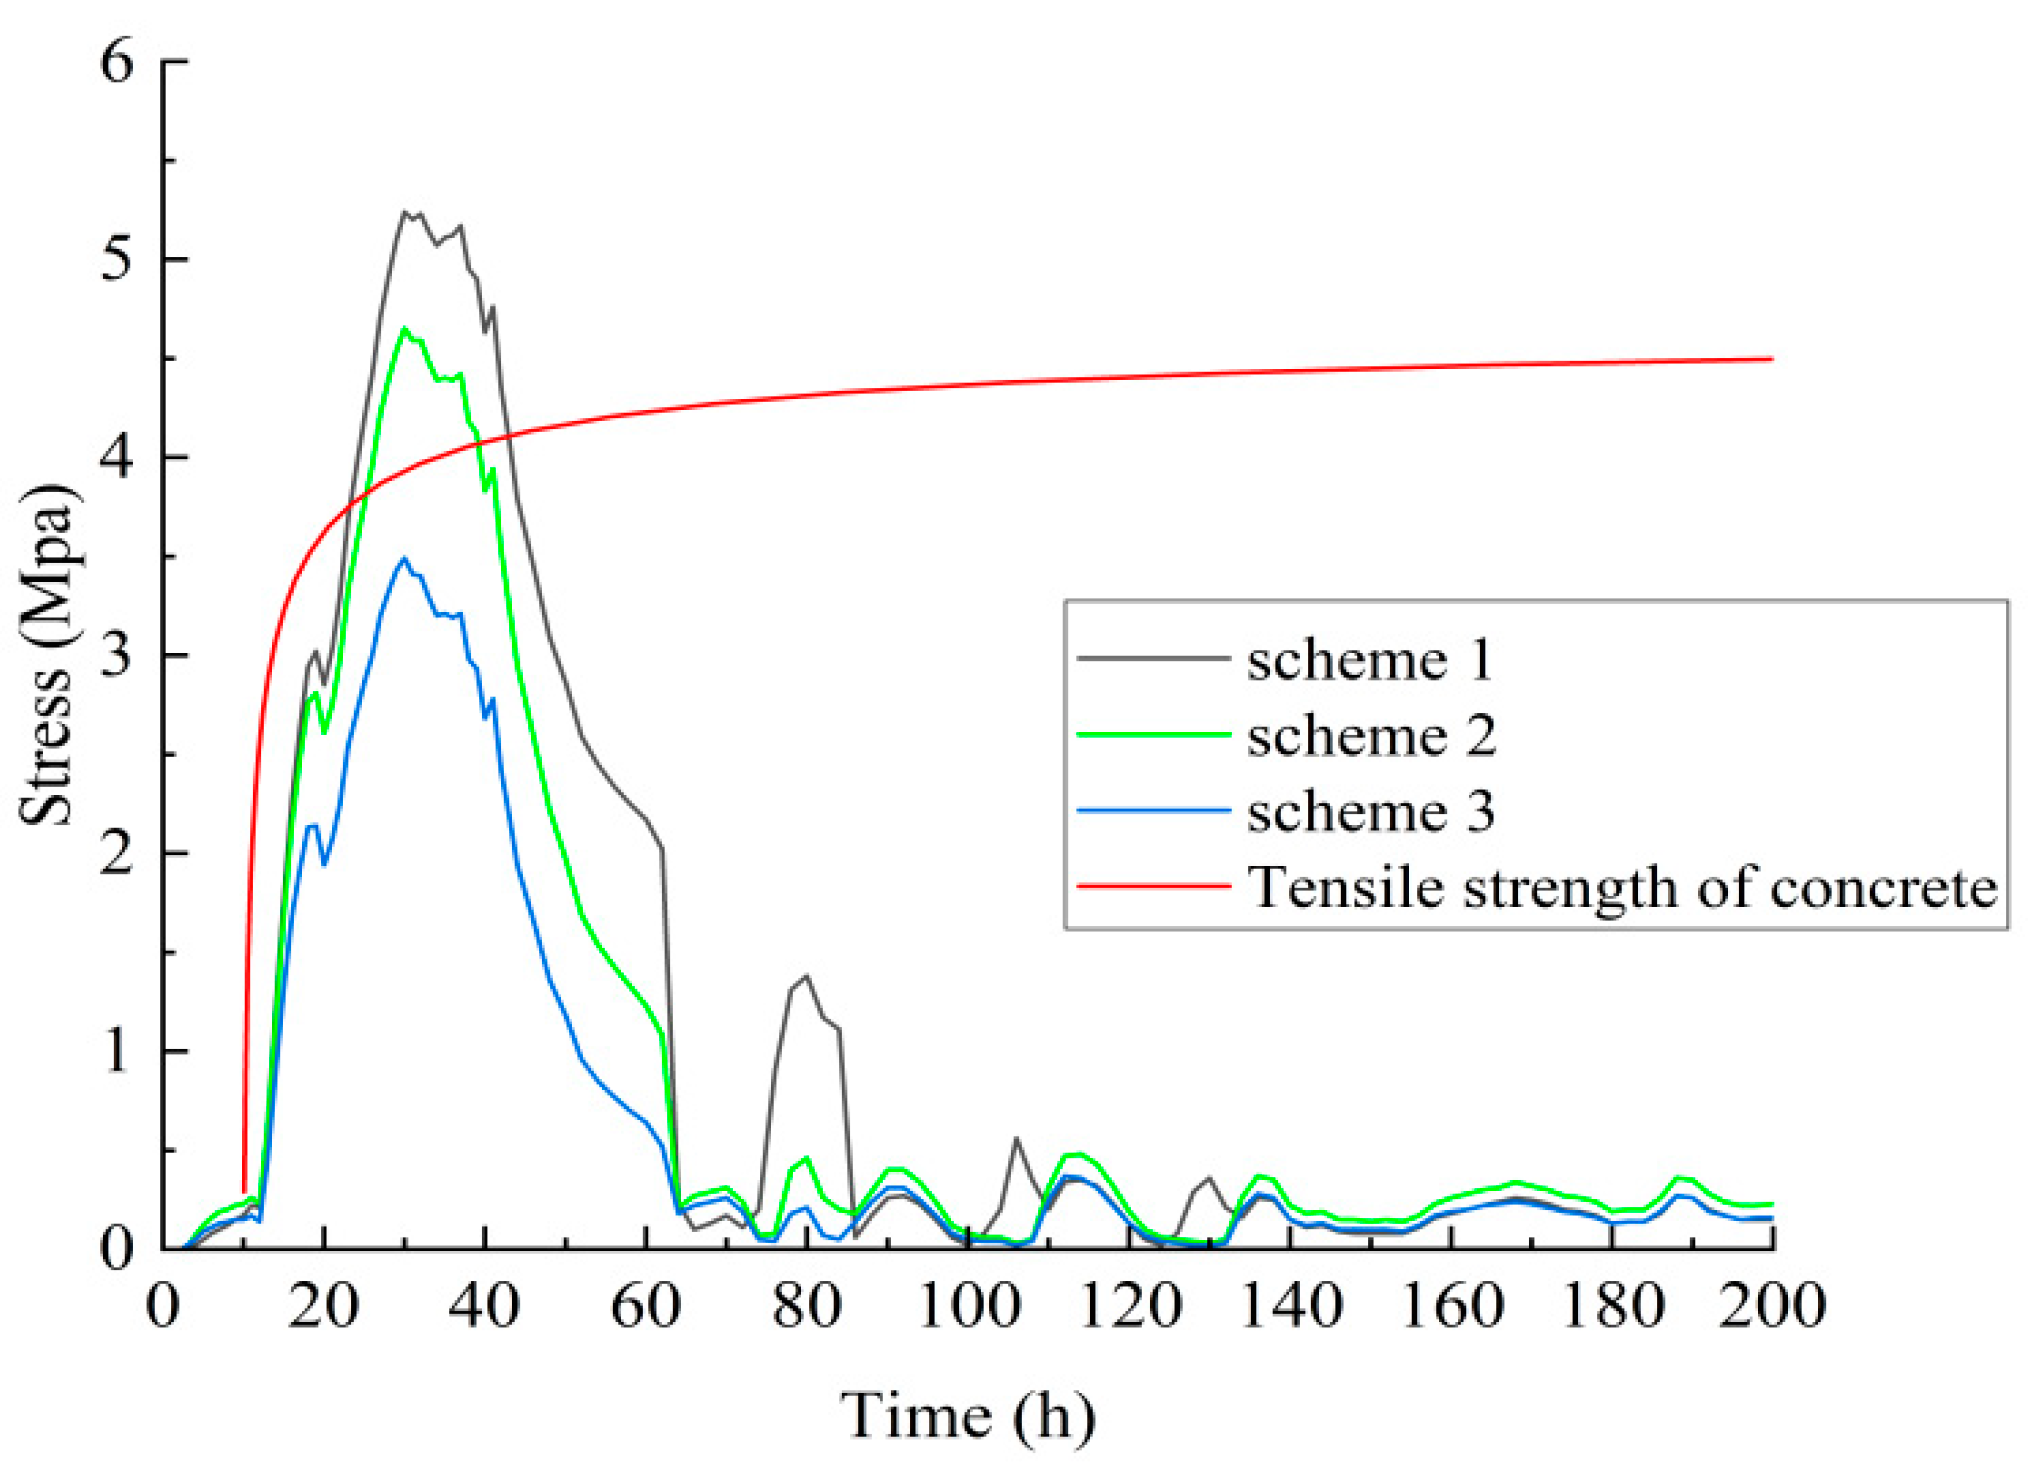
5.2. Stress Effect Evaluation

Temperature thermal stress risk assessment reveals a direct correlation between hydration-induced stresses and concrete cracking potential. Figure 14 shows the time-history curves of the maximum principal stress node (node No. 320384) on the surface of the box girder in the three schemes. The comparison of schemes presented in Figure 13 and Figure 14 reveals that under the conditions of scheme 1, the largest temperature difference exists between the interior and the surface of the concrete, and simultaneously, the maximum principal tensile stress develops on the concrete surface. From the results obtained in scheme 1 to scheme 3, it can also be observed that as the temperature difference between the interior and the surface of the concrete decreases, the maximum principal tensile stress on the concrete surface also gradually diminishes. This indicates that the temperature difference between the interior and the surface generated by the hydration heat of concrete is the main reason for the tensile stress of concrete. It can also be seen from Figure 14 that the maximum principal stress of scheme 3 does not exceed the tensile strength curve of concrete, and there is no risk of cracking during the whole pouring process of concrete box beams.

5.3. Cost-Effectiveness Evaluation

The issue of early-age cracking in concrete box girders has a significant impact on the early strength of concrete and may even affect the overall lifespan of concrete structures. If the concrete cracks propagate further, this would potentially lead to the failure of concrete structures, resulting in certain economic losses. This study conducts an exploratory analysis using a 5 m test section to initially evaluate the potential economic benefits of crack control research on an 80 m box girder, as shown in Table 5.
In summary, if the recommended method for crack control is employed, it is possible to reduce the potential economic loss by at least 1.753 million yuan for each 80 m prefabricated box girder.

6. Conclusions

The early-age hydration heat effect on prestressed concrete box girders was investigated through an experimental study using thermal monitoring data and numerical simulation and taking a 5 m long segment of the box girder. The conclusions are as follows:
  • The monitored maximum temperature shows a positive correlation with the cross-sectional dimensions of the structural member, where the larger the size, the higher the temperature. Meanwhile, the time taken for the concrete temperature to reach the maximum value is essentially proportional to the distance between the measurement point and the member’s surface. The smaller the distance, the shorter the time to reach the peak temperature.
  • The measured and theoretical temperature time histories exhibit comparable trends, indicating that the developed finite element model accurately captures the thermal behavior induced by the hydration process in a representative 5 m long segment of the box girder. This finding can provide a foundation for the subsequent analysis of the hydration heat of an 80 m long segment of the prestressed concrete box girder of the Hangzhou Bay Cross-Sea Railway Bridge.
  • The corresponding maximum principal stress increases with the temperature difference between the interior and the surface of concrete, demonstrating that hydration-induced differential thermal expansion between the core and surface regions greatly affects the tensile stress.
  • To effectively prevent structural cracking risks during the concrete pouring and curing process of box girders, a scheme is proposed to maintain principal stress levels consistently below the concrete’s tensile strength threshold. For summer construction with a high concrete molding temperature, implementing strategic ventilation measures within the girder effectively reduces core-surface thermal gradients and early-age tensile stresses, thereby mitigating the initial concrete cracking potential.

Author Contributions

Conceptualization, T.W., J.C., Q.F., W.J. and Y.H.; Methodology, T.W., J.C., Q.F., W.J. and Y.H.; Software, T.W., J.C., Q.F., W.J. and Y.H.; Validation, T.W.; Formal analysis, Q.F.; Investigation, T.W., J.C. and Q.F.; Data curation, T.W.; Writing—original draft, J.C., Q.F., W.J. and Y.H.; Writing—review & editing, T.W., J.C. and Q.F. All authors have read and agreed to the published version of the manuscript.

Funding

The research described in this paper was financially supported by the National Natural Science Foundation of China (Grant Nos. 52408226, U23A20659 and U24A20169).

Data Availability Statement

Data are contained within the article.

Conflicts of Interest

Author Weizhong Jia was employed by the company China Railway Major Bridge Engineering Group Co., Ltd. The remaining authors declare that the research was conducted in the absence of any commercial or financial relationships that could be construed as a potential conflict of interest.

References

  1. Zhang, P.; Xiong, H.T.; Wang, R.M. Measurements and Numerical Simulations for Cast Temperature Field and Early-Age Thermal Stress in Zero Blocks of High-Strength Concrete Box Girders. Adv. Mech. Eng. 2022, 14, 16878132221091514. [Google Scholar] [CrossRef]
  2. Nassr, A.; Abd-el-Rahim, H.; Kaiser, F.; El-sokkary, A. Topology Optimization of Horizontally Curved Box Girder Diaphragms. Eng. Struct. 2022, 256, 113959. [Google Scholar] [CrossRef]
  3. Wang, J.Q.; Fang, Z.; Liu, J.; Zuo, Y.; Ma, Z.F. Research on the Construction Crack Resistance of Large-span Box Girder Bridge. JRES Eng. 2016, 33, 81–86. (In Chinese) [Google Scholar]
  4. Lin, Y.; Chen, H.L. Thermal Analysis and Adiabatic Calorimetry for Early-Age Concrete Members. J. Therm. Anal. Calorim. 2015, 122, 937–945. [Google Scholar] [CrossRef]
  5. Schackow, A.; Effting, C.; Gomes, I.R.; Patruni, I.Z.; Vicenzi, F.; Kramel, C. Temperature Variation in Concrete Samples Due to Cement Hydration. Appl. Therm. Eng. 2016, 103, 1362–1369. [Google Scholar] [CrossRef]
  6. Fairbairn, E.M.R.; Silvoso, M.M.; Toledo Filho, R.D.; Alves, J.L.D.; Ebecken, N.F.F. Optimization of Mass Concrete Construction Using Genetic Algorithms. Comput. Struct. 2004, 82, 281–299. [Google Scholar] [CrossRef]
  7. Rita, M.; Fairbairn, E.; Ribeiro, F.; Andrade, H.; Barbosa, H. Optimization of Mass Concrete Construction Using a Twofold Parallel Genetic Algorithm. Appl. Sci. 2018, 8, 399. [Google Scholar] [CrossRef]
  8. Yang, W.; Wu, T.; Fang, Z. Measurement and Analysis of Hydration Heat of Concrete Box Girderin Single-box Multi-cells. Highw. Eng. 2017, 42, 254–260. (In Chinese) [Google Scholar]
  9. Chang, S.; Yang, M.; Sun, Y.; Liu, K. Calculation Method of Early-Age Crack Width in Reinforced Concrete Bridge through a Nonlinear FEA Model. KSCE J. Civ. Eng. 2019, 23, 3088–3096. [Google Scholar] [CrossRef]
  10. Seo, T.S.; Kim, S.S.; Lim, C.K. Experimental Study on Hydration Heat Control of Mass Concrete by Vertical Pipe Cooling Method. J. Asian Arch. Build 2015, 14, 657–662. [Google Scholar] [CrossRef]
  11. Do, T.A.; Verdugo, D.; Tia, M.; Hoang, T.T. Effect of Volume-To-Surface Area Ratio and Heat of Hydration On Early-Age Thermal Behavior of Precast Concrete Segmental Box Girders. Case Stud. Therm. Eng. 2021, 28, 101448. [Google Scholar] [CrossRef]
  12. Kurylowicz-Cudowska, A. Determination of Thermophysical Parameters Involved in the Numerical Model to Predict the Temperature Field of Cast-In-Place Concrete Bridge Deck. Materials 2019, 12, 3089. [Google Scholar] [CrossRef]
  13. Pan, Y.M.; Prado, A.; Porras, R.; Hafez, O.M.; Bolander, J.E. Lattice Modeling of Early-Age Behavior of Structural Concrete. Materials 2017, 10, 231. [Google Scholar] [CrossRef] [PubMed]
  14. Nguyen, T.; Weiler, M.; Waldmann, D. Experimental and Numerical Analysis of Early Age Behavior in Non-Reinforced Concrete. Constr. Build. Mater. 2019, 210, 499–513. [Google Scholar] [CrossRef]
  15. Zhao, H.; Jiang, K.; Yang, R.; Tang, Y.; Liu, J. Experimental and Theoretical Analysis On Coupled Effect of Hydration, Temperature and Humidity in Early-Age Cement-Based Materials. Int. J. Heat Mass Tran. 2020, 146, 118784. [Google Scholar] [CrossRef]
  16. Zhang, F.; Liu, J.Y. Study On Temperature Distribution of Three-Cell Box Girder During the Hydration Process. J. Therm. Anal. Calorim. 2023, 148, 2629–2643. [Google Scholar] [CrossRef]
  17. Wei, D.Y.; Du, C.F.; Lin, Y.F.; Chang, B.M. Impact Factors of Hydration Heat of Cemented Tailings Backfill Based On Multi-Index Optimization. Case Stud. Therm. Eng. 2020, 18, 100601. [Google Scholar] [CrossRef]
  18. De Schutter, G. Finite Element Simulation of Thermal Cracking in Massive Hardening Concrete Elements Using Degree of Hydration Based Material Laws. Comput. Struct. 2002, 80, 2035–2042. [Google Scholar] [CrossRef]
  19. Dai, J.P.; Wang, Q.C.; Bi, R.X.; Wang, C.; Han, Z.W.; Du, W.T.; Chen, Z.Y. Research On Influencing Factors and Time-Varying Model of Thermal Conductivity of Concrete at Early Age. Constr. Build. Mater. 2022, 315, 125638. [Google Scholar] [CrossRef]
  20. Lim, C.; Kim, J.; Seo, T. Prediction of Concrete Adiabatic Temperature Rise Characteristic by Semi-Adiabatic Temperature Rise Test and FEM Analysis. Constr. Build. Mater. 2016, 125, 679–689. [Google Scholar] [CrossRef]
  21. Xin, J.; Zhang, G.; Liu, Y.; Wang, Z.; Wu, Z. Evaluation of Behavior and Cracking Potential of Early-Age Cementitious Systems Using Uniaxial Restraint Tests: A Review. Constr. Build. Mater. 2020, 231, 117146. [Google Scholar] [CrossRef]
  22. Xiao, M.; Xi, J.; Qiu, P.; Deng, C.; Li, F.; Wei, J.; Gao, P.; Yu, Q. Evaluation of Tensile Properties and Cracking Potential Evolution of Fly Ash-Cement Mortar at Early Age Based On Digital Image Correlation Method. Constr. Build. Mater. 2024, 412, 134855. [Google Scholar] [CrossRef]
  23. Cai, Y.L.; Wang, F.; Zhao, Z.; Lyu, Z.; Wang, Y.G.; Zou, P. Early-Hydration Heat and Influencing Factor Analysis of Large-Volume Concrete Box Girder Based on Equivalent Age. Structures 2023, 50, 1699–1713. [Google Scholar] [CrossRef]
  24. Do, T.A.; Tia, M.; Nguyen, T.H.; Hoang, T.T.; Tran, T.D. Assessment of Temperature Evolution and Early-Age Thermal Cracking Risk in Segmental High-Strength Concrete Box Girder Diaphragms. KSCE J. Civ. Eng. 2022, 26, 166–182. [Google Scholar] [CrossRef]
  25. Qiao, G.; Xue, G.; Zhu, G. A Precise Internal-Stress Calculation Algorithm for the Evolution of Cracking Risk of the Steam-Curing Box Girder. Constr. Build. Mater. 2022, 346, 128463. [Google Scholar] [CrossRef]
  26. Liu, J.; Liu, Y.J.; Zhang, N.; Ma, Z.Y.; Bai, Y.X. Research On Temperature Action and Cracking Risk of Steel-Concrete Composite Girder During the Hydration Process. Arch. Civ. Mech. Eng. 2020, 20, 47. [Google Scholar] [CrossRef]
  27. Yu, X.Z.; Chen, J.Y.; Xu, Q.; Zhou, Z. Research on the Influence Factors of Thermal Cracking in Mass Concrete by Model Experiments. KSCE J. Civ. Eng. 2018, 22, 2906–2915. [Google Scholar] [CrossRef]
  28. Lee, C.; Lee, S.; Nguyen, N. Modeling of Compressive Strength Development of High-Early-Strength-Concrete at Different Curing Temperatures. Int. J. Concr. Struct. Mater. 2016, 10, 205–219. [Google Scholar] [CrossRef]
  29. Zeng, Y.; Li, X.Q.; Jiang, D.; Ran, J.H. Study On the Effects of Innovative Curing Combinations On the Early Temperature Field of Concrete Box Girders. Buildings 2022, 12, 1808. [Google Scholar] [CrossRef]
  30. Comite Euro-International du Beton. CEB-FIP Model Code 1990; Thomas Telford Ltd.: London, UK, 1993. [Google Scholar]
  31. Zhu, B.F. Temperature Stresses and Temperature Control in Mass Concrete, 2nd ed.; China Water Conservancy and Hydropower Press: Beijing, China, 2012. (In Chinese) [Google Scholar]
Figure 1. Cross-section of box girder (unit: cm).
Buildings 15 00859 g001
Figure 2. The on-site 5 m long segment.
Buildings 15 00859 g002
Figure 3. Time-history curves of measured temperature.
Buildings 15 00859 g003
Figure 4. Measured temperature difference on the inner surface.
Buildings 15 00859 g004
Figure 5. Model in the finite element analysis.
Buildings 15 00859 g005
Figure 6. The adiabatic temperature rise curves.
Buildings 15 00859 g006
Figure 7. Measured ambient temperature.
Buildings 15 00859 g007
Figure 8. Comparison of measured temperature and calculated temperature time-history curves.
Buildings 15 00859 g008
Figure 9. Temperature field distribution of the box girder at key moments: (a) 10 h; (b) 20 h; (c) 28 h; (d) 48 h; (e) 72 h; (f) 200 h.
Buildings 15 00859 g009
Figure 10. The stress distribution diagram at the time of the maximum global stress. (a) Stress distribution along the bridge. (b) First principal stress.
Buildings 15 00859 g010
Figure 11. Comparison of maximum surface stress and tensile strength in zones of concrete.
Buildings 15 00859 g011
Figure 12. Maximum temperature of different curing schemes.
Buildings 15 00859 g012
Figure 13. Time−history curves of temperature difference for different curing schemes.
Buildings 15 00859 g013
Figure 14. Time-history curves of the maximum principal stress at node 320384.
Buildings 15 00859 g014
Table 1. Mix proportion of the 5 m long segment of the box girder.
MaterialsCementCoal Fly AshMineral PowderSandCrushed StoneWater ReducerWater
Mass/kg2861345772710465.72144
Specific heat
capacity/ k J / ( k g · ° C )
0.5360.920.920.750.71/4.19
Heat   conductivity   coefficient / W / ( m · ° C ) 2.220.230.263.082.91/0.6
Table 2. Material properties of the 5 m long box girder in the experiment.
Age of Concrete/d Compressive Strength/MPa Splitting Tensile Strength/MPa Tensile Strength/MPa Modulus of Elasticity/MPa
232.32.324.218 3.00 × 10 4
338.73.044.319 3.04 × 10 4
549.33.334.422 3.39 × 10 4
755.23.774.477 3.85 × 10 4
2868.14.48\ 4.00 × 10 4
Table 3. Construction phase time distribution.
Construction PhaseTime (h)Step Size (h)
Floor pouring stage11/6
Web pouring stage11/6
Roof pouring stage21/3
Curing stage 1401
Curing stage 21602
Table 4. Different curing schemes.
SchemeConcrete Surface WettingConcrete Pouring TemperatureInternal Surface Ventilation of Box Girder
1201 m/s
2241 m/s
3244 m/s
Table 5. Cost estimation table for precast box girder.
StructureMaterialsAmount of MaterialUnit Material CostCost of Various Materials/Thousand YuanTotal Cost/
Thousand Yuan
m3tYuan/m3Yuan/t
5 m test sectionC55 concrete34.11 399.72 13.661.6
reinforcement 15.32 313248.0
80 m box girder structureC55 concrete1079.87 399.72 431.61753.4
reinforcement 268.54 3132841.1
71.44 6729480.7
Disclaimer/Publisher’s Note: The statements, opinions and data contained in all publications are solely those of the individual author(s) and contributor(s) and not of MDPI and/or the editor(s). MDPI and/or the editor(s) disclaim responsibility for any injury to people or property resulting from any ideas, methods, instructions or products referred to in the content.

