Article

Study on Dynamic Response and Anti-Collision Measures of Aqueduct Structure Under Vehicle Impact

by
Jiaze Shi
1,
Rui Wen
2,
Li Chen
2,
Yao Zhou
1,
Lei Duan
1 and
Weiqiang Wang
1,*
1
College of Water Conservancy and Hydropower Engineering, Hohai University, Nanjing 210098, China
2
Shanghai Investigation, Design & Research Institute Co., Ltd., Shanghai 200434, China
*
Author to whom correspondence should be addressed.
Buildings 2025, 15(6), 851; https://doi.org/10.3390/buildings15060851
Submission received: 17 January 2025 / Revised: 28 February 2025 / Accepted: 6 March 2025 / Published: 8 March 2025
(This article belongs to the Special Issue Research on the Mechanical and Durability Properties of Concrete)

Abstract

In recent years, the number of incidents involving aqueduct damage due to vehicle impact has steadily increased, significantly affecting the safe operation of water transfer projects. To investigate the dynamic response characteristics of aqueduct structures under vehicle impact, a numerical model of vehicle impact on an aqueduct was developed using ANSYS/LS-DYNA software. The influence of impact eccentricity and concrete strength on the dynamic response of the aqueduct structure was then analyzed. The results indicate that the aqueduct bent frame exhibits a pronounced torsional response under eccentric impact, exacerbating the damage and deformation of the aqueduct structure. The peak impact force is positively correlated with concrete strength, whereas the maximum lateral displacement and residual displacement at the top of the impacted bent frame show a negative correlation with concrete strength. Finally, three anti-collision measures are proposed: a rubber concrete outer box with a rubber filling layer, an ultra-high-performance concrete (UHPC) outer box with a foam aluminum filling layer, and a rubber concrete outer box with a foam aluminum filling layer. The energy dissipation, internal force response, displacement response, and aqueduct damage characteristics of these measures are compared and analyzed, and compared to the aqueduct structure without anti-collision measures, the peak impact force is reduced by at least 17%. The lateral residual displacements at the bottom, the impact area, and the top of the aqueduct bent frame are reduced by at least 88.3%, 97.8%, and 88.5%. The damage and severity of damage to the aqueduct are significantly reduced, providing valuable insights for the anti-collision design of aqueducts.

1. Introduction

Water resources are fundamental to the survival and well-being of human society. In China, the overall distribution of water resources is marked by significant regional imbalances, which severely hinder the improvement of economic society and living standards [1,2]. To achieve the rational allocation of water resources, large- and medium-sized water transfer projects, such as the South-to-North Water Transfer Project, have emerged in response to evolving demands [3]. As an overhead water conveyance structure capable of spanning mountains, valleys, and roads, the aqueduct has become one of the key structural types in water conveyance projects due to its ability to be erected regardless of topographical constraints [4]. Gu et al. [5] analyzed examples of aqueduct structures in China from the 1970s to the present, and attributed their failures to natural disasters, such as earthquakes, wind-induced forces, and water damage, as well as human factors, including vehicle impacts, design flaws, and construction errors. In recent years, advancements in aqueduct design and construction technology, along with enhanced maintenance and preventive measures for existing aqueduct projects, have significantly mitigated structural issues caused by natural disasters [6].
On the other hand, the rapid development of the transportation industry has resulted in an increasing number of highways intersecting with aqueducts, which has led to a significant rise in vehicle impact incidents on aqueducts, substantially affecting the normal operation of water transfer projects. For example, in 2020, a vehicle impacted with an aqueduct on the Hengyang section of the G4 Beijing–Hong Kong–Macao Expressway in China resulted in issues such as slippage of the aqueduct body, misalignment of the pier body, and longitudinal penetration cracks in the web, posing significant safety hazards. Table 1 presents the impact locations and corresponding aqueduct damage in recent years. It is observed that the impact damage can be primarily categorized into two types: aqueduct bent frame impact and trough body impact, with the former being the more predominant type.
Currently, research on aqueduct structures under dynamic load primarily focuses on seismic performance [7,8,9], while studies on their performance under impact load remain limited [10]. Li et al. [4] conducted a numerical simulation of an aqueduct bent frame being struck by a ship and analyzed the resulting damage characteristics. Su et al. [10] developed a numerical model of the impact between the hull and the aqueduct using ANSYS/LS-DYNA software, analyzed the failure mode of the aqueduct structure, and examined the relationship between ship speed and the failure probability of the aqueduct. Currently, extensive research is being conducted on the performance of bridge structures under vehicle impact, both domestically and internationally. Since bridge structures and aqueducts share certain similarities, the findings from studies on vehicle impact to bridge structures can offer valuable insights for this research. Thilakarathna et al. [11] conducted a numerical study on the dynamic response of reinforced concrete (RC) piers under vehicle impact, and found that the lateral displacement at the impact location was horizontal. Similarly, Do et al. [12] investigated the dynamic behavior of RC piers under vehicle impact through numerical simulation, and the results indicate that the impact force impulse is positively correlated with the vehicle’s initial momentum, and the peak impact force is influenced by both the impact speed and the engine characteristics. Chen et al. [13] compared the dynamic response and damage characteristics of RC piers under vehicle impact for different boundary conditions through numerical simulation, and the results indicate that the upper boundary conditions have minimal impact on the results, while the cross-sectional shape of the pier column significantly affects the degree of damage. In addition, both Chinese and international scholars have studied anti-collision mechanisms for bridge piers. Wang et al. [14] designed a flexible energy-absorbing anti-collision device consisting of an outer box girder, rubber spring rings, and an inner plate girder, and found that the device provides dual protection for both bridges and vehicles. Liu et al. [15] used rubber concrete to cover the pier in order to dissipate the impact kinetic energy of vehicles, and the study found that as the size and content of the rubber particles increased, the anti-collision energy absorption effect was significantly enhanced. A numerical model of vehicle impact on aqueduct structures was developed using ANSYS/LS-DYNA software, and the effects of impact eccentricity and concrete strength on the dynamic response characteristics of the aqueduct structure under vehicle impact were analyzed. Finally, three anti-collision measures, a rubber concrete outer box with a rubber filling layer, an ultra-high-performance concrete (UHPC) outer box with an aluminum foam filling layer, and a rubber concrete outer box with an aluminum foam filling layer, are proposed. The anti-collision energy absorption effects of these measures are compared to provide guidance for the anti-collision design of aqueducts.

2. Materials and Methods

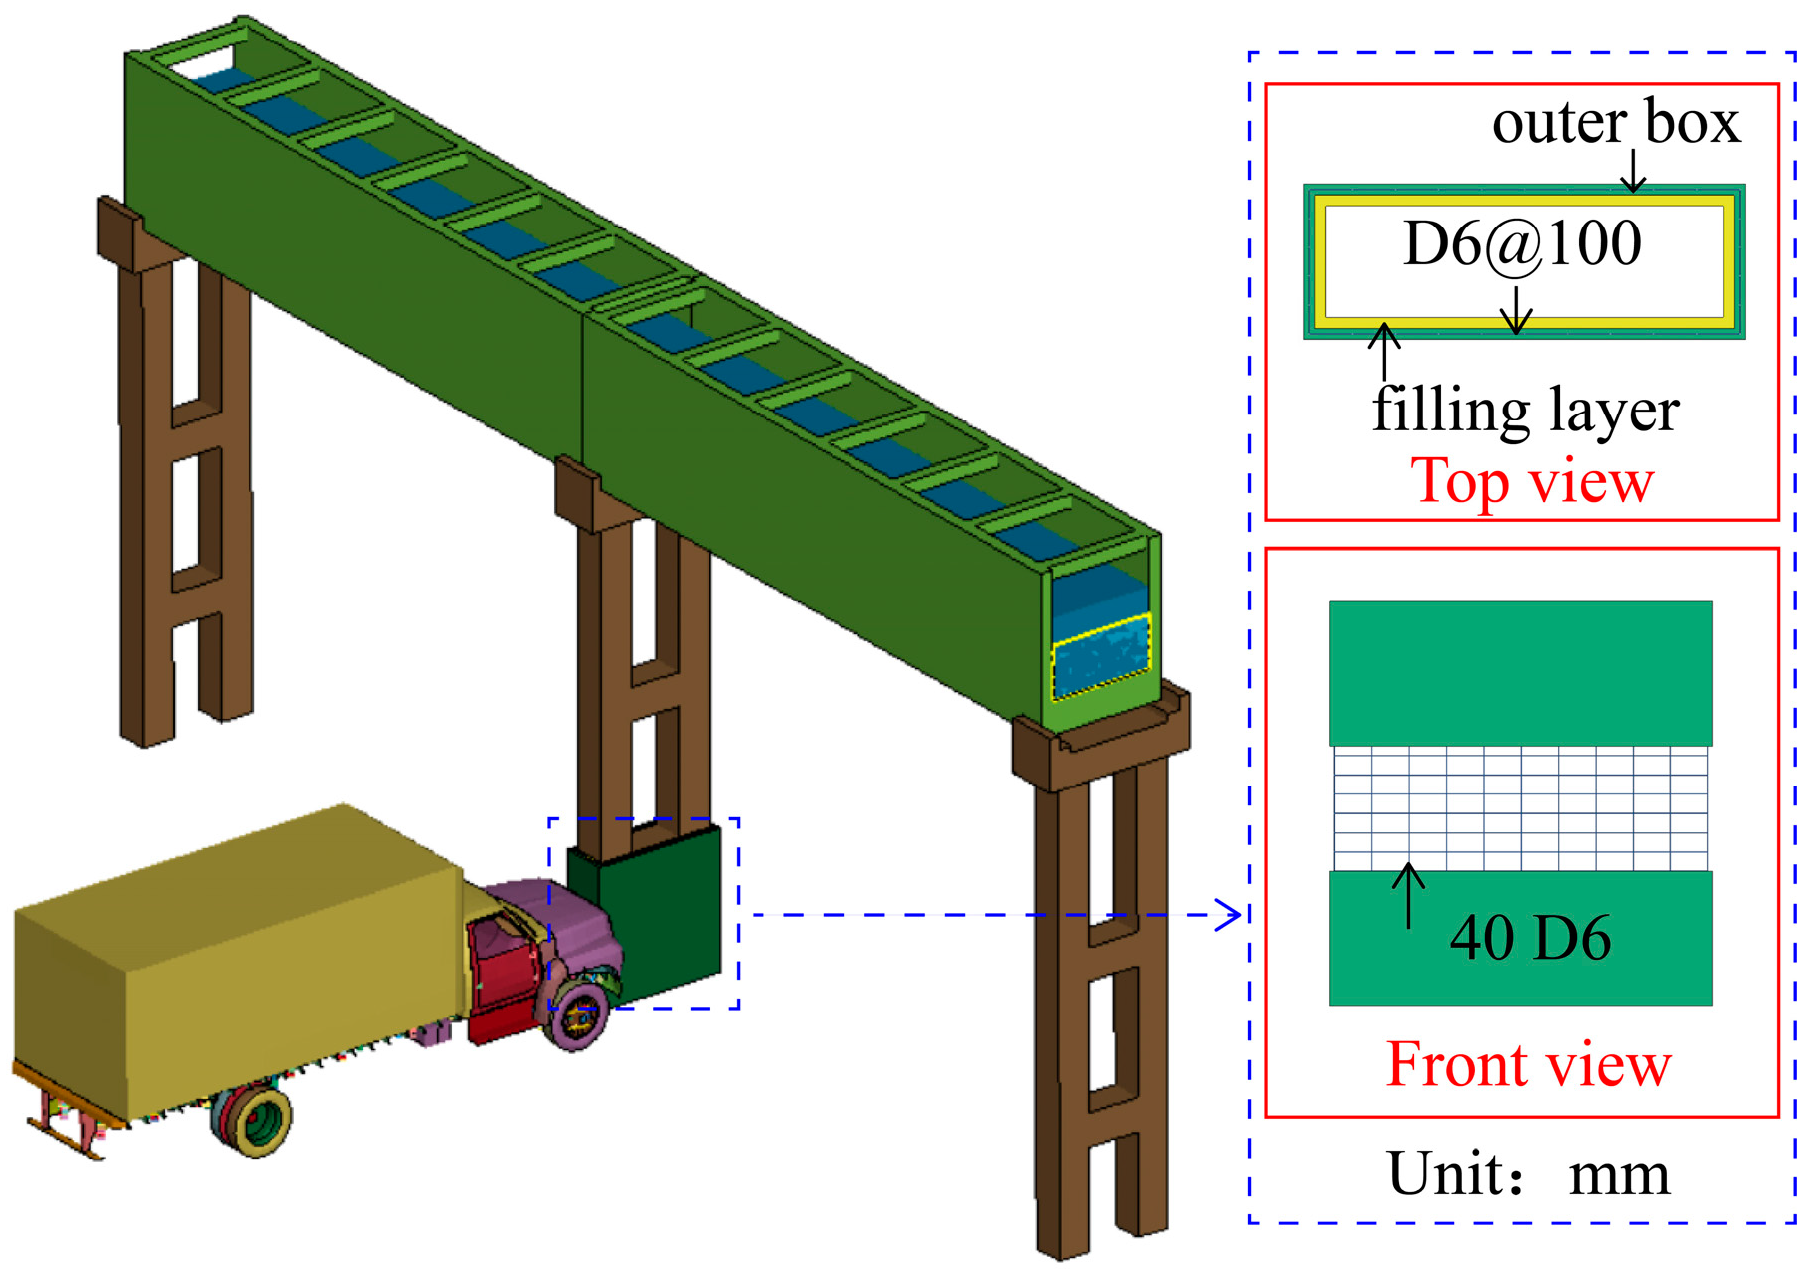
2.1. Numerical Model

2.1.1. Aqueduct Model

The numerical simulations in this study were conducted using ANSYS/LS-DYNA(17.0) (ANSYS, Inc., Canonsburg, PA, USA). The numerical model of a 10 m span, beam-type rectangular aqueduct was developed, as shown in Figure 1. The aqueduct consists of a supporting structure, a cap beam, a cross beam, and a trough body. The supporting structure consists of a beam-type double-row bent frame (0.5 m × 0.5 m × 7 m), with the two rows of bent frames connected by cross beams (0.5 m × 0.5 m × 0.8 m). The trough has a height of 2.4 m, a width of 2 m, and a single span length of 10 m, with a water depth of 0.8 m. The yield strengths of the longitudinal reinforcement and stirrups are 400 MPa and 335 MPa, respectively. The bond-slip behavior between the steel bars and concrete is modeled using the keyword *Lagrange_In_Solid. The full constraint (constraint of the translational and rotational degrees of freedom in all directions) is applied along the 0.3 m level below the height of the bent frame to simplify the foundation soil constraint.

2.1.2. Water Model

To model the fluid–solid coupling effect of the nonlinear sloshing of the aqueduct structure and the water body in the trough under vehicle impact, one commonly used method is Arbitrary Lagrange-Euler (ALE), as proposed by Hirt et al. [16]. However, this method has difficulty in achieving computational convergence when simulating large deformation problems. Building upon the traditional ALE method, the Multi-Material Arbitrary Lagrangian-Eulerian (MMALE) method incorporates interface reconstruction algorithms and multi-material remapping techniques [17] to overcome the limitations of the Lagrange grid at the interfaces of large deformation materials; this approach allows for the presence of mixed grids (i.e., multiple substances within the same grid), and uses the Volume of Fluid (VOF) method to track the boundaries of each material. The material exchange and transport in the corresponding unit effectively simulate the nonlinear sloshing of the free water surface. In recent years, it has been widely used in simulating fluid–solid coupling systems [18,19,20,21].
The fluid domain (air and water) in the aqueduct model established in this paper is simulated using solid elements based on the 11th algorithm (single-point MMALE); the MMALE algorithm is applied, with the structural domain using the Lagrangian approach, and the fluid domain and the structural domain are coupled through *Lagrange_In_Solid, which can track the relative displacement between the fluid and the structure, effectively simulating water sloshing. It is important to note that this coupling method is sensitive to parameter control; energy leakage and hourglass must be managed to ensure solution accuracy [21]. The volume fraction of each fluid in the domain is defined using the keyword Initial_Volume_Fraction_Geometry. To allow the water and air to reach a pressure equilibrium in the initial state, use the keyword *Control_ALE to set the global reference pressure to 0.101325 MPa (1 bar). For the boundary conditions of the fluid domain, NOFLOW is set at the boundary in contact with the trough body to constrain the flow perpendicular to the plane; NON_REFLECTING is set at the remaining boundaries to simulate a transmission boundary that can be applied to minimize pressure wave reflections at mesh boundaries when modeling an infinite domain using a finite mesh.
The concrete element size is 50 mm, the fluid domain element size is 100 mm, and the aqueduct model consists of a total of 819,050 nodes, 406,944 solid elements, and 164,928 beam elements. A mesh sensitivity analysis showed that further reducing the element size produced similar results but significantly increased computational time.

2.1.3. Vehicle Model

The vehicles traveling on the road are primarily cars and trucks. Among these, cars have a relatively light weight (ranging from 0.8 to 2 tons), resulting in minimal damage to the aqueduct. Therefore, this paper focuses on the truck for the numerical simulation analysis of the impact between the vehicle and the aqueduct. The truck’s structure is complex, with its bumper, front frame, engine, and cargo box having a significant influence on the dynamic response during the impact process. Therefore, the precise specification of the shape, size, contact mode, and material constitutive parameters for each component of the truck can effectively improve the accuracy of the simulation results for the vehicle impact on the aqueduct structure. This paper selects the F800 medium-sized truck model released by the National Collision Research Center (NCAC), as shown in Figure 1. The overall dimensions of the vehicle model are 8.6 m × 2.4 m × 3.3 m, with a total of approximately 35,000 elements; the net weight of the vehicle is 5.27 tons, and the rated maximum mass is 12 tons, which can be adjusted by modifying the cargo density. In this study, the vehicle’s mass is set to 8.25 tons. The bumper and cargo box are made of steel plates, which are modeled using elastic–plastic plate and shell elements. The engine and cargo are modeled using linear elastic solid elements, with elastic moduli of 110 GPa and 2 GPa, respectively. The truck model is widely used in vehicle–bridge collision research and has been validated through numerous collision experiments, demonstrating good reliability [22,23,24].
The numerical model of the vehicle impacting the aqueduct is shown in Figure 1. In this model, the vehicle and aqueduct are defined as independent parts, and the automatic surface contact algorithm (*Contact_Automatic_Surface_To_Surface) is used to simulate the interaction between the vehicle and the aqueduct. The contact coefficient, SOFT, is set to 1, and the static and dynamic friction coefficients are set to 0.3 [25]. The vehicle impact velocity is defined using the *Initial_Velocity_Generation keyword. Additionally, the Flanagan–Belytschko stiffness formulation is employed for hourglass control to prevent element distortion and zero-energy modes.

2.2. Material Models and Numerical Algorithm

In LS-DYNA, users can select appropriate material constitutive models to reflect the behavior of the materials. Concrete is modeled using constant stress solid elements and defined by the continuous surface cap model (CSCM) (or *Mat_159). This model accounts for hardening, damage, and strain rate effects, and demonstrates excellent performance in simulating the dynamic mechanical properties of concrete under strong dynamic load, such as those encountered during impact simulations [26]. The model parameters of C40 concrete (standard condition) are shown in Table 2.
The reinforcement material is modeled using the Hughes–Liu beam element and defined by the Mat_Plastic_Kinrmatic (*Mat_003) material model. The model employs the Von-Mises yield criterion and considers the effect of strain rate on the yield strength of the reinforcement, thereby accelerating the solution. The strain rate is calculated using the Cowper–Symonds equation, and the yield stress is scaled using the strain rate factor as follows:
σ y = 1 + ε ˙ C 1 / p σ 0 + β E p ε e f f
In the equation, ε ˙ is the strain rate; σ 0 is the initial yield stress; β is the sclerosis parameter; Ep is the plastic hardening modulus; ε e f f is equivalent plastic strain; and C and p are strain rate parameters.
As a novel cement-based composite material, ultra-high-performance concrete (UHPC) is characterized by a high cement content, fine aggregates, low porosity, ultra-high strength, exceptional toughness, and excellent durability; it holds significant potential for applications in structural reinforcement and protection engineering [27,28,29,30]. In the development of the numerical model for the anti-collision box, the UHPC material is represented using constant stress solid elements and defined by a continuous surface cap model (CSCM) (or *Mat_159) [31].
Rubber concrete is a composite material created by incorporating rubber particles into concrete mortar; it exhibits characteristics such as light weight [32], crack resistance [33], high energy absorption [34], and high ductility, and it has garnered widespread attention in fields such as road construction, bridge engineering, and building design [15]. In the development of a numerical model for the anti-collision box, rubber concrete is modeled using constant stress solid elements and defined by the Mat_John_Sonz_Holmquist_Concrete (*Mat_111) material model [15].
Aluminum foam is a novel functional material that combines the properties of both metal and foam; it is characterized by light weight, corrosion resistance, and effective energy absorption [35,36]. In the development of the numerical model for the anti-collision box, aluminum foam is modeled using constant stress solid elements and defined by the Mat_Crushable_Foam (*Mat_063) material model [37].
Rubber is a highly elastic polymer material with reversible deformation, and it has been widely used in the design and manufacture of buffer materials [38]. In the development of the numerical model for the anti-collision box, rubber is modeled using constant stress solid elements and defined by the Mat_Mooney_Rivlin_Rubber (*Mat_027) material model [39].
Table 2. Material model parameters.
ModelNotationParameterMagnitude
*Mat_003RO (kg/m3)Mass density7850
E (MPa)Young’s modulus2.06 × 105
PRPoisson’s ratio0.3
SIGY (MPa)Yield stress400/335
ETANTangent modulus2060
BETAHardening parameter1
SRCStrain rate parameter, c40.4
SRPStrain rate parameter, p5
FSFailure strain for eroding elements0.2
*Mat_027
[39]
RO (kg/m3)Mass density1600
PRPoisson’s ratio0.4995
A (MPa)Material constant0.6
B (MPa)Material constant0.15
*Mat_063
[37]
RO (kg/m3)Mass density1200
E (MPa)Young’s modulus1200
PRPoisson’s ratio0.3
TSC (MPa)Tensile stress cutoff10
*Mat_111
[15]
RO (kg/m3)Mass density2375
G (MPa)Shear modulus1.15 × 104
ANormalized cohesive strength0.79
BNormalized pressure hardening1.6
CStrain rate coefficient0.007
NPressure hardening exponent0.61
FC (MPa)Quasi-static uniaxial compressive strength24.5
T (MPa)Maximum tensile hydrostatic pressure3.1
EPS0Reference strain rate1 × 10−6
EFMINAmount of plastic strain before fracture0.01
SFMAXNormalized maximum strength7
PC (MPa)Crushing pressure13.7
UCCrushing volumetric strain0.0006
PL (MPa)Locking pressure800
ULLocking volumetric strain0.095
D1Damage constant0.03
D2Damage constant1
K1 (MPa)Pressure constant8.5 × 104
K2 (MPa)Pressure constant−1.71 × 10⁵
K3 (MPa)Pressure constant2.08 × 105
FSFailure type0.003
*Mat_159
(UHPC)
[31]
RO (kg/m3)Mass density2500
NHHardening initiation0
CHHardening rate0
G (MPa)Shear modulus1.8 × 1010
K (MPa)Bulk modulus2.5 × 1010
α (MPa)Triaxial compression surface constant term4.59 × 1010
θTriaxial compression surface linear term0.2873
λ (MPa)Triaxial compression surface nonlinear term3.65 × 107
β (MPa−1)Triaxial compression surface exponent1.26 × 10−8
α1 (MPa)Torsion surface constant term1
θ1Torsion surface linear term0
λ1 (MPa)Torsion surface nonlinear term0.4226
β1 (MPa−1)Torsion surface exponent1.277 × 10−9
α2 (MPa)Triaxial extension surface constant term1
θ2Triaxial extension surface linear term0
λ2 (MPa)Triaxial extension surface nonlinear term0.5
β2 (MPa−1)Triaxial extension surface exponent1.277 × 10−9
RCap aspect ratio6
X0 (MPa)Cap initial location6 × 108
WMaximum plastic volume compaction0.05
D1 (MPa−1)Linear shape parameter6 × 10−10
D2 (MPa−1)Quadratic shape parameter0
BDuctile shape softening parameter100
GFCFracture energy in uniaxial stress1 × 104
DBrittle shape softening parameter 0.1
GFTFracture energy in uniaxial tension1000
GFSFracture energy in pure shear stress1000
pwrcShear-to-compression transition parameter5
pwrtShear-to-tension transition parameter1
pmodModify moderate pressure softening parameter0
η0cRate effects parameter for uniaxial compressive stress1.83 × 10−4
NcRate effects power for uniaxial compressive stress0.504
η0tRate effects parameter for uniaxial tensile stress1.76 × 10−5
NtRate effects power for uniaxial tensile stress0.56
overcMaximum overstress allowed in compression1.05 × 108
overtMaximum overstress allowed in tension7.76 × 106
SrateRatio of effective shear stress to tensile stress fluidity 1
repowPower which increases fracture energy with rate effects1
*Mat_159
(Concrete)
[26]
RO (kg/m3)Mass density2500
IRATERate effect options1
ERODEElement erosion1.1
FPC (MPa)Unconfined compression strength40
DAGG (mm)Maximum aggregate size25
The material composition of water and air is defined using the keyword *ALE_Multi_ Material_Group. The water body was modeled using the Mat_Null material model, which has no shear stiffness or yield strength, combined with the Gruneisen Equation of State (EOS), and the pressure was defined as:
p = ρ 0 C 2 μ 1 + 1 γ 0 2 μ a 2 μ 2 1 S 1 1 μ S 2 μ 2 μ + 1 S 3 μ 3 μ + 1 2 2 + ( γ 0 + a μ ) E
μ = ρ i / ρ 0 1
For intumescent materials,
p = ρ 0 C 2 μ + γ 0 + a μ E
In the equation, C, Si (i = 1, 2, 3), γ0, and A are infinite programmatic constants, ρ0 is the initial density, and E is the internal energy per unit of reference water volume. Table 3 lists the material model and EOS parameters of the water body [40].
Air is simulated as a gas using the Mat_Null material model combined with the Linear_Polynomial equation of state, with zero shear stiffness. The pressure is defined as:
p = C 0 + C 1 μ + C 2 μ 2 + C 3 μ 3 + ( C 4 + C 5 μ + C 6 μ 2 ) E
In the equation, Cr (r = 1, 2, …, 6) is the hydrodynamic constant and E is the internal energy per unit volume of reference air. Table 3 lists the material model and EOS parameters for air [40].

3. Results

3.1. Energy Analysis

The speed limit on truck roads is generally 80 km/h. Numerical simulations indicate that under low-speed impact conditions of 40 km/h and 60 km/h, the aqueduct experiences only concrete damage and slight steel reinforcement yielding in the impact area, with the overall structure remaining stable; therefore, this paper conducts a dynamic response analysis of the collision process between the vehicle and the aqueduct under the most unfavorable impact speed condition of 80 km/h. The energy changes during the vehicle’s impact on the aqueduct are shown in Figure 2. Throughout the impact process, the initial kinetic energy is progressively converted into internal energy and hourglass energy, while the total energy fluctuates slightly but remains largely unchanged. In this paper, the vehicle is modeled using Belytschko–Tsay shell elements, and the concrete is modeled using solid elements, both of which are solved using the single-point integral method. However, during the calculation process, the grid elements tend to distort into a zigzag shape, leading to the formation of a zero-energy mode, also known as an hourglass. To ensure solution accuracy, the hourglass energy must be controlled within 5% of the total energy [41]. Under these conditions, the hourglass energy generated is 12.10 kJ, which accounts for only 0.094% of the total energy, thereby verifying the reliability of the established numerical model.

3.2. Impact Force and Damage Analysis

Figure 3 shows the dynamic response time history curve and the lateral displacement curve (along the impact direction) at different heights of the bent frame. From Figure 3a, it can be observed that the impact on the aqueduct occurs in four distinct stages. The first stage is the bumper impact; with a peak impact force of 368 kN, stress is confined to the bumper impact area, causing minor concrete damage, as shown in Figure 4. Among them, blue represents the state of no damage to the structure, from green to yellow to red, representing the degree of damage continues to increase until failure. The second stage involves the impact of the front frame; with the peak impact force reaching 1156 kN, at this point, the bumper is curled and deformed, the concrete in the impact area of the bent frame is significantly damaged, and the bent frame begins to produce lateral displacement, as shown in Figure 3b. The third stage involves the engine impact; at this stage, the peak impact force reaches 4389 kN, and the tensile stress on the back impact side of the bent frame exceeds the tensile strength of the concrete, leading to bending cracks. The shear failure of the concrete at the bottom of the bent frame causes the maximum lateral displacement in the impacted area of the bent frame to increase rapidly to 10.8 mm. The fourth stage is the cargo box impact; under the continuous action of the impact load, the crack extends from the impact area to the top of the bent frame and adjacent bent frame, and the overall damage range and severity of the aqueduct continue to increase, leading to bending failure on the back impact side of the bent frame, the maximum lateral displacement in the impact area reaches 35.3 mm. Due to the time required for the propagation of the stress wave, the peak lateral displacement at the top of the bent frame occurs with a delay compared to the peak impact force, as shown in Figure 3a.
Notably, during the impact process, the height at which the maximum lateral displacement occurs decreases from 2000 mm to 500 mm, as illustrated by the yellow arrow in Figure 3b. From Figure 4, it can be observed that as the impact progresses, the cargo box tilts forward due to inertia, compressing the front of the vehicle. This causes the overall downward movement of the vehicle’s impact center, leading to a corresponding change in the height of the maximum lateral displacement. After the impact, the core concrete layer of the impacted bent frame is partially retained, and the steel bar does not completely fail; therefore, the cracks will not lead to progressive collapse under this condition, but there is a very high safety risk.

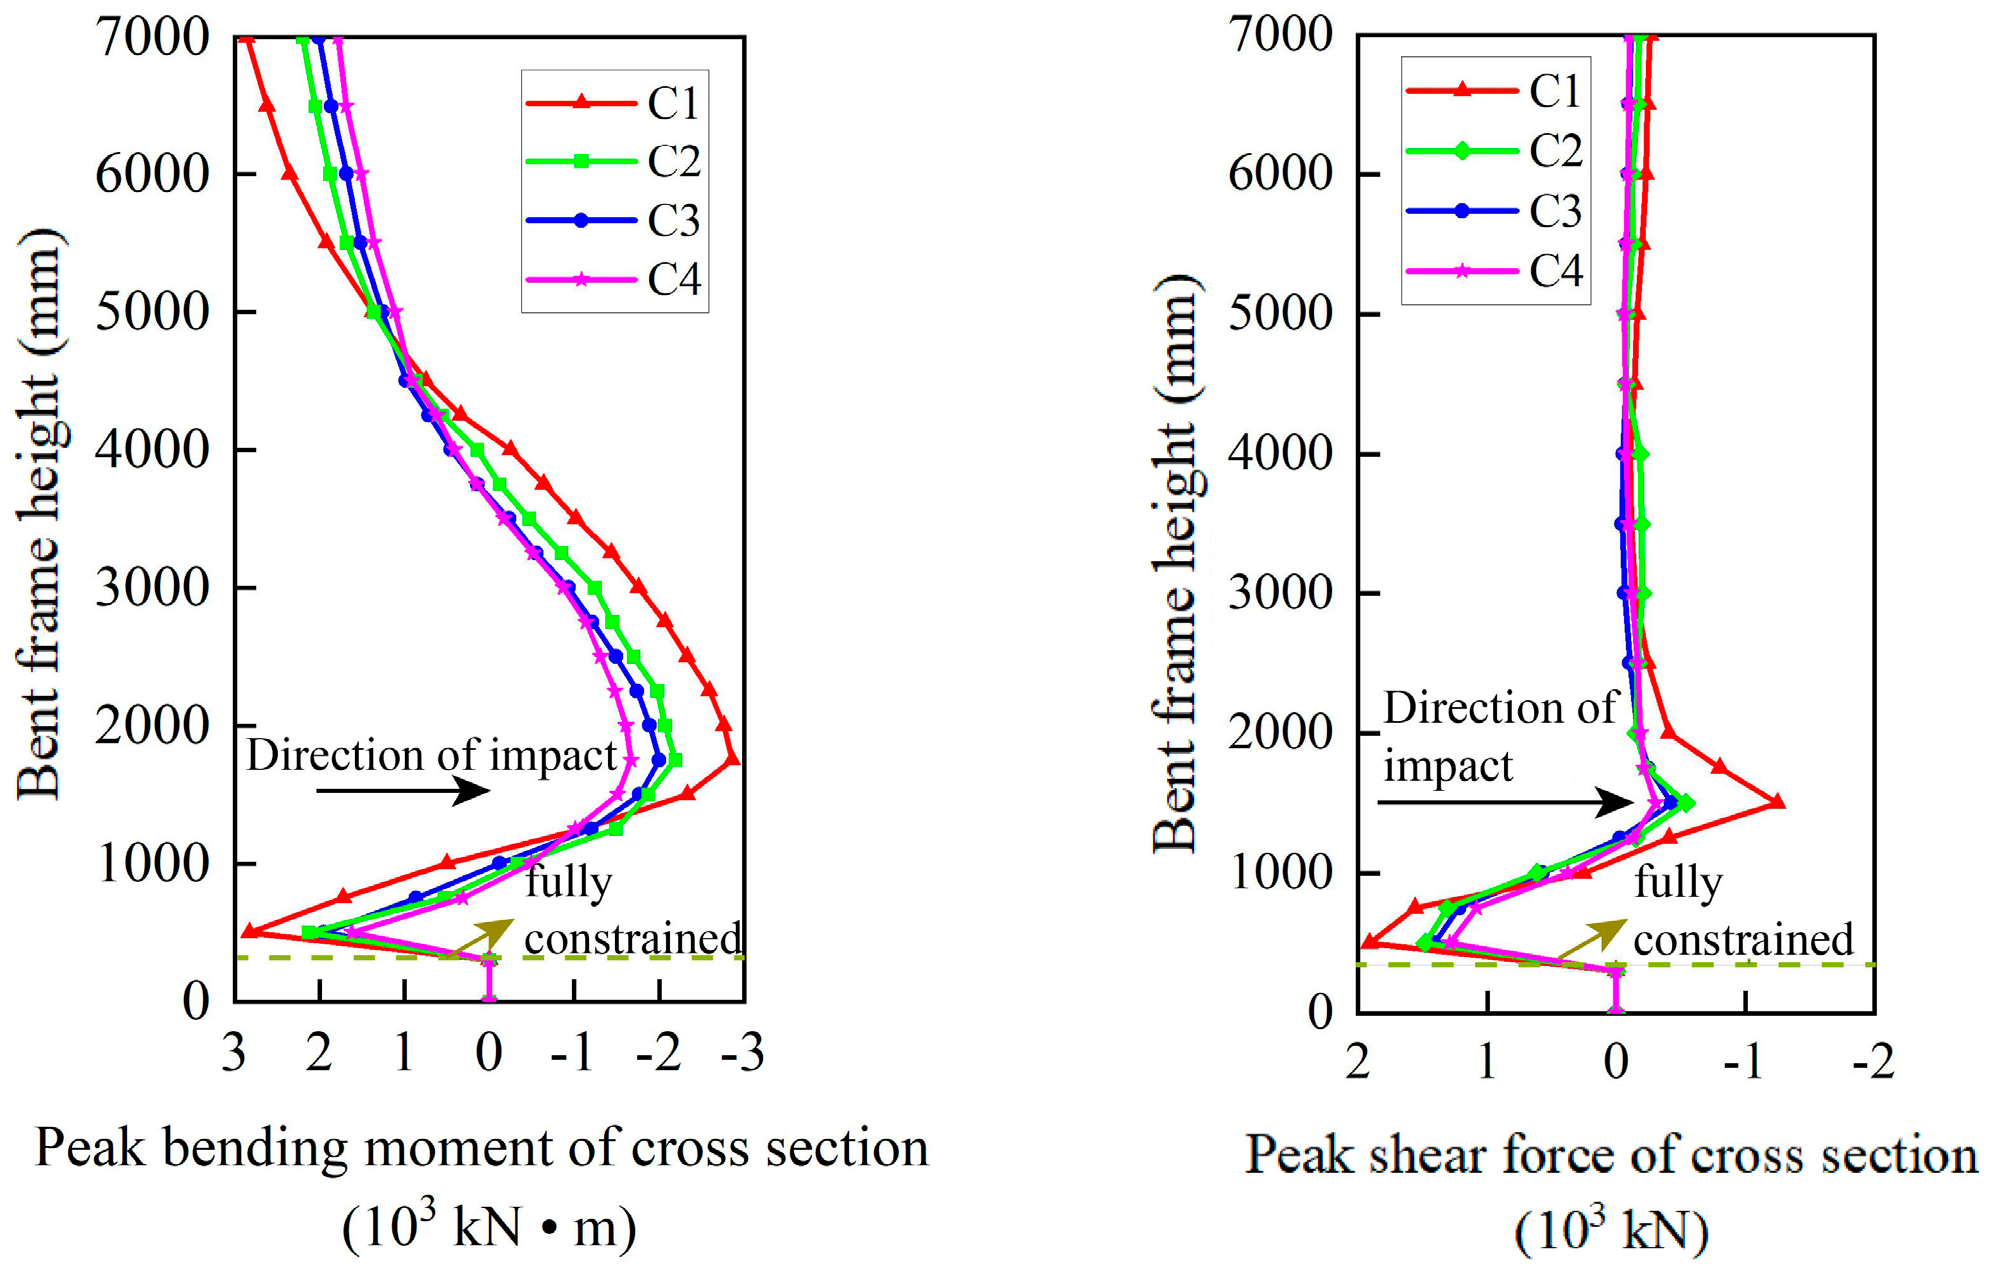
3.3. Internal Force Analysis

It is stipulated that the shear force and bending moment on the collision side of the bent frame are positive, while the shear force and bending moment on the opposite side are negative. The internal forces at different stages of the collision process are extracted along the height of the bent frame, and the internal force distribution of the aqueduct bent frame is presented in Figure 5. It can be observed that the bending moment of the bent frame primarily occurs in three typical sections: the bottom of the bent frame, the impact area, and the top of the bent frame. The shear force of the bent frame primarily occurs in two typical sections: the bottom of the bent frame and the impact area. During the bumper impact stage, due to the peak impact force of 368 kN, the internal force across the entire section of the impacted bent frame is small and mainly concentrated in the impact area. Under the continuous action of the impact load, the bending moment and shear force at the typical sections of the impacted bent frame increase progressively, reaching their peak values during the engine impact stage. At this point, the shear force at the bottom section of the impacted bent frame reaches 1916 kN, causing shear failure of the concrete, with some units ceasing to function. As a result, both the bending moment and shear force at this section decrease to a certain extent during the cargo box impact stage, as shown in Figure 5d.
The fixed supports at both ends of the aqueduct’s cap beam effectively constrain the displacement of the trough body. Numerical simulation analysis shows that the lateral displacement of the trough body is similar to the lateral displacement at the top of the bent frame. Therefore, in the case of a stable bent frame, the trough body will not slip or fall. During the impact process, the impacted bent frame undergoes plastic deformation and absorbs most of the impact’s kinetic energy, while the damage to the adjacent bent frame is significantly lower than that of the impacted bent frame.

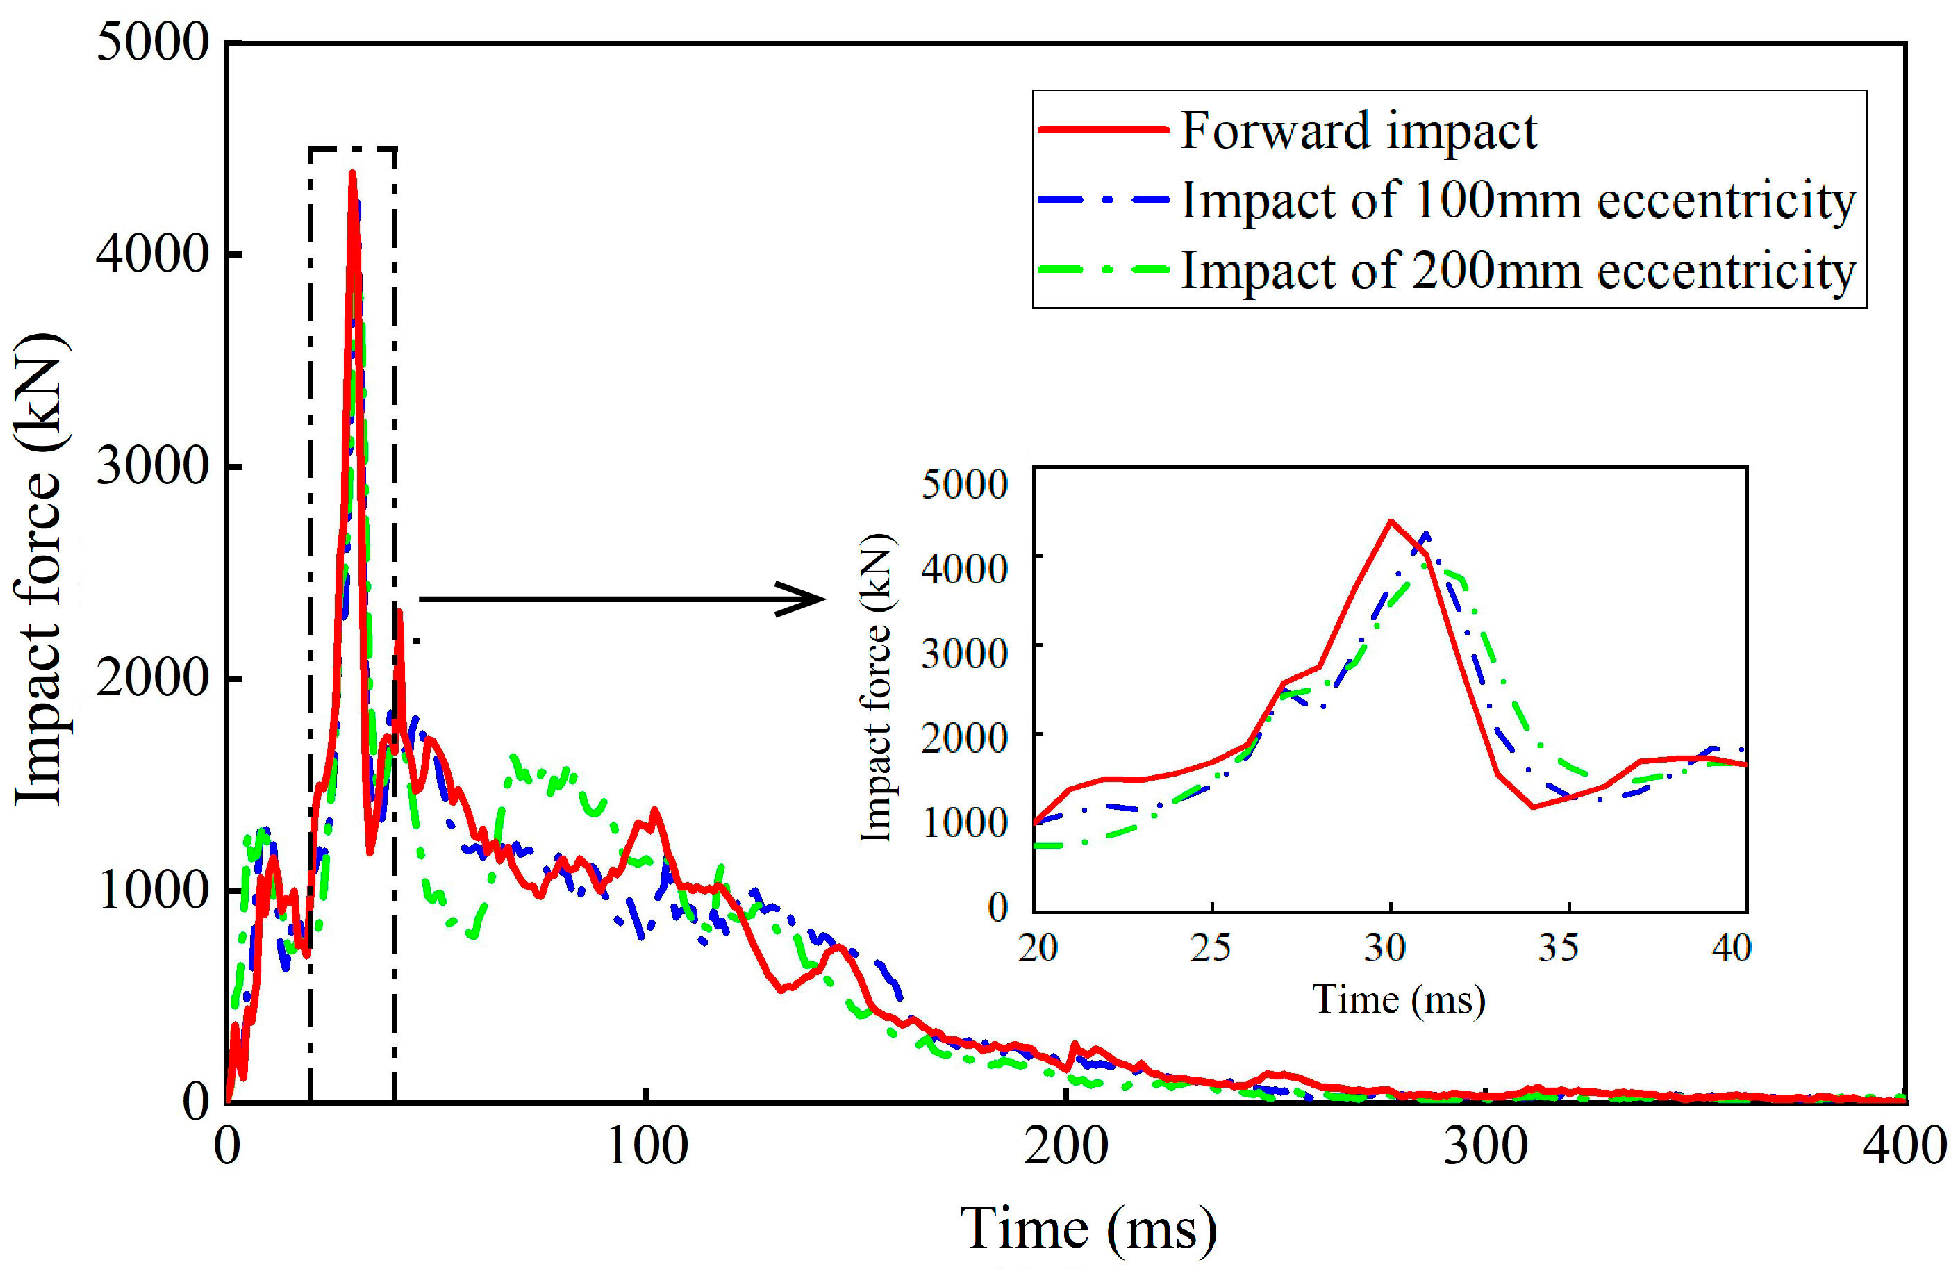
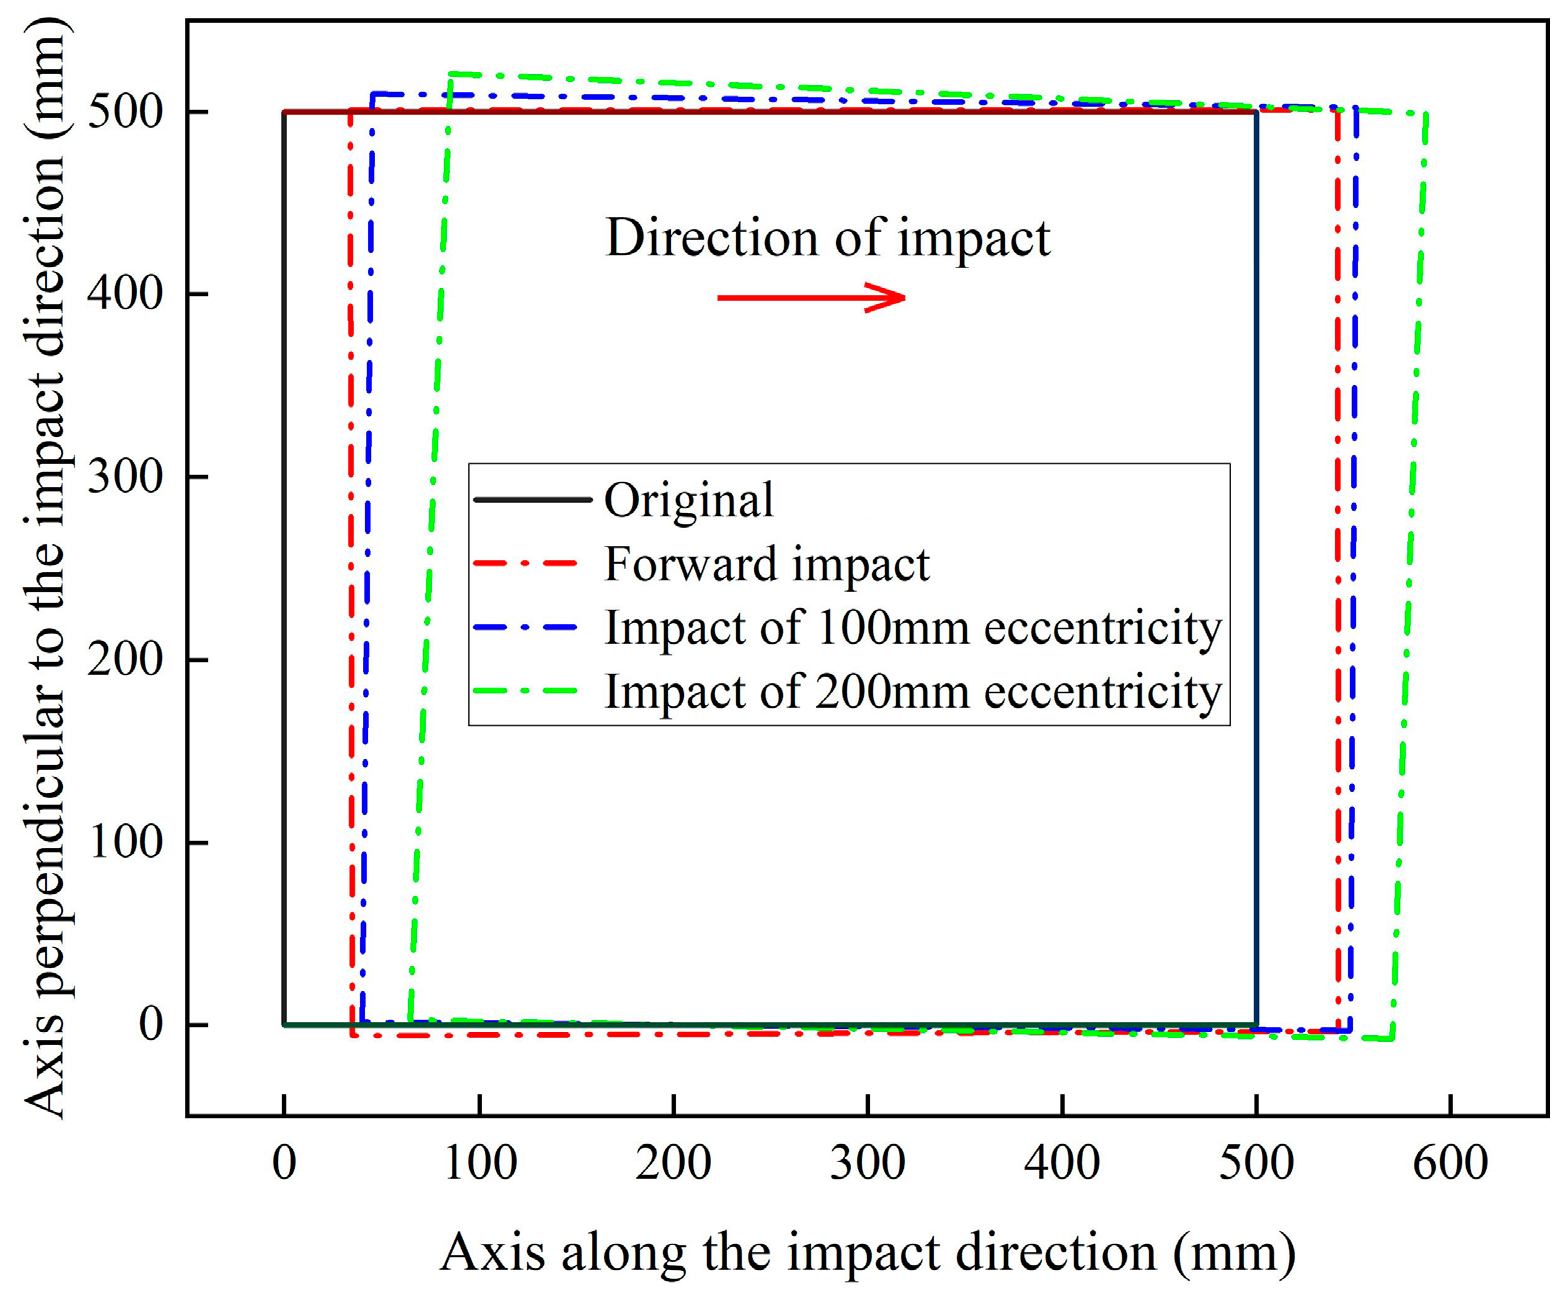
3.4. Impact Eccentricity Analysis

The impact eccentricity refers to the vertical distance between the line of action of the impact force and the center of mass of the struck bent frame. According to statistics of impact accident data, eccentric impact is the most common type of collision. However, current numerical studies on vehicle impact primarily focus on direct (forward) impact, with limited research on eccentric impact [42]. Based on this, this section uses the forward impact (eccentricity = 0 mm) as a reference and sets two impact eccentricity conditions of 100 mm and 200 mm for comparative analysis. The off-center distance is defined as the horizontal distance between the central axes of the aqueduct bent frame and the truck, as viewed from the top, and can be modified by shifting the truck’s position perpendicular to the direction of impact (Figure 6). Figure 7 presents the time history curves of the impact force under varying impact eccentricities. It is evident that the peak impact force is inversely correlated with the impact eccentricity, as the peak force is primarily determined by the translational kinetic energy. Assuming constant initial kinetic energy, an increase in impact eccentricity leads to a rise in rotational kinetic energy and a decrease in translational kinetic energy.
Figure 8 presents the residual displacement at a height of 500 mm (the location of maximum impact depth) along the bent frame for different impact eccentricities. The residual displacement of the bent frame is observed to be positively correlated with the impact eccentricity. This observation suggests that increasing eccentricity amplifies the torsional response of the bent frame, which results in greater displacement. This is due to the fact that eccentric impact induces significant torsional deformation in the bent frame, thereby reducing its shear and bending resistance to some extent [25]. As the eccentricity increases, the torque generated by the vehicle impact intensifies, resulting in a more pronounced torsional response.

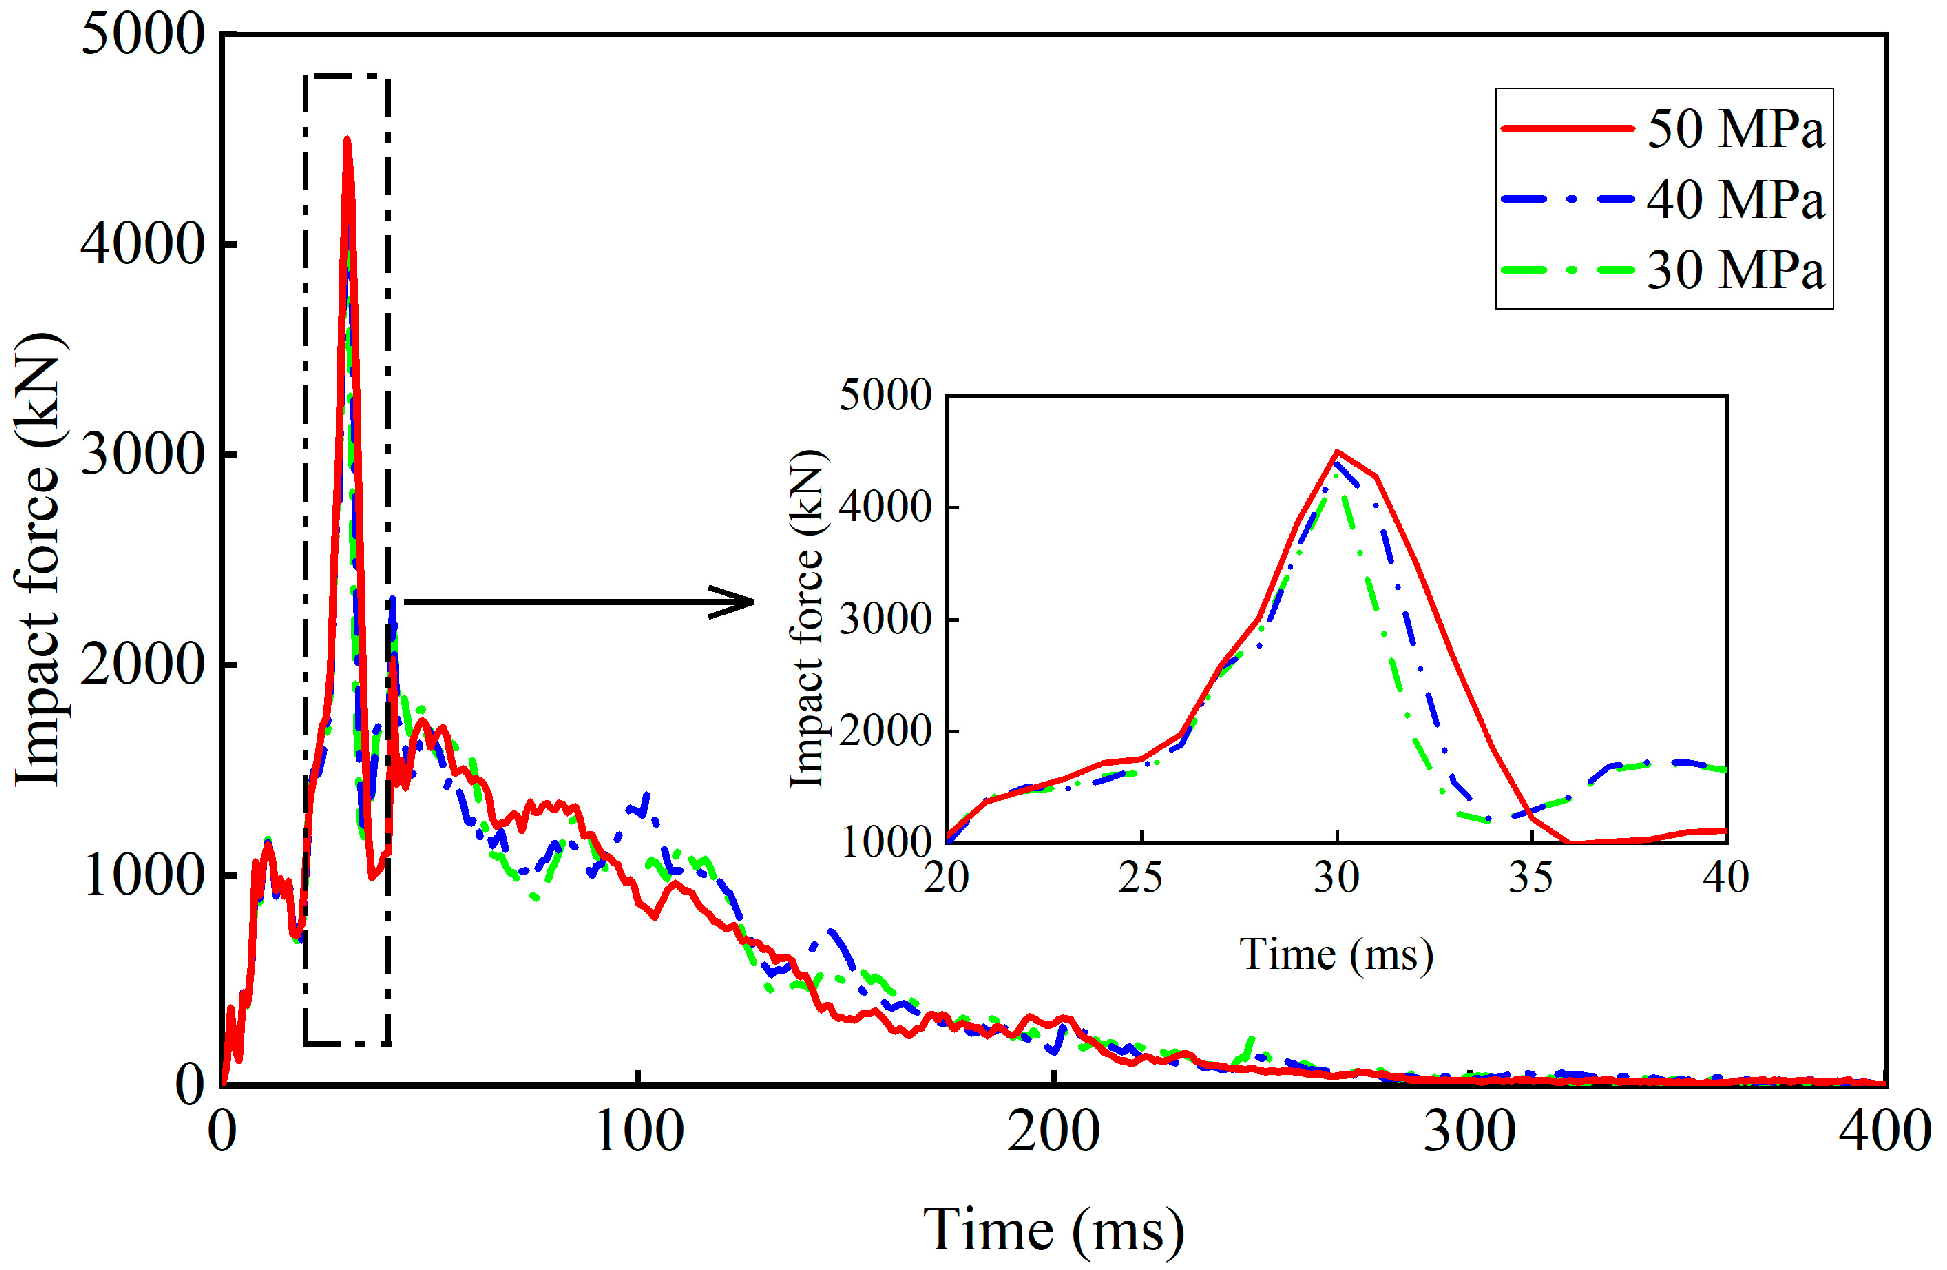
3.5. Concrete Strength Analysis

Figure 9 and Figure 10 present the time history curves of the impact force and lateral displacement at the top of the bent frame for different concrete compressive strengths (30 MPa, 40 MPa, and 50 MPa). As the concrete strength increases, the peak impact force rises, while the maximum lateral displacement and residual displacement at the top of the bent frame decrease to some extent. This is due to the positive correlation between peak impact force and contact stiffness, with high-strength concrete exhibiting greater stiffness, thereby enhancing impact resistance.
Figure 11 illustrates the damage distribution diagram of the aqueduct for varying concrete strengths. It can be observed that, with increasing concrete strength, the overall damage distribution of the bent frame, the extent of bending failure on the back impact side, and the degree of shear failure in the impacted area all decrease significantly. This is because high-strength concrete possesses higher ultimate compressive and tensile strengths, making it more difficult for the stress generated during the impact process to reach the ultimate stress values. Coupled with the dense internal structure of high-strength concrete, it effectively stores impact kinetic energy as elastic deformation and releases it after impact, whereas lower-strength concrete dissipates energy through the formation of internal micro-cracks and other damage mechanisms.

4. Discussion

Currently, research on the anti-collision performance of aqueduct structures, both in China and internationally, remains underdeveloped, and many aqueducts continue to be either ‘unprotected’ or inadequately protected. Based on the aforementioned analysis of the aqueduct’s dynamic response and damage mechanisms, this study proposes three anti-collision strategies: a rubber concrete outer box with a rubber filling layer, a UHPC outer box with a foam aluminum filling layer, and a rubber concrete outer box with a foam aluminum filling layer. The effectiveness of these measures in reducing damage to the aqueduct is evaluated through numerical simulations. The operating parameters and corresponding results are presented in Table 4. Fmax is the peak impact force.

4.1. Aqueduct Model with Anti-Collision Measures

Figure 12 presents the numerical model of the aqueduct structure incorporating anti-collision measures. The anti-collision system consists of a box structure, composed of an outer box and a filling layer. The thickness of each layer is 50 mm, resulting in a total thickness of 100 mm, with a height of 2100 mm. The reinforcing steel mesh is arranged in the outer box to prevent the anti-collision measures from cracking prematurely under the impact and losing the protective effect. The diameter of the steel bar is 6 mm, and the stirrup spacing is 100 mm. The automatic surface-to-surface contact algorithm is applied between the vehicle, outer box, filling layer, and aqueduct, with both the static and dynamic friction coefficients set to 0.3. The aqueduct structure continues to use the standard working condition parameters, and uses the impact velocity of 80 km/h to test the protective effect of different anti-collision measures on the aqueduct structure.

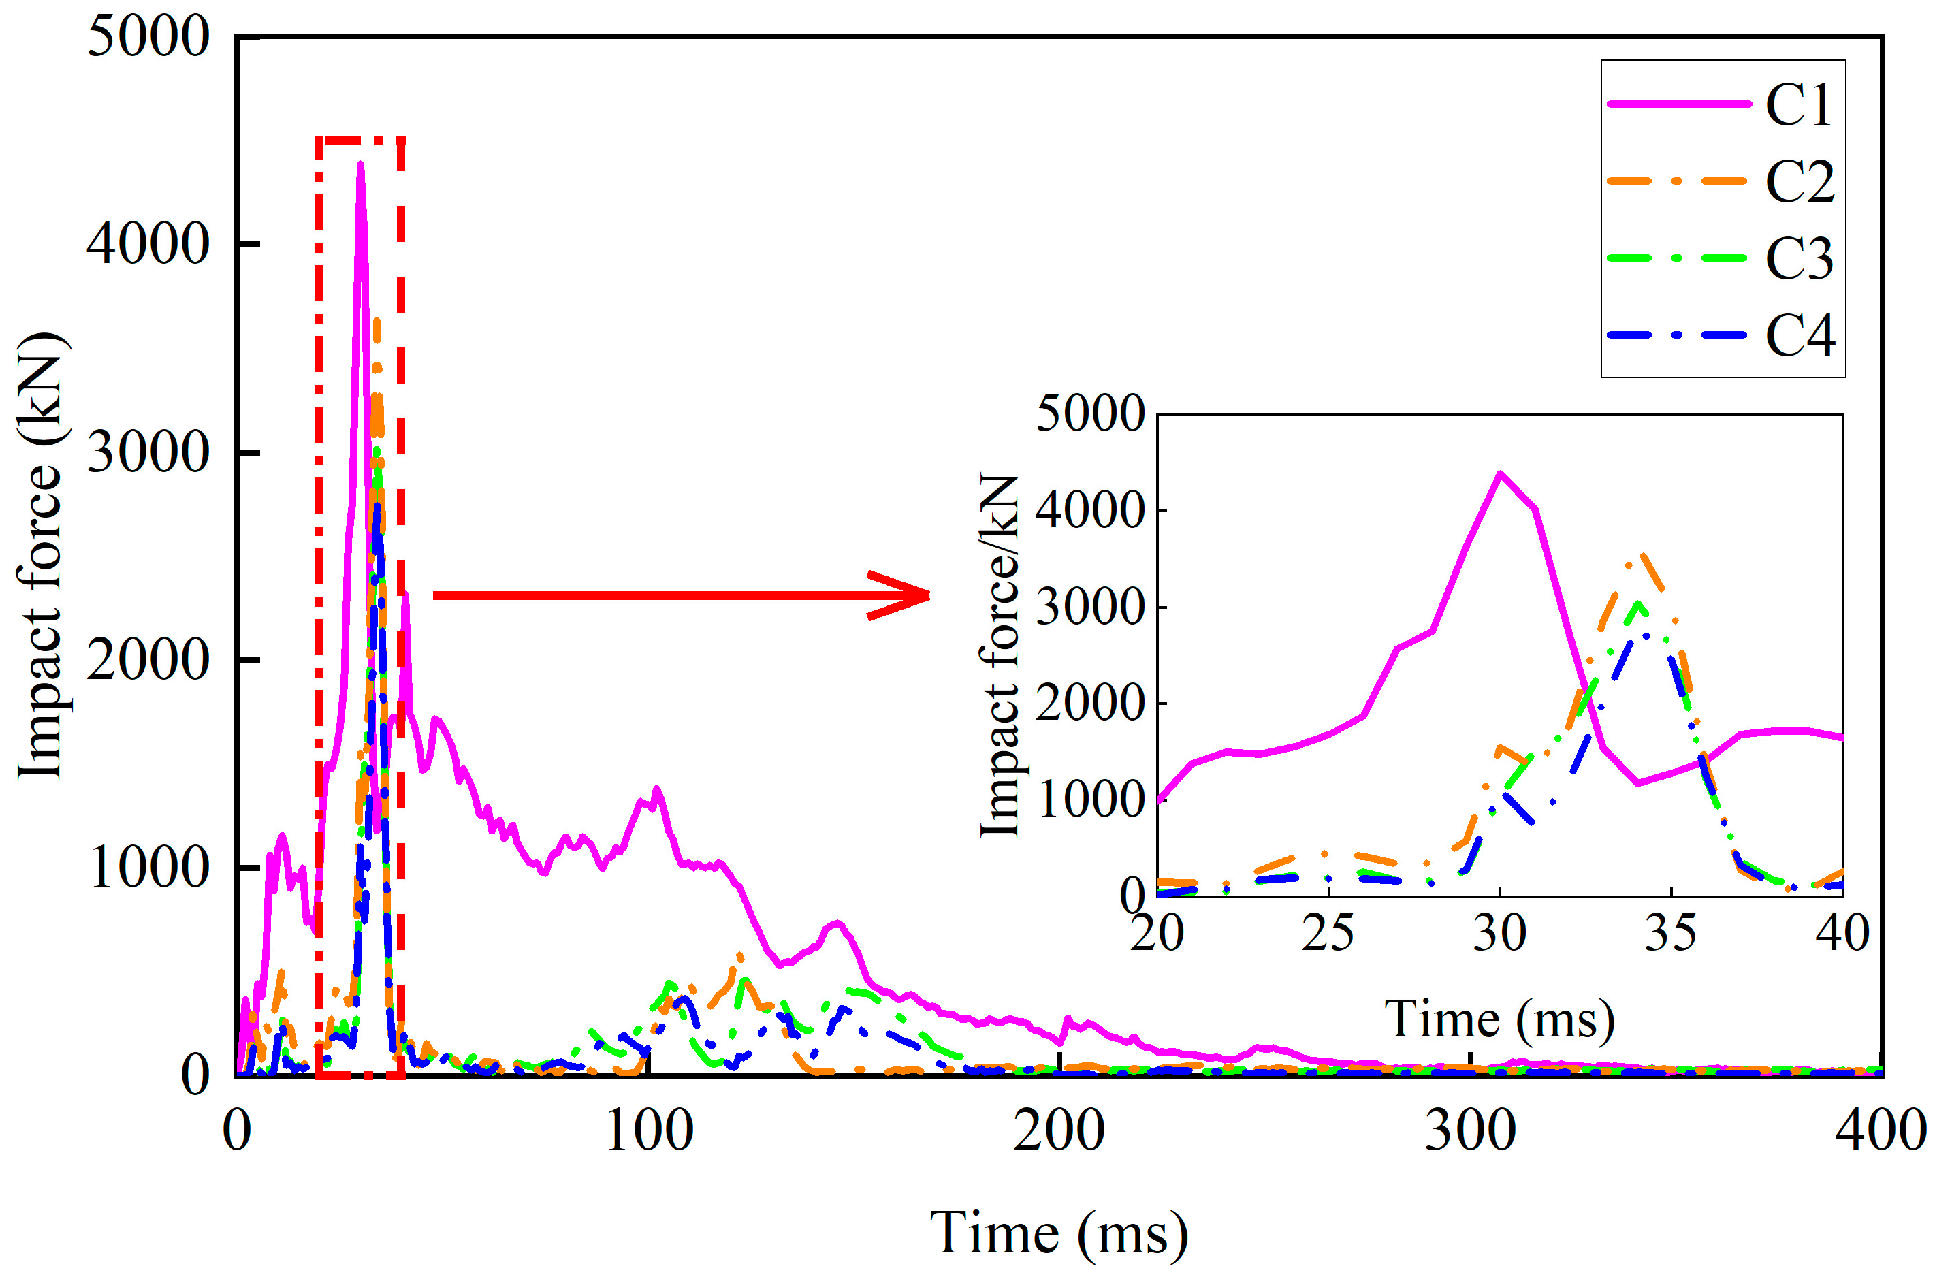
4.2. Comparative Analysis of Dynamic Response Results

4.2.1. Energy Dissipation

During the impact process, UHPC absorbs energy through the formation and propagation of internal micro-cracks, as well as friction between various components, such as the cement matrix and fibers. In rubber concrete, rubber particles convert impact energy into elastic potential energy, while the concrete matrix absorbs energy through the formation and propagation of internal micro-cracks. Rubber absorbs energy through viscous flow via elastic deformation and relative sliding between molecular chains, while aluminum foam absorbs energy through plastic deformation and friction within its internal pore structure.
In this paper, the energy dissipation under different anti-collision measures is obtained by analyzing the internal energy curve of the anti-collision box and the components of the aqueduct, as shown in Figure 13. It is evident that the anti-collision structure, under the three proposed anti-collision measures, exhibits a significant advantage in absorbing impact kinetic energy. The energy absorption ratios of the anti-collision box under conditions C2, C3, and C4 are 56%, 81%, and 84%, respectively. Among them, under the condition of C4, the energy absorption ratio of the rubber concrete outer box reaches 53%, which is the main energy absorption component, and the energy absorption ratio of the foam aluminum filling layer reaches 31%; this anti-collision measure has the most significant protective effect on the aqueduct.

4.2.2. Internal Force Response

Figure 14 presents the time history curve of the impact force when the vehicle impacts the aqueduct under different anti-collision measures. It is evident that the three anti-collision measures effectively reduce the vehicle’s impact force. Compared to the C1 condition, which lacks anti-collision measures, the peak impact forces in the C2, C3, and C4 conditions are reduced by 17%, 31%, and 37%, respectively. The internal forces of each section along the height of the bent frame at different times during the impact process are extracted, resulting in the peak bending moment and shear force diagrams, as shown in Figure 15. It is evident that, after implementing the anti-collision measures, both the bending moment and shear force at the typical cross-section are reduced compared to the condition without anti-collision measures, with the C4 condition showing the most significant reduction.

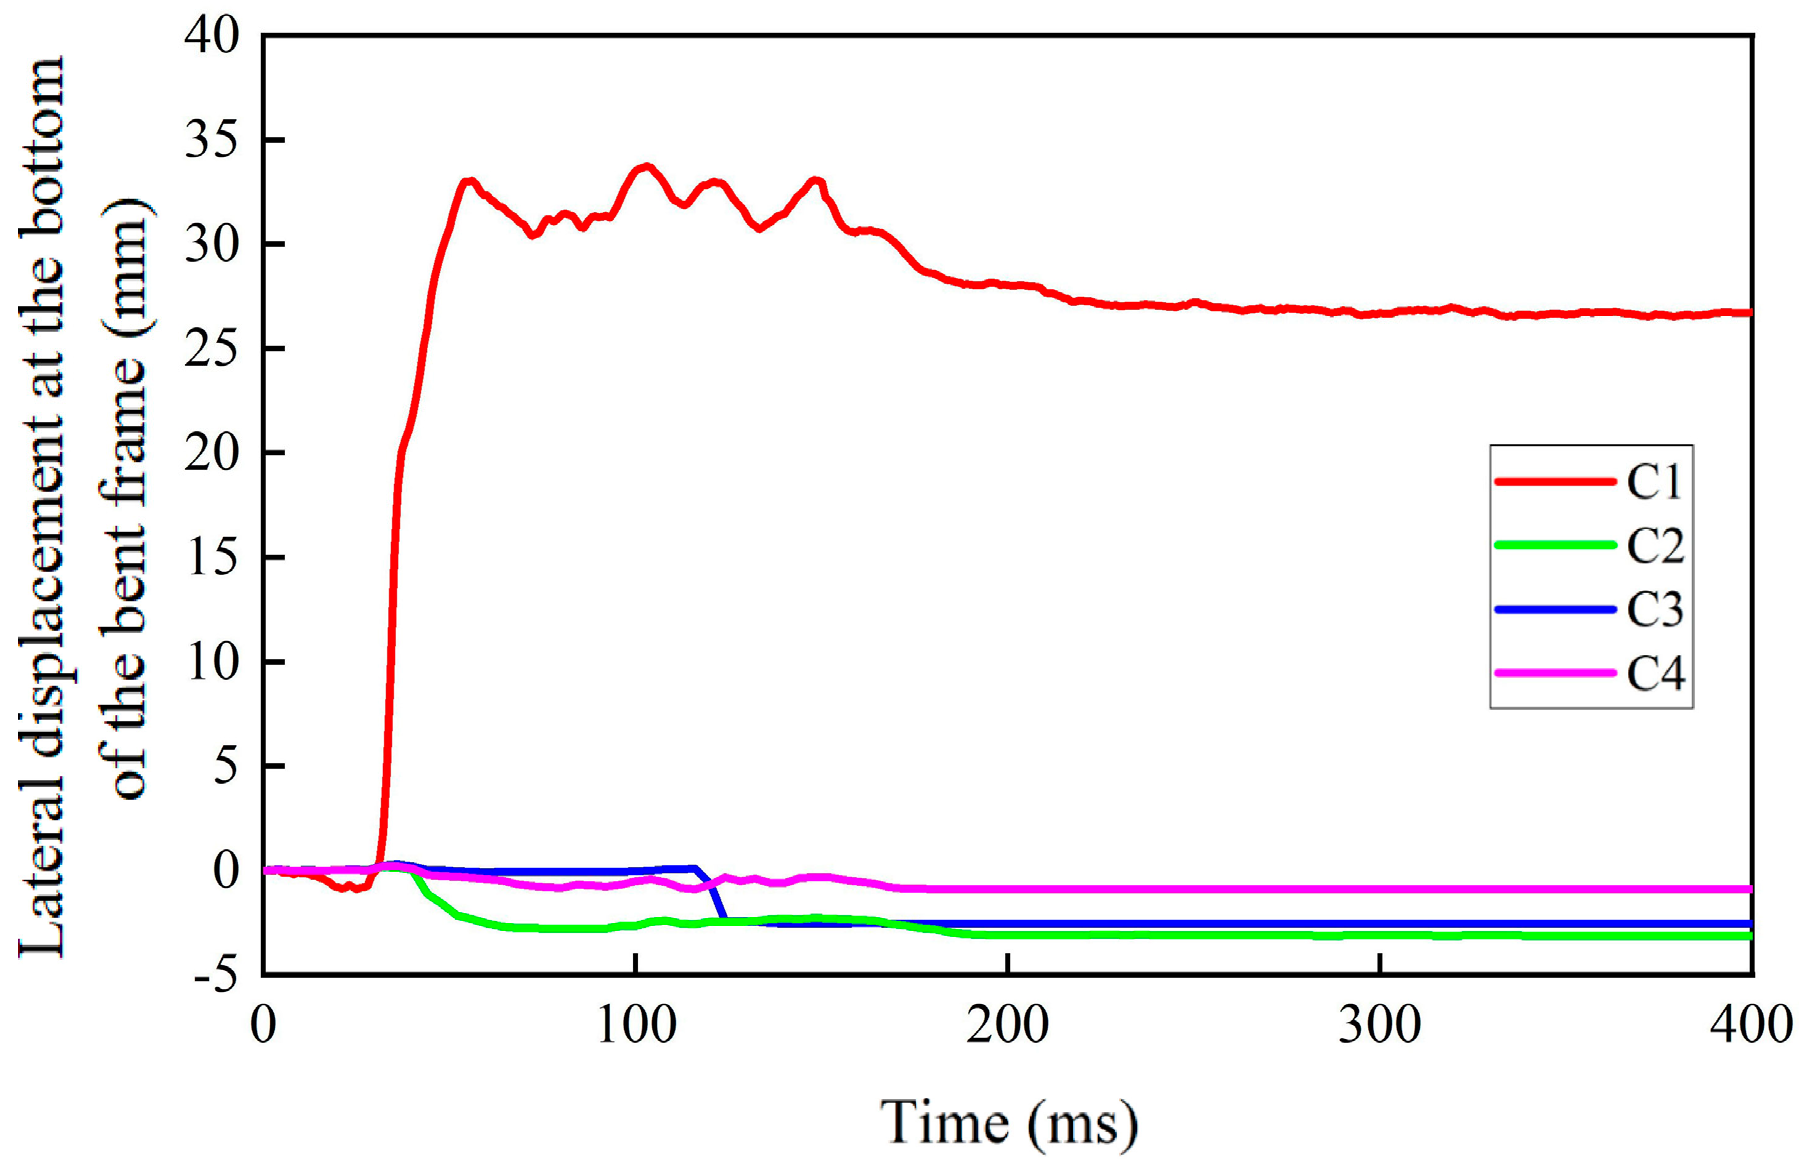
4.2.3. Displacement Response

This section utilizes lateral residual displacement at three typical positions—the bottom of the bent frame, the impact area, and the top of the bent frame—as evaluation indices to assess the effectiveness of the three anti-collision measures in improving the aqueduct structure’s collision resistance. Figure 16, Figure 17 and Figure 18 present the lateral displacements at the bottom, impact area, and top of the bent frame under various anti-collision measures. Compared to the aqueduct structure without anti-collision measures, the lateral residual displacements at the bottom, impact area, and top of the aqueduct bent frame are significantly reduced by 88.3%, 97.8%, and 88.5%, respectively, when anti-collision measures are applied. Notably, the C4 condition demonstrates the most significant reductions, with decreases of 96.7%, 99.4%, and 93.1%, respectively. Therefore, all three anti-collision measures effectively protect the aqueduct structure during the vehicle impact.

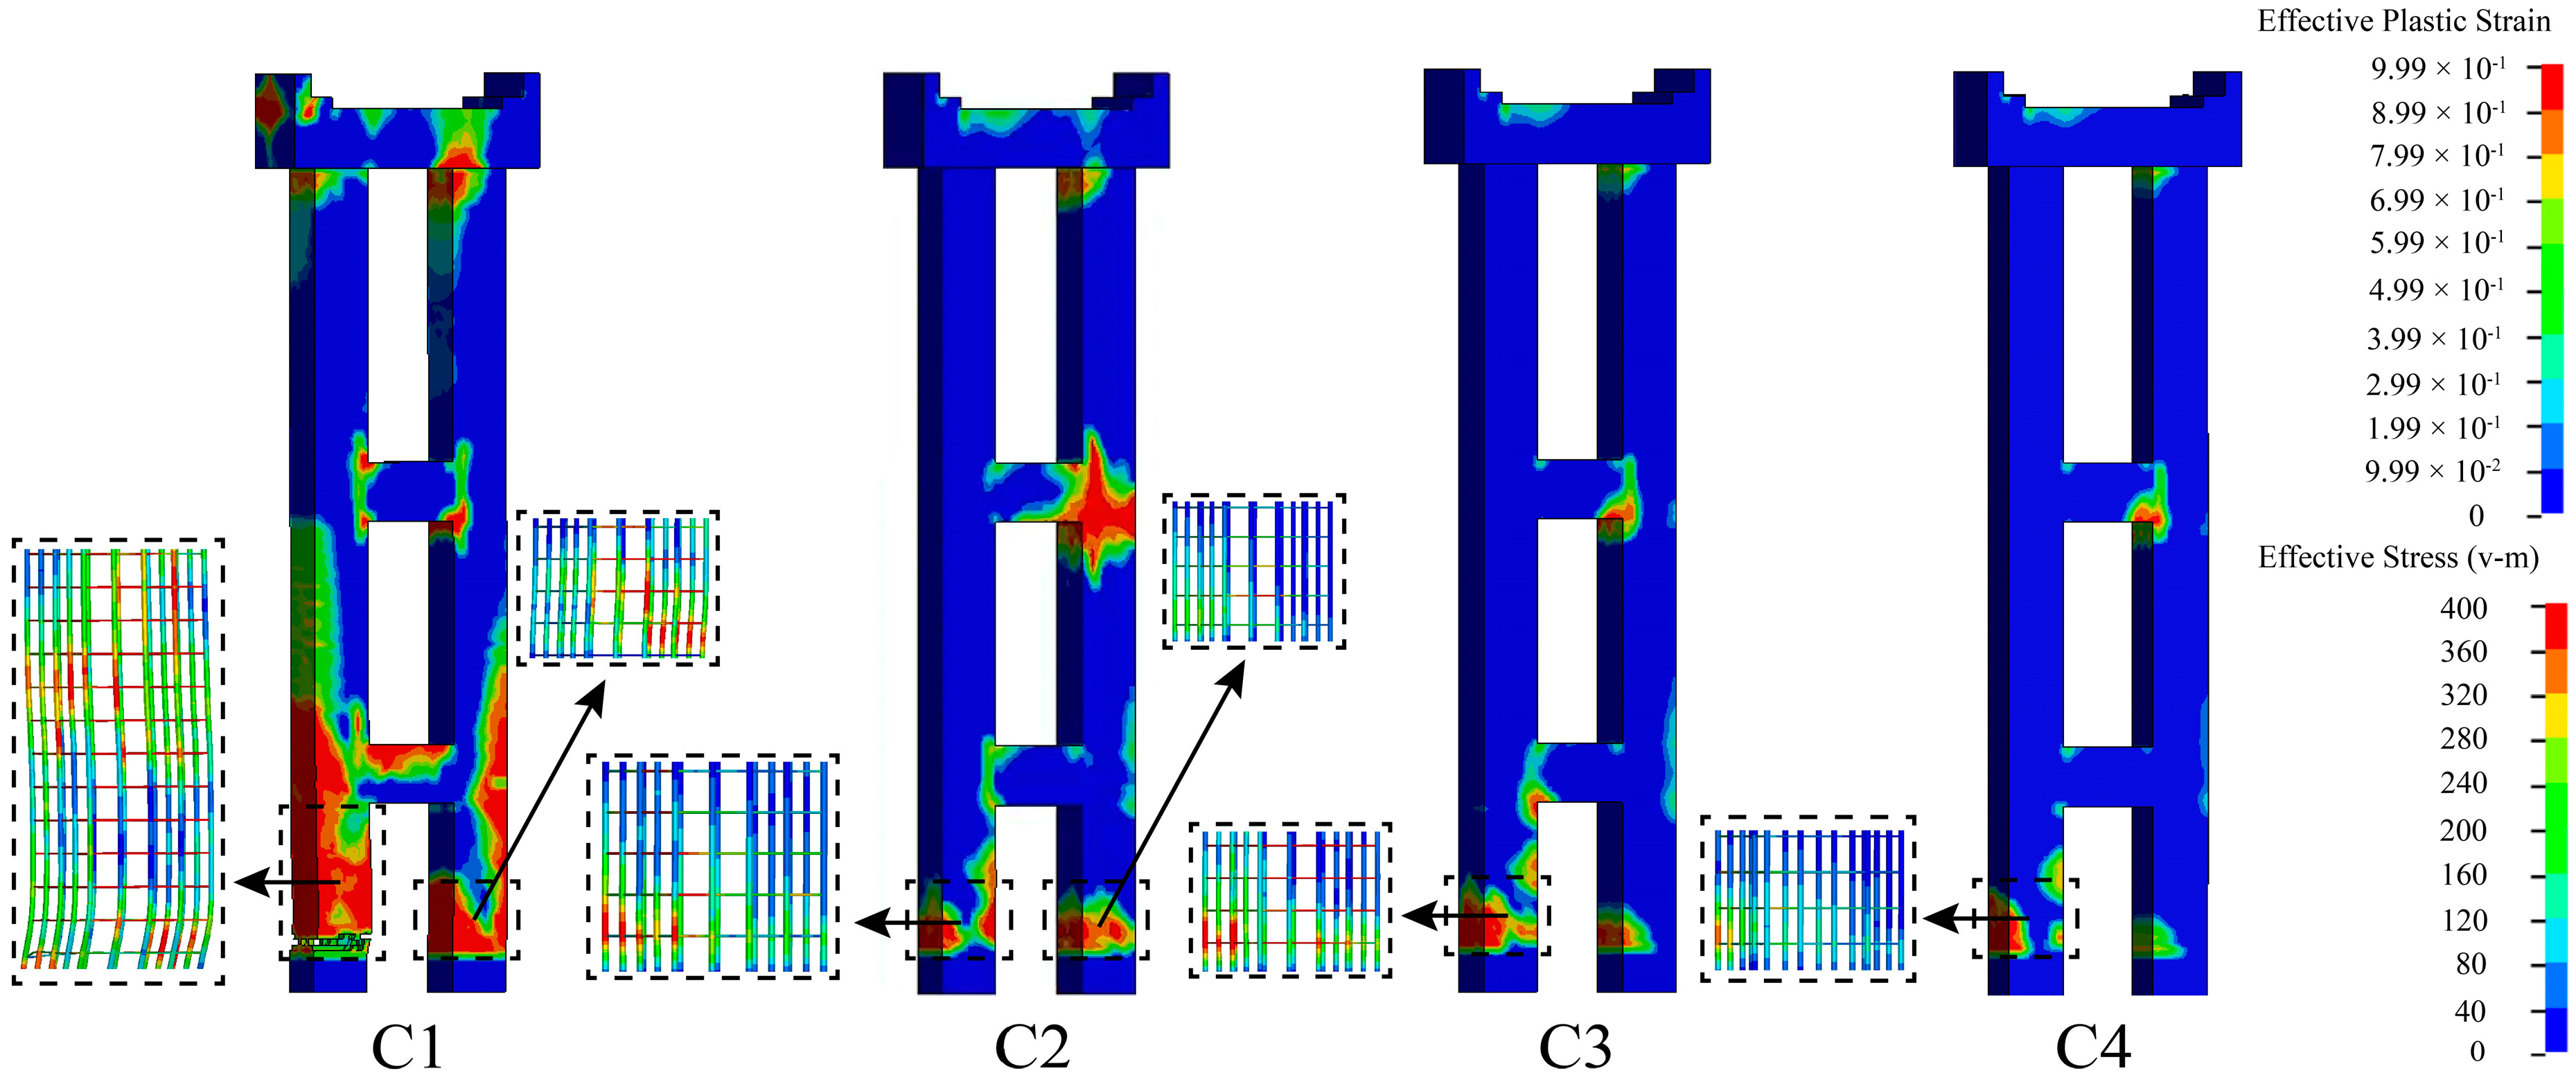
4.2.4. Damage Feature

As shown in Section 3.2, the aqueduct experiences the most severe damage under vehicle impact. This section presents the plastic strain of the concrete and the effective stress distribution of the steel bars under various anti-collision measures following the vehicle impact, as shown in Figure 19. Compared to the aqueduct structure without anti-collision measures, the damage extent and severity are significantly reduced when anti-collision measures are applied. This reduction is primarily observed in the concrete shear deformation at the bottom of the bent frame and the bending damage on the back collision side. Under C3 and C4 conditions, only a portion of the steel bars at the bottom of the impacted bent frame yield.

5. Conclusions

This paper establishes a refined numerical model to simulate vehicle–aqueduct impact and investigates the influence of varying impact eccentricities and concrete strength on the dynamic response characteristics of the aqueduct structure under vehicle impact. Furthermore, three novel anti-collision devices are proposed, and their energy absorption effects are compared and analyzed. The key conclusions of this study are as follows:
(1)
The dynamic impact process of a vehicle on an aqueduct structure can be categorized into four stages: bumper impact, frame impact, engine impact, and cargo box impact. Notably, the shear failure of the concrete at the bottom of the impacted side of the bent frame, caused by the engine and cargo box impact, along with the bending failure of the concrete on the rear impact side, are the primary contributors to the instability and failure of the aqueduct structure.
(2)
Eccentric impact induces substantial torsional deformation of the aqueduct bent frame, thereby reducing its shear and bending resistance, which leads to more severe impact damage and greater residual deformation.
(3)
The peak impact force exhibits a positive correlation with concrete strength during vehicle impact on the aqueduct. Conversely, the lateral displacement at the top of the impacted bent frame shows a negative correlation with concrete strength. Enhancing concrete strength significantly improves the aqueduct structure’s resistance to vehicle impact.
(4)
The three anti-collision measures proposed in this paper effectively protect the aqueduct structure during the impact process. Notably, the anti-collision performance is most pronounced when the rubber concrete outer box with a foam aluminum filling layer is employed.
Despite the significant strides made in this research, certain limitations are acknowledged. Firstly, this study is limited to the forward impact condition, which means that the dynamic response characteristics of the aqueduct structure under different impact angles have not been explored. Additionally, the aqueduct is affected by the natural environment during long-term use, and it is prone to durability problems such as concrete panels cracking and steel bar corrosion. Therefore, it is engaging to evaluate the dynamic response of aqueduct structures with different aging degrees under vehicle impacts. Moreover, in future work, it would be interesting to use the plastic rotation angle to evaluate the damage degree of the aqueduct bent frame.

Author Contributions

Conceptualization, W.W., R.W. and L.C.; methodology, J.S.; software, J.S., Y.Z. and L.D.; validation, J.S., Y.Z. and L.D.; formal analysis, J.S.; investigation, J.S., Y.Z. and L.D.; resources, W.W.; data curation, J.S.; writing—original draft preparation, J.S.; writing—review and editing, W.W., R.W. and L.C.; visualization, J.S.; supervision, W.W.; project administration, W.W.; funding acquisition, W.W. All authors have read and agreed to the published version of the manuscript.

Funding

This research was funded by the Natural Science Foundation of Jiangsu Province (No. BK20220986) and the Fundamental Research Funds for the Central Universities (No. B220201029).

Data Availability Statement

The original contributions presented in this study are included in the article. Further inquiries can be directed to the corresponding author.

Conflicts of Interest

Authors Rui Wen and Li Chen were employed by Shanghai Investigation, Design & Research Institute Co., Ltd. The remaining authors declare that the research was conducted in the absence of any commercial or financial relationships that could be construed as a potential conflict of interest.

References

  1. Shen, J.J.; Bai, X.L. Research on temporal and spatial difference model of urban water use for water-saving construction. J. Hohai Univ. (Nat. Sci.) 2022, 50, 38–43. [Google Scholar]
  2. Li, K.B.; Tao, J. Study on water resources utilization efficiency and its influencing factors in China. J. Hydraul. Eng. 2024, 43, 11–23. [Google Scholar]
  3. Chen, X.N.; Jin, Y.G. Thinking on smart water dispatching in the South-to-North Water Diversion Middle Route Project. J. Hohai Univ. (Nat. Sci.) 2023, 51, 46–55. [Google Scholar]
  4. Li, J.; Cui, D.H. Safety detection and evaluation of aqueduct supporting structure under lateral impact load. Pearl River 2023, 44, 89–96. [Google Scholar]
  5. Gu, P.Y.; Wang, L.L. Summary of research on typical failure characteristics of aqueduct structures in China. Adv. Sci. Technol. Water Res. 2017, 37, 1–8. [Google Scholar]
  6. Nan, J.J. Research on disease treatment and roughness reduction protection technology of aqueduct in large irrigation area. Tech. Supply Water Res. 2023, 1, 195–198. [Google Scholar]
  7. Huang, L.; Hou, Y. Collision in the expansion joint effects on the seismic behavior of large-scale aqueduct. J. Asian Arch. Build. Eng. 2021, 20, 663–673. [Google Scholar] [CrossRef]
  8. Du, M.; Zhang, S.; Wang, C.; She, L.; Li, J.; Lu, T. Seismic fragility assessment of aqueduct bent structures subjected to mainshock-aftershock sequences. J. Eng. Struct. 2023, 292, 116505. [Google Scholar] [CrossRef]
  9. Du, M.; Zhang, S.; Wang, C.; Li, Z.; Yao, J.; Lu, T. Development of the compound intensity measure and seismic performance assessment for aqueduct structures considering fluid-structure interaction. J. Ocean Eng. 2024, 311, 118838. [Google Scholar] [CrossRef]
  10. Su, Z.Q.; Wang, J.M.; Yan, Q.L. Reliability analysis of water-crossing bridge under ship collision based on surrogate model. Highways 2023, 68, 176–181. [Google Scholar]
  11. Thilakarathna, H.M.I.; Thambiratnam, D.P.; Dhanasekar, M. Numerical simulation of axially loaded concrete columns under transverse impact and vulnerability assessment. Int. J. Impact Eng. 2010, 37, 1100–1112. [Google Scholar] [CrossRef]
  12. Do, T.V.; Pham, T.M.; Hao, H. Dynamic responses and failure modes of bridge columns under vehicle collision. Eng. Struct. 2018, 156, 243–259. [Google Scholar] [CrossRef]
  13. Chen, L.; Zeng, Y.Y.; Yan, Z.F. Dynamic response and damage characteristics of reinforced concrete piers under vehicle impact. J. Vib. Shock 2019, 38, 261–267. [Google Scholar]
  14. Wang, B.; Liu, J.; Yang, S. Design and numerical analysis of flexible anti-collision device for bridge pier. Jidian Gongcheng 2016, 33, 30–36. [Google Scholar]
  15. Liu, B.; Yang, S.; Li, W. Damping dissipation properties of rubberized concrete and its application in anti-collision of bridge piers. Constr. Build. Mater. 2020, 236, 117286. [Google Scholar] [CrossRef]
  16. Hirt, C.W.; Amsden, A.A.; Cook, J.L. An arbitrary lagrangian-eulerian computing method for all flow speeds. J. Comput. Phys. 1974, 14, 227–253. [Google Scholar] [CrossRef]
  17. Milan, K.; Mikhail, S. Conservative Multi-Material Remap for Staggered Multi-Material Arbitrary Lagrangian-Eulerian Methods. J. Comput. Phys. 2014, 258, 268–304. [Google Scholar]
  18. Zeng, Q.H.; Sun, W.J. MOF-MMALE Numerical Simulation of Multi-Material Large Deformation Flow Problems. Appl. Math. Mech. 2014, 35, 1163–1176. [Google Scholar]
  19. Xue, M.A.; Kargbo, O.; Zheng, J. Seiche oscillations of layered fluids in a closed rectangular tank with wave damping mechanism. Ocean Eng. 2020, 196, 106842. [Google Scholar] [CrossRef]
  20. Yu, C.C.; Mir, F.U.H.; Whittaker, A.S. Validation of numerical models for seismic fluid-structure-interaction analysis of nuclear, safety-related equipment. Nucl. Eng. Des. 2021, 379, 111179. [Google Scholar] [CrossRef]
  21. Zhang, D.X.; Liu, P.S.; Zhang, C.J. Study on the Applicability of Fluid-Solid Interaction Model of Dynamic Analysis of Aqueduct Structure. J. North China Univ. Water Res. Electr. Power (Nat. Sci. Ed.) 2024, 10, 1–9. [Google Scholar]
  22. Abdelkarim, O.I.; Elgawady, M.A. Performance of Bridge Piers Under Vehicle Collision. Eng. Struct. 2017, 140, 337–352. [Google Scholar] [CrossRef]
  23. Li, R.W.; Wu, H.; Yang, Q.T. Vehicular impact resistance of seismic designed RC bridge piers. Eng. Struct. 2020, 220, 111015. [Google Scholar] [CrossRef]
  24. Li, R.W.; Cao, D.S.; Wu, H. Collapse analysis and damage evaluation of typical simply supported double-pier RC bridge under truck collision. Structures 2021, 33, 3222–3238. [Google Scholar] [CrossRef]
  25. Li, R.W.; Zhou, D.Y.; Wu, H. Experimental and numerical study on impact resistance of RC bridge piers under lateral impact loading. Eng. Fail. Anal. 2019, 109, 104319. [Google Scholar] [CrossRef]
  26. Meng, Y.; Yi, W.J. Study on dynamic effect of concrete cylinder specimen under low velocity impact. J. Vib. Shock 2011, 30, 205–210. [Google Scholar]
  27. Du, J.; Meng, W.; Khayat, K.H. New development of ultra-high-performance concrete (UHPC). Compos. Part B Eng. 2021, 224, 109220. [Google Scholar] [CrossRef]
  28. Hung, C.C.; El-Tawil, S.; Chao, S.H. A review of developments and challenges for UHPC in structural engineering: Behavior, analysis, and design. J. Struct. Eng. 2021, 147, 03121001. [Google Scholar] [CrossRef]
  29. Bajaber, M.A.; Hakeem, I.Y. UHPC evolution, development, and utilization in construction: A review. J. Mater. Res. Technol. 2021, 10, 1058–1074. [Google Scholar] [CrossRef]
  30. Bahmani, H.; Mostafaei, H.; Santos, P.; Fallah Chamasemani, N. Enhancing the Mechanical Properties of Ultra-High-Performance Concrete (UHPC) Through Silica Sand Replacement with Steel Slag. Buildings 2024, 14, 3520. [Google Scholar] [CrossRef]
  31. Wang, W.; Wu, C.; Li, J. Behavior of ultra-high performance fiber-reinforced concrete (UHPFRC) filled steel tubular members under lateral impact loading. Int. J. Impact Eng. 2019, 132, 103314. [Google Scholar] [CrossRef]
  32. Liu, F.; Chen, G.; Li, L. Study of impact performance of rubber reinforced concrete. Constr. Build. Mater. 2012, 36, 604–616. [Google Scholar] [CrossRef]
  33. Turatsinze, A.; Bonnet, S.; Granju, J.L. Potential of rubber aggregates to modify properties of cement based-mortars:improvement in cracking shrinkage resistance. Constr. Build. Mater. 2007, 21, 176–181. [Google Scholar] [CrossRef]
  34. Xue, J.; Shinozuka, M. Rubberized concrete: A green structural material with enhanced energy-dissipation capability. Constr. Build. Mater. 2013, 42, 196–204. [Google Scholar] [CrossRef]
  35. Wu, Z.L.; Xu, X.X.; Liu, L. Experimental study on the compression and energy-absorbing properties of anti-collision energy-absorbing materials, metal foam, and aluminum. Transp. Sci. Technol. 2008, 4, 74–77. [Google Scholar]
  36. Wang, D.P.; Li, W.; He, S.M. Study on optimization of impact structure of bridge piers across debris flow reinforced by aluminum foam sandwich panels. J. Vib. Shock 2016, 35, 108–114. [Google Scholar]
  37. Li, Z.M.; Yang, X.D.; Hu, Q. Low-speed impact energy absorption performance of aluminum foam. Hot Work. Technol. 2019, 48, 29–33. [Google Scholar]
  38. Zabihi, A.; Fasihi, M.; Rasouli, S. Improving the mechanical properties and curing characteristics of styrene-butadiene rubber/butadiene rubber composites by incorporating silicon carbide. Polym. Compos. 2024, 45, 1676–1687. [Google Scholar] [CrossRef]
  39. Li, H.Y.; Zhou, L.Y.; Wang, Q. Research on key parameters and performance of new assembled steel-UHPC anti-ship collision device. J. Cent. South Univ. (Sci. Technol.) 2021, 52, 519–528. [Google Scholar]
  40. Truong, D.D.; Jang, B.S.; Janson, C.E. Benchmark study on slamming response of flat-stiffened plates considering fluid-structure interaction. Mar. Struct. 2021, 79, 103040. [Google Scholar] [CrossRef]
  41. Cao, R.; Agrawal, A.K.; El-Tawil, S. Heavy truck collision with bridge piers: Computational simulation study. J. Bridge Eng. 2019, 24, 04019052. [Google Scholar] [CrossRef]
  42. Xue, S.; Hao, H.; Hao, Y. Numerical investigation of impact response of bridge pier subjected to off-center vehicle collision. Eng. Struct. 2024, 317, 118624. [Google Scholar] [CrossRef]
Figure 1. Aqueduct and impact diagram.
Buildings 15 00851 g001
Figure 2. Energy change during the impact process.
Buildings 15 00851 g002
Figure 3. Dynamic response time history curve and lateral displacement along bent frame height curve. (a) Dynamic response time history curve. (b) Lateral displacement curve along height of the bent frame.
Buildings 15 00851 g003
Figure 4. Aqueduct damage distribution.
Buildings 15 00851 g004
Figure 5. Internal force distribution of aqueduct bent frame during impact process. (a) Bumper impact. (b) Frame impact. (c) Engine impact. (d) Cargo box impact.
Buildings 15 00851 g005
Figure 6. Schematic diagram of eccentric impact.
Buildings 15 00851 g006
Figure 7. Impact force time history curves of different eccentricity.
Buildings 15 00851 g007
Figure 8. Comparison of residual displacement of bent frame section under different impact eccentricities.
Buildings 15 00851 g008
Figure 9. Impact force time history curves under different concrete strengths.
Buildings 15 00851 g009
Figure 10. The time history curve of lateral displacement at the top of the bent frame under different concrete strengths.
Buildings 15 00851 g010
Figure 11. Aqueduct damage cloud diagram under different concrete strengths.
Buildings 15 00851 g011
Figure 12. Numerical model of aqueduct anti-collision measures.
Buildings 15 00851 g012
Figure 13. Energy dissipation under different anti-collision measures.
Buildings 15 00851 g013
Figure 14. Impact force time history curves under different anti-collision measures.
Buildings 15 00851 g014
Figure 15. Peak internal force of bent frame section under different anti-collision measures.
Buildings 15 00851 g015
Figure 16. Lateral displacement at the bottom of the bent frame under different anti-collision measures.
Buildings 15 00851 g016
Figure 17. Lateral displacement of the impact area of the bent under different anti-collision measures.
Buildings 15 00851 g017
Figure 18. Lateral displacement at the top of the bent under different anti-collision measures.
Buildings 15 00851 g018
Figure 19. Aqueduct damage cloud diagram under different anti-collision measures.
Buildings 15 00851 g019
Table 1. Statistics of aqueduct impact accidents in China.
DateLocationImpact PositionAqueduct Damage
August 2011Penghu Town, Fujian Province, ChinaBottom of the bent frameTrough body collapsed
December 2015Hezhuang Village, Zhejiang Province, ChinaBottom of the bent frameTrough body collapsed
August 2017Liangfeng Village, Sichuan Province, ChinaBottom of the bent frameTrough body collapsed
January 2018Lushan City, Jiangxi Province, ChinaBottom of the bent frameTrough body collapsed
August 2018Taoxi Town, Fujian Province, ChinaBottom of the bent frameTrough body slipped and fell
May 2019Wujiachong Caokouyan Irrigation District, Hunan Province, ChinaBottom of the bent frameTrough body collapsed
March 2020Tanlei Section of G4 Beijing-Hong Kong-Macao Expressway, ChinaBottom of the bent frameTrough body slipped
January 2021Majian Aqueduct, Jiangxi Province, ChinaBottom of the bent frameTrough body collapsed
May 2021Lintou Village, Zhejiang Province, ChinaBottom of the bent frameTrough body fractured
June 2023Shenhu Aqueduct, Hunan Province, ChinaBottom of the bent frameBent frame fractured
July 2023Shuangxikou Town, Hunan Province, ChinaTrough bodyCross beam fractured
Table 3. Materials and EOS parameters for air and water.
Notation (Air)Magnitude (Air)Notation (Water)Magnitude (Water)
ρ0 (kg/m3)1.225ρ0 (kg/m3)1000
C00C1.48 × 106
C10S11.921
C20S2−0.096
C30S30
C40.4γ00.35
C50.4A0
C60E (MPa)0.2895
E (MPa)0.25
Table 4. Working condition parameters and calculation results.
CaseAnti-Collision MeasuresFmax (kN)Peak Bending Moment of Cross-Section (kN•m)Peak Shear Force of the Section (kN)
BottomImpact AreaTopBottomImpact AreaTop
C1/43892817−286128741916−1250−264
C2rubber concrete–rubber36362139−219822151482−552−188
C3UHPC–aluminum30381950−200620321417−443−123
C4rubber concrete–aluminum27871625−167717841293−233−113
Disclaimer/Publisher’s Note: The statements, opinions and data contained in all publications are solely those of the individual author(s) and contributor(s) and not of MDPI and/or the editor(s). MDPI and/or the editor(s) disclaim responsibility for any injury to people or property resulting from any ideas, methods, instructions or products referred to in the content.

