1. Introduction
The increasing global focus on children’s rights highlights the necessity for urban environments that prioritize their safety and independence. The United Nations Children’s Fund (UNICEF) has developed several critical guidance documents aimed at promoting child-friendly urban environments. Notably, the guidance for “Building Child-Friendly Cities—A Framework for Action” explicitly recognizes “the ability to walk the streets safely and independently” as one of the 12 fundamental goals of children’s rights. This emphasis underscores the importance of independent mobility for children in urban settings. Furthermore, the Handbook of Child-Friendly Urban Planning: Making Cities Better for Children advocates the development of active and public transportation systems that cater to children and communities, thereby facilitating their independent movement. The emergence of the concept of “child-friendly cities” can be traced back to the Second United Nations Conference on Human Settlements in 1996, in which it was posited that urban planning should integrate the fundamental needs of children. In 2004, UNICEF further solidified this concept by issuing a framework that delineated 12 rights of children within urban environments. These rights included the ability to walk safely alone, engage socially with peers, and reside in a green, pollution-free environment. The focus of child-friendly city initiatives is on safeguarding children’s rights and addressing their unique needs, which have historically been overlooked in urban design.
Recently, China’s National Development and Reform Commission, along with other relevant departments, issued the “Guiding Opinions on Promoting the Construction of Child-Friendly Cities” in 2021. This document emphasizes the enhancement of safe travel experiences for children. It advocates for improvements to the slow traffic system, the planning and construction of sidewalks and bicycle lanes, and the optimization of pedestrian routes around schools. These regulations focus on safe and convenient access to educational facilities for primary school students, emphasizing the fact that primary school students should be able to reach school easily and safely and encouraging primary school students to walk to school. In China, numerous cities have actively engaged in child-friendly actions. Beijing has issued the “Implementation Plan for the Construction of Child-friendly Cities”, presenting 22 key tasks and advancing the construction of child-friendly cities based on five aspects: friendly policies, friendly services, friendly rights, friendly spaces, and friendly environments. The goal is to fully establish a child-friendly city by 2030. Specific measures include encouraging children to participate in community activities, such as by serving as “community small building door supervisors”, to enhance children’s sense of participation and belonging in urban life. Another measure involves promoting the child-friendly transformation of public spaces by adding “peace-of-mind school routes” and “loving zebra crossings”, improving the travel environment for children and ensuring their safe travel. Shanghai has released the “Three-Year Action Plan for Promoting the Construction of Child-Friendly Cities (2023–2025)”, which clearly defines the establishment of child-friendly policy systems and the construction of child participation mechanisms. Shanghai is actively promoting the child-friendly transformation of service facilities such as schools, hospitals, and public libraries, adding child-friendly activity spaces, and enhancing the utilization rate and service level of children’s activity spaces. Wuhan has established a leading group for the construction of child-friendly cities with the mayor as the group leader, clarifying 30 key tasks and promoting the construction of child-friendly cities around five dimensions, including friendly social policies and friendly public services. Plans have been made to construct child-friendly parks, schools, and communities, increase the quantity and quality of children’s activity spaces, and ensure that children have a safe and healthy growth environment in the city. Themed activities for child-friendly cities have been launched to encourage children to participate in urban construction and enhance their right to speak and their sense of participation.
The shift toward child-friendly urban planning reflects a broader recognition of the rights of children and the necessity of incorporating their perspectives into city development. This approach not only enhances the mobility and safety of children but also fosters a sense of community and belonging, ultimately contributing to healthier and more inclusive urban environments. As cities evolve, prioritizing the voices and the needs of children becomes imperative for sustainable and equitable urban development.
Research on school travel has important practical social significance for China. With social problems such as “school district houses” and “Chinese-style pickup” [
1], improvement of the built environment can provide school environments where parents can rest assured that their children can go to and from school alone, reducing the commuting pressure of working parents to pick up and drop off their children. It can also alleviate the congestion and chaos caused by motor vehicle transportation near schools, increase physical activity and social interaction opportunities for children, and promote low-carbon travel for residents, which is of great significance for improving the quality of life and urban traffic environment of residents. More importantly, with rapid urbanization in China, the gap between urban and rural areas is widening, and disparities in educational facilities are becoming more pronounced. Against the backdrop of social issues such as the unequal distribution of educational resources, improvements in the built environment offer a pathway to promote educational equity from a mobility perspective.
The key questions investigated in this study are listed below:
- (1)
What are the factors that influence the school commuting patterns of students, and which of these factors are more significant?
- (2)
What factors influence the adoption of walking as a mode of school commuting, and more critically, what factors impede the use of active school travel modes such as walking, thereby leading to the preference for motorized transportation?
2. Literature Review
In recent years, with the rise in relevant studies on child-friendly cities, researchers have paid attention to the travel modes of children [
2], active school travel modes of children [
3], and school paths [
4]. School commute travel refers to the transportation of children to and from school [
5]. Many researchers have discussed the relationship between the built environment and the school commute. The study of the effect of the built environment on travel behavior is very important for the characterization and judgment of the environment [
6]. Ewing [
7] used a “5Ds” model to describe the built environment. These are density, diversity, design, destination accessibility, and distance to transit. In addition to the built environment, non-built environment factors such as age and gender may also directly or indirectly affect school travel mode choices. Non-built environmental factors, including socio-demographic characteristics such as household income, car ownership, and child age, may affect the choice of the school commuting mode. In particular, the gender of the child may be an important factor in determining active school travel (AST) [
7]. Distance to school from the homes of adolescents is one of the environmental factors that can negatively influence the relationship between the built environment and AST [
8]. Some North American studies have reported that male students are more likely to walk to school than female students. However, other studies have not found a statistical association between the gender of a child and the choice of school commuting mode. This suggests that gender differences may manifest differently in different regions and cultural contexts.
The subjective perception of the built environment involves not only the objective built environment itself but also the meaning of the built environment to individuals and their value needs [
9], reflecting the values of users. Perception may be related to the age, gender, cultural background, and personal experience of individuals, thus affecting their choice of school commuting mode. For example, parent perception of the neighborhood environment may vary depending on the gender of their children. Compared with boys, parents with girls may be more inclined to protect their children’s independent or active travel ability. There is an interaction between the built environment and non-built environmental factors, which jointly shape the pattern of school commuting. For example, an area’s transportation infrastructure (built environment) and resident perceptions of traffic safety (non-built environment) jointly influence whether parents choose to send their children to school independently. There are significant differences in travel modes between primary school students in China and other countries, which are primarily influenced by factors such as culture, policies, urban planning, and family attitudes [
10]. In developed countries such as the United States, different European nations, and Australia, primary school students have more diverse travel options, including walking, cycling, public transportation, school bus services, and driving [
11]. Among these, walking and cycling are encouraged as green travel modes in many countries, particularly in nations like the Netherlands and Denmark, where cycling infrastructure is well-developed [
12]. Additionally, school bus services are highly prevalent in North America, with many schools offering dedicated bus services to ensure student safety and convenience [
13]. In contrast, in China, primary school students primarily rely on cars, especially in large cities, where traffic congestion and safety concerns lead parents to prefer personally transporting their children [
14]. Although Chinese students also use walking and public transportation, the proportion of students walking to school is significantly lower compared to their counterparts abroad. Research indicates that only about 20% of Chinese primary school students walk to school, while in some European countries, this proportion can exceed 50% [
15]. This disparity not only reflects differences in transportation infrastructure and urban planning but also highlights varying parental attitudes toward children’s independence and safety [
16].
Previous studies have analyzed travel mode choices from multiple angles and dimensions. Different studies have had different emphases, with some focused on the travel mode, some focused on travel time, some focused on built environmental conditions, and some comprehensively considering the travel mode, travel time, travel distance, travel activities, and other variables.
In terms of research methods, a large number of studies were carried out using statistical models such as multiple linear regression [
17], logistic regression [
18], and Bayesian models [
19].
At present, the measurement of the built environment in academic circles is mostly based on the overarching perspective, which has a certain gap with the real perception of travelers. The path and mechanism of the built environment affecting travel mode choices also need to be further explored. Therefore, based on the assessment of the built environment and the perception assessment of the users of educational facilities (primary school students and parents), this study analyzes the factors and mechanisms that affect the decision-making involved in primary school students’ travel behavior and attempts to improve aspects of the built environment to promote safer and more convenient travel routes for primary school students. Additionally, with safe and convenient routes, we suggest that students can travel in a non-motorized way such as walking and public transport.
3. Theory, Data, and Methods
3.1. “Homo Urbanicus” Theory
The “Homo Urbanicus” theory was proposed by Mr. Hok-Lin Leung, a Chinese Canadian scholar. This theory is currently mainly being applied to cultural genes [
1], policy analysis, territorial spatial planning, community living circles, and public service facilities. Currently, the “Homo Urbanicus” theory has achieved remarkable research results in the field of public service facilities, this theory is being applied to the research on different type of facilities such as medical facilities [
20], sports facilities [
21], and parks [
22].
The “Homo Urbanicus” theory follows the principle of “maximizing spatial interactions with minimal effort”. “Human-based” refers to a value orientation toward human nature, with both rational perception and physical perception [
23].
Utilizing the “Homo Urbanicus” theory, scholars have conducted extensive planning studies on public service facilities. Previous studies have focused on the layout of public service facilities. In a primary school study, researchers rationally considered the planning and layout of primary schools. From the perspective of “self-preservation”, it was shown that most parents and students tend to go to the nearest place to enroll, while, from the perspective of school authorities, who want to attract more students, it is more desirable to build schools in places with more people [
24].
Figure 1 illustrates the conceptual framework of this study, it shows that both the built environment, demographic characteristics, and travel perceptions collectively influence travel mode choices. According to the “Homo Urbanicus” theory, both students and parents have travel perceptions during the travel process. Travel perception can be categorized into four dimensions: safety, convenience, comfort, and aesthetics. These dimensions exhibit a progressive relationship. By employing the “Homo Urbanicus” theory, travel perceptions become quantifiable. People follow the principle of “maximizing spatial interactions with minimal effort”. People choose their way to school based on the use of “minimal effort” to obtain “spatial interactions” to pursue education facilities.
3.2. Study Area and Data Resources
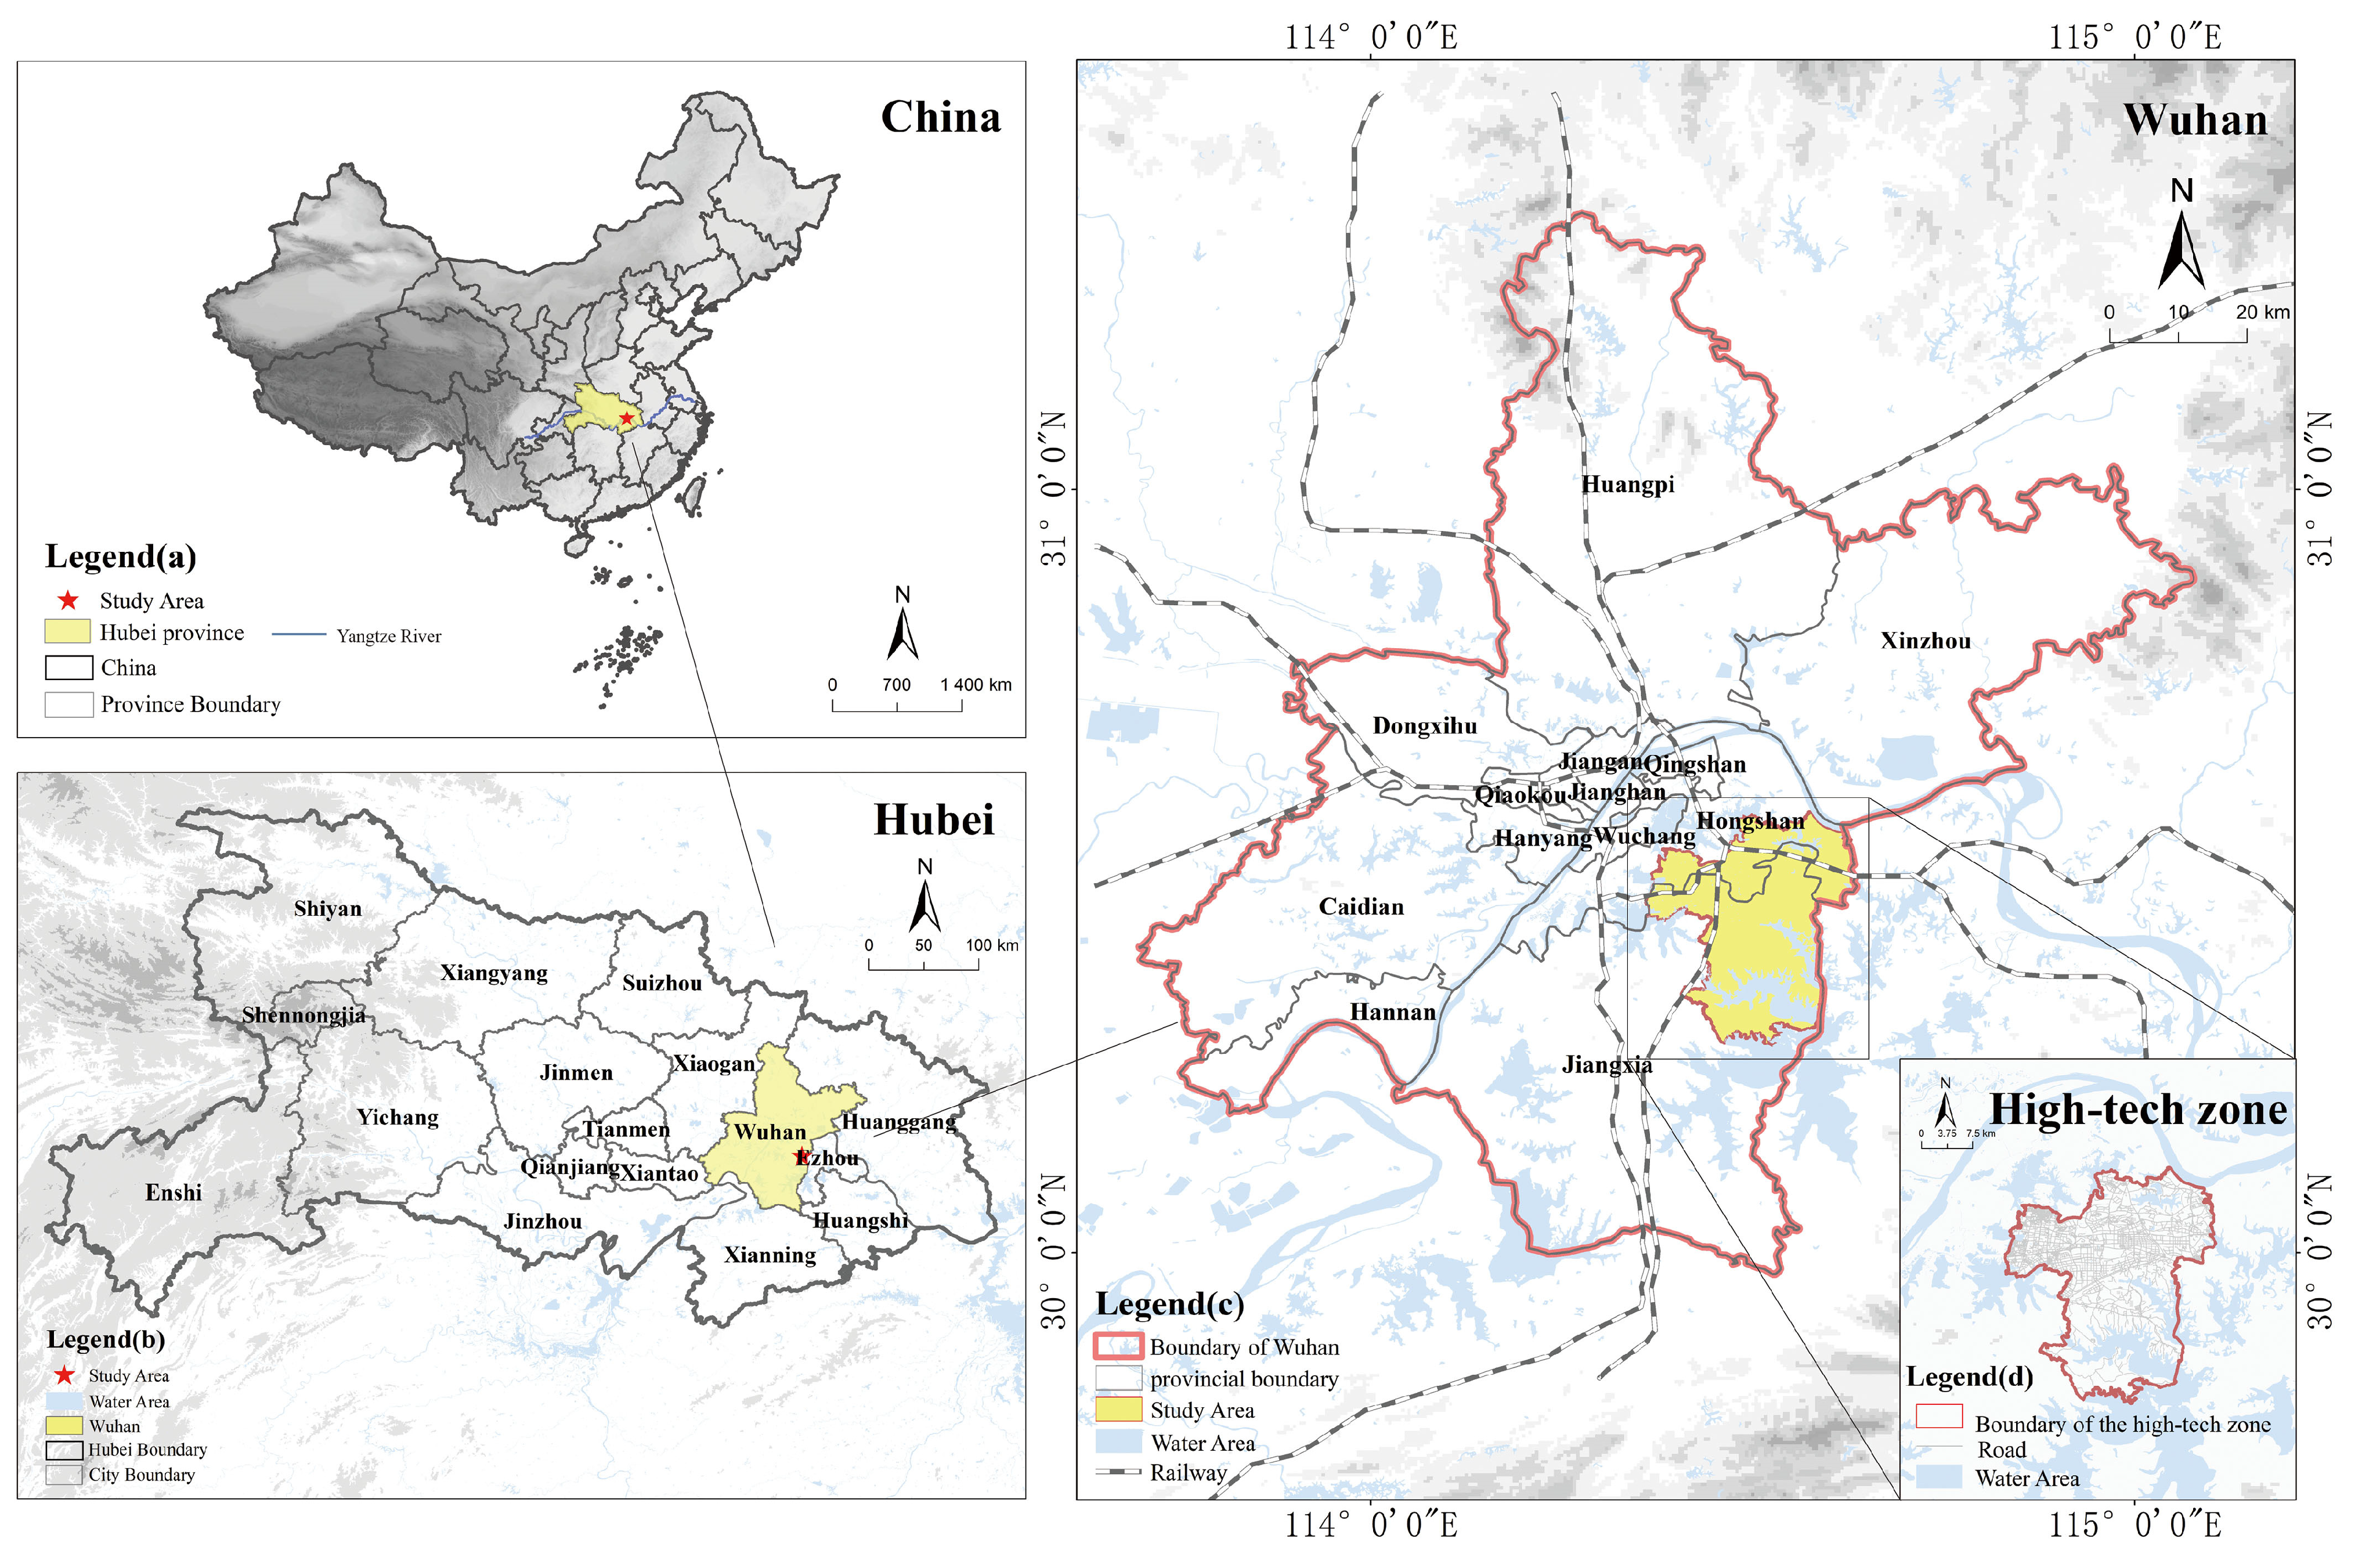
We choose the Wuhan East Lake High-Tech Development Zone (hereinafter referred to as the “high-tech zone”) as the research area. The high-tech zone is located in the southeast area of Wuhan, with a total area of 518 km
2. It borders Ezhou in the east, the Jiangxia District in the south, and the Hongshan District, East Lake Scenic Area, and the Qingshan District in the central city of Wuhan in the northwest (
Figure 2). In December 2009, the State Council approved and agreed to support the construction of a national independent innovation high-tech zone in the East Lake New Technology Industrial Development Zone, becoming the second national independent innovation high-tech zone in China [
25]. The high-tech zone is the most rapidly developing area in Wuhan. The GDP in this area is constantly high. In 2023, the GDP of the high-tech zone was 2713 million [
26].
The population in this area is constantly increasing. At present, the resident population of the high-tech zone is 2,935,146. The population grew by 5.7% in the last year [
27]. Compared with the sixth national census in 2010, the permanent resident population of the high-tech zone has increased by 538,549 people, an increase of 7.59%. From the perspective of the age structure of the population (
Table 1), 14.04% are 0–14 years old, 77.04% are 15–59 years old, 8.92% are over 60 years old, and 5.65% are over 65 years old. The high-tech zone has eight sub-districts, namely the Guandong Sub-District, Fozuling Sub-District, Baoxie Sub-District, Jiufeng Sub-District, Huashan Sub-District, Zuoling District, Longquan District, and Binhu District. Each district predominantly features a population age structure centered around individuals aged 15–59, and is characterized by a high proportion of adolescents and young adults. It is evident that the high-tech district has a high proportion of young people and school-age children, which leads to a significant demand for educational facilities. However, the current educational infrastructure is inadequate. Therefore, this high-tech area was selected as the research region due to its uniqueness, which holds research significance.
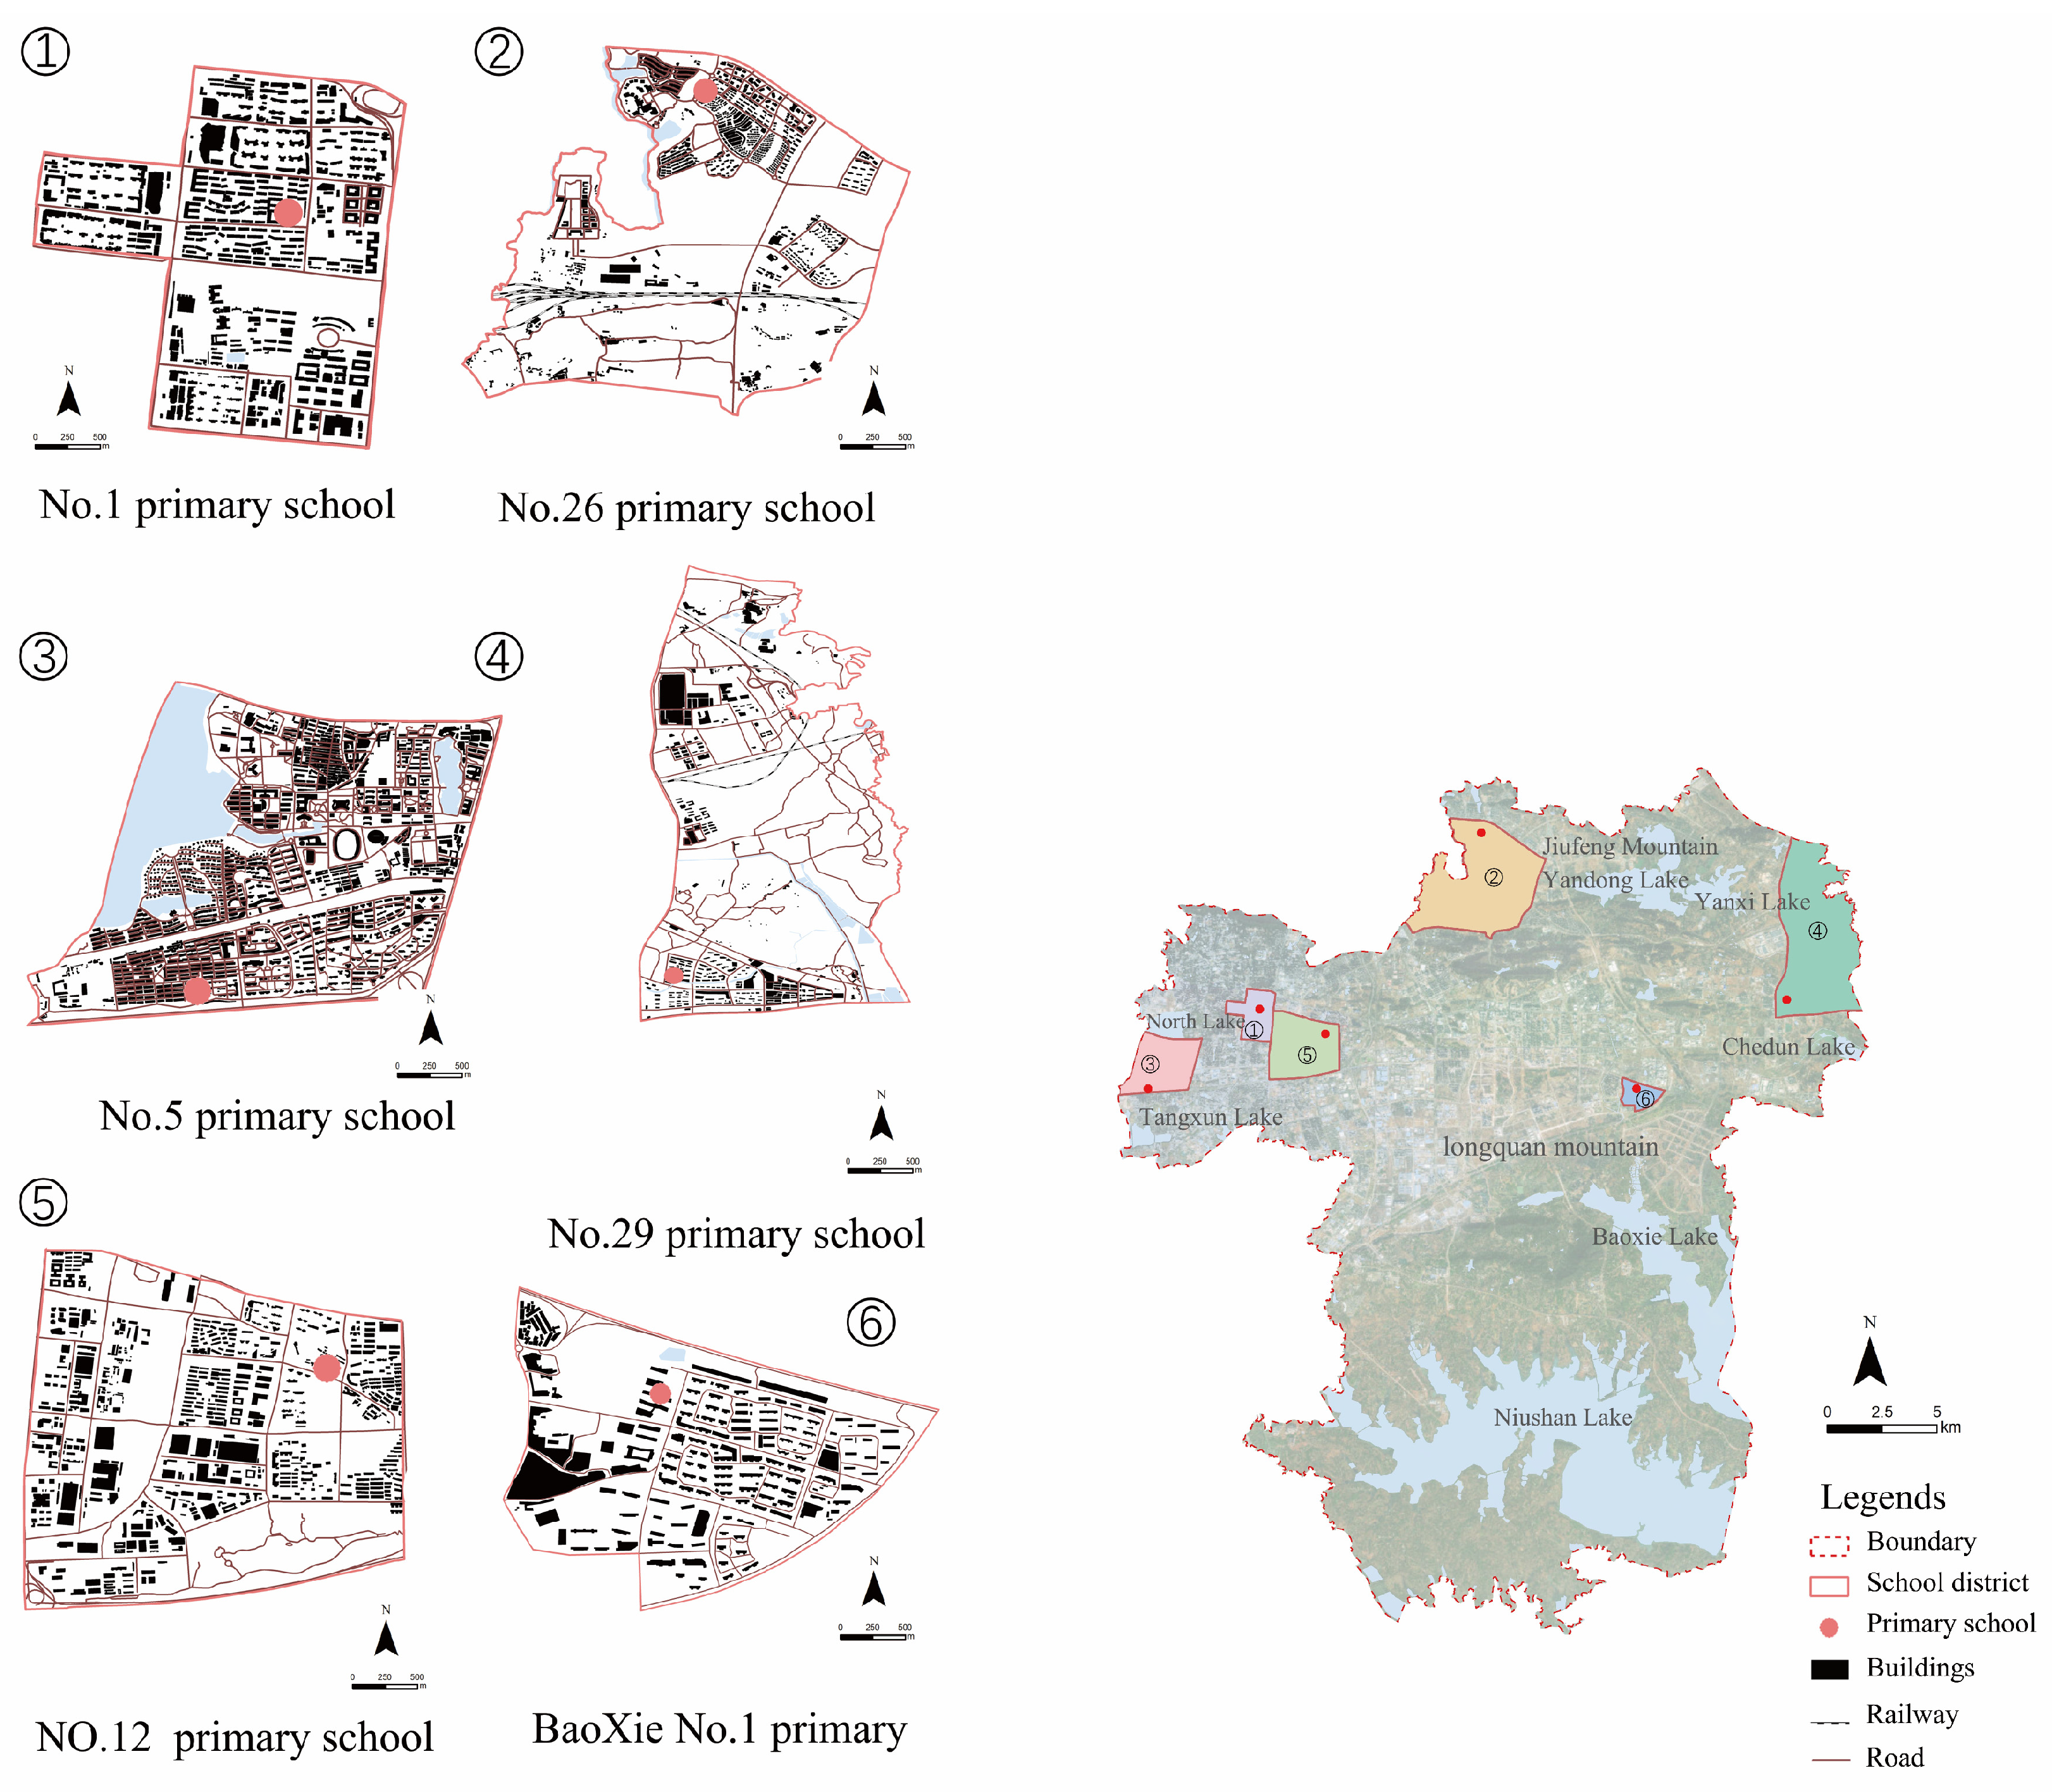
The high-tech zone has 52 primary schools (including nine K–12 primary schools). To analyze the school district, only public primary schools can be chosen. After field research, we selected six primary schools for our study, which were the Optical Valley No. 1 primary school, No. 5 primary school, No. 12 primary school, No. 26 primary school, No. 29 primary school, and BaoXie No. 1 primary school (
Figure 3). First, these schools have different built environments, with different building densities, road levels, population densities, and natural surroundings. The accessibility could be different due to the location and road attributes. These six primary schools exhibit significant variations in terms of site selection, school size, and surrounding environments, which are the primary reasons for selecting these schools as representative samples for our study.
The data used in this study are built environment data and travel data.
Table 2 presents a comprehensive overview of the data sources utilized in this study.
3.3. Questionnaire Design
According to the field investigation and semi-structured interview in advance, we formulated a questionnaire for parents and students in the high-tech zone. A total of 1650 questionnaires were collected in this study. After removing the questionnaires that lasted less than 120 s, were inconsistent in logic, or were filled in incorrectly, 1399 valid questionnaires were obtained, which means that the effective rate is 82.5%. As the actual users of the educational facilities, primary school students and parents were asked to rate the travel perception, all of which were evaluated using the international five-level Likert scale. This survey has yielded a substantial amount of subjective travel perception data, which significantly compensates for the deficiencies in the objective data, thereby rendering it highly valuable.
At the beginning of the survey, participants were asked about their school and home addresses so that we could locate their school and home address. Then, they were asked about travel information such as travel mode and travel time. The second part of the survey acquired demographic attributes such as age and gender. In addition, social and economic attributes such as family income were investigated. In the third part of the survey, travel perceptions of safety, convenience, comfort, and aesthetics were measured using a five-level Likert scale. From one to five, participants provided ratings from “strongly agree” to “strongly disagree”.
The reliability and validity of the questionnaire were rigorously assessed in this study. In
Table 3, Cronbach’s Alpha coefficients for all items exceeded the threshold of 0.8, indicating robust validity of the questionnaire data. Furthermore, the overall reliability coefficient was calculated to be 0.873, which also surpassed the acceptable criterion of 0.8. As indicated in
Table 4, the Kaiser–Meyer–Olkin (KMO) measure of sampling adequacy yielded a value of 0.881, which exceeded the recommended threshold of 0.8. This suggests that the data are highly suitable for factor analysis and effectively capture the underlying structure, thereby reflecting strong validity. Additionally, Bartlett’s test of sphericity resulted in a
p-value of 0.00 (
p < 0.05), further confirming the overall adequacy of the data for factor extraction and supporting the robustness of the validity. These results collectively demonstrate that the questionnaire exhibits excellent reliability and validity, rendering it suitable for application in this research.
3.4. Research Method: Multiple Linear Regression Model
Based on the existing theories and related studies, in this study, a regression model is selected for analysis. The travel modes (which are treated as a continuous variable before entering the model) are multiple, so binary regression cannot be used, and a multiple regression model should be used instead [
28]. Simple logistic regression analysis refers to the regression application with one dichotomous outcome and one independent variable [
29]. Multiple regression analysis applies when there is a single dichotomous outcome and more than one independent variable.
The general form of the multiple linear regression model is as follows:
where
Y is the dependent variable,
β0 is the constant term,
X1,
X2…
Xm are the independent variables, and
β is the regression coefficient, which represents the unit number of the average change in a dependent variable when all other independent variables remain unchanged, and e is the residual value [
30].
3.5. Establishment of Evaluation Index System
Based on the theoretical model, a measurement standard and a survey questionnaire were designed. A total of 24 measurement indicators for various variables were established (
Table 5). The dependent variable represents the five school travel modes, and the other variables serve as independent variables. The independent variables encompass built environmental factors, travel perceptions, and demographic characteristics. The built environmental factors are categorized into density, design, diversity, destination, and accessibility. Density includes the road density and intersection density, while diversity is characterized by the land use entropy. Accessibility is defined by the distance from the school to home, which is ascertained through the questionnaire by pinpointing the home addresses of students and calculating the distances from home to school for different travel modes by using Baidu API. Destination refers to the distance from the school to the nearest public transit facility.
There are four types of travel perceptions: Safety perception refers to the subjective assessment of the safety conditions during travel, particularly for vulnerable groups such as primary school students. This dimension encompasses several specific measures, including the safety of night-time travel, such as regards the adequacy of lighting and visibility; the safety of sidewalks and pedestrian pathways, ensuring they are free from hazards and suitable for walking; and the safety of students traveling alone, considering factors such as crime rates, the presence of security measures, and the overall sense of security in the travel environment.
Convenience perception evaluates the ease and efficiency of travel, particularly for primary school students. It includes the ease of reaching school, which is the proximity of the school to residential areas and the availability of direct routes, the convenience of public transportation, such as the frequency of services, accessibility of transit stops, and affordability of fares, and whether the travel convenience of the student population, a group of minors, has been considered. Comfort perception includes fresh air, a clean and orderly environment, and whether the school entrance is congested. Aesthetics perception includes the evenness of the road surface, the degree of greenness, and whether the facilities are well-maintained.
In the model, the age of the child, the child’s gender, the age of the parents, the gender of the parents, family structure, family income, living status, density, diversity, destination, accessibility, perception of safety, convenience, comfort, and aesthetics are taken as independent variables (
X), while the school travel mode is taken as an independent variable (
Y) (
Table 5).
4. Results
4.1. Results from the Questionnaire Survey
4.1.1. Demographic Characteristics
Table 6 shows the demographic characteristics of 1399 samples. We divided the student ages into three groups: Grades 1–2, Grades 3–4, and Grades 5–6. The gender of the student is also included. In this survey, the proportion of boys and girls is 50/50. For parents, after we collected the age and gender of parents, we found that the age of parents is mainly concentrated in the range of 26–35 and 36–55. More than 600 parents are between the ages of 26 and 35, which shows that the parent group is very young. This is particularly true in areas such as high-tech zones, where parents tend to be younger.
From the perspective of family structure, 63% of the family structures for primary school students are nuclear families, and 28.5% are stem families. In other cases, only grandparents and children live together, and the proportion is relatively low. In other words, the family structure shows the characteristics of young, small families.
For family income, 45.1% is within CNY 10,001–20,000, 22.8% is CNY 20,001–50,000, and the other 4.5% have incomes greater than CNY 50,000, which is would be considered rich. Additionally, because some areas of the high-tech zone used to be countryside, the family income could be lower. However, there are also many high-tech companies, which are well paid. With regard to living stage, 86.6% live in their own apartment or house, while 13.4% rent apartments.
4.1.2. Travel Modes and Travel Time
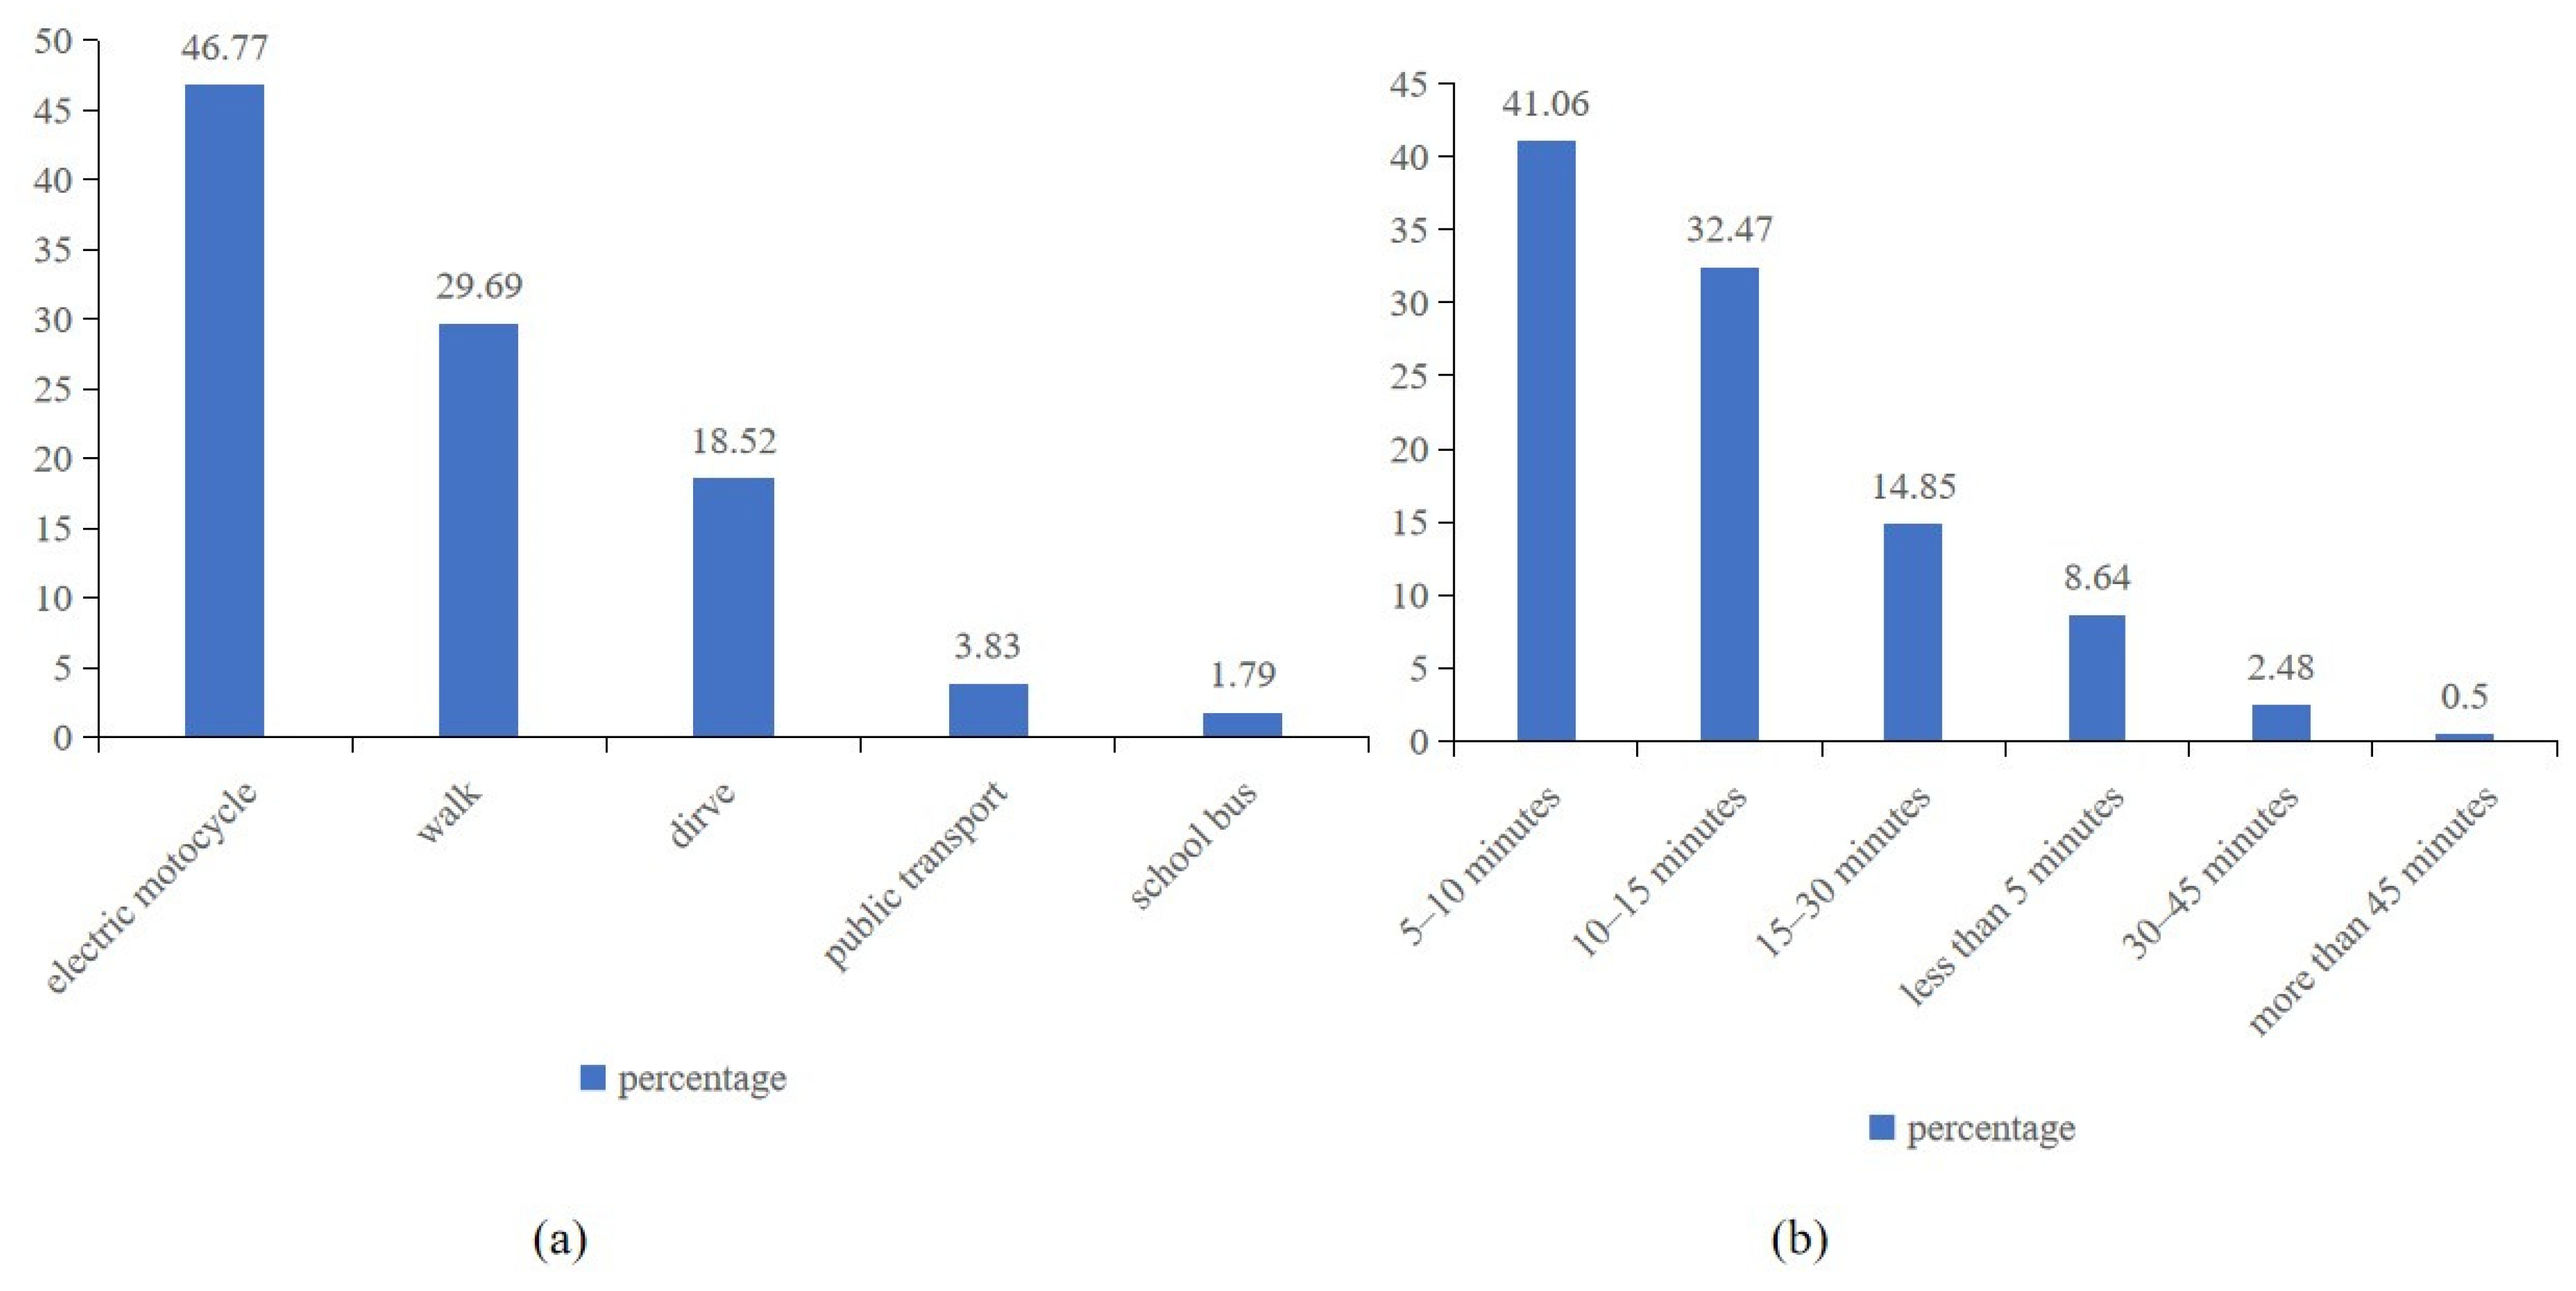
Using our questionnaire, we collected data on travel modes and travel time. According to
Figure 4a, electric bicycles are the most chosen mode of transportation (46.77%), with approximately 47% of parents opting to use electric bicycles to transport their children to and from school, although a small number of students also ride bicycles to school. The second most popular travel mode is walking (29.69%), which refers to parents accompanying their children walking to school. This is the second most popular travel method in the high-tech zone. The third most popular mode is driving (18.52%), which refers to parents driving their children to school. Overall, 5.04% of people choose to use public transport and only 2.98% of people choose to take a school bus. The real-life situation could be more complex, but we have tried to include all travel modes through investigation and the survey. The use of public transport seems not to be popular. Forms of public transport include railways, buses, and Bus Rapid Transit (BRT) in the high-tech zone. As the high-tech zone is developing quickly, public transport facilities are rapidly being constructed in this zone. However, only 4% of students choose public transport. As for school buses, only about 3% of students choose school buses to travel. This is related to the schedule of the school bus line being fixed. Additionally, according to our field investment, active travel modes constitute 76%, which is generally favorable. However, the proportion of walking is less than 30%, while the proportion of electric bicycle travel is 46%. Nevertheless, walking is the more encouraged mode because it does not affect traffic conditions and does not cause congestion. Due to the advantages of high levels of comfort, short waiting times, and low energy consumption, electric bicycles have replaced the use of cars, buses, and motorcycles to a certain extent [
31].
In terms of travel time, as shown in
Figure 4b, according to the statistics, the majority of students and parents spend between 5 and 10 min reaching primary schools, and this interval accounts for 41.06% of the total survey. Following this, the time intervals of 10–15 min have proportions of 32.47% of the total survey.
Related to relevant policies such as “nearby enrollment” and “15 min life circle”, the travel time between school and home should be no more than 15 min. In this research, the travel time for most people is less than 15 min(
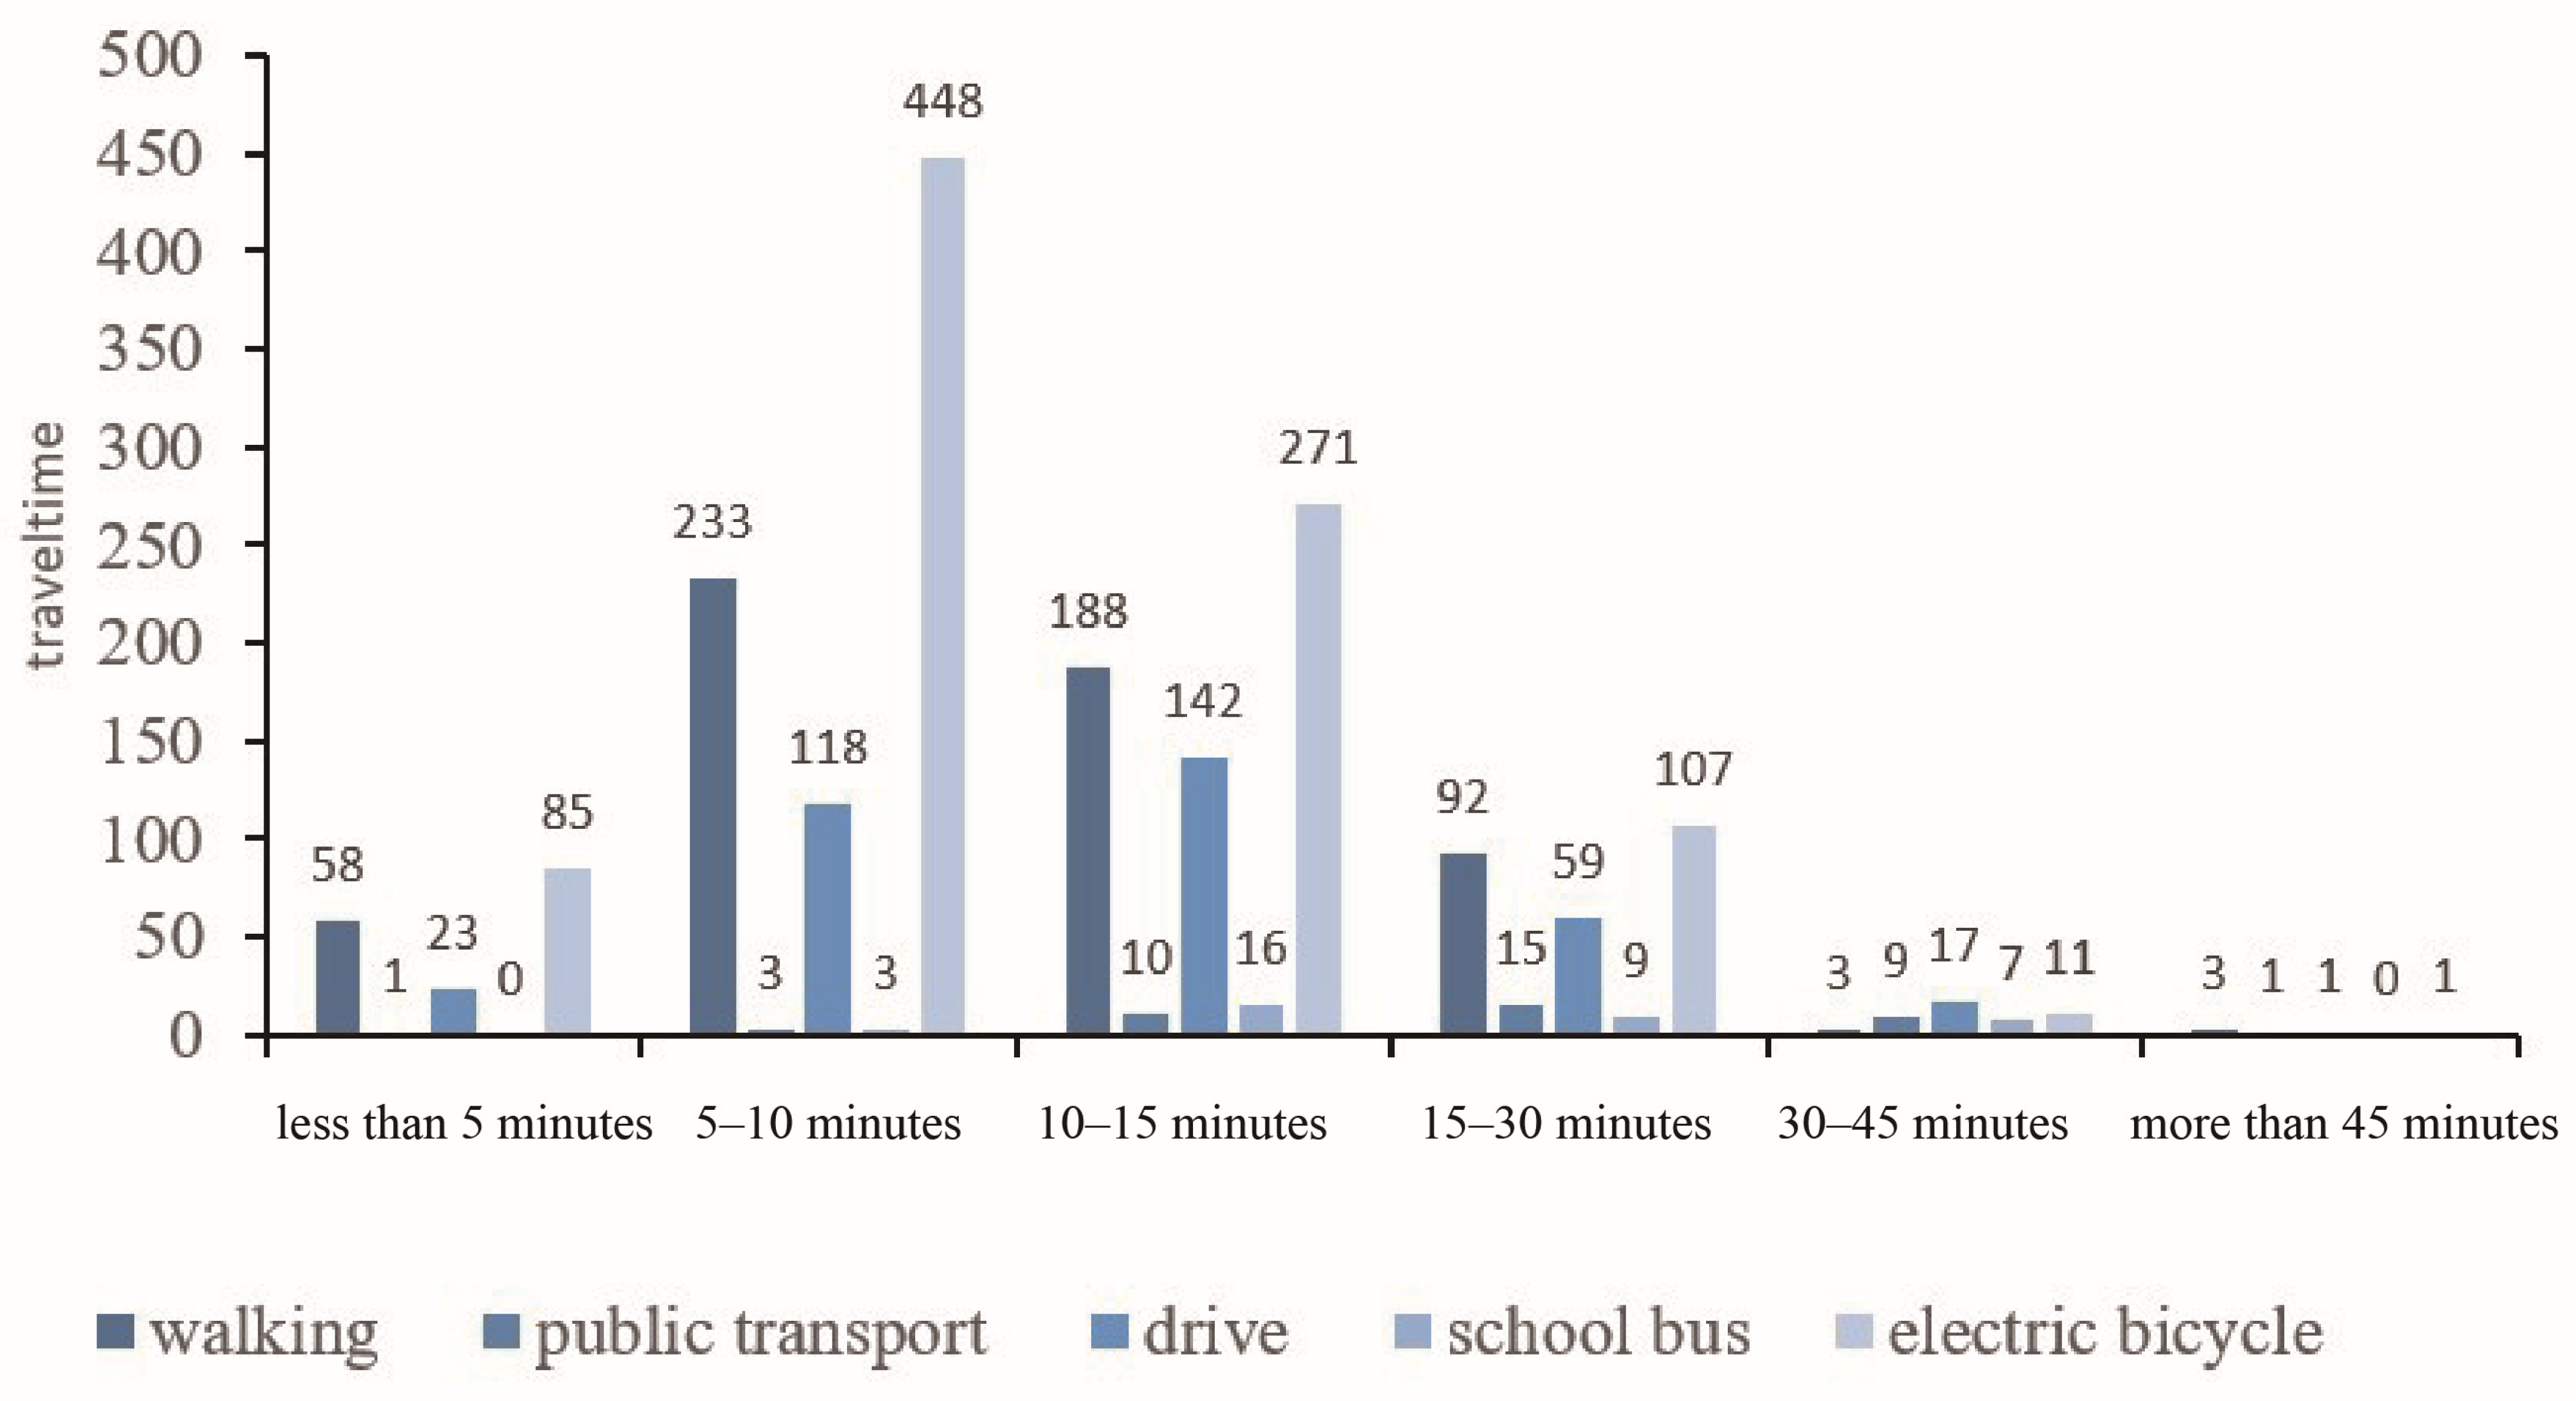
Figure 5), which is consistent with the requirements of the policy. However, in different travel modes, the travel distance is very different. In the same 15 min, the distance of 15 min by car is approximately 8–15 km, and the walking distance is only approximately 1–2 km. Therefore, as shown in
Figure 5, we collected each travel mode’s travel time separately. This also exhibits a very similar phenomenon in that most people spend 5–15 min on school travel.As illustrated in
Figure 6, students across different age groups exhibit distinct modes of transportation. Specifically, first and second-grade students, due to their younger age, they use walking or being escorted by parents. In contrast, students from third to sixth grade demonstrate a more diverse range of transportation options, including all five travel modes.
4.1.3. Travel Perception
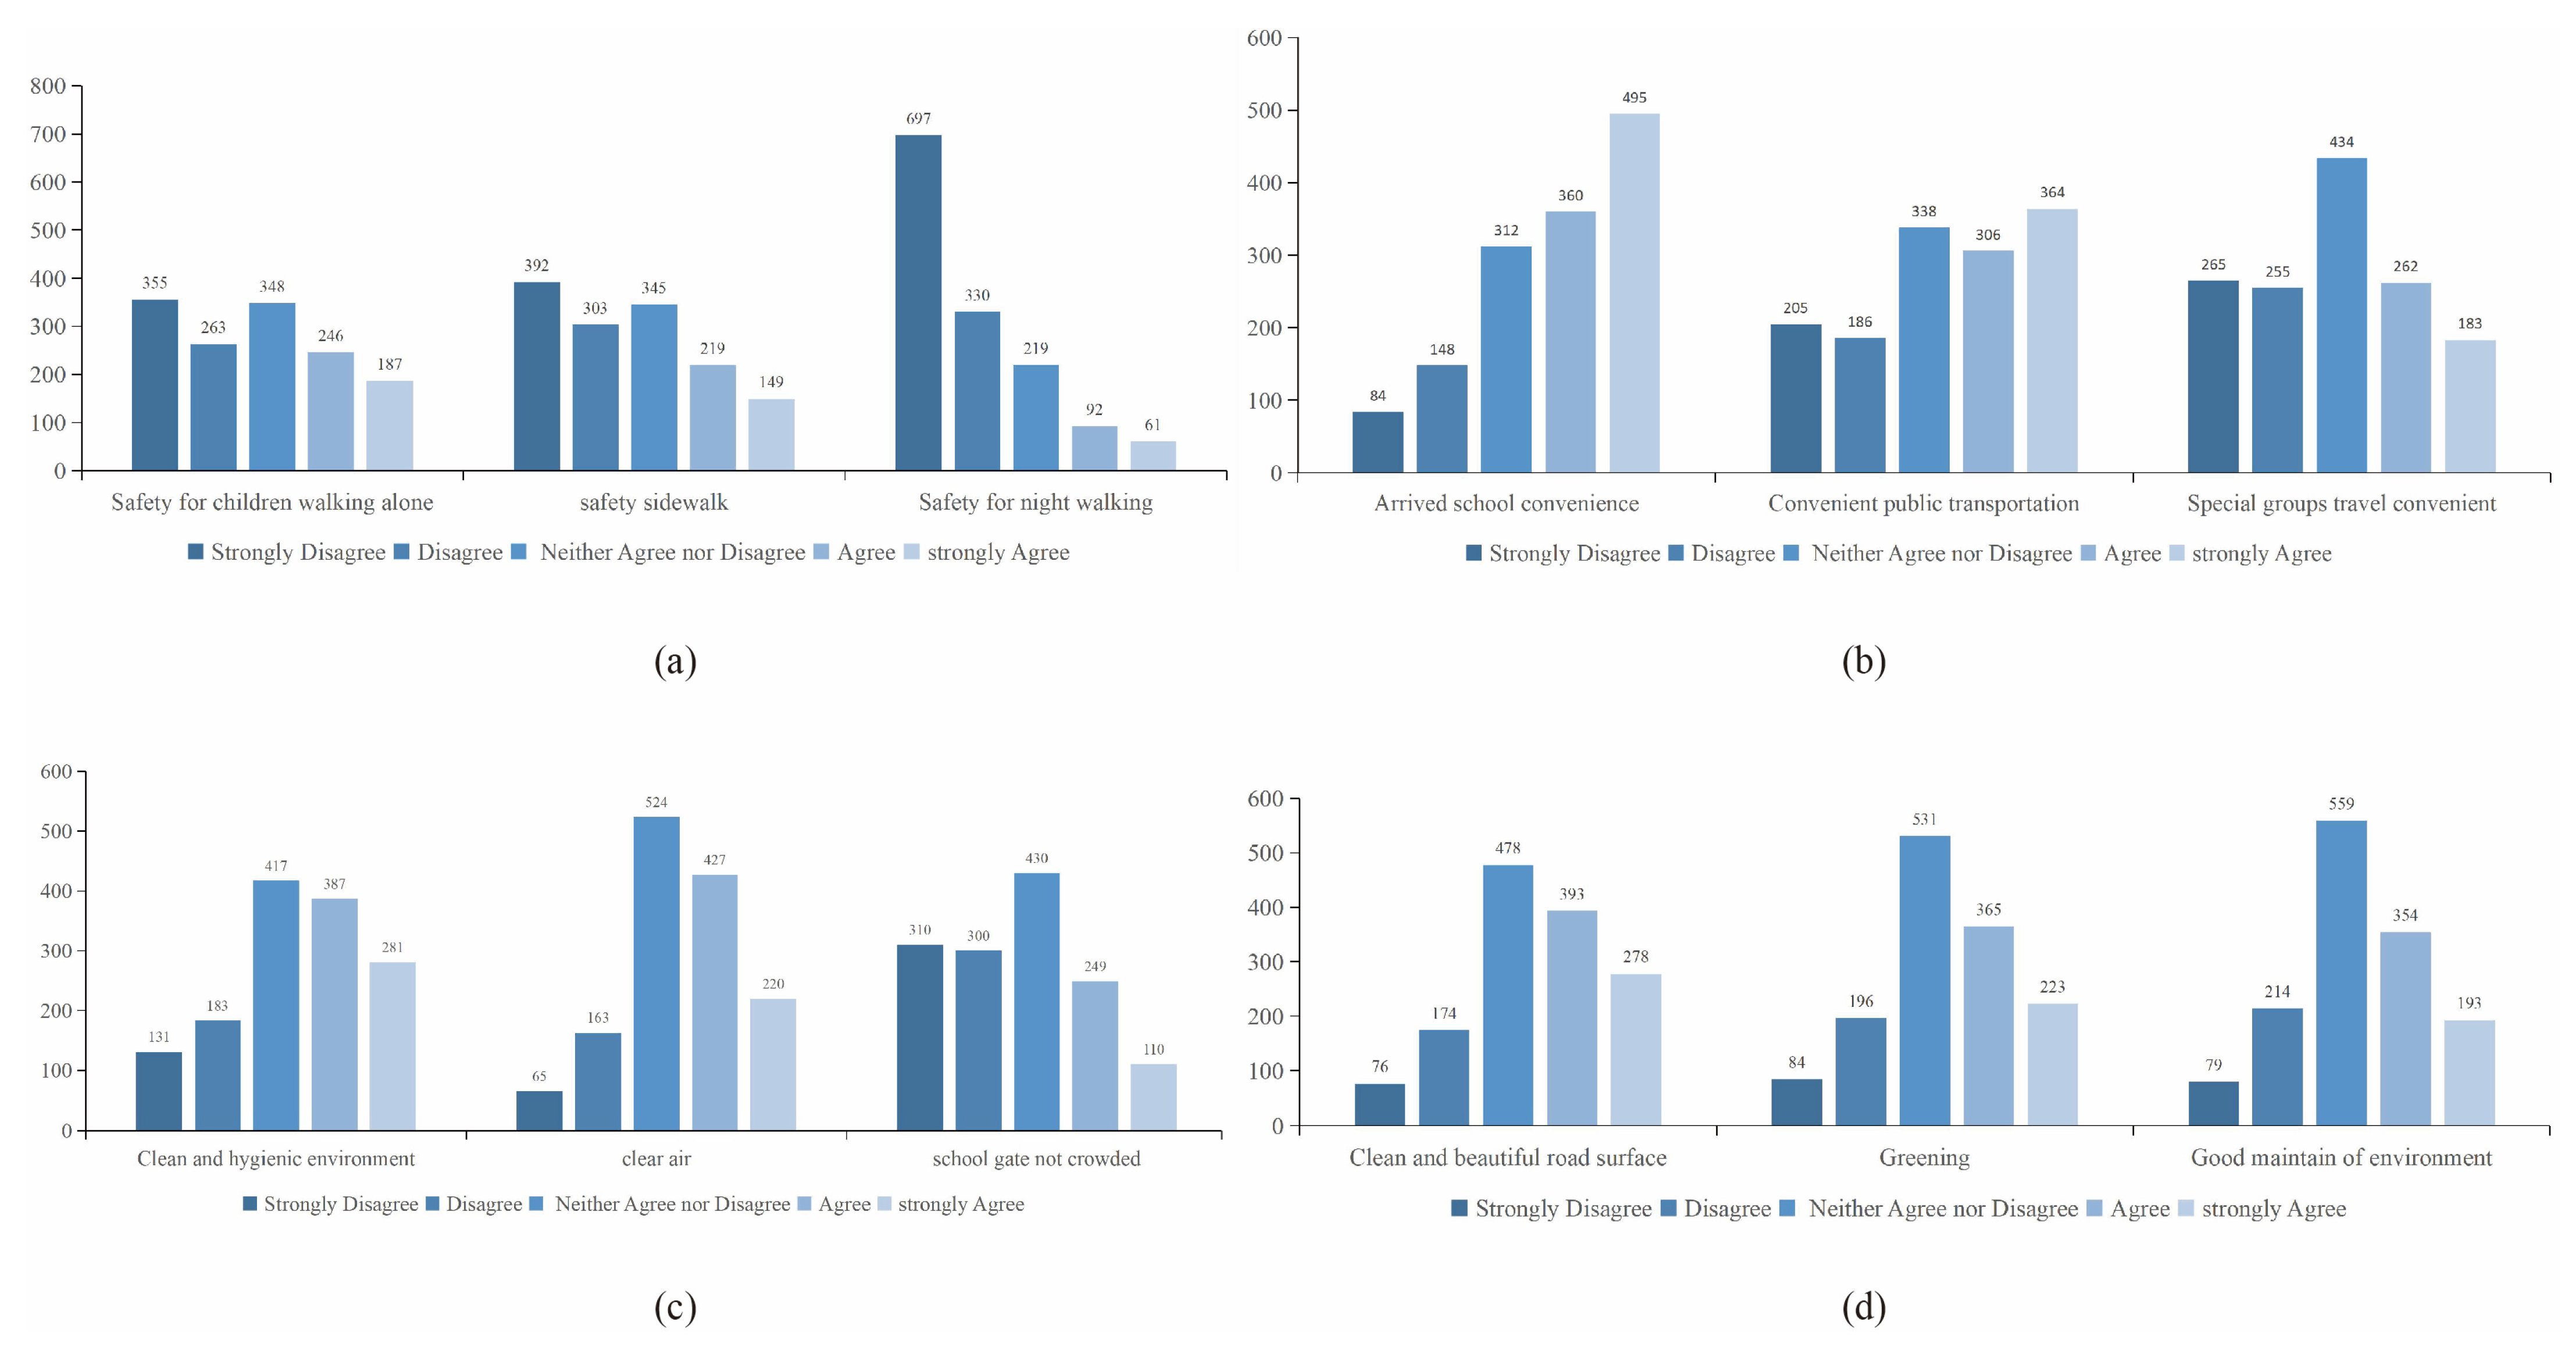
In this study, travel perception includes safety, convenience, comfort, and aesthetics. Safety perception includes the categories of safety sidewalks, safety of students traveling alone, and safety for night travel. The results show that night travel safety is the most prominent problem. As shown in
Figure 7, overall, 697 people think that it is very unsafe for primary school students to travel at night, accounting for 49.8% of the total. Similarly, the number of people who believe that primary school students can travel independently is only 149, indicating that most people believe that primary school students cannot travel independently. This indicates that safety for student travel roads is in urgent need of improvement.
For the perception of convenience, due to the policy of “nearby enrollment”, most primary school students can study in schools that are close to them. Therefore, regarding convenience in commuting to school, 495 people think their commute is very convenient, and only 84 people think it is very inconvenient. In the choice of whether to consider a special group of primary school students (vulnerable groups), most people think that the group of primary school students who need care is not being considered.
Comfort perception includes the comfort of the travel environment and whether the school gate is congested. Dissatisfaction in comfort perception is focused on congestion, with 1040 people thinking that the school gate is congested. According to our field research, crowding at the school gate is indeed a common problem in the high-tech zone. There is an overlap between school hours and the morning rush hour of the city, which is itself relatively congested, and a large number of vehicles parked around the school during this period also cause further congestion.
Aesthetic perceptions include perceptions of fresh air, clean road surfaces, and the surrounding environmental facilities being well maintained. The results show that most people agree that the environment during school travel is good, the road surface is clean, and the air is fresh. However, for the third option, only 193 people think the road environment is well maintained, while 559 people have a neutral attitude for this option. We can infer that the travel environment of the high-tech zone has not been well maintained, which will also be a focus of subsequent improvement.
4.2. Model Fit
To explore the internal influence mechanism of school travel mode choice for primary school students, we established a multiple linear regression model to analyze the correlation between travel mode choices and the built environment, demographic characteristics, and travel perceptions. Then, we discuss the results according to the model.
First, it was found in
Table 7 that the model passed the F-test (F = 16.152,
p = 0.000 < 0.05) during the F-test of the model. This indicates that the model’s construction is meaningful. In addition, according to the multicollinearity test of the model, it was found that all the VIF values in the model are less than five, which means that there is no collinearity problem. Moreover, the D-W value is near the number 2, which indicates that there is no autocorrelation in the model and there is no correlation between the sample data. The prediction effect of the model is significant (
p = 0.000), and the adjusted R
2 of the model is 0.206.
4.3. Model Results
The multiple linear regression model was used to test a total of 26 factors. Based on the
p-value (
Table 8), it can be estimated that accessibility, destination, the child’s gender, comfort perception 2, and convenience perception 1 (
p = 0.000) significantly influence travel mode choice. Additionally, diversity (
p = 0.003), safety perception 1 (
p = 0.002), household income (
p = 0.002), the child’s age (
p = 0.034), and living status (
p = 0.037) affect travel mode choice. Other factors have no clear influence on travel mode choice, but the results show that demographic characteristics, built environment factors, and travel perception can have a significant influence on the travel mode choices of the students.
For the demographic characteristic side, four factors are significant, and the age of the child has a significant positive impact on the travel mode choice. In addition, the gender of the child has a significant negative impact on the travel mode choice. Previous research has shown that gender and age group are associated with the travel mode choices of students. Older children are more likely to obtain permission from their parents to go to school alone or with friends, but younger students, especially 6–8-year-old students have difficulty traveling alone. However, other factors, such as the age of the parents, do not show a correlation with travel mode choice. This may be because, in the whole dataset of our sample, the age of parents is basically concentrated in the age group of 26–55, so age cannot be considered in the analysis. Similarly, family structure is not significant, because this these respondents who completed the survey questionnaire basically consists of nuclear families [
2] and stem families [
3].
In many studies, distance is one of the most important influence factors affecting travel mode choice. There is a positive influence in that accessibility (the distance between home and school) can significantly affect travel mode choice. This means that the shorter the travel distance is, the more inclined to walking and other non-motor travel modes a child is, which is also recommended. The effect of school distance on positive school attendance suggests that pressure on school-age children to arrive at school on time may lead to a greater sensitivity to distance [
32].
In this study, diversity (land use entropy) has a significant impact on travel mode choice, which is consistent with previous studies. High land use entropy generally means that more activities and facilities are concentrated in smaller areas, which helps to reduce travel distances and increase the possibility of walking. With higher land use entropy and street connectivity, people tend to driving less frequently. This is mainly due to the shorter distance required to reach nearby places or other destinations and the availability of other transportation modes such as walking, cycling, or using public transport. Therefore, land use can affect non-motor travel modes, and it can especially affect the walking behaviors of adolescents.
Among the four perceptions, safety, convenience, and comfort have a significant influence on travel mode choice, but aesthetics perception is not significant. It can be seen that safety is the most basic and most valued perception, and convenience perception is the second most important factor of the four kinds of perception. People, especially parents, will choose the most convenient choice because they only have limited time. Comfort perception mainly comes from the environment being well-designed, so people feel comfortable with the feeling of having a clean and hygienic environment during school travel.
However, aesthetics perception is a higher level of demand. Research has provided evidence that when children have a better sense of school roads, they will spend a large amount of time exploring the way to and from school. Children also have aesthetic needs, but because the survey data mainly come from parents, there is no clear expression of the children’s needs for aesthetics.
5. Conclusions
This study explored which factors influence the travel mode choices of students and their parents. Our findings indicate that built environment factors, demographic characteristics, and travel perceptions significantly impact travel mode choices. However, certain factors exhibit a negative effect, while others demonstrate a positive effect.
Specifically, the multiple linear regression model is introduced to offer a clear interpretation of the results by identifying the key factors and indicating the split thresholds of the variables. Combining the questionnaire and interviews provides more comprehensive evidence on the mechanisms of school travel mode choices. In this study, we identified accessibility, destination, the child’s gender, and travel perceptions as the most influential determinants of travel mode choice. The results show that a long distance between school and home can significantly stimulate the use of cars in school commuting, which is not beneficial for AST. When the travel distance is less than 1 km, students are more likely to choose walking, and when the distance is greater than 1 km, students and parents tend to choose vehicles such as electric bicycles because of the long distance. Furthermore, it can be assumed that living within the school district can reduce the probability of using a car. Our study uses the concept of a school district, so the analysis reveals that students residing within the geographical boundaries of a school district exhibit a higher propensity to utilize AST methods such as walking.
6. Discussion
Compared to previous studies, our research has some similar findings. For instance, we identified distance (accessibility) as one of the most significant factors influencing travel mode choice, which is consistent with earlier research. Land use has been proven by many scholars to be one of the most important factors affecting school travel. However, there are several differences between our study and previous studies. When a study examines specific demographic groups, scholars prefer to study adults and elderly groups. Few scholars have focused exclusively on the travel mode choices of primary school students, which is more important at present. Our study specifically addresses travel mode choices for school commuting, which is beneficial to the development of child-friendly urban environments.
As urban planners, we can improve safety, convenience, comfort and even aesthetic perceptions of the ways to and from school by promoting the improvement of the built environment, thereby improving the travel experience.
Based on our field research and results, we propose the following three detailed strategies:
- (1)
Create more school travel safety roads. We suggest installing traffic-calming measures, such as speed bumps, speed limits, and all-red traffic lights at intersections, to discourage car travel and improve safety. Paint eye-catching signs and road markings around schools to increase visibility and safety awareness among children and drivers.
- (2)
To prevent school gate congestion, we suggest closing streets near schools to vehicular traffic during peak commuting hours (morning and afternoon). Strictly enforce traffic organization principles, such as separating pedestrians and vehicles, to minimize conflicts. Prohibit parking within 100 m of school gates, particularly stop-and-go parking, to reduce risks to pedestrians and congestion.
- (3)
To promote walking, it is recommended that pathways within a 1km radius be enhanced, and that separation piers be installed at intersections to eliminate illegal parking on sidewalks [
33]. To ensure the safety of elementary school students, it is advisable to implement an adult-guided “walking school bus” program, establish walking stations within 1 km of the school, and accompany children on their walks to and from school.
Author Contributions
Conceptualization, S.C. and W.W.; Methodology, S.C. and W.W.; Software, S.C., M.H. and W.W.; Validation, S.C. and M.H.; Formal Analysis, S.C. and W.W.; Investigation, S.C., W.W. and M.H.; Resources, W.W.; Data Curation, S.C.; Writing—Original Draft Preparation, S.C.; Writing—Review and Editing, S.C. and W.W.; Visualization, S.C.; Supervision, W.W.; Project Administration, W.W.; funding acquisition, W.W.; All authors have read and agreed to the published version of the manuscript.
Funding
This research was funded by the Research Project of Humanities and Social Sciences of the Ministry of Education, grant number 24YJA630097 and the Ministry of Education of Humanities and Social Science Project, grant number 24A10486058.
Data Availability Statement
Population structure in high-tech zone and land use data were provided by Wuhan Planning and Design Institute; questionnaire data were collected by our group; further inquiries can be directed to the corresponding author.
Conflicts of Interest
The authors declare no conflicts of interest.
Abbreviations
| AST | Active school travel |
| VIF | Variance inflation factor |
| GDP | Gross domestic product |
| RMSE | Root mean square error |
| DW | Durbin–Watson test |
| AIC | Akaike information criterion |
| BIC | Bayesian information criterion |
| KMO | Kaiser-Meyer-Olkin |
References
- Zou, Y.; Rao, Y.; Guo, X.; Yi, C.; Luo, F.; Song, Y.; Wu, P. Are school-district houses truly livable against the background of educational capitalization? Evidence from the city of Hohhot in western China. J. Hous. Built Environ. 2024, 39, 201–226. [Google Scholar] [CrossRef]
- Fyhri, A.; Hjorthol, R. Children’s independent mobility to school, friends and leisure activities. J. Transp. Geogr. 2009, 17, 377–384. [Google Scholar] [CrossRef]
- EIkeda, E.; Hinckson, E.; Witten, K.; Smith, M. Associations of children’s active school travel with perceptions of the physical environment and characteristics of the social environment: A systematic review. Health Place 2018, 54, 118–131. [Google Scholar] [CrossRef] [PubMed]
- Fang, K.; Azizan, S.A.; Huang, H. GIS-based intelligent planning approach of child-friendly pedestrian pathway to promote a child-friendly city. Sci. Rep. 2024, 14, 8139. [Google Scholar] [CrossRef]
- Xia, W.; Jian, J. A review of built environment research based on children’s school travel behavior. Urban Plan. Int. 2018, 33, 57–62+109. [Google Scholar]
- Liu, J.; Xiao, L.; Zhou, J.; Guo, Y.; Yang, L. The nonlinear relationship between built environment and walking learning of adolescents: A study based on limit gradient lifting model. Prog. Geogr. 2002, 41, 251–263. [Google Scholar] [CrossRef]
- Ewing, R.; Cervero, R. Travel and the built environment: A meta- analysis. J. Am. Plan. Assoc. 2010, 76, 265–294. [Google Scholar] [CrossRef]
- Ma, L.; Shi, W.; Huang, Y.; Lin, J. Active school travel in China: Unveiling multifaceted influences for sustainable mobility. Transp. Res. Part D Transp. Environ. 2024, 134, 104361. [Google Scholar] [CrossRef]
- Molina-García, J.; García-Massó, X.; Estevan, I.; Queralt, A. Built Environment, Psychosocial Factors and Active Commuting to School in Adolescents: Clustering a Self-Organizing Map Analysis. Int. J. Environ. Res. Public Health 2019, 16, 83. [Google Scholar] [CrossRef]
- Lin, L.; Moudon, A.V. Objective versus subjective measures of the built environment, which are most effective in capturing associations with walking? Health Place 2010, 16, 339. [Google Scholar] [CrossRef] [PubMed]
- Shaw, B.; Watson, B.; Frauendienst, B.; Redecker, A.; Jones, T. Children’s independent mobility: A comparative study in England and Germany. J. Transp. Geogr. 2013, 29, 1–10. [Google Scholar]
- McMillan, T.E. Urban form and a child’s trip to school: The current literature and a framework for future research. J. Plan. Lit. 2005, 19, 440–456. [Google Scholar] [CrossRef]
- Pucher, J.; Buehler, R. Making cycling irresistible: Lessons from the Netherlands, Denmark, and Germany. Transp. Rev. 2008, 28, 495–528. [Google Scholar] [CrossRef]
- National Highway Traffic Safety Administration (NHTSA). School Bus Safety. 2019. Available online: https://www.nhtsa.gov/road-safety/school-bus-safety (accessed on 6 July 2024).
- Zhang, Y.; Wang, L. Travel patterns of primary school students in urban China: A comparative analysis. J. Urban Plan. Dev. 2020, 146, 04020025. [Google Scholar]
- Zhu, X.; Lee, C. Walkability and safety around elementary schools: Economic and ethnic disparities. Am. J. Prev. Med. 2008, 34, 282–290. [Google Scholar] [CrossRef]
- Stone, M.R.; Faulkner, G.E.; Mitra, R. Children’s independent mobility and physical activity: A review of the literature. Prev. Med. 2017, 105, 55–62. [Google Scholar]
- Shi, Y.W.; Zhu, X.G.; Sun, J. Study on the Influence of Green Open Space on Different Social Interaction of the Elderly: A Case Study of Nanjing City. J. Hum. Settl. W. China 2022, 37, 62–68. [Google Scholar]
- Jeong, J.; Lee, J.; Gim, T.-H.T. Travel mode choice as a representation of travel utility: A multilevel approach reflecting the hierarchical structure of trip, individual, and neighborhood characteristics. Pap. Reg. Sci. 2022, 101, 745–766. [Google Scholar] [CrossRef]
- Zhao, Z.; Koutsopoulos, H.N.; Zhao, J. Detecting pattern changes in individual travel behavior: A Bayesian approach. Transp. Res. Part B Methodol. 2018, 112, 73–88. [Google Scholar] [CrossRef]
- Guo, F.; Wei, W.; Xiang, B.; Hong, M. Analysis of Regional Medical Supply and Demand Network Characteristics Based on “Patient Flow Phenomenon”: A Case Study of the Core Area of the Wuhan Metropolitan Area. Land 2024, 13, 142. [Google Scholar] [CrossRef]
- Wei, W.; Deng, L. Allocation and optimization of community sports facilities from the perspective of “homo-urbanicus”: A case study of Wuhan City Center. Shanghai Urban Plan. Rev. 2020, 04, 76–83. [Google Scholar]
- Wei, W.; Zhou, J.; Luo, M. Satisfaction analysis and planning Strategy of community park from the perspective of “homo-urbanicus”: A case study of Zhongnan Road, Wuchang District, Wuhan. Urban Plan. Rev. 2018, 42, 55–66. [Google Scholar]
- Leung, H.-L. Talk about “homo-urbanicus”—people-oriented urbanization. J. Urban Plan. 2014, 38, 64–75. [Google Scholar]
- Wei, W.; Yu, T.; Huan, Y. Satisfaction Improvement on Layout of Primary Schools in Central Area of Big City. Planners 2020, 36, 13–18. [Google Scholar]
- East Lake High-Tech Development Zone Administration Committee. Historical Development of the East Lake High-Tech Zone. 2009. Available online: http://www.wehdz.gov.cn (accessed on 12 December 2023).
- Wuhan Municipal Bureau of Statistics. Wuhan Statistical Yearbook 2023; Wuhan Municipal Bureau of Statistics: Wuhan, China, 2023.
- Tabachnick, B.G.; Fidell, L.S. Using Multivariate Statistics, 7th ed.; Pearson: Boston, MA, USA, 2019. [Google Scholar]
- Hosmer, D.W.; Lemeshow, S.; Sturdivant, R.X. Applied Logistic Regression, 3rd ed.; Wiley: Hoboken, NJ, USA, 2013. [Google Scholar]
- Field, A. Discovering Statistics Using IBM SPSS Statistics, 5th ed.; Sage Publications: London, UK, 2018. [Google Scholar]
- Bigazzi, A.; Wong, K. Electric bicycle mode substitution for driving, public transit, conventional cycling, and walking. Transp. Res. Part D Transp. Environ. 2020, 85, 102412. [Google Scholar] [CrossRef]
- McDonald, N.C. Children’s mode choice for the school trip: The role of distance and school location in walking to school. Transportation 2008, 35, 23–35. [Google Scholar] [CrossRef]
- Eldeeb, G.; Mohamed, M.; Páez, A. Built for active travel? Investigating the contextual effects of the built environment on transportation mode choice. J. Transp. Geogr. 2021, 96, 103158. [Google Scholar] [CrossRef]
| Disclaimer/Publisher’s Note: The statements, opinions and data contained in all publications are solely those of the individual author(s) and contributor(s) and not of MDPI and/or the editor(s). MDPI and/or the editor(s) disclaim responsibility for any injury to people or property resulting from any ideas, methods, instructions or products referred to in the content. |
© 2025 by the authors. Licensee MDPI, Basel, Switzerland. This article is an open access article distributed under the terms and conditions of the Creative Commons Attribution (CC BY) license (https://creativecommons.org/licenses/by/4.0/).


