Article

Finite Element Modeling with Sensitivity and Parameter Variation Analysis of a Deep Excavation: From a Case Study

1
Department of Civil Engineering, Sakarya University, 54050 Sakarya, Türkiye
2
Department of Civil Engineering, Institute of Science and Technology, Sakarya University, 54050 Sakarya, Türkiye
3
Department of Civil Engineering, Graduate Education Institute, Sakarya University of Applied Sciences, 54050 Sakarya, Türkiye
4
Sid & Reva Dewberry Department of Civil, Environmental, and Infrastructure Engineering, Krasnow Institute, George Mason University, 4461 Rockfish Creek Ln., Fairfax, VA 22030, USA
*
Author to whom correspondence should be addressed.
Buildings 2025, 15(5), 658; https://doi.org/10.3390/buildings15050658
Submission received: 20 January 2025 / Revised: 11 February 2025 / Accepted: 12 February 2025 / Published: 20 February 2025
(This article belongs to the Section Construction Management, and Computers & Digitization)

Abstract

Current deep excavation applications, which pose risks for constructing high-rise buildings and infrastructures, are increasing. Therefore, the increasing urbanization, underground infrastructure requirements, and time and cost constraints in construction projects have led to a growing demand for rapid, economical, and safe deep excavation designs. Although numerical modeling tools enable rapid analyses, the reliability of soil engineering parameters remains a challenge due to natural variability, sample disturbances, and differences between laboratory and field test conditions. In this study, PLAXIS 2D (Version 24) was used to model a deep excavation, allowing for the assessment of soil–structure interaction and excavation-induced deformations. The objectives are to compare field data with the numerical model and identify which soil parameters are critical for excavation. Through the sensitivity analysis, the study highlighted that the variations in shear strength parameters, such as cohesion and internal friction angle, are crucial and shall be precisely determined. The performed analyses revealed that even minor changes in the internal friction angle can dramatically impact displacements by doubling them and highlight the significant disparity between the minimum and maximum margins. The numerical analysis underscores the need for precise parameter measurement and careful analysis to achieve reliable results and ensure safer, more effective designs. The comparison of numerical results with field measurements confirmed the model’s accuracy.

1. Introduction

There is a widespread need for deep excavations, especially for the construction of tall buildings or infrastructures such as tunnels [1,2,3,4]. The construction of deep excavations is a process that requires special precautions, as it should not affect the stability of the soils, underground structures, adjacent buildings, and other existing engineering structures. During the deep excavation, there are many risk factors characterized by lateral deformation of the surrounding soils, differential settlement of the adjacent buildings, and collapse of excavation [5,6,7,8,9,10,11]. In addition to the economic losses, these risks can lead to casualties [12,13]. Therefore, to alleviate these risks, support elements shall be utilized in construction projects of deep excavations [14,15]. These support elements include retaining walls, braced walls, diaphragm walls, pile walls, sheet piles, struts, and anchors. The design of such a project requires careful analysis in terms of examining the internal forces acting on these elements and the resulting lateral displacements [16]. Therefore, a detailed analysis is crucial before deep excavations to predict the stresses and deformations that will occur in the soil or a support system structure.
Numerical modeling tools help design the optimum of any construction system in terms of executing different designs quickly and cost-effectively [17,18,19,20,21,22]. The finite element method (FEM), first introduced by Clough in 1960, is one of the numerical modeling tools that solve complex engineering problems by providing a simple equivalent model [23]. When the relationship between the model, geometry, materials, and desired criteria is established correctly, this approximate calculation gives users an advantage in terms of time and economy. Especially for deep excavation problems, both the coupling effect of the geotechnical properties of soils surrounding the excavation and forces on supporting elements can be appropriately designed by FEM [24,25]. The critical point in these models is the appropriate selection of the soil properties where the excavation is carried out, the mechanical parameters of the support elements, and the creation of the best geometric model that will reflect the boundary conditions. In this regard, PLAXIS, a commercially available FEM software (Version 24), has been preferred by many researchers in the stability of deep excavations [26,27,28,29,30,31,32].
Pal and Khan [29] simulated a deep excavation in the sand layer using a diaphragm wall, anchors, and geogrids in PLAXIS 2D (Version 24). They emphasized that numerical modeling is successful in simulating deep excavations. Santos et al. [26] numerically modeled an excavation supported by a strut with the PLAXIS program. The numerical results were compared with actual displacements obtained from the field, and it was stated that the deformations obtained by PLAXIS analyses were higher than the actual data. Pak et al. [30] modeled 1296 deep excavation cases stabilized using the soil-nailing method using PLAXIS and presented design tables and diagrams that can be easily used in the preliminary design. Kog and Loh [32] used PLAXIS to model a deep excavation in marine clays and emphasized the selection of appropriate constitutive models. Ou [27] compared drained and undrained analyses and constitutive soil models in deep excavation problems in clay. He emphasized that undrained analysis generally predicts wall movements well for excavations. Gaur and Sahay [28] simulated soils with different structural models in an excavation model in PLAXIS, and they emphasized that the unloading behavior of the soil is important in excavation problems.
Soil properties are highly variable, as Terzaghi (1948) noted, stating that “soil properties may vary from point to point”. Taylor (1948) also highlighted this challenge, emphasizing the inherent difficulty in dealing with geomaterials. Even samples from the same soil layer can produce different results, raising concerns about the reliability of models based on a single soil test. This variation also affects numerical models, making it essential to account for changes in the soil parameters. To address this, researchers have conducted parametric studies by varying properties to obtain reliable excavation models [33,34]. Whitman [35] suggested that it is valuable to systematically choose the parameters using statistical and probabilistic methods. Sang-To et al. [31] introduced a new method for estimating the horizontal displacement of the diaphragm wall using optimization and PLAXIS together. In PLAXIS, a real field case with phased excavation was modeled using the planetary optimization algorithm to optimize the soil parameters and evaluate the model’s fit to field data. While optimization helps select correct parameter values, engineers need a theoretical background for effective application. A sensitivity analysis, which is easier to apply and included in PLAXIS, is another useful method in this context [36]. This method analyzes which the input parameters are most critical in designed or existing models for complex engineering problems, making it particularly valuable for determining the model parameters [37]. The primary challenge in the models is selecting the input parameters, as accurate model results depend on this careful selection [38,39,40]. Errors in these parameters can lead to significant issues in determining the output parameters, such as deformations in excavation problems. Thus, prior to analyzing excavation issues, it is essential to conduct parameter selection and a sensitivity analysis to eliminate insignificant inputs. This necessity has prompted researchers to focus on this subject in recent numerical studies. Borgh [41] conducted a sensitivity analysis on parameters for modeling a deep excavation in soft soil, focusing on the West Link project for a new railway station in Gothenburg, Sweden. The analysis revealed that interface strength (Rinter) significantly affects the bending moment and lateral deformations of the diaphragm wall. Wu et al. [15] conducted a parametric sensitivity study of an actual excavation project using PLAXIS 2D, examining the effects of preliminary drilling, the embedment depth of the retaining wall, and soil improvement. This study aimed to enhance the understanding of retaining wall designs for deep excavations. Wu et al. [15] highlighted that relying on a single set of parameters for input poses a high risk in predicting the performance of the support system. Ganesh et al. [42] modeled a foundation excavation support system using PLAXIS 2D and conducted a sensitivity analysis to assess the impact of changes in input material and bolt properties.
Within the scope of this study, a deep excavation belonging to a case study conducted in an alluvial field was simulated in PLAXIS 2D software (Version 24). The excavation design was made on a section that would represent the site’s soil profile. It was modeled with support elements in accordance with the case analysis. Inclinometer measurements that were obtained from the field were compared with the results of the finite element model, and the significance of numerical models in simulating real cases was discussed. More importantly, the sensitivity analysis and parameter variation analysis, which have recently taken value in numerical modeling, were performed to determine the effect of soil characteristics on the lateral displacements caused by excavation. Determining this effect has yielded significant outputs regarding the lateral displacements occurring in deep excavations. Since performing these two analyses will reveal the effect of all possible differences in the soil parameters, it will be beneficial in determining possible collapse and deformation problems before even starting the excavation phase and taking precautions when necessary. This study is an example of all collapse and deformation problems in geotechnics.

2. Materials and Methods

2.1. Case Study

The case analysis modeled in this study involves an excavation carried out with an alluvial soil in Izmir (Türkiye). The soil profile obtained from the boreholes can be examined in Figure 1. Below a 1 m fill, the soils are as follows: 2.5 m thick silty clay, 3.5 m silty sandy gravel, 7 m sandy clay, 4 m sandy clayey gravel, 5 m sandy clay, 5 m clayey sandy gravel, 1 m silty sandy clay, and 10 m sandy clay. The groundwater level is 2 m below the surface. An impermeable support system was designed to ensure that the excavation, which has a depth of 14.8 m (from the fill’s top level) and width of 35.3 m, is carried out with a safe and dry excavation. The vertical support elements consist of anchored diaphragm walls with a width of 80 cm. In addition, high-capacity anchors were used to meet the lateral stresses. According to preliminary research tests carried out in the field before starting production, the anchor capacity was determined to be 650 kN. In the field study, four rows of anchors were constructed. In situ research includes the lateral displacement measurements along the wall by using inclinometers.

2.2. Numerical Model

This study aims to calculate and compare displacements in a case study, including deep excavation. For that purpose, numerical analyses were carried out using the software called PLAXIS 2D (Version 24). Due to the symmetry, only the left half of the excavation was modeled with the plane strain property. The sensitivity and parameter variation analyses were carried out to reveal the most essential factors on the lateral displacements.

2.2.1. Soils and Structural Elements

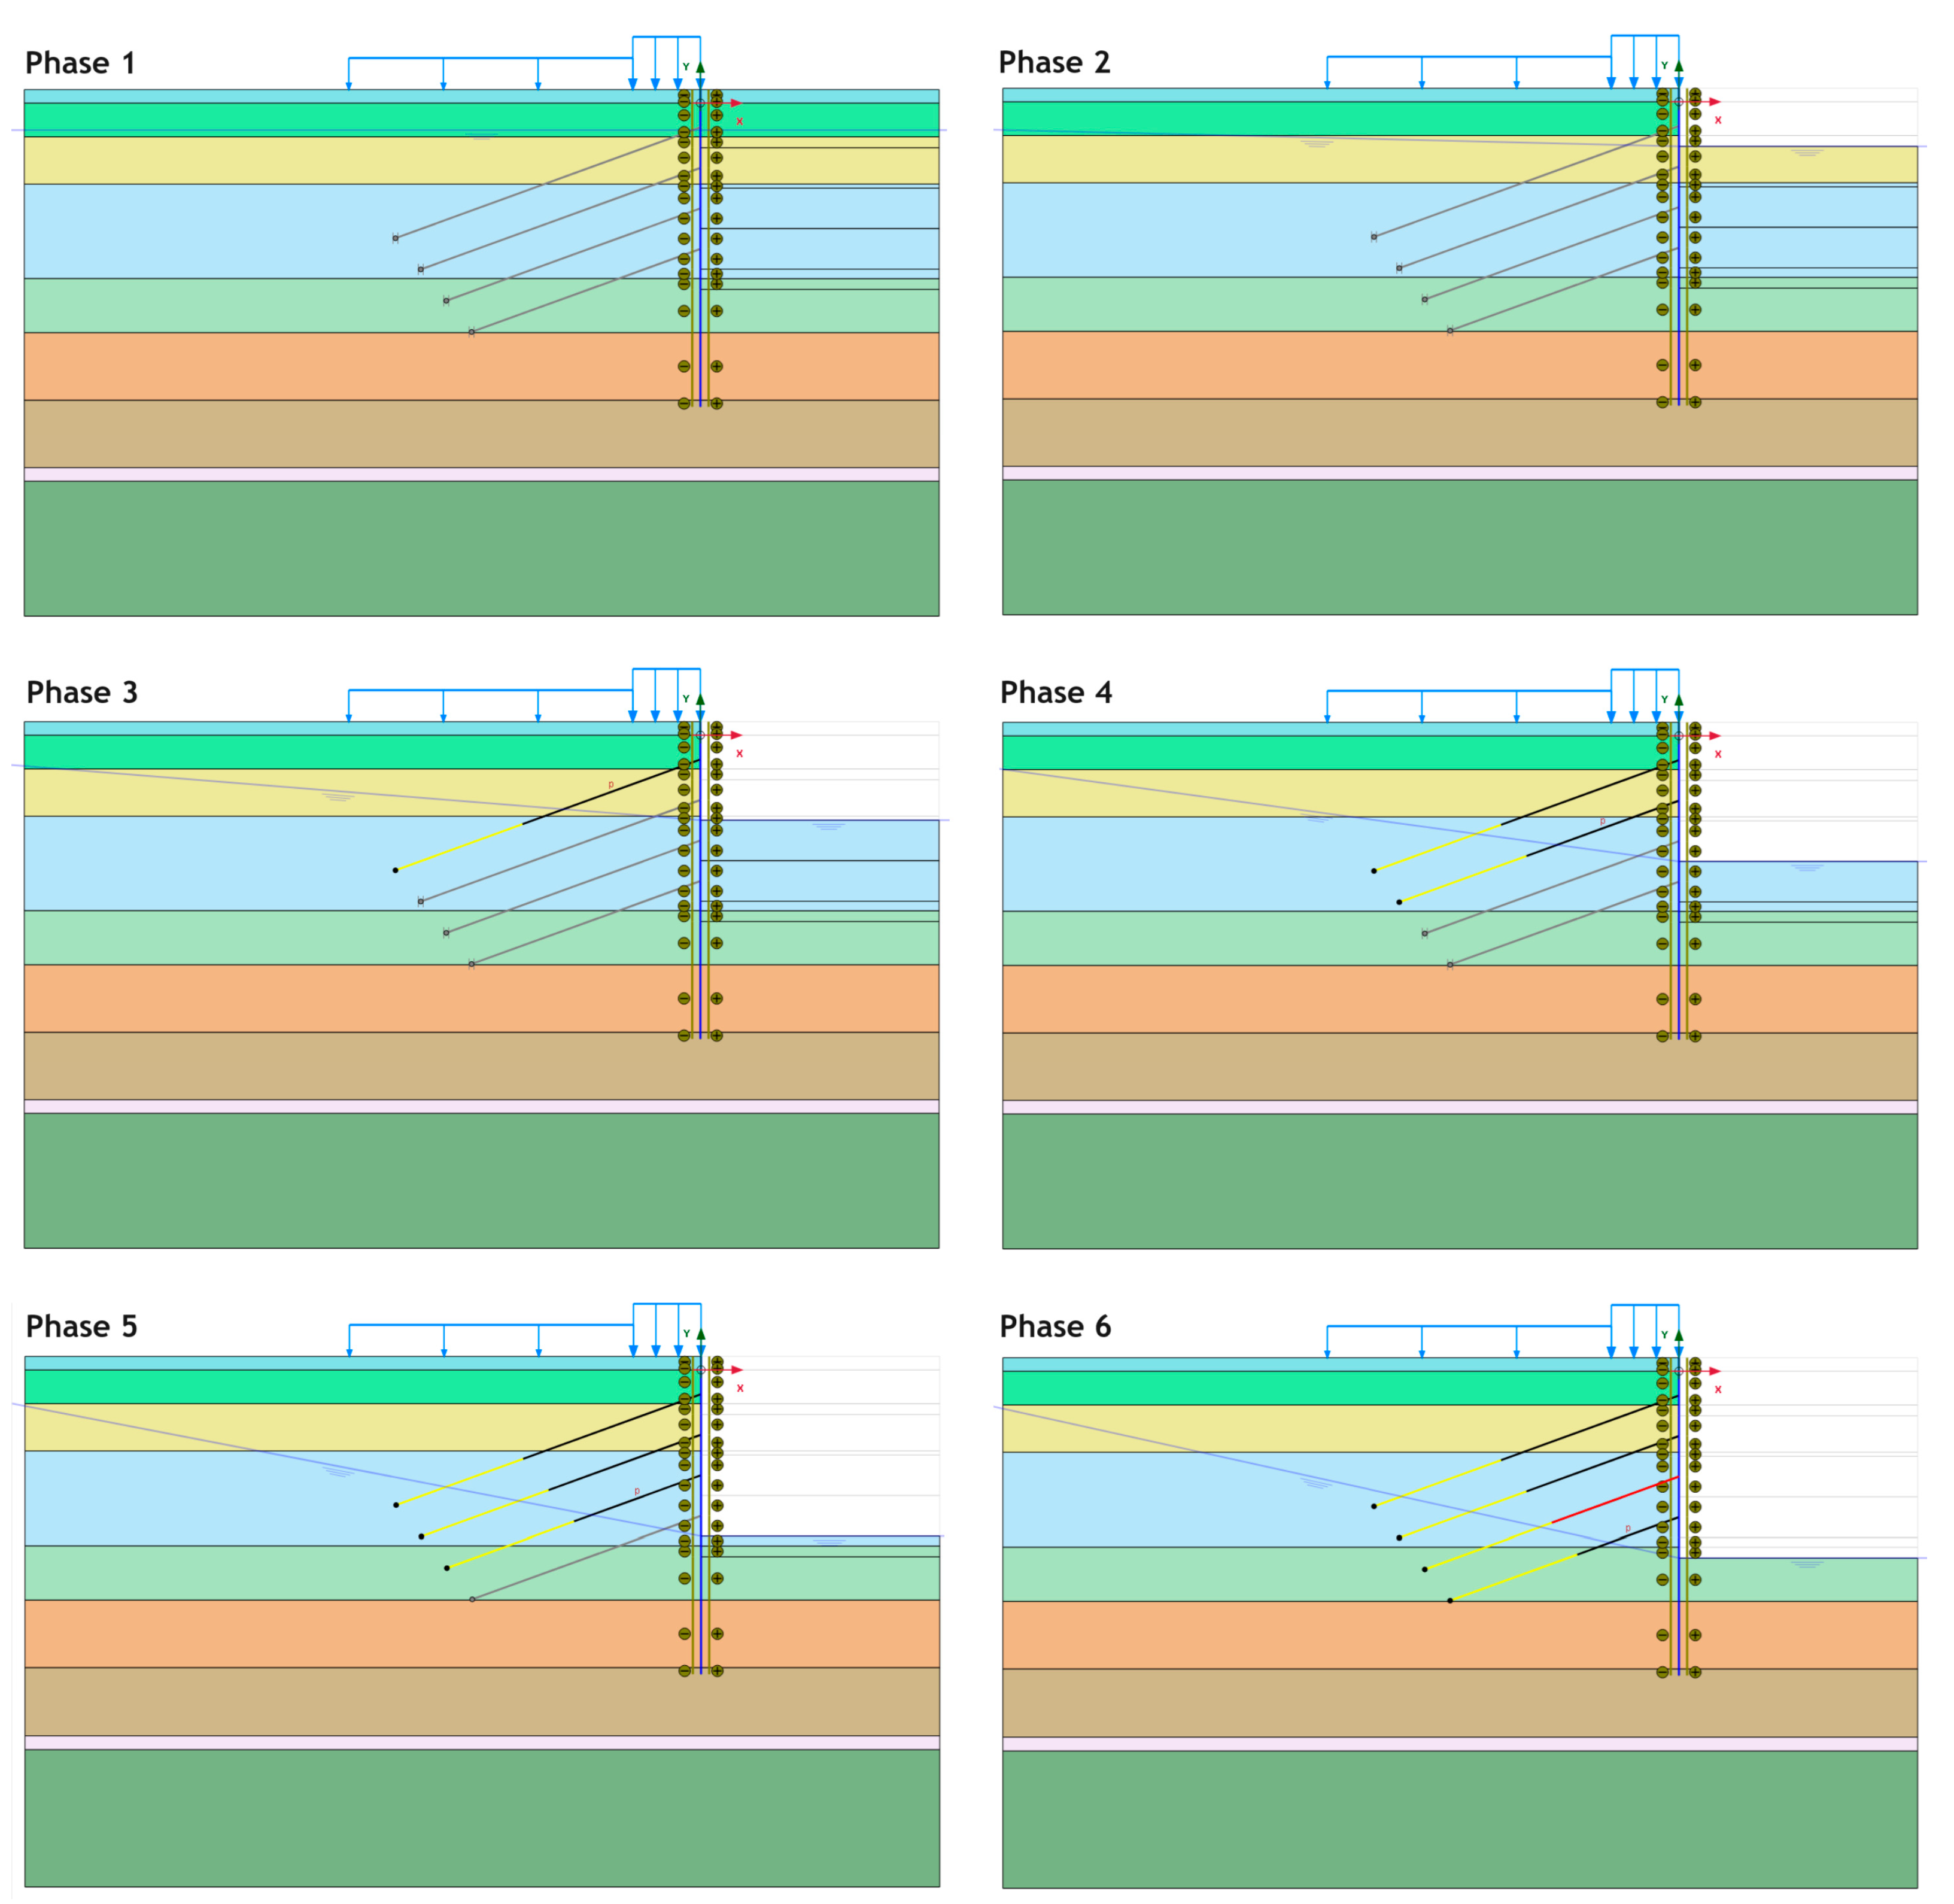
In the numerical model, the soils were simulated with the Hardening Soil small-train (HSs) model to realistically simulate the nonlinear excavation behavior of the soils [43]. This model was selected to accurately capture the nonlinear stress–strain behavior and small-strain stiffness effects of the soil, ensuring a more realistic representation of the soil response under excavation-induced deformations. Table 1 gives the soil parameters used in this model. The total excavation depth (starting from the top level of the fill) was 14.8 m, and the excavation was carried out in stages in the field. Before the excavation, a diaphragm wall was built to a depth of approximately 23 m. Interface elements were introduced at the surfaces between the wall and the soils. The wall was supported with anchors for each excavation stage. The levels of the anchors were −1.8 m, −4.8 m, −7.8 m, and −10.8 m, and they were activated at phase 3, phase 4, phase 5, and phase 6, respectively. According to the in situ tests, the anchor capacity was determined to be 650 kN. In addition, the structures existing near the excavation area were modeled by defining uniform distributed loads. The diaphragm wall was modeled using a “plate” element, the free length of the anchor was modeled with “anchor”, and the fixed length (bonded-grouted part) was modeled with a “geogrid” element in PLAXIS (Version 24). The properties of these structural elements are given in Table 2.

2.2.2. Mesh

After the whole geometry and structural elements are modeled, the “mesh” process is performed. Meshing is dividing the geometry into small, optimized triangular wedge-shaped elements. The FEM meshing is an automated process in PLAXIS (Version 24) that works without expecting much from the user. It is essential to ensure mesh optimization by the user in this process to obtain accurate numerical results [44]. While a user may need to perform mesh refinement to increase the calculation precision in some regions, coarse meshing should be provided to reduce the calculation time in some areas. In the current model, 15-noded triangular elements were selected to ensure accuracy and enhanced capability to capture stress concentrations. The mesh was refined in regions with high stress concentrations, while a medium-density mesh was applied elsewhere to balance accuracy and computational efficiency. The mesh geometry is illustrated in Figure 2.

2.2.3. Excavation Phases

After the mesh is created, the excavation stages are defined. Figure 3 illustrates the stages as follows: Initial phase: Initial stresses were generated by the K0 procedure. Phase 1: The structural loads and diaphragm wall were activated. Phase 2: The first excavation stage was carried out. At this stage, 4.3 m of the soil was excavated from the top level of the fill. The groundwater level was lowered at a steady-state flow. Phase 3: Before the second excavation stage, the first row of anchors was subjected to prestressing. Then, the soil was excavated to a depth of −6.3 m, and the groundwater level was lowered to this level. In total, 7.3 m of soil was excavated from the upper level of the filling. Phase 4: The anchors in the second row were prestressed. The third excavation stage, which reached −9.3 m (10.3 m from the top of the fill), was carried out, and the groundwater level was lowered. Phase 5: The anchors in the third row were prestressed. The fourth excavation stage, which reached −12.3 m (13.3 m from the top of the fill), was carried out, and the groundwater level was lowered. Phase 6: The last anchor row was subjected to prestressing, and the final excavation stage (14.8 m in total from the top of the fill) was carried out. The groundwater level was lowered to the excavation base.

2.2.4. Sensitivity Analysis and Parameter Variation Analysis

In a parametric study, it should be noticed that some parameters may have much more effect on the results than others, while some may have negligible effects. In order to reduce the number of combinations in the analysis, first, the effect of each parameter must be determined by performing a “sensitivity analysis”, and those with less effect must be eliminated from the solutions. This is a similar process to feature selection. In the sensitivity analysis, the calculations are performed for the min. and max. limits of each parameter to be examined, and the total number of analyses to be performed in a problem with n variables will be 2n + 1 (+1 indicates the main model). At the end of the sensitivity analysis, the soil parameters that are most significant on a previously given criterion (these criteria can be displacements, stresses, or safety factors at a point in the geometry) are determined through their sensitivity scores. On the other hand, the “parameter variation analysis” option includes creating all possible combinations using the min. and max. limits of each parameter to be examined, and all models will be calculated using these values. Accordingly, after calculating the natural stresses in the main model, all stages for all combinations must be calculated separately. If the number of soil properties to be examined is n, all 2n + 1 (+1 indicates the main model) models must be analyzed. At this stage, the more parameters there are, the more analyses there will be, which is not a preferred situation for saving time and money. Therefore, it makes sense to include only the features with high sensitivity scores obtained from the sensitivity analysis in the parameter variations. In this sense, one should note that a sensitivity analysis is a crucial step for the preliminary analysis of the effective features of a model [45].
In this study, sensitivity analysis and parameter variation analysis were carried out to investigate the variation in the soil parameters for the lateral displacement on the wall due to the deep excavation. The soil parameters were evaluated based on their impact on lateral wall displacement, as it is the primary concern in deep excavation stability. Sensitivity scores were determined by analyzing displacement variations within the given parameter ranges. The parameters with the highest sensitivity scores were selected for the parameter variation analysis. The parameters, such as Poisson’s ratio and unit weight, were excluded due to their low sensitivity scores in the preliminary analysis. Additionally, parameters with negligible effects on lateral wall displacement were omitted to optimize the computational efficiency while maintaining accuracy. The soil parameters included in the sensitivity analysis and their min.–max. ranges are given in Table 3. In this table, the reference value is taken from the main numerical model, while the variations in the soil parameters are established according to Duncan [46].

3. Results and Discussions

3.1. Numerical Model Results

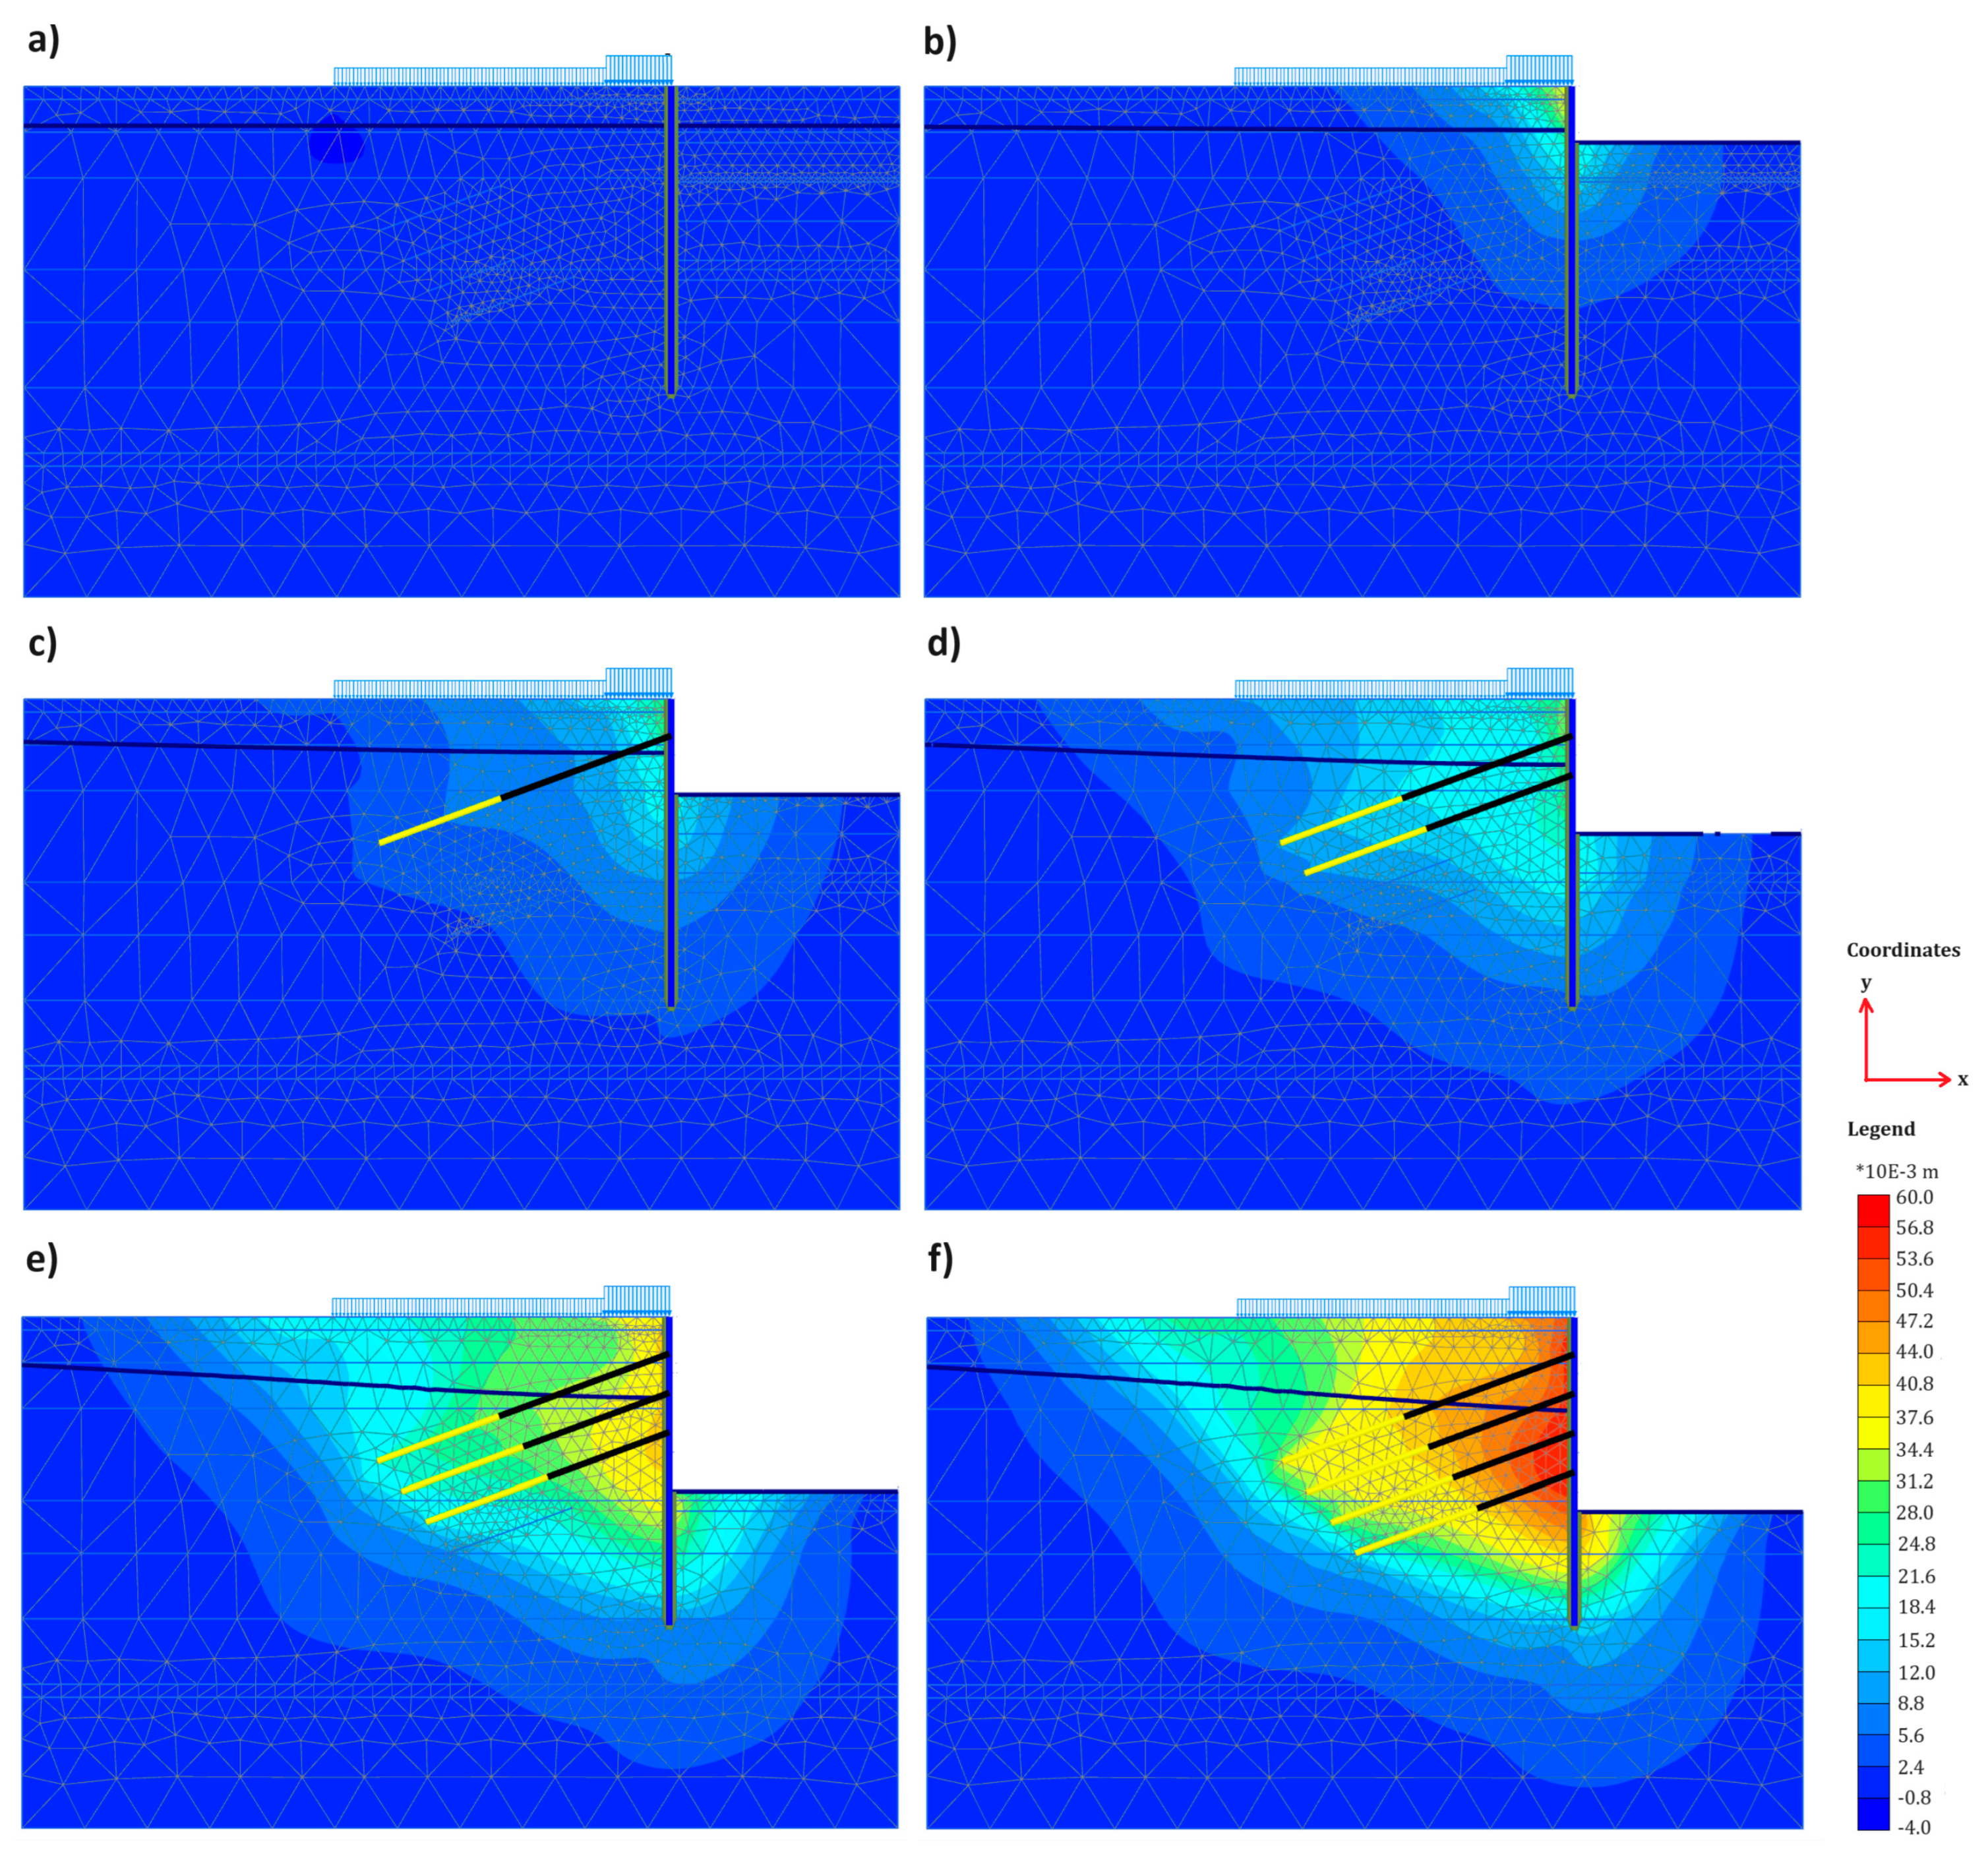
In this study, we tried to model a case study of a deep excavation with nearby structures. The deformed mesh formed at each excavation stage is illustrated in Figure 4 at the same scale. In this figure, it is noticeable that, due to the excavation, lateral deformations occur at the diaphragm wall, and heave occurs at the excavation base. It is clearly seen that the lateral displacements are prevented by anchors as much as possible. The lateral deformations at the top of the diaphragm wall (the upper surface of the filling) seem to have been avoided by the first row of anchors, especially. This situation emphasizes the success of flexible walls and anchors in deep excavations.
The importance of lateral displacements in a deep excavation has been the focus of many researchers, as mentioned previously. Figure 5 shows the lateral displacements that occur in each excavation phase in the numerical analysis of the case study. It was determined that the maximum displacement was 6 cm, which is an acceptable level based on the code of Türkiye [47]. As examined, lateral displacements are generally concentrated around the middle section of the diaphragm wall as the excavation depth increases. It is clear that the displacements increase despite the support elements, especially in cases where the excavation exceeds 13 m (Figure 5e), approximately at the middle of the wall. The highest lateral displacements occur around depths of 10 to 13 m, indicating this as the critical zone where passive resistance from the embedded portion of the wall is less effective in counteracting lateral earth pressures. The displacements in these areas are likely to increase the internal effects on the diaphragm wall.
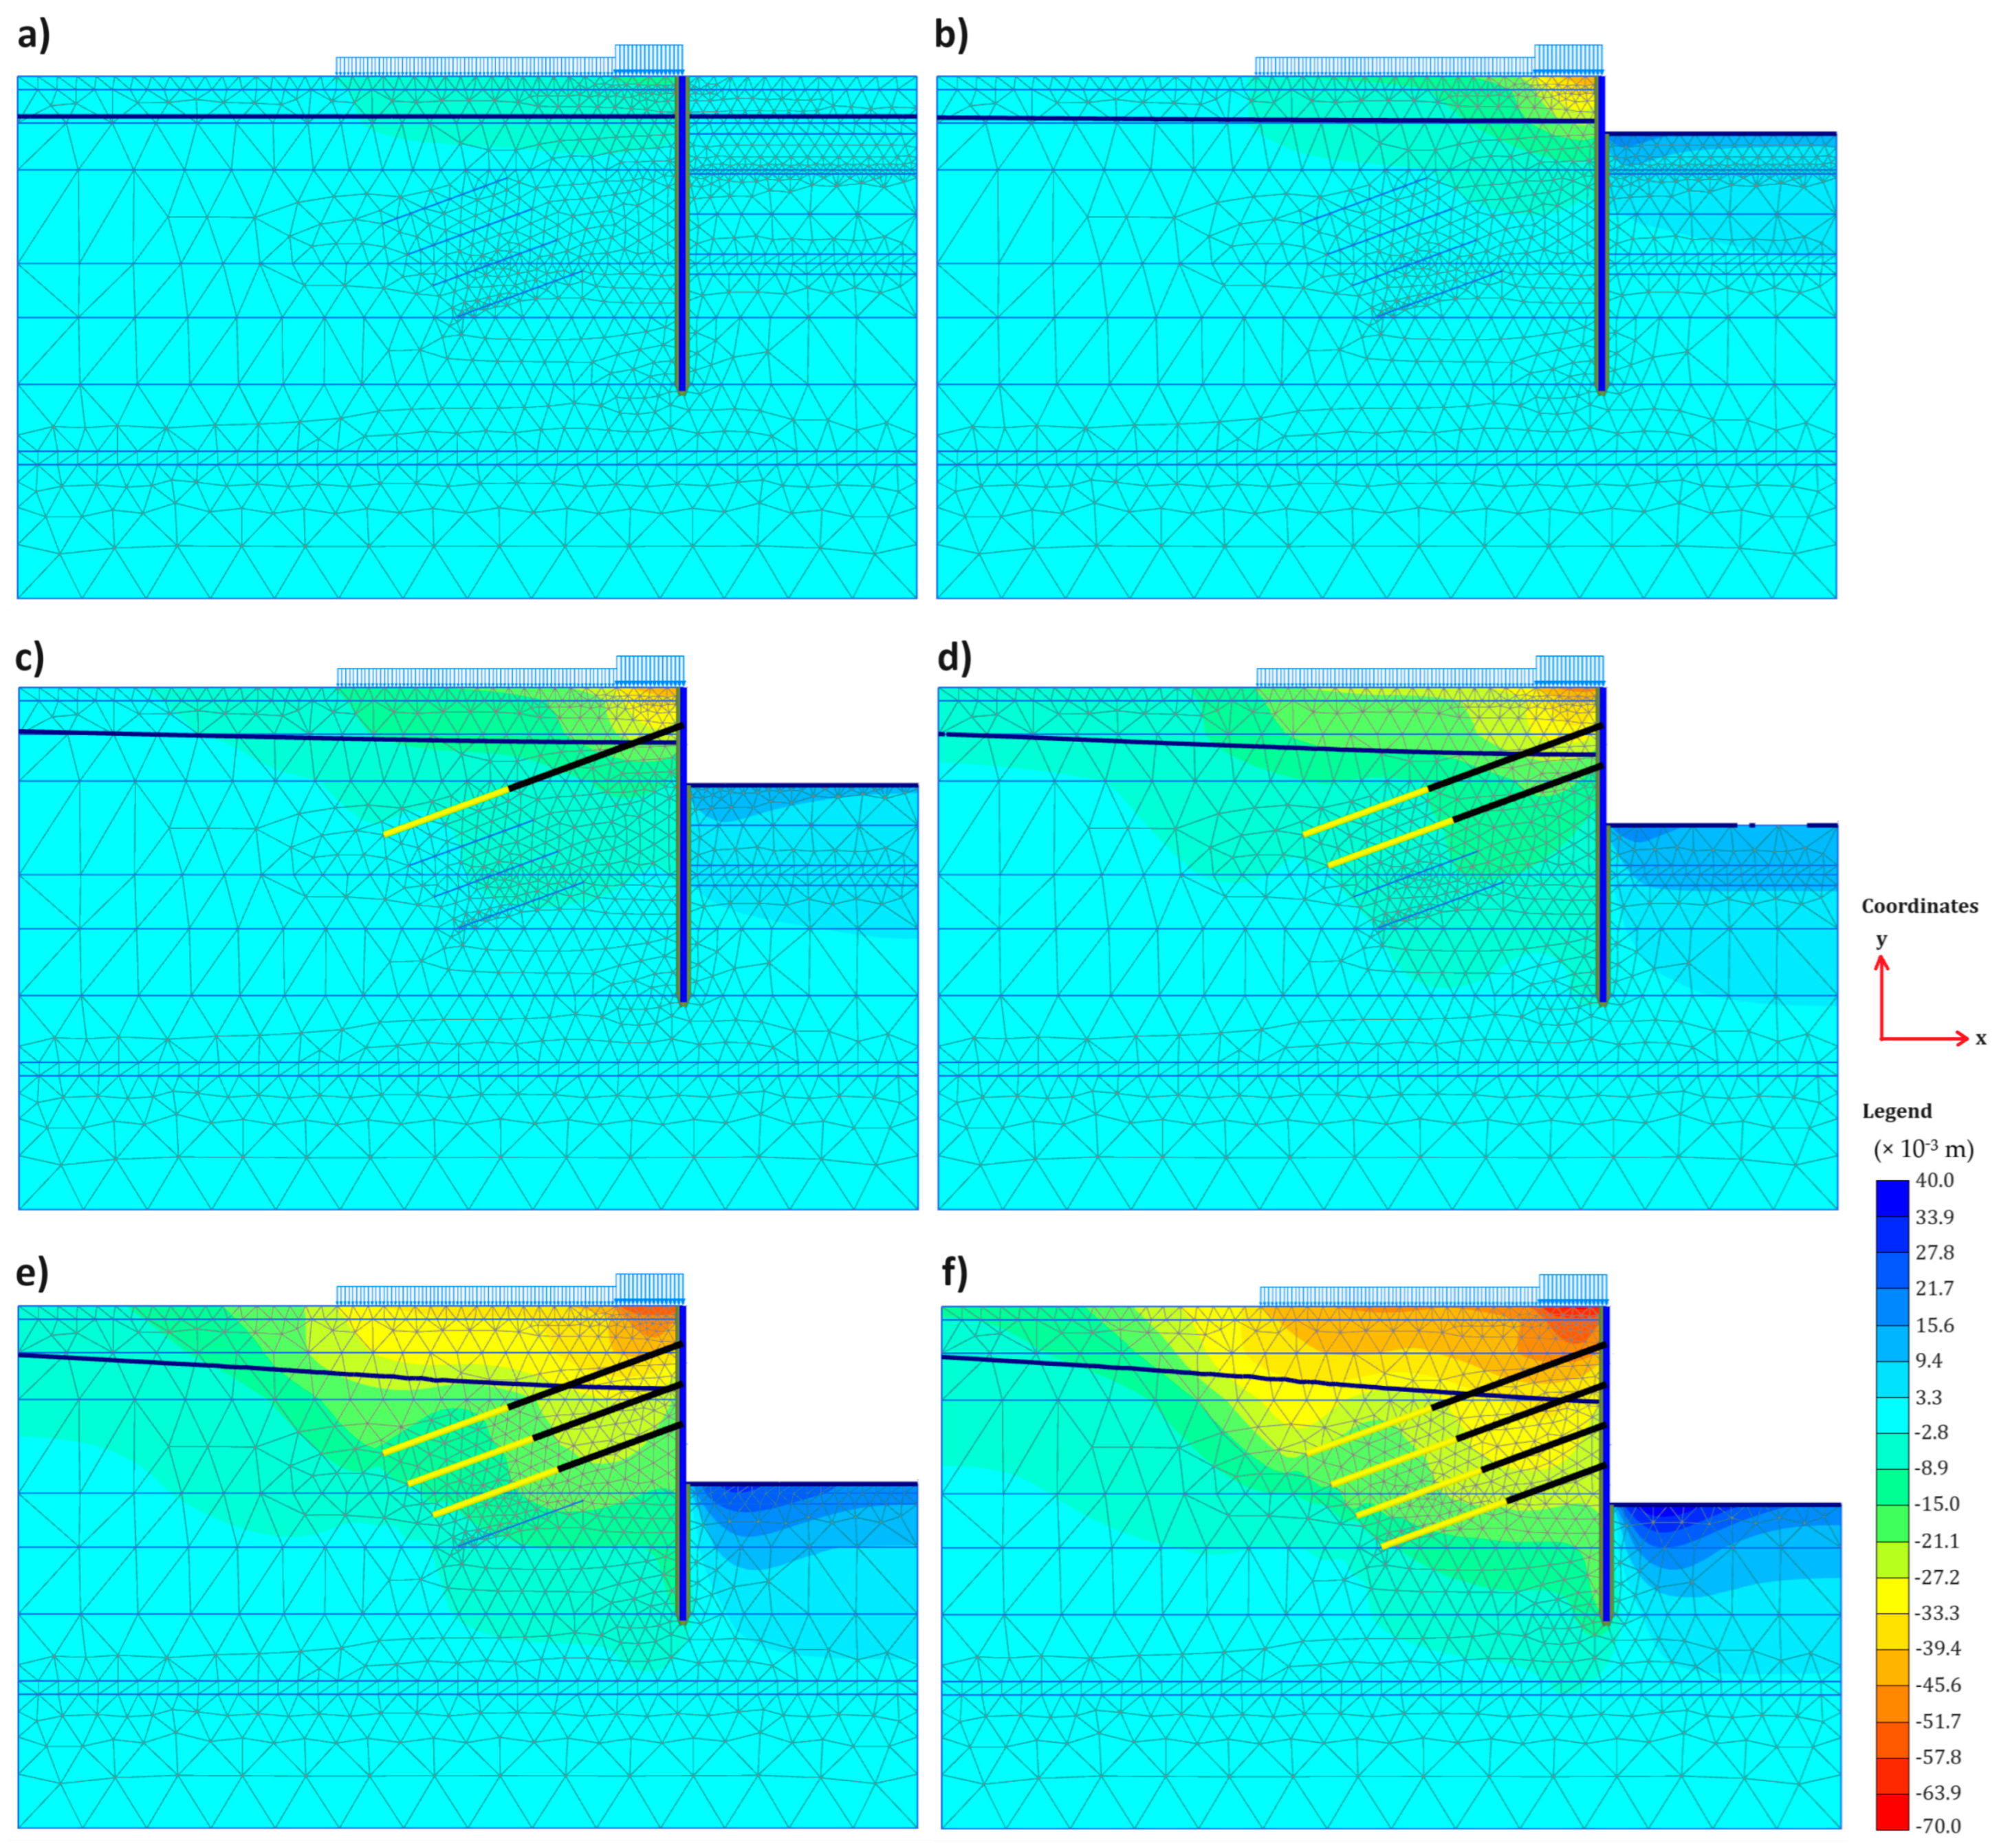
The vertical displacements are illustrated in Figure 6. In this figure, the values in the positive y direction symbolize heave, while those in the negative direction symbolize settlement. From here, it is understood that heave occurs especially at the excavation base, and settlements occur in places where nearby structures are located. It has been observed that heave reaches the maximum levels, such as 4 cm from around 1.5 cm, significantly when the excavation depth exceeds 10 m. It has been determined that the most critical areas for heave occur in places close to the wall. Settlement, on the other hand, reached its maximum value as the excavation stages increased.
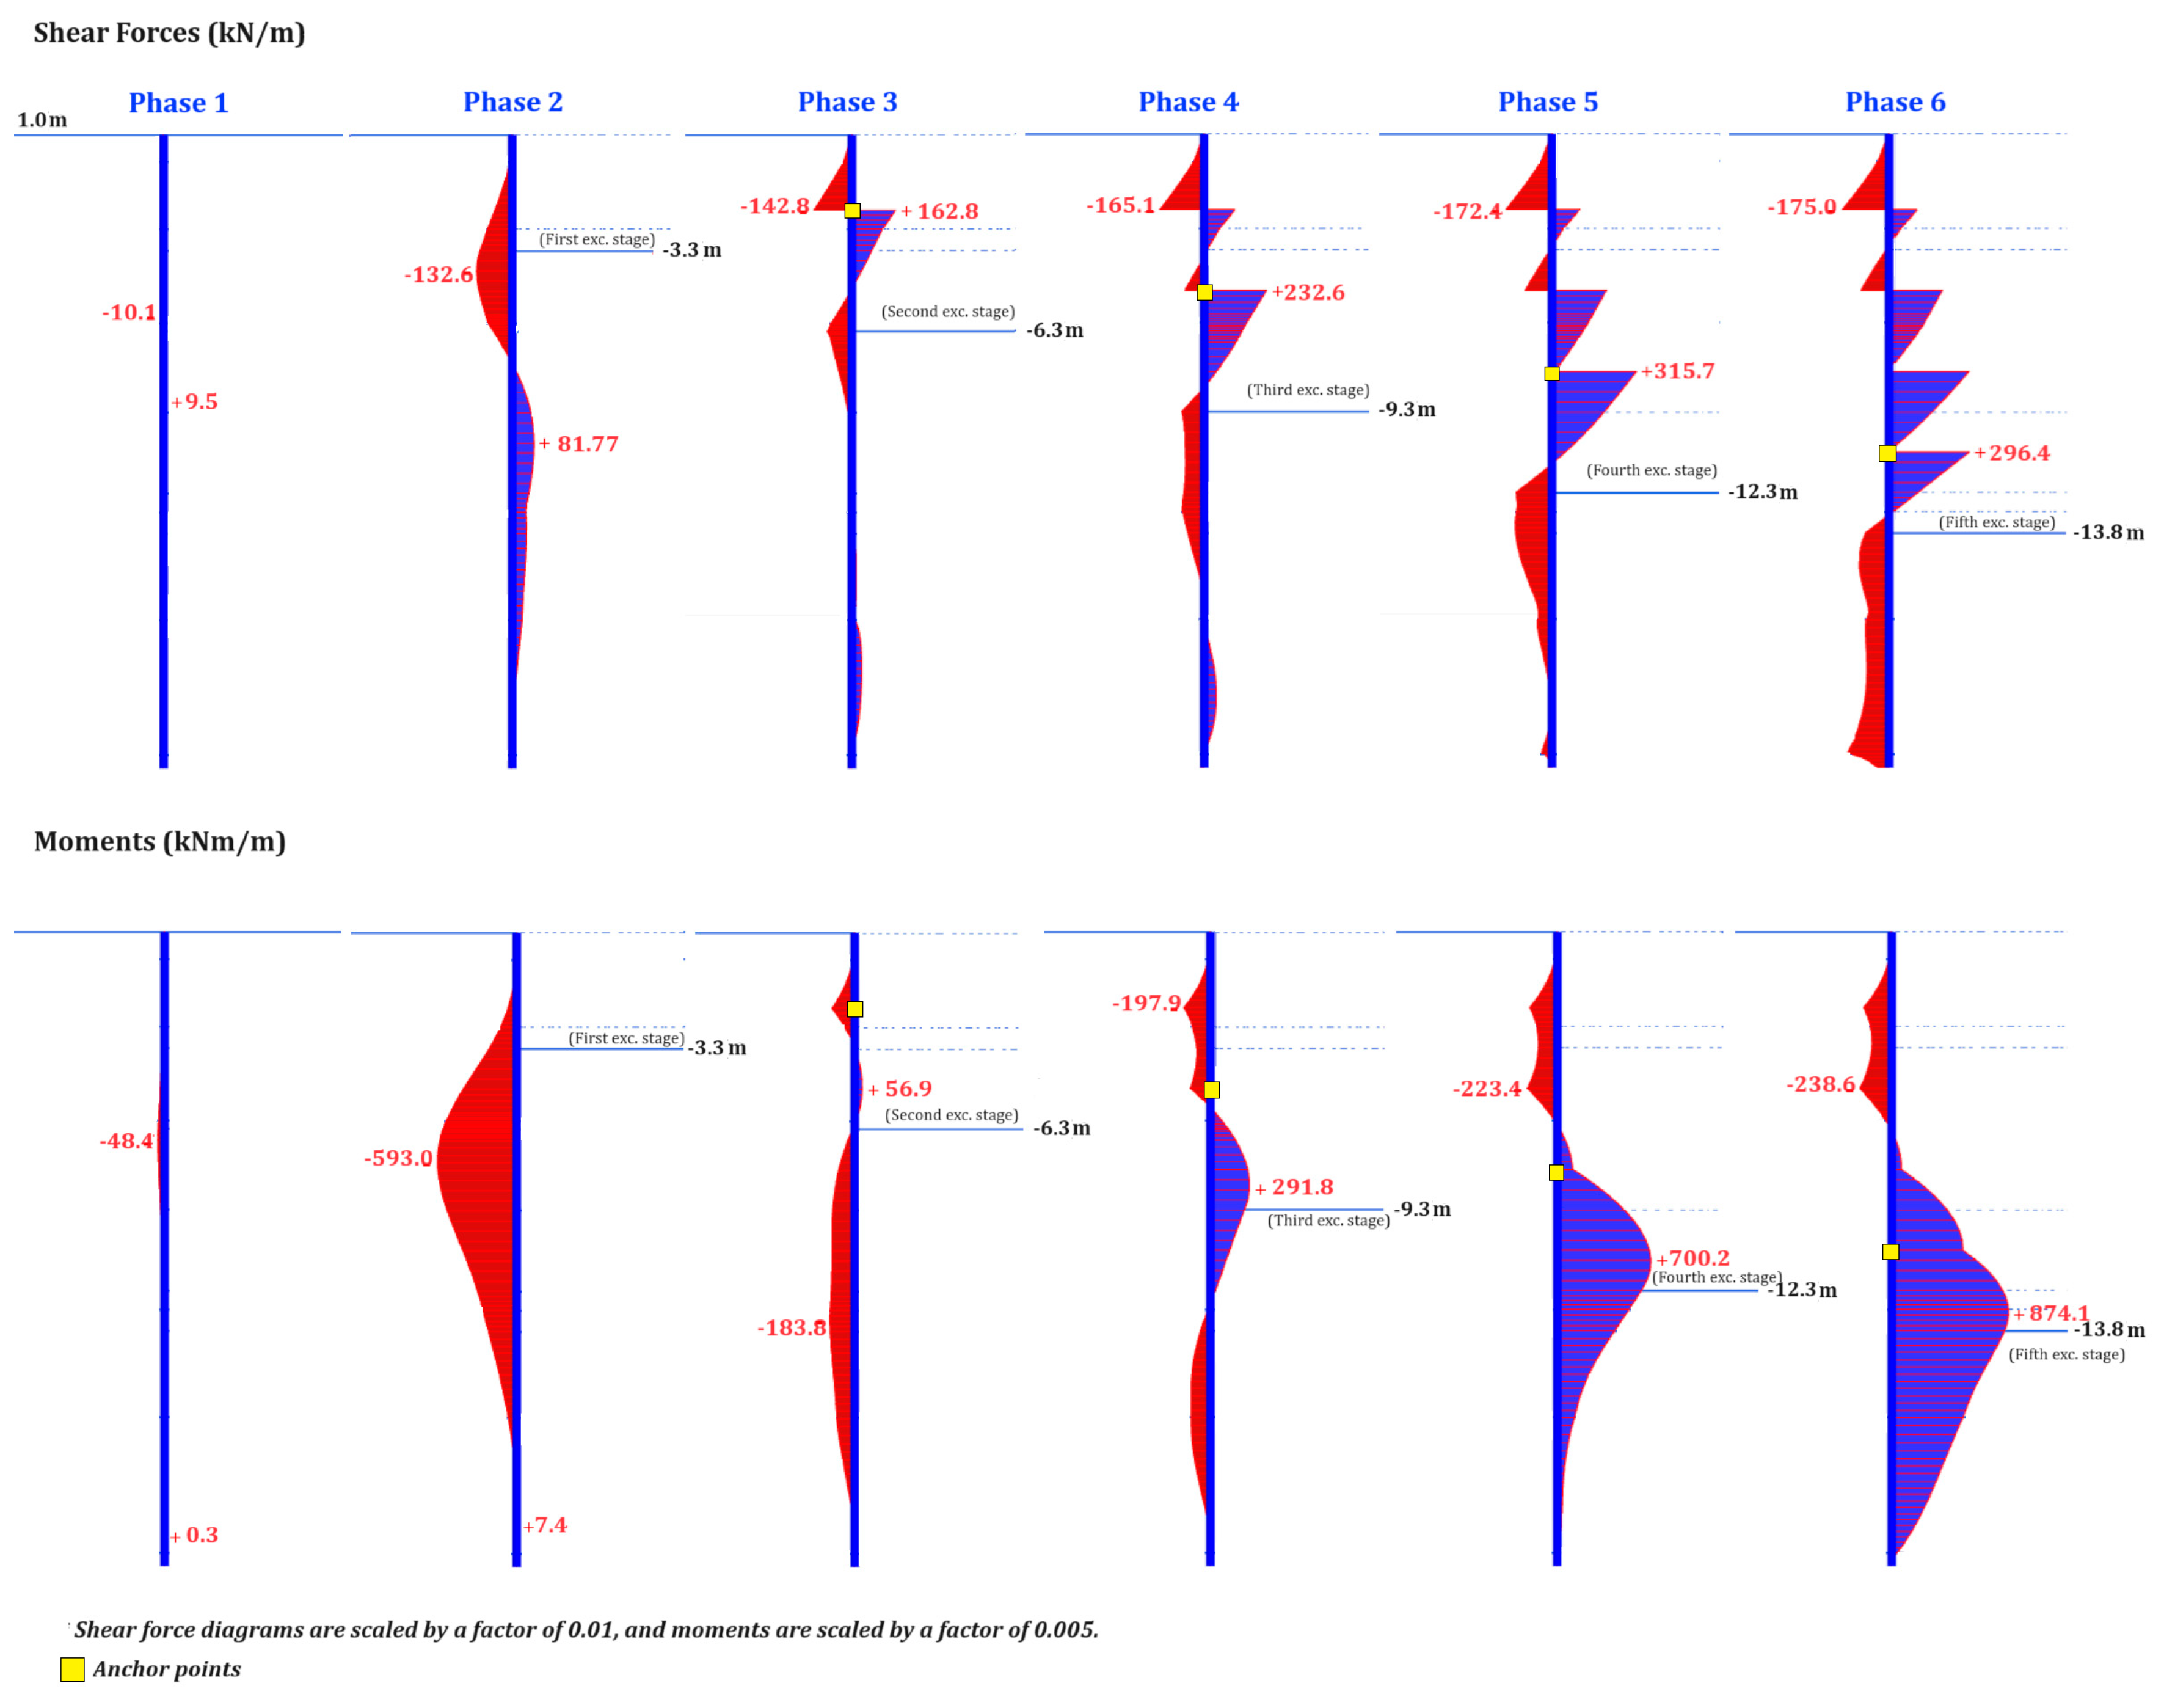
Figure 7 includes the shear force and moment diagrams on the diaphragm wall in different excavation phases. In this figure, the excavates are indicated with dashed blue lines, depending on their phases; the anchor levels are also shown with a yellow square box in their activated phases. The first excavation stage was activated in phase 2, and the second was in phase 3 and continued in an orderly manner. When the shear force diagrams in the figure are detailed, it can be seen that the magnitude of the shear forces is too high on the excavation side in phase 2, in which a total of 4.3 m of excavation was made, and no anchor was activated. This force is limited by applying the first anchor sequence in phase 3. During each excavation phase, it indicates that the tendency to increase the shear force caused by the increasing excavation depth is restricted by the anchors as much as possible. Similar conclusions can be made again when the moment diagrams are taken into consideration. Moments, which increased as a result of the deepening of the excavation, were limited by the anchor forces. In deep excavations, increasing the excavation depth leads to greater lateral soil pressures, which, if unbalanced, can result in excessive bending moments and shear forces on the retaining structure. The activated anchors transfer a portion of these lateral forces into the surrounding stable ground, thereby reducing the internal forces on the diaphragm wall. Therefore, the anchors play a key role in redistributing lateral earth pressures, thereby reducing bending moments and shear forces on the diaphragm wall. As shown in Figure 7, the first row of anchors significantly limits the increase in internal forces, demonstrating their effectiveness in enhancing excavation stability. In such studies, the number and locations of the anchors are important to provide optimum reduction in the moment. Providing anchor rods at the optimum locations may decrease moments significantly [48]. Therefore, it is beneficial to model and evaluate the projects numerically before field applications to satisfy stability and the minimum cost.
Finally, the safety factor in each excavation stage was examined. The factor of safety values was determined using the strength reduction method (SRM) implemented in PLAXIS 2D (Version 24). In this method, the shear strength parameters (cohesion and internal friction angle) of the soil are gradually reduced until the system reaches failure, and the corresponding reduction factor is recorded as the safety factor (Msf). The values of 2.9, 2.7, 1.9, 1.6, and 1.4 were obtained for different excavation stages through this approach. Physically, these values indicate the margin of stability at each phase of excavation. As excavation progresses and the lateral support conditions change, the safety factor decreases, reflecting an increasing level of instability. The fact that all values remain above 1.0 confirms that the excavation remains stable throughout the process. However, the declining trend in Msf highlights the growing importance of lateral support mechanisms such as diaphragm walls and anchors as the excavation deepens. These results emphasize the necessity of precise geotechnical parameter selection and monitoring, as a further reduction in the safety factor could lead to instability in deeper excavation phases.

3.2. Sensitivity Analysis and Parameter Variation

Another objective in the numerical modeling was to determine which parameters would create more sensitivity over wall deformations in this type of deep excavation while considering the variable nature of the soil. For this reason, several engineering features of the soil layers were selected, and the upper and lower limits were given according to the variation rates in the literature. As a result of the sensitivity analysis, the effect of each feature of the soils on a predetermined criterion (displacement in this project) is understood according to these scores (SensiScores). In PLAXIS 2D (Version 24), the sensitivity analysis assists in evaluating the impact of changes in specific soil parameters on the model results. The obtained SensiScores reflect the model’s sensitivity to changes in these parameters. A high SensiScore suggests that a slight change in the parameter significantly affects the model results, where a low SensiScore implies that changes in the parameter do not cause significant alterations in the model results.
Based on the SensiScores provided in Table 4, it can be concluded that variations in the rigidity parameter Eur and the shear strength parameters such as cohesion and internal friction angle are significant in deep excavation scenarios. Specifically, variations in the internal friction angle substantially impact the excavation. This is likely because the internal friction angle directly influences soil stability and shear resistance. Soils with high internal friction angles are generally more stable, whereas low internal friction angles may pose a greater risk of displacement during excavation. A reduction in the shear strength parameters weakens the soil’s resistance against lateral earth pressures, increasing the risk of excessive displacements and potential instability. Additionally, considering lateral earth pressures directly affect excavation, the contribution of internal friction resistance to passive resistance cannot be overlooked. Therefore, the variation in the internal friction angle of the sixth soil layer, which lies along the depth of the embedded wall, has directly impacted the displacements occurring in the wall due to excavation. This analysis underscores the critical importance of accurately determining the internal friction resistance of soils in deep excavation scenarios and emphasizes the need for reliable data for this parameter. Another parameter with a high sensitivity score is cohesion. As a shear resistance parameter, cohesion also directly affects soil stability and lateral forces, increasing its sensitivity score. The sensitivity analysis has revealed that accurately determining parameters such as internal friction angle and cohesion, which directly impact shear resistance, is crucial, as these parameters influence the excavation performance and deformations.
Moreover, elasticity moduli influence the deformation characteristics of the soil, where higher values lead to reduced lateral displacements, while lower values increase overall deformation and wall deflections. As observed in the sensitivity analysis, even minor changes in these parameters significantly impact excavation-induced displacements, highlighting the necessity of their accurate determination. These results emphasize that variations in shear strength parameters and elasticity moduli play a crucial role in governing the excavation performance and must be carefully evaluated in geotechnical modeling to ensure excavation safety and efficiency.
When examining which parameters are influential in each soil layer, the sensitivity scores indicate that variations in the soil layers from the third to the sixth (i.e., between depths of 3.5 m and 23 m from the fill level) significantly influenced the analysis results. It is essential to consider that the total excavation depth is 14.8 m, with a diaphragm wall extending to 23 m. This implies that changes in the soil properties within this depth range are critical for the displacements occurring in the excavation. Furthermore, Layer 3 (silty sandy gravel) is a highly permeable layer located near the excavation, yet it remains well beyond the embedment depth of the diaphragm wall. Layer 4 (sandy clay) is situated within the excavation and exhibits a low shear strength. Given that the analysis considers long-term conditions and this layer has a substantial thickness, variations in its parameters significantly affect lateral displacement. These changes are particularly relevant due to the long-term deformation behavior of clay. Layer 5 (sandy clayey gravel) is positioned directly beneath the excavation level, while Layer 6 (sandy clay) extends to the embedment depth, forming the primary passive resistance zone. Therefore, it is not surprising that variations in the shear strength parameters, particularly the shear strength angle, which serves as the primary source of passive resistance, have a considerable impact on lateral displacement. These findings collectively highlight that the soil layers within the excavation depth, particularly the layers providing passive resistance beneath the excavation, play a crucial role in governing lateral deformations. Specifically, the shear strength of these deeper soil layers is a key factor influencing the overall displacement behavior of the excavation.
In this study, following the sensitivity analysis, a “parameter variation” analysis was conducted to assess the impact of key soil parameters on excavation-induced displacements and internal forces. By systematically varying the most sensitive parameters identified in the sensitivity analysis, this study aimed to evaluate the best-case and worst-case scenarios for excavation performance. Therefore, in this analysis, parameters with the highest sensitivity scores were selected, and the lower and upper values of these parameters were cross-referenced with the minimum and maximum values of other selected parameters. A sensitivity score threshold of 5% was considered based on a balance between significance and computational efficiency. The parameters included the internal friction angles of the third, fourth, fifth, sixth, and seventh soils and the cohesion of the fifth and sixth layers. A total of 129 analyses were conducted. If the feature selection process had not been applied using the sensitivity analysis, a parameter variation analysis would have been conducted for each input related to the soils. This would have increased the number of analyses to 2145 + 1. The importance of conducting a sensitivity analysis in terms of saving time and effort can be seen.
Among the 129 analyses, there is also the analysis where a specific parameter combination results in the maximum displacement in the model (MaxDispl) and the analysis where parameter combinations minimize the displacement in the model (MinDispl). These terms correspond to the numerical models in which the combination of soil parameters results in the highest (MaxDispl) and lowest (MinDispl) lateral displacements. The MaxDispl model identifies the worst-case scenario, where parameter variations lead to the largest excavation-induced deformations, while the MinDispl model represents the best-case scenario with the least deformations. These models illustrate the boundaries of the parameter variations, enabling the understanding of the worst- and best-case scenarios for displacements in the deep excavation. Therefore, this analysis is crucial for understanding the safety margins of the design.
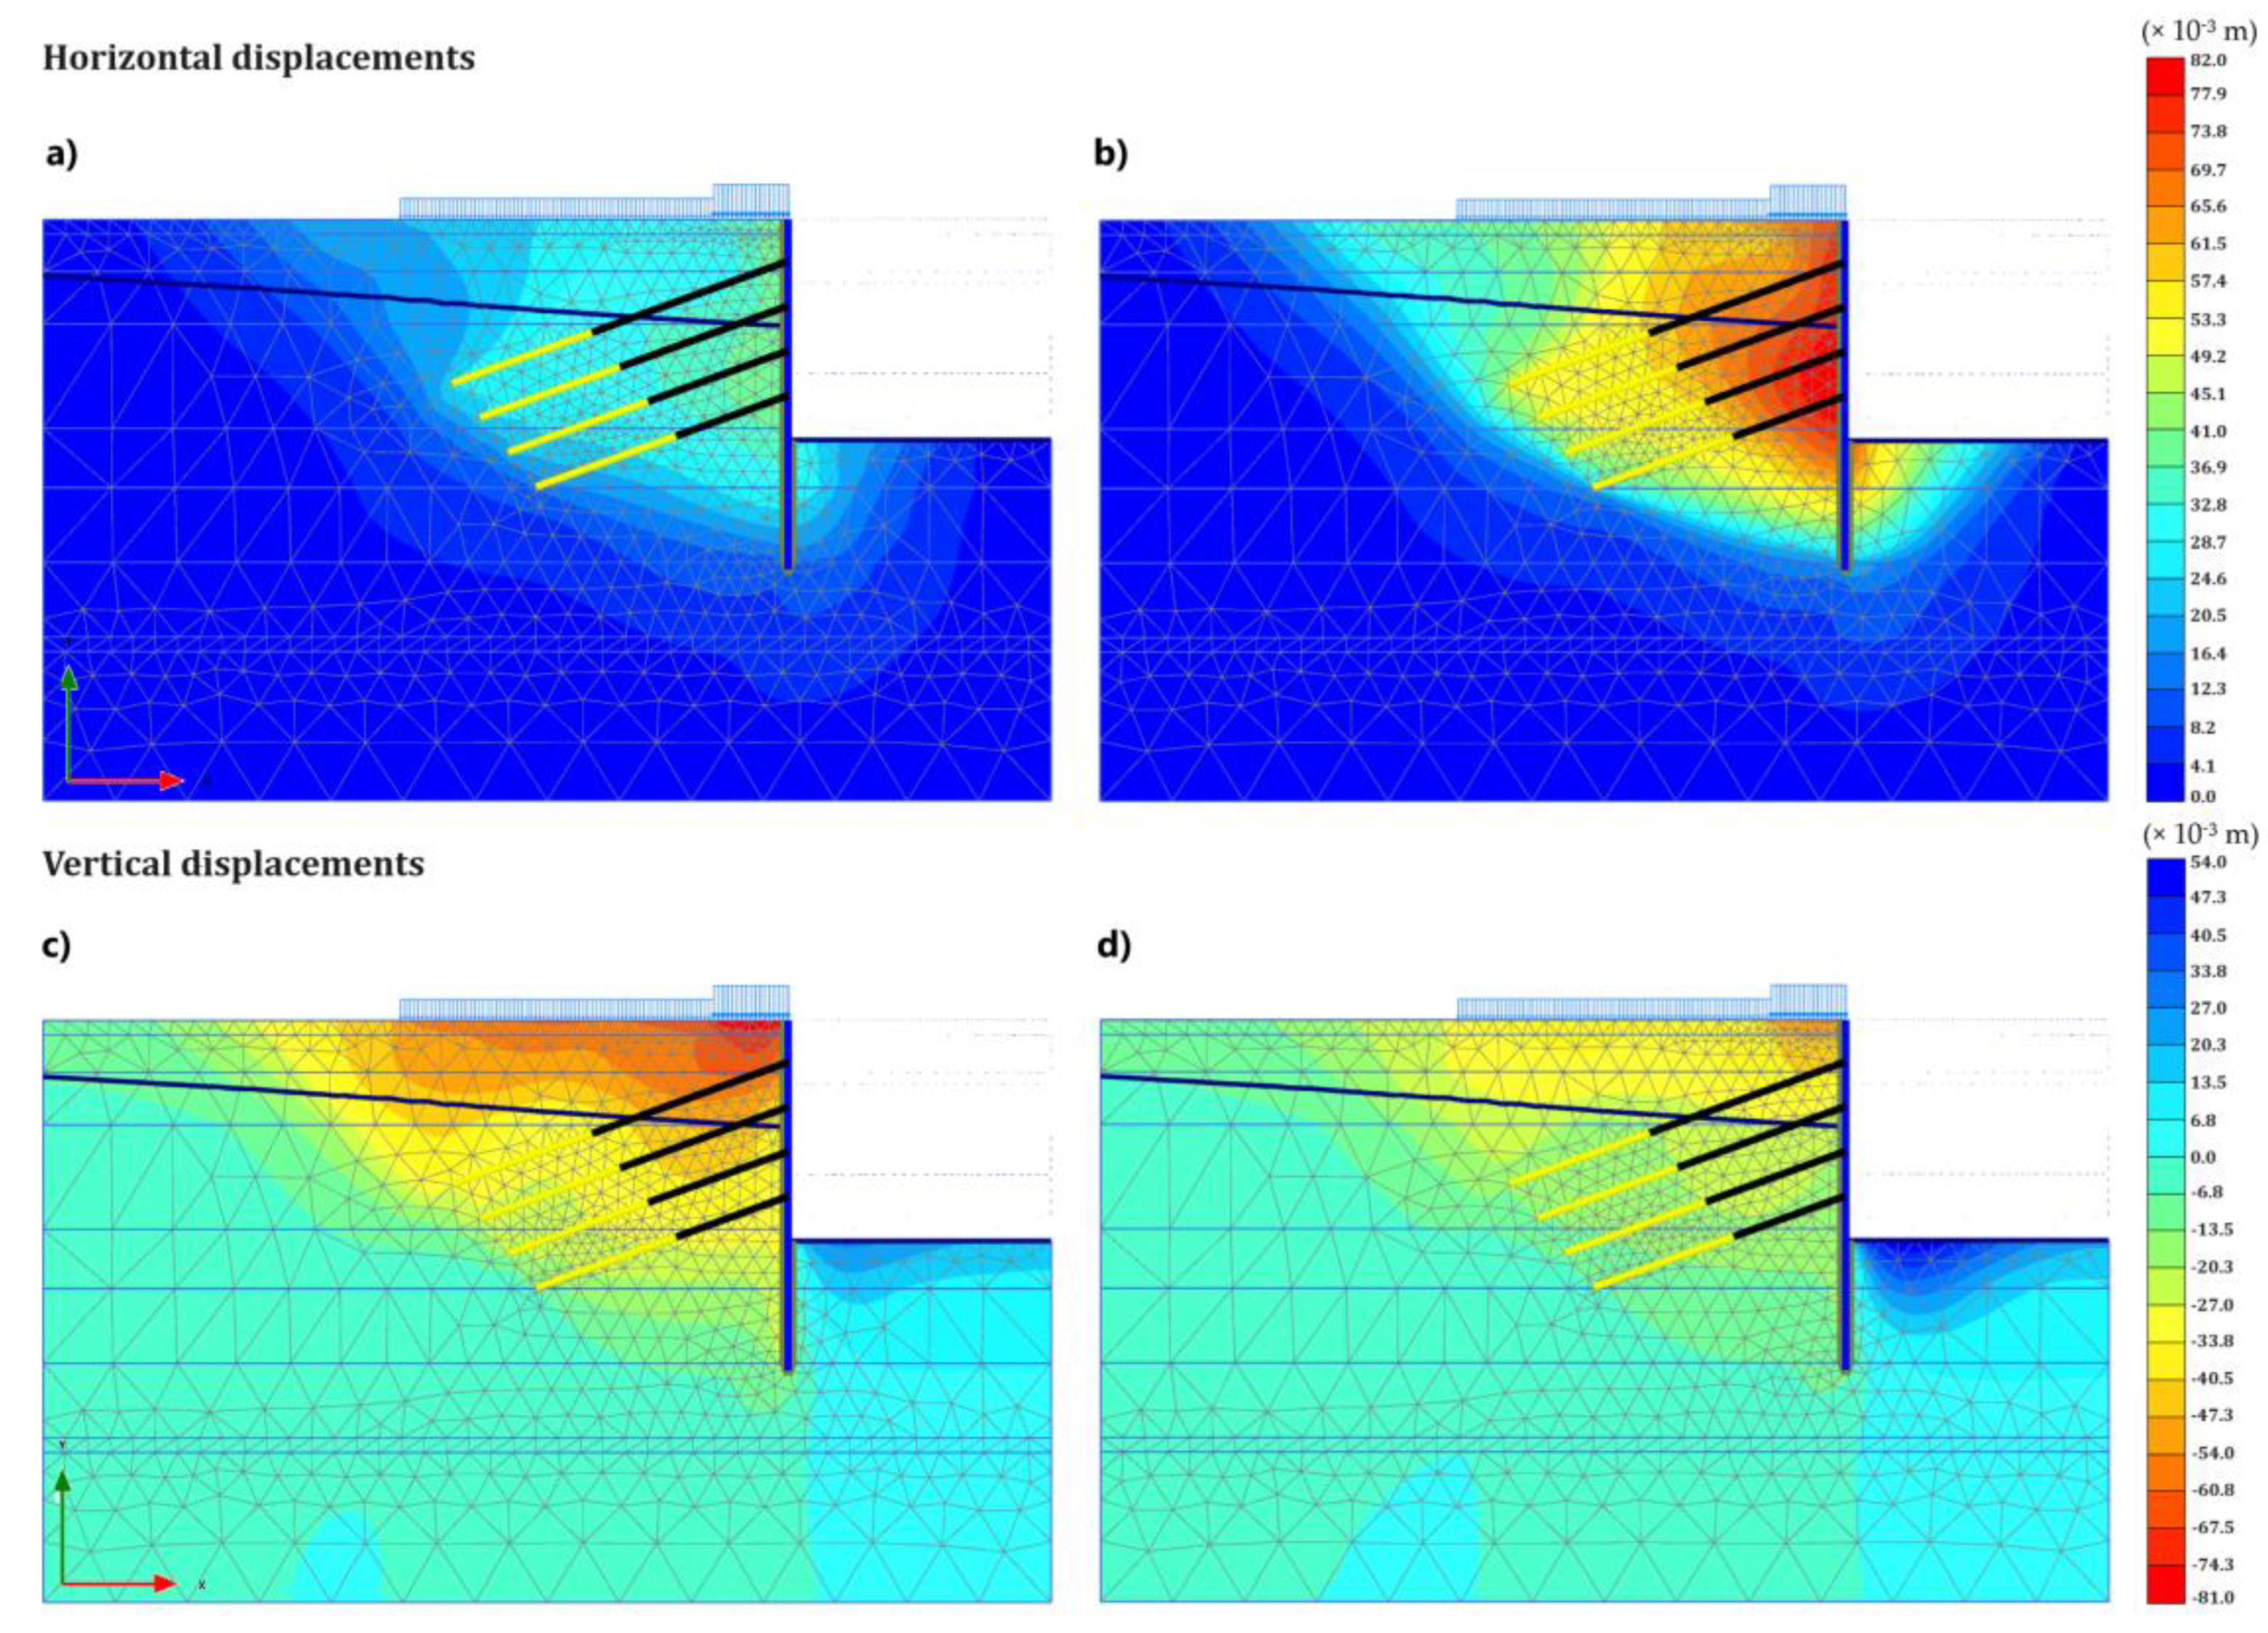
The distribution of horizontal and vertical displacements resulting from the parameter variation analysis is presented in Figure 8. The results correspond to the following cases: in case (a), minimum displacements occur (MinDispl case), while, in case (b), the displacement is the maximum (MaxDispl case). Thus, the outputs represent best-case and worst-case scenarios. It is observed that the minimum horizontal displacement reaches approximately 4.5 cm, while, in the MaxDispl model, this displacement increases to 8.2 cm. As for the vertical displacements, the difference in settlements is around twofold, while the difference in heave exceeds twofold. During excavation, in the scenario of MinDispl, the settlement caused by nearby structures behind the top of the wall becomes critical, while, in the case of MaxDispl, the heave at the excavation base plays a more crucial role. These scenarios highlight the necessity of considering the heave and the impact of nearby structures in excavation problems. Additionally, the magnitude of the values in the maximum scenario reveals an important fact: even a 3-unit increase in a parameter value (as seen in Table 3) can lead to displacements up to twofold, underlining the significance of parameter sensitivity in displacement outcomes.
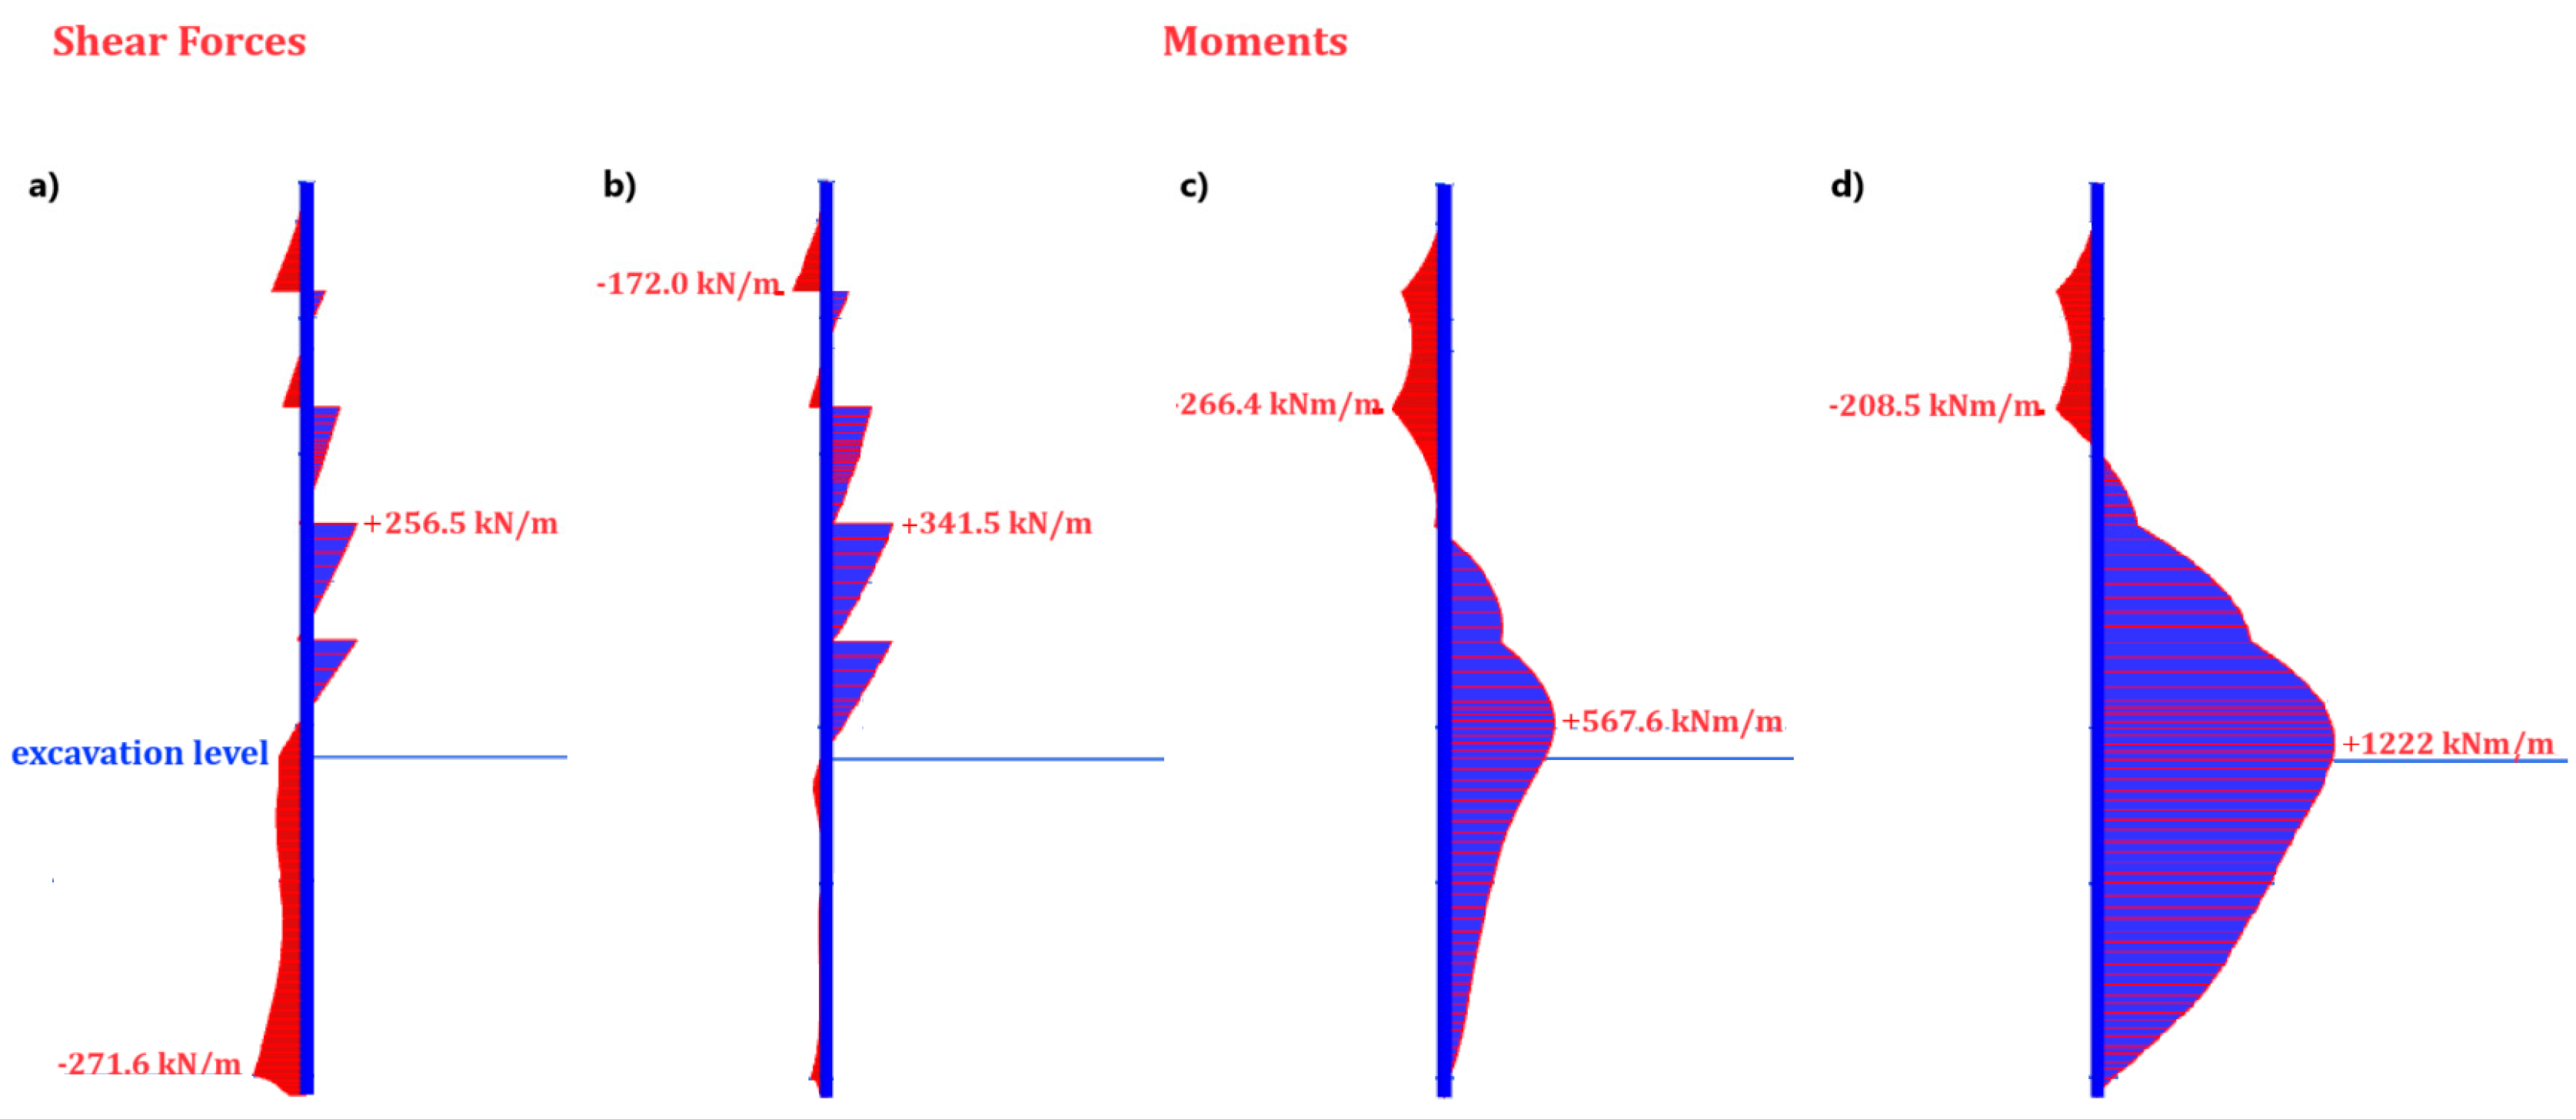
Figure 9 presents the shear force and bending moment diagram along the retaining wall. Similarly, case (a) represents the minimum displacement model, while case (b) represents the model with maximum displacements. When the shear forces in Figure 9a,b are compared, the increasing deformation caused the location of the maximum shear force to shift towards the nonembedded part while also increasing in magnitude. For the bending moments, an approximately twofold increase was observed. Despite the soil parameters not changing significantly, the internal forces at the wall varied to such an extent, highlighting the necessity and inevitability of conducting this analysis.

3.3. Comparison with the Case Study

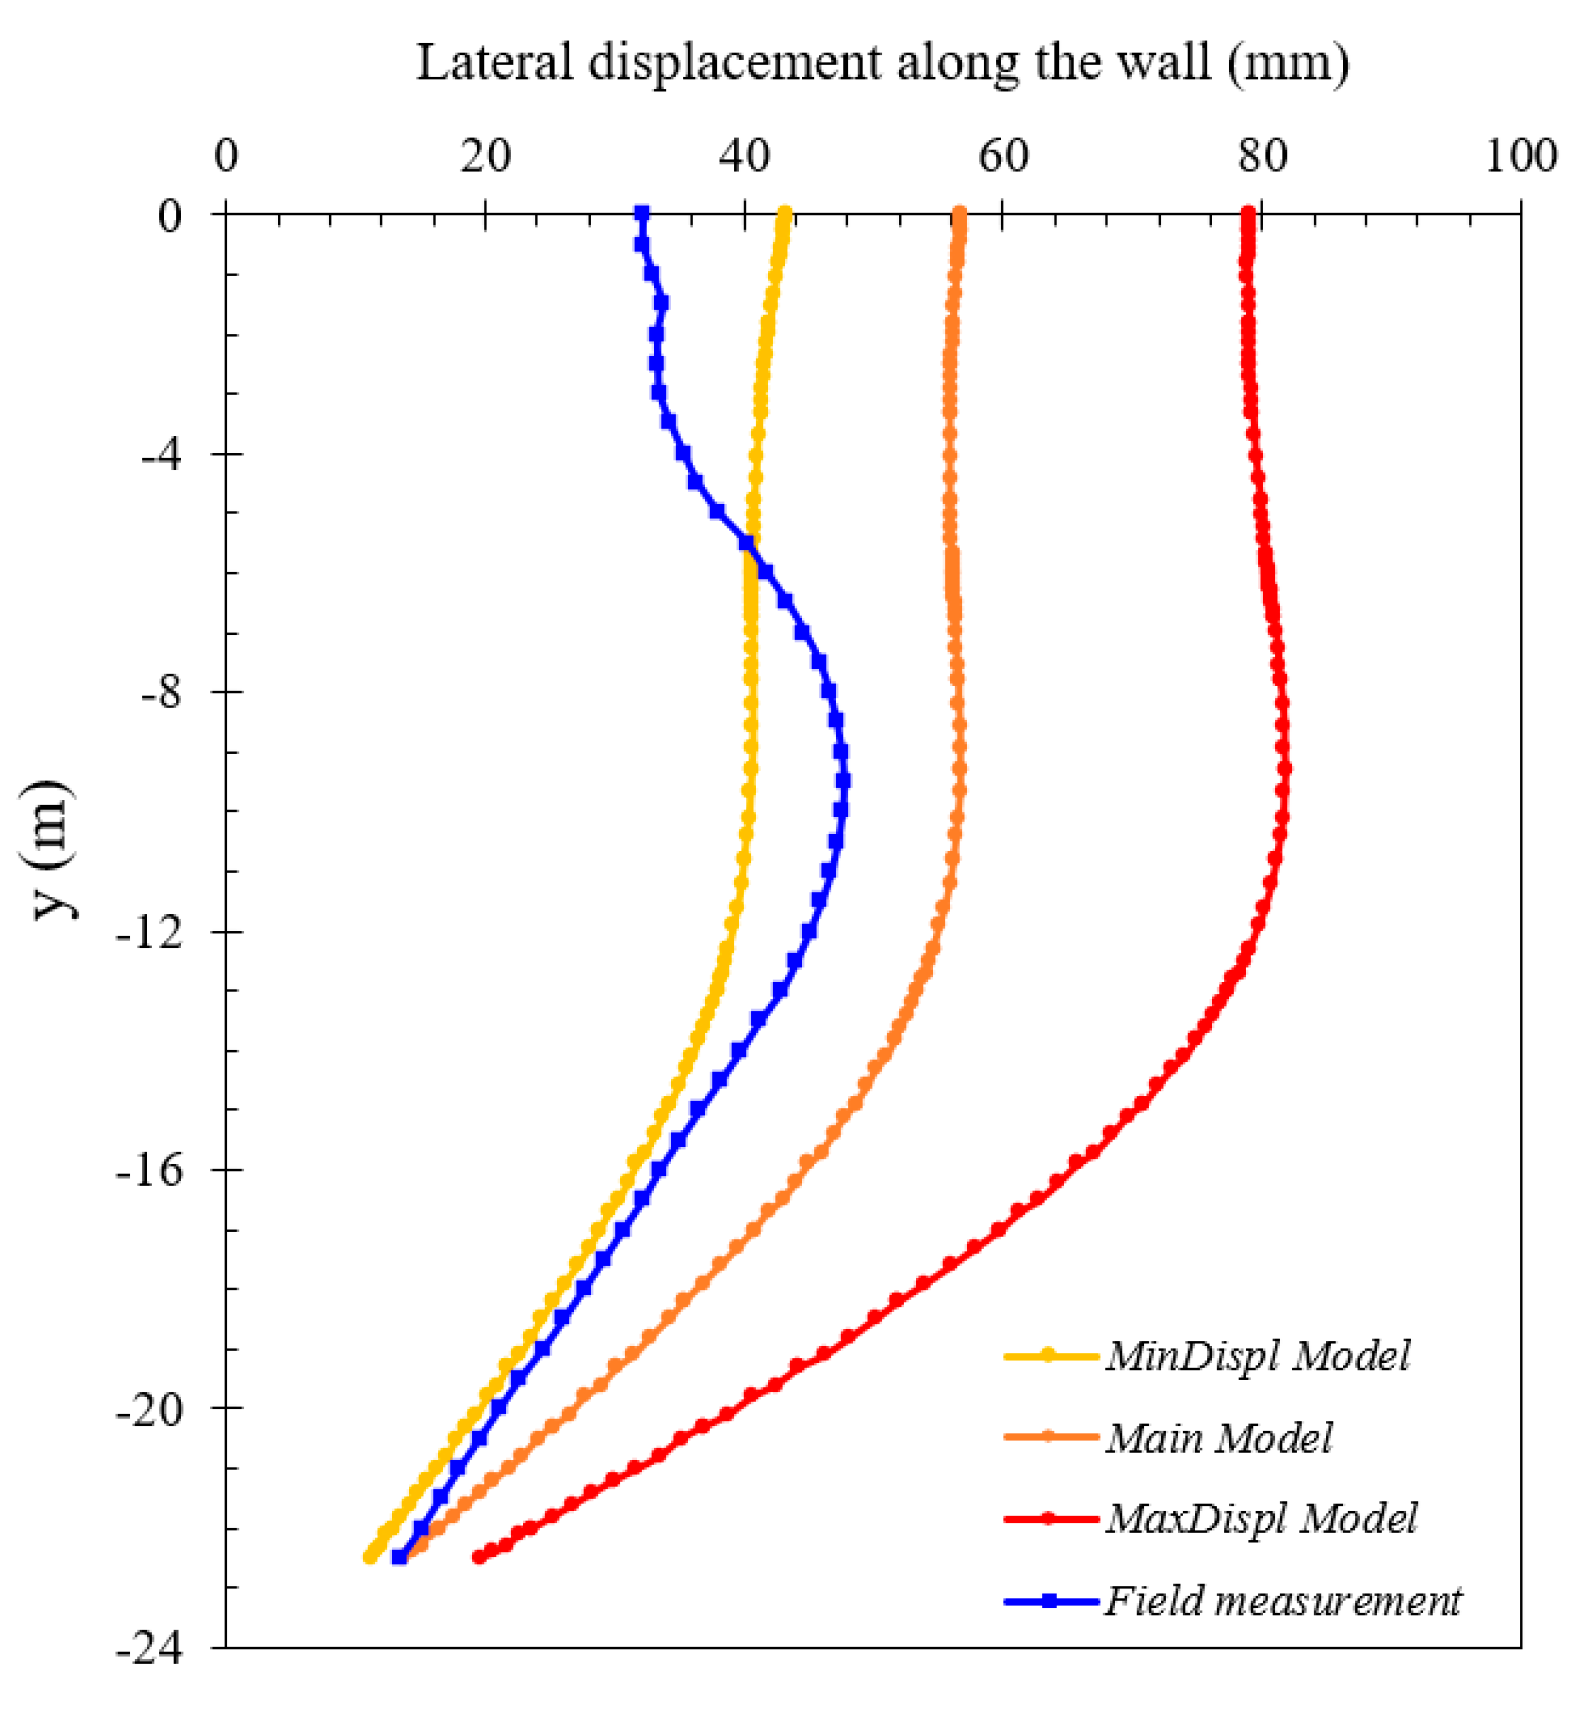
In this section, the horizontal displacements of the wall obtained from the numerical models are compared with those measured in the field using an inclinometer in the case study. The results of the MinDispl model, the main numerical model, and the MaxDispl model from the numerical analyses were used. An assessment was made to determine where the field results obtained by the inclinometer fall within these three models, and the effectiveness of the numerical methods was evaluated. Figure 10 presents the lateral displacements obtained from both numerical models and field measurements in the case study. Upon general examination, it is observed that the numerical models developed are consistent with the field measurements. This demonstrates the effectiveness of the Hardening Soil small constitutive model in simulating excavation problems. Differences in the boundary conditions, soil heterogeneity, measurement accuracy, and environmental variations may lead to expected discrepancies between the numerical results and field measurements. As can be understood, the values measured in the field using an inclinometer fell between the MinDispl and the initially developed main numerical model. The displacements from the field measurements were slightly higher than those of the MinDispl model. Notably, the displacement difference increased significantly in the middle sections of the wall (around 10 m). Although the actual field data did not approach the maximum model, when comparing the minimum, main, and maximum models with each other, the impact of varying material properties input by the user in the numerical models is clearly evident. Overall, the field measurements closely align with the numerical results, particularly within the range defined by the MinDispl and main numerical models, confirming the model’s ability to reasonably capture excavation-induced deformations.

4. Conclusions

In general, the limited number of samples obtained from soil investigations in designs leads to insufficient tests to make statistical interpretations. This situation raises concerns about the reliability of the test results. Slight variations in the test results can impact the analysis outcomes. In this study, the numerical modeling of a deep excavation problem (from a case study) was conducted. Significant insights were gained into how variations in a soil parameter can affect the results due to the sensitivity analyses and parameter variation analyses available in PLAXIS 2D (Version 24). The results were compared with field measurement data, accompanied by sensitivity and parameter variation analyses. The key findings are as follows:
  • Based on the numerical model, the lateral displacements are concentrated near the middle of the diaphragm wall, with the excavation base being critical for heave and the nearby structures most affected by the settlements. Internal force diagrams show that the shear forces and moments on the diaphragm wall may be reduced by anchors. Safety factor evaluations confirmed the deep excavation is safe.
  • The sensitivity analysis revealed that variations in the elasticity moduli and shear strength parameters, such as cohesion and internal friction angle, are critical for deep excavations. Precise determination of the internal friction angle and cohesion is essential, though the influence of elasticity moduli on the excavation outcomes may be less significant.
  • A parameter variation analysis, conducted on key features from the sensitivity analysis, identified the models with maximum (MaxDispl) and minimum (MinDispl) displacements out of 129 analyses. These models highlighted the safety margins of the design, revealing significant differences in the displacements and internal forces. A 3-unit variation in a few soil parameters was found to substantially impact the results.
  • The horizontal displacements of the wall from numerical models were compared with field measurements from the case study, showing consistency and confirming the model’s accuracy. The actual displacements fell between the MinDispl and the main model, but significant differences between the minimum, main, and maximum models highlighted the impact of varying material properties in projects.
The analysis emphasizes the need for precise soil parameter measurements and thorough examination of the potential outcomes during the data collection phase of deep excavation projects. It stresses defining the upper and lower limits for parameters through comprehensive tests and incorporating them into the design for accurate deformation assessments. These analyses help identify key parameters, enhance risk management, and ensure safer, more efficient designs by allowing engineers to assess a range of possible outcomes rather than relying on a single set of soil properties. Since the soil conditions are naturally variable and uncertain, defining the upper and lower parameter limits helps predict the best-case and worst-case scenarios, ensuring that potential risks are identified and mitigated early in the design phase.

Author Contributions

Conceptualization, E.A. (Eylem Arslan) and S.S.; methodology, U.F.Ç., Ö.Ö., H.P., S.A. and N.Ç.A.; software, U.F.Ç., Ö.Ö., H.P., S.A., N.Ç.A. and S.S.; validation, E.A. (Eylem Arslan) and S.S.; formal analysis, S.S.; investigation, U.F.Ç., Ö.Ö., H.P., S.A. and N.Ç.A.; data curation, U.F.Ç., Ö.Ö., H.P., S.A. and N.Ç.A.; writing—original draft preparation, E.A. (Eylem Arslan); writing—review and editing, E.A. (Emre Akmaz), Y.K. and S.S.; supervision, S.S.; project administration, S.S. All authors have read and agreed to the published version of the manuscript.

Funding

This research received no external funding.

Data Availability Statement

Data will be shared upon reasonable request.

Acknowledgments

We would like to express our gratitude to Azime Gül Şengül, Mehmet Ali Kayın, Ansarulhaq Khair Khah, and Yekta Mert Cihan for their contributions.

Conflicts of Interest

The authors declare no conflicts of interest.

Abbreviations

The following abbreviations are used in this manuscript:
FEMFinite element method
SensiScoresSensitivity scores
MaxDisplMaximum displacement
MinDisplMinimum displacement
UDUndrained analysis
DDrained analysis

References

  1. Tan, Y.; Fan, D.; Lu, Y. Statistical analyses on a database of deep excavations in Shanghai soft clays in China from 1995–2018. Pract. Period. Struct. Des. Constr. 2022, 27, 04021067. [Google Scholar] [CrossRef]
  2. Van, N.D.; Kim, D.; Choo, Y. Nonlinear seismic performance of buildings considering deep excavation-soil-structure interaction. Bull. Earthq. Eng. 2024, 22, 5119–5145. [Google Scholar] [CrossRef]
  3. Peng, T.; Ren, D.; Kang, C.; Liu, H.; Xue, P.; Huang, H. Deformation characteristics of soft soil induced by deep excavation and its impact on adjacent tunnels: A case study in Shanghai. KSCE J. Civ. Eng. 2024, 28, 1715–1728. [Google Scholar] [CrossRef]
  4. Cui, X.; Li, Z.; He, H.; Liu, T.; Wang, J. Observed characterization of multi-level retaining structure for deep excavation of subway station. Urban Rail Transit 2024, 10, 89–106. [Google Scholar] [CrossRef]
  5. Liu, G.B.; Jiang, R.J.; Ng, C.W.; Hong, Y. Deformation characteristics of a 38 m deep excavation in soft clay. Can. Geotech. J. 2011, 48, 1817–1828. [Google Scholar] [CrossRef]
  6. Chen, R.P.; Lee, Z.C.; Chen, Y.M.; Ou, C.Y. Failure investigation at a collapsed deep excavation in very sensitive organic soft clay. J. Perform. Constr. Facil. 2015, 29, 04014078. [Google Scholar] [CrossRef]
  7. Bhatkar, T.; Barman, D.; Mandal, A.; Usmani, A. Prediction of behaviour of a deep excavation in soft soil: A case study. Int. J. Geotech. Eng. 2017, 11, 10–19. [Google Scholar] [CrossRef]
  8. Hu, J.; Ma, F. Failure investigation at a collapsed deep open cut slope excavation in soft clay. Geotech. Geol. Eng. 2018, 36, 665–683. [Google Scholar] [CrossRef]
  9. Ou, X.; Zhang, X.; Fu, J.; Zhang, C.; Zhou, X.; Feng, H. Cause investigation of large deformation of a deep excavation support system subjected to unsymmetrical surface loading. Eng. Fail. Anal. 2020, 107, 104202. [Google Scholar] [CrossRef]
  10. Zhou, F.; Zhou, P.; Li, J.; Lin, J.; Ge, T.; Deng, S.; Wang, Z. Deformation characteristics and failure evolution process of the existing metro station under unilateral deep excavation. Eng. Fail. Anal. 2022, 131, 105870. [Google Scholar] [CrossRef]
  11. Zhang, W.G.; Hu, X.Y.; Zhang, R.H.; Chen, C.X.; Li, Y.Q.; Ye, W.Y.; Chen, R.L. Numerical analysis of one-strut failure in deep braced excavation considering anisotropic clay behavior. J. Cent. South Univ. 2023, 30, 4168–4181. [Google Scholar] [CrossRef]
  12. Hsieh, P.G.; Ou, C.Y.; Liu, H.T. Basal heave analysis of excavations with consideration of anisotropic undrained strength of clay. Can. Geotech. J. 2008, 45, 788–799. [Google Scholar] [CrossRef]
  13. Do, T.N.; Ou, C.Y.; Chen, R.P. A study of failure mechanisms of deep excavations in soft clay using the finite element method. Comput. Geotech. 2016, 73, 153–163. [Google Scholar] [CrossRef]
  14. Goh, T.C.; Zhang, F.; Zhang, W.; Zhang, Y.; Liu, H. A simple estimation model for 3D braced excavation wall deflection. Comput. Geotech. 2017, 83, 106–113. [Google Scholar] [CrossRef]
  15. Wu, L.; Sun, J.; Tong, Y. Parametric sensitivity study of deep excavation in Singapore old alluvium formation. Adv. Civ. Eng. 2021, 2021, 8644288. [Google Scholar] [CrossRef]
  16. Dinakar, K.N.; Prasad, S.K. Behaviour of tie back sheet pile wall for deep excavation using PLAXIS. Int. J. Res. Eng. Technol. 2014, 3, 97–103. [Google Scholar] [CrossRef]
  17. Cui, K.; Défossez, P.; Richard, G. A new approach for modelling vertical stress distribution at the soil/tyre interface to predict the compaction of cultivated soils by using the PLAXIS code. Soil Tillage Res. 2007, 95, 277–287. [Google Scholar] [CrossRef]
  18. Babu, G.S.; Singh, V.P. Simulation of soil nail structures using PLAXIS 2D. Plaxis Bull. 2009, 25, 16–21. [Google Scholar]
  19. Hsiung, B.C.B.; Dao, S.D. Evaluation of constitutive soil models for predicting movements caused by a deep excavation in sands. Electron. J. Geotech. Eng. 2014, 19, 17325–17344. [Google Scholar]
  20. Bowers, J.T.; Webb, M.C.; Beaver, J.L. Soil parameters for design with the 3D PLAXIS hardening soil model. Transp. Res. Rec. 2019, 2673, 708–713. [Google Scholar] [CrossRef]
  21. Saleh, S.; Mohd Yunus, N.Z.; Ahmad, K.; Mat Said, K.N. Numerical simulation with hardening soil model parameters of marine clay obtained from conventional tests. SN Appl. Sci. 2021, 3, 156. [Google Scholar] [CrossRef]
  22. Arslan, E.; Kayaturk, D.; Durmus, M.R.; Bagca, I.; Imamoglu, T.; Sert, S. The role of utilizing load in different cases while numerical modeling of multi-story buildings on alluvial stratum: A comparison study. Arab. J. Sci. Eng. 2024, 49, 13845–13860. [Google Scholar] [CrossRef]
  23. Rao, S.S. The Finite Element Method in Engineering; Butterworth-Heinemann: London, UK, 2017. [Google Scholar]
  24. Wang, L.; Juang, C.H.; Atamturktur, S.; Gong, W.; Khoshnevisan, S.; Hsieh, H.S. Optimization of design of supported excavations in multi-layer strata. J. GeoEng. 2014, 9, 1–12. [Google Scholar] [CrossRef]
  25. Al-Ne’aimi, R.M.S.; Nasir, H.K. Numerical study of design parameters influencing anchored diaphragm walls for deep excavation. Innov. Infrastruct. Solut. 2023, 8, 301. [Google Scholar] [CrossRef]
  26. Santos, M.D.; Danziger, B.R.; Sieira, A.C. A case of numerical analysis of settlements due to excavation on nearby structures. In Proceedings of the 12th International Conference on International Association for Computer Methods and Advances in Geomechanics (IACMAG), Goa, India, 1–6 October 2008; pp. 3849–3857. [Google Scholar]
  27. Ou, C.Y. Finite element analysis of deep excavation problems. J. GeoEng. 2016, 11, 1–12. [Google Scholar] [CrossRef]
  28. Gaur, A.; Sahay, A. Comparison of different soil models for excavation using retaining walls. SSRG Int. J. Civ. Eng. 2017, 4, 43–48. [Google Scholar] [CrossRef]
  29. Pal, D.; Khan, A.K. Analysis of multivariate regression and deep excavation in expansive soil using PLAXIS 2D. In Geotechnical Characterization and Modelling; Gali, L., Latha, M.P., Ravi, R., Eds.; Lecture Notes in Civil Engineering; Springer: Singapore, 2020; Volume 85, p. 69. [Google Scholar] [CrossRef]
  30. Pak, A.; Maleki, J.; Aghakhani, N.; Yousefi, M. Numerical investigation of stability of deep excavations supported by soil-nailing method. Geomech. Geoeng. 2021, 16, 434–451. [Google Scholar] [CrossRef]
  31. Sang-To, T.; Hoang-Le, M.; Khatir, S.; Mirjalili, S.; Wahab, M.A.; Cuong-Le, T. Forecasting of excavation problems for high-rise buildings in Vietnam using planet optimization algorithm. Sci. Rep. 2021, 11, 23809. [Google Scholar] [CrossRef] [PubMed]
  32. Kog, Y.C.; Loh, K.K. Soil parameters of Kallang formation and old alluvium in Singapore for excavation study with Plaxis. Pract. Period. Struct. Des. Constr. 2022, 27, 04022006. [Google Scholar] [CrossRef]
  33. Büyükgökçe, F. Parametrical Analysis of Shoring Systems Exposed to Lateral Load in Deep Excavations. Master’s Thesis, Sakarya University, Sakarya, Türkiye, 2018. (In Turkish). [Google Scholar]
  34. Yalçın, G.; Uncuoğlu, E. The investigation of the single row anchored wall behaviour by numerical analysis studies. In Proceedings of the 8th International Geotechnical Symposium, İstanbul, Türkiye, 13–15 November 2019. [Google Scholar]
  35. Whitman, R.V. Organizing and evaluating uncertainty in geotechnical engineering. J. Geotech. Geoenviron. Eng. 2000, 126, 583–593. [Google Scholar] [CrossRef]
  36. Bentley Systems, Inc. Plaxis 2D, Version 2024; Bentley Systems, Inc.: Exton, PA, USA, 2024. [Google Scholar]
  37. Zhou, B.; Marshall, A.M.; Yu, H. The effect of relative density on settlement above tunnels in sand. In Proceedings of the International Symposium on Geomechanics from Micro to Macro, Nottingham, UK, 20–22 May 2014; pp. 127–139. [Google Scholar]
  38. Sert, S.; Önalp, A. Sensitivity and parameter variation analysis in excavation problems. In Proceedings of the 4th Geotechnical Symposium, Adana, Türkiye, 1–2 December 2011. (In Turkish). [Google Scholar]
  39. Aslan, V.; Yağcı, B. A parametric study for lateral displacement of cantilever diaphragm walls. AKU J. Sci. Eng. 2018, 18, 015601. (In Turkish) [Google Scholar] [CrossRef]
  40. Aslan, V.; Yağcı, B. Geotechnical modeling differences in the analysis of deep excavation support systems. J. BAUN Inst. Sci. Technol. 2018, 20, 514–526. (In Turkish) [Google Scholar] [CrossRef]
  41. Borgh, R. Sensitivity Analysis of Numerical Models for Diaphragm Walls with Cross-Walls in Soft Soils. Master’s Thesis, Chalmers University of Technology, Gothenburg, Sweden, 2018. [Google Scholar]
  42. Ganesh, K.M.; Ray, A.; Dagdi, D.; Rai, R.; Jaiswal, A. Sensitivity analysis of excavation support systems using numerical modelling. J. Inst. Eng. India Ser. D 2023, 105, 1127–1136. [Google Scholar] [CrossRef]
  43. Obrzud, R.F. On the use of the hardening soil small strain model in geotechnical practice. Numerics Geotech. Struct. 2010, 16, 1–17. [Google Scholar]
  44. Dey, A. Calibration of a PLAXIS finite element dynamic model: Effect of domain width and meshing schemes/AES. In Proceedings of the Third Indian Young Geotechnical Engineers Conference, Kochi, India, 15–17 December 2011; p. 127132. [Google Scholar]
  45. Sert, S.; Önalp, A.; Arel, E. The influence of soil parameter variations on numerical solutions. In Proceedings of the 13th National Congress on Soil Mechanics and Foundation Engineering, İstanbul, Türkiye, 1–2 October 2010. (In Turkish). [Google Scholar]
  46. Duncan, J.M. Factors of safety and reliability in geotechnical engineering. J. Geotech. Geoenviron. Eng. 2000, 126, 307–316. [Google Scholar] [CrossRef]
  47. The Design and Application Principles of Excavation Support Structures. Published in Türkiye’s Official Gazette on 18 December 2022. Available online: https://www.resmigazete.gov.tr/eskiler/2022/12/20221218-2.htm (accessed on 18 December 2022).
  48. Ranjan, H.S.; Rao, S. Analysis of the effect of anchor rod on the behavior of diaphragm wall using PLAXIS 3D. Aquat. Procedia 2015, 4, 240–247. [Google Scholar] [CrossRef]
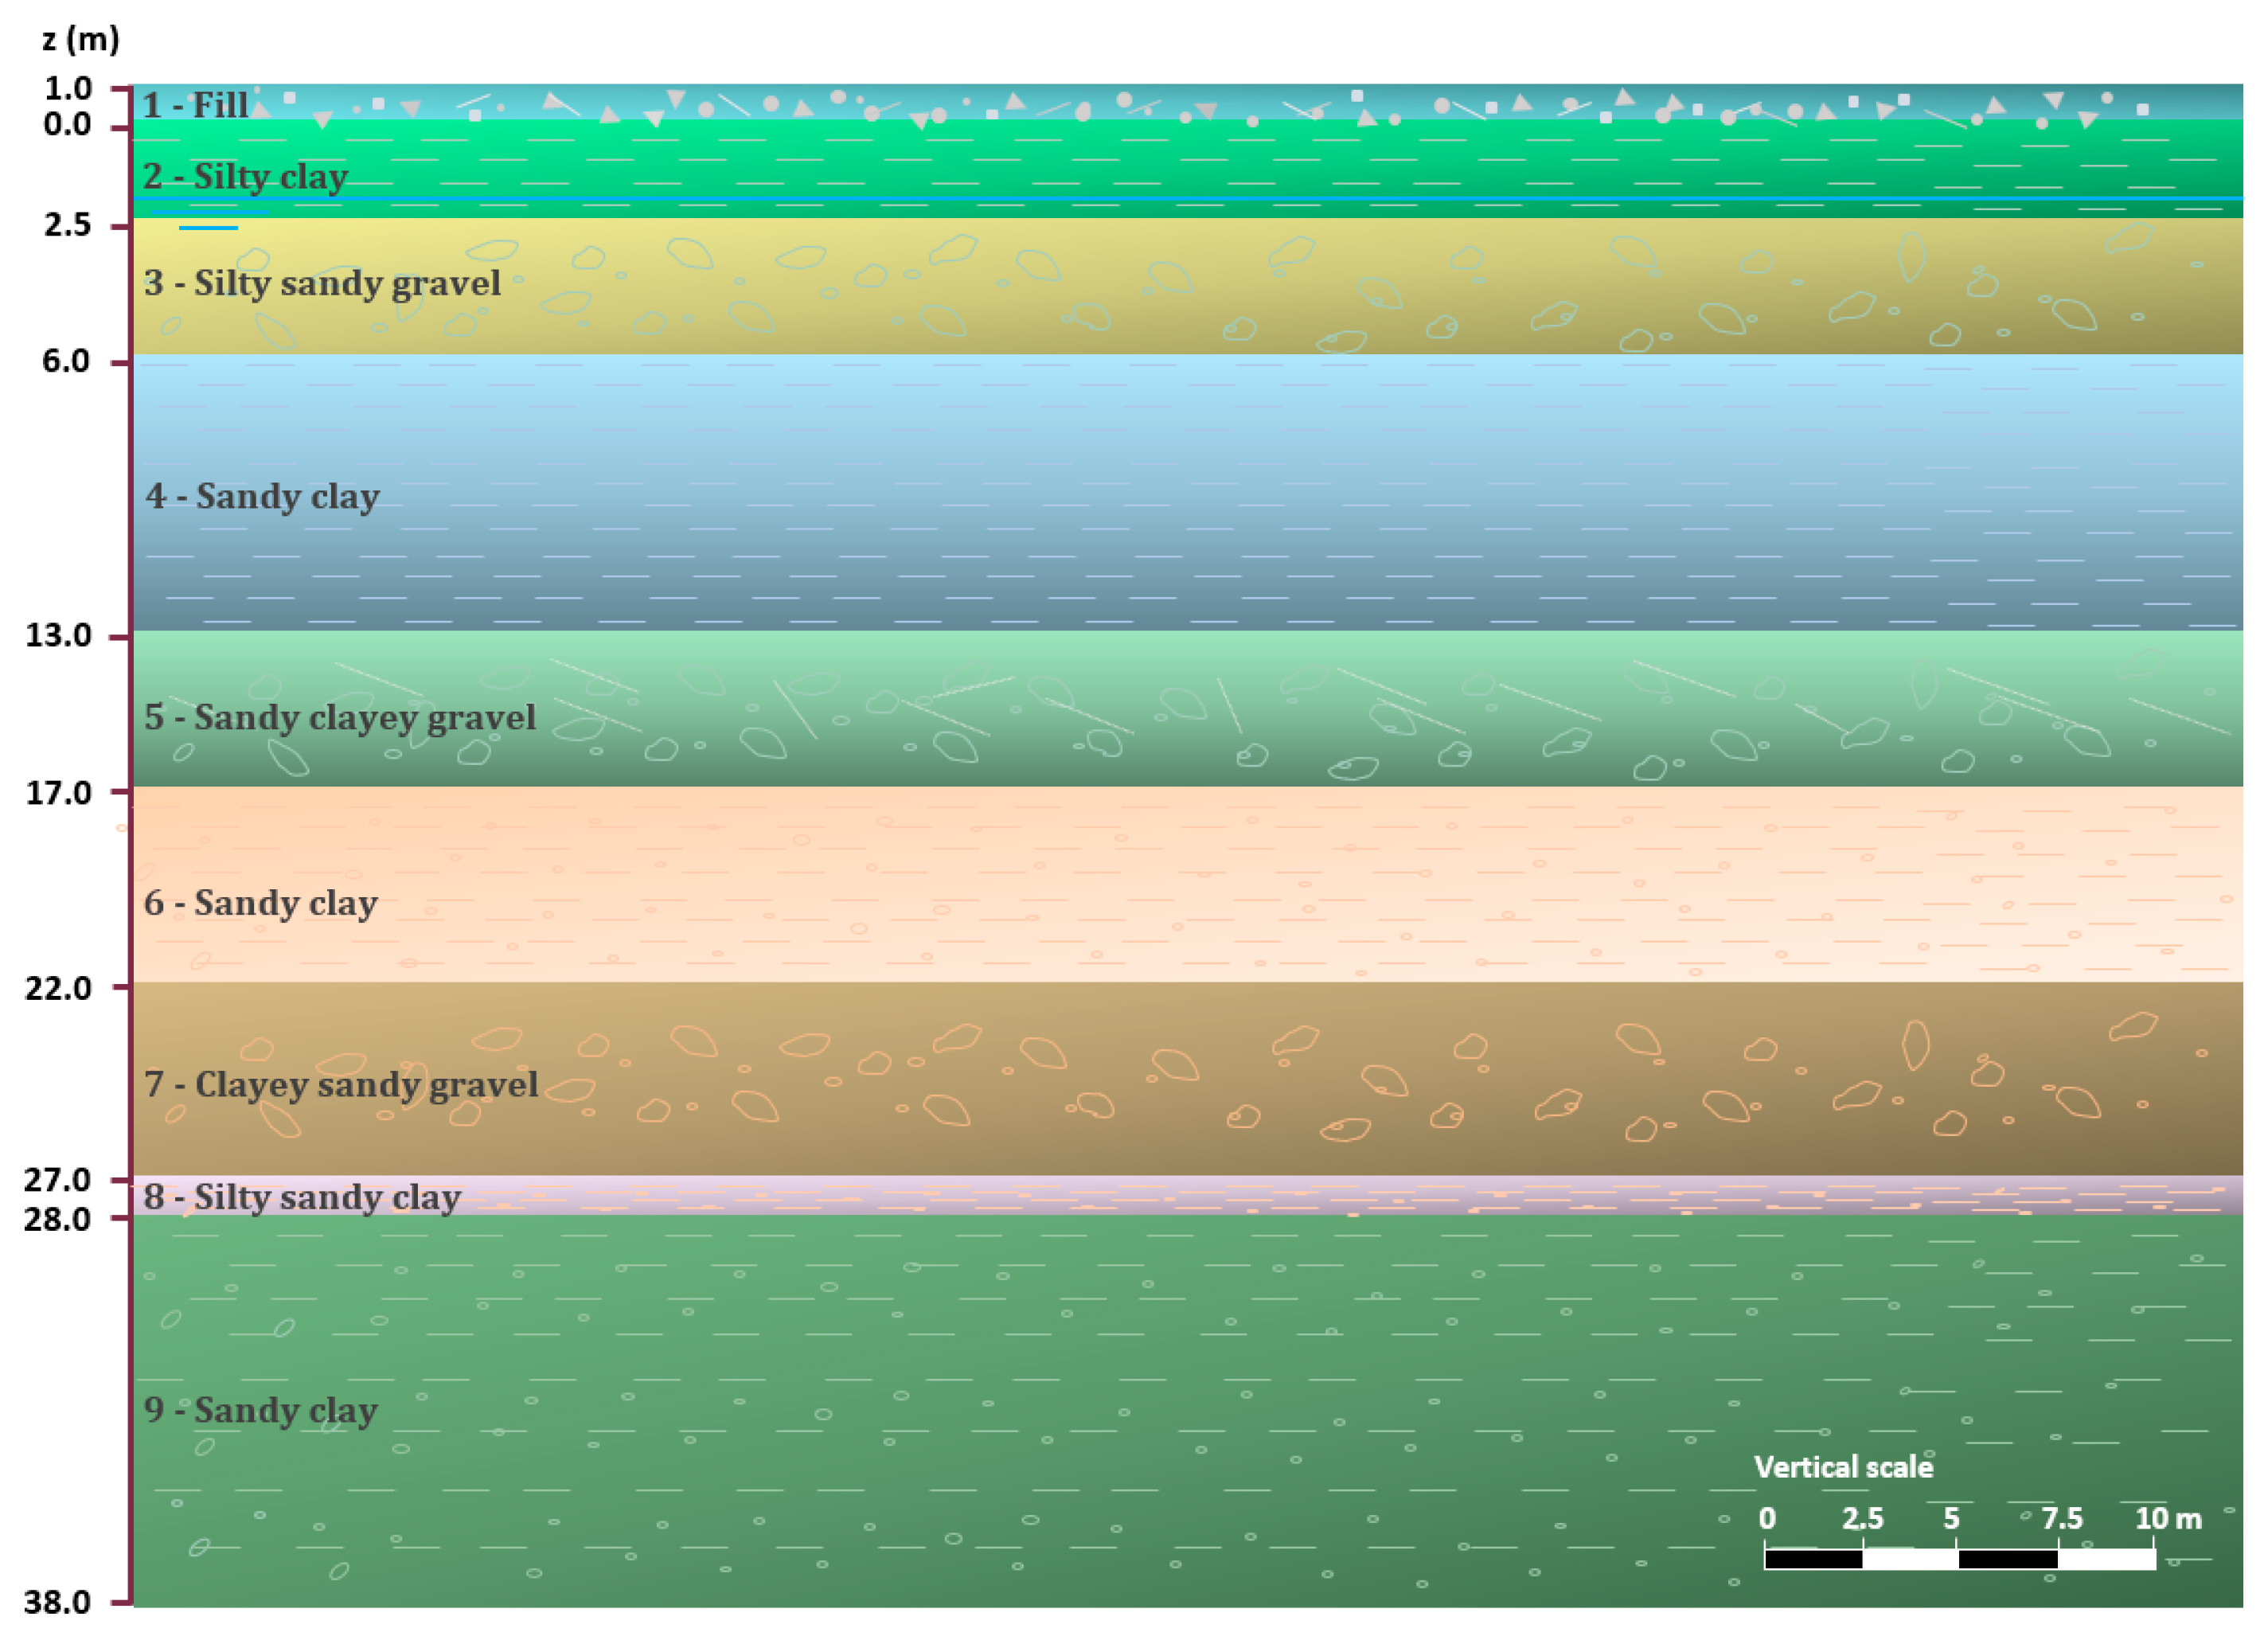
Figure 1. Soil profile obtained from the site of the case study.
Buildings 15 00658 g001
Figure 2. The mesh geometry of the numerical model.
Buildings 15 00658 g002
Figure 3. The excavation phases in the numerical model.
Buildings 15 00658 g003
Figure 4. The deformed mesh at the phases: (a) 1; (b) 2; (c) 3; (d) 4; (e) 5; (f) 6.
Buildings 15 00658 g004
Figure 5. The horizontal displacements at the phases: (a) 1; (b) 2; (c) 3; (d) 4; (e) 5; (f) 6.
Buildings 15 00658 g005
Figure 6. The vertical displacements at the phases: (a) 1; (b) 2; (c) 3; (d) 4; (e) 5; (f) 6.
Buildings 15 00658 g006
Figure 7. The shear force and moment diagrams of the diaphragm wall.
Buildings 15 00658 g007
Figure 8. The displacements at the end of the excavation: (a) Horizontal MinDispl; (b) Horizontal MaxDispl; (c) Vertical MinDispl; (d) Vertical MaxDispl.
Buildings 15 00658 g008
Figure 9. The shear force and moment diagrams at the end of the excavation: (a) MinDispl shear; (b) MaxDispl shear; (c) MinDispl moment; (d) MaxDispl moment.
Buildings 15 00658 g009
Figure 10. The lateral displacements measured along the wall in the numerical and field measurements.
Buildings 15 00658 g010
Table 1. The features of the soils in the model.
Symbol 1The Number of Soil LayerUnit
12 3456789
-Hardening Soil Small-Strain-
-DUDDUDDUDDUDUD-
γunsat/γsat18/1918/1919/2019/2020/2119/2021/2219/2020/21kN/m3
E50ref12,000800015,00010,00025,00022,00050,00030,00040,000kN/m2
Eoedref12,000800015,00010,00025,00022,00050,00030,00040,000kN/m2
Eurref36,00024,00045,00030,00075,00066,000150,00090,000120,000kN/m2
C′ref121201015151010kN/m2
φ′322630283428342828°
ψ300040400°
G0ref38,60038,00039,60064,000101,200113,000112,000123,000152,000kN/m2
K0nc0.470.560.500.530.440.530.440.530.53-
Rinter0.80.80.80.80.80.80.80.80.8-
1 D and UD denote drained and undrained conditions; γunsat and γsat are the unsaturated and saturated unit weights; E50ref, Eoedref, and Eurref are secant stiffness, tangent stiffness, and unloading/reloading stiffness; c′ref, φ′, and ψ are cohesion, friction angle, and dilatancy angle; and G0ref, K0nc, and Rinter are shear modulus, horizontal earth coefficient, and interface strength, respectively.
Table 2. The features of the structural elements.
ParameterSymbolWallAnchor-Free LengthAnchor-Fixed LengthUnit
Model-PlateAnchorGeogrid-
Material type-ElasticElastoplasticElastic-
Axial stiffnessEA124,000,000163,800600,000kN/m
Bending stiffnessEI1,280,000--kNm2/m
Poisson’s ratiov0.15---
Dimensionsd0.8--m
SpacingLspacing-22m
Table 3. Minimum, reference, and maximum values of the features in the sensitivity analysis.
SoilE50ref & Eoedref (kN/m2)Eurref (kN/m2)φ′ (°)C′ref (kN/m2)
MinRefMaxMinRefMaxMinRefMaxMinRefMax
110,80012,00013,20032,40036,00039,600293235---
272008000880021,60024,00026,400232629---
313,50015,00016,50040,50045,00049,500273033---
4900010,00011,00027,00030,00033,000252831---
522,50025,00027,50067,50075,00082,50031343771013
619,80022,00024,20059,40066,00072,600252831121518
745,00050,00055,000135,000150,000165,000313437121518
827,00030,00033,00081,00090,00099,00025283171013
936,00040,00044,000108,000120,000132,00025283171013
Table 4. Sensitivity scores of the soil features.
SoilsThickness (m)Sensitivity Score
E50refEoedref EurrefC′ φ′
1-Fill 1011-1
2-Silty clay2.5101-4
3-Silty sandy gravel3.5211-12
4-Sandy clay7012-8
5-Sandy clayey gravel410098
6-Sandy clay5112718
7-Clayey sandy gravel511039
8-Silty sandy clay100000
9-Sandy clay1000030
Disclaimer/Publisher’s Note: The statements, opinions and data contained in all publications are solely those of the individual author(s) and contributor(s) and not of MDPI and/or the editor(s). MDPI and/or the editor(s) disclaim responsibility for any injury to people or property resulting from any ideas, methods, instructions or products referred to in the content.