Article

Effect of Photovoltaic Energy-Saving Window Factors on Building Heating Load Under Three Control Modes

Ministry of Industry and Information Technology Key Laboratory of Cold Region Urban and Rural Human Settlement Environment Science and Technology, School of Architecture and Design, Harbin Institute of Technology, Harbin 150001, China
*
Author to whom correspondence should be addressed.
Buildings 2025, 15(2), 238; https://doi.org/10.3390/buildings15020238
Submission received: 16 December 2024 / Revised: 10 January 2025 / Accepted: 13 January 2025 / Published: 15 January 2025
(This article belongs to the Section Building Energy, Physics, Environment, and Systems)

Abstract

Photovoltaic (PV) glazing is widely used in the building sector for its power generation advantages. However, its low transmittance reduces solar heat gain, limiting energy-saving effectiveness in heating regions. To address this, the present study proposes a novel PV energy-saving window that reduces heating load by separately controlling its components—PV glazing, insulated shutter, and clear glazing—through three control modes: Mode 1 controls insulated shutter, Mode 2 controls insulated shutter and PV glazing, and Mode 3 controls insulated shutter and clear glazing. First, the energy-saving benefits of the window were confirmed through in situ testing. Next, using a validated model, the correlation between key factors and heating load was analyzed under the above three modes. Finally, the impact of configurations on heating load under the three control modes was clarified. The main findings are as follows: (1) When PV glazing is controlled, clear glazing layers become the primary factor influencing the heating load. (2) In Modes 1 and 3, the configurations have a greater impact on heating load, reducing it by 34.62% and 39.60%, respectively, while Mode 2 shows a reduction of 17.93%. (3) Mode 2 is the optimal control mode, confirming the effectiveness of controlling PV glazing to reduce heating load.

1. Introduction

Photovoltaic (PV) glazing, with its unique ability to generate energy, has been increasingly integrated into architectural applications to address the high energy consumption in the construction industry [1]. This innovative material has found applications in numerous iconic architectural projects worldwide. Notable examples include the New-Blauhaus in Germany, the CFMEU Training and Wellness Centre in Australia, and the Pavillon Novartis in Switzerland. At the CFMEU Training and Wellness Centre, 16 m2 of PV glazing are integrated into the façade, achieving an annual reduction of 94.8 kg of CO2 emissions under standard operational conditions [2].
Photovoltaic double-skin façades (PV-DSFs) have gained prominence as a key approach to applying PV glazing in buildings, owing to their advanced performance characteristics. Compared to vacuum PV glazing, a PV-DSF employs ventilation strategies to mitigate overheating challenges while offering enhanced thermal insulation compared to single-pane PV glazing. This adaptability renders PV-DSFs applicable to a broader range of climatic conditions. Wang et al. [3] demonstrated that PV-DSFs outperformed PV insulating glass units by minimizing solar heat gain and enhancing PV efficiency. Other studies have shown that in subtropical humid climates, PV-DSFs achieve a 30.4% reduction in heat gain and a 50.3% reduction in heat loss compared to single-glazed semi-transparent photovoltaic systems [4]. In regions with a cool Mediterranean climate, such as parts of the United States, PV-DSFs realized an approximately 50% reduction in net electricity consumption compared to traditional glazing [5]. A similar investigation in Shenzhen, China, indicated that PV-DSFs could reduce annual energy usage by 16.26% compared to single-pane clear glazing [6]. These studies underscore the critical contribution of PV-DSFs to energy-efficient and sustainable architectural innovations.
As the application and research of PV glazing have advanced, certain areas for improvement have become increasingly evident. Some scholars have noted that its low transmittance results in reduced indoor solar heat gains, increasing heating loads and rendering PV glazing less suitable for regions with high heating demands. Guo et al. [6] found that in Harbin, China, a naturally ventilated double photovoltaic (NVDPV) system with 5% transmittance resulted in an annual electricity consumption increase exceeding 10%. Similarly, Wang et al. [7] demonstrated that with a PV coverage ratio of 90%, air-conditioning energy consumption increased by approximately 15.90% compared to a 10% coverage ratio. Furthermore, Roberts et al. [8] observed that PV-DSFs with low transmittance and efficiency fail to generate sufficient electricity to offset the increased energy demands for artificial lighting and winter heating. Xu et al. [9] reached similar conclusions after comparing the performance of PV-DSFs with PV glazing transmittance of 20% and 40%.
To address these findings, some scholars have proposed variations of the PV-DSF to mitigate the losses caused by insufficient solar heat gain from PV glazing. Three primary strategies have been commonly recognized. The first strategy involves reducing the proportion of PV glazing in the window design [10,11], utilizing the high transmittance of clear glazing to enhance the entry of solar radiation. The second strategy focuses on reversible window designs [12,13], enabling PV glazing to be rotated from the exterior to the interior during winter, thereby utilizing residual heat to increase indoor temperatures. The third approach incorporates PV glazing louvers within the DSF system [14], allowing for adjustable transmittance by modifying the louver angles. While these designs showcase innovative solutions to the transmittance challenges of PV glazing, further optimization is needed to tackle issues.
The control modes of PV-DSFs primarily include external circulation, internal circulation, and thermal buffer mode. Yang et al. [15] compared the heating load performance of external circulation and thermal buffer modes, concluding that the thermal buffer mode is more suitable for winter. Studies have shown that the thermal buffer mode offers better insulation performance than external circulation, whereas external circulation improves PV module efficiency by lowering the operating temperature of PV-DSFs [16]. Similarly, lower outdoor temperatures in winter mitigate overheating in PV modules, resulting in higher energy conversion efficiency compared to summer conditions [17]. Liu et al. [18] further evaluated the energy-saving performance of internal circulation and thermal buffer modes during winter, highlighting that PV-DSF can only switch to internal circulation when the air within the cavity is sufficiently heated. Studies indicate that internal circulation and thermal buffer modes are the optimal control modes for winter. The internal circulation mode operates by opening the upper and lower vents on the indoor-facing glazing when the cavity temperature exceeds the indoor temperature, facilitating convective heat exchange and increasing indoor temperature. Conversely, when the cavity temperature is lower than the indoor temperature, the thermal buffer mode is activated by sealing the cavity through vent closure to enhance thermal insulation. Considering the heat exchange characteristics of the internal circulation mode, scholars have explored optimizing control modes for PV-DSF to reduce heating loads. Although the internal circulation mode outperforms the thermal buffer mode, it still faces challenges arising from the low transmittance of PV glazing, which can lead to higher heating loads [7,17].
The influence of various factors on performance under different control modes has emerged as a central focus in current research. Studies [19,20] have investigated the impact of PV-DSF parameters on building energy consumption in different regions under external circulation and thermal buffer modes. The results indicate that the solar heat gain coefficient (SHGC) of PV-DSFs had the most significant impact on energy consumption, while the thermal transmittance (U-value) of the internal and external glazing and the cavity depth also played crucial roles in building performance. A subsequent study [21] further explored the effects of the U-value of the indoor glazing and the SHGC of PV glazing on system performance, identifying optimal parameter values for three climate zones in Australia. Sharma et al. [22] found that in a PV triple-skin façade system (PV-TSF), the transmittance of PV glazing accounted for approximately 54% of the impact on SHGC. Research [23] examined the effects of different PV coverage ratios on solar heat gain and overall energy performance under various control modes in winter and summer. Another investigation [17] assessed the thermal performance of the thermal buffer mode using PV glazing transmittance levels of 20% and 40%, concluding that 40% transmittance is better suited for heating-dominant regions. Furthermore, their study revealed that during winter, using double-pane glazing on the indoor side resulted in lower energy consumption compared to laminated glass in both internal circulation and thermal buffer modes. Other scholars [24,25] have also examined the impact of PV-DSF parameters on energy consumption in external circulation and ventilation modes in cooling-dominant regions.
In summary, current PV-DSF control modes fall short in addressing the increased heating load caused by reduced solar heat gain in PV glazing. Existing solutions face limitations, such as suboptimal PV power generation and inadequate thermal insulation in heating-dominant regions with harsh winters. To tackle these challenges, this study proposes a novel PV energy-saving window, which incorporates an insulated shutter to enhance thermal performance. Based on the characteristics of the proposed PV energy-saving window, three control modes are introduced: Mode 1 controls the insulated shutter, Mode 2 controls the insulated shutter and the PV glazing, and Mode 3 controls the insulated shutter and the clear glazing.
The proposed control mode, which opens the PV glazing under sufficient solar radiation, is compared with two other control modes to evaluate the impact of key factors related to the PV energy-saving window on heating load. The results confirm that this control mode effectively mitigates the loss of solar heat gain caused by the low transmittance of PV glazing, making it suitable for heating-dominant regions.

2. Methodology

The present study proposes a novel PV energy-saving window and analyzes the impact of key factors and configurations on heating load under three control modes, as shown in Figure 1. First, the energy-saving advantage of the PV energy-saving window is validated through in situ tests. Second, using the validated simulation model, the correlation between key factors and heating load under each control mode is compared and analyzed. Finally, the effect of configurations under various control modes on heating load is discussed.

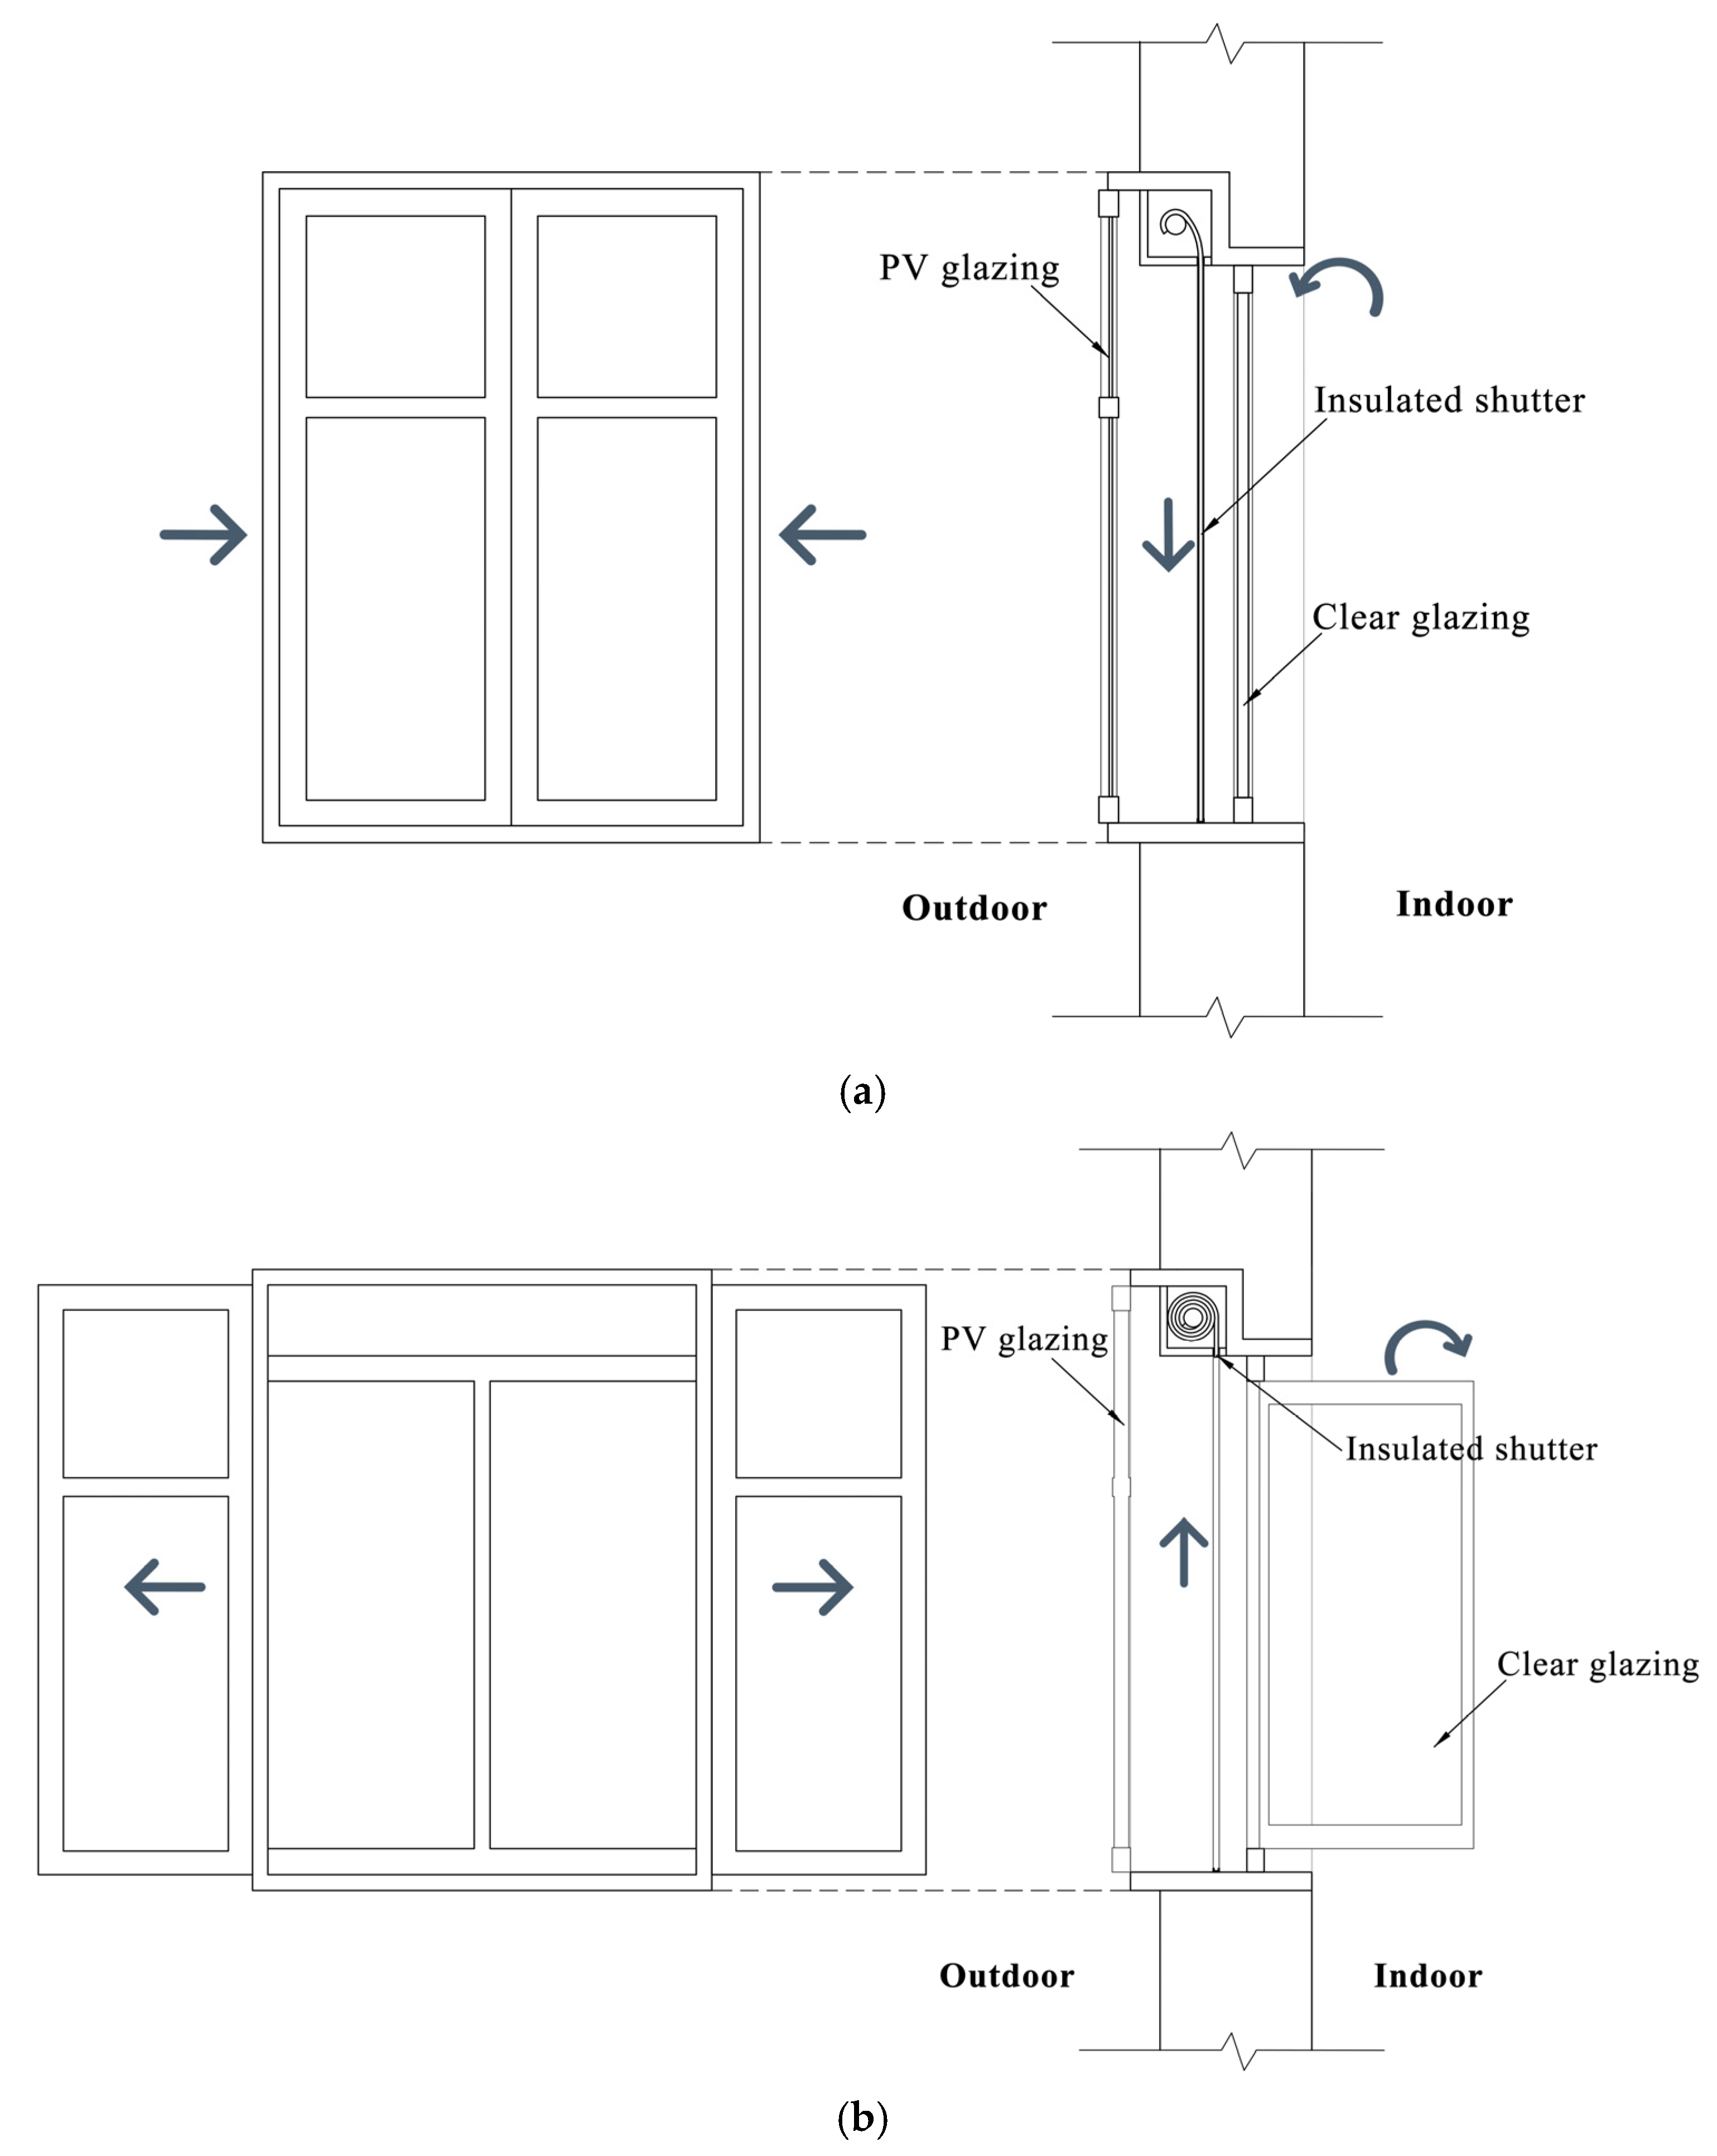
2.1. Window Design and Mathematical Model

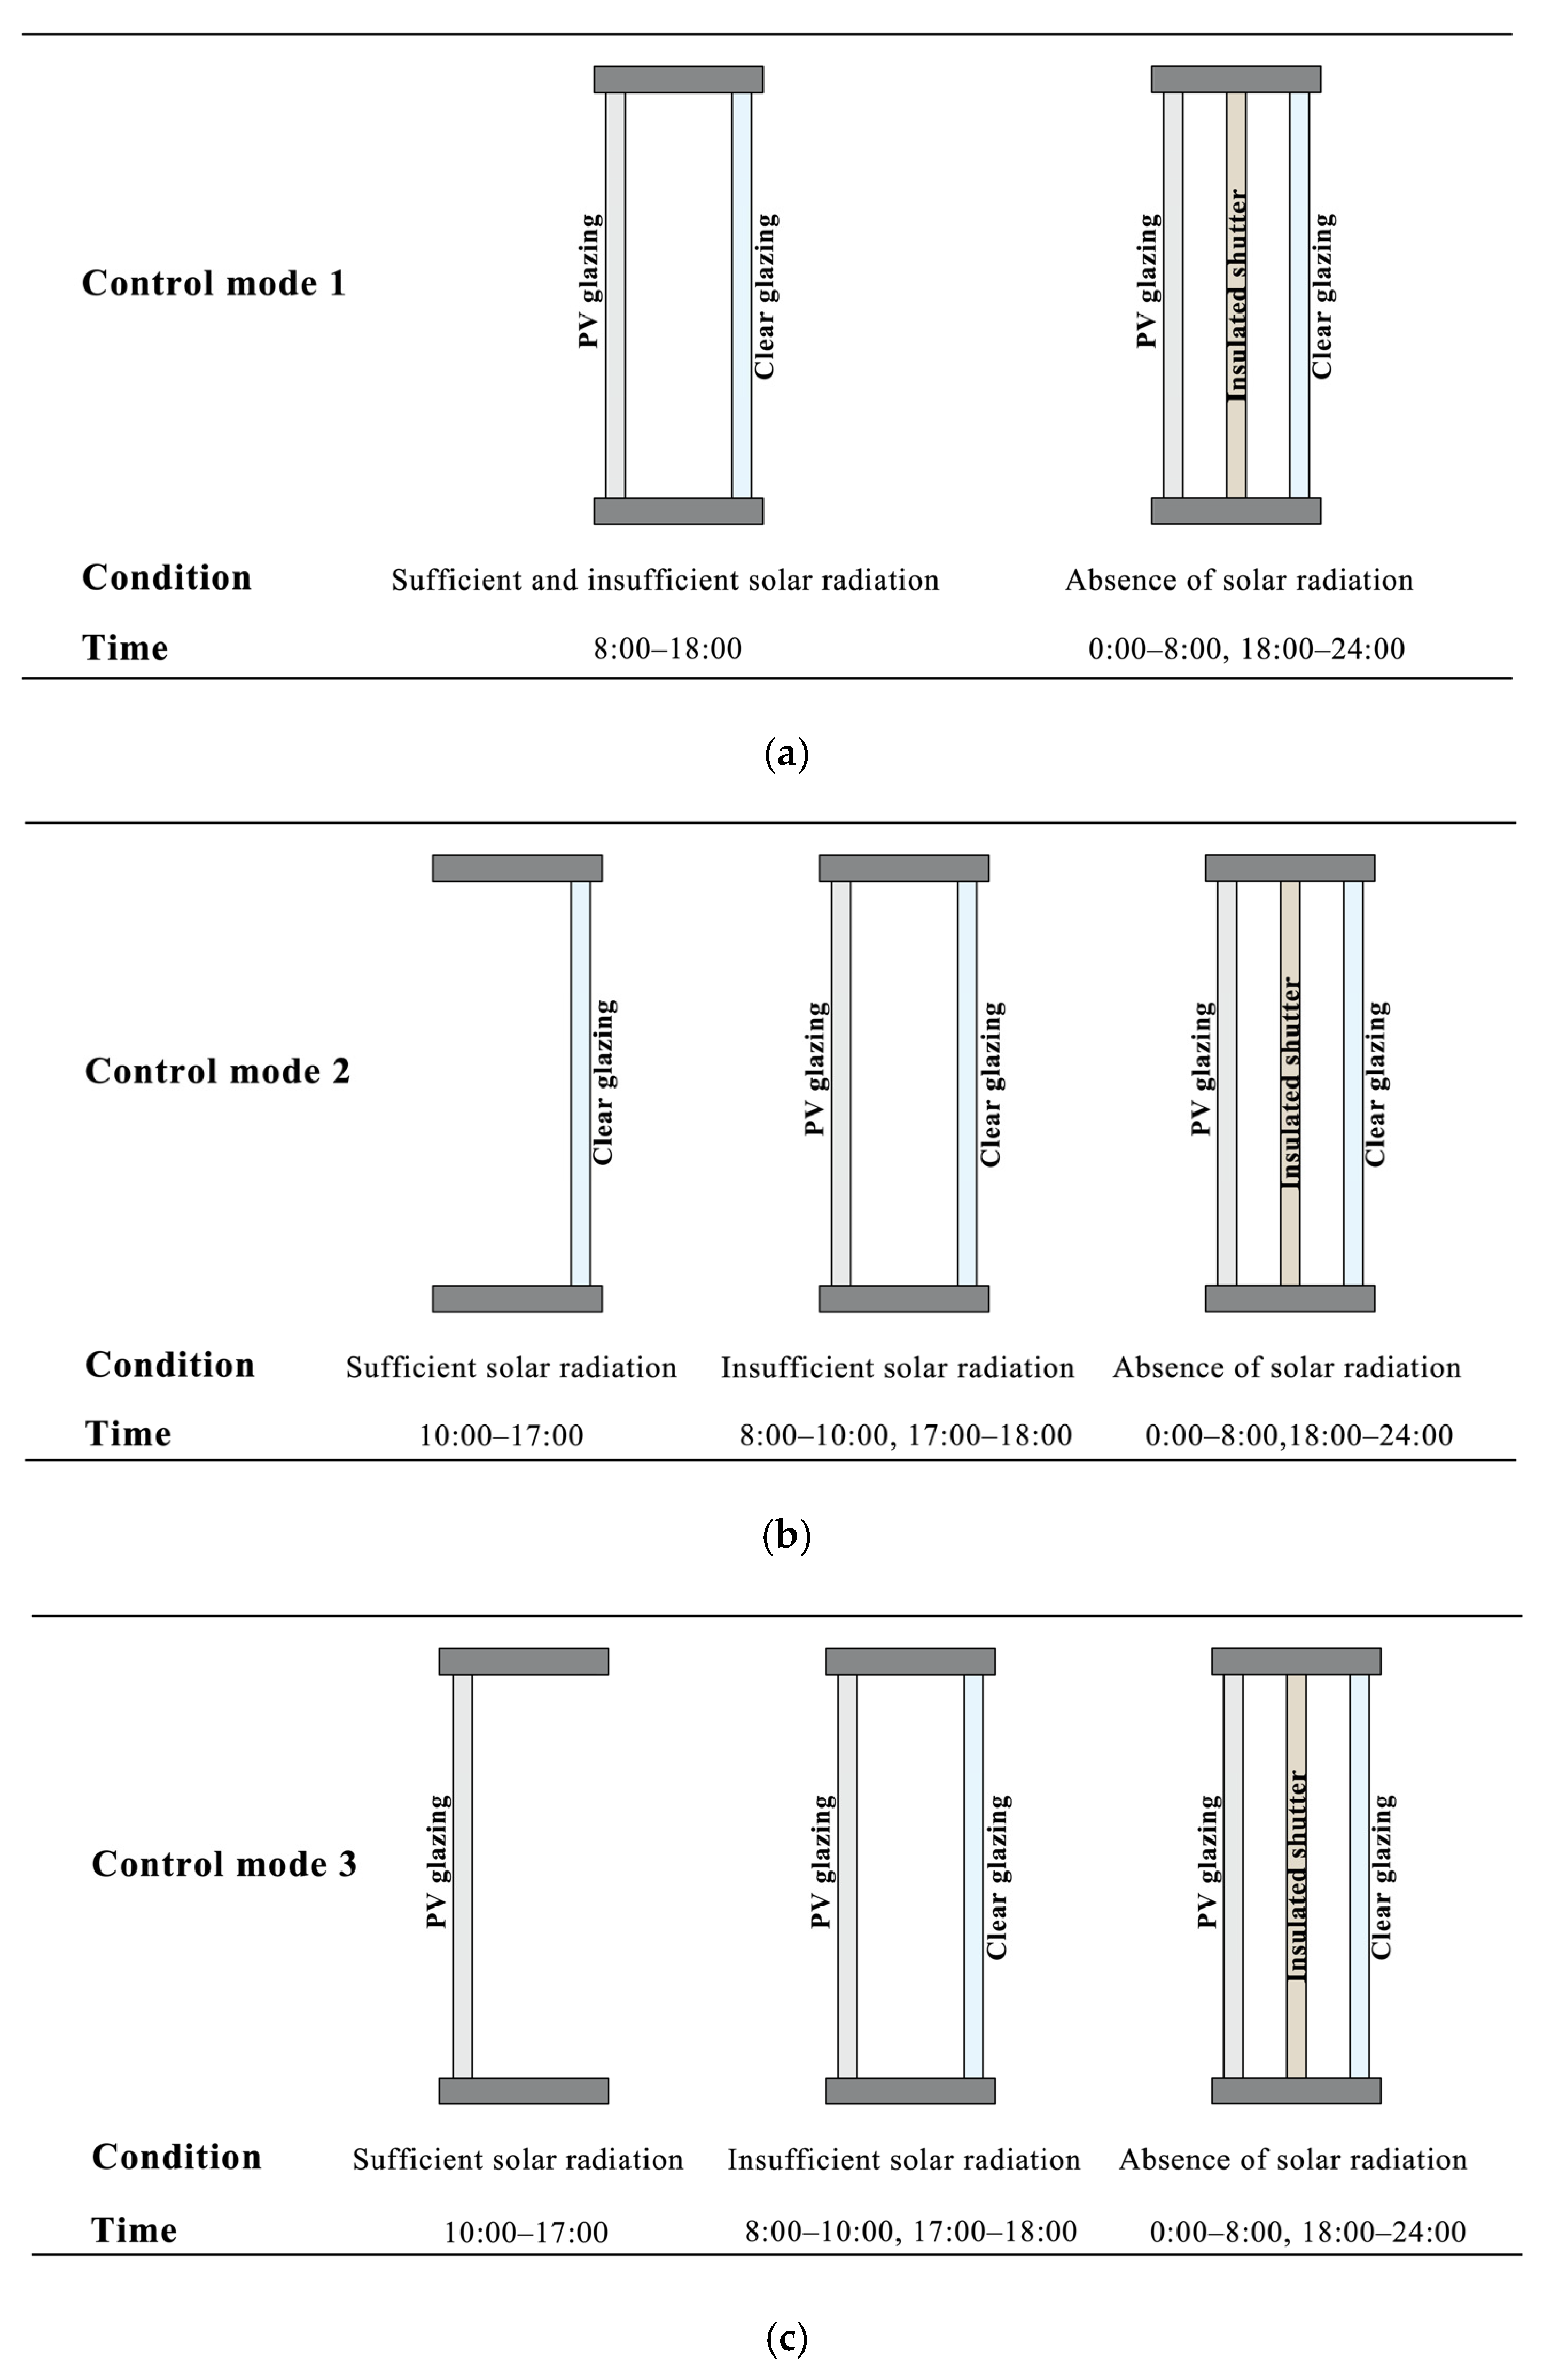
2.1.1. Window Structure and Three Control Modes

Enhancing window insulation and solar transmittance is crucial for reducing heating loads in heating-dominant regions. While PV glazing offers energy benefits, traditional PV-DSFs underperform due to low solar transmittance. This study proposes a novel PV energy-saving window, shown in Figure 2. The window consists of three layers: PV glazing, insulated shutter and clear glazing, arranged from exterior to interior. PV glazing provides shading in summer to reduce cooling loads but can increase heating loads in winter. To ensure year-round use, the PV glazing should be designed to be controllable. Its opening method involves moving towards the sides of the window. This method allows the PV glazing to remain oriented towards the direction of maximum solar radiation, without compromising its energy output. Low outdoor temperatures in winter mitigate efficiency losses caused by overheating in PV modules [17]. Opening the PV glazing further enhances convective heat exchange, reducing the temperature of the module and improving energy conversion efficiency. Additionally, it can provide a certain degree of insulation and wind protection.
The insulated shutter, made of high-insulation material, improves the overall performance of the window, making it suitable for cold heating regions. The insulated shutter can move vertically along a track and roll up when not in use, providing flexibility in adjusting insulation levels. The clear glazing on the interior side provides high solar transmittance and moderate insulation, serving as the fundamental component of the system. It adopts an inward-swinging opening method for easy operation. Additionally, to accommodate varying usage needs and adapt to environmental changes, each of the three layers—PV glazing, insulated shutter, and clear glazing—can be fully opened and independently controlled, as illustrated in Figure 2b. This feature ensures optimal performance under different conditions.
Three solar radiation conditions may occur each day: sufficient radiation, insufficient radiation, and absence of radiation. Under conditions of sufficient solar radiation, several potential configurations of layer openings can effectively reduce the heating load, as illustrated in Figure 3. Figure 3a presents the basic control mode, which controls only the opaque insulated shutter to ensure an outdoor view during the day. Figure 3b presents a control mode in which the PV glazing is moved aside during periods of sufficient solar radiation, allowing more solar radiation to enter the indoor space and increase solar heat gain. Figure 3c presents a control mode where the clear glazing is opened during periods of sufficient solar radiation. This operation allows the heated air in the cavity, which is warmed by both the residual heat from PV glazing and solar radiation, to exchange heat with the indoor air through convection, thereby reducing the heating load.
Under insufficient solar radiation, the closed layers are the same across the three control modes. During this period, closing the PV glazing enhances insulation, while its low transmittance has minimal impact on solar heat gain. Under absence of solar radiation, insulation is the most critical factor, and closing all layers achieves the best energy-saving performance.
The main difference between these control modes lies in controlling the operation of PV glazing, clear glazing, and insulated shutter to regulate solar heat gain, cavity-to-indoor air heat exchange, and thermal insulation efficiency.

2.1.2. Mathematical Model

The heat exchange between the PV energy-saving window and its surroundings involves conduction, convection, and radiation. Conduction occurs within the glass material, while convective heat exchange takes place between the glazing surfaces and the adjacent air. Radiative heat exchange occurs between the glazing and surrounding surfaces. Solar radiation passes through the PV glazing and clear glazing, experiencing reflection, absorption, and transmission, which decreases the radiation intensity at each layer. As a result, the temperature of each layer rises due to solar heat gain, and some of the solar radiation penetrates into the interior.
When a solid is an isotropic and dense single material, the unsteady-state conduction process occurring within it can be described by Equation (1).
ρ C t τ = x ( λ t x ) + y ( λ t y ) + z ( λ t z ) + Φ
where t is the temperature in °C; τ is time; ρ is the material density, in kg/m3; C is the specific heat capacity, in J/(kg·K); λ is the thermal conductivity of the material, in W/(m·K); and Φ ˙ is the heat generation from the internal heat source, in W/m3.
The initial condition for Equation (1) is:
t τ = 0 = ϕ ( x , y , z )
where φ(x,y,z) refers to the known temperature function.
Based on the actual conditions, considering the effects of convection and radiation, the third type of boundary condition is selected. The boundary conditions are shown in Equation (3).
λ t n s = h ( t s t f ) + ε σ ( T s 4 T s u r 4 )
where h is the heat transfer coefficient of the inner and outer surfaces in W/(m2·°C); tf is the air temperature, in °C; ts is the surface temperature, in °C; Tsur is the environmental surface temperature, in K; ε is the emissivity; and σ is the Stefan–Boltzmann constant, 5.67 × 10⁻⁸ W/(m2·K4).
The convective heat transfer governing equations describe the heat exchange between the window surface and the surrounding air, including the continuity equation, the energy differential equation, and the momentum differential equation. The governing equations for convective heat transfer are as follows.
Continuity Equation (4):
u x + v y + w z = 0
Energy differential Equation (5):
t τ + u t x + v t y + w t z = λ ρ C p 2 t x 2 + 2 t y 2 + 2 t z 2
where Cp represents the specific heat capacity at constant pressure, in J/(kg·K).
System of differential equations for momentum:
ρ u τ + u u x + v u y + w u z = F x + μ 2 u x 2 + 2 u y 2 + 2 u z 2 ρ x
ρ v τ + u v x + v v y + w v z = F y + μ 2 v x 2 + 2 v y 2 + 2 v z 2 ρ y
ρ w τ + u w x + v w y + w w z = F z + μ 2 w x 2 + 2 w y 2 + 2 w z 2 ρ z
where Fx, Fy, and Fz are the components of the volume force in the x, y, and z directions; u, v, and w are the velocity components in the x, y, and z directions, in m/s; and μ is the dynamic viscosity, in Pa·s.
The governing equation for the heat transfer R1 from a high-temperature surface to a low-temperature surface is as follows:
R 1 = ε i A i i = 1 N X i σ T 1 4 T 2 4
where εi is the emissivity of other low-temperature surfaces; Ai is the area of other low-temperature surfaces, in m2; Xi is the angle factor between the high-temperature surface and the other low-temperature surfaces; T1 is the temperature of the high-temperature surface, in K; T2 is the temperature of the other low-temperature surfaces, in K.
The above governing equations form the foundation for all heat exchange processes and are used to calculate the heat transfer rate through the window. These rates are integrated into the heat balance equation to determine the heating load of the building. The numerical simulation in this study was conducted using EnergyPlus (Version 9.6.0).
The PV glazing is composed of two layers of tempered glass and a PV cell layer. The heat transfer processes between these layers are similar. To illustrate the thermal transfer within the window, the tempered glass on the outer surface of the PV glazing will be used as an example. The heat balance equation is as follows:
D p o ρ p o C p o T p o τ = D p o k p o 2 T p o y 2 + 2 T p o x 2 + I ξ p o h c , o u t T p o T o u t h r , o u t T p o T o u t + U p o , p i T p i T p o 1 δ + U p o , p c T p c T p o ε
where Dpo, ρpo, Cpo, and kpo are the thickness in m, density in kg/m3, heat capacity, in J/kg·K, and thermal conductivity, in W/(m·K) of the outer layer of the PV glazing, respectively; Tpo, Tpi, and Tpc are the temperatures of the outer layer of PV glazing, the inner layer of PV glazing, and the PV cell, in K, respectively; I represents the solar radiation intensity incident on the window surface, in W/m2; ξpo is the solar radiation absorptance of the outer layer of PV glazing; Tout is the environmental temperature, in K; hc,out and hr,out are the convective heat transfer coefficient and radiative heat transfer coefficient, in W/(m2·K), between the outer layer of PV glazing and the environment, respectively; Upo,pc refers to the equivalent heat transfer coefficient, in W/(m2·K), between the outer layer of the PV glazing and the PV cells, while Upo,pi represents the equivalent heat transfer coefficient, in W/(m2·K), between the outer and inner layers of the PV glazing; and δ is the coverage ratio of the PV cell.
The convective and radiative heat transfer coefficients between the PV glazing and outdoor air are as follows [26]:
h c , o u t = 5.62 + 3.9 V o u t
h r , o u t = σ ε p o T p o 4 T s k y 4 X p o , s k y + T p o 4 T g n d 4 X p o , g n d T p o T o u t
where Vout represents the outdoor ambient wind speed, in m/s; εpo is the infrared emissivity of the PV glazing; Tsky is the sky temperature, in K; Tgnd is the ground surface temperature, in K; and Xpo,sky refers to the angle factor between the glazing surface and the sky, while Xpo,gnd represents the angle factor between the glazing surface and the ground.

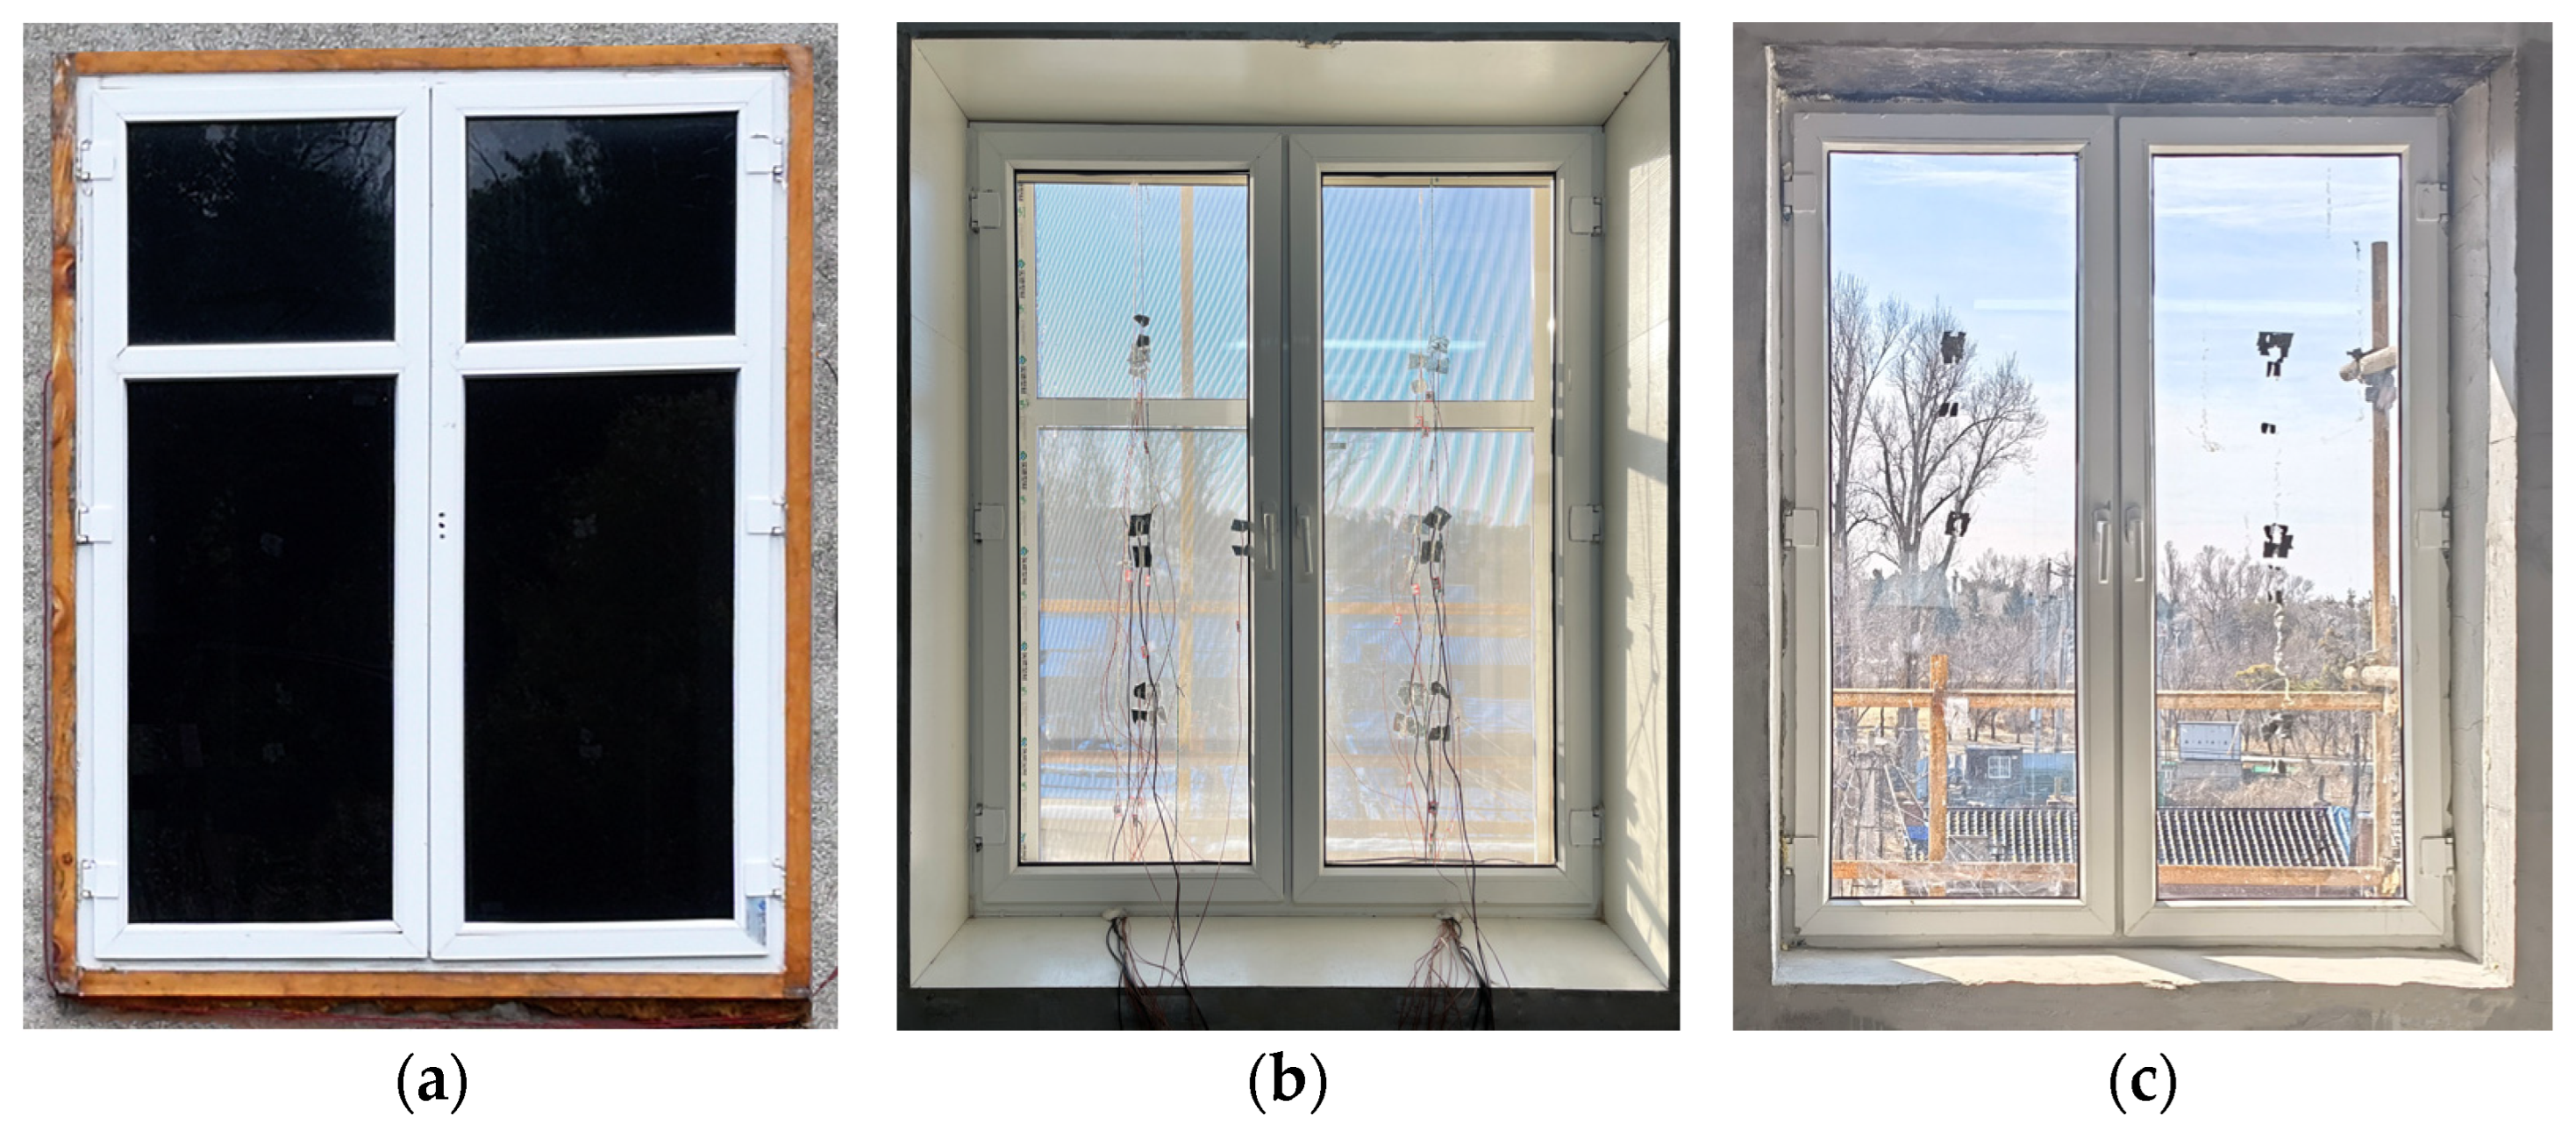
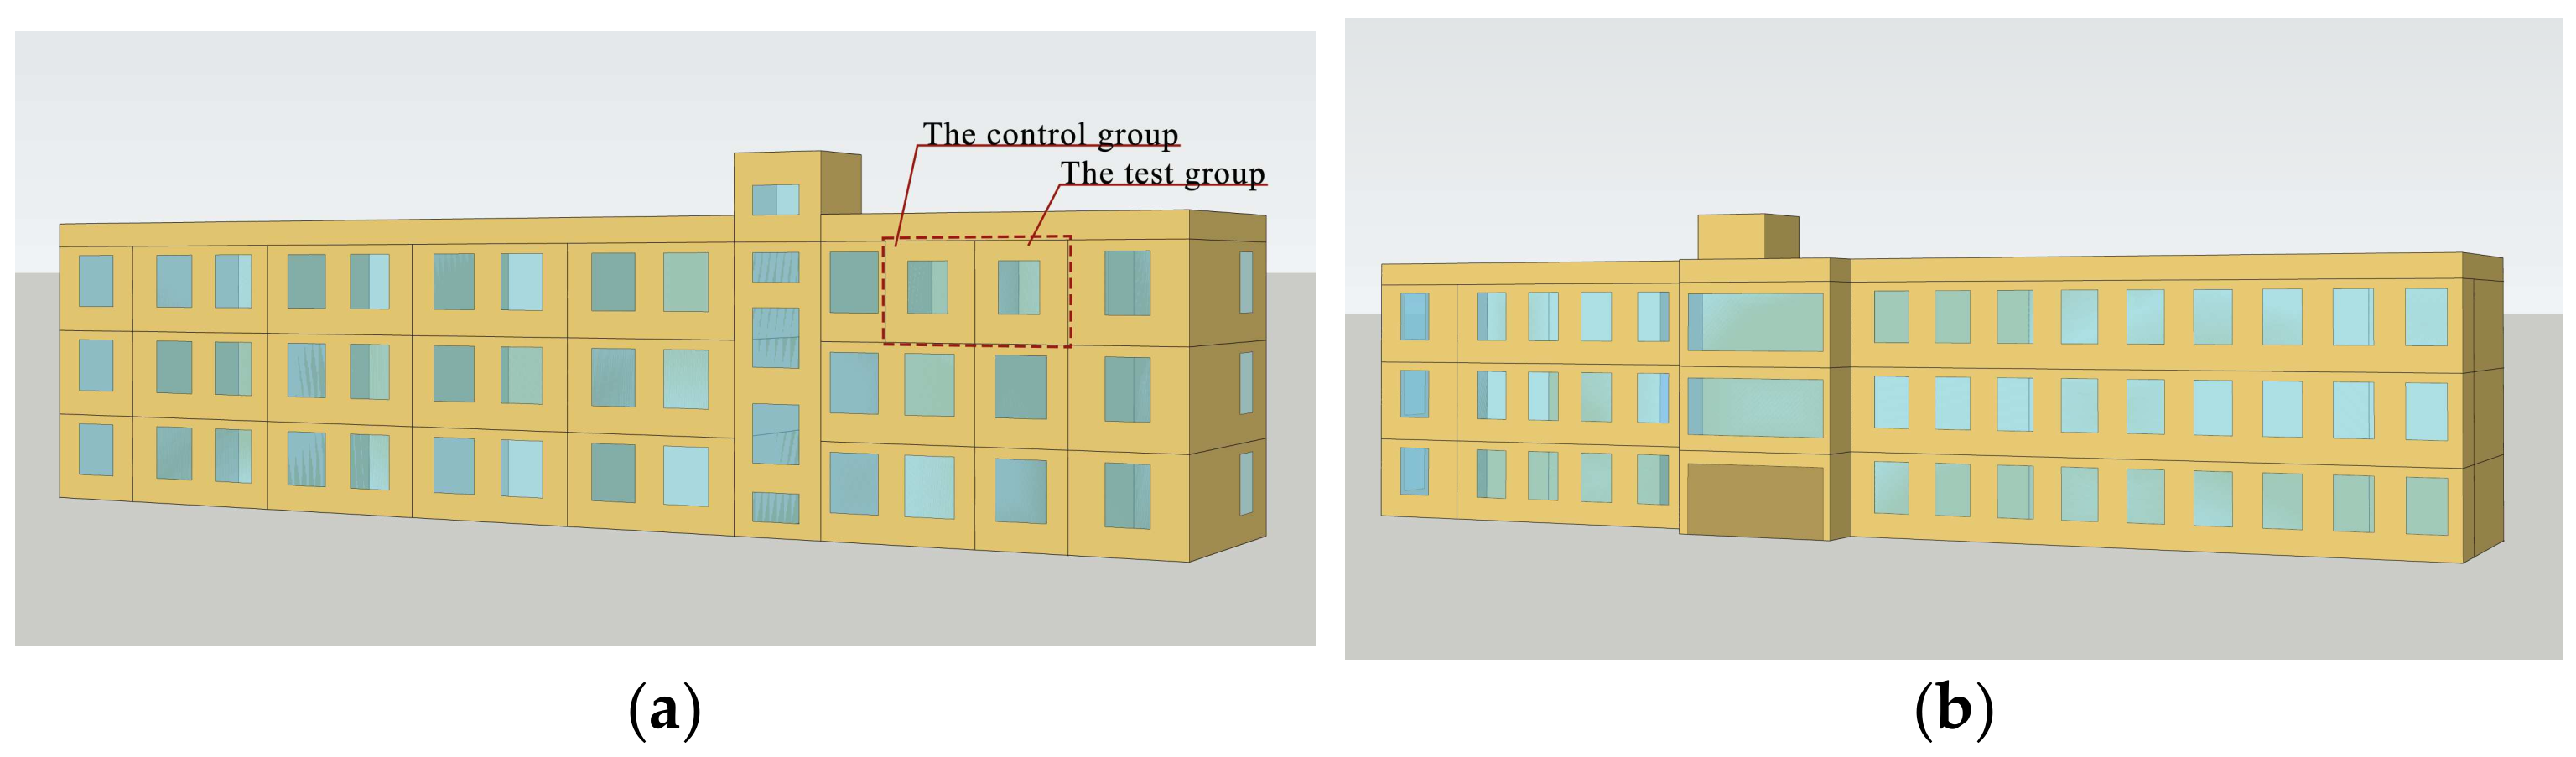
2.2. In Situ Test Setup and Energy-Saving Effect Confirmation

2.2.1. In Situ Test Setup

The in situ test was conducted in Changchun, China (longitude 125.22° E, latitude 43.90° N, altitude 238 m), a region with a heating demand. The average temperature of the coldest month in Changchun is −14.4 °C. Two south-facing rooms of identical dimensions in an existing building were selected as the test and control groups. The building features exterior and interior walls constructed of 0.49 m and 0.24 m thick brick, respectively. To enhance thermal insulation, 0.16 m of expanded polystyrene (EPS) is applied to the inner side of the walls in both the test and control groups. The material properties of the building envelope are listed in Table 1. In this city, the south-facing direction receives the highest intensity of solar radiation. The test group was equipped with the PV energy-saving window, while the control group used the locally common double-pane clear glazing, as shown in Figure 4. The window openings measured 1.4 m in width and 1.7 m in height. The parameters for each layer in the PV energy-saving window are listed in Table 2.
Solar radiation intensity and outdoor temperature were measured using pyranometer and thermocouples, respectively. Outdoor wind speed and humidity data were obtained from the European Centre for Medium-Range Weather Forecasts (ECMWF) [27] and local weather station. Heating for both groups was provided by two identical electric heaters from the same brand and batch, and the electricity consumption of each heater was individually recorded using separate power monitoring equipment. The measured load is equivalent to the required load representing the heat provided to maintain indoor temperature.
The temperatures of the PV glazing, outer cavity, insulated shutter, inner cavity, and clear glazing were measured using thermocouples. Each area was equipped with 6 thermocouples to measure the temperature simultaneously. Separately, the room temperatures for both the test and control groups were measured using an array of three thermocouples placed at the center of each room. The data were logged by a data logger at intervals of 10 s. Additionally, the heat transfer coefficient of the building envelope was determined based on data from heat flux sensors and temperature sensors, with measurements taken every minute.
The room temperature was regulated by a temperature control device, which was set to maintain a constant 21 °C. Upon reaching this temperature, the heater would turn off. To ensure identical initial conditions, it was essential that the room temperatures of both the test and control groups were the same prior to each test. After every 24 h measurement period, the PV energy-saving window was kept with the same double-pane clear glazing used in the control group. Throughout the test, all data were recorded automatically to prevent any temperature fluctuations caused by human interference.

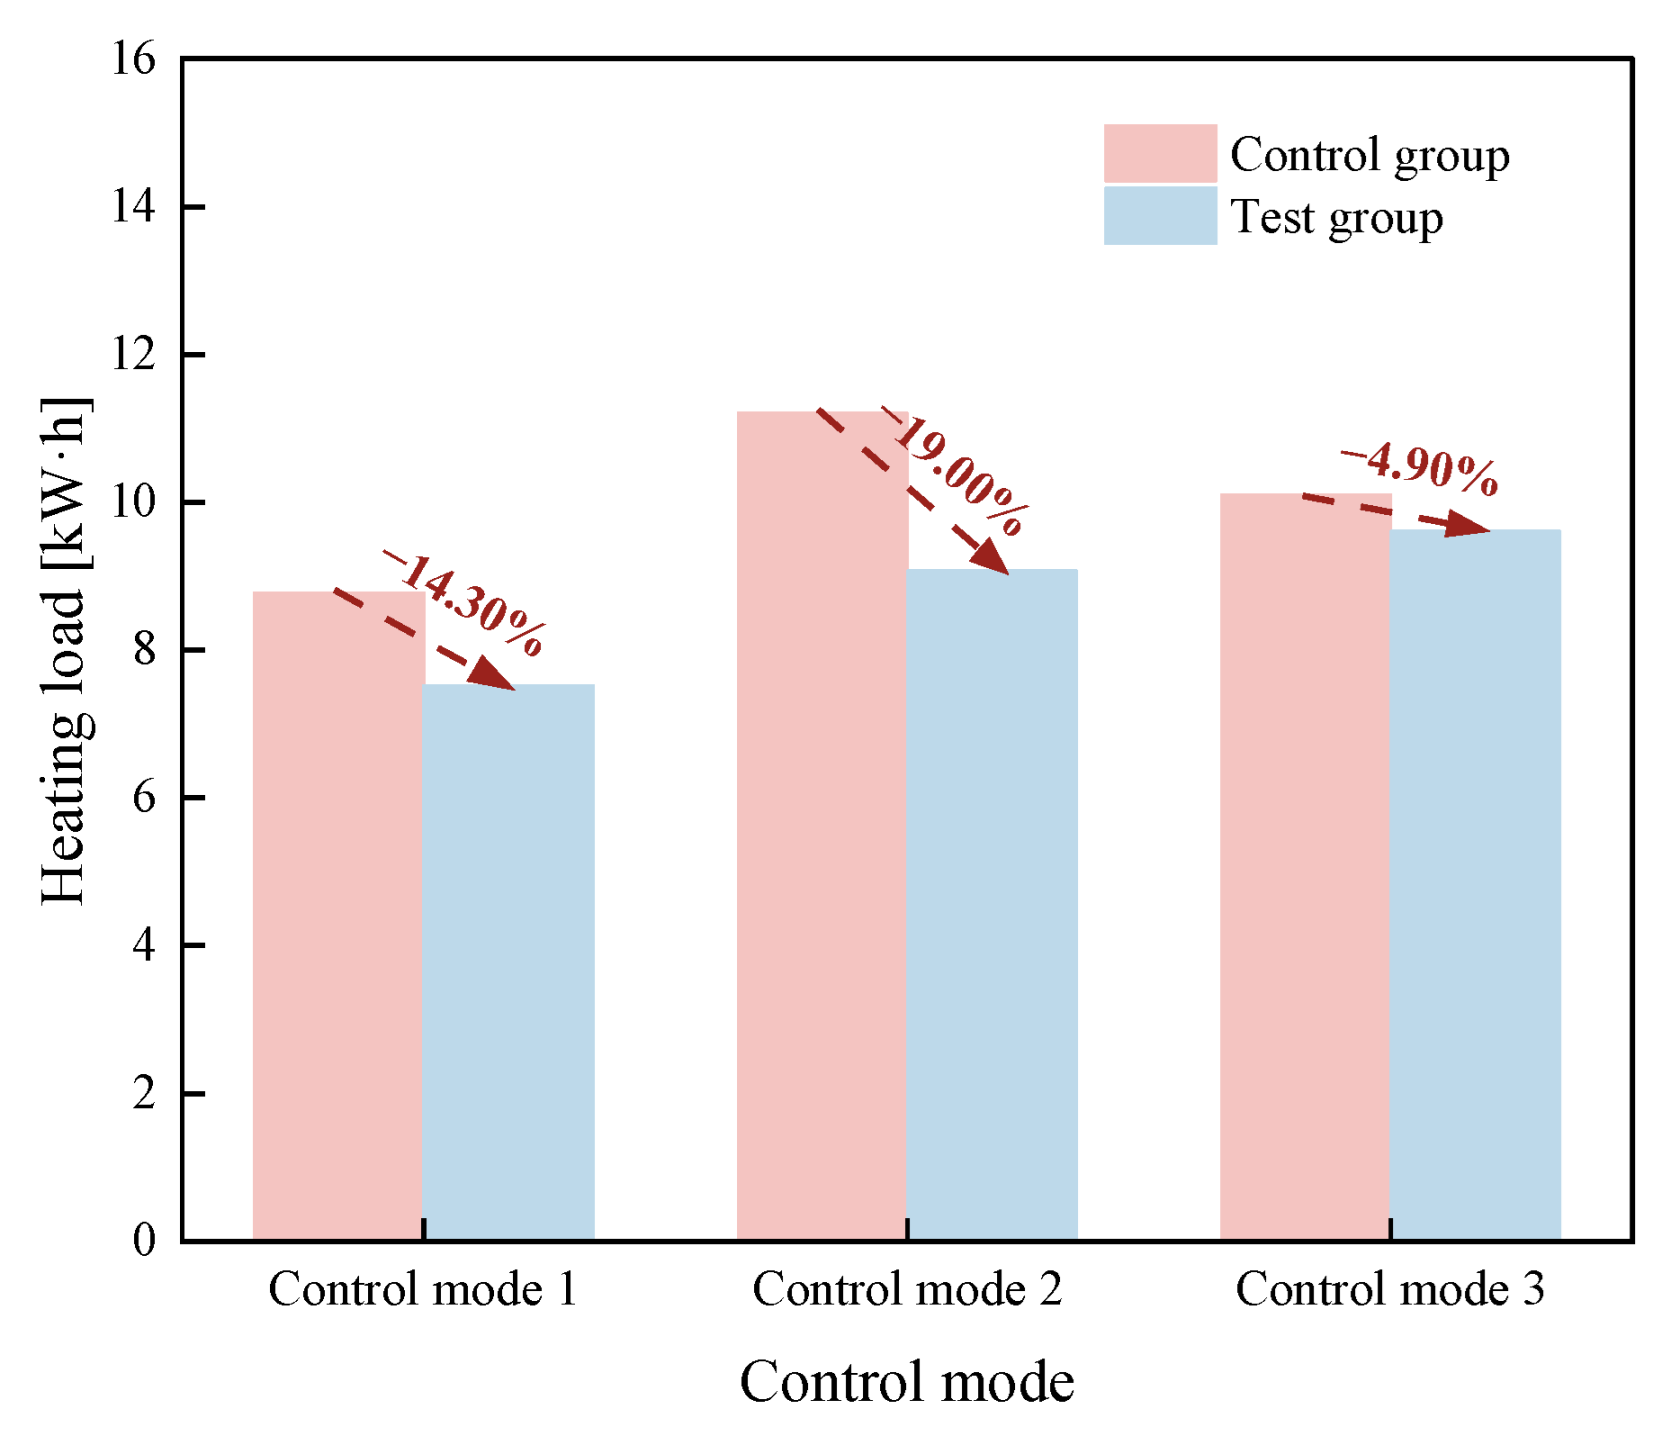
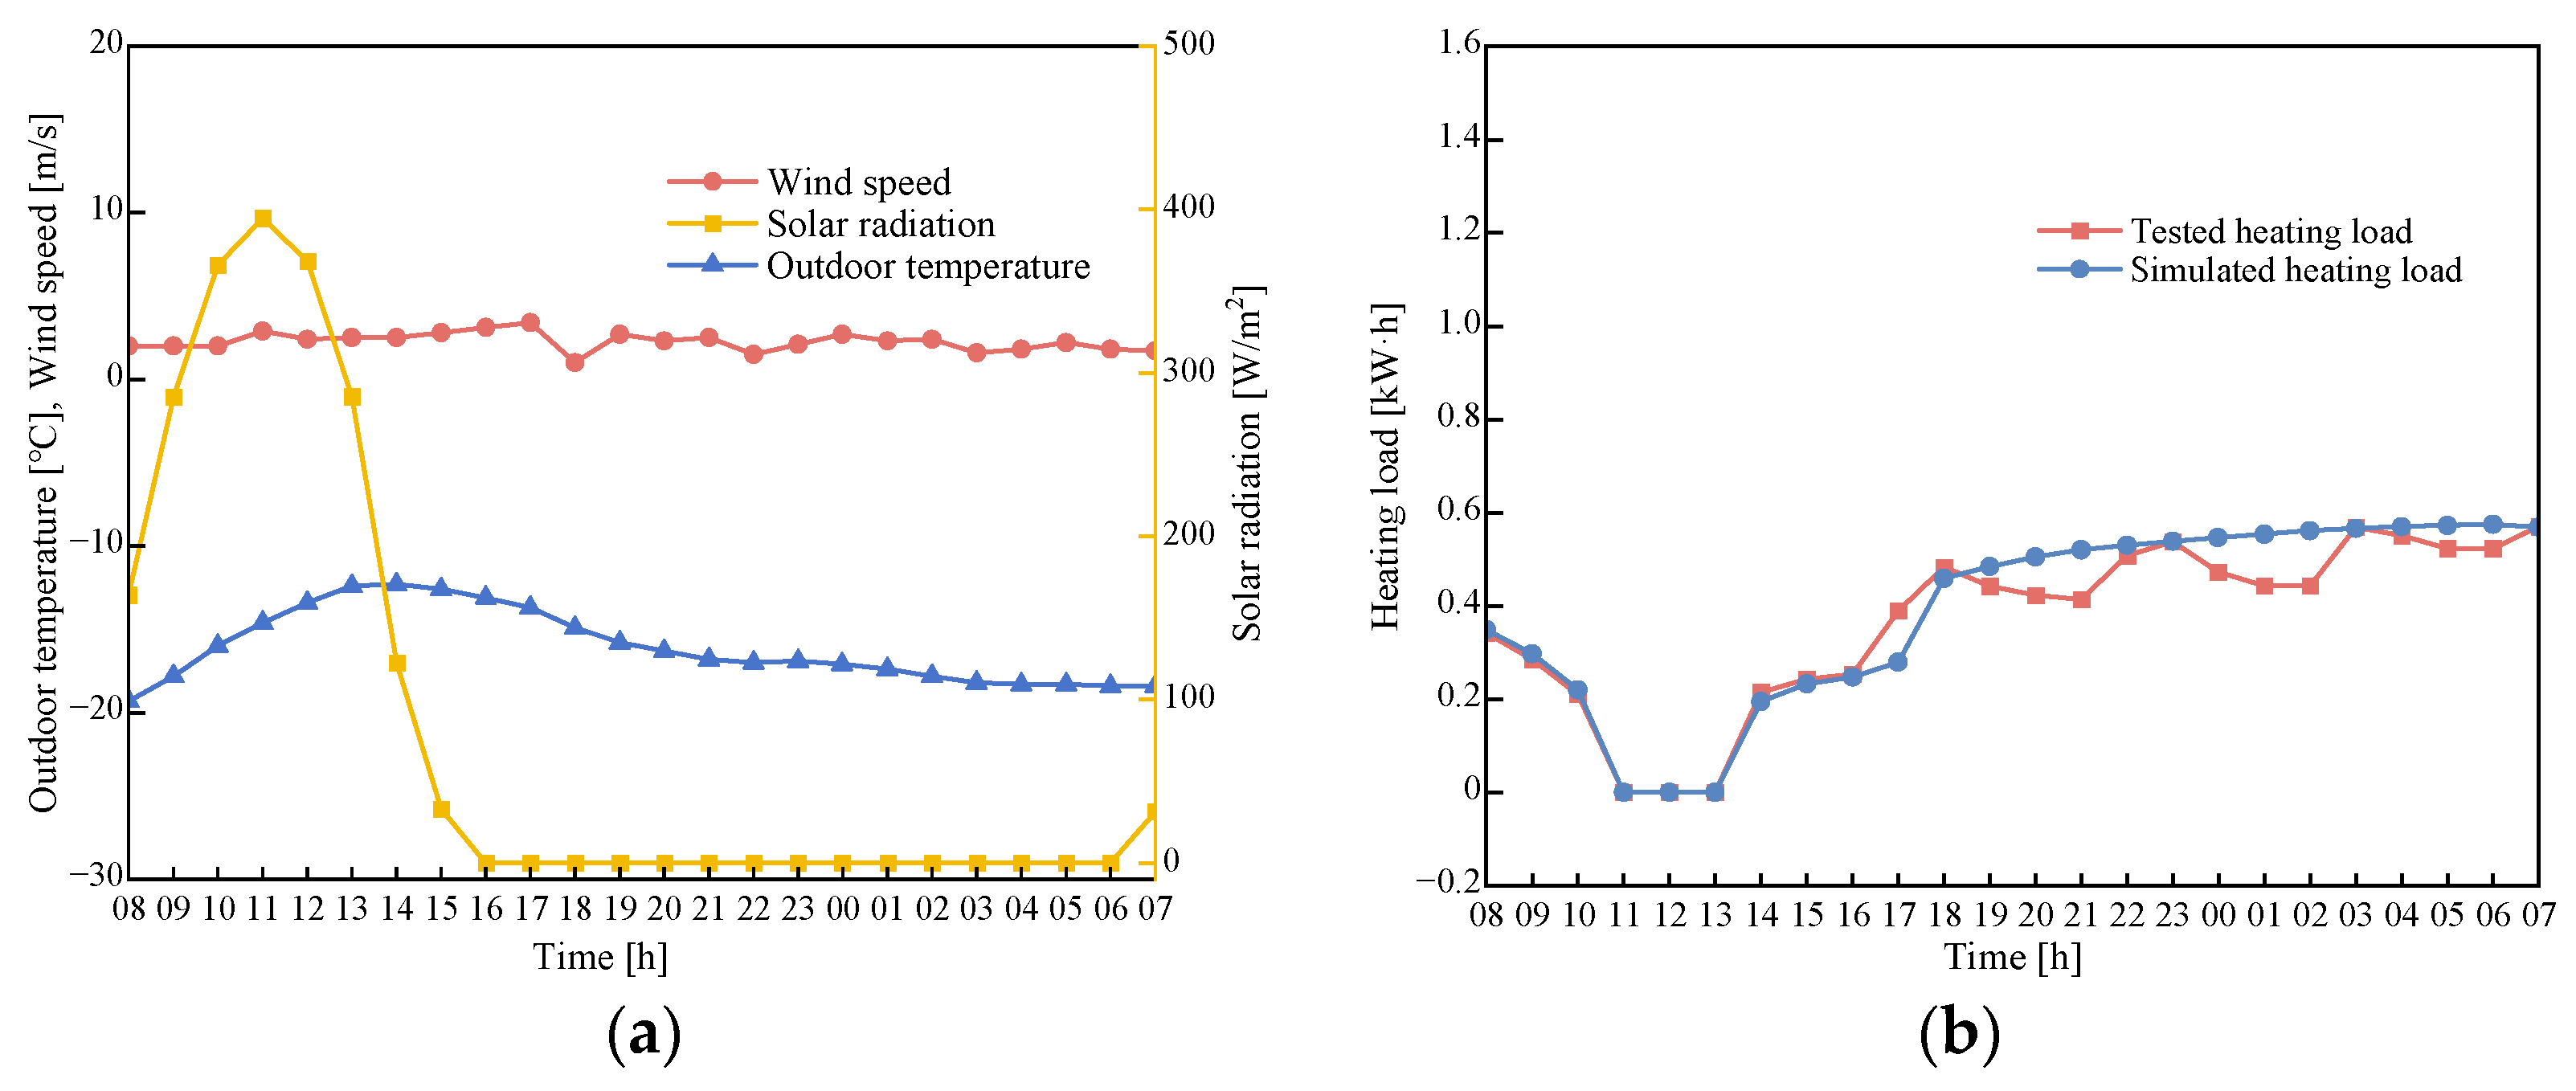
2.2.2. Confirmation of the Window Energy-Saving Effect

This section presents the energy-saving performance of the proposed window under the three control modes based on three days in situ test results, as shown in Figure 5. It can be observed that among the three control modes, control mode 2 achieves the best energy-saving performance, reducing the heating load by 19.00% compared to the control group. These findings confirm the effectiveness of the PV energy-saving window in reducing heating load and provide a foundation for further research.

2.3. Numerical Experiment Setup and Model Validation

2.3.1. Numerical Experiment Setup

The numerical simulation in this study was conducted using EnergyPlus (Version 9.6.0), with the building model constructed in SketchUp (Version 2021), as shown in Figure 6. The weather conditions during the heating period, from 20 October to 6 April of the following year, were based on the typical meteorological year (TMY) data [28] for the local area, as shown in Figure 7. The parameters of the window and building used in the simulation were consistent with the in situ test setup, as shown in Table 1 and Table 2. The control switching criteria for the three control modes were based on solar radiation during the three coldest months of the local heating period.
Figure 8 shows the average hourly solar radiation, along with the maximum and minimum values, from December to February. The data show that solar radiation is generally higher between 10:00 and 17:00, while it remains consistently lower before 8:00 and after 18:00. Considering the low outdoor temperatures, the control switching criteria were set as follows: In control modes 2 and 3, the PV glazing and the clear glazing open between 10:00 and 17:00. For all three control modes, the insulated shutter opens between 8:00 and 18:00. The specific time periods corresponding to the steps of each control mode are illustrated in Figure 3. The simulation time step was set to 1 min.

2.3.2. Model Validation

The weather conditions on the day of the in situ test and the results of the model validation are presented in Figure 9. The control mode used during the experiment was the second mode. The experiment lasted 24 h, from 8:00 to 8:00 the following day. The PV glazing was open from 11:00 to 13:00, while the insulated shutter was open from 8:00 to 16:00.
The Mean Absolute Percentage Error (MAPE) and Root Mean Square Error (RMSE) were used to evaluate the accuracy of the heating load simulation result.
M A P E = 1 n i = 1 n Q τ Q t e s t , τ Q t e s t , τ × 100 % , i = 1 , 2 , 3 , , n
R M S E = 1 n i = 1 n Q τ Q t e s t , τ 2 , i = 1 , 2 , 3 , , n
where Qτ represents the simulated heating load at the time τ, in kW·h; and Qtest,τ represents the tested heating load at the time τ, in kW·h.
The error for MAPE was approximately 9.97%, and the error for RMSE was around 0.037. These results indicate that the difference between the simulated and tested data falls within an acceptable range, suggesting that the simulation is accurate and can reliably predict the thermal performance of the PV energy-saving window. The discrepancies between the test and simulation may stem from the inability of the simulation to fully replicate the complex weather conditions on the test day, variations between theoretical values and actual material performance, fluctuations in heat output from the heater during real operation, and other contributing factors.

3. Results and Discussion

This section employs the orthogonal experiment method to analyze multi-factor interactions under three control modes. Based on the results, Pearson correlation analysis was conducted to quantify the strength of relationships between key factors and heating load under each control mode. Finally, the impact of configurations composed of these key factors on heating load was examined. As a statistical design approach, orthogonal experiments allow for a systematic investigation of multi-factor influences on outcomes with relatively few trials. Combined with analytical methods, previous studies have confirmed its effectiveness in assessing factor importance [29,30,31,32].
The selection of key factors is based on the characteristics of the window, including PV glazing layers (Factor A), the transmittance of PV glazing (Factor B), the thickness of the insulated shutter (Factor C), and the number of clear glazing layers (Factor D). Since triple-pane PV glazing is rarely used in practical engineering and relevant data are difficult to obtain, single-pane PV glazing, commonly adopted in practice, is used as a surrogate level in the analysis. The factors and levels of the orthogonal experiment are shown in Table 3, while the orthogonal array L9(34) and its results are presented in Table 4.

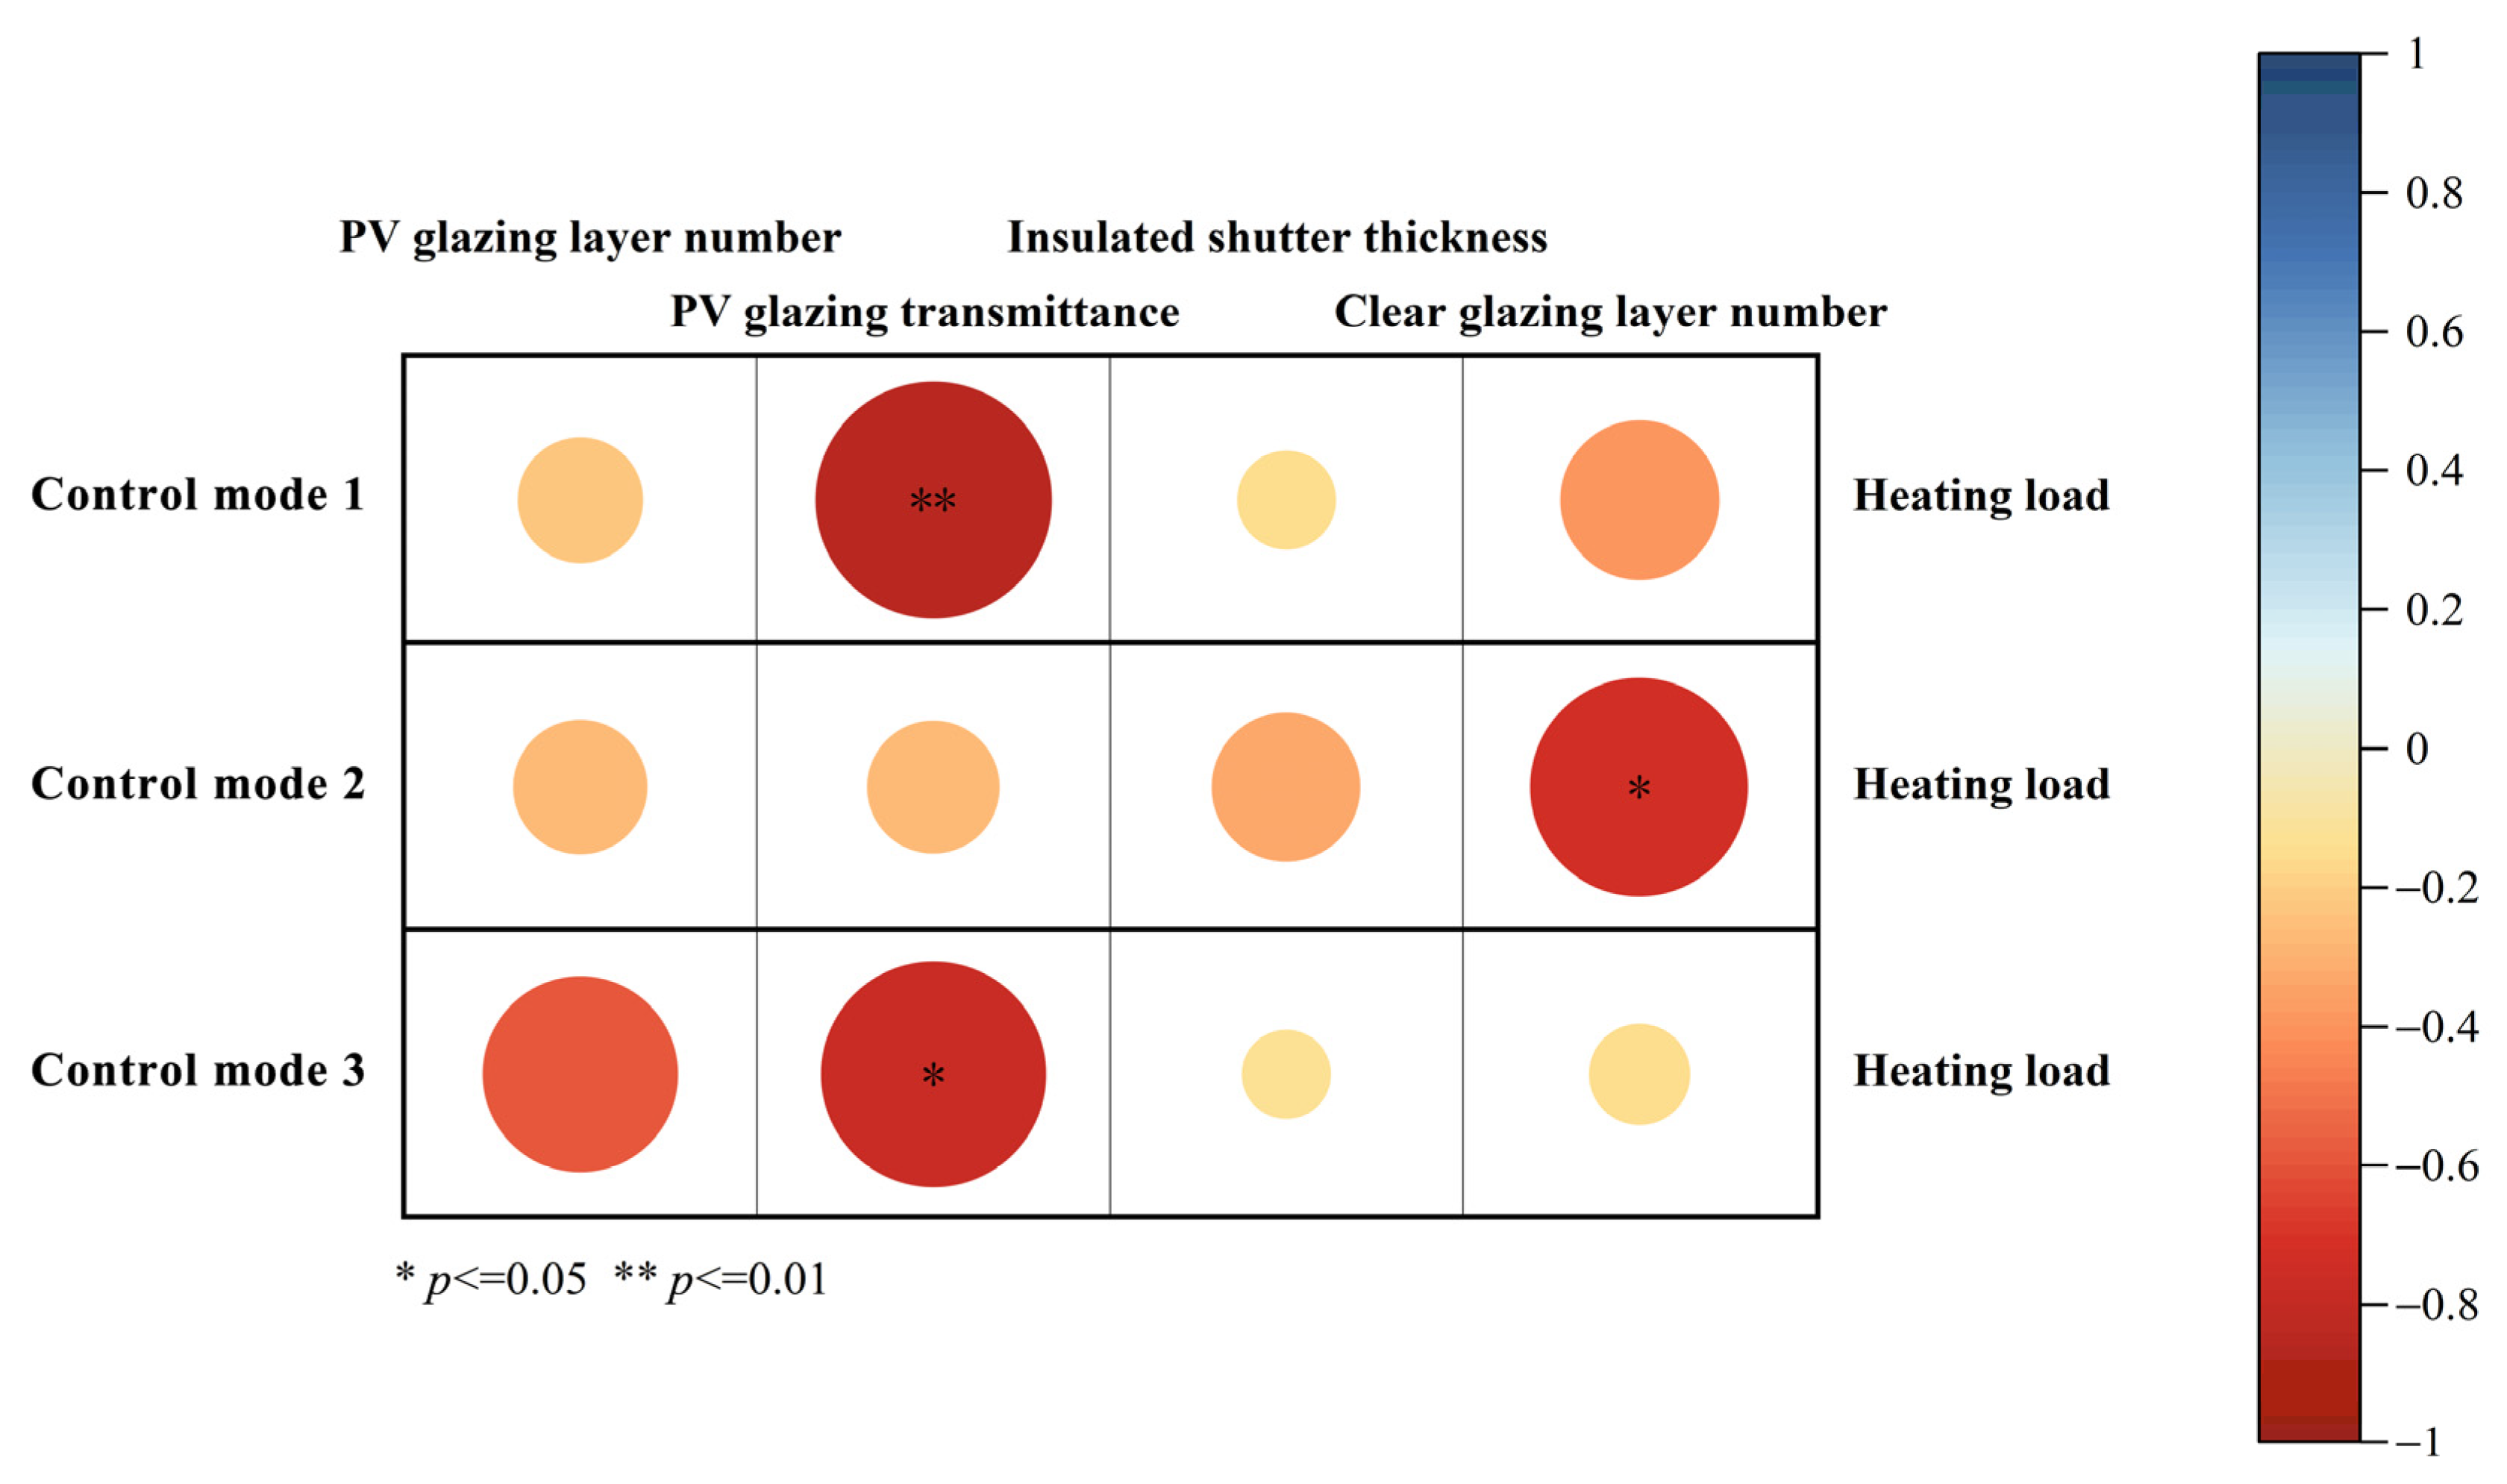
3.1. Correlation Analysis of Key Factors Influencing Building Heating Load

The Pearson correlation analysis quantifies the influence of key factors on heating load under each control mode, with results shown in Figure 10. Blue hues represent positive correlations, while red hues indicate negative correlations. The size and intensity of the circles reflect the strength of the correlation: darker colors and larger circles denote stronger correlations. The figure was created using correlation analysis results derived from orthogonal experiments. The strength and direction of the correlations were visualized using plotting software.
In control mode 1, the correlation rankings of key factors influencing heating load, in descending order, are as follows: PV glazing transmittance (correlation coefficient: 0.855), number of clear glazing layers (correlation coefficient: 0.389), number of PV glazing layers (correlation coefficient: 0.240), and insulated shutter thickness (correlation coefficient: 0.148). PV glazing transmittance exerts the greatest impact on heating load, aligning with the characteristics of this control mode. This underscores that, when PV glazing is not controlled and remains in a closed state, its transmittance plays a more critical role in influencing heating load than its insulation performance. Similar to the conclusions of Yang et al. [19], the importance of PV glazing transmittance has been reaffirmed. Clear glazing, which remains consistently closed and provides supplementary insulation, partly explains why the influence of insulation performance is less pronounced.
In control mode 2, the correlation rankings of key factors influencing heating load, in descending order, are as follows: number of clear glazing layers (correlation coefficient: 0.724), insulated shutter thickness (correlation coefficient: 0.338), number of PV glazing layers (correlation coefficient: 0.274), and PV glazing transmittance (correlation coefficient: 0.268). When PV glazing is controlled under sufficient solar radiation, its transmittance ceases to be the primary influencing factor. Instead, the number of clear glazing layers becomes dominant, highlighting the importance of insulation performance.
In control mode 3, the correlation rankings of key factors influencing heating load, in descending order, are as follows: PV glazing transmittance (correlation coefficient: 0.776), number of PV glazing layers (correlation coefficient: 0.583), number of clear glazing layers (correlation coefficient: 0.157), and insulated shutter thickness (correlation coefficient: 0.121). With PV glazing remaining in a closed position in this mode, its transmittance regains prominence. Furthermore, with clear glazing controlled to open, only PV glazing contributes to insulation, making its insulation performance more important in this scenario.
In conclusion, the control mode modifies the degree of influence of key factors on heating load. The findings further highlight the importance of PV glazing with position-controlled operation in reducing heating load. When PV glazing is in its closed state, its transmittance shows the strongest correlation with heating load. In contrast, under control, the importance of the clear glazing layer number becomes more pronounced.

3.2. Effect of Key Factor Configurations on Building Heating Load

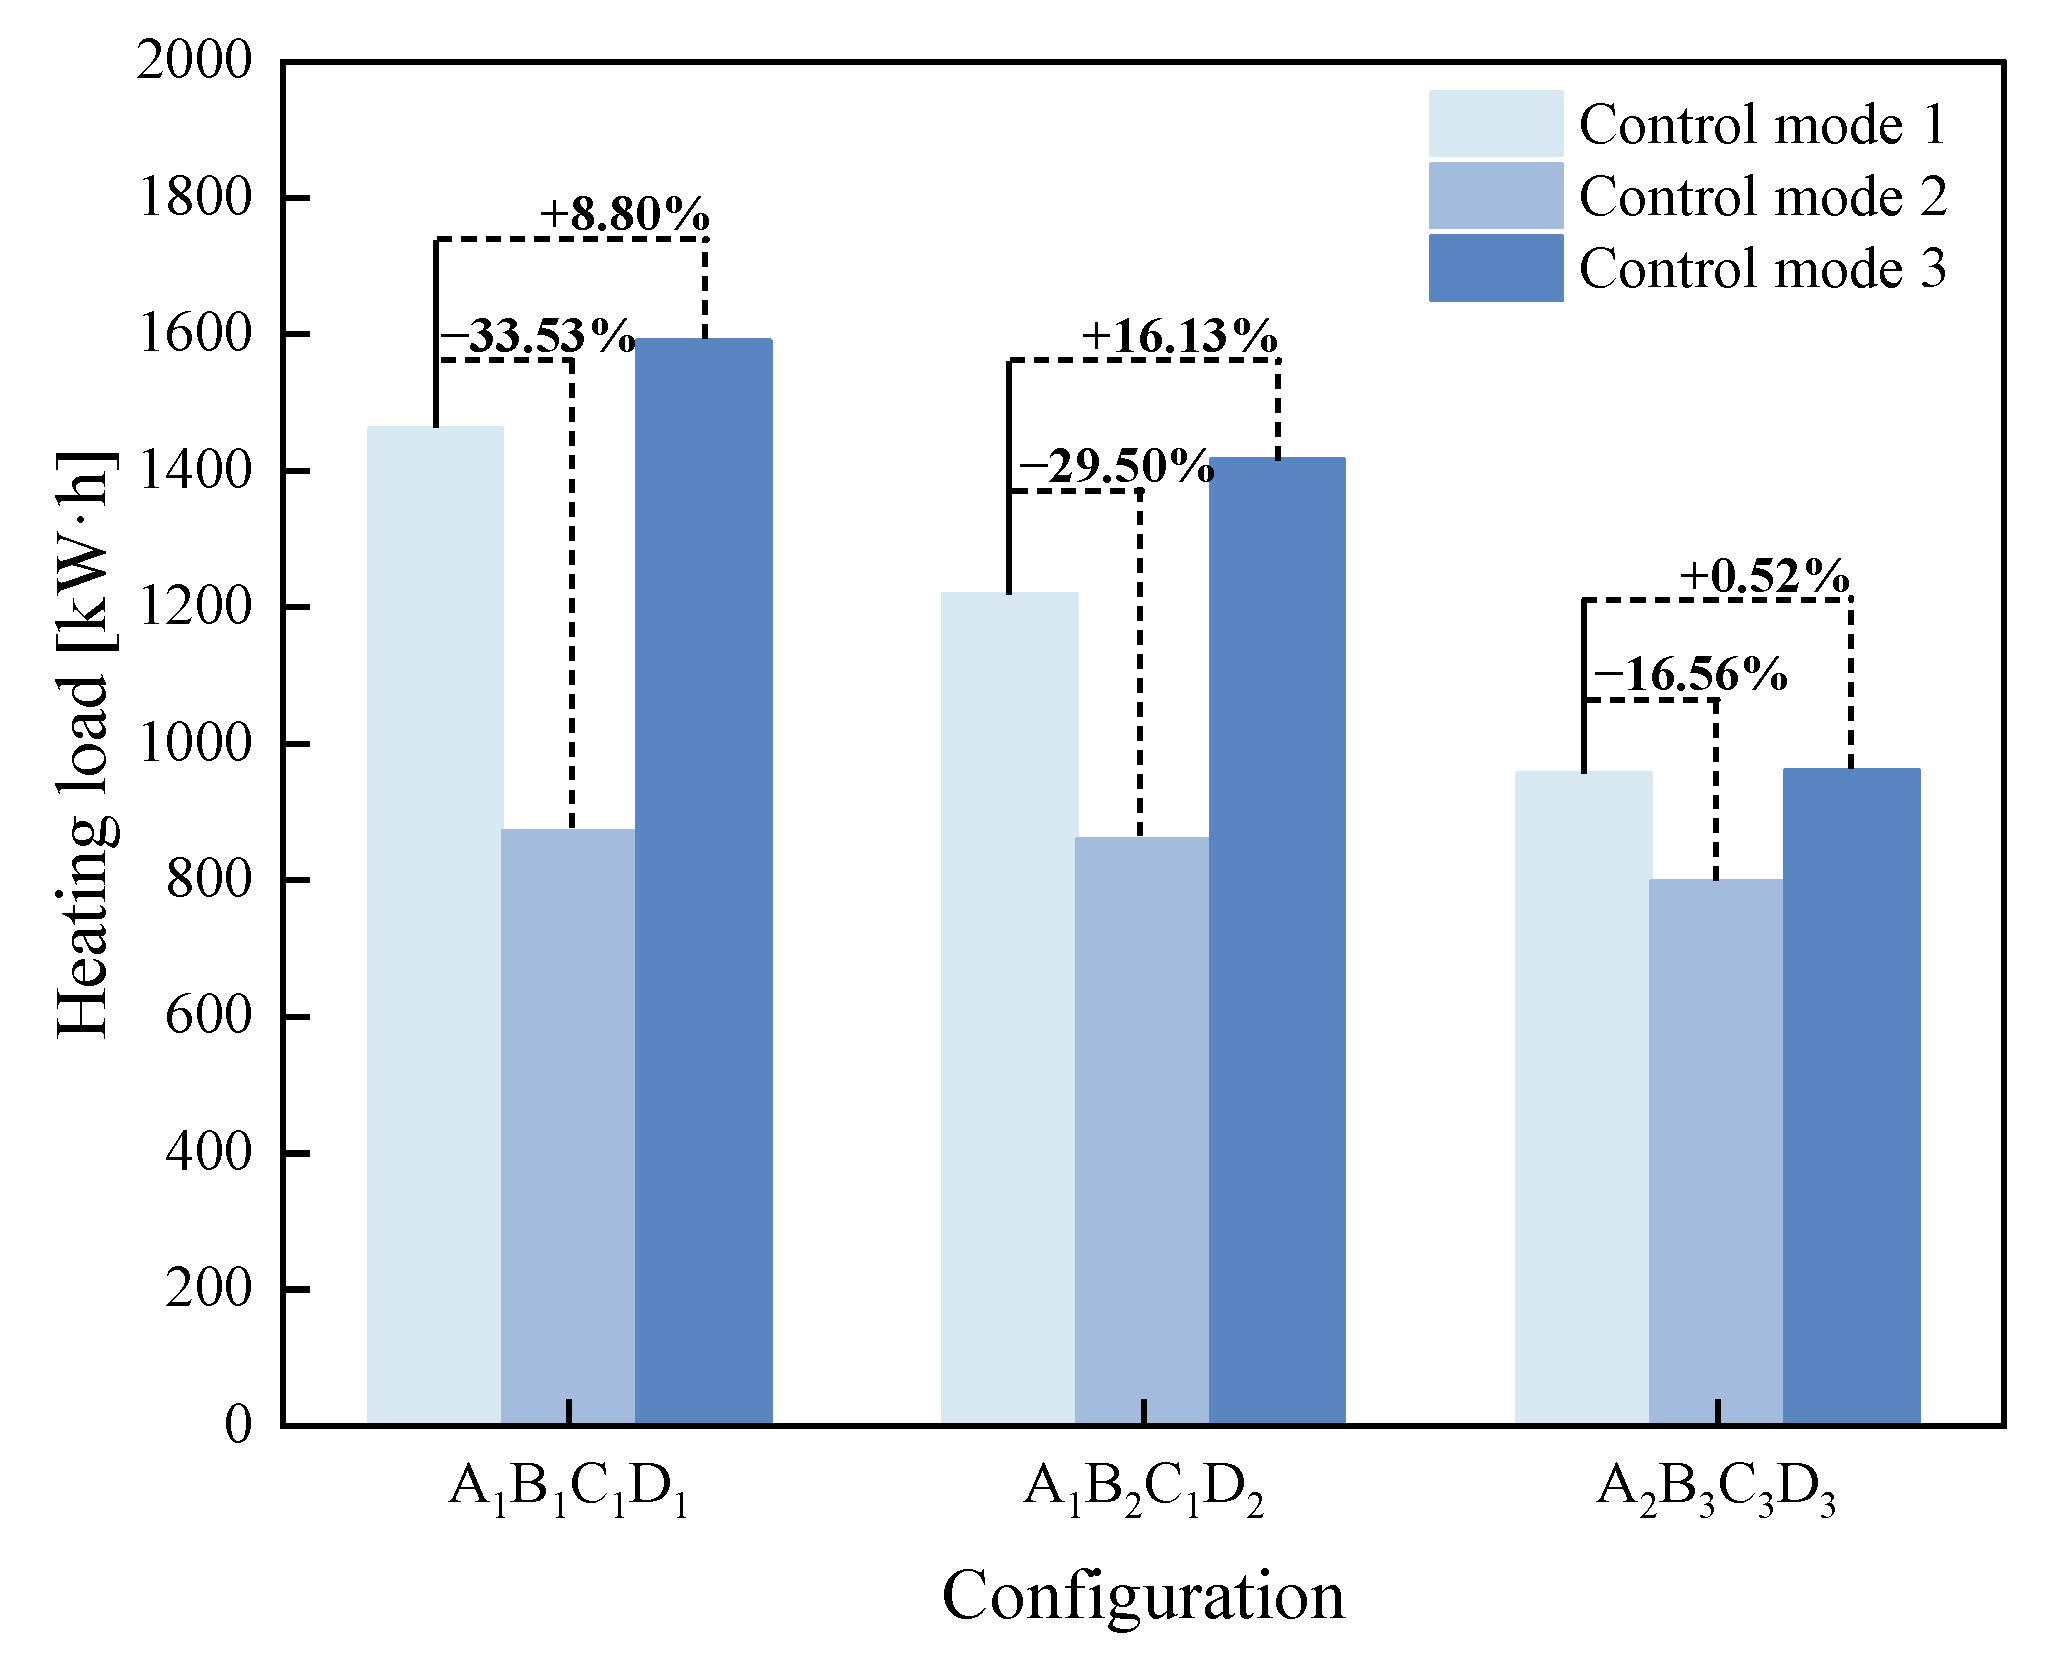
3.2.1. Comparison Within Control Modes

Figure 11 presents the results of the orthogonal experiment configurations under three control modes. Among these, Test Number 10 demonstrates the lowest heating load with the optimal level configuration of A2B3C3D3. All results are compared against Test Number 1, which serves as the baseline.
For control mode 1, the results of the ten configurations are shown in Figure 11a. The largest reduction in heating load is observed in Test Number 3 within the orthogonal experiment, with a decrease of 32.99% (1462.62 vs. 980.13). Comparing the optimal configuration, Test Number 10, to the highest heating load configuration, the reduction was 34.62% (1462.62 vs. 956.21).
For control mode 2, the results of the ten configurations are shown in Figure 11b. The maximum reduction in heating load within orthogonal experiment is observed in Test Number 4, with a decrease of 16.57% (972.18 vs. 811.07). Comparing the optimal configuration, Test Number 10, to the highest heating load configuration, the reduction was 17.93% (972.18 vs. 797.83).
For control mode 3, the results of the ten configurations are shown in Figure 11c. The largest reduction in heating load is observed in Test Number 6 within the orthogonal experiment, with a decrease of 37.33% (1591.37 vs. 997.26). Comparing Test Number 10 to the highest heating load configuration, the reduction was 39.60% (1591.37 vs. 961.17).
These results indicate that the impact of configurations on heating load is substantial. Across the different control modes, the optimal configurations reduce heating load by 34.62%, 17.93%, and 39.60%, respectively, compared to the configurations with the highest heating load. Among the control modes, the configuration changes under control mode 3 have the greatest impact on heating load, whereas those under control mode 2 have the least impact. For all three control modes, the optimal configuration is consistently A2B3C3D3, while the configuration with the highest heating load is consistently A1B1C1D1. However, for non-extreme configurations, the heating load reductions are closely tied to the control mode. The control approach in control mode 2 diminishes the influence of the PV glazing transmittance, leading to smaller variations in heating load between configurations compared to modes 1 and 3. In contrast to modes 1 and 3, control mode 2 does not exhibit a clear trend of heating load decreasing as transmittance increases.

3.2.2. Comparison Between Control Modes

This section compares three representative configurations across the control modes, as shown in Figure 12: the configuration with the highest heating load (A1B1C1D1), the experimental configuration (A1B2C1D2), and the configuration with the lowest heating load (A2B3C3D3).
The three control modes show the same trend of a gradual decrease in heating load across these configurations. However, the differences between configurations vary. Overall, configurations with lower heating loads are less influenced by the control modes. Among the three control modes, control mode 3 consistently produced the highest heating load, while control mode 2 achieved the lowest. This indicates that control mode 2 is the most optimal control mode for the PV energy-saving window. The opening of the PV glazing proves necessary, as it offers enhanced energy-saving advantages compared to modes 1 and 3, where the PV glazing remains closed. Even under the optimal configuration, the heating load in control mode 2 is reduced by 16.56% compared to control mode 1.
The higher heating load observed in control mode 3 compared to control mode 1 suggests that, under local climatic conditions, the heat exchanged between the cavity and the interior is insufficient to sustain or raise indoor temperatures over an extended period. This further confirms that poorly managed internal circulation can lead to a heating load even higher than the thermal buffer mode [18].

4. Conclusions

This study analyzed the importance of key factors of PV energy-saving window under three control modes in influencing heating load. The results demonstrate that the control mode of opening PV glazing effectively addresses the issue of reduced solar heat gain caused by PV glazing, making its application viable in heating-dominant regions. The main findings are as follows:
(1)
The degree of correlation between key factors and heating load is influenced by the control mode. When the PV glazing is not controlled and remains closed, transmittance is the most critical factor. However, in control mode 2, where PV glazing is controlled, the number of clear glazing layers proves to be the most influential factor on heating load.
(2)
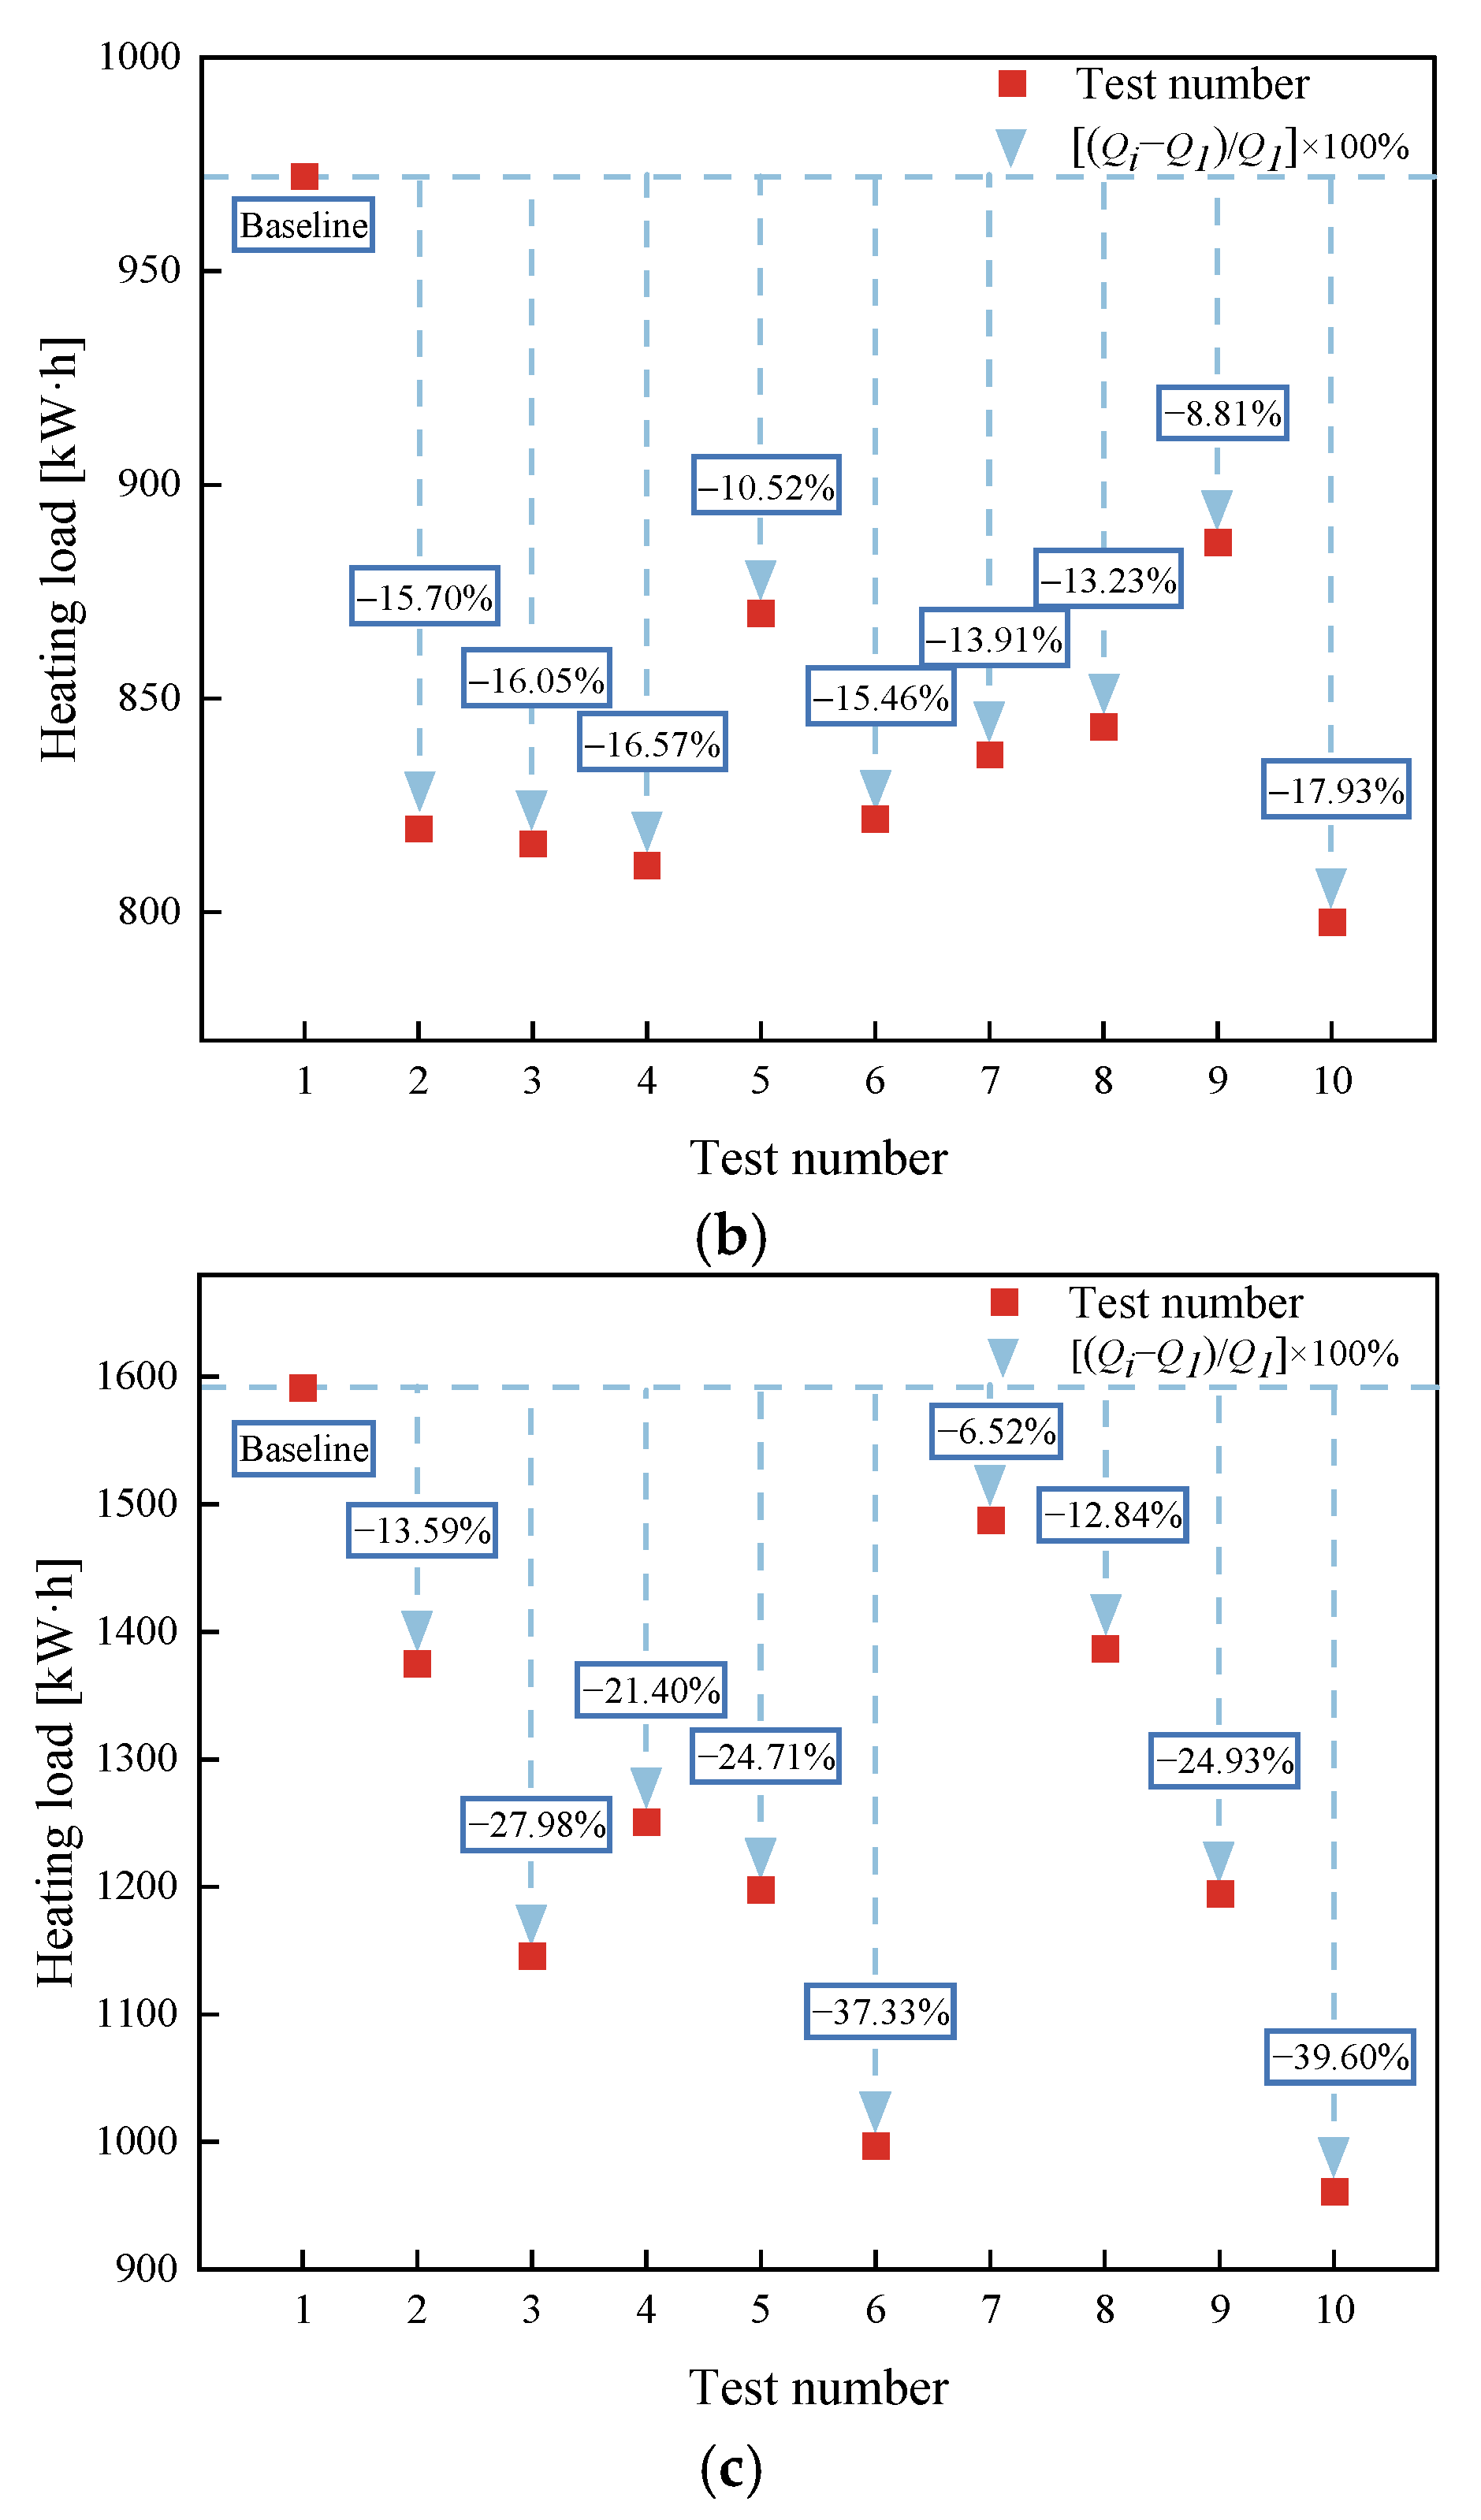
Configurations under control modes 1 and 3 have a relatively greater impact on heating load, with reductions from the highest to the lowest heating load of 34.62% and 39.60%, respectively. In contrast, the reduction is smaller in control mode 2, with a decrease of 17.93% from the highest to the lowest heating load. This suggests that an appropriate control mode can reduce heating load differences caused by configuration variations.
(3)
Among the three control modes for PV energy-saving window, control mode 2 proves to be the most optimal. Even under the optimal configuration, the heating load in control mode 2 is reduced by 16.56% compared to control mode 1. These results confirm that position-controlled operation of the PV glazing is a viable approach for reducing heating load.
This study is based on manual operation and uses time-based switching criteria for initial exploration. Future research will further refine the switching conditions and explore control mode switching across seasons. Machine learning for predictive control, combined with automated systems, will be utilized to enhance the response speed and efficiency of each layer, thereby maximizing energy-saving performance. Moreover, this paper focuses on addressing the primary issue of heating load in the application of PV glazing in heating-dominant regions. Considering the power generation potential of PV glazing, future studies will integrate power generation analysis and quantify the comprehensive energy-saving benefits that include energy production.

Author Contributions

Conceptualization, H.X.; methodology, J.W.; software, J.L.; validation, J.W. and J.L.; formal analysis, J.L.; investigation, H.X.; resources, H.X.; data curation, J.L.; writing—original draft preparation, J.L.; writing—review and editing, J.L.; visualization, J.L.; supervision, H.X. and J.W. All authors have read and agreed to the published version of the manuscript.

Funding

This research received no external funding.

Data Availability Statement

All data are contained within the article.

Conflicts of Interest

The authors declare no conflicts of interest.

Nomenclature

Abbreviation
PVphotovoltaic
DSFdouble-skin façade
SHGCsolar heat gain coefficient
BIPVbuilding-integrated photovoltaic
EPSexpanded polystyrene
CdTeCadmium Telluride
ECMWFEuropean Centre for Medium-Range Weather Forecasts
MAPEMean Absolute Percentage Error
RMSERoot Mean Square Error
TMYtypical meteorological year
NVDPVnatural ventilated double photovoltaic
Symbol
Ttemperature [K]
τtime
ρdensity [kg/m3]
Cspecific heat capacity [J/(kg·K)]
λthermal conductivity [W/(m·K)]
Φ ˙ heat generation from the internal heat source [W/m3]
hheat transfer coefficient [W/(m2·K)]
εemissivity
σStefan–Boltzmann constant, 5.67 × 10⁻⁸ [W/(m2·K4)]
μdynamic viscosity [Pa·s]
Athe area [m2]
Xangle factor
Dthickness [m]
kthermal conductivity [W/(m·K)]
Isolar radiation [W/m2]
ξabsorbance
Ueffective heat transfer coefficient [W/(m2·K)]
δPV coverage ratio
Vwind speed [m/s]
Qheating load [kW·h]
Subscript
fair temperature
ssurface temperature
surenvironmental surface temperature
poouter part glass of PV glazing
piinner part glass of PV glazing
pcphotovoltaic cells of PV glazing
cconvection heat transfer
rradiative heat transfer
gndground surface temperature

References

  1. Boehle, L.; Callioni, F.; Loyant, H.; Camarasa, C.; Gask, C.; Henriot, P.; Klimovich, K.; Kauf, N.; Kaur, S.; Laera, S.; et al. Energy Efficiency 2023; International Energy Agency: Paris, France, 2023; Available online: https://www.iea.org/reports/energy-efficiency-2023 (accessed on 18 September 2024).
  2. Available online: https://www.clearvuepv.com/project/cfmeu-wellness-centre/?utm_medium=website&utm_source=archdaily.com (accessed on 26 September 2024).
  3. Wang, M.; Peng, J.Q.; Li, N.P.; Yang, H.X.; Wang, C.L.; Li, X.; Lu, T. Comparison of energy performance between PV double skin facades and PV insulating glass units. Appl. Energy 2017, 194, 148–160. [Google Scholar] [CrossRef]
  4. Wu, Z.H.; Zhang, L.; Su, X.S.; Wu, J.; Liu, Z.B. Experimental and numerical analysis of naturally ventilated PV-DSF in a humid subtropical climate. Renew. Energy 2022, 200, 633–646. [Google Scholar] [CrossRef]
  5. Peng, J.Q.; Curcija, D.C.; Lu, L.; Selkowitz, S.E.; Yang, H.X.; Zhang, W.L. Numerical investigation of the energy saving potential of a semi-transparent photovoltaic double-skin facade in a cool-summer Mediterranean climate. Appl. Energy 2016, 165, 345–356. [Google Scholar] [CrossRef]
  6. Guo, W.W.; Kong, L.; Chow, T.T.; Li, C.Y.; Zhu, Q.Z.; Qiu, Z.Z.; Li, L.; Wang, Y.L.; Riffat, S.B. Energy performance of photovoltaic (PV) windows under typical climates of China in terms of transmittance and orientation. Energy 2020, 213, 118794. [Google Scholar] [CrossRef]
  7. Wang, C.Y.; Uddin, M.M.; Ji, J.; Yu, B.D.; Wang, J. The performance analysis of a double-skin ventilated window integrated with CdTe cells in typical climate regions. Energy Build. 2021, 241, 110922. [Google Scholar] [CrossRef]
  8. Roberts, F.; Yang, S.L.; Du, H.; Yang, R. Effect of semi-transparent a-Si PV glazing within double-skin façades on visual and energy performances under the UK climate condition. Renew. Energy 2023, 207, 601–610. [Google Scholar] [CrossRef]
  9. Xu, C.W.; Shi, X.P.; Ni, Y.H.; Su, H.; Lei, X.Y.; Kong, D.F.; Han, F.; Zhu, C.S. Comparative study of dynamic thermal performance of photovoltaic double skin façades influenced by glass transmittance and natural ventilation. Energy Build. 2023, 294, 113220. [Google Scholar] [CrossRef]
  10. Lee, C.S.; Lee, H.M.; Choi, M.J.; Yoon, J.H. Design optimization and experimental evaluation of photovoltaic double skin facade. Energy Build. 2019, 202, 109314. [Google Scholar] [CrossRef]
  11. Ioannidis, Z.; Buonomano, A.; Athienitis, A.K.; Stathopoulos, T. Modeling of double skin facades integrating photovoltaic panels and automated roller shades: Analysis of the thermal and electrical performance. Energy Build. 2017, 154, 618–632. [Google Scholar] [CrossRef]
  12. Su, X.S.; Zhang, L.; Luo, Y.Q.; Liu, Z.B. Energy performance of a reversible window integrated with photovoltaic blinds in Harbin. Build. Environ. 2022, 213, 108861. [Google Scholar] [CrossRef]
  13. Su, X.S.; Zhang, L.; Luo, Y.Q.; Liu, Z.B.; Yang, H.X.; Wang, X.C. Conceptualization and preliminary analysis of a novel reversible photovoltaic window. Energy Conv. Manag. 2021, 250, 114925. [Google Scholar] [CrossRef]
  14. Luo, Y.Q.; Zhang, L.; Liu, Z.B.; Xie, L.; Wang, X.L.; Wu, J. Experimental study and performance evaluation of a PV-blind embedded double skin façade in winter season. Energy 2018, 165, 326–342. [Google Scholar] [CrossRef]
  15. Yang, S.L.; Cannavale, A.; Carlo, A.D.; Prasad, D.; Sproul, A.; Fiorito, F. Performance assessment of BIPV/T double-skin façade for various climate zones in Australia: Effects on energy consumption. Sol. Energy 2020, 199, 377–399. [Google Scholar] [CrossRef]
  16. Peng, J.Q.; Lu, L.; Yang, H.X.; Ma, T. Comparative study of the thermal and power performances of a semi-transparent photovoltaic façade under different ventilation modes. Appl. Energy 2015, 138, 572–583. [Google Scholar] [CrossRef]
  17. Liu, X.J.; Yang, H.T.; Wang, C.J.; Shen, C.; Bo, R.; Hinkle, L.; Wang, J.L. Semi-experimental investigation on the energy performance of photovoltaic double skin façade with different façade materials. Energy 2024, 295, 131049. [Google Scholar] [CrossRef]
  18. Liu, X.J.; Shen, C.; Bo, R.; Wang, J.L.; Ardabili, N.G. Experimental investigation on the operation performance of photovoltaic double skin façade in winter. Energy 2023, 283, 129040. [Google Scholar] [CrossRef]
  19. Yang, S.L.; Fiorito, F.; Prasad, D.; Sproul, A.; Cannavale, A. A sensitivity analysis of design parameters of BIPV/T-DSF in relation to building energy and thermal comfort performances. J. Build. Eng. 2021, 41, 102426. [Google Scholar] [CrossRef]
  20. Yang, S.L.; Cannavale, A.; Prasad, D.; Sproul, A.; Fiorito, F. Numerical simulation study of BIPV/T double-skin facade for various climate zones in Australia: Effects on indoor thermal comfort. Build. Simul. 2019, 12, 51–67. [Google Scholar] [CrossRef]
  21. Yang, S.L.; Fiorito, F.; Sproul, A.; Prasad, D. Optimising Design Parameters of a Building-Integrated Photovoltaic Double-Skin Facade in Different Climate Zones in Australia. Buildings 2023, 13, 1096. [Google Scholar] [CrossRef]
  22. Sharma, M.K.; Preet, S.; Mathur, J.; Chowdhury, A.; Mathur, S. Parametric analysis of factors affecting thermal performance of photovoltaic triple skin façade system (PV-TSF). J. Build. Eng. 2021, 40, 102344. [Google Scholar] [CrossRef]
  23. Wang, C.Y.; Ji, J.; Uddin, M.M.; Yu, B.D.; Song, Z.Y. The study of a double-skin ventilated window integrated with CdTe cells in a rural building. Energy 2021, 215, 119043. [Google Scholar] [CrossRef]
  24. Barman, S.; Chowdhury, A.; Mathur, S.; Mathur, J. Assessment of the efficiency of window integrated CdTe based semi-transparent photovoltaic module. Sustain. Cities Soc. 2018, 37, 250–262. [Google Scholar] [CrossRef]
  25. Preet, S.; Sharma, M.K.; Mathur, J.; Chowdhury, A.; Mathur, S. Performance evaluation of photovoltaic double-skin facade with forced ventilation in the composite climate. J. Build. Eng. 2020, 32, 101733. [Google Scholar] [CrossRef]
  26. Khalvati, F.; Omidvar, A. Summer study on thermal performance of an exhausting airflow window in evaporatively-cooled buildings. Appl. Therm. Eng. 2019, 153, 147–158. [Google Scholar] [CrossRef]
  27. European Centre for Medium-Range Weather Forecasts. Available online: https://www.ecmwf.int/ (accessed on 15 April 2024).
  28. EnergyPlus Weather Search. Available online: https://energyplus.net/weather-search/Changchun (accessed on 11 June 2024).
  29. Hwang, R.L.; Lin, T.P.; Liang, H.H.; Yang, K.H.; Yeh, T.C. Additive model for thermal comfort generated by matrix experiment using orthogonal array. Build. Environ. 2009, 44, 1730–1739. [Google Scholar] [CrossRef]
  30. Shao, N.; Zhang, J.L.; Ma, L.D. Analysis on indoor thermal environment and optimization on design parameters of rural Residence. J. Build. Eng. 2017, 12, 229–238. [Google Scholar] [CrossRef]
  31. Gong, G.C.; Xu, C.W.; Jiao, J.J.; Liu, Y.K.; Xie, S.N. Investigation of moisture condensation on papermaking plant envelopes in high humidity environment by orthogonal analysis and CFD simulation. Build. Environ. 2011, 46, 1639–1648. [Google Scholar] [CrossRef]
  32. Zhao, S.G.; Hai, G.; Zhang, X. An Analysis of the Influence of Cool Roof Thermal Parameters on Building Energy Consumption Based on Orthogonal Design. Buildings 2024, 14, 28. [Google Scholar] [CrossRef]
Figure 1. Flowchart of methodology for this study.
Buildings 15 00238 g001
Figure 2. Structure of PV energy-saving window: (a) closing conditions of each layer; (b) opening conditions of each layer.
Buildings 15 00238 g002
Figure 3. Three types of control modes: (a) control mode 1; (b) control mode 2; (c) control mode 3.
Buildings 15 00238 g003
Figure 4. Outside view and inside view of PV energy-saving window and double-pane clear glazing: (a) outside view of PV energy-saving window; (b) inside view of PV energy-saving window; (c) inside view of double-pane clear glazing.
Buildings 15 00238 g004
Figure 5. Comparison of heating load between test group and control group.
Buildings 15 00238 g005
Figure 6. Schematic diagram of the building: (a) south elevation of the building; (b) north elevation of the building.
Buildings 15 00238 g006
Figure 7. Weather conditions during heating period.
Buildings 15 00238 g007
Figure 8. Average hourly solar radiation from December to February.
Buildings 15 00238 g008
Figure 9. Model validation: (a) weather conditions; (b) simulated and tested heating load.
Buildings 15 00238 g009
Figure 10. Correlation coefficient heat map of key factors under three control modes.
Buildings 15 00238 g010
Figure 11. Results of orthogonal experiments for configurations: (a) control mode 1; (b) control mode 2; (c) control mode 3.
Buildings 15 00238 g011aBuildings 15 00238 g011b
Figure 12. Influence of configuration on heating load in three control modes.
Buildings 15 00238 g012
Table 1. Physical properties of building construction materials.
MaterialDensity
[kg/m3]
Thermal
Conductivity
[W/(m·K)]
Specific Heat
[J/(kg·K)]
Brick18000.8101050
EPS200.0391380
Glass25001.000840
Table 2. Structural parameters of PV energy-saving window.
ParametersData
External layer: Cadmium Telluride (CdTe) PV glazing
Glazing typeSingle-pane
Visible transmittance20%
Thickness7 mm
Maximum power73.84 W
Voltage at the maximum power point (Vmp)86.37 V
Current at the maximum power point (Imp)0.85 A
Open Circuit Voltage (Voc)116.00 V
Short Circuit Current (Isc)0.97 A
Temperature coefficient−0.214%/°C
Efficiency10.25%
Air cavity between PV glazing and shutter
Thickness270 mm
Middle layer: insulated shutter
MaterialPolyurethane foam
Conductivity0.024 [W/(m·K)]
Thickness5 mm
Air cavity between clear glazing and shutter
Thickness100 mm
Internal layer: clear glazing
Glazing typeDouble-pane
Thickness24 mm
Frameplastic steel window frame
Window system frameWooden
Table 3. Orthogonal experiment table of factors and levels.
LevelFactor AFactor B [%]Factor C [m]Factor D
1Single-pane100.005Single-pane
2Double-pane200.025Double-pane
3 400.045Triple-pane
Table 4. Orthogonal array L9(34) and results of 3 control modes.
Test NumberFactor AFactor BFactor CFactor DHeating Load of Control Mode 1 [kW·h]Heating Load of Control Mode 2 [kW·h]Heating Load of Control Mode 3 [kW·h]
111111462.62972.181591.37
212321178.88819.581375.12
31323980.13816.131146.05
421331197.52811.071250.79
522211186.08869.941198.07
62312988.07821.88997.26
711221273.34836.951487.61
812131173.38843.521387.05
913311097.00886.531194.69
10 (Optimal level)2333956.21797.83961.173
Disclaimer/Publisher’s Note: The statements, opinions and data contained in all publications are solely those of the individual author(s) and contributor(s) and not of MDPI and/or the editor(s). MDPI and/or the editor(s) disclaim responsibility for any injury to people or property resulting from any ideas, methods, instructions or products referred to in the content.

