Article

Evaluating the Performance of Fixed 3D-Printed and Dynamic Fabric Modules in a Second-Skin Façade System: A Residential Case Study in Southern Italy at Building and District Scales

Department of Architecture and Industrial Design, University of Campania Luigi Vanvitelli, 81031 Aversa (CE), Italy
*
Authors to whom correspondence should be addressed.
Buildings 2025, 15(2), 189; https://doi.org/10.3390/buildings15020189
Submission received: 3 December 2024 / Revised: 6 January 2025 / Accepted: 8 January 2025 / Published: 10 January 2025
(This article belongs to the Section Building Energy, Physics, Environment, and Systems)

Abstract

The building sector accounts for 30% of worldwide final energy usage and 26% of global energy-linked emissions. In construction, innovative materials and systems can offer flexible, lightweight, energy-efficient solutions to achieve more efficient buildings. This study addresses the energy analysis and environmental impacts of retrofitting residential buildings in Monterusciello, Italy, using an innovative second-skin façade system design that incorporates 3D-printed and fabric modules. The purpose is to enhance energy efficiency and reduce the environmental impact of residential buildings originally constructed with prefabricated elements that have degraded over time. This research employed TRNSYS modelling to simulate energy consumption and environmental impacts at the single-building and whole-district levels, analysing the system’s effectiveness in reducing cooling and heating demands and using different materials for optimal performance. The results show that retrofitting with the second-skin façade system significantly reduces cooling energy demand by 30.2% and thermal energy demand by 3.84%, reaching a primary energy saving of 16.4% and 285 tons of CO2 emissions reduction for the whole district. The results highlight the potential of second-skin façade systems in improving energy efficiency and environmental sustainability, suggesting future research directions in material innovation and adaptive system development for district-wide applications.

1. Introduction

According to data from the International Energy Agency (IEA), energy consumption in Europe decreased by approximately 5.0% between 2005 and 2021, the last available year [1,2]. However, between the years 2020 and 2021, there has been a growth of approximately 5.9%; this trend is attributable to population expansion and a rise in the standard of life, on the other hand. Analysing in more detail the energy consumption sector by sector, it can be noticed how the energy consumption associated with residential, commercial, and public services increased by about 2.9% from 2005 to 2010; then, since 2015, improved building envelope performance due to European Union (EU) policies has resulted in a 2.0% decrease in energy consumption when comparing data from 2010 to 2021 [2,3]. This slow reduction is mainly due to the following: (i) only 3% of buildings in the EU have an efficient building envelope, (ii) only 1% of the EU’s buildings are renovated every year, and (iii) about 75% of EU buildings were built before 2000 and have poor energy performance [4]. Moreover, despite a shift towards electricity and renewables, fossil fuel use in buildings has grown at an average rate of 0.5% per year since 2010. However, the goal of the Net Zero Emissions (NZE) Scenario still stands, requiring a 25% reduction in buildings’ energy consumption and a 40% decrease in fossil fuel use by 2030 [5,6]. Indeed, in 2023, to improve the energy performance of buildings, the EU has established a legislative framework that includes the revised Energy Performance of Buildings Directive (EU/2010/31) and Energy Efficiency Directive (EU/2023/1791). These European Directives aim to improve energy performance in renovated buildings to achieve a fully decarbonised building stock by 2050, with a crucial recommendation to establish one-stop shops that can provide comprehensive services for deep retrofit and weatherisation of existing buildings [4]. This will help simplify the process and make it more convenient for building owners to access the necessary resources and expertise to improve their properties’ energy efficiency and sustainability. Other than the EU, all the world’s major economies are enhancing energy performance standards for buildings. China implemented energy efficiency codes for new and renovated buildings, and the ASHRAE has published zero net energy and carbon standards in the US [5,6]. Also, countries like Turkey, India, Japan, and Australia have tightened regulations to improve energy efficiency in buildings [7,8,9,10]. These arguments define the critical role of the building sector in the global transition toward a more clean and efficient future [3]. Over the years, the construction industry and building research have overcome significant challenges in identifying more efficient and sustainable solutions [11,12,13,14,15,16,17,18,19,20,21]. Several systems have been proposed to improve their energy efficiency, indoor comfort, and sustainability, with a particular interest in improving the building’s envelope and façade systems due to the holistic influence on buildings’ energy performance and design [11,12,13,14,15,16,17,18,19,20,21]. As reported in [22], high-performing building envelopes are the most effective way to reduce energy consumption in buildings. Three main subject areas are identified as the most relevant [16]: material innovation, development of adaptive systems, and design of district-level renovations. Indeed, advancements in materials are fundamental in reducing current construction constraints, while the rise of adaptive building envelope systems and control technologies are enhancing buildings’ energy performance and resilience to climate change. Coordinated multi-building renovations could amplify the impact of these actions to accelerate the process and reduce costs, exemplified by programs like Energiesprong [23] in Europe and REHOUSE Project [24] in Italy.
The aim of this study is to investigate integrating two distinct innovative module types, one constructed from 3D-printed polymer and the other from textile fabric, into a unified dynamic Second-Skin Façade (SSF) system from energy and environmental points of view through numerical simulations. In particular, the proposed dynamic SSF system serves as a retrofit solution for existing residential buildings in the public housing district of Monterusciello in southern Italy.
In the following sub-sections, a brief review of these innovative systems and materials for building envelopes is carried out (Section 1.1), and the distinctive aspects of the research and its objectives are outlined comprehensively (Section 1.2).

1.1. Literature Review

Over the past two decades, numerous energy-efficient strategies have been explored to enhance the energy performance of building envelopes by incorporating additional external insulation layers, adaptive façade elements, or second-skin layers [16]. These solutions can be classified as passive refurbishment, which entails a retrofit step that lessens energy lost through the building envelope while also increasing thermal resistance and lowering energy demand. This is a widespread technique to improve a building’s energy efficiency [25,26]. Additionally, passive retrofit procedures are typically less intrusive and enable repairs without altering the structure of old or protected buildings [27]. One of the most effective passive strategies to cut energy use is the installation of a second skin layer on the existing façade [16]; in particular, on the traditional façade, an air cavity and an external skin are added. Well-designed SSF systems provide multiple environmental and economic advantages, including reduced heating and cooling demands, lower energy consumption, improved thermal comfort, enhanced daylighting and glare control, better acoustic insulation, improved building aesthetics, and lower operating costs [16]. The next generation of building envelope materials, textiles (whether they be fibre-reinforced composites, fabric- or foil-membrane materials), offer possibilities for the expression of lightness and controlled transparency and satisfy modern aesthetics of intelligence, sustainability, and complexity [16]. Also, polymers have become popular in building and engineering due to their ease of production, installation, durability, low maintenance requirements, lightweight nature, and ability to be formed into complex shapes [16]. Many studies [28,29,30,31,32,33,34,35,36,37,38] have addressed the use of flexible and lightweight materials and design solutions in the building envelope, utilising a modular design. The next subsections report a brief analysis of these studies.

1.1.1. Textile Solutions

Several studies investigated textile solutions (ETFE, Glass-PTFE fabric, Polypropylene fabric, PVC-coated polyester fabric, etc.), evaluating their optical, thermal, energy, and environmental performances [28,29,30,31,32,33,34]. Indeed, different studies [28,32,33,34] have focused on improving building energy efficiency through façade technologies, such as Second-Skin Façades (SSFs) and Double-Skin Façades (DSFs), with a specific aim of reducing energy consumption for cooling and heating. They also assessed the environmental impact by evaluating CO2 emissions reduction. Additionally, these studies highlighted the importance of enhancing indoor thermal comfort by managing heat gain and improving temperature regulation. The studies in [28,32,33,34] highlighted the need to optimise façade systems based on varying environmental conditions (e.g., solar radiation, wind) to maximise performance. Numerical simulations were employed in each case to predict performance and validate the effectiveness of these energy-saving systems. A study on an Iranian case explored strategies to reduce peak summer electricity loads driven by cooling systems. The researchers developed and tested a Double-Skin Façade (DSF) integrated with a double-glazed window for a sun-exposed office space. Based on experimental data and validated numerical simulations, the system reduced air conditioning inlet temperatures by 4–6 °C, resulting in daily energy savings of 0.27–0.42 kWh m−2. If implemented on a larger scale, this approach could lower national electricity consumption by 4.28 TWh during the hot season, offering significant environmental benefits. Scorpio et al. [32] analysed semi-transparent modules for Double-Skin Façades, focusing on material type, cavity depth, and transparency using TRNSYS 17 v17.02.003 and Radiance v5.2 software. The results showed that these new modules significantly improve energy efficiency and indoor environmental quality compared to standard façades. The study found that performance and optimal design depend on boundary conditions and the thermal and visual properties of the materials used. In previous studies [28,33,34], the authors investigated the use of an SSF system with the PVC-coated polyester fabric, a tensile material, as the second-skin layer in office buildings, using the TRNSYS simulation software. The researchers investigated the performance of this material upon varying the building orientation and the control logic of the dynamic shading system. The results demonstrated that the proposed material provided energy and environmental benefits across various climates, including those of Italy (with a reduction of the primary energy consumption up to 9.1%) [28], Iran (up to a primary energy saving of 13.6%) [33], and Norway (for a primary energy consumption up to 35.0%) [34]. In [29], the researchers investigated the thermal impact of large-span reticulated domes covered by ETFE membrane or glass roof through long-term monitoring and numerical analysis to investigate thermal stress and thermal deformation on the structures. They carried out field monitoring and numerical analysis. The results highlighted that (i) introducing a membrane can significantly reduce daily temperature variation, (ii) the average temperature of components increases due to the membrane’s greenhouse effect, and (iii) the axial stress change caused by seasonal temperature difference was within 20 MPa. This paper [30] examined the potential of a pneumatic multilayer foil construction with a kinetic shading mechanism, specifically, a switchable ETFE foil cushion, to improve building energy efficiency by responding to dynamic climatic factors like solar radiation. Using ray-tracing techniques, the study analysed the optical performance of the ETFE cushion in different configurations and its impact on heating, cooling, and lighting energy consumption. Simulations showed an angle-dependent optical behaviour and highlighted that the adaptive shading system significantly reduces cooling and heating loads compared to conventional glazing, with potential energy savings of up to 44.9%. The study emphasises the importance of design and environmental factors in optimising building energy performance with switchable ETFE foil cushions. Karimi et al. [31] explored the potential of lightweight polypropylene nonwoven fabrics for building applications, focusing on how their structure influences thermal insulation and acoustic absorption. Polypropylene fibres with two linear densities (1.4 and 1.8 dtex) were used to produce 31 nonwoven samples with varying thicknesses, porosities, and fibre orientations. Thermal conductivity and sound absorption were measured, showing that finer fibres provided better acoustic and thermal performance. Increased through-plane fibre orientation negatively impacted thermal insulation but had a variable effect on acoustic absorption based on porosity and sound frequency. In-plane fibre orientation had little effect on thermal insulation and sound absorption, except at high frequencies (4000–6300 Hz). The best performance was achieved by 1.4 dtex fibres with 3 cm and 4 cm thickness, outperforming commercial products in both thermal and acoustic properties.

1.1.2. 3D-Printed Solutions

Numerous studies examined 3D-printed solutions, mainly focused on design matters [35,36,37,38]. In particular, [35] explored the integration of construction 3D printing (C3DP) with building energy modelling (BEM) to address energy performance, a neglected aspect in the automation of the construction industry. The research developed a BIM-to-BEM workflow and evaluated it using various scenarios, including different climate zones, wall configurations, and curved wall designs specific to 3D-printed buildings. The paper found that typical 3D-printed wall systems failed to meet energy code requirements, particularly in cold climates. However, a well-designed, all-electric 3D-printed residential building could reduce energy use by 26% and CO2 emissions by 6.35 tons compared to uninsulated 3D-printed buildings. Na et al. [36] studied the potential of using 3D-printed elements in a smart node system for curtain walls with complex shapes. They described how they used 3D printing to create the formworks for casting 647 different nodes of a freeform structure. The formworks were 3D-printed to accurately create the shapes of the nodes according to the parametric software’s specifications, which led to decreased production times, weights, and construction errors while enhancing the aesthetic appeal of the final products. No experimental test or numerical analysis was performed in the research to evaluate the potential benefits of using the proposed solution for a free-form façade. In [37], the development of a PLA 3D-printed multifunctional adaptive façade panel designed to regulate heat exchange between indoor and outdoor environments was explored. The developed panel features a high thermal resistance inner core and two outer layers that circulate water to absorb and release heat from solar or indoor sources. The goal was to create a lightweight, recyclable component; however, the paper did not report experimental or simulation analyses on the thermal and energy performance of the developed panel. In a previous work [38], the authors discussed the increasing use of polymeric materials in architecture. They investigated the performance of extruded Acrylonitrile-Butadiene-Styrene (ABS) panels as second-skin layers in ventilated façade systems. Experimental tests showed that ABS panels could perform similarly to conventional materials. In addition, they developed a numerical model to further examine the thermal performance of plastic and composite polymer panels, with a root mean square error of less than 0.40 °C, confirming its reliability. The model was applied to eight refurbishment case studies of an office building in Italy upon varying the polymer and the manufacturing technology (extruded or 3D-printed panels). The simulation results revealed low reductions in thermal and cooling energy demand (up to 6.9% and 3.1%) and non-renewable primary energy consumption (up to 2.6%) compared to a reference case.

1.2. Research Novelty and Goals

The literature review presented in the previous subsections highlighted that several works were carried out; however, no one investigated the SSF system realised with a combination of components (panels, modules, or nodes) realised with different materials (3D printed and textile fabric). Indeed, while fabric materials are widely investigated from energy, thermal, optical, and acoustic points of view, 3D-printed materials are often investigated from design and structural points of view, leaving a research gap on the thermo–physic aspects that directly affect heating, cooling, and overall energy consumption, thus playing a critical role in the design of energy-efficient buildings. Moreover, the presented literature review highlighted that office buildings were usually investigated, neglecting residential buildings, particularly public housing apartments, a building typology that has been very common in Italy since the middle of the XX century and is usually realised with very basic construction technologies [39].
As strongpoints, the review highlighted that textile materials perform well in dynamic scenarios, where their lightness and flexibility can be exploited to develop systems that can react quickly to external stimuli while also preserving the see-through quality, thus keeping a visual relationship between the indoor and outdoor environment; on the other hand, the 3D-printed technology allows to develop highly customised parts, offering high personalisation on both the technical (e.g., thermal and structural performances) and aesthetic sides, making it suitable in residential context where the sense of identity should be preserved and emphasised [16].
The authors have already investigated textile and 3D-printed materials in previous research [28,32,33,34,38,40]. However, a key distinction in this study is integrating two different materials, fixed 3D-printed and dynamic fabric modules, in a single SSF system. While previous research primarily focused on using either one material or technology (such as ETFE, PVC-coated fabrics, or traditional DSF), this work explores the novel combination of these materials. The implementation of a dual-material approach has the potential to enhance adaptability to various environmental conditions. Therefore, several case studies have been modelled to evaluate the performance of different polymers for the 3D-printed modules in combination with the same textile fabric from energy and environmental points of view across a whole year by means of the dynamic simulation software TRNSYS 18 [41].
Finally, the retrofit has been extended to a selected district area comprising 82 residential buildings to evaluate the energy and environmental benefits of a broader intervention.
Therefore, the aims of this work can be summarised as follows:
  • To assess the potential energy saving and CO2 reduction achievable in residential building refurbishment using a combination of 3D-printed and fabric-based modules as an SSF system by means of dynamic numerical simulation;
  • To evaluate the impacts on an extended residential area, taking into account the interrelations between buildings and urban morphology;
  • To explore and discuss the potential economic and social effects on the involved communities and provide suggestions and solutions for strengthening existing policies and implementing new ones.

2. Materials and Methods

This section presents a comprehensive description of the study object, along with the methodology employed in conducting the numerical analysis. It begins with a historical and technical overview of the Monterusciello district (Section 2.1), followed by the modelling and characterisation of the chosen building typology and a specific area within the district (Section 2.2). Lastly, Section 2.3 outlines the energy and environmental analysis methodology utilised to compare the reference cases with the retrofitted counterparts at both the individual building level and the district–area level.

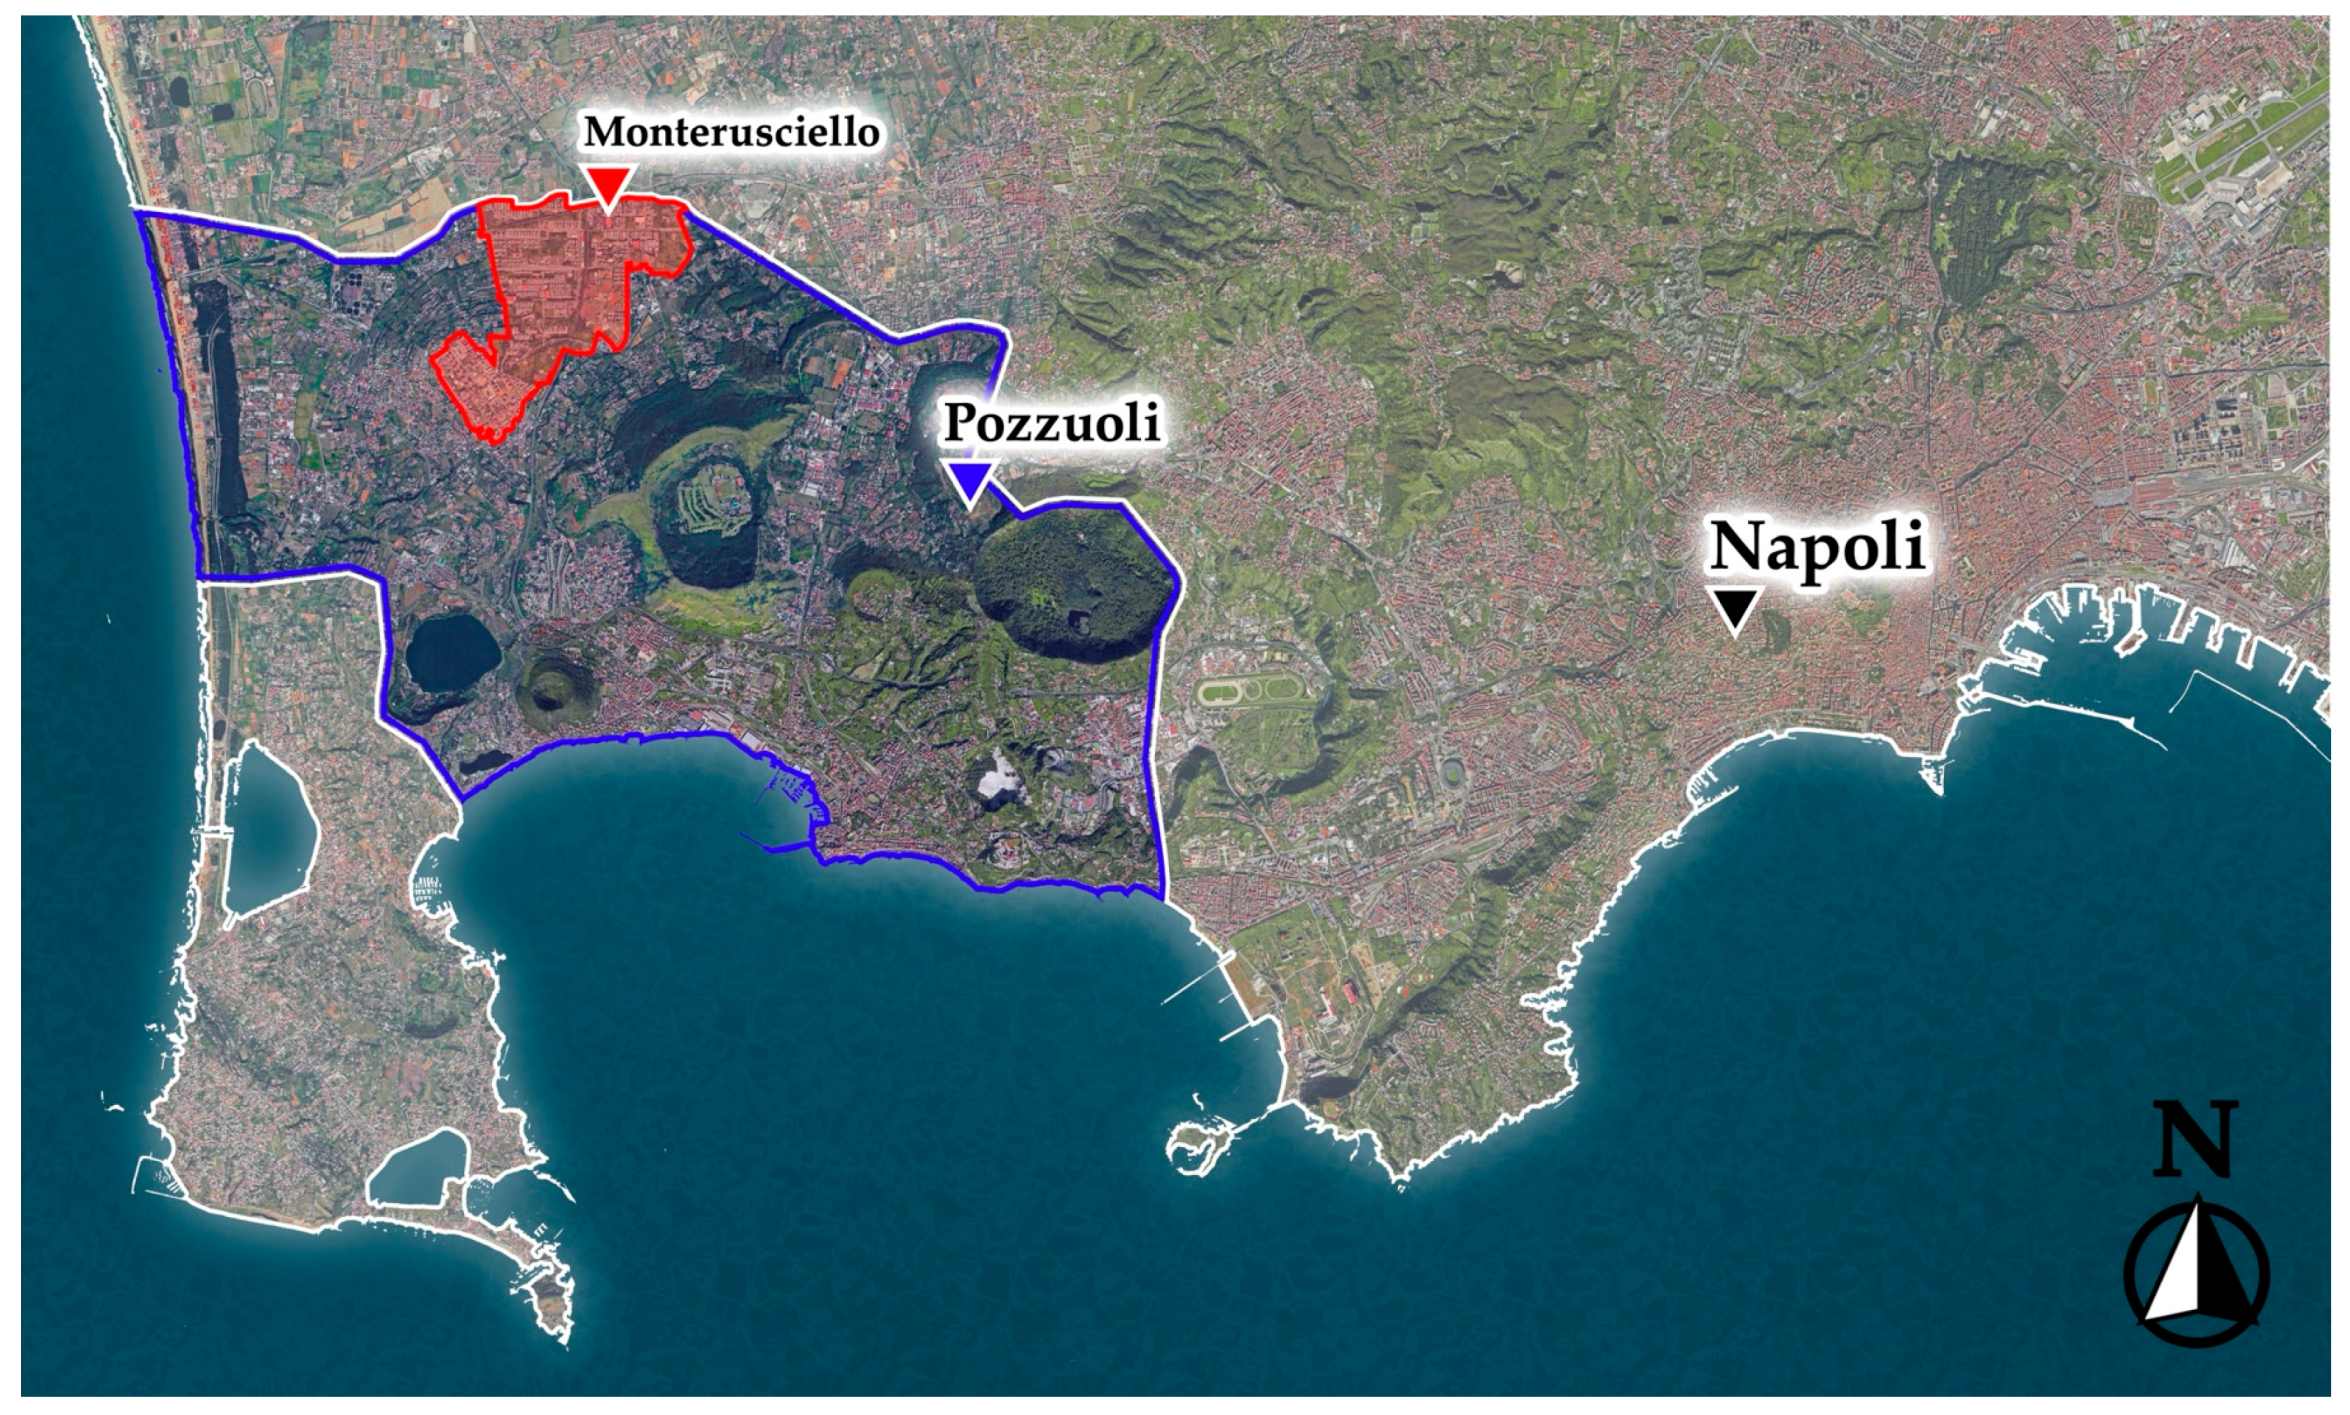
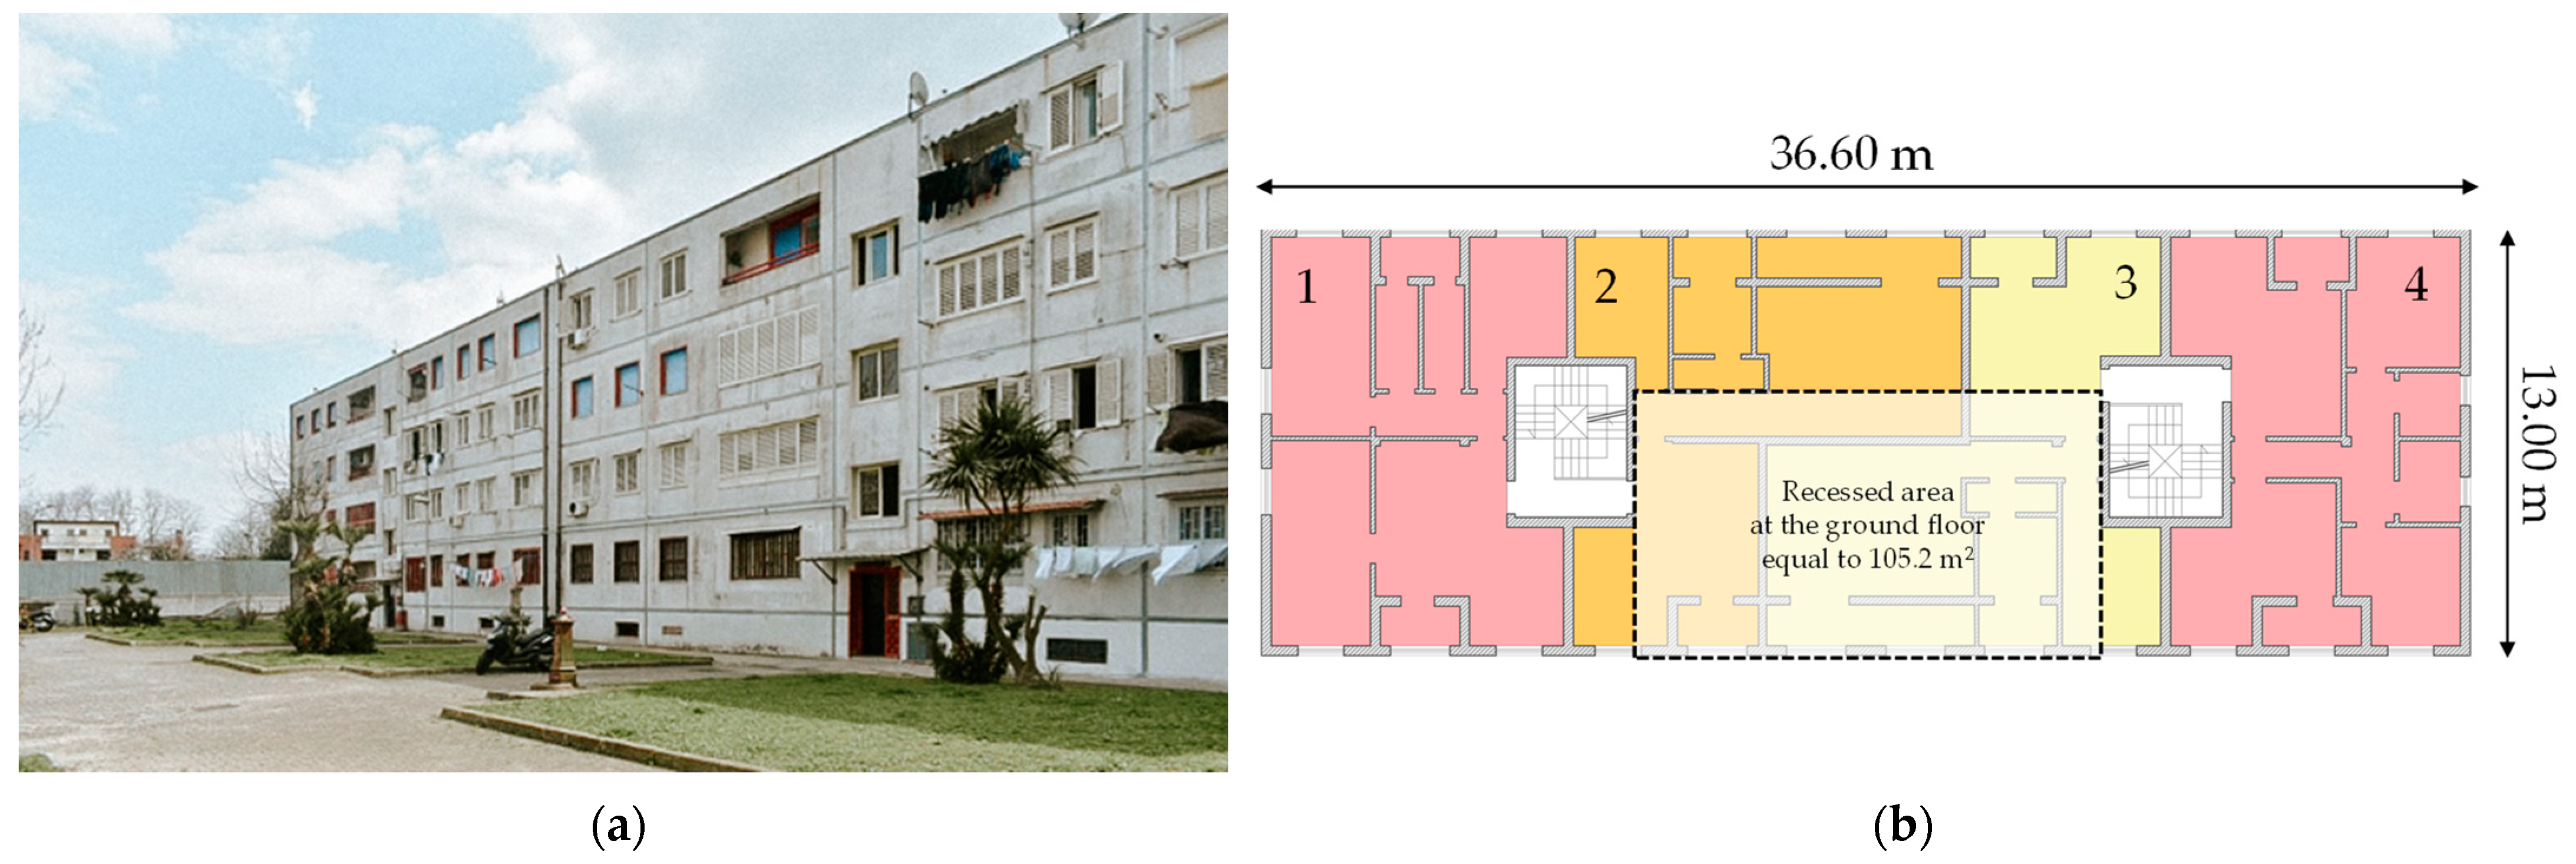
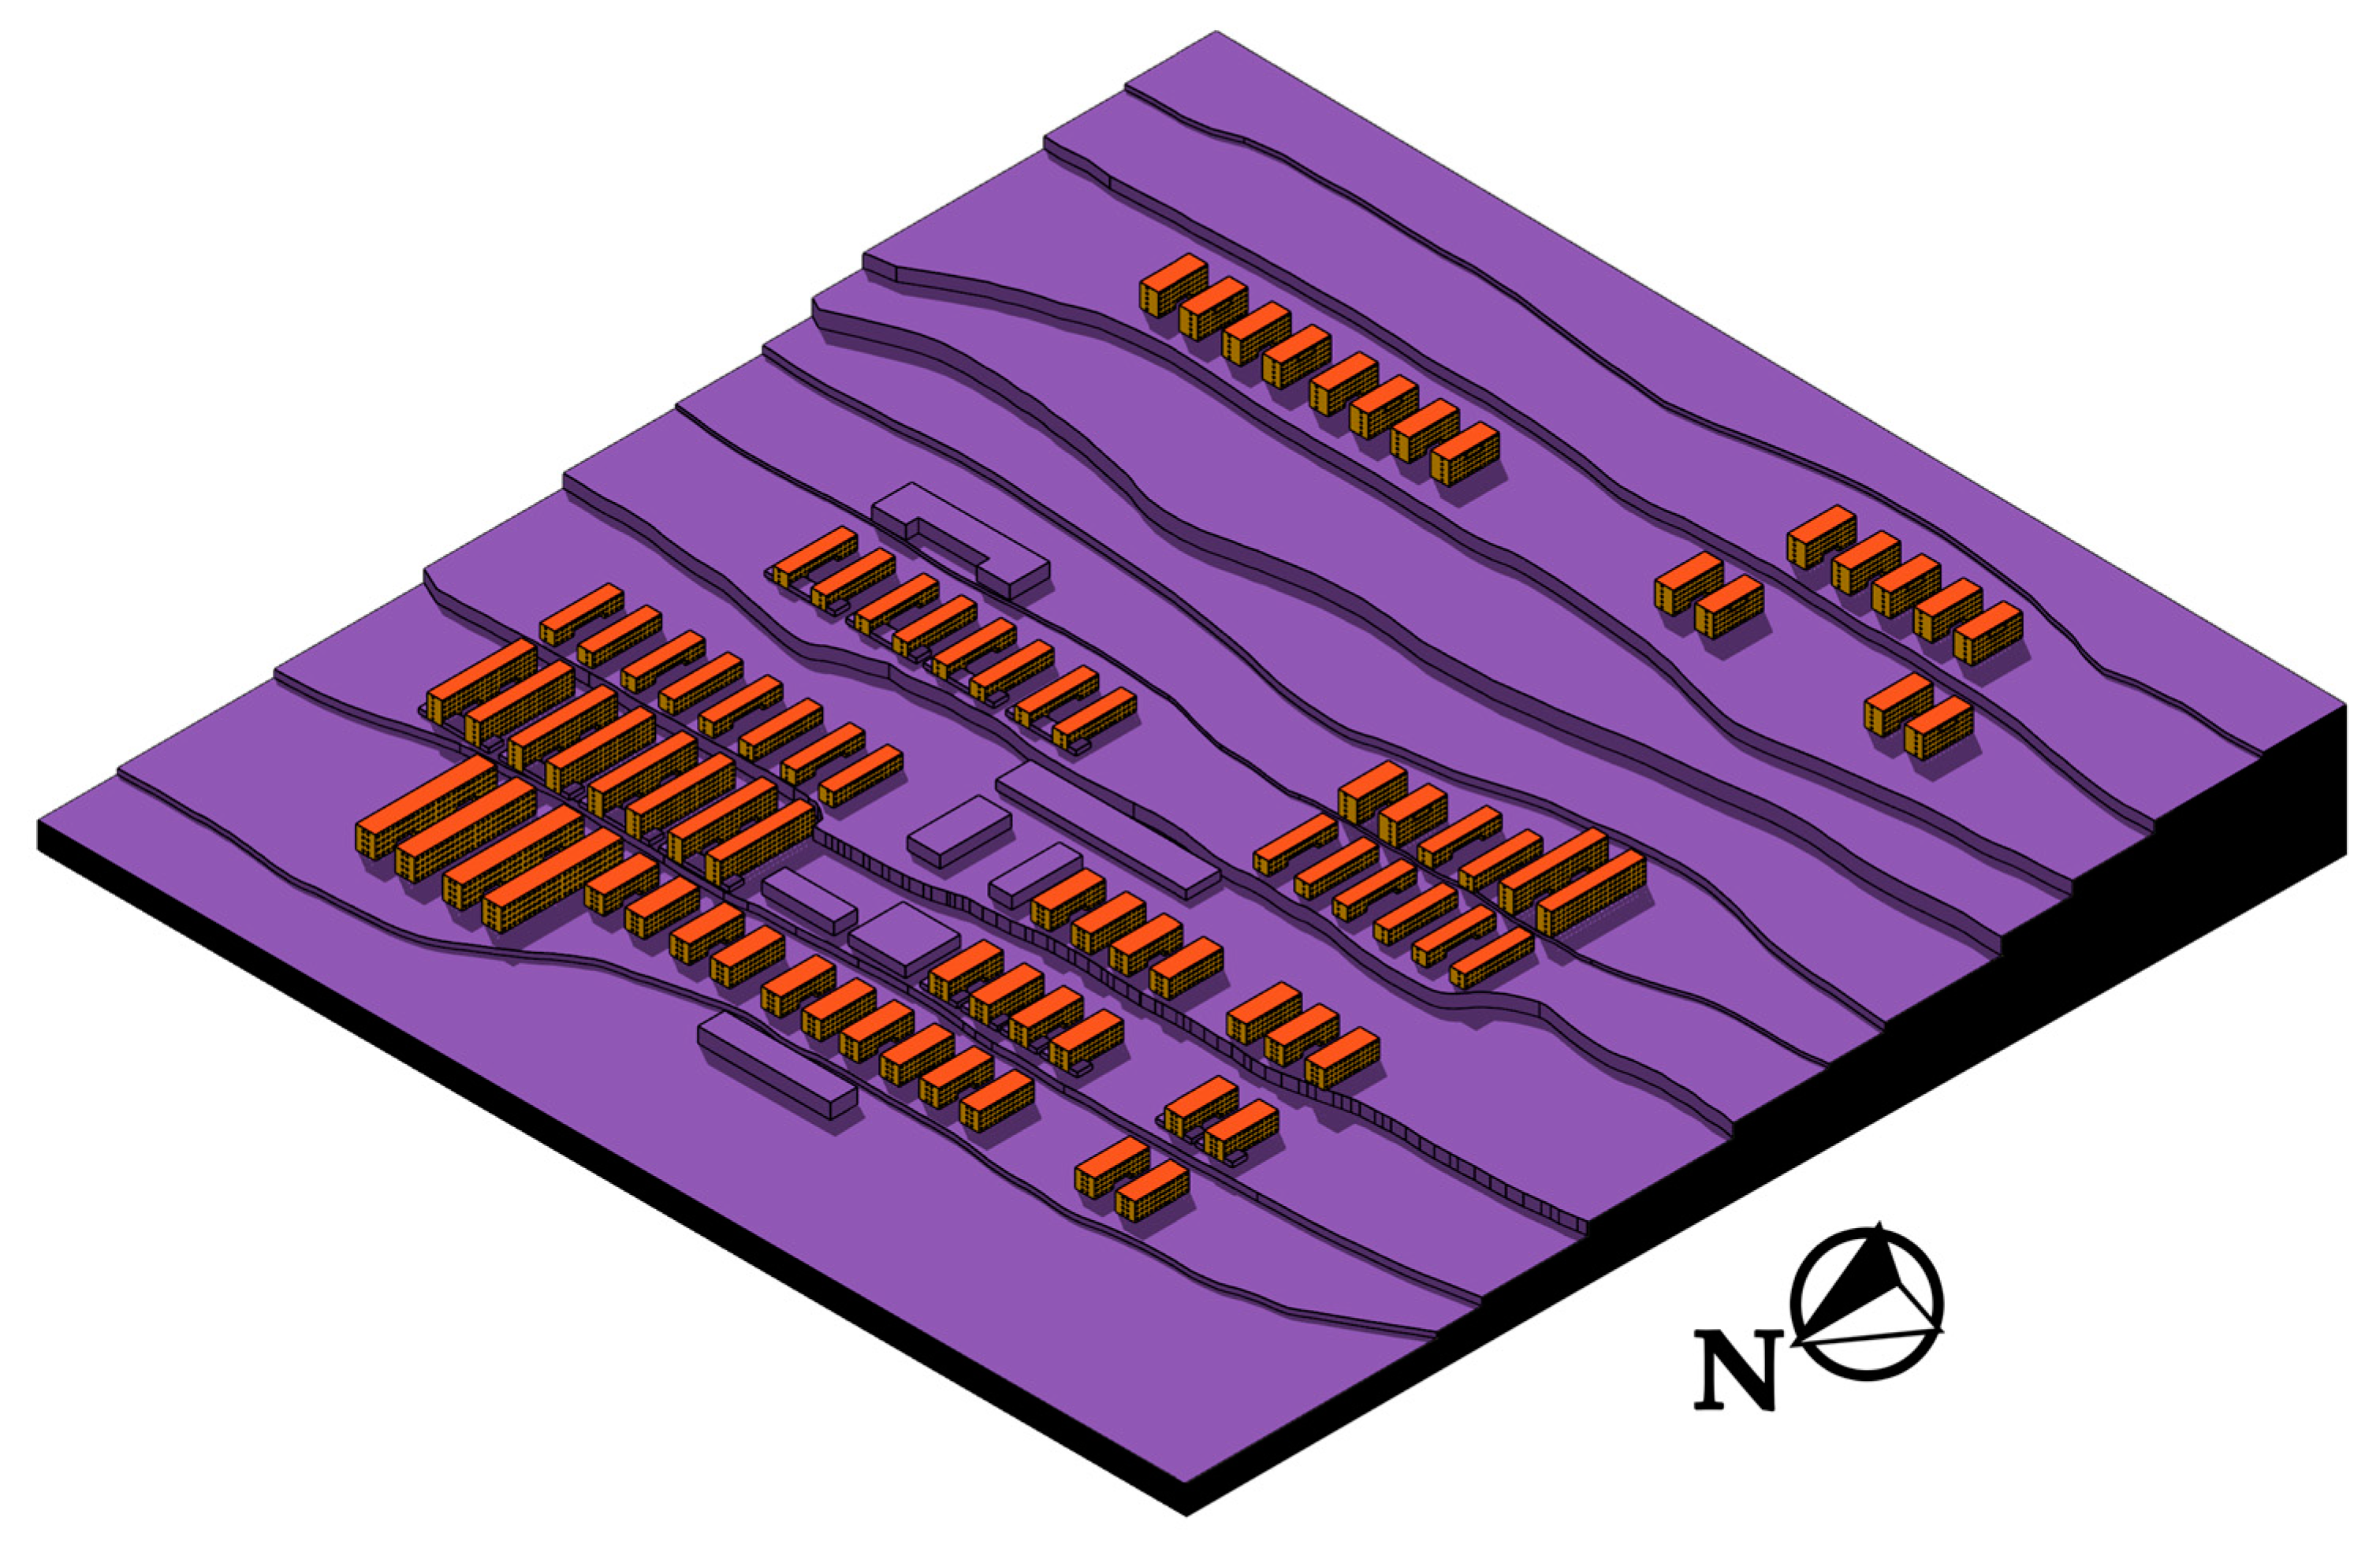
2.1. Description of the Monterusciello District

Monterusciello is a district of Pozzuoli (40°49′23″ N 14°07′20″ E, Italian climatic zone C [42]), a city near the Metropolitan Area of Napoli, in Southern Italy, 110 m above sea level, characterised by a moderately cold climate during the winter season and a mild and temperate climate during the summer season, with an annual rainfall of about 952 mm and an average annual temperature of about 16.7 °C (maximum about 28.2 °C, minimum about 7.4 °C). The entirety of Pozzuoli is located within the Phlegraean Fields, a significant volcanic region characterised by bradyseism phenomena. This phenomenon entails periodic tectonic movements, resulting in the gradual subsidence and elevation of the ground level. Although these movements occur at a relatively slow pace on a human timescale (typically around 1 cm per year), they are markedly rapid when considered from a geological perspective.
In the latter decades of the twentieth century, the phenomenon of bradyseism shifted from a negative (decreasing) to a positive (increasing) trend. This change resulted in a total elevation from 150 to 170 cm, consequently jeopardising the historic centre of Pozzuoli. In response to the emergency and subsequent evacuation of unsafe structures, the Italian Government, in collaboration with the Municipality of Pozzuoli and the University of Naples, initiated plans in 1983 for the development of the new district of Monterusciello. This initiative aimed to facilitate the resettlement of affected populations (Figure 1).
The first settlement consisted of 600 lodgings and was later expanded by a second, larger one of about 4000 lodgings [43]. The first settlement was built in a Monterusciello area that was already urbanised. In contrast, the second, much larger settlement followed a more rigorous and extensive urban planning and design activity. Considering the need for rapid construction times, the buildings for both settlements were designed and realised using prefabricated components; by the end of 1986, the first settlement was completed, including a nursery, primary and middle schools, sports equipment, and a shopping centre [43].
The coordination of the second settlement project was conducted under the leadership of Professor Uberto Siola and architect Agostino Renna. They developed a distinct and recognisable urban framework, drawing inspiration from the characteristics of Pozzuoli. This framework includes small blocks interspersed with roads, squares, and green spaces. The central area of the settlement is strategically positioned at the summit of the slope, rendering it easily identifiable. Additionally, the residential blocks are constructed on terraces, aligning the buildings along a north–south axis. In an effort to replicate the structure of a historical centre, various public buildings and communal spaces are thoughtfully integrated among the residential blocks, contributing to a more complex and diverse urban environment. The second settlement is divided into a mosaic of 18 functionally equal lots, grouped into three areas (Area_A: civic spaces + high-density residential, Area_B: low-density residential, and Area_C: commercial/tertiary spaces) to improve the management and scalability of the new district of Monterusciello. This study focuses on the residential buildings of Area_A.
In Area_A, there are five types of residential buildings that adopt the same layout and construction characteristics with different surface/volume ratios. Table 1 reports the main geometrical characteristics of each typology and the Windows-to-Wall Ratio (WWR) for each façade of every building typology.
Figure 2 shows a schematic view of the main Monterusciello areas, focusing on the buildings’ typologies of Area_A, as reported in Table 1.
The construction of the Monterusciello district has had a significant impact on the community. It provided an opportunity to evaluate the effectiveness of rapid and modular construction techniques in addressing the needs of the population. These methods successfully reduced costs and minimised land use. However, challenges arose primarily from the difficulties faced by local workers in the implementation of prefabricated concrete components.
Now, more than thirty years later, the public areas within the district are well-maintained. In contrast, residential buildings require substantial renovations, particularly in light of the substantial evolution in building performance standards over recent decades.

2.2. Modelling of the Numerical Case Studies

Before starting with the modelling of the case study, a careful data collection process was carried out. In particular, it was organised into three distinct phases: (i) municipal documents and technical reports served as foundational sources for primary data; (ii) comprehensive on-site inspections and field surveys were conducted to validate and enhance the information obtained from these documents and reports; and (iii) interviews with the residents, facilitating the identification of the number of occupants for each apartment and the domestic appliances typologies in order to gather detailed information regarding their operational conditions and performance.
Figure 3 shows the methodological framework of this study, including the selection of the single building, the retrofit actions’ proposal, the materials considered, and the scale of the performance analysis (single building and whole Area_A).

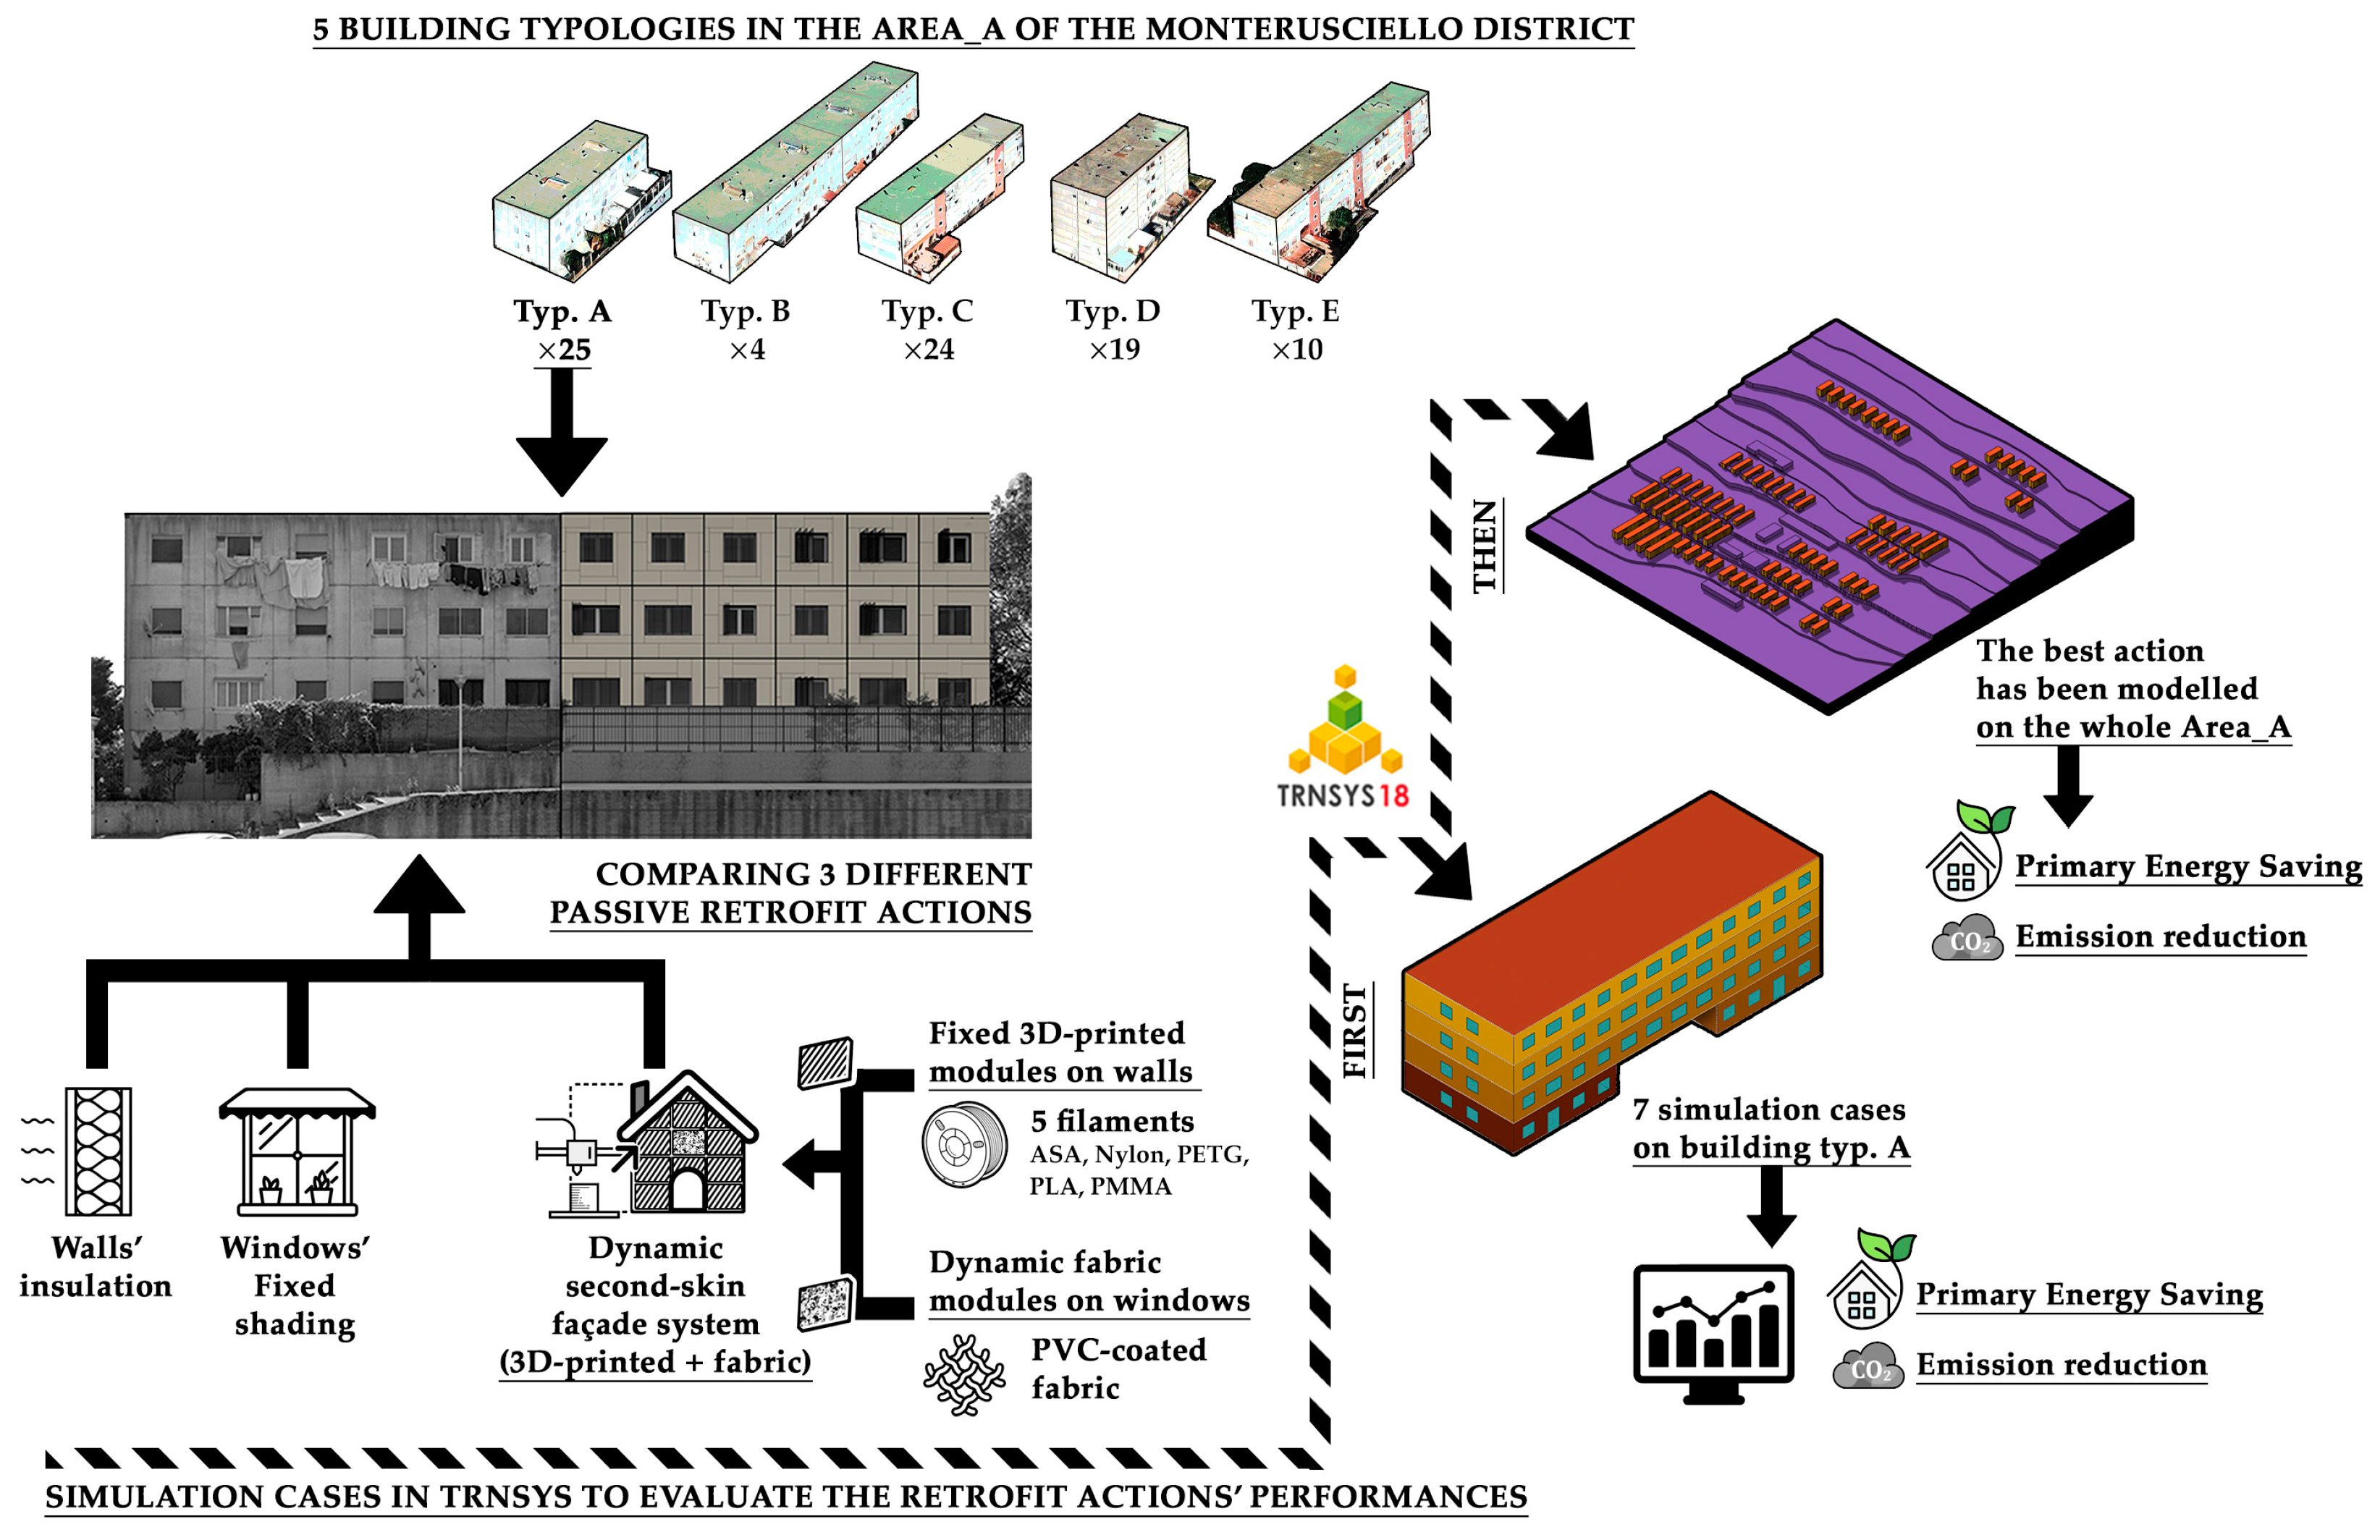
2.2.1. Numerical Model at the Individual Building Level

The most common building typology has been selected as a reference case study and reported in Figure 4: a four-story multi-family building with a recessed ground floor with three apartments and four apartments on each upper floor (Typology A, Table 1).
The reference building envelope is constructed using multilayer prefabricated concrete panels that are strategically joined to form the primary structure. This assembly utilises rubber joints for enhanced durability. Interior spaces are delineated by prefabricated concrete walls and slabs, ensuring robust partitioning. It is important to note that all window fixtures are made of metal and lack thermal breaks, which has led some occupants to opt for walling up the openings in an effort to mitigate thermal dispersions. Table 2 reports the main geometrical and thermophysical characteristics of the building envelope’s construction components, as reported in the technical data archived in the municipality’s database [44].
The numerical model of the reference residential building was developed in TRNSYS 18 [41]. Firstly, the geometries have been modelled using the software SketchUp Pro 2019 v19.2.222 [45], dividing the building into six thermal zones, as shown in Figure 5: in particular, the ground floor was divided into three separate thermal zones (TZ_1, TZ_2, and TZ_3) to take into account the different depths of the central apartment, while the upper floors were modelled as single thermal zones (TZ_4 for the first floor, TZ_5 for the second floor, and TZ_6 for the third floor).
The model was then imported into TRNSYS 18 to detail the building envelope, the cooling and heating systems, the thermal gains, and the air infiltration rate through the Type 56, a Fortran component that contains all the building details and through which the connections with other components such as the weather data are managed. Thermal bridges were neglected in this study for both the reference and the retrofit simulation models due to a lack of experimental or archival data on the transmission losses related to the thermal bridges of the buildings of the Monterusciello district. The weather data relative to Napoli (40°50′09″ N 14°14′55″ E) [46] have been used during all the simulations due to the lack of a weather file specific to Pozzuoli (40°49′23″ N 14°07′20″ E).
The temperature setpoint has been considered equal to 20 °C for the heating systems and equal to 26 °C for the cooling systems to guarantee an acceptable level of indoor thermal comfort [47,48]. The internal gains associated with the lighting systems, appliances, and residents vary between workdays and weekends, are reported in Figure 6; in particular, this figure represents the internal gains, expressed in W m−2, defined according to [49,50] and based on the residents’ interviews.
The air infiltration rate has been set equal to 0.24 h−1 during the heating period, while, during the cooling period, it has been set equal to 0.24 h−1 when the outdoor air temperature is above 26 °C and equal to 0.60 h−1 when the outdoor air temperature is below 26 °C to predict the user behaviour and account for the more frequent opening of windows, whatever the indoor air temperature is, as suggested by [51].
Then, a preliminary analysis was carried out, and a simulation was run to evaluate the heating and cooling loads of the reference building. In this preliminary analysis, the building envelope, the internal gains, and the infiltration were fully characterised. The temperature setpoints for the heating and cooling systems were established while allowing for unrestricted heating and cooling capacities. This approach was implemented to assess the maximum load capabilities of the systems effectively. The established maximum heating and cooling load values are employed to verify and select the capacity of a commercial electric heat pump model, facilitating simulations for the case studies. Figure 7 shows the space heating and cooling load-duration diagram for the whole reference building; in particular, this figure shows the order of sensible thermal power (in red) and cooling power (in blue) values obtained from the simulation, arranged from highest to lowest values, taking into account the duration of each value. The thermal and cooling energy essential for sustaining the desired indoor air temperature during both heating and cooling periods is illustrated by the area between the horizontal axis and the respective curves. The heating load shows a peak of 67.8 kW and a duration of 3288 h, while the cooling load shows a peak equal to 39.4 kW and a duration of 1900 h.
The results obtained enabled the selection of a suitably sized commercial electric heat pump (EHP) model to effectively meet the energy requirements and ensure that the specified temperature setpoints are achieved. Therefore, fifteen EHPs Clint CRA/K 15 [52] are installed, each characterised by a cooling capacity of 10.4 kW with a Seasonal Energy Efficiency Rate (SEER) of 2.75 and thermal power of 12.4 kW with a Seasonal Coefficient Of Performance (SCOP) of 2.62, as declared by the manufacturer; during the heating season, all of the fifteen EHPs are considered active for a total nominal heating power equal to 75 kW (about 41.71 W m−2, considering the sum of the reference floor area for all the floors equal to 1798 m2), while only eleven EHPs are considered active during the cooling season for a total nominal cooling power of 46.2 kW (about 25.70 W m−2). The EHPs have been modelled as steady-state components, working at nominal SEER and SCOP whenever required for both cooling and heating periods.
The retrofit case studies were modelled considering two cases with traditional passive retrofit actions and five cases that considered installing an SSF dynamic system on all the external walls. In contrast, the other surfaces (internal and external floors, internal walls, and roof) were considered as in the reference case.
In particular, the traditional passive retrofit actions considered in the first two case studies are as follows:
  • The installation of an insulation layer on all of the external walls;
  • The installation of a fixed shading system on the windows.
In the other five retrofit cases, the proposed SSF system consists of two elements:
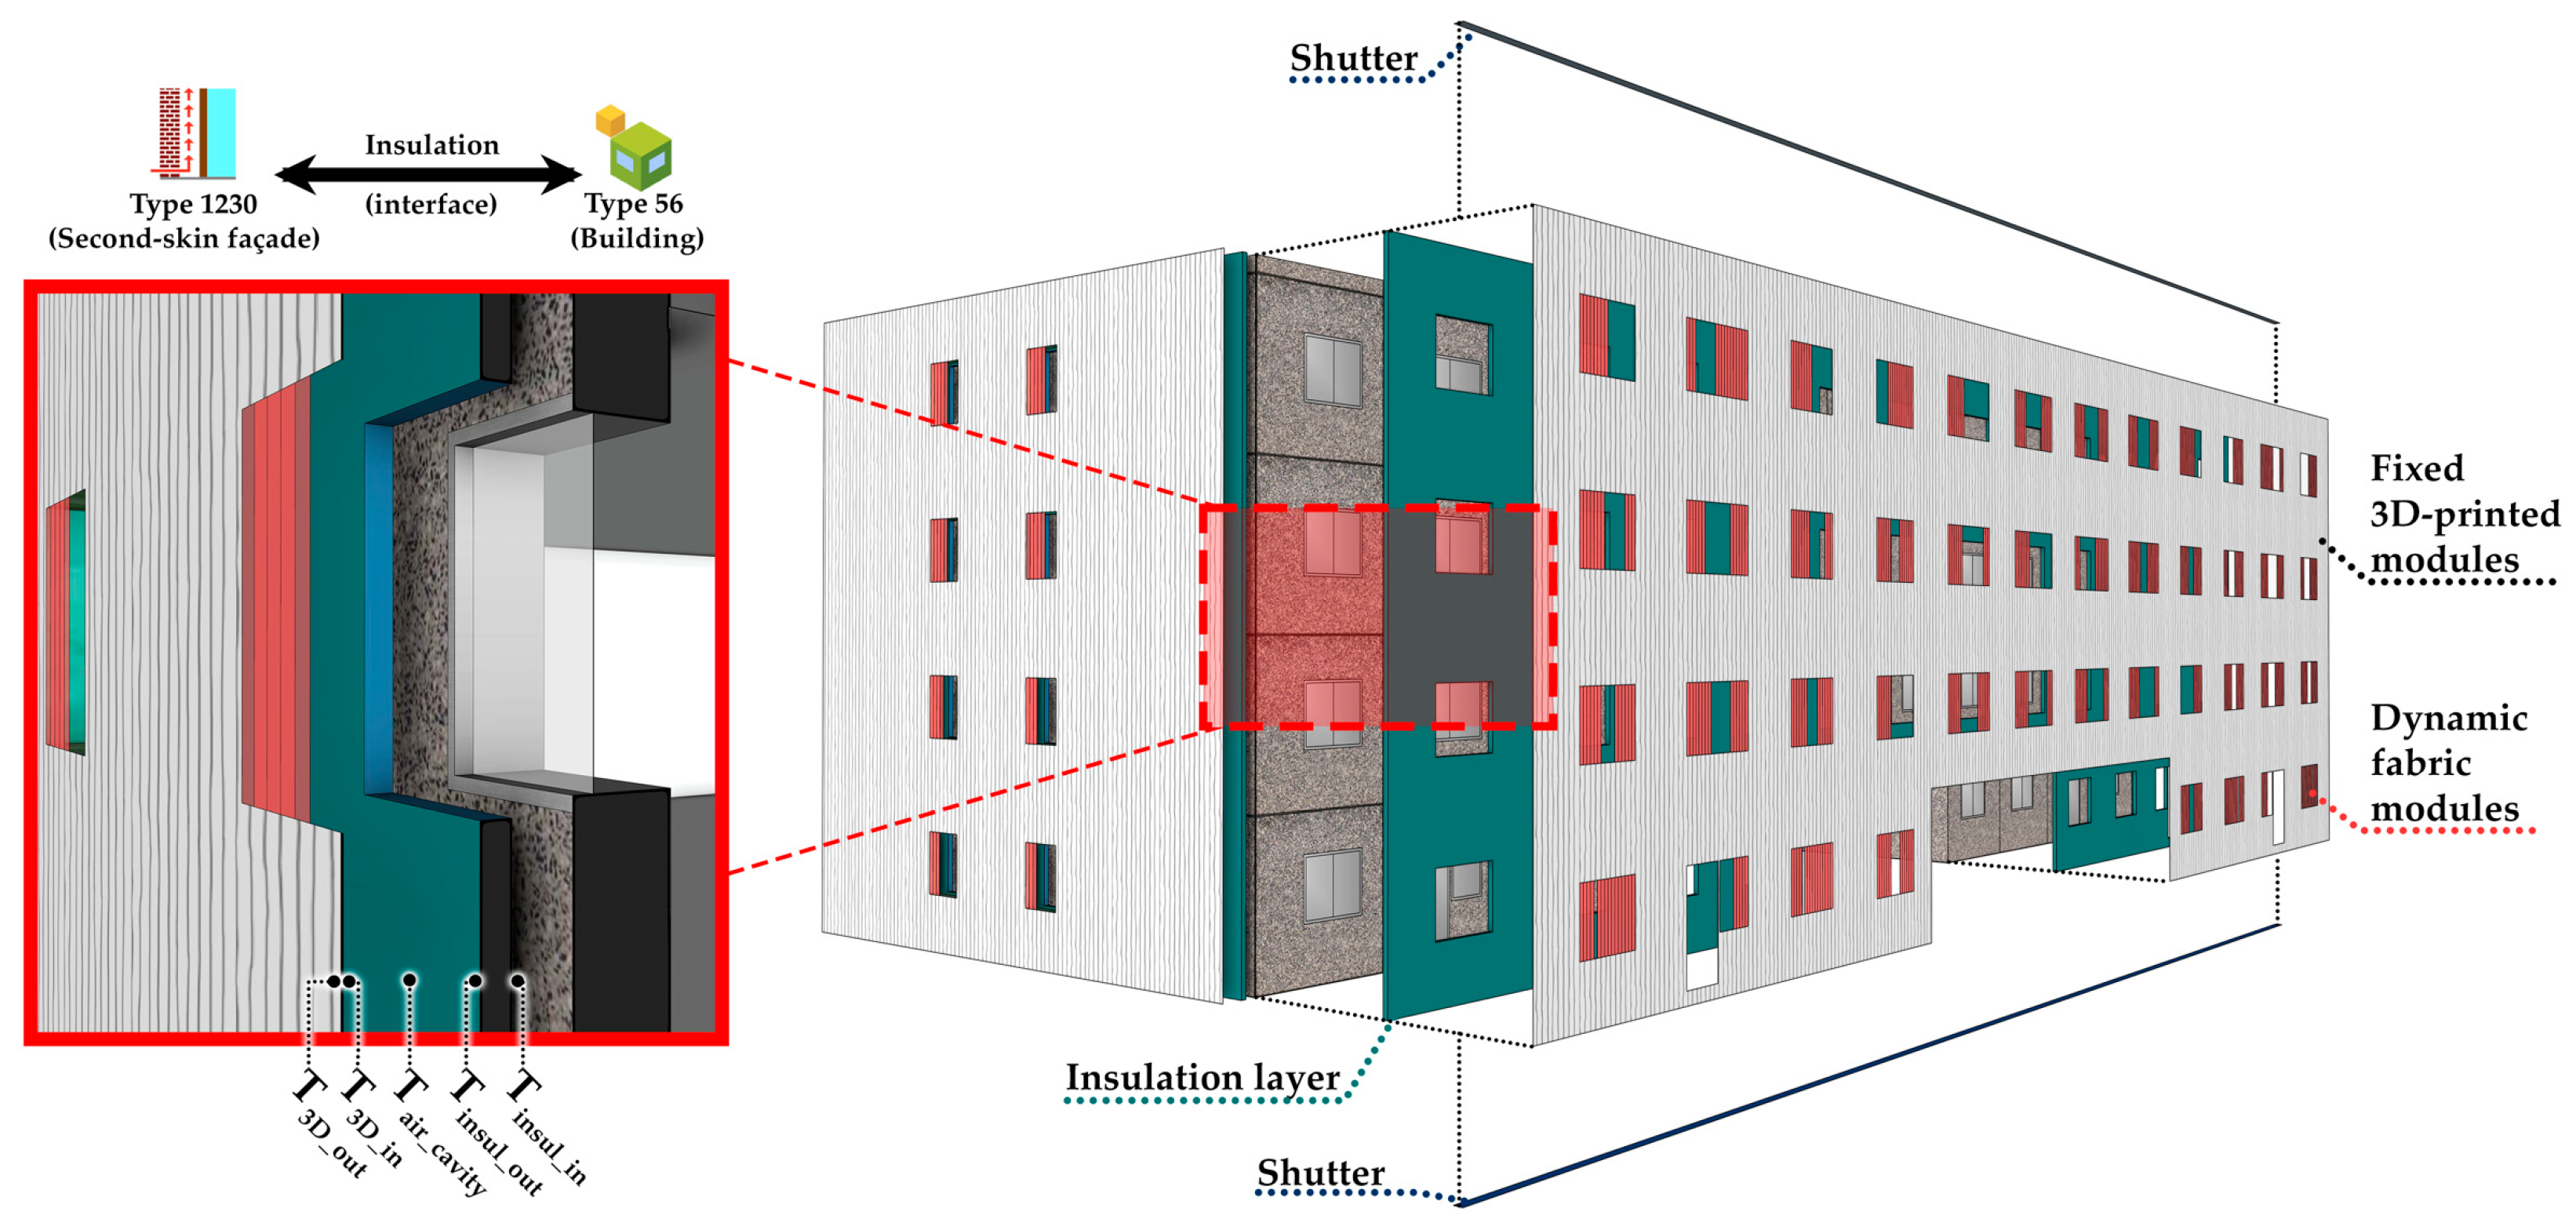
  • Fixed modules installed on the opaque envelope by installing the insulation layer, leaving an air cavity of 10 cm, and adding an opaque cladding realised by using 3D-printed modules;
  • Dynamic modules installed in front of the windows, leaving a cavity of 10 cm, and realised by using the PVC fabric.
In TRNSYS, the insulation layer (Expanded polystyrene) for the first retrofit case has been added as a massive layer in Type 56, considering a density of 20 kg m−3, a specific heat equal to 1.01 kJ kg−1 K−1, and a thermal conductivity equal to 0.041 W m−1 K−1 [53]. Instead, the second retrofit case with the fixed shading system, consisting of a traditional fixed Italian awning positioned at the top of the windows with a 0.60 m depth, has been modelled in Type 56 using shading objects with the proper dimensions [54,55]. Finally, the SSF used in the last five case studies has been modelled using the Type 1230 [56], a Fortran component that effectively reproduces the behaviour of an outer layer installed on a massive wall, interposing a naturally ventilated air gap. In particular, Type 1230 considers the effects of solar radiation, longwave radiation, and air convection on the SSF outer layer, the transmission and accumulation of thermal energy in the SSF outer layer, the radiative exchanges in the air cavity, and the thermal energy transmission through the external wall of the building. The Type 1230 (SSF system) and the Type 56 (building) are coupled and connected through the temperature and thermal resistance of the most external layer of the building wall, in this case, the insulation layer, which acts as an interface between the two Types. Figure 8 shows a schematic view of the retrofit action simulated on the reference residential building and a detailed section on the SSF.
The radiative heat transfer (hrad) between the inner surface of the outer layer and the external surface of the insulation layer depends on the surface temperatures T3D_in, Tinsul_out, and Tinsul_in (Figure 8), the air cavity temperature (Tair_cavity), the convective heat transfer coefficient between the inner surface of the outer layer and the air cavity (hconv), the thermal transmittance of the insulation layer (Uinsul), and the area of the outer layer (A). The radiative heat transfer coefficient is calculated in Type 1230, as detailed in Equation (1).
h r a d = T i n s u l _ o u t T a i r _ c a v i t y T 3 D _ i n T i n s u l _ o u t h c o n v + T i n s u l _ o u t T i n s u l _ i n T 3 D _ i n T i n s u l _ o u t U i n s u l A
The values of T3D_in, Tinsul_out, and Tinsul_in, Tair_cavity, and hconv are dynamically determined during the simulation, whereas Uinsul and A are established based on the properties of the building’s external wall. Additional information regarding Type 1230 is available in [28,56].
To simulate the behaviour of the SSF system, Type 1230 requires the geometries of the SSF, the thermophysical characteristics of the outer layers, and the depth of the air cavity. While the geometries of the SSF have been set to be the same as the existing building’s outer dimensions, the thermophysical characteristics of the outer 3D-printed layer have been calculated following the methodology reported in [57,58], starting from the thermophysical properties of the filaments as declared by the manufacturers and the geometries of the 3D-printed modules considered as fixed elements of the SSF implemented in this study (i.e., length = 120 cm; width = 60 cm; thickness = 1 cm; wall thickness: 2 layers; infill percentage: 20%). As suggested by [16,59], the internal geometries have been modelled as hexagons, which proved to be the most durable to physical stress, making them more appropriate for use as a construction component. Therefore, the thermal conductivity of the 3D-printed modules (λ3D) has been determined using the equations given by [57,58] (Equations (2)–(4)):
λ 3 D = λ m × 2 × a 1 × b 1 a × b
  with   a = λ d λ m λ d r × h c  
and   b = V d + λ d λ m + 2 × λ d r × h c + 2
where λm is the filament’s thermal conductivity as reported by the manufacturers [60,61,62,63,64], λd is the filler’s thermal conductivity (air in the hexagonal infill, equal to 0.026 W m−1 K−1 [65]), r is the hexagonal infill radius measured from the specimens (measured as 0.0045 m), hc is the interfacial boundary conductance (equal to 12 W m−2 K−1 [57]), and Vd is the air volume fraction in the printed matrix (calculated as 0.69 of the modules’ total volume). In this study, five different filaments have been considered, considering the most common polymers used in the 3D-printing industry for outdoor applications [66,67]:
  • ASA (Acrylonitrile Styrene Acrylate), which offers strong resistance to weather, chemical, and mechanical stress while being non-biodegradable and hardly recyclable; the cost per kilogram of this filament ranges between USD 25 and USD 50 [60].
  • NYLON PA66, which offers very high mechanical and thermal properties, even at extreme temperatures, thanks to the infusion of fibreglass into the polymer, thus making it non-biodegradable and complex to recycle; the cost per kilogram of this filament ranges between USD 40 and USD 80 [61].
  • PETG (PolyEthylene Terephthalate Glycol-modified), which offers good resilience and printability, as well as high recyclability despite being non-biodegradable; the cost per kilogram of this filament ranges between USD 20 and USD 40 [62].
  • PLA pro HT (PolyLactic Acid), which offers good printability and resistance while also being produced from renewable resources, thus biodegradable under industrial composting conditions; the cost per kilogram of this filament ranges between USD 30 and USD 50 [63].
  • PMMA (PolyMethyl MethAcrylate), which offers excellent chemical and weather resistance, as well as excellent optical properties, while being non-biodegradable and complex to recycle; the cost per kilogram of this filament ranges between USD 20 and USD 50 [64].
The PLA Pro HT stands out as the most environmentally friendly option due to its biodegradability and renewable resource base. PETG is a close second due to its recyclability.
Table 3 reports the values of the main characteristics for all the five 3D-printed modules’ variations considered in this study upon varying the filament. The density and specific heat were calculated considering the filaments’ manufacturer data [60,61,62,63,64] and the ratio between the extruded filament (31%) and the air in the fixed 3D-printed modules (69%).
Instead, the characteristics of the PVC fabric installed in front of the windows, in particular, thickness (0.0009 m), density (579 kg m−3), thermal conductivity (1.64 W m−1 K−1), and visual properties (solar transmission = 0.27, solar reflection = 0.20, solar absorption = 0.53), have been taken from the manufacturer datasheet [68].
Finally, the control logic of the SSF has been defined and set in TRNSYS. In particular, the characteristics of flexibility and lightness of the PVC fabric allowed us to take advantage of the SSF sections in front of the windows, making them movable to manage the solar gains as commonly reported in several industry and scientific real cases [15,16,28,36,37,69,70]. In this study, these sections were considered always open whenever the indoor air temperature (Tindoor) in the thermal zone was below 20 °C, in order to maximise the solar gains through the windows. Then, when Tindoor threshold is exceeded, the control of the PVC fabric sections has been connected to the incident solar vertical irradiation (Gv) values measured on the external building façades, thus controlling each façade independently depending on its orientation: in particular, the sections on the windows were considered closed when Gv exceeded the threshold equal to 100 W m−2 (thus covering the windows) and open otherwise. In addition, the air cavity has been considered closed by a series of inlet and outlet louvres whenever the ambient air temperature is below 20 °C and open when above this threshold to optimise the whole system, improve its insulation performance during colder periods, and maximise the natural ventilation of the SSF system during hotter ones.
Table 4 summarises the case studies and the different insulation thicknesses considered to reach the same thermal transmittance value of 0.36 W m−2 K−1, the threshold value suggested by the Italian construction regulation code [71].

2.2.2. Numerical Model at the District–Area Level

The modelling has been extended to include all 82 residential buildings and the 10 public ones in the Area_A of the Monterusciello district (see Figure 2). All the residential buildings (25 typ. A, 4 typ. B, 24 typ. C, 19 typ. D, and 10 typ. E, see Table 1) share the same construction components [44], while the public ones have not been considered in this study and thus have been modelled as simple shadow objects. All the district’s buildings have been modelled in Type 56, using the same approach described above (Section 2.2.1), with three thermal zones for each ground floor and additional thermal zones for each additional upper floor, resulting in a total of 511 thermal zones to model the whole area. In this whole-area numerical case, the ground has been modelled as well, reproducing the real urban morphology (terrain and buildings’ arrangement) of the area, as shown in Figure 9. This method permitted an analysis of the interactions among buildings, including factors such as the cast shadows and thermal effects, as well as the influence of the ground morphology. In particular, the thermal interactions between the buildings have been simulated using the TRNSYS default star-node approach, which adopts a basic approximation for the radiative heat flows, making it a more efficient option for numerical models with large numbers of thermal zones [41].
On this base reference model of the whole Area_A, the retrofit on the residential buildings has been implemented considering the installation of the proposed SSF system on all the external walls. The dynamic SSF system for each building has been modelled using Type 1230 [56] once more, as outlined in Section 2.2.1. However, in this case, only the SSF made of fixed 3D-printed PLA and dynamic fabric modules has been used due to its better environmental characteristics [66,67].

2.3. Methodology: Energy and Environmental Assessments

This section outlines the methodologies utilised to compare the Proposed Cases with the SSF system (PC) to their respective Reference Cases (RCs) in terms of primary energy saving and environmental impacts. The identical methodology is utilised to assess the energy and environmental impacts of the retrofit at both the individual building level and the district–area level.
The analysis of energy consumption involves assessing primary energy usage, which is determined by evaluating the Primary Energy Saving (PES) [28]. The calculation of PES is outlined below (Equation (5)):
P E S = E p R C     E p P C / E p R C 100
where E p R C represents the primary energy consumption linked to the reference cases, while E p P C denotes the primary energy consumption associated with each proposed case. A positive PES index indicates that the implemented passive retrofit measures reduce primary energy consumption compared to the reference case.
The E p R C (Equation (6)) and E p P C (Equation (7)) values are computed as follow:
E p R C =   E t h R C S C O P + E c o o l R C S E E R + E e l , e q u i p m e n t + E e l , l i g h t i n g / η P P
E p P C =   E t h P C S C O P + E c o o l P C S E E R + E e l , e q u i p m e n t + E e l , l i g h t i n g / η P P
where ηPP is the power plant’s average efficiency equal to 0.465 [40,72].
The environmental comparison was conducted by assessing the reduction in carbon dioxide equivalent emissions (ΔCO2) [28] (Equation (8)):
Δ C O 2 = m C O 2 , e q R C     m C O 2 , e q P C
where m C O 2 , e q R C represents the mass of carbon dioxide equivalent emissions for the reference cases, and m C O 2 , e q P C represents the mass of carbon dioxide equivalent emissions for each of the eight proposed cases. Consequently, ΔCO2 signifies the capacity of the implemented passive retrofit measures to decrease the carbon dioxide equivalent emissions in the renovated case compared to the reference case.
The m C O 2 , e q R C (Equation (9)) and m C O 2 , e q P C (Equation (10)) values are computed by using the following equations:
m C O 2 , e q R C = α E t h R C S C O P + E c o o l R C S E E R + E e l , e q u i p m e n t + E e l , l i g h t i n g
m C O 2 , e q P C = α E t h P C S C O P + E c o o l P C S E E R + E e l , e q u i p m e n t + E e l , l i g h t i n g
where α represents the carbon dioxide equivalent emission factor linked to electricity production in Italy, which is assumed to be 0.36425 kgCO2,eqkWhel−1 [40,72], while SCOP and SEER are taken from the manufacturer’s data [52].

3. Simulation Results

This section delineates the processed and analysed simulation results concerning the proposed case studies in comparison with the reference case study, as outlined in Section 2.3. Firstly, the energy and environmental impacts on building typology A (Section 3.1) are analysed, followed by those associated with the whole Area_A of the Monterusciello district (Section 3.2).

3.1. Energy and Environmental Impacts of the Retrofit on the Individual Building Level

Figure 10a,b report the values of PES and ΔCO2 for the proposed case studies, respectively. Figure 11 and Table 5 illustrate the main thermal and cooling energy flows and the annual specific cooling and thermal energy demands for the whole building upon varying the case study, respectively.
Figure 12 reports the operative temperatures’ minimum, average, and maximum values as a function of the months associated with Case 0 and Case 6 for the TZ_3 and TZ_5.
In particular, Figure 10, Figure 11 and Figure 12, as well as Table 5, highlight the following:
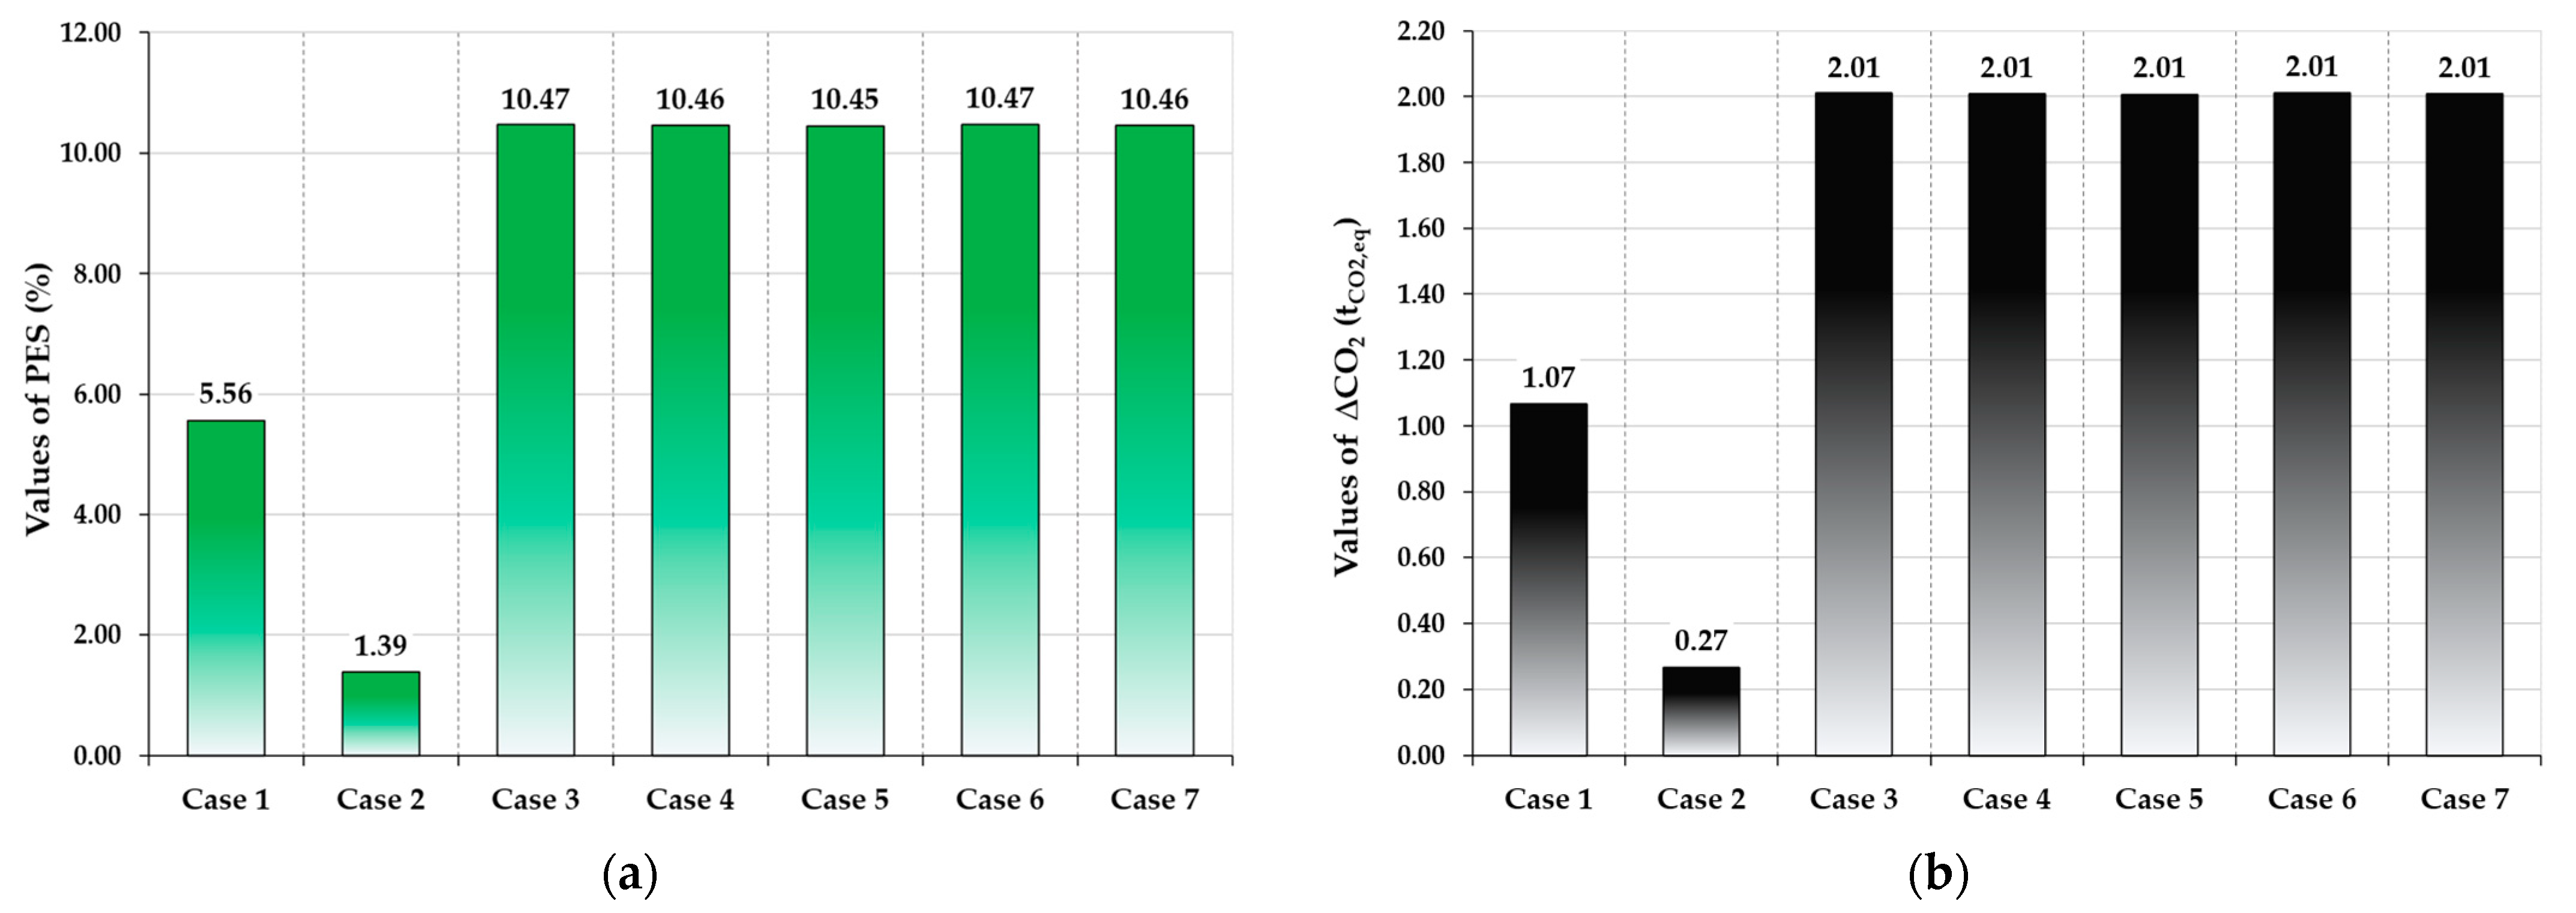
  • In Case 1, the PES showed a positive value of 5.56%, and the reduction in CO2 emissions (ΔCO2) was 1.07 tonCO2,eq; these positive values are mainly due to the best result in terms of thermal energy demand reduction compared to Case 0 (equal to 10.8%), despite a non-negligible increase in cooling energy demand (about 10.0%); these results are in line with those reported in [17,18].
  • In Case 2, the simulation results returned a value of PES equal to 1.39% and a ΔCO2 value equal to 0.27 tonCO2,eq; these results were achieved thanks to a 21.5% reduction in cooling energy demand despite a 5.4% increase in energy demand during the heating period compared to the reference case (Case 0); these findings are consistent with those documented in [19].
  • All the case studies with the proposed SSF systems (Cases 3–7) always return positive values of both PES (~10.5% in all cases) and ΔCO2 (~2.0 tonCO2,eq in all cases) when compared to the reference case; this means that all the proposed materials used for refurbishment cases allow for the reduction of both primary energy consumption and carbon dioxide equivalent emissions for the current building status; these findings align with those previously reported in [20,21,28,33].
  • Comparing the proposed SSF system (Cases 3–7) to a conventional insulation system (Case 1) and a case study (Case 2) featuring fixed window shading, the SSF system demonstrates its ability to enhance primary energy savings further, positively impacting both the cooling and thermal energy demands; this translates in an upgrade in PES ranges from an additional 4.9% to 9.0%, respectively. At the same time, the SSF system reduces environmental impact more effectively, and the reduction in CO2 emissions varies from an additional 0.94 to 1.74 tonCO2,eq, respectively;
  • Among the SSF retrofit cases, no significant differences can be highlighted by considering different 3D-printed materials for the fixed module installed in the SSF: indeed, Cases 3 and 6 (with 3D-printed ASA and PLA modules, respectively) returned better results in terms of PES (10.47%), while no differences can be highlighted in terms of ΔCO2 (Cases 3–7 allow to save 2.01 tonCO2,eq per year);
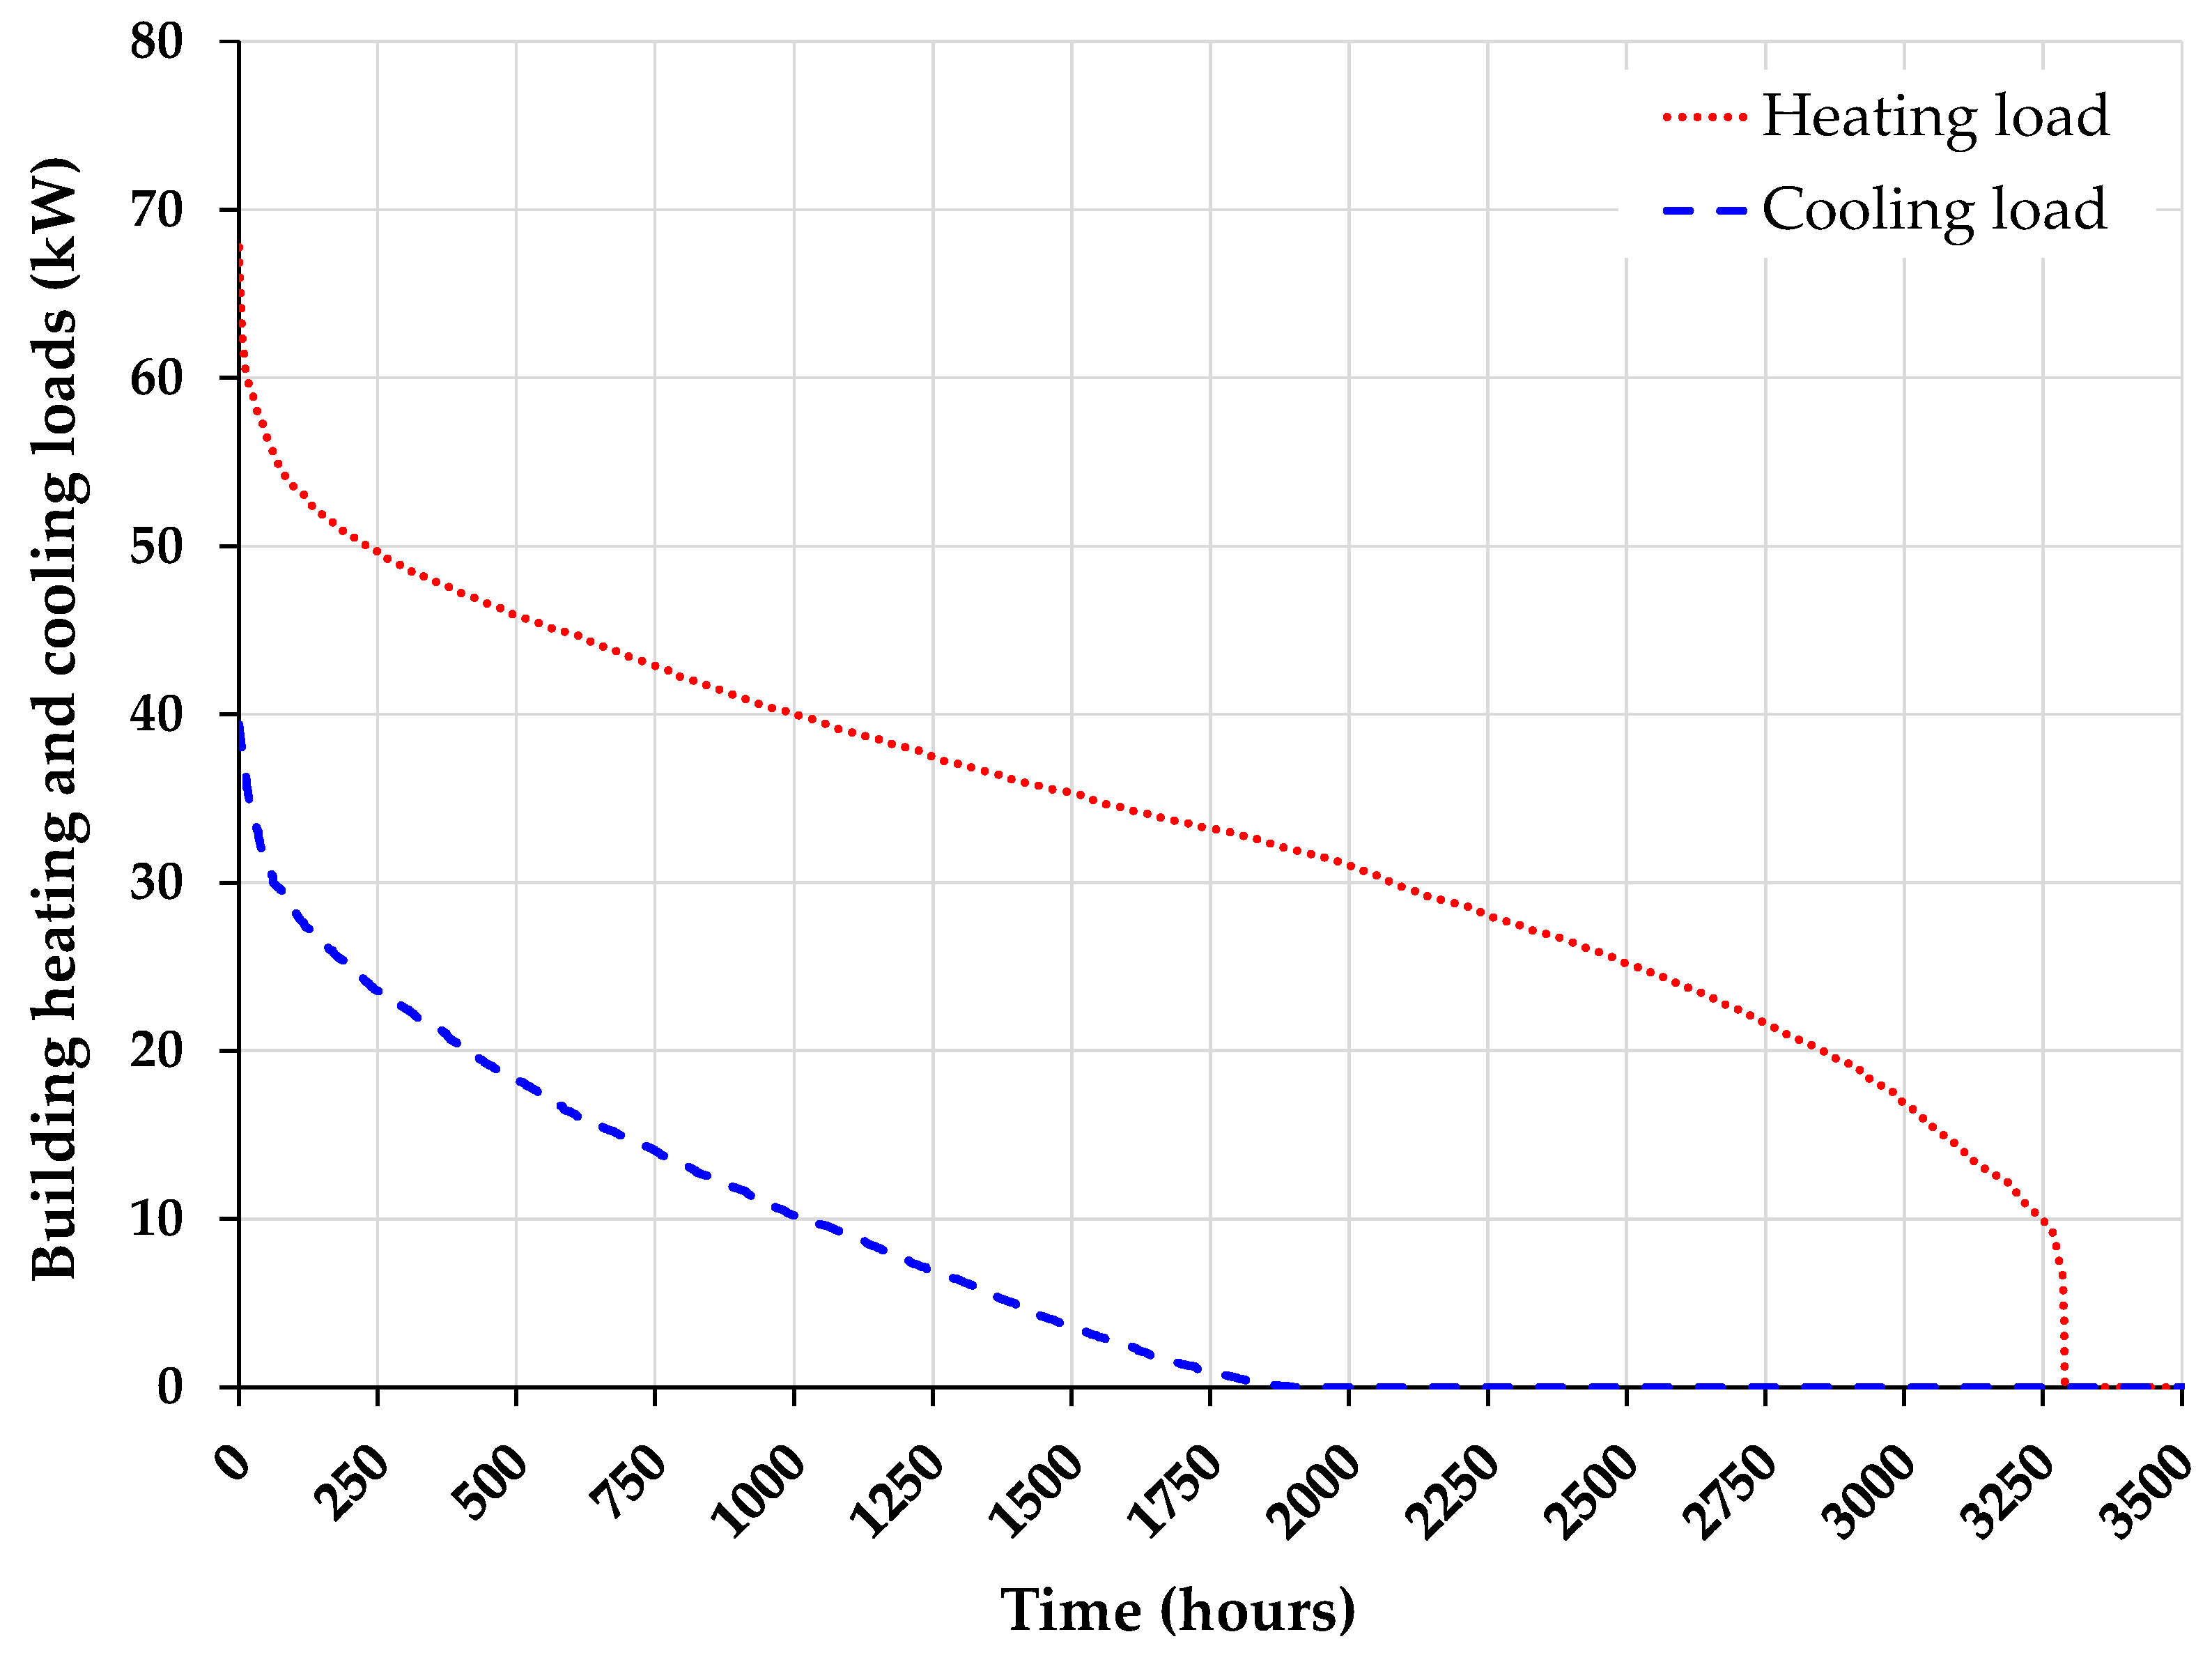
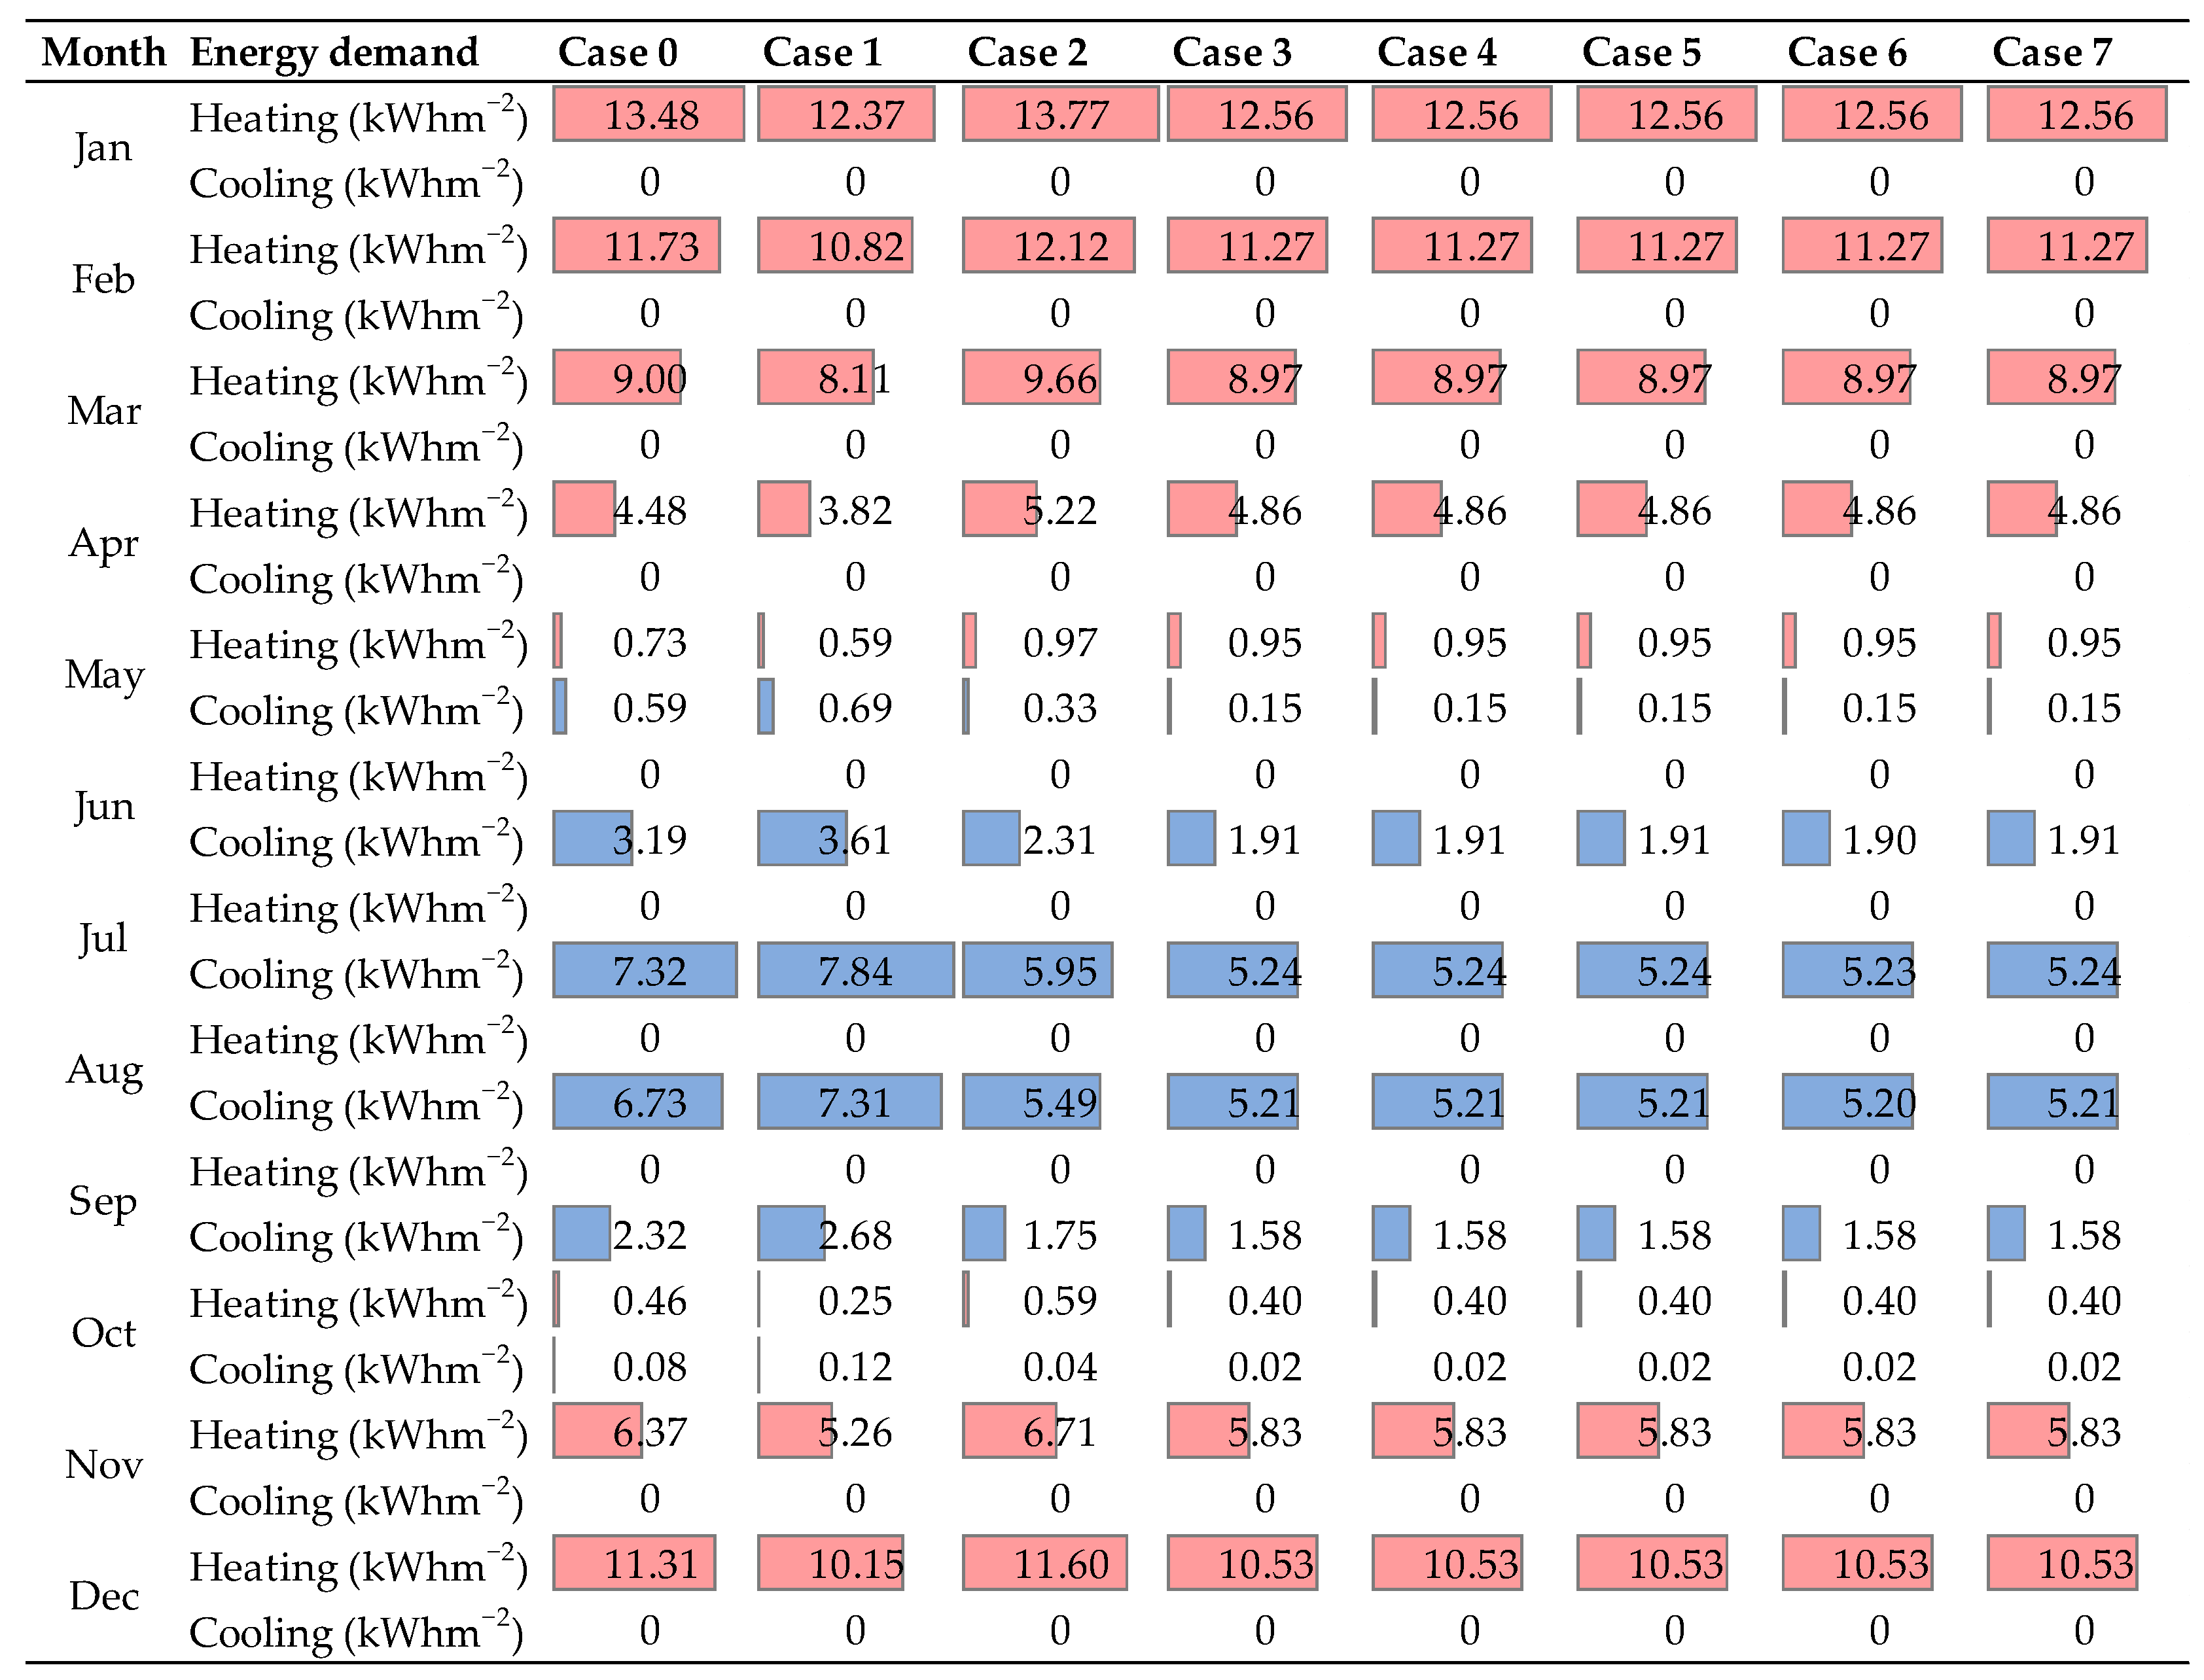
  • The trends of thermal and cooling energy flows (Figure 11), as well as the annual specific cooling and thermal energy demands (Table 5), justify the values of PES and ΔCO2, showing how the SSF (Cases 3–7) struggled to perform well during the milder months (April, May, October), while, in harsher conditions, the SSF characteristics (dynamic cavity ventilation, insulation, dynamic shading) allowed for the best yearly performance; indeed, the SSF cases returned the best results among all the retrofit cases in terms of cooling energy demand reduction while performing worse than Case 1 in terms of thermal energy demand reduction.
  • In terms of cooling energy demand, all the simulation case studies using the proposed SSF system (Cases 3–7) returned similar monthly trends with a yearly reduction of about 30.2%, which amounts to a reduction in the annual specific cooling energy demand of about 6.1 kWh m−2 year−1 in comparison to the Case 0; the best month in terms of cooling energy demand reduction is July, with a decrease in the monthly specific cooling energy demand of about 2.1 kWh m−2 year−1 if compared with the reference case;
  • In terms of thermal energy demand, all the simulation case studies with the SSF system (Cases 3–7) returned a yearly reduction of about 3.8%, which amounts to a reduction in the annual specific thermal energy demand of about 2.2 kWh m−2 year−1 in comparison to the Case 0; the best month in terms of thermal energy demand reduction was January, with a decrease in the monthly specific thermal energy demand of about 0.9 kWh m−2 year−1 if compared with the reference case;
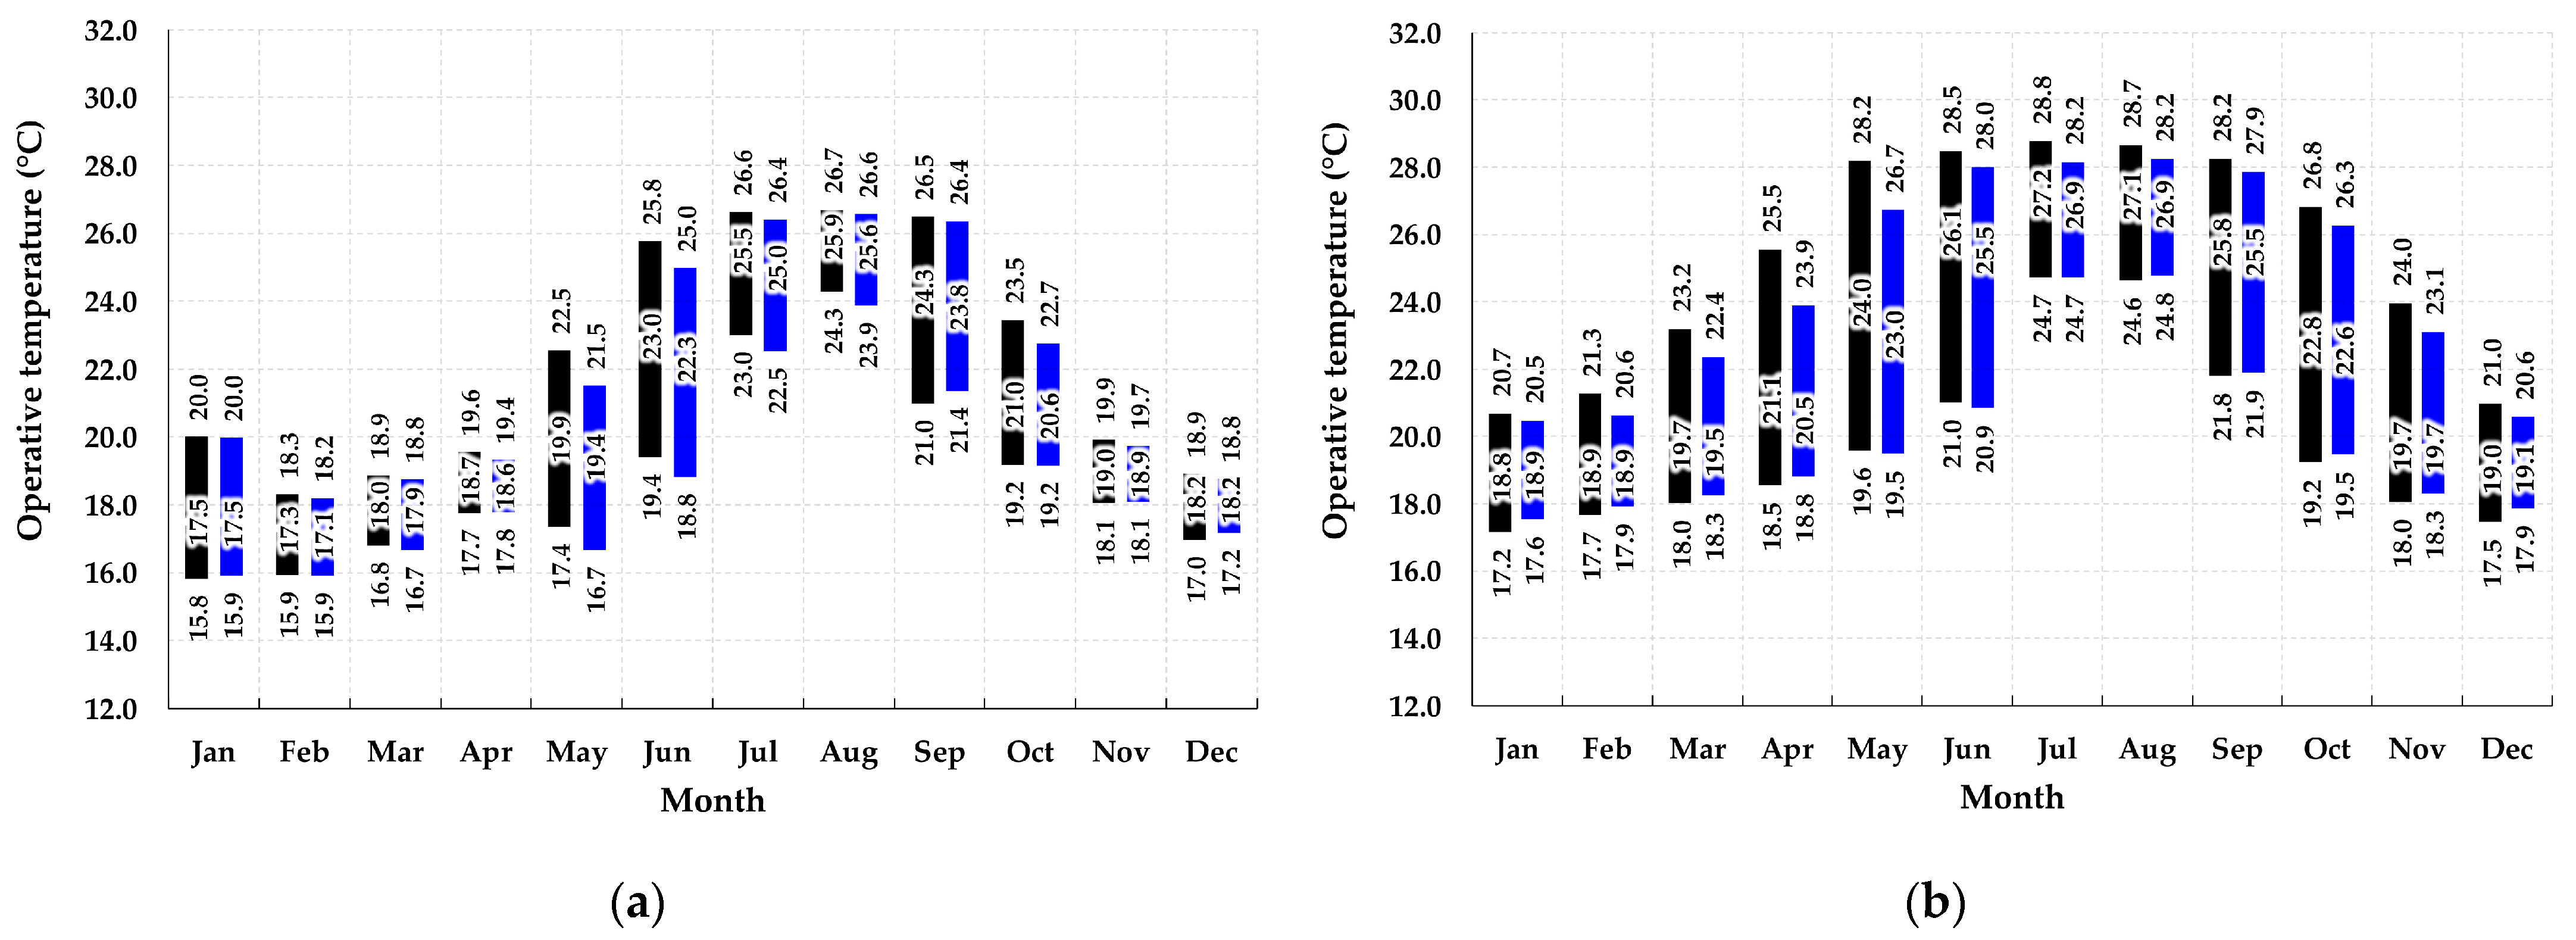
  • The comparison of the monthly minimum, average, and maximum values of the operative temperatures (Figure 12) between the two cases, Case 0 (black) and Case 6 (blue), demonstrated that the use of the SSF system (Case 6) leads to lower maximum temperature values across the whole year while returning, in terms of minimum temperatures, slightly higher values during the heating months and slightly lower values during the cooling months, resulting in a slightly more comfortable indoor environment overall; a similar trend can be observed in both TZ_3 and TZ_5. The operative temperature values also confirm that the SSF does not perform as well during milder months, as already highlighted by the energy flows’ results (Figure 11).
Therefore, the simulation results demonstrate that conventional insulation (Case 1) and fixed window shading (Case 2) actions can be used to target reductions in the energy demand in specific periods (specifically, Case 1 during heating and Case 2 during cooling), while the proposed SSF system, which consists of two types of modules (one fixed, made from 3D-printed polymer, and the other dynamic, made from fabric material), performs well in reducing the energy consumption and environmental impact for individual buildings across the whole year.

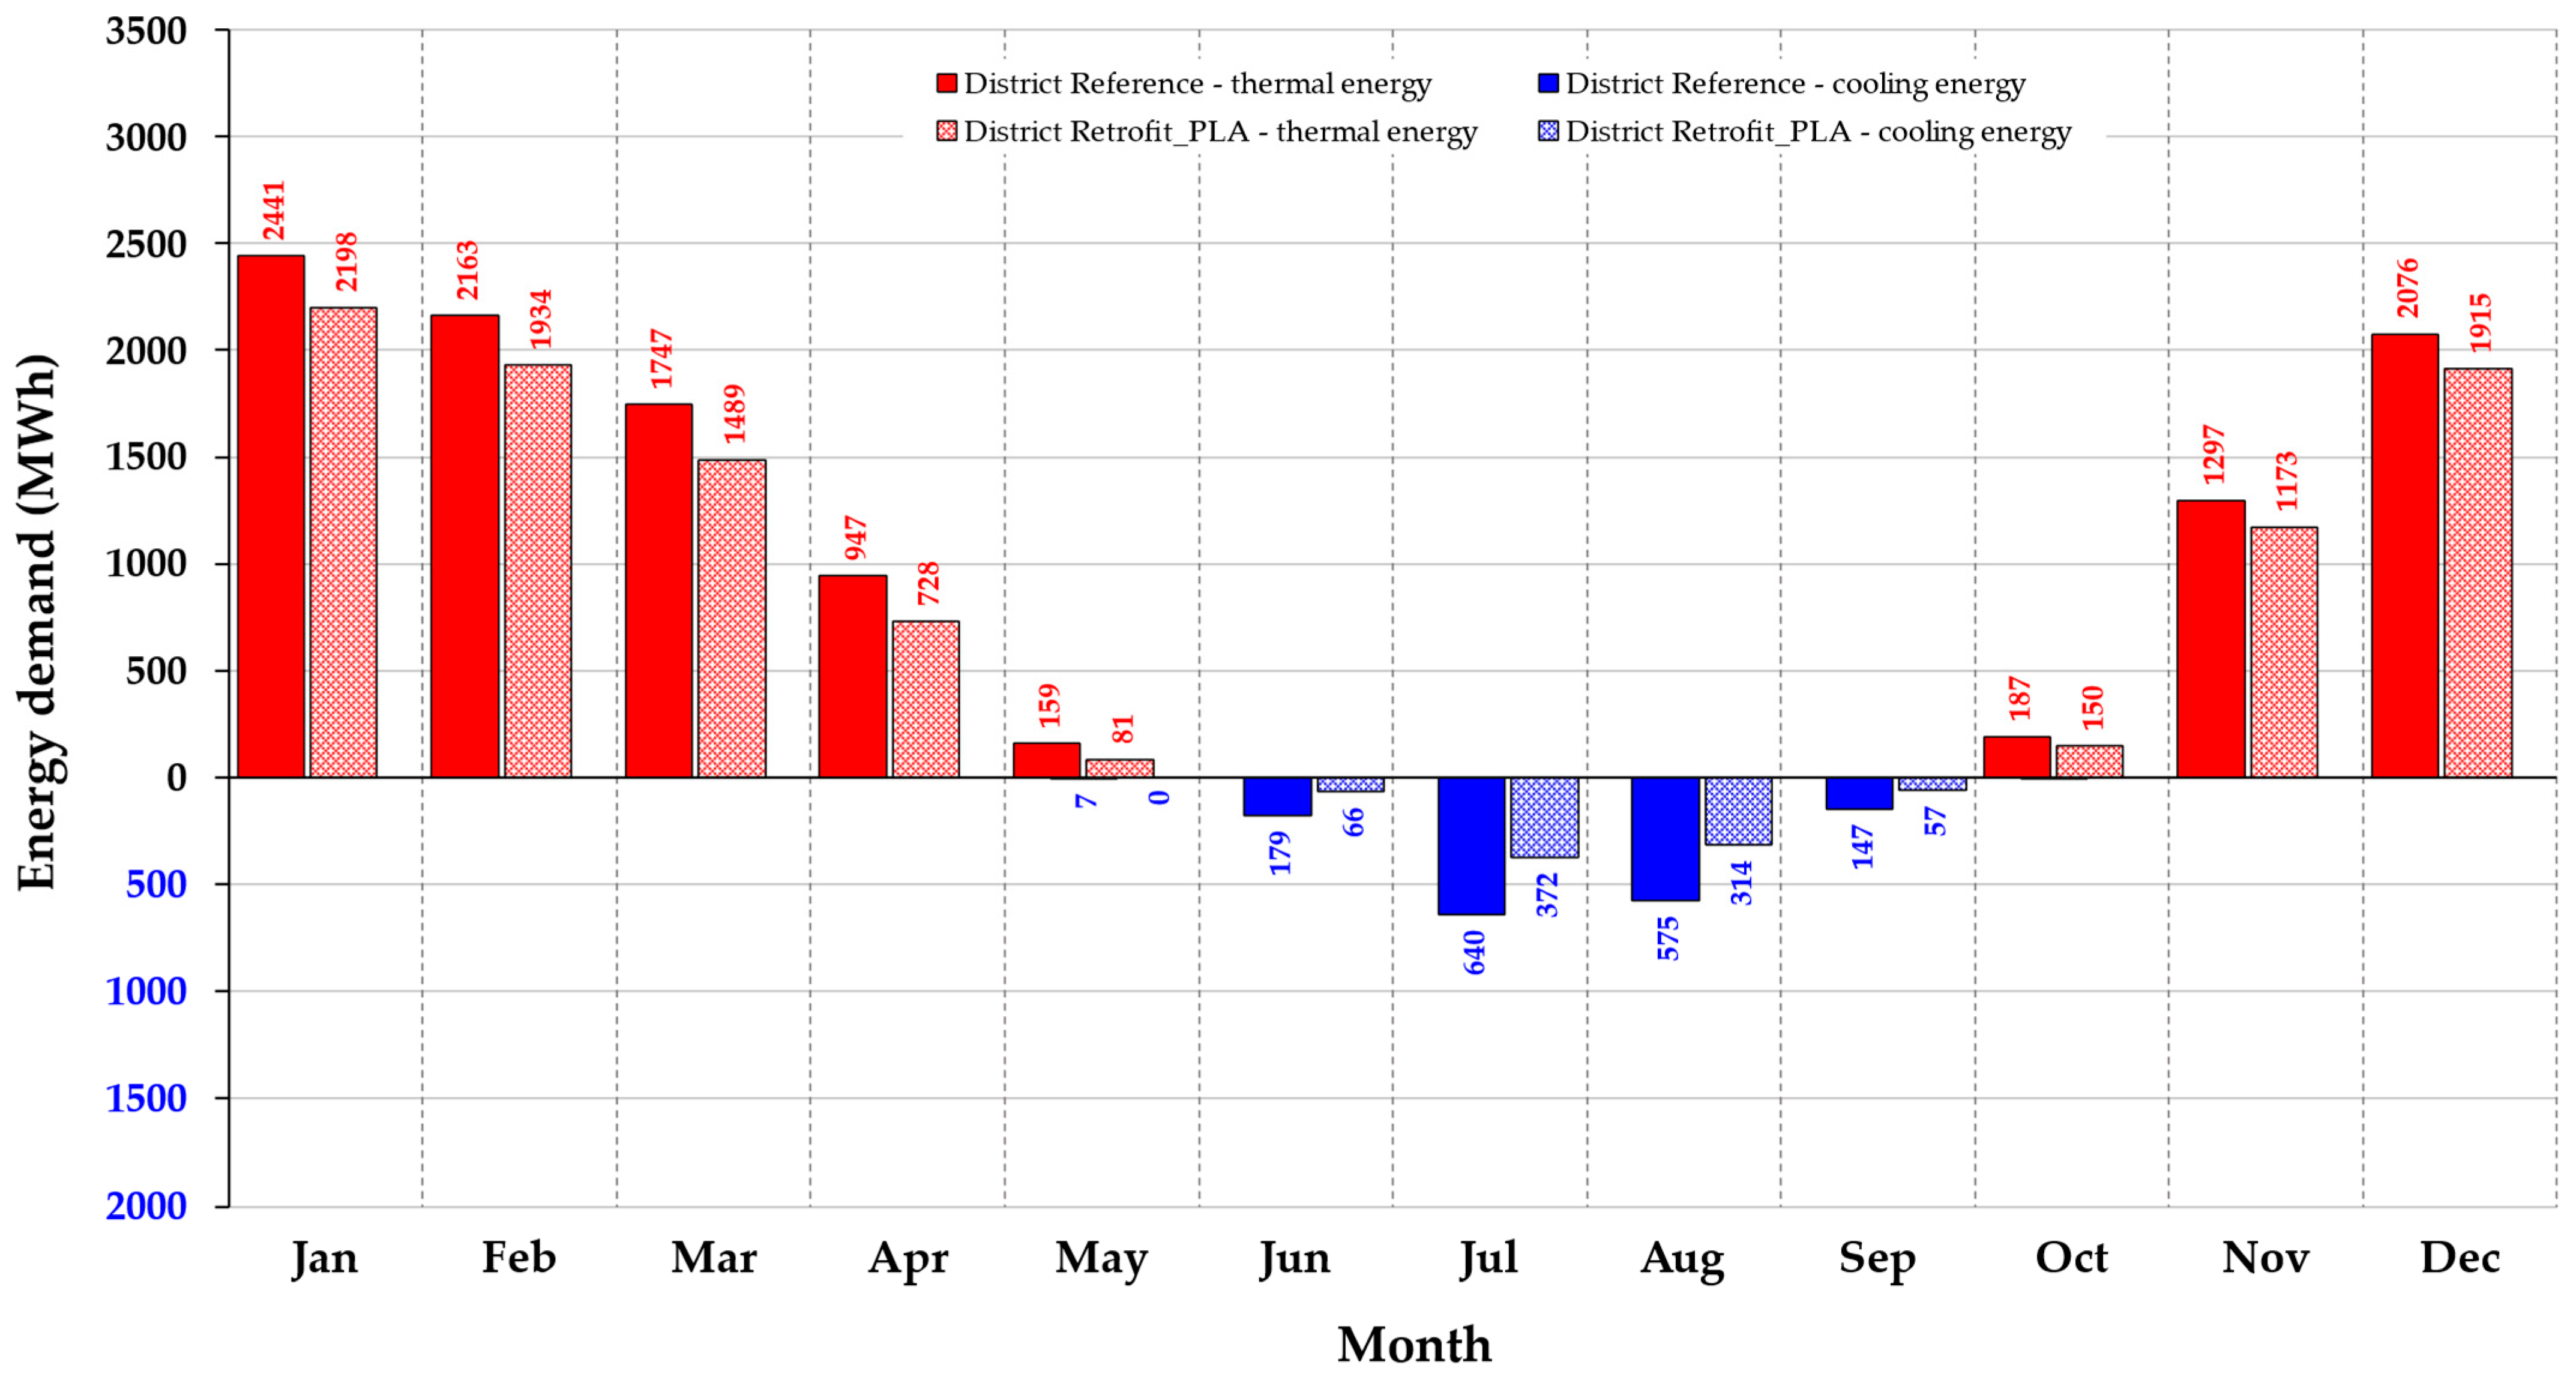
3.2. Energy and Environmental Impacts of the Retrofit on the District–Area Level

When considering the refurbishment of the whole Area_A of the Monterusciello district by means of the SSF integrating fixed 3D-printed PLA and dynamic fabric modules, the simulation results returned a PES of 16.4%, equivalent to a reduction in primary energy consumption of about 1685 MWhp and a reduction in the saved electric energy-linked emissions of 285 tons of CO2 equivalent emissions in one year.
As reported in Figure 13, which shows the main thermal and cooling energy flows of the simulations carried out on the whole Area_A of the Monterusciello district, this is due to a significant reduction in the retrofit case of both the cooling (−47.7%, ~738.9 MWh) and thermal (−12.2%, ~1349.3 MWh) energy demands when compared to the reference case with no refurbishment implemented.
The higher energy demand reductions returned by the Area_A retrofit case, compared to the single-building case, are likely due to (i) thermal interactions between the 511 TZs modelled by Type 56 and (ii) geometric interactions, such as cast shadows due to the buildings’ arrangement and sun position (see Appendix A). Indeed, on the one hand, the radiative interactions between the buildings could be responsible for a reduction in the thermal energy demand of the whole Area_A. On the other hand, the physical/geometric interactions between the buildings and the sun’s position due to the real urban morphology (terrain and buildings’ arrangement) could be responsible for an increase in thermal energy demand due to the cast shadows’ effect: the real slope orientation, along with the proximity of the buildings and the average solar altitude during the heating period, are responsible for considerable cast shadows which greatly reduce the solar gains, thus increasing the energy heating demand. Therefore, the relevance of these effects surely requires far more extensive investigations in future studies.

4. Discussion

This section examines and analyses the contributions of the proposed dynamic SSF system to achieve objectives in the retrofitting of residential buildings. It also considers the potential economic and social impacts on the communities involved, along with recommendations and strategies for enhancing existing policies and developing new policy frameworks. Finally, it delineates the limitations of this study.
Implementing the proposed dynamic SSF systems in Monterusciello offers significant economic and social benefits while presenting challenges that require strategic policy measures. Economically, retrofitting can lower energy costs for residents and stimulate local employment by creating jobs in design, 3D printing, and construction. Additionally, the improved aesthetics and functionality of buildings could increase property values and attract businesses, driving urban revitalisation. Socially, enhanced thermal comfort and reduced energy dependency improve residents’ quality of life. However, the high initial investment due to the need for specialised technology, such as sensors, actuators, and innovative materials, as well as the complexity of dynamic façade design and integration, may strain municipal budgets and residents without appropriate subsidies, and uneven implementation could exacerbate existing inequalities. Moreover, to fully realise the benefits of dynamic façades, stakeholders need to address several critical issues, including the maintenance costs and compatibility with existing building codes and regulations. Therefore, strengthening existing policies can involve expanding subsidies and grants to support retrofitting projects, particularly for low-income households, and launching awareness campaigns highlighting the benefits of energy-efficient renovations. New policies could include tax incentives, rebates for adopting sustainable technologies, and training programs to equip local workers with the skills needed to install and maintain façade systems. Establishing monitoring frameworks would help measure the long-term impact of these interventions.
Moreover, public–private partnerships can mobilise resources for these projects while involving residents in planning to ensure the initiatives meet community needs. Pilot projects in diverse buildings should precede large-scale implementation, allowing feasibility assessments. In addition, integrating retrofitting with broader urban planning goals, such as renewable energy initiatives, could further improve its impact.
The limitations of this research can be summarised as follows:
  • The simulations were conducted using climate data specific to southern Italy (Monterusciello), limiting the generalizability of the findings to other regions;
  • The energy and environmental impact assessments relied on numerical simulations in TRNSYS, which simplified variables such as occupant behaviour, actual solar gains, and thermal bridges. These simplifications may lead to discrepancies between simulated and actual energy savings;
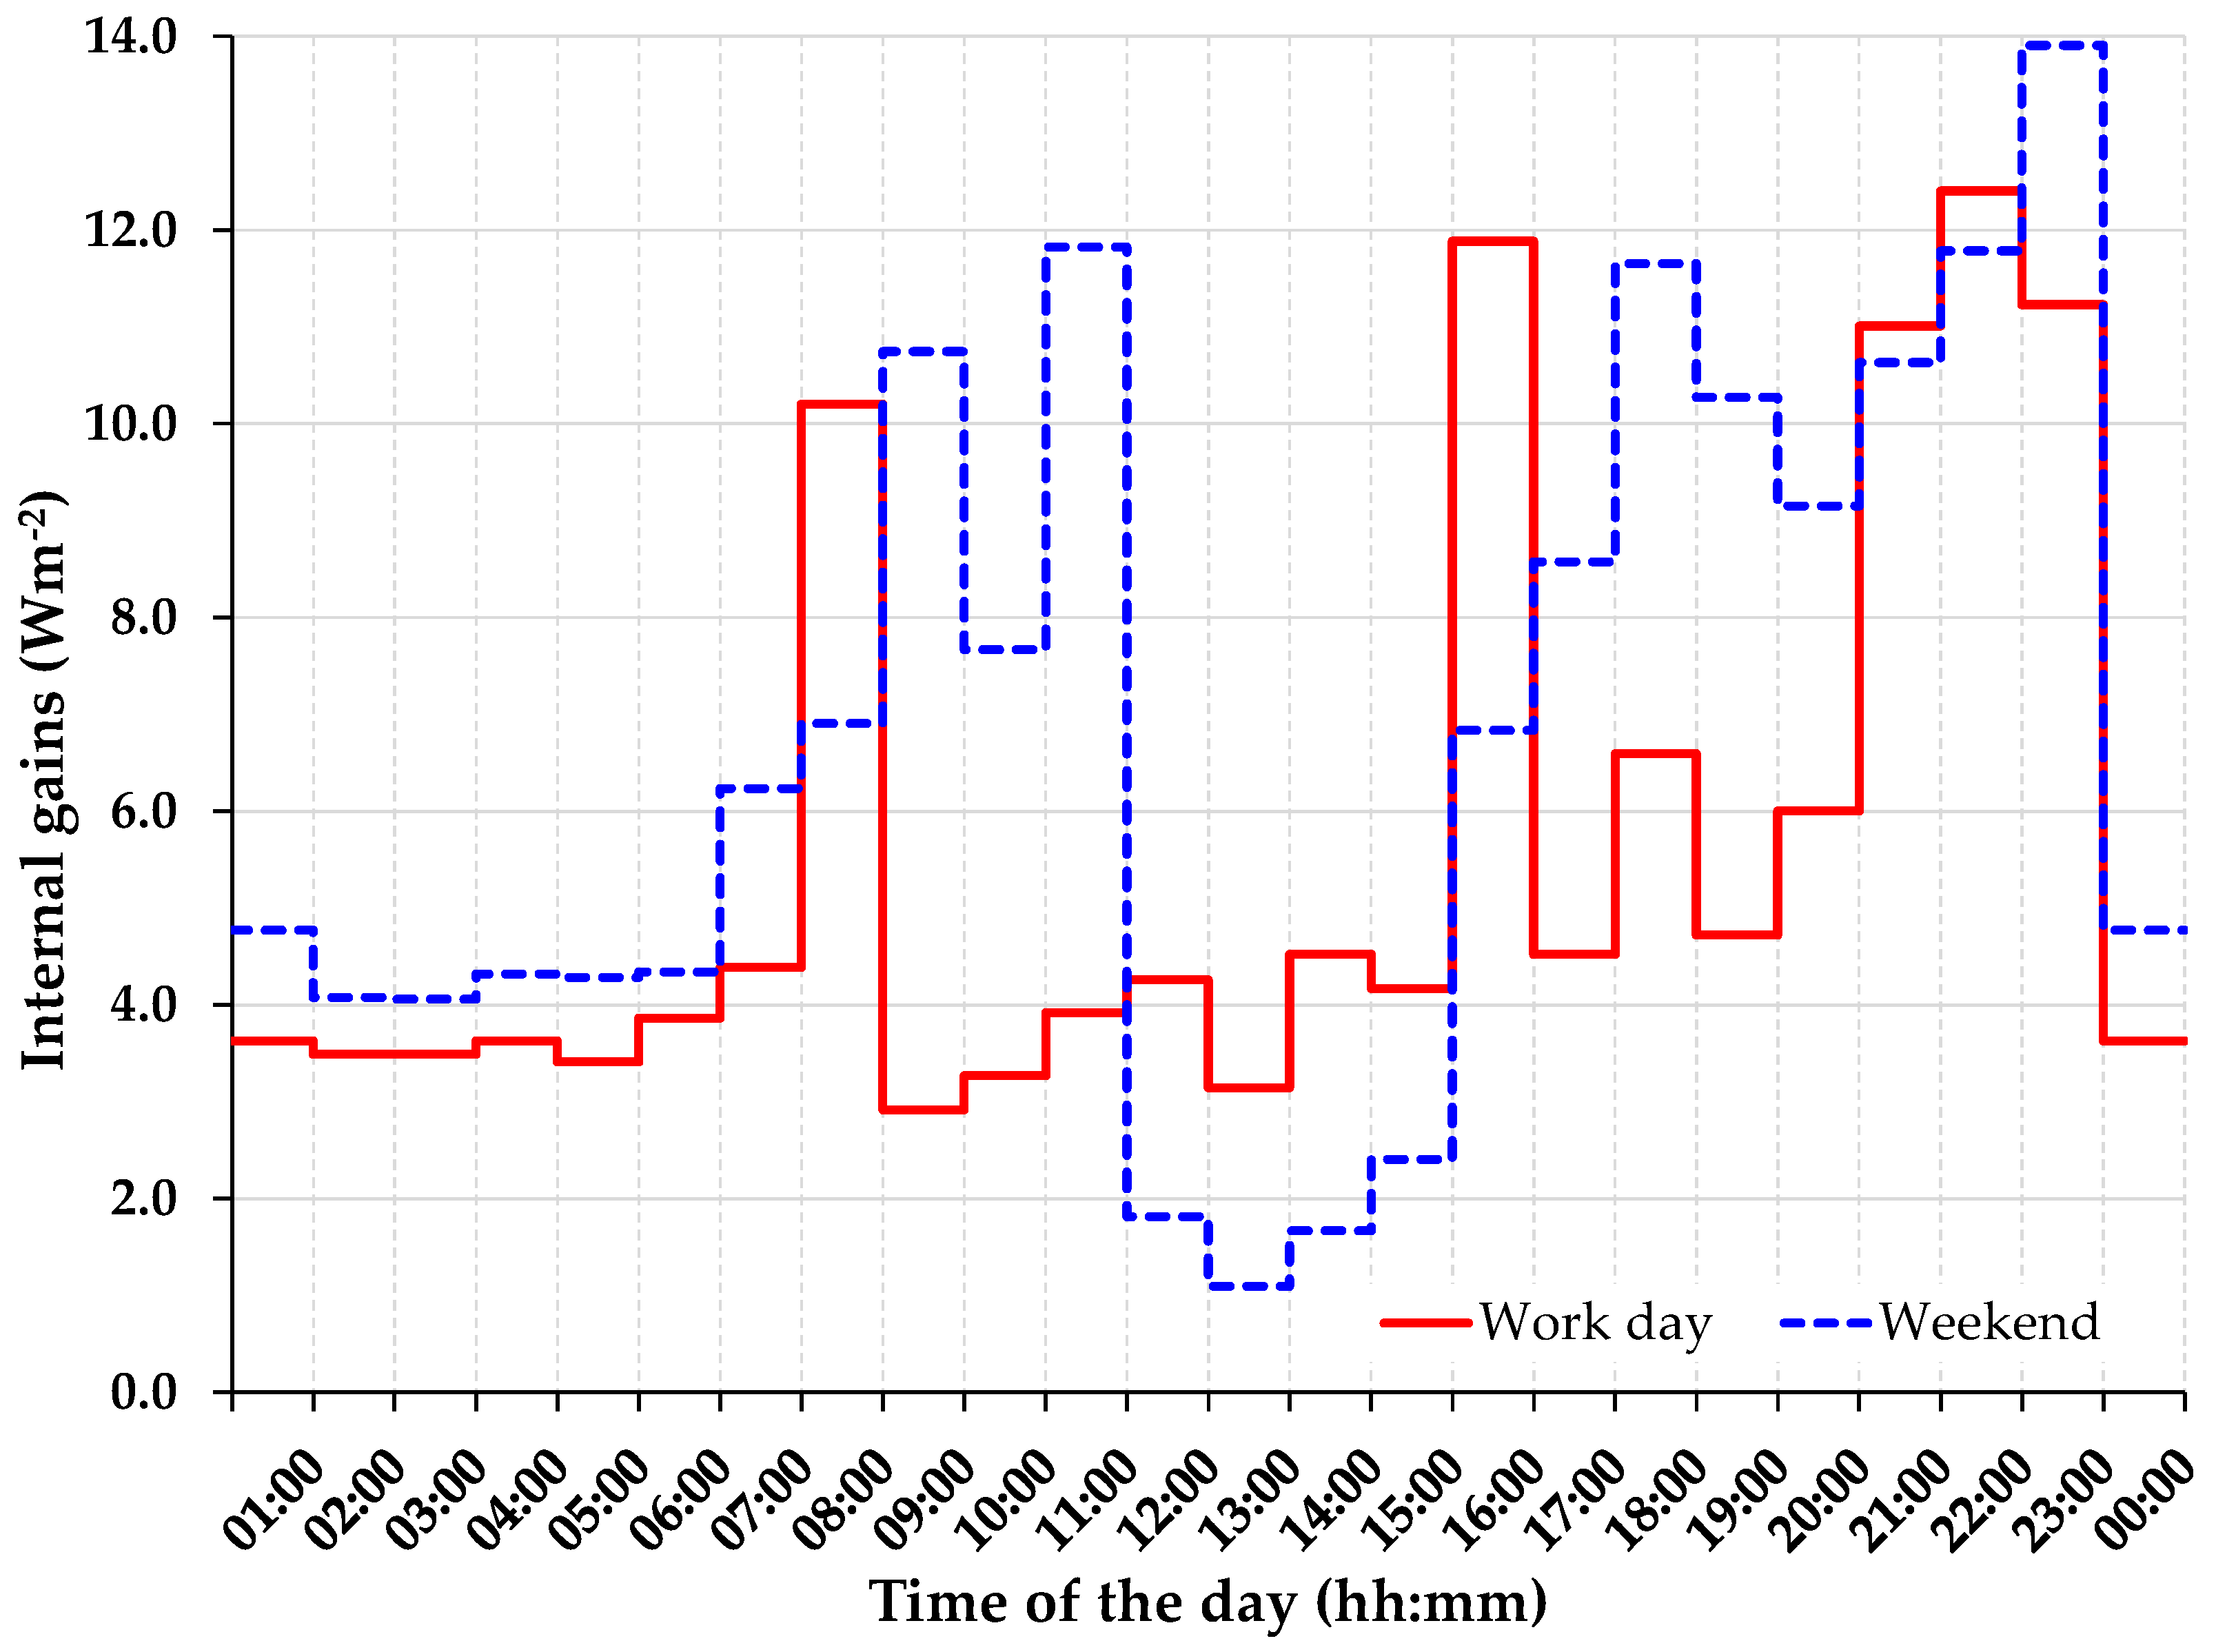
  • No real data on occupant behaviour were available at the time of this study; demand and gain profiles were simplified using references from scientific literature, local legislation, interviews, or archival data;
  • This study focused solely on the energy and environmental performance of the passive retrofit without addressing interventions on active systems;
  • The economic and social benefits of retrofitting, particularly in public housing contexts, were only briefly addressed, with no in-depth analysis of how large-scale retrofits could be implemented from a policy or regulatory standpoint. The proposed solutions may face challenges related to policy frameworks, financing mechanisms, or homeowner adoption, especially in areas with fewer incentives for energy-efficient retrofits.

5. Conclusions

This study evaluated the energy and environmental impacts of retrofitting residential buildings in the Monterusciello district of Pozzuoli, Italy, using a second-skin façade (SSF) system. The Monterusciello district was chosen due to its prefabricated construction, which led to significant degradation and a need for retrofitting. A four-story multi-family building of the Monterusciello district was modelled using the dynamic simulation software TRNSYS. The installation of an SSF system combining 3D-printed (made of five different filaments) and fabric modules was simulated, assessing its performance in terms of reduction in primary energy consumption and carbon dioxide equivalent emissions at both the single building and whole-district scale to also consider the interrelations between buildings and the urban morphology. The following are the key findings:
  • The proposed dynamic SSF system (Cases 3–7) returned better performance in terms of primary energy saving (PES) and reduction in carbon dioxide equivalent emissions (ΔCO2) in comparison to traditional passive retrofit actions (Cases 1 and 2);
  • Cases 3–7 demonstrated reductions in terms of PES (up to 10.5%) and ΔCO2 (up to 2.01 tonCO2,eq per year), thanks to a reduction of both the cooling energy demand of about 6.1 kWh m−2 year−1 and the thermal energy demand of about 2.2 kWh m−2 year−1 in comparison to the reference case (Case 0);
  • Considering the refurbishment of the whole Area_A of the Monterusciello district using the SSF integrating fixed 3D-printed PLA and dynamic fabric modules, the analyses returned a PES value of 16.4% and a ΔCO2 value equal to 285 tonCO2,eq.
Future research should attempt the following:
  • Explore the performance of the SSF system in different climates (e.g., colder or more humid regions) and in urban contexts with varying morphologies or denser city centers;
  • Conduct real-world pilot projects to validate the efficacy of the simulations and identify unforeseen challenges related to installation, maintenance, or user adoption;
  • Develop more dynamic models that include occupant behaviour or varying internal gains based on human activity patterns to improve the representation of energy use;
  • Investigate the long-term durability and economic feasibility of different SSF materials and designs to provide more comprehensive guidance for stakeholders and policymakers;
  • Carry out field surveys, including interviews and audits with occupants, to also assess indoor comfort parameters, such as thermal and visual comfort, and optimize the dynamic control logics of the SSF system for energy savings, operative temperatures, and daylight distribution.

Author Contributions

Y.S.: conceptualisation, methodology, software, validation, formal analysis, investigation, resources, data curation, writing—original draft preparation, writing—review and editing, visualisation, and supervision; G.C.: conceptualisation, methodology, validation, formal analysis, investigation, writing—original draft preparation, writing—review and editing, visualisation, supervision, project administration, and funding acquisition; L.T.: software, investigation, resources, data curation, writing—original draft preparation, and writing—review and editing; M.S.: conceptualisation, methodology, formal analysis, writing—original draft preparation, writing—review and editing, and visualisation; S.S.: conceptualisation, methodology, validation, resources, supervision, project administration, and funding acquisition. All authors have read and agreed to the published version of the manuscript.

Funding

For the publication of this article, the authors would like to thank (i) the “Bando di Ateneo per il finanziamento di progetti di ricerca fondamentale ed applicata dedicato ai giovani Ricercatori” of the University of Campania Luigi Vanvitelli (Italy), Project title: “Design and AssessmeNt of innovative Textile and 3d-printEd systems for HUMan-centered spaces”—DANTEHUM, Project number: CUP: B63C23000650005, and (ii) the Next Generation EU funded PNRR PhD Program, Italian DM 352/2022, Project number: CUP: B31J22000450006, mission: “M4C2”, investment type and scholarship category: “I.3.3 innovativi”, scholarship code: DOT22B2TTX.

Data Availability Statement

Research data will be available on request.

Conflicts of Interest

The authors declare no conflicts of interest.

Appendix A

Figure A1 illustrates the shadow patterns cast by buildings at different times of the year (from November to March) and at two times of the day (9:00 a.m. and 4:00 p.m.), highlighting how sunlight interacts with the built environment in the Area_A of Monterusciello, a district of Pozzuoli (40°49′23″ N 14°07′20″ E, Italian climatic zone C [42]), a city near the Metropolitan Area of Napoli, in Southern Italy, 110 m above sea level.
The shading effects are influenced by the sun’s position relative to the arrangement of the terrain and buildings, as well as the seasonal variation in solar angles. Figure A1 shows that, in all months, the distribution of buildings significantly affects shadow formation. Buildings that are closer together cause overlapping shadow patterns, creating more shaded areas in the urban core. Taller buildings cast longer shadows, affecting adjacent lower structures or open spaces. Moreover, the terrain (Figure 9) also influences how shadows fall. In areas where the terrain has noticeable elevation changes (seen through the contours in the figures), shadows interact differently with sloped surfaces, creating varied shading patterns compared to flat areas.
In particular, the following is true:
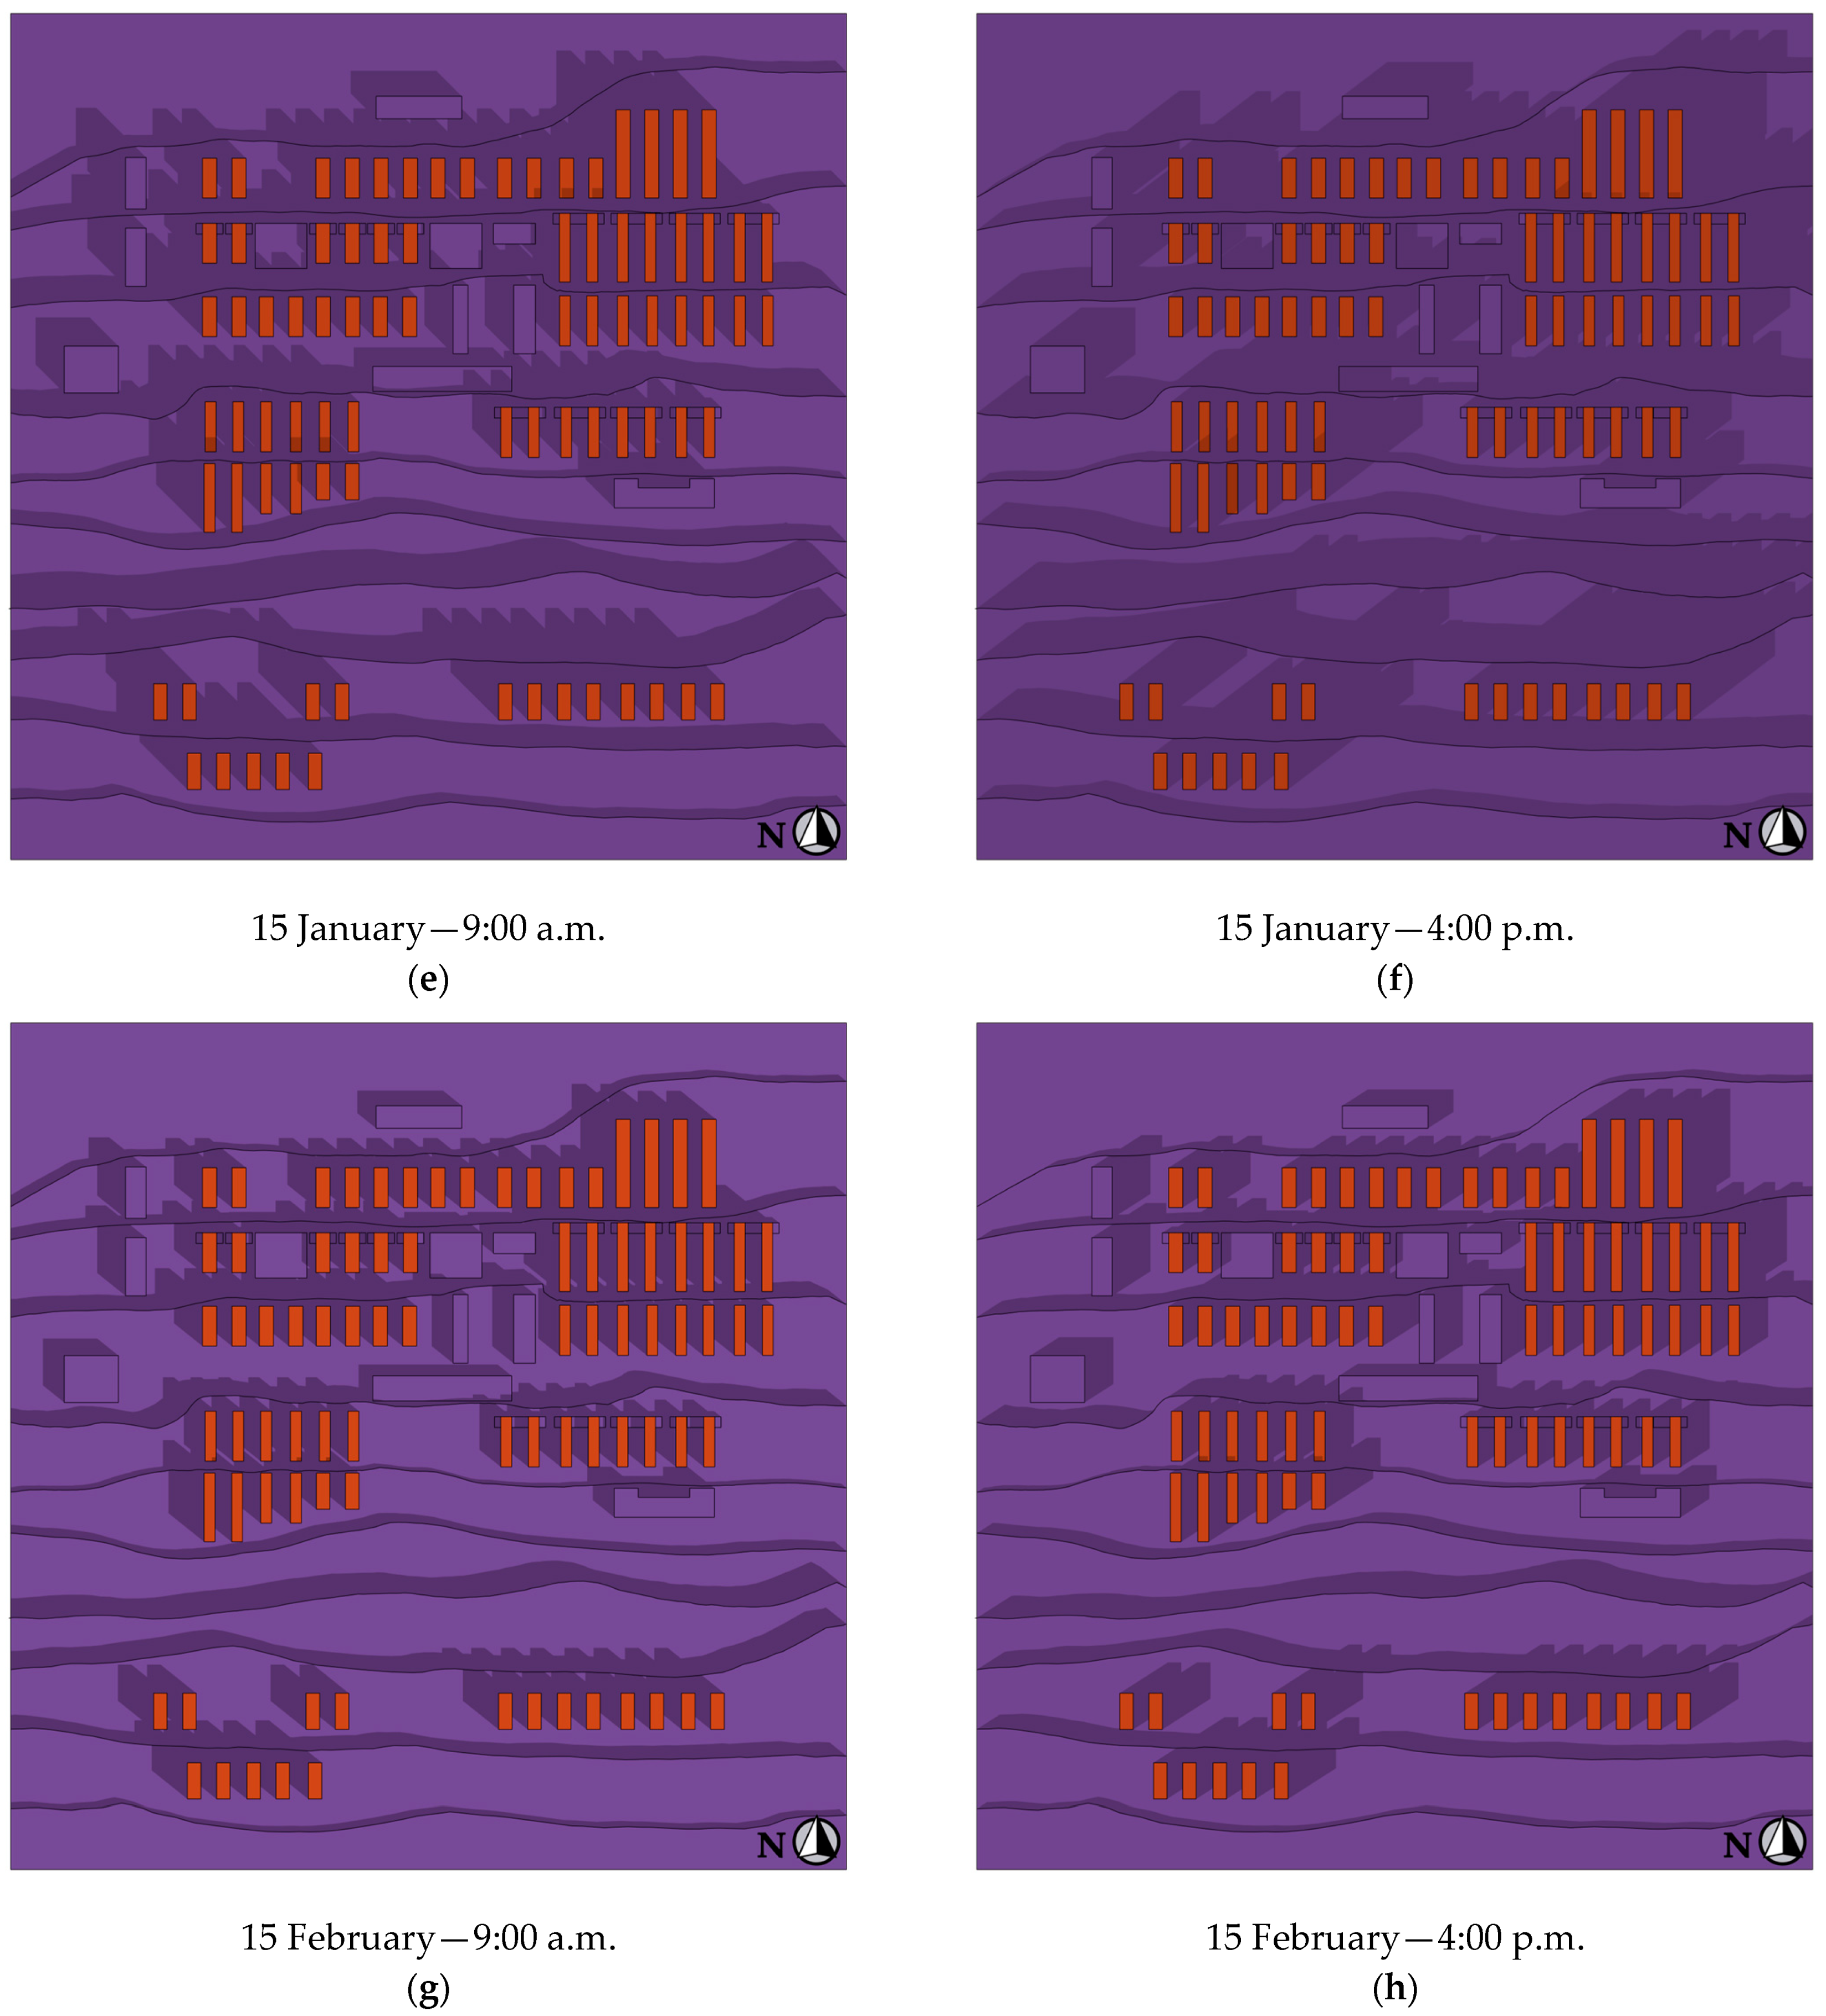
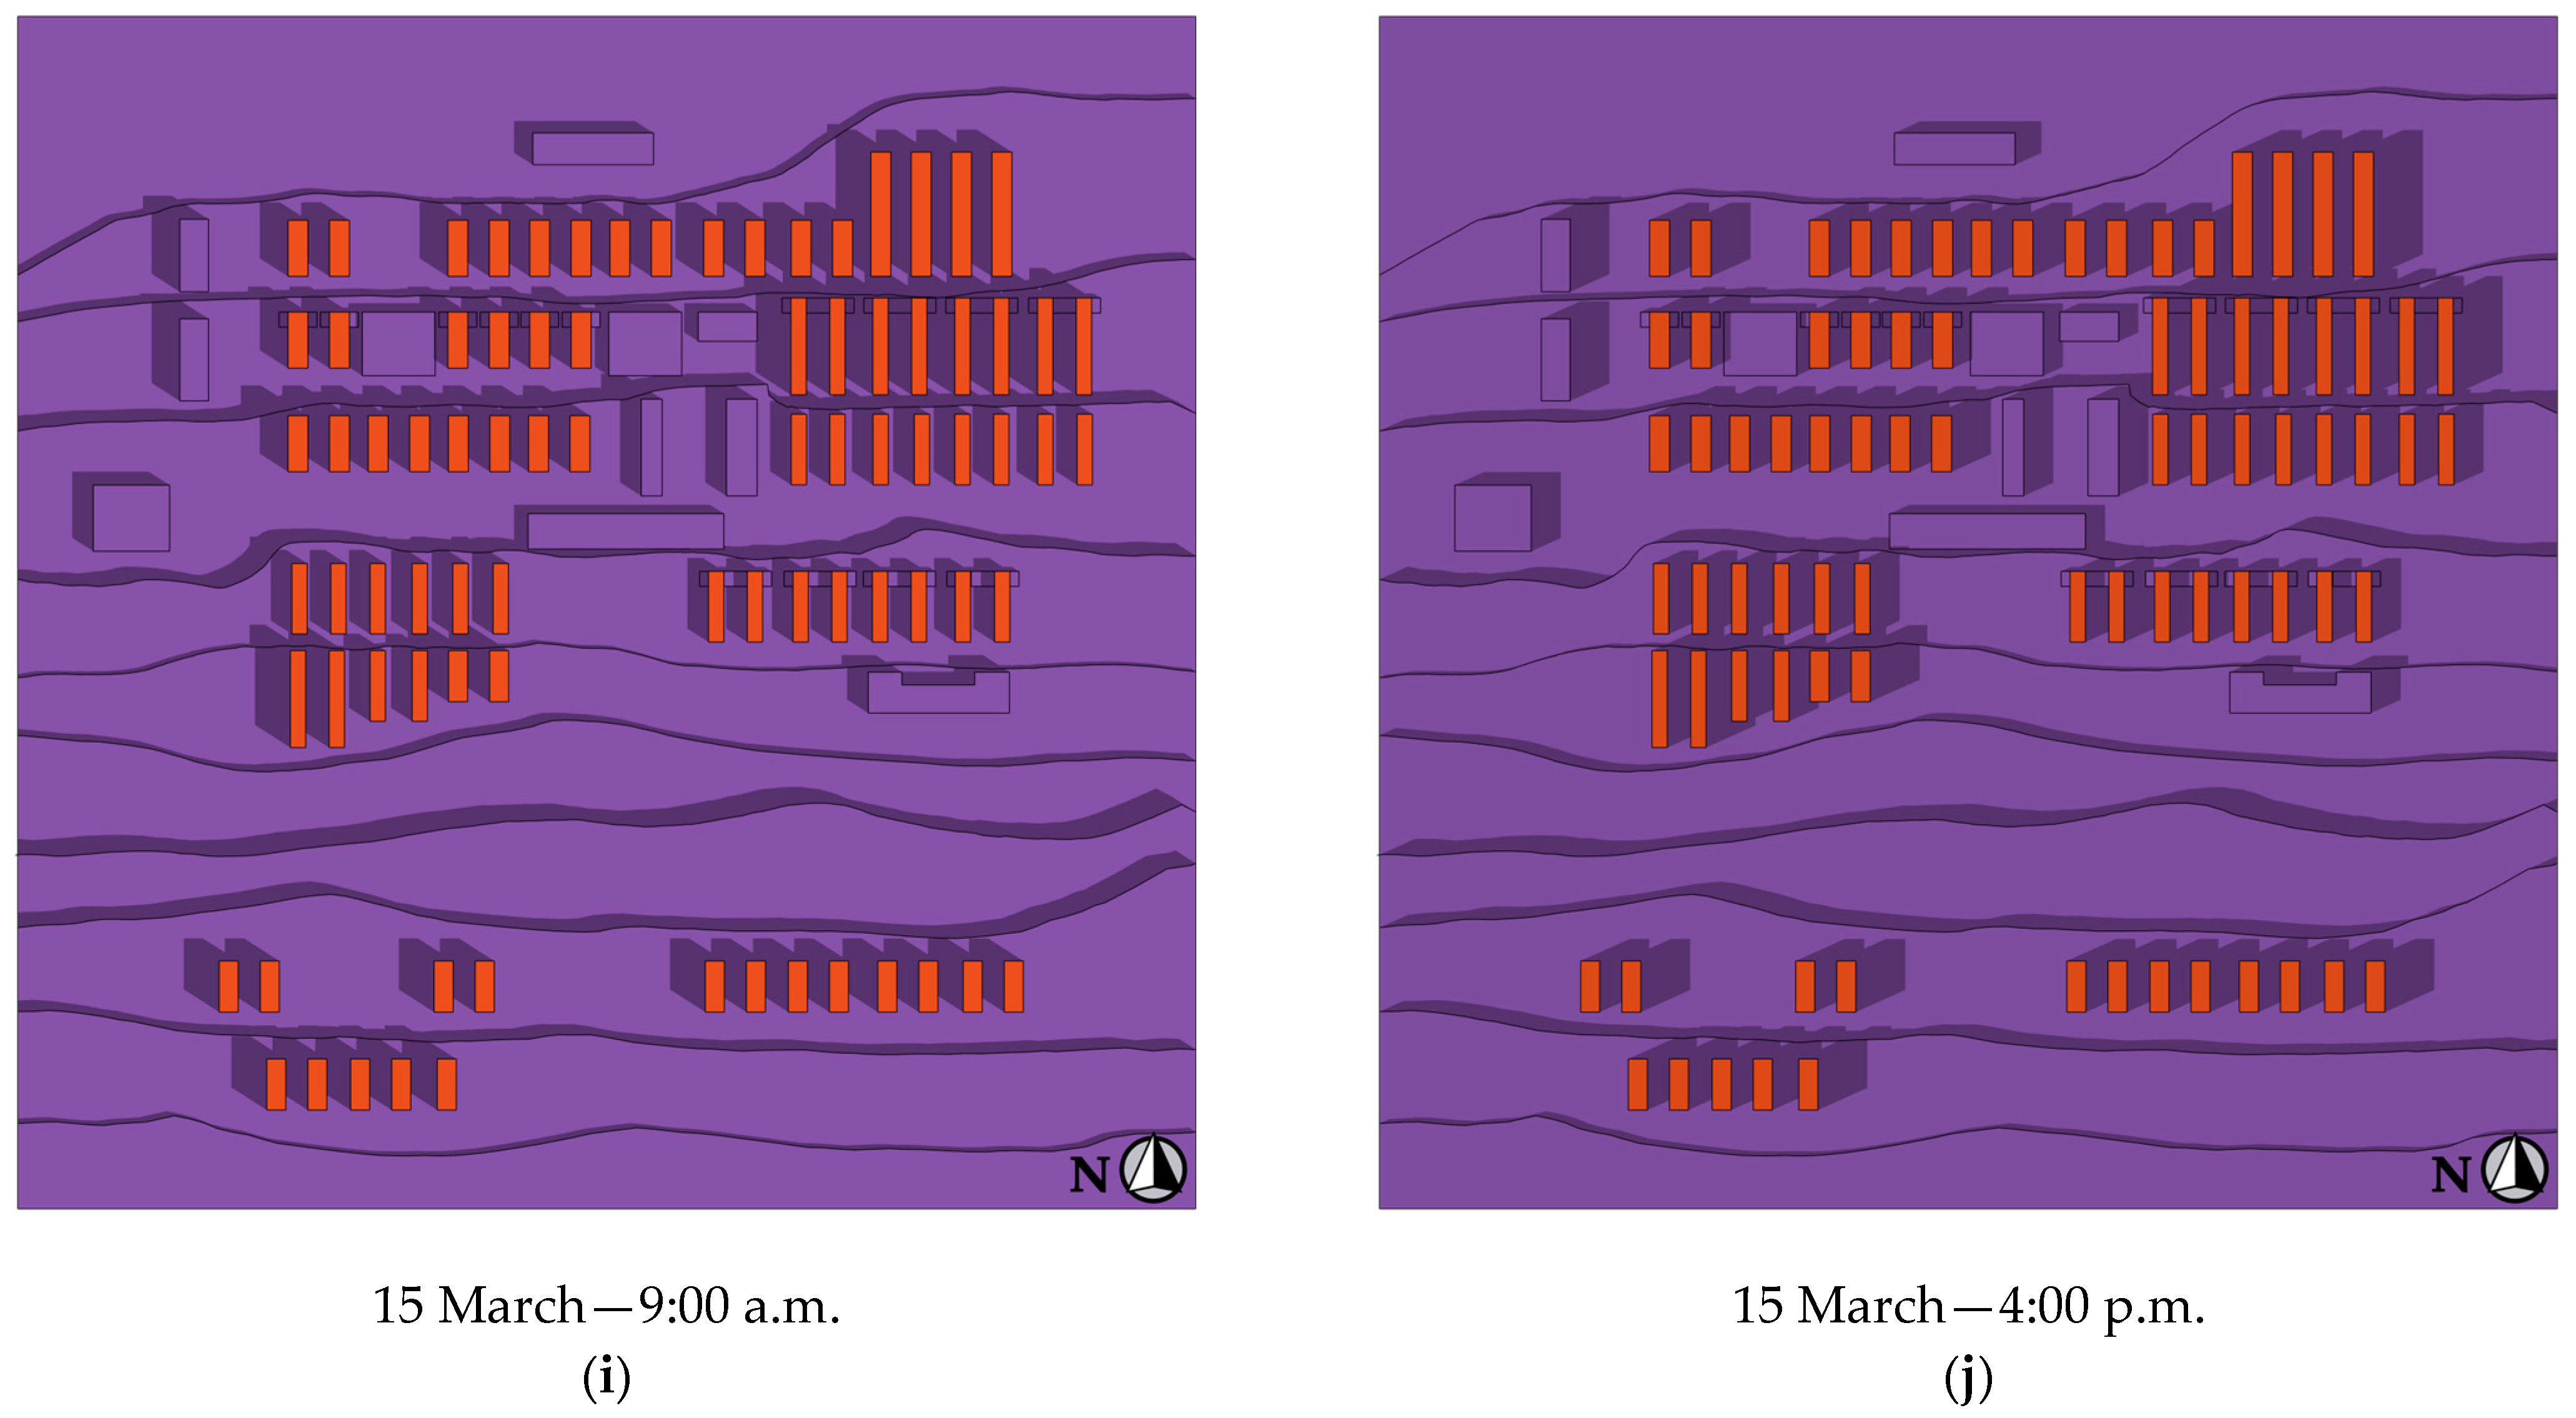
  • In November and December, shadows are longer in both the morning and afternoon, consistent with the sun being at a lower altitude during winter months. The shading pattern indicates that the sun is rising and setting closer to the horizon, which means that the buildings block more sunlight and create deeper, more extended shadows;
  • In January, the length of the shadows remains substantial, though slightly shorter than in December due to the sun’s position being higher in the sky as the days start lengthening;
  • In February and March, the shadows become noticeably shorter compared to the previous months, especially at 9:00 a.m. This is due to the higher sun’s position in the sky as spring approaches, reducing the overall shadow length and modifying the shading pattern.
Figure A1. Shadow patterns cast by buildings at different times of the year: (a) 15 November—9:00 a.m., (b) 15 November—4:00 p.m., (c) 15 December—9:00 a.m., (d) 15 December—4:00 p.m., (e) 15 January—9:00 a.m., (f) 15 January—4:00 p.m., (g) 15 February—9:00 a.m., (h) 15 February—4:00 p.m., (i) 15 March—9:00 a.m., and (j) 15 March—4:00 p.m.
Buildings 15 00189 g0a1aBuildings 15 00189 g0a1bBuildings 15 00189 g0a1c

References

  1. Energy Statistics Data Browser—Data Tools—IEA. Available online: https://www.iea.org/data-and-statistics/data-tools/energy-statistics-data-browser?country=WEOEUR&fuel=Energy%20consumption&indicator=TFCShareBySector (accessed on 22 July 2024).
  2. Kitsopoulou, A.; Ziozas, N.; Iliadis, P.; Bellos, E.; Tzivanidis, C.; Nikolopoulos, N. Energy Performance Analysis of Alternative Building Retrofit Interventions for the Four Climatic Zones of Greece. J. Build. Eng. 2024, 87, 109015. [Google Scholar] [CrossRef]
  3. Buildings—Energy System—IEA. Available online: https://www.iea.org/energy-system/buildings (accessed on 19 September 2024).
  4. European Commission. Energy Performance of Buildings Directive. Available online: https://energy.ec.europa.eu/topics/energy-efficiency/energy-efficient-buildings/energy-performance-buildings-directive_en (accessed on 22 July 2024).
  5. Wu, S.; Sun, K.; Bi, Y.; Shi, M.; Yu, L. Carbon Reduction Potential of Housing Retrofits: Evidence from China. Renew. Sustain. Energy Rev. 2024, 200, 114580. [Google Scholar] [CrossRef]
  6. Nikdel, L.; Agee, P.; Reichard, G.; McCoy, A. Net Zero Energy Housing: An Empirical Analysis from Measured Data. Energy Build. 2022, 270, 112275. [Google Scholar] [CrossRef]
  7. Yilmaz, D.G.; Cesur, F. A Study for the Improvement of the Energy Performance Certificate (EPC) System in Turkey. Sustainability 2023, 15, 14074. [Google Scholar] [CrossRef]
  8. Kirme, S.K.; Kapse, V.S. A comprehensive Review of Residential Building Energy Efficiency Measures in India. Energy Build. 2024, 319, 114537. [Google Scholar] [CrossRef]
  9. Panjaitan, T.W.S.; Pandyaswargo, A.H.; Atmaja, T.D.; Firman, F.A.; Al Irsyad, M.I. Drawing Insights from Japan’s Energy Efficiency Policies for Indonesia’s Progress. Indones. J. Energy 2024, 7, 107–123. [Google Scholar] [CrossRef]
  10. Berry, S.; Moore, T.; Ambrose, M. Australia’s Experience of Combining Building Energy Standards and Disclosure Regulation. Front. Sustain. Cities 2022, 4, 801460. [Google Scholar] [CrossRef]
  11. Moskaleva, A.; Safonov, A.; Hernández-Montes, E. Fiber-Reinforced Polymers in Freeform Structures: A Review. Buildings 2021, 11, 481. [Google Scholar] [CrossRef]
  12. Li, Q.; Zanelli, A. A Review on Fabrication and Applications of Textile Envelope Integrated Flexible Photovoltaic Systems. Renew. Sustain. Energy Rev. 2021, 139, 110678. [Google Scholar] [CrossRef]
  13. Ahmed, G.H. A Review of “3D Concrete Printing”: Materials and Process Characterization, Economic Considerations and Environmental Sustainability. J. Build. Eng. 2023, 66, 105863. [Google Scholar] [CrossRef]
  14. Bedarf, P.; Dutto, A.; Zanini, M.; Dillenburger, B. Foam 3D Printing for Construction: A Review of Applications, Materials, and processes. Autom. Constr. 2021, 130, 103861. [Google Scholar] [CrossRef]
  15. Craveiro, F.; Duarte, J.P.; Bártolo, H.; Bártolo, P. Moving Forward to 3D/4D Printed Building Facades. In Proceedings of the Progress in Digital and Physical Manufacturing. ProDPM 2019. Lecture Notes in Mechanical Engineering; Springer: Leiria, Portugal, 2019; pp. 277–282. [Google Scholar]
  16. Spanodimitriou, Y.; Ciampi, G.; Tufano, L.; Scorpio, M. Flexible and Lightweight Solutions for Energy Improvement in Construction: A Literature Review. Energies 2023, 16, 6637. [Google Scholar] [CrossRef]
  17. Ciampi, G.; Spanodimitriou, Y.; Scorpio, M.; Rosato, A.; Sibilio, S. Integration of a Flexible Tensile Material in a Second Skin Façade System: A Passive Method to Enhance the Energy Performances of the Italian Building Scenario. In Proceedings of the 2021 Building Simulation Conference, Bruges, Belgium, 1–3 September 2021; pp. 2821–2828. [Google Scholar]
  18. Basińska, M.; Kaczorek, D.; Koczyk, H. Economic and Energy Analysis of Building Retrofitting Using Internal Insulations. Energies 2021, 14, 2446. [Google Scholar] [CrossRef]
  19. Elzeyadi, I. The Impacts of Dynamic Façade Shading Typologies on Building Energy Performance and Occupant’s Multi-Comfort. Arch. Sci. Rev. 2017, 60, 316–324. [Google Scholar] [CrossRef]
  20. Ibañez-Puy, M.; Vidaurre-Arbizu, M.; Sacristán-Fernández, J.A.; Martín-Gómez, C. Opaque Ventilated Façades: Thermal and Energy Performance Review. Renew. Sustain. Energy Rev. 2017, 79, 180–191. [Google Scholar] [CrossRef]
  21. Saroglou, T.; Theodosiou, T.; Givoni, B.; Meir, I.A. Studies on the Optimum Double-Skin Curtain Wall Design for High-Rise Buildings in the Mediterranean Climate. Energy Build. 2020, 208, 109641. [Google Scholar] [CrossRef]
  22. Building Envelopes—IEA. Available online: https://www.iea.org/energy-system/buildings/building-envelopes#tracking (accessed on 19 September 2024).
  23. Funding Energiesprong Global Alliance Energiesprong Project. Available online: https://energiesprong.org/ (accessed on 22 July 2024).
  24. Santarsiero, G.; Misceo, M.; Aversa, P.; Candigliota, E.; Di Micco, A.; Hugony, F.; Manfredi, V.; Marghella, G.; Marzo, A.; Masi, A.; et al. Holistic Assessment for Social Housing Retrofitting: Integrating Seismic, Energy, and Social Aspects in the REHOUSE Project. Buildings 2024, 14, 3659. [Google Scholar] [CrossRef]
  25. Hu, X.; Xiang, Y.; Zhang, H.; Lin, Q.; Wang, W.; Wang, H. Active–Passive Combined Energy-Efficient Retrofit of Rural Residence with Non-Benchmarked Construction: A Case Study in Shandong Province, China. Energy Rep. 2021, 7, 1360–1373. [Google Scholar] [CrossRef]
  26. Brito-Coimbra, S.; Aelenei, D.; Gomes, M.G.; Rodrigues, A.M. Building Façade Retrofit with Solar Passive Technologies: A Literature Review. Energies 2021, 14, 1774. [Google Scholar] [CrossRef]
  27. Balali, A.; Hakimelahi, A.; Valipour, A. Identification and Prioritization of Passive Energy Consumption Optimization Measures in the Building Industry: An Iranian Case Study. J. Build. Eng. 2020, 30, 101239. [Google Scholar] [CrossRef]
  28. Ciampi, G.; Spanodimitriou, Y.; Scorpio, M.; Rosato, A.; Sibilio, S. Energy Performance of PVC-Coated Polyester Fabric as Novel Material for the Building Envelope: Model Validation and a Refurbishment Case Study. J. Build. Eng. 2021, 41, 102437. [Google Scholar] [CrossRef]
  29. Zhao, Z.; Liu, H.; Chen, Z. Thermal Behavior of Large-Span Reticulated Domes Covered by ETFE Membrane Roofs under Solar radiation. Thin-Walled Struct. 2017, 115, 1–11. [Google Scholar] [CrossRef]
  30. Flor, J.-F.; Liu, D.; Sun, Y.; Beccarelli, P.; Chilton, J.; Wu, Y. Optical Aspects and Energy Performance of Switchable Ethylene-tetrafluoroethylene (ETFE) Foil Cushions. Appl. Energy 2018, 229, 335–351. [Google Scholar] [CrossRef]
  31. Karimi, F.; Soltani, P.; Zarrebini, M.; Hassanpour, A. Acoustic and Thermal Performance of Polypropylene Nonwoven Fabrics for Insulation in Buildings. J. Build. Eng. 2022, 50, 104125. [Google Scholar] [CrossRef]
  32. Scorpio, M.; Ciampi, G.; Spanodimitriou, Y.; Laffi, R.; Rosato, A.; Sibilio, S. Double-Skin Facades With Semi-Transparent Modules For Building Retrofit Actions: Energy And Visual Performances. In Proceedings of the Building Simulation 2019, Rome, Italy, 2–4 September 2019. [Google Scholar]
  33. Spanodimitriou, Y.; Ciampi, G.; Scorpio, M.; Mokhtari, N.; Teimoorzadeh, A.; Laffi, R.; Sibilio, S. Passive Strategies for Building Retrofitting: Performances Analysis and Incentive Policies for the Iranian Scenario. Energies 2022, 15, 1628. [Google Scholar] [CrossRef]
  34. Ciampi, G.; Spanodimitriou, Y.; Nocente, A.; Scorpio, M.; Sibilio, S. Energy Performances of Tensile Material in Building Renovation in the Nordic Region. E3S Web Conf. 2022, 362, 05003. [Google Scholar] [CrossRef]
  35. Kamel, E.; Kazemian, A. BIM-Integrated Thermal Analysis and Building Energy Modeling in 3D-Printed Residential Buildings. Energy Build. 2023, 279, 112670. [Google Scholar] [CrossRef]
  36. Na, S.; Kim, S.; Moon, S. Additive Manufacturing (3D Printing)-Applied Construction: Smart Node System for an Irregular Building Façade. J. Build. Eng. 2022, 56, 104743. [Google Scholar] [CrossRef]
  37. Sarakinioti, M.V.; Konstantinou, T.; Turrin, M.; Tenpierik, M.; Loonen, R.; De Klijn-Chevalerias, M.L.; Knaack, U. Development and Prototyping of an Integrated 3D-Printed Façade for Thermal Regulation in Complex Geometries. J. Facade Des. Eng. 2018, 6, 29–40. [Google Scholar] [CrossRef]
  38. Ciampi, G.; Spanodimitriou, Y.; Scorpio, M.; Rosato, A.; Sibilio, S. Energy Performances Assessment of Extruded and 3D Printed Polymers Integrated into Building Envelopes for a South Italian Case Study. Buildings 2021, 11, 141. [Google Scholar] [CrossRef]
  39. Mortarotti, G.; Morganti, M.; Cecere, C. Thermal Analysis and Energy-Efficient Solutions to Preserve Listed Building Façades: The INA-Casa Building Heritage. Buildings 2017, 7, 56. [Google Scholar] [CrossRef]
  40. Mokhtari, N.; Ciampi, G.; Spanodimitriou, Y.; Nocente, A.; Manni, M.; Lobaccaro, G.; Scorpio, M.; Sibilio, S. Textile as Second-Skin Façade for Building Envelope Retrofitting: A Numerical Analysis on the Comfort, Energy and Environmental Impacts in Different European Climates. In Proceedings of the Building Simulation 2023: 18th Conference of IBPSA, Shanghai, China, 4–6 September 2023; pp. 1901–1908. [Google Scholar]
  41. TRNSYS. Transient System Simulation Tool. Available online: http://www.trnsys.com (accessed on 22 July 2024).
  42. DPR 412/93 and DPR 551/99 Decree of the President of the Italian Republic. Available online: https://www.gazzettaufficiale.it/eli/id/2000/04/06/000G0118/sg (accessed on 19 September 2024).
  43. Solano, V. Monterusciello: The New Town. Available online: https://www.valentinasolano.it/monterusciello-the-new-town/ (accessed on 19 September 2024).
  44. Discetti, E.; Discetti, P.; Masturzo, A. Progetto Esecutivo Intervento di “Rigenerazione Eco-Energetica Degli Edifici Erp del Quartiere di Monterusciello”; Pozzuoli. 2020. Available online: https://halleyweb.com/c063060/zf/index.php/atti-amministrativi/delibere/dettaglio/atto/G5WpBMETUTT0-A (accessed on 19 September 2024).
  45. Trimble Inc. SketchUp. Available online: https://www.sketchup.com/en (accessed on 22 July 2024).
  46. Energyplus Energyplus_Weather_Naples.162890_IWEC. Available online: https://energyplus.net/weather-location/europe_wmo_region_6/ITA/ITA_Naples.162890_IWEC (accessed on 22 April 2024).
  47. CEN/TC 228—Heating Systems in Buildings; CEN/TC 228/WG 4—Calculation Methods and System Performance and Evaluation EN 12831:2003—Heating Systems in Buildings—Method for Calculation of the Design Heat Load. 2003. Available online: https://standards.iteh.ai/catalog/standards/cen/5a4acdae-ff13-4411-8b0b-b54c65c4f91c/en-12831-2003?srsltid=AfmBOoojYgMeuCkBaPak05TkrGlD8bPFY7-i5boCuMBaWJY8BDR4vibn (accessed on 19 September 2024).
  48. CTI UNI TS 11300-1:2014; Energy Performance of Buildings—Part 1: Evaluation of Energy Need for Space Heating and Cooling. UNI: Milan, Italy, 2014.
  49. Angrisani, G.; Canelli, M.; Roselli, C.; Sasso, M. Microcogeneration in Buildings with Low Energy Demand in Load Sharing Application. Energy Convers. Manag. 2015, 100, 78–89. [Google Scholar] [CrossRef]
  50. Barton, J.; Thomson, M. CREST Demand Model v2.3.3—A High-Resolution Stochastic Integrated Ther-mal-Electrical Domestic Demand Simulation Tool 2020. Available online: https://repository.lboro.ac.uk/articles/dataset/CREST_Demand_Model_v2_0/2001129 (accessed on 19 September 2024).
  51. Zarrella, A.; De Carli, M.; Peretti, C. Radiant Floor Cooling Coupled with Dehumidification Systems in Residential Buildings: A Simulation-Based Analysis. Energy Convers. Manag. 2014, 85, 254–263. [Google Scholar] [CrossRef]
  52. Clint Technical Data Sheet Model CRA/K 15÷131. Available online: https://clint.it/en/products/watercooled-condenserless-liquid-chillers-and-heat-pumps-for-commercial-industrial-application-remote-condensers-3/watercooled-water-chillers-and-heat-pumps/cwwkwp-15151/ (accessed on 19 September 2024).
  53. Plastifab Plastispan-Insulation. Available online: https://www.plastifab.com/products/plastispan-insulation/plastispan-20.html (accessed on 10 September 2024).
  54. Settino, J.; Carpino, C.; Perrella, S.; Arcuri, N. Multi-Objective Analysis of a Fixed Solar Shading System in Different Climatic Areas. Energies 2020, 13, 3249. [Google Scholar] [CrossRef]
  55. Mandalaki Maria and Tsoutsos, T. Shading Systems: Their Relation to Thermal Conditions. In Solar Shading Systems: Design, Performance, and Integrated Photovoltaics; Springer International Publishing: Cham, Switzerland, 2020; pp. 23–66. ISBN 978-3-030-11617-0. [Google Scholar]
  56. TRNSYS Thermal Energy System Specialists, TESS Individual Components—TYPE 1230: Ventilated Air Cavity Wall (Ventilated Facade). Available online: https://www.trnsys.com/tess-libraries/individual-components.php.html (accessed on 19 September 2024).
  57. Shemelya, C.; De La Rosa, A.; Torrado, A.R.; Yu, K.; Domanowski, J.; Bonacuse, P.J.; Martin, R.E.; Juhasz, M.; Hurwitz, F.; Wicker, R.B.; et al. Anisotropy of Thermal Conductivity in 3D Printed Polymer Matrix Composites for Space Based Cube Satellites. Addit. Manuf. 2017, 16, 186–196. [Google Scholar] [CrossRef]
  58. Hasselman, D.; Johnson, L.F. Effective Thermal Conductivity of Composites with Interfacial Thermal Barrier Resistance. J. Compos. Mater. 1987, 21, 508–515. [Google Scholar] [CrossRef]
  59. Sarvestani, H.Y.; Akbarzadeh, A.; Niknam, H.; Hermenean, K. 3D Printed Architected Polymeric Sandwich Panels: Energy Absorption and Structural Performance. Compos. Struct. 2018, 200, 886–909. [Google Scholar] [CrossRef]
  60. Acrylonitrile Styrene Acrylate (ASA) Filament. Available online: https://www.makeitfrom.com/material-properties/Acrylonitrile-Styrene-Acrylate-ASA (accessed on 4 July 2024).
  61. Polyamide (PA, Nylon) 6/6 (66, Nylon 101) Filament. Available online: https://www.makeitfrom.com/material-properties/Polyamide-PA-Nylon-6-6-66-Nylon-101 (accessed on 4 July 2024).
  62. Glycol-Modified Polyethylene Terephthalate (PETG, PET-G) Filament. Available online: https://www.makeitfrom.com/material-properties/Glycol-Modified-Polyethylene-Terephthalate-PETG-PET-G (accessed on 4 July 2024).
  63. Polylactic Acid (PLA, Polylactide) Filament. Available online: https://www.makeitfrom.com/material-properties/Polylactic-Acid-PLA-Polylactide (accessed on 4 July 2024).
  64. Polymethylmethacrylate (PMMA, Acrylic) Filament. Available online: https://www.makeitfrom.com/material-properties/Polymethylmethacrylate-PMMA-Acrylic (accessed on 4 July 2024).
  65. Stephan, K.; Laesecke, A. The Thermal Conductivity of Fluid Air. J. Phys. Chem. Ref. Data 1985, 14, 227–234. [Google Scholar] [CrossRef]
  66. Gregor-Svetec, D. Polymers in Printing Filaments. In Polymers for 3D Printing: Methods, Properties, and Characteristics; William Andrew Publishing: Norwich, NY, USA, 2022; pp. 155–269. [Google Scholar] [CrossRef]
  67. Oladapo, B.I.; Bowoto, O.K.; Adebiyi, V.A.; Ikumapayi, O.M. Net Zero on 3D Printing Filament Recycling: A Sustainable Analysis. Sci. Total Environ. 2023, 894, 165046. [Google Scholar] [CrossRef]
  68. Serge Ferrari Frontside View 381. Available online: https://www.sergeferrari.com/productsfrontside-range/frontside-view-381 (accessed on 22 July 2024).
  69. Cortiços, N.D. Improving Residential Building Efficiency with Membranes Over Façades: The Mediterranean Context. J. Build. Eng. 2020, 32, 101421. [Google Scholar] [CrossRef]
  70. Ascione, F.; Bianco, N.; Iovane, T.; Mastellone, M.; Mauro, G.M. The Evolution of Building Energy Retrofit Via Double-Skin and Responsive Façades: A Review. Sol. Energy 2021, 224, 703–717. [Google Scholar] [CrossRef]
  71. DM 26 Giugno 2015 Italian Minister Decree. Available online: https://www.mimit.gov.it/index.php/it/normativa/decreti-interministeriali/decreto-interministeriale-26-giugno-2015-adeguamento-linee-guida-nazionali-per-la-certificazione-energetica-degli-edifici (accessed on 19 September 2024).
  72. Marrasso, E.; Roselli, C.; Sasso, M. Electric Efficiency Indicators and Carbon Dioxide Emission Factors for Power Generation by Fossil and Renewable Energy Sources on Hourly Basis. Energy Convers. Manag. 2019, 196, 1369–1384. [Google Scholar] [CrossRef]
Figure 1. Aerial view of the Monterusciello district.
Buildings 15 00189 g001
Figure 2. Schematic view of the Monterusciello district, with details on the buildings’ typologies in Area_A.
Buildings 15 00189 g002
Figure 3. Methodological framework, from the single building’s selection to the whole-area performance analysis.
Buildings 15 00189 g003
Figure 4. Reference building: (a) photo and (b) planimetry of a typical upper floor highlighting the recessed area for the ground floor.
Buildings 15 00189 g004
Figure 5. Model of the reference building, divided into six thermal zones: (a) south–east and (b) north–west views.
Buildings 15 00189 g005
Figure 6. Values of the workday and weekend internal gains (in W m−2) used in the simulations [49,50].
Buildings 15 00189 g006
Figure 7. Heating and cooling load-duration diagram associated with the whole building.
Buildings 15 00189 g007
Figure 8. Schematic view of the retrofit action.
Buildings 15 00189 g008
Figure 9. Geometrical model of the thermal zones for the Area_A of the Monterusciello district.
Buildings 15 00189 g009
Figure 10. Values of (a) PES and (b) ΔCO2 upon varying the retrofit simulation cases.
Buildings 15 00189 g010
Figure 11. Thermal (light red) and cooling (light blue) energy flows vary depending on the simulation case study and the month of the year for the residential building.
Buildings 15 00189 g011
Figure 12. Minimum, average, and maximum values of the operative temperatures as a function of the months associated with Case 0 and Case 6 for the (a) TZ_3 and (b) TZ_5.
Buildings 15 00189 g012
Figure 13. Thermal and cooling energy flows for the whole Area_A upon varying the simulation case study and the month of the year.
Buildings 15 00189 g013
Table 1. Main external dimensions and characteristics of the residential buildings [43,44].
ParameterTypology ATypology BTypology CTypology DTypology E
Length (m)36.6081.0046.0033.3063.10
Width (m) 13.0013.0010.0012.4010.00
Height (m)12.0015.009.0015.0015.00
Covered ground area (m2)475.801053.00460.00412.92631.00
N. of floors (-)45355
N. of buildings per typology (-)254241910
WWR North façade (%)88595
Opaque area (m2)143.07178.8485.15169.84141.92
Transparent area (m2)12.9316.264.8516.158.08
WWR South façade (%)56464
Opaque area (m2)147.36184.286.76175.00144.60
Transparent area (m2)8.5410.803.2410.805.40
WWR West façade (%)2121192121
Opaque area (m2)345.92969.93335.53395.94751.48
Transparent area (m2)93.28251.5278.46103.56195.02
WWR East façade (%)2022212221
Opaque area (m2)350.58955.61327.04392.06746.21
Transparent area (m2)88.62268.8486.96107.44200.29
Table 2. Main characteristics of the reference building’s construction components [44].
ComponentLayers
(Inside to Outside)
Thickness
(mm)
Density
(kg m−3)
Thermal Conductivity
(W m−1 K−1)
Thermal Capacity
(kJ kg−1 K−1)
Thermal Transmittance
(W m−2 K−1)
External wallsPlaster15.014000.7001.010.85
Concrete panel80.014001.5651.00
Polystyrene panel37.0300.0451.22
Vapor barrier3.011000.1000.90
Concrete panel120.014001.5651.00
RoofConcrete panel180.014001.5651.002.69
Screed 30.020001.0601.00
Bitumen10.012000.1701.00
Ground floorCeramic tiles10.017001.4701.002.23
Screed30.020001.0601.00
Concrete panel380.014001.5651.00
Internal wallsPlaster10.014000.7001.012.38
Bricks80.06000.3600.84
Plaster10.014000.7001.01
Internal floorsCeramic tiles10.017001.4701.003.12
Screed30.020001.0601.00
Concrete panel180.014001.5651.00
WindowsSingle glass glazing4---6.12
Table 3. Characteristics of the fixed 3D-printed modules upon varying the filament.
FilamentDensity
(kg m−3)
Specific Heat
(kJ kg−1 K−1)
Thermal Conductivity
(W m−1 K−1)
Cost Range
($ m−2)
ASA3401.0960.05385–170
NYLON PA66 4931.0960.077197–395
PETG4111.0650.08282–164
PLA pro HT4011.2200.045120–200
PMMA3501.1510.05970–175
Table 4. Summary of the case studies.
Case StudyRetrofit Action and MaterialInsulation Thickness
(m)
Façades Thermal
Transmittance
(W m−2 K−1)
Case 0--0.85
Case 1 Insulation0.0650.36
Case 2 Opaque fixed shading (no insulation)-0.85
Case 3SSF made of fixed 3D-printed ASA and dynamic fabric modules0.0520.36
Case 4SSF made of fixed 3D-printed NYLON and dynamic fabric modules 0.054
Case 5SSF made of fixed 3D-printed PETG and dynamic fabric modules0.055
Case 6SSF made of fixed 3D-printed PLA and dynamic fabric modules0.051
Case 7SSF made of fixed 3D-printed PMMA and dynamic fabric modules0.053
Table 5. Annual specific cooling and thermal energy demands associated with the whole residential building upon varying the simulation cases.
Simulation CaseCooling Energy for Space Cooling Demand Associated with the Whole Building (kWh m−2 Year−1)Thermal Energy for Space Thermal Demand Associated with the Whole Building (kWh m−2 Year−1)
Case 020.257.6
Case 122.251.4
Case 215.960.6
Case 314.155.4
Case 414.155.4
Case 514.155.4
Case 614.155.4
Case 714.155.4
Disclaimer/Publisher’s Note: The statements, opinions and data contained in all publications are solely those of the individual author(s) and contributor(s) and not of MDPI and/or the editor(s). MDPI and/or the editor(s) disclaim responsibility for any injury to people or property resulting from any ideas, methods, instructions or products referred to in the content.

