Article

Vulnerability Assessment of Urban Rail Transit Network—A Case Study of Chongqing

1
School of Management Science and Real Estate, Chongqing University, Chongqing 400044, China
2
Construction Economics and Management Research Center, Chongqing University, Chongqing 400044, China
*
Author to whom correspondence should be addressed.
Buildings 2025, 15(2), 170; https://doi.org/10.3390/buildings15020170
Submission received: 3 December 2024 / Revised: 4 January 2025 / Accepted: 6 January 2025 / Published: 9 January 2025
(This article belongs to the Section Architectural Design, Urban Science, and Real Estate)

Abstract

:
Urban rail network vulnerability assessment has become the core of the urban public transport system. Identifying and quantifying the vulnerability of urban rail transit is the key to coping with the crisis situation of the urban rail transit system. The article uses the Space L method based on complex network theory to establish a topological model of the Chongqing rail transit line network, analyze the topological properties of the network, and use MATLAB 2020b software to conduct deliberate attacks on each station to assess the vulnerability of the Chongqing rail transit network in terms of changes in network efficiency. The results show that the density of Chongqing’s rail transit network is low and the network level needs to be improved; there is no significant correlation between the node vulnerability and the degree value of nodes in the network. The identification of important stations can provide a basis for the decision-making of urban rail transit operation managers and has a strong practical value.

1. Introduction

With the acceleration of China’s urbanization process, urban traffic problems become more prominent, and more requirements are put forward for the efficient operation of urban traffic. Urban rail transit has become an effective tool to reduce urban traffic pressure due to its characteristics such as large passenger capacity, low pollution, fast, efficient and convenient, high load capacity and land saving. At the same time, rail transit can shorten the distance between regions and play an important role in regional economic development and effectively narrow regional income gap [1]. It has greatly alleviated urban ground traffic congestion, expanded urban development space, and has become an important transportation hub. However, with the advancement of networked operations, urban rail transit accidents have occurred frequently, and its operational safety issues have become increasingly prominent.
Urban rail transit systems are important transportation hubs, and the safety of urban rail transit operations is a type of safety issue with certain unique features. On the one hand, the space of urban rail transit is mainly underground, in a relatively closed environment, and urban rail transit has the characteristics of large passenger capacity and high personnel density [2]. Therefore, in case of an emergency, emergency evacuation is a major challenge. So, once a sudden event occurs, due to the inconvenience of escape and rescue, it is easy to cause mass casualties, property losses, and traffic disruptions, which have a serious negative impact on the social and economic development of the region. On the other hand, with the increase in the number of urban rail transit lines and stations, most cities’ rail transit has formed a networked operation mode, and the interconnection between lines is becoming higher and higher [3]. If an emergency occurs at a certain point in the urban rail transit network, it may trigger operational safety issues throughout the entire network. In addition, urban rail transit is open to the public, and the complex environment is easily disturbed by human or environmental factors [4], which has a strong vulnerability [5].
In view of this, this paper aims to deeply explore the impact of intentional attacks on the vulnerability of urban rail transit based on complex network theory, taking Chongqing as the research object, and using the network model method to analyze the vulnerability characteristics of its rail transit network structure, in order to fill the gap in current research in this field and provide theoretical support and practical guidance for the safe operation of urban rail transit. Through this research, it is expected to clarify the specific manifestations and changing patterns of the vulnerability of Chongqing’s rail transit network under intentional attacks, identify key nodes and vulnerable links in the network, and then propose targeted prevention strategies and optimization suggestions to enhance the anti-risk ability and operational safety of urban rail transit under intentional attack scenarios. At the same time, it also provides a reference example for the vulnerability research of rail transit in other cities, promoting the in-depth development of urban rail transit vulnerability research and improving the relevant theoretical system and practical application framework.
The primary framework of this paper is structured as follows: Section 1 introduces the research background of Urban rail transit systems. Section 2 conducts a literature review and identifies the research gaps pertaining to the vulnerability of urban rail transit. Section 3 elaborates on the research methods adopted and the analysis process of the application case in Chongqing. Section 4 presents the outcomes of data analysis. Lastly, Section 5 comprehensively analyzes and discusses the significance of vulnerability research of urban rail transit and points out the possible shortcomings of this research and the future research direction.

2. Literature Review

Urban rail transit is open to the public, so it is vulnerable to perceived or environmental factors; that is, urban rail transit is vulnerable. Generally, the vulnerability evaluation methods mainly include the index evaluation method, the function model method, the graph cascade method, and the network model method [6,7,8]. Among them, the network model method can analyze the connection relationship between the components of the system, abstract it into the nodes and edges in the network, and form a topological network model, which can objectively and fully reflect the essential characteristics of urban rail transit.
With the rapid development of urban rail transit construction, more and more scholars are studying the vulnerability of urban rail transit at home and abroad, and analyzing the vulnerability of urban rail transit by using complex network theory has become a hot spot in recent years [9]. Most of the existing studies use complex network theory to construct complex network models, analyze the basic topological parameters, and take the statistical characteristics of complex network topology as an indicator to measure vulnerability. Some scholars choose to select the vulnerability assessment index and evaluate the topological vulnerability of the subway network through the change in the index [8,10,11]. Some scholars evaluate the vulnerability of the subway network by simulating attacks on the subway network and identifying the most effective mode of attack [12] through the vulnerability change in the subway network. Some scholars optimize the travel time for citizens by analyzing the path structure of urban rail transit network [13,14]. Most of the vulnerabilities of network topology are analyzed in static networks. However, due to the existence of passenger flow, rail transit networks and traffic networks are also typical flow networks. Therefore, when studying the vulnerability of urban rail transit networks, later scholars also fully considered the service level of urban rail transit networks [15,16,17,18]. In addition, some scholars have analyzed the vulnerability of urban rail transit by establishing a comprehensive evaluation index system [19,20].
Albert [21] proposed that complex attacks on networks are generally divided into random attack and deliberate attack. Random attack refers to a random attack on a network, not for a specific target, causing a random failure. In random failures, each node or edge of the network has the same probability. Deliberate attacks are mainly caused by human factors, such as arson or terrorist attacks. Often, the most important stations in a large network, such as a transfer station, may be deliberately attacked and destroyed. For topological analysis, site failures can be simulated by removing nodes from the network. For random failures, the nodes were randomly removed according to a specific probability distribution function. For deliberate attacks, assuming that the attacks proceed in the order of importance of the nodes, the nodes are deleted in descending order of node degree. Previous studies [12,22] show that the impact of random attacks on the vulnerability of the urban rail transit network is not significant, while deliberate attacks can greatly reduce the vulnerability of the network. Therefore, based on the complex network theory, this paper will study the influence of deliberate attacks on the vulnerability of urban rail transit and use the network model method to study the vulnerability of rail transit network structure in Chongqing municipality.
Although many studies have focused on the vulnerability of urban rail transit in the academic circle at present, no consensus has been reached on the definition of the vulnerability of urban rail transit. Meanwhile, the evaluation of the vulnerability of urban rail transit lacks specificity, and it is difficult to comprehensively and accurately reflect the vulnerability characteristics of urban rail transit in a complex operating environment. This provides an entry point and exploration space for the research of this paper. Based on the complex network theory exploring the impact of intentional attacks on the vulnerability of urban rail transit is expected to further enrich and improve the theoretical and practical research results in this field.

3. Methodology

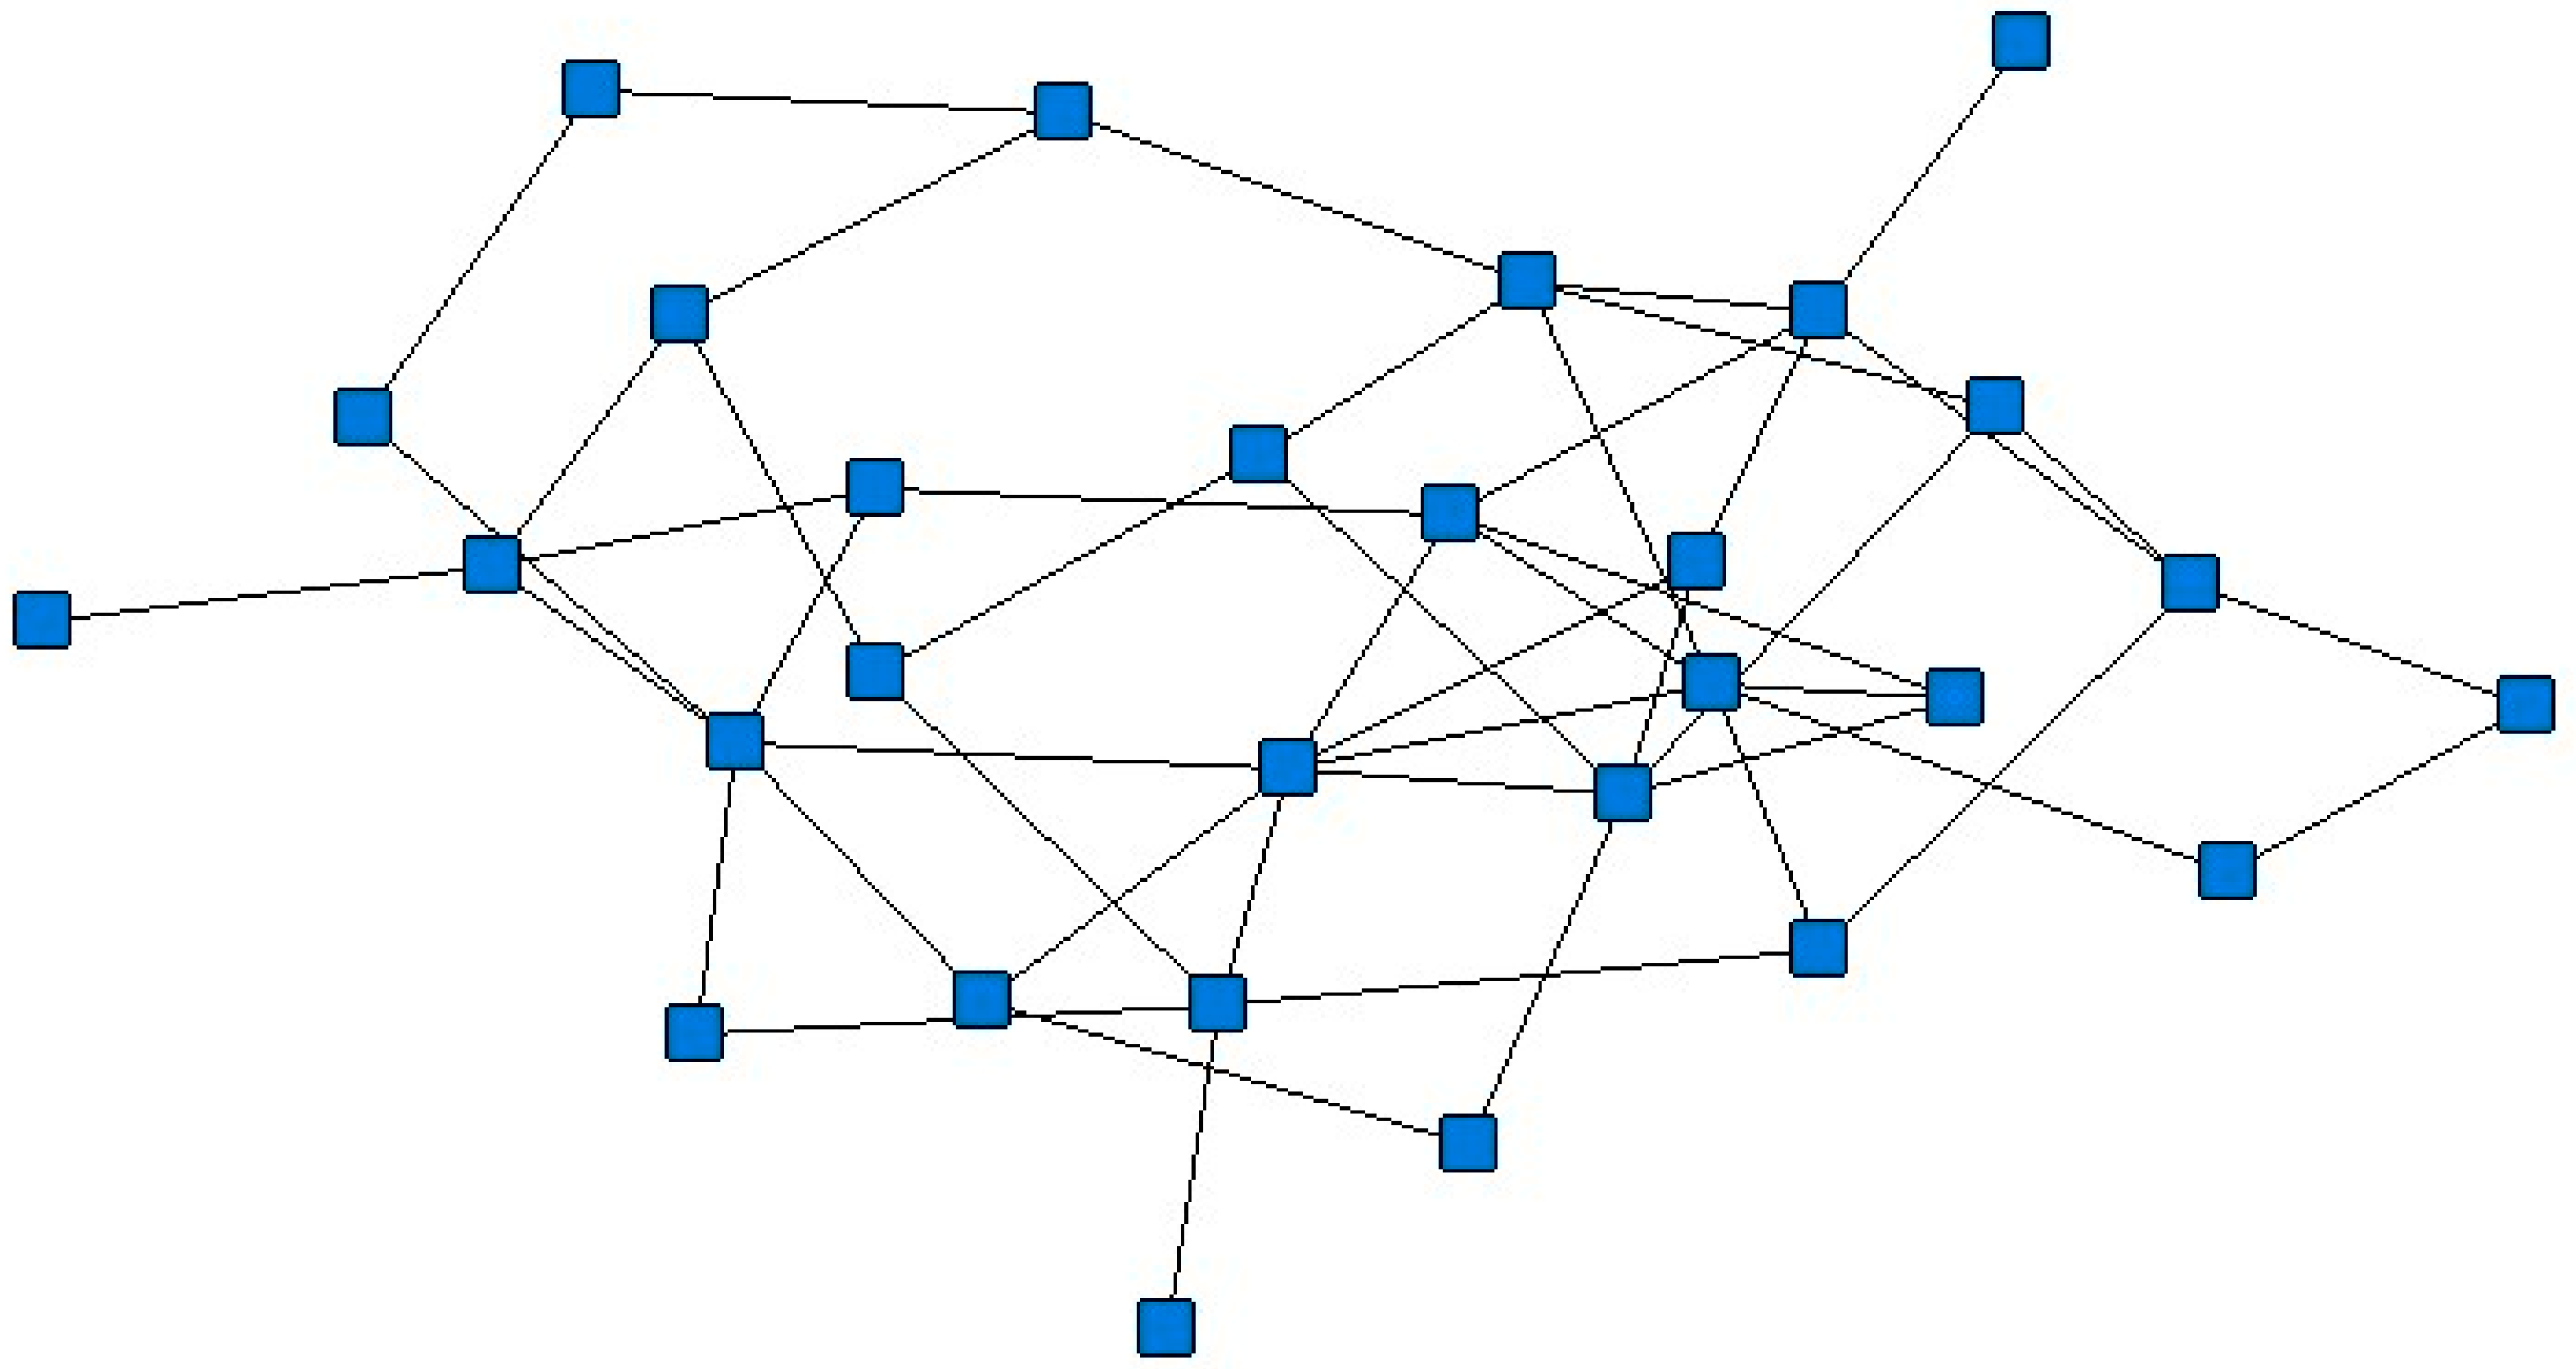
3.1. Selection of Topological Network Model Construction Method

Complex network theory is a basic method widely used in the network modeling of facilities at the beginning of the critical period, such as power grids, water transmission systems, and transportation networks. Complex network theory models [23,24] for real systems to be studied in the form of graphs with non-microscopic topological elements not available by traditional networks. Network topology is a key determinant factor in theoretical approaches to complex networks. The desired network properties can be calculated through the characteristic parameter indexes of the topological network. Complex network theory has been widely applied to key urban infrastructure networks, including grid networks [25,26,27,28], pipeline networks [29], water transmission networks [30], and transportation networks [31,32].
Network topology is a key determinant of the approach to complex network theory. It refers to the properties of the network geometry and describes the layout and connection properties of the elements in the network. Understanding the network and its basic characteristics is the basis of analyzing the network topology. The structure of the network affects the efficiency of the system in fulfilling its functions. Studying topological network structures helps to understand system functions in many ways, such as estimating maximum traffic, evaluating routes of interest, exploring shortest paths, identifying hub nodes (i.e., nodes with high nodal degree), and detecting the impact of attacks or breaches on the network. At the same time, the required network attributes can be calculated by the characteristic parameters of the topological network. Such research helps define and quantify the associated costs, consequences of node or link failures, efficiency, vulnerability, and resilience.
In general, there are three basic construction methods for the network topology, namely the Space L, Space P, and Space B methods (Figure 1a–c). The topological network constructed based on the Space L method can vividly show the relationship between the components in the system. Taking the urban rail transit network as an example, the network established by the Space L method, nodes represent sites, the edges in the network indicate that at least one route connects two sites, and there is only one edge between two nodes to represent the connection relationship between nodes, as shown in Figure 1a. Generally, the distance between sites or line traffic can be used to assign edges in the network. The Space P method believes that all stations on the same line can be connected with each other, that is, all stations on the same line have connected sides, which reflect the direct relationship between stations, as shown in Figure 1b. The urban rail transit topological network that it builds mainly reflects the transfer nature of the network. The nodes in the topological network constructed using the Space B method represent both the site and the line. Each line node is connected to the site contained in the line, which is the edge of the network. There is no direct connection between the nodes of the same type, and they cannot be connected by lines, as shown in Figure 1c.
In order to provide a scientific and reasonable reference for the planning and design of urban rail transit network layout and reconstruction, the abstract natural network form structure of Space L has a stronger practical significance. The urban rail transit topological network constructed by using this method can reflect the natural layout of the urban rail transit stations and lines, thus facilitating the analysis of the characteristics of the network structure. Therefore, the Space L method is used to construct the topological structure model of the urban rail transit network.

3.2. Construction of the Topological Structure Model of Rail Transit Network in Chongqing

Chongqing is the ninth city in the Chinese mainland and the first city in western China to have rail transit. In recent years, Chongqing rail transit has developed rapidly, and has developed from the original single-line operation to the initial scale of the rail transit network, and gradually formed a network layout. Under the development opportunity of the Chengdu–Chongqing economic circle. Chongqing has 314 km of lines under construction centering on the construction of a “metropolitan area on track”. During the 14th Five-year Plan period, the construction of 8 and 198 km rail transit projects approved in the fourth phase will be accelerated. In the future, the urban rail transit network in Chongqing will become more and more dense, which means that once an operation accident occurs, it is likely to cause a large range of faults, which will seriously affect the normal work and travel of citizens. Therefore, it is an urgent problem for Chongqing rail transit to accurately understand and evaluate a reasonable strategy for improving the resilience of the rail transit network, so as to reduce the occurrence of accidents and avoid adverse effects.
The Chongqing rail transit network covers the main urban area of Chongqing. By January 2023, Chongqing had opened 10 rail transit lines and 229 stations, as shown in Figure 2. Among them, rail transit lines 1, 4, 5, 6, 9, 10, ring line, and GGB Line are subway systems, and rail transit lines 2 and Line 3 are monorail systems. According to the plan, by 2050, Chongqing will build 18 rail transit lines, forming a network of “17 lines and one ring”, forming a network structure of “ring line + radiation”, with a total length of about 820 km, of which the main city line is about 780 km, and the density of the rail network in the main city will reach 0.69 km/square kilometer.

3.2.1. Model Construction

Before constructing the metro transit network, the following assumptions are required:
A.
Since the distance between the track sites is relatively close, the site spacing is assumed to be equal. Moreover, the paper only studies the topological structure of the orbit network to find the stations with strong vulnerability, instead of considering the passenger flow intensity on each line. Therefore, the network is reduced to the unauthorized network;
B.
Since the urban rail transit can operate in both directions between any two stations, the urban rail transit network can be considered as an undirected network;
C.
Some of the same stations contained in the different lines are not in the same location due to unreasonable planning or excessive terrain height difference. The paper does not consider the hierarchical structure of the urban rail transit transfer station, and regards it as the same node;
D.
All stations and lines in the initial network of urban rail transit are not disturbed and can operate normally;
E.
Once a site or line is attacked, it is considered that the site is unable to play its original function.

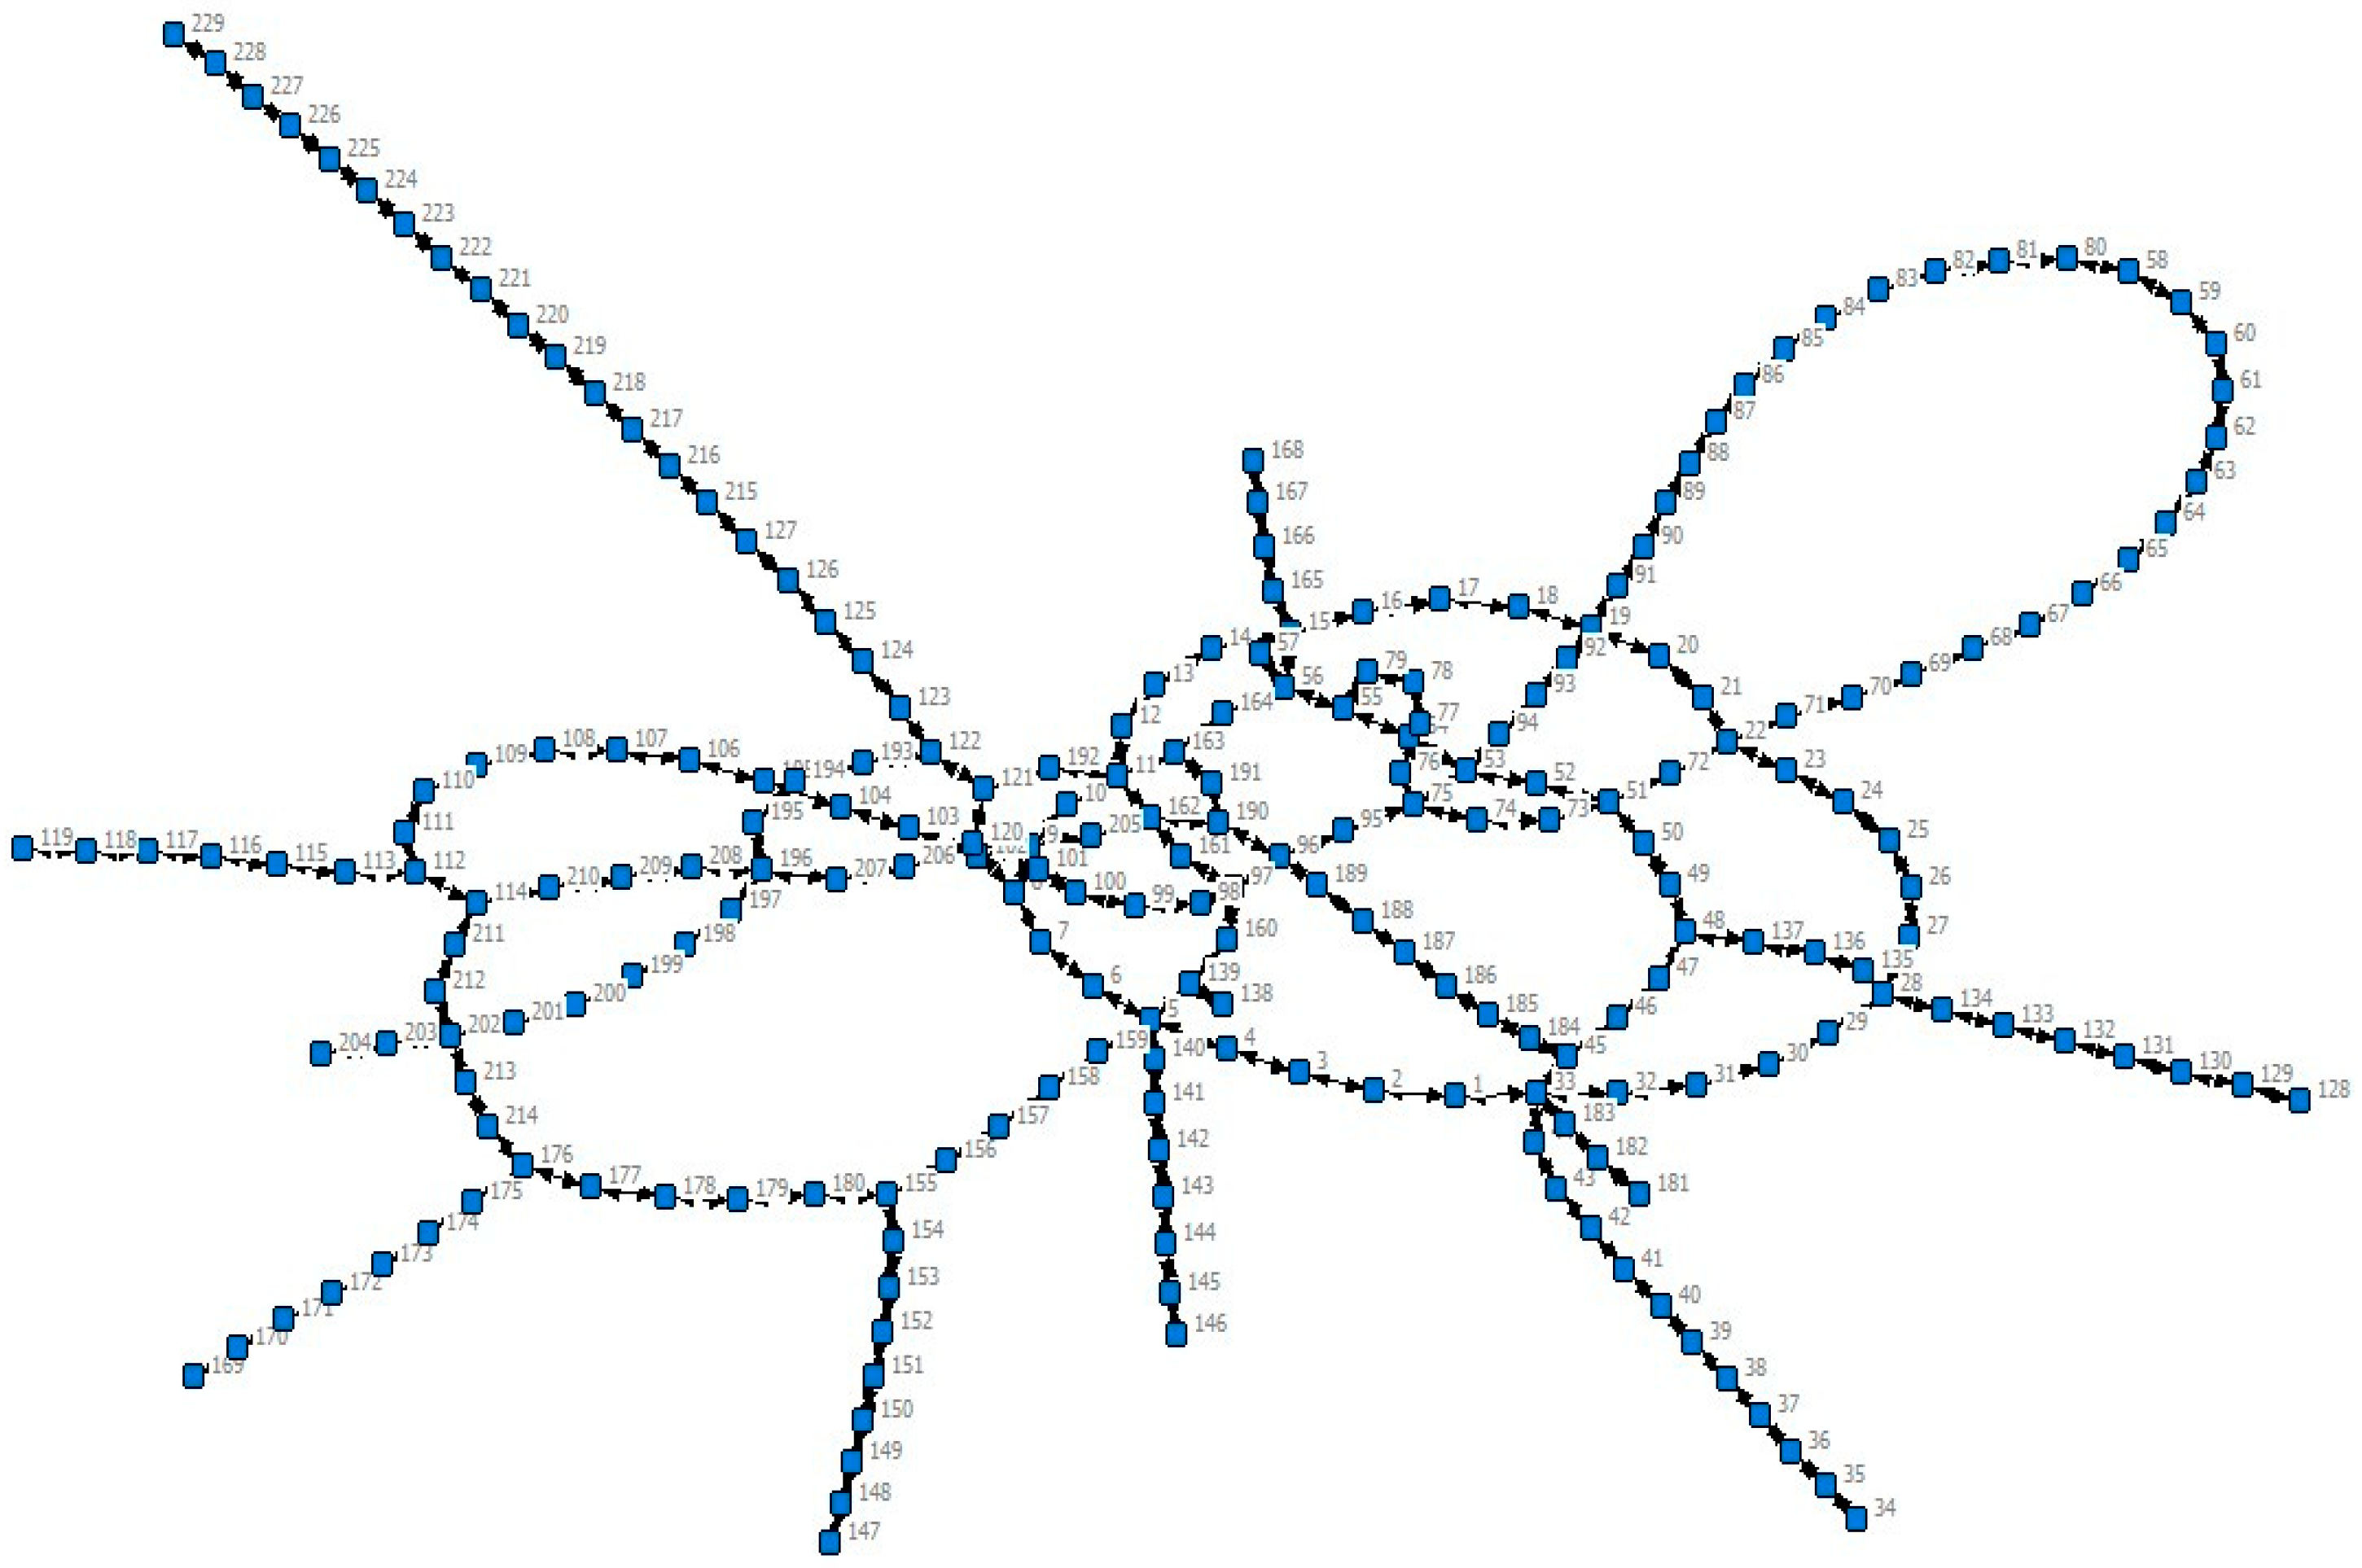
3.2.2. Model Building

The urban rail transit system serves to fulfill the city’s transportation demands by enhancing public transportation capacity and facilitating the movement of passengers between stations across various districts. This system exhibits typical network structure characteristics, comprising nodes, links, and interaction patterns among nodes. Nodes and links are fundamental components that define the network’s configuration, while network connectivity is crucial for comprehending the network’s attributes.
Suppose that S = { s 1 , s 2 , , s N } , E = { e i j |i, j ∈ S}, is the set of nodes and the set of edges of the network, respectively;
1 ≤ i, j ≤ N, N is the total number of nodes in the network;
s i is the i node, e i j and is the connected edge between nodes;
The connection state between any two nodes in the network can be represented by the association matrix A, denoted as A = [ a i j ] N N ;
If there is a connection between the node and, then e i j = 1;
If there is no direct connection between the two nodes, then e i j equal to infinity;
If i = j, then a i j is the connection between the node and itself, then = 0. As illustrated in Figure 3.
In the topological analysis of urban rail transit networks, this paper does not consider factors such as rail transit upstream and downstream lines, connecting distance between stations, rail transit train departure frequency, passenger capacity, and political reasons. The model used is essentially an undirected powerless network system, and this model is often used to represent traffic network systems.
Based on this, this paper takes complex network theory as guidance using Ucinet 6 software [33], uses the Space L topology modeling method, numbers each station, and establishes the topological structure diagram of Chongqing urban rail transit network, as shown in Figure 4. According to statistics, Chongqing rail transit network data are as follows: 229 rail transit stations, with a total of 250 connected edges. The nodes in the network represent the sites of the network, and the edges in the network represent the lines of the network.

3.3. Analysis of Topological Structure Parameters of Rail Transit Network in Chongqing
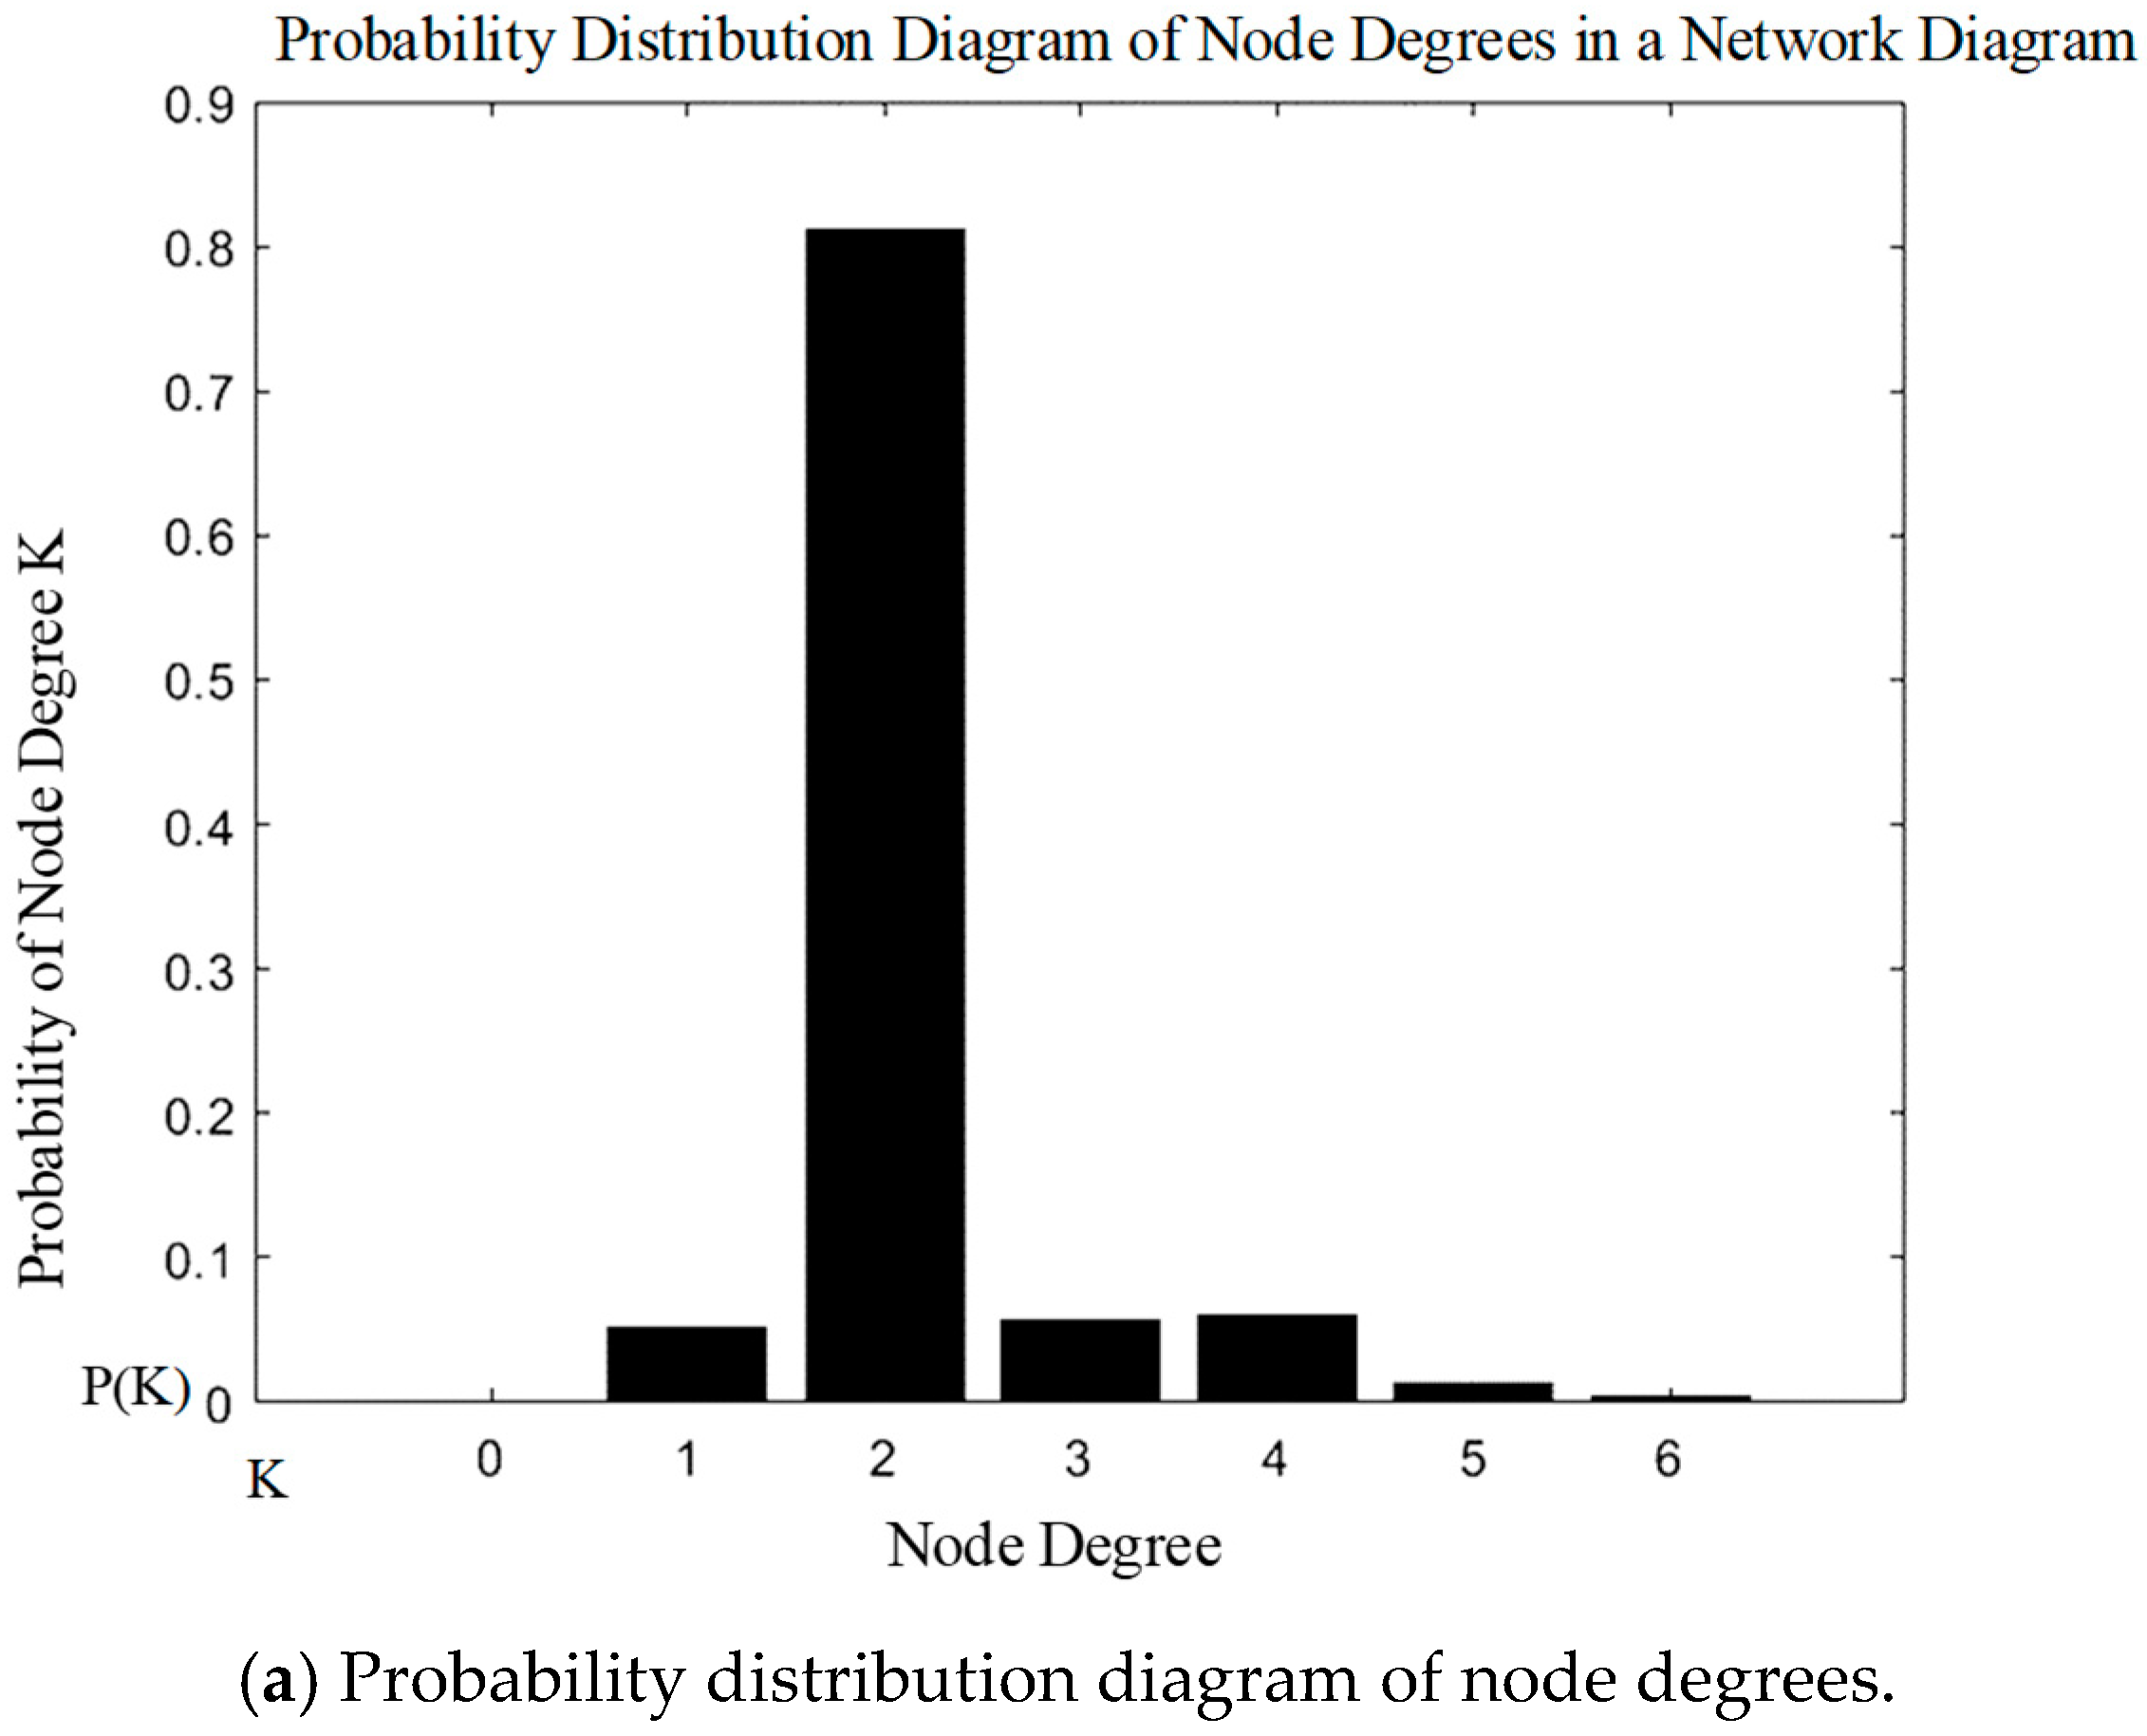
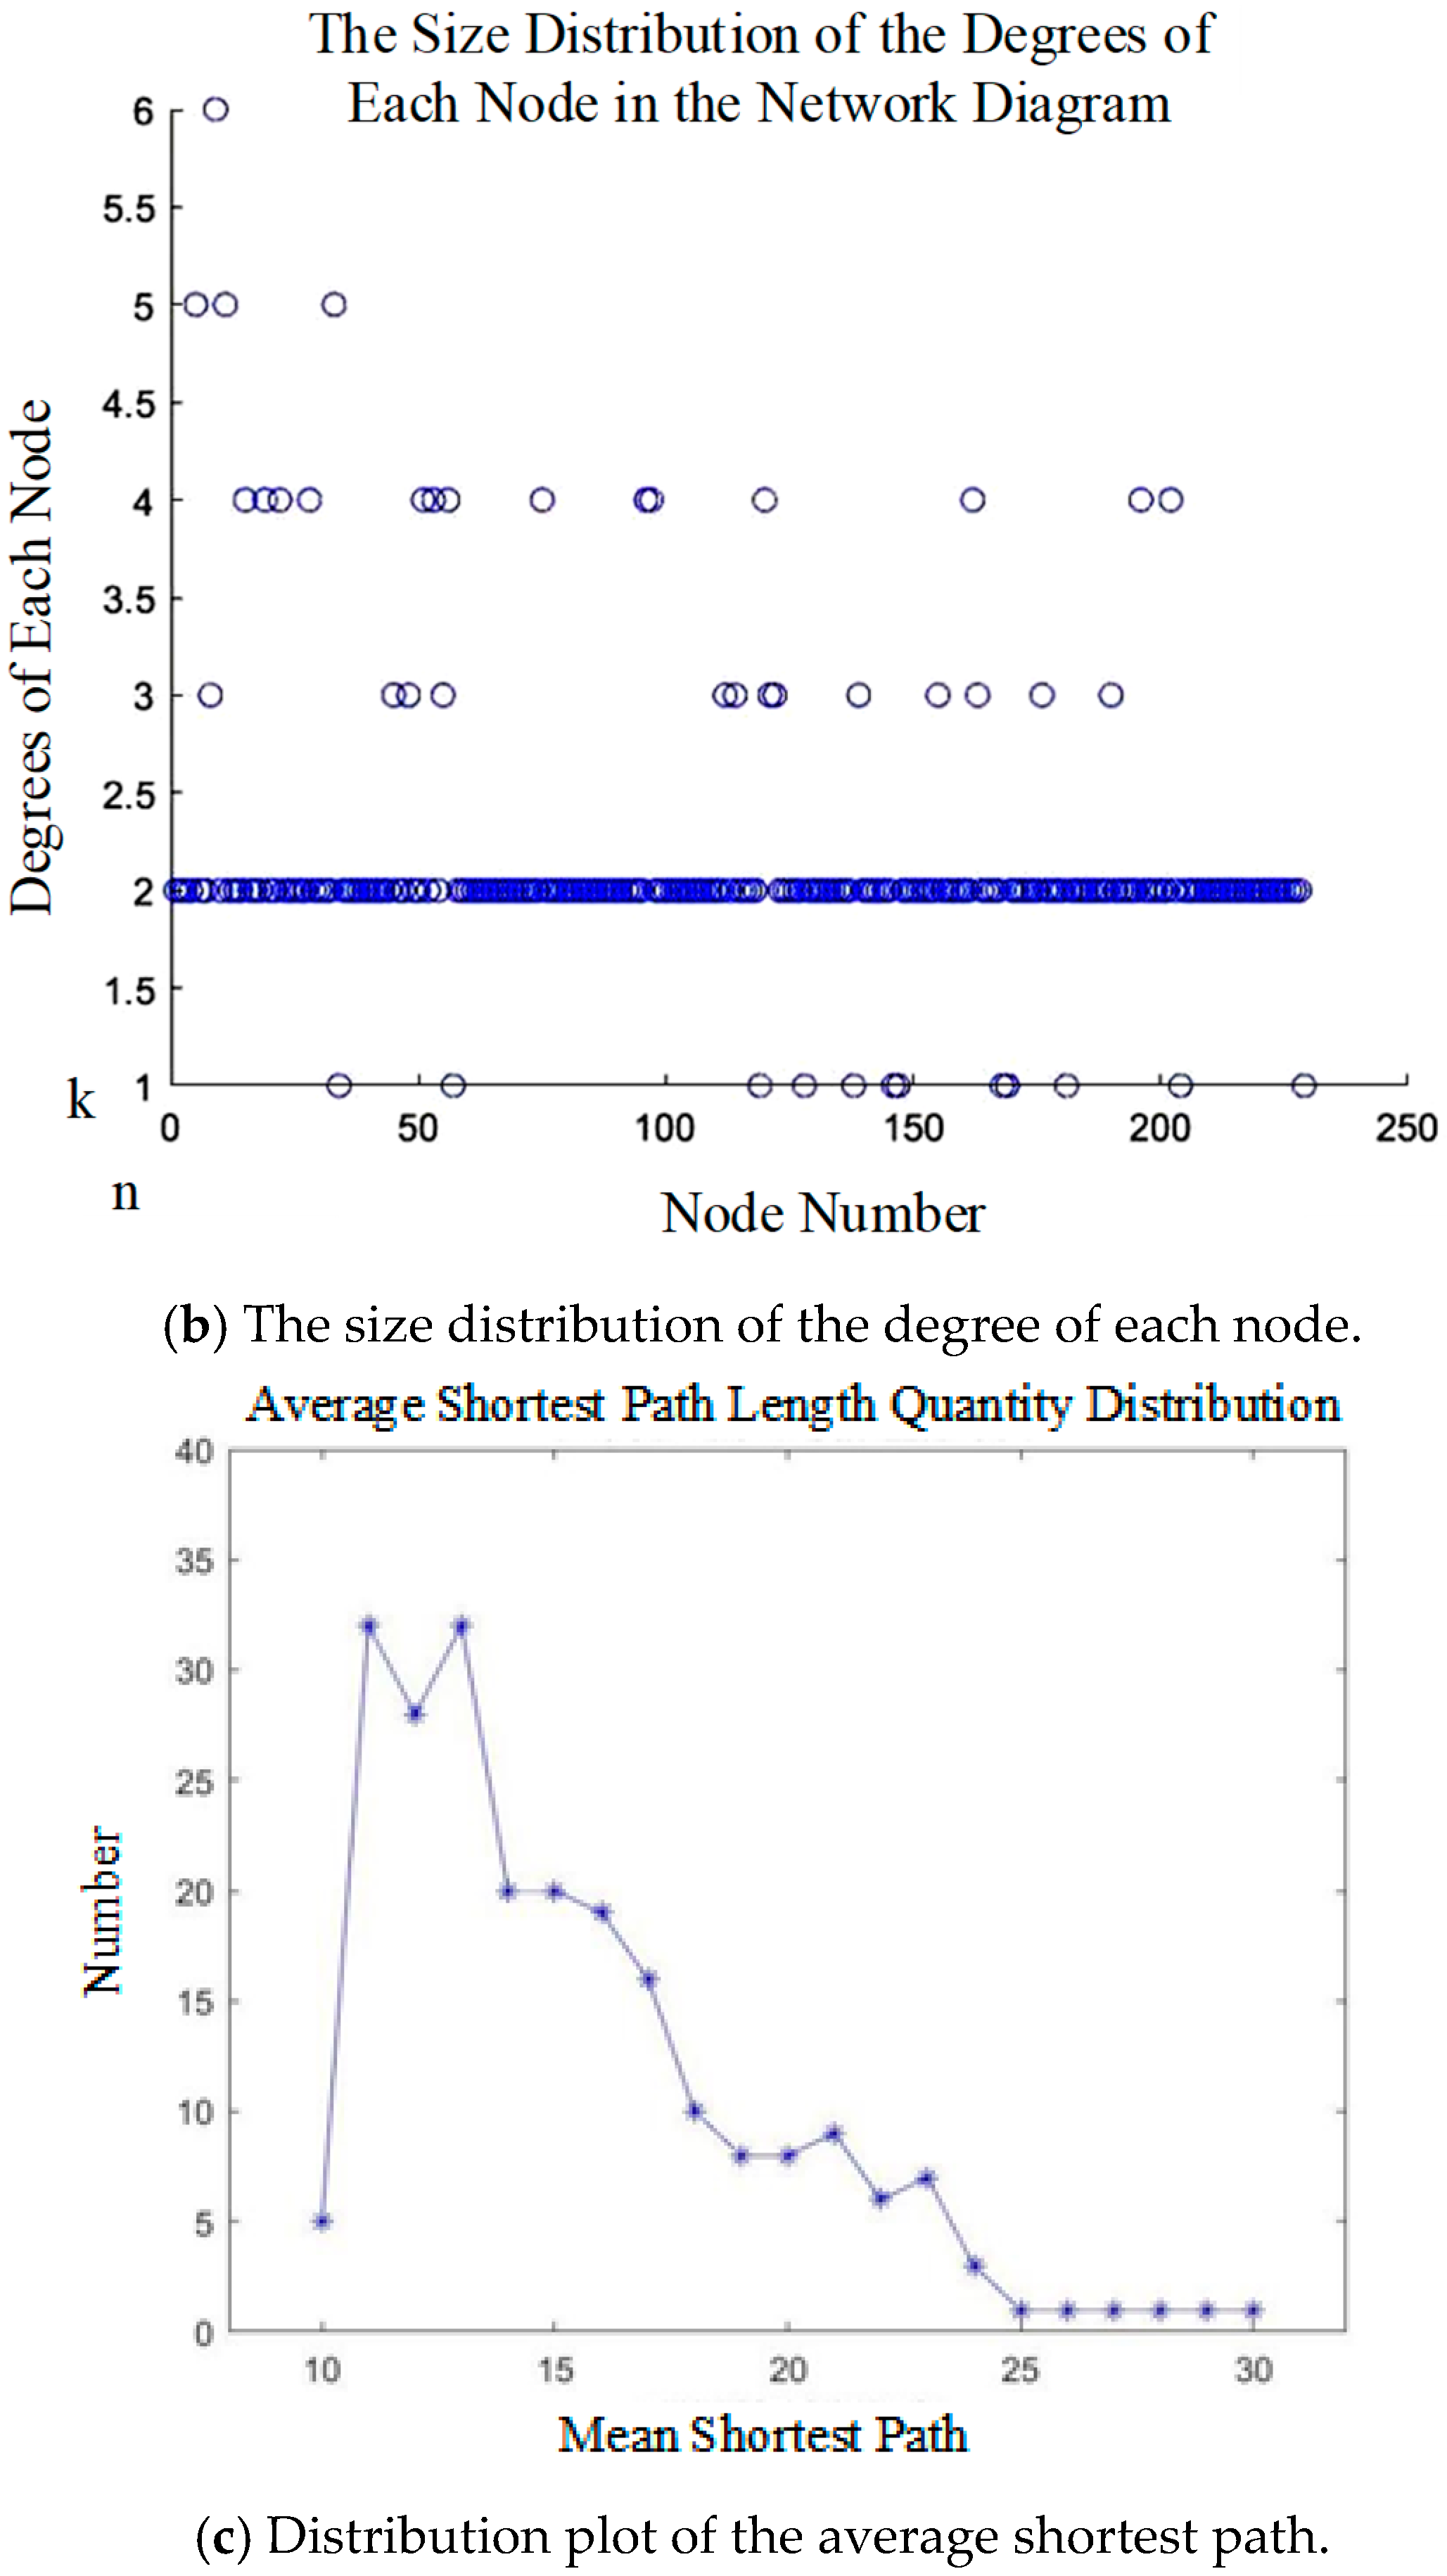
3.3.1. Node Degree

The most basic of the parameters of complex network topology is the node degree, which describes the importance of nodes, and the node degree size is proportional to the importance. Figure 5a,b, respectively, describes the probability of the Chongqing rail transit network node degree of distribution and the node size distribution. From the figure showing the Chongqing rail transit network, the degree value of site 2 accounts for a great amount, reaching 80%. The degree value of nodes 1, 3, and 4 is almost the same, accounting for about 5%, and the degree values of sites 5 and 6 is very small, about 5%. As shown in Figure 5b, there is only one station with a degree value of 6 in the Chongqing rail transit network, which is Chongqing North Railway Station; the degrees of Ranjiaba, Wulidian, and Shapingba are 5 and higher. After calculation, the average degree of the network is 2.18, and the network diameter d is 45, indicating that the transportation distance of the Chongqing rail transit network is relatively large.

3.3.2. Aggregation Coefficient

The clustering coefficient reflects the degree of clustering of the nodes in the network. After calculation, the average aggregation coefficient of the Chongqing rail transit network model is 0.0025, which is obviously very low and close to 0, which does not mean that most stations are isolated, but that the rail network density is too poor. As can be seen from the topology of the Chongqing rail transit network (Figure 4), it is relatively sparse, most of the stations are only connected to two stations, and the path length between other stations is large, so the aggregation coefficient of the Chongqing rail transit network is low.

3.3.3. Average Shortest Path Length

The average network shortest path length describes the connectivity of the network as a whole. The average network shortest path length is usually used to analyze the “small-world nature” of the network. The paper uses the Floyd algorithm, programmed using MATLAB software [34], to calculate the shortest distance between nodes, and the calculated average shortest path is about 15. Figure 5c reflects the distribution of the shortest path length of the nodes in the orbital Space L network. As can be seen from the figure, the maximum value is obtained from L = 10 to 15, which means that the distance between most nodes is between 10 and 15, that is, there are 10 to 15 other sites apart, and the value is still relatively small, and the travel is more convenient.

3.4. Rail Transit Network Vulnerability Assessment in Chongqing

3.4.1. Frailty Evaluation Index Selection and Model Construction

Network vulnerability can be measured by many indicators; usually, different indicators can be used to observe different changes in network vulnerability. Network performance can also be measured by network connectivity indicators, such as network average shortest path or network efficiency [35]. Most scholars [13,36,37,38,39] use network efficiency to evaluate the vulnerability of the network, so the paper chooses the change in the network efficiency to measure the change in the network vulnerability.
Network efficiency quantitatively describes the connectivity ability of the network, which is expressed in E, and is calculated as:
E = i j G e i j N N 1 = 1 N ( N 1 ) i j G 1 l i j
In the formula:
N is the total number of nodes in the network;
l i j is the shortest path length between node i and node j.
The inverse of the shortest path length l i j essentially refers to the connectivity efficiency between nodes i and j in the network, which is e i j .
Equation (1) clearly shows that the value of network efficiency ranges from 0 to 1.0, which means that there is no connection between any two nodes in the network, and 1 indicates a connection between any two nodes in the network. If nodes i and j are not connected between l i j   = +∞, the efficiency value is 0.
Network efficiency reflects the performance of the topology of the network, especially the effectiveness of the whole network and the connectivity between the nodes. The network efficiency ratio can clearly show the efficiency change in the whole network after the node failure. The network efficiency ratio is the ratio of the network efficiency after the network is attacked at different nodes to the network efficiency of the initial network. Therefore, the network efficiency ratio is calculated as follows:
E = E i E 0   i = From   1   to   N
In formula:
E i is the efficiency of the network after the network is subjected to the i-time attack;
E 0 is used for the efficiency of the initial network.
V i = E = E 0 E i
In formula:
V i is the vulnerability of the nodes in the network.

3.4.2. Attack Strategy

When all the information or part of the network information is known, the network is usually attacked by deliberate attack. The deliberate attack usually depends on the importance of the attack object in the network, and the more important attack object is often attacked first. Holme et al. [40] have conducted a lot of research on malicious attacks. They divided their deliberate attack strategies into node-based deliberate attacks and edge-based deliberate attacks according to the different attack objects. The deliberate attack based on nodes has different node importance measured by different angles and can be divided into node-based initial degree attack, initial magnitude attack, recalculated initial degree attack, and recalculated initial magnitude attack. Edge-based deliberate attacks are divided into initial and recomputed initial mediation attacks.
In the study of the destruction of nodes or edges in complex networks, edge failure will cause the redistribution of network flow, only when all the connecting edges of a node are damaged or the node load exceeds the bearing capacity. In other words, there is a certain possibility that the node can continue to work under side failure. However, different from the edge failure mode, the failure of a certain node will lead to the failure of all the connected edges associated with the node, and the attack on the junction will cause a faster and more serious network failure.
Theoretically, the connectivity of urban rail networks may be affected by the failure of nodes and edges. As shown in Figure 6b, when node 2 is attacked, the connection edge between node 2 and node 1 and node 3 is deleted, and the numbers in the rows and columns represented in the adjacent matrix are 0; that is, the node exists in the network as a node in isolation, and the total number of nodes in the network does not change. As shown in Figure 6c, when the edge between nodes 1 and 2 is attacked, the edge disappears, and the change in the adjacency matrix is that the value corresponding to the modified edge in the matrix changes from 1 to 0, as shown in Table 1. In other words, there is some possibility that the node can continue to work under side failure. However, the destruction of a node will lead to the failure of all the edges associated with the node, causing a more serious loss. Therefore, this paper mainly focuses on attacks on nodes.
A simulation to simulate urban rail transit networks using MATLAB 2020b software programming was needed. In MATLAB software, all nodes are arranged in descending order according to the size of the degree value, each node is deleted in turn, and the change in network efficiency is recorded. The change curve of indicators is drawn as the number of attacks and the ratio of network efficiency as the ordinate.
The deliberate attack code is as follows Algorithm 1:
Algorithm 1. Deliberate attack code.
f = find(A > 0);
L = length(f); %The query vector length;
[m, m] = size(A); % Get the number of rows and columns of the matrix;
sum(sum(A))~ = 0 % For summing over the elements of each column of the matrix;
[n, n] = size(A);
k = sum(A); % Each column degree value;
j = 1:n;
C = [j, k]; % Matrix table of the degree values of each node;
[order, lo] = sort(C(:,2),’descend’); % An ascending sort of the array returns the sorted array;
p = lo(1); % Obtain the serial number corresponding to the node with the highest degree value;
A(p,:) = []; % The node with the highest median value in the original matrix is all in the column of 0;
A(:,p) = []; % The node with the highest median value in the original matrix has all rows of 0;
L = length(A); % Returns the length of the largest array dimension in A;
E = Network_efficiency(A); % Calculate the network efficiency after a deliberate attack.

4. Results and Discussions

4.1. Changes in the Ratio of the Network Efficiency

The network efficiency of urban rail transit networks can measure the connectivity between stations. The greater the network efficiency, the better the connectivity between stations, and the more the time cost of passenger flow transportation can be saved. Figure 7 shows the change in the ratio of network efficiency after random and deliberate attack sites. As shown in Figure 7, for 116 deliberate attacks on Chongqing rail transit, the network efficiency is reduced to 0, while random attacks require more than 200 attacks. In the case of a deliberate attack, the curve begins with a sharp drop and then turns to a slow decline. In the case of a random attack, the overall curve showed a slow downward trend. This fully proves the importance of transfer stations to urban rail transit networks and also proves that the vulnerability of the Chongqing rail transit network under deliberate attack conditions is much greater than that under random attack, which is similar to the characteristics of a scale-free network.

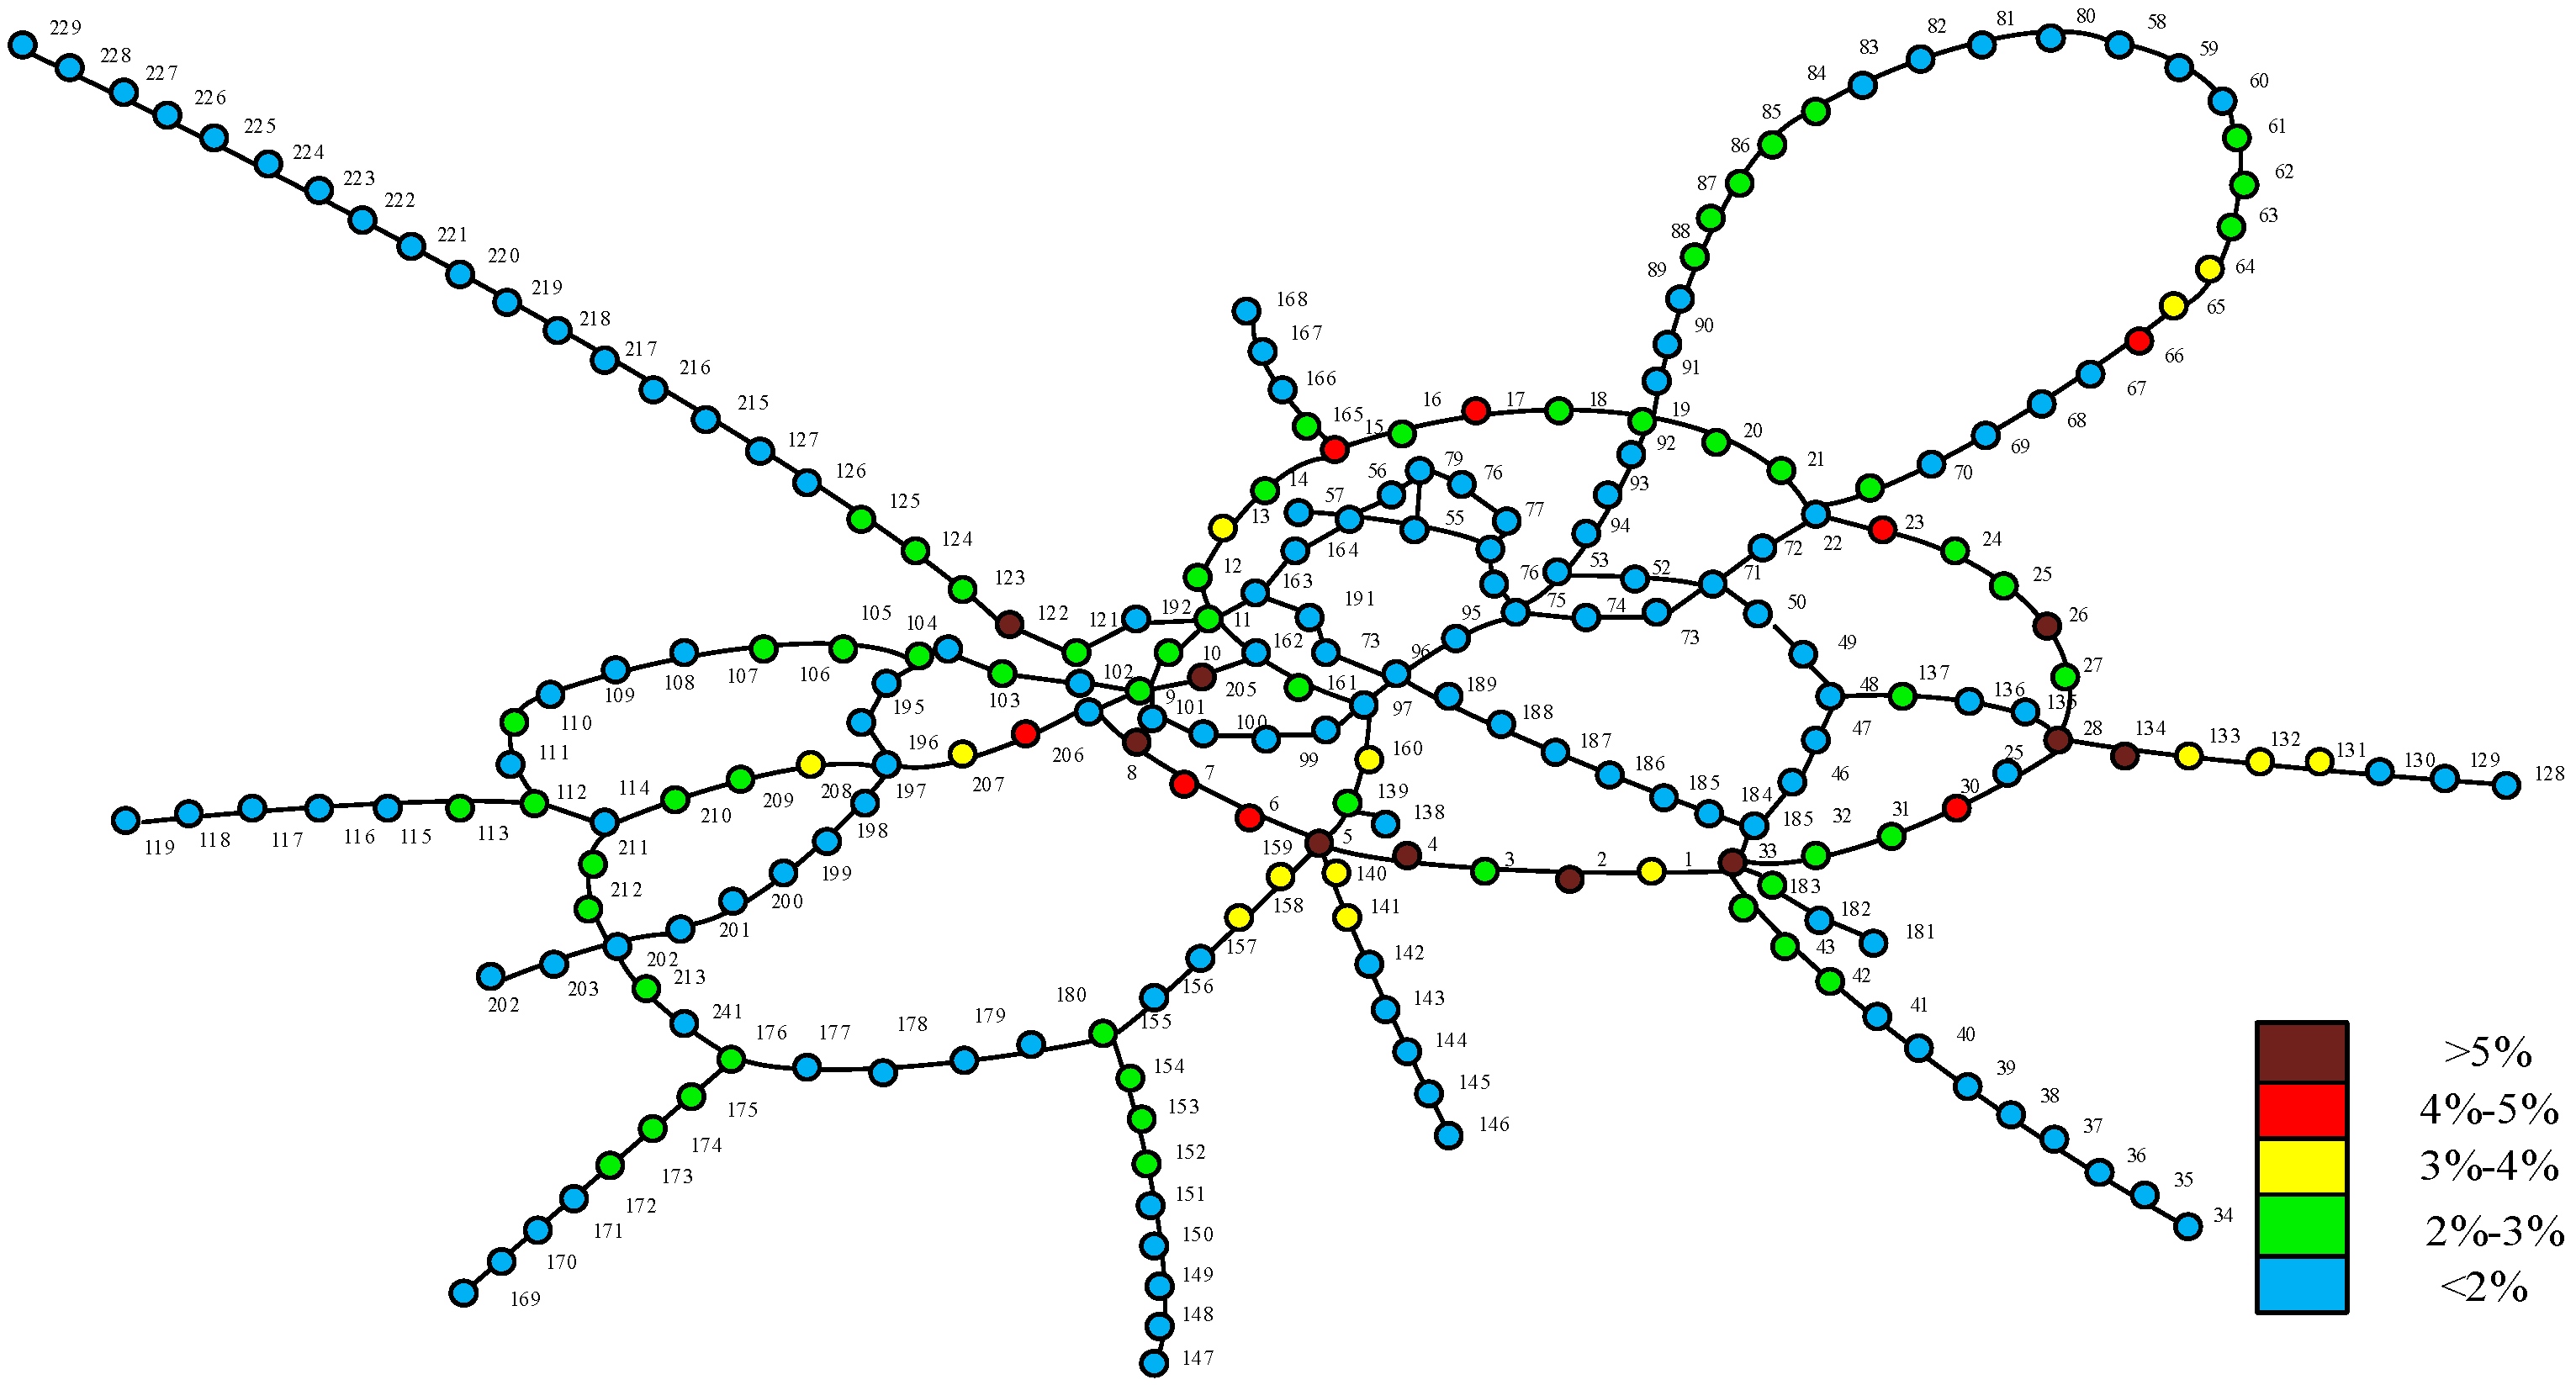
4.2. Site Vulnerability

There are 229 nodes (Refer to Appendix A. Rail Transit Network Station Number in Chongqing) in the Chongqing rail transit network model, which remove each node from the network, respectively, and the change in network efficiency, that is, the vulnerability of the site, are calculated. The ten nodes with the highest vulnerability are shown in Table 2. (All sites of Node Vulnerability Ranking are in Appendix C).
Observing the ten sites with the strongest vulnerability in Table 2, the degree value of these sites is not necessarily the largest. For example, although Yudaishan, Sports Park, and Erlang Station are very low and are only connected with two nodes, these three nodes are on the loop, and the attack will have a great impact on the connectivity between the other stations. This result also indicates that the vulnerability of Chongqing rail transit caused by a single station failure is not significantly correlated with the station degree value.
According to the proportion of network efficiency decline after deleting nodes, the sites are divided into five levels with 5%, 4%, 3%, and 2% as the critical points. The vulnerability of sites with network efficiency decline higher than 5% is very high, and the failure of sites with network efficiency less than 2% has almost no effect on the network, as shown in Figure 8.
Specific locations of key sites with higher vulnerability are marked in Figure 8. It can be seen that most of these nodes are in a position of low network density. Once such key nodes are removed, the connection between the area on the radiation line and the entire network will be completely cut off. This is the key reason for the vulnerability of the rail transit in Chongqing. On the other hand, the sites with high degree value are mostly located in the downtown area. Because the downtown network is much more dense than in the suburban network, even sites with large degree values will not have a serious impact on network connectivity; that is, there are still enough options to be connected by alternative routes. Through the above analysis, we can see that the Chongqing rail transit network has a large transmission distance and a low network density. Through simulation analysis, it can be seen that the rail transit network is very vulnerable to deliberate attacks and attack stations with high vulnerability, which will have a huge impact on the efficiency of the network. In the rail transit network of Chongqing, the south Square of Chongqing North Railway Station, Ranjiaba, Wudian and Shapingba of Chongqing North Railway Station have high degrees and are important transfer stations with high passenger flow. Once attacked, it would seriously affect the travel of citizens. At the same time, Yudaishan, Erlang, and Chongqing West Railway Station are the stations with high vulnerability, and the failure of these stations will affect the operation efficiency of the Chongqing rail transit network. Therefore, in the case of limited resources, priority should be given to the protection of important transfer stations and stations with high vulnerability, and good planning should be made to avoid the destruction of these nodes.

4.3. Improvement Strategy

When urban rail transit networks are affected by disturbances such as equipment failures, natural disasters, or deliberate attacks, how to utilize limited resources to restore the network and enhance the ability to respond to such disturbances to maximize the recovery of the entire network’s smooth operation is the key to improving the resilience of urban rail transit [41]. Resilient urban transportation emphasizes problem-oriented approaches, aiming to reduce the vulnerability of urban rail transit and enhance the system’s ability to cope with various disturbances. According to the previous analysis, the density of the network and the distribution of rail transit stations and lines have a significant impact on the vulnerability of Chongqing’s rail transit network. Simulation analysis shows that Chongqing’s rail transit network exhibits strong vulnerability to deliberate attacks, and attacking certain stations can cause significant damage to the network. Therefore, under the condition of limited resources, it is necessary to first strengthen the safety protection measures for stations with higher vulnerability to prevent them from being damaged and ensure the stable operation of Chongqing’s rail transit.

4.3.1. Planning Principles

① Accelerate development and address shortcomings. Increase investment in urban rail transit, add more rail transit lines, enhance the connectivity of the urban rail transit network, improve network efficiency, and strengthen the connection between peripheral areas and the main urban area.
② Scientifically plan and improve the network. Plan new urban rail transit lines, expand the coverage area of the network, and solve the “last mile” problem; rationally optimize the layout of the urban rail transit network in combination with industrial and urbanization development, and promote the integrated development of urban rail transit networks, trunk railways, and regional railways.
③ Support and lead, with moderate advancement. Accelerate the transformation and upgrading of the urban rail transit industry, promote the transformation of urban rail transit development from a “follower” to a “leader”, moderately advance the configuration of urban rail transit infrastructure, upgrade equipment and facility systems, actively integrate into the development of urban agglomerations, strengthen the radiation and driving effect on peripheral areas, and give full play to the supporting and leading role of urban rail transit.
④ Coordinate and integrate, with efficient connection. Coordinate and promote the construction progress of urban rail transit, public transportation systems, and railways, create a clear-function, convenient transfer public transportation system, and improve the convenience of passenger transport.

4.3.2. Network Optimization

① Network Planning Stage
During the planning process of the rail transit network, priority should be given to enhancing the density of the rail transit network and improving its resilience. To achieve this goal, it is necessary to identify key stations in the network. When new stations need to be built, they should be connected to these key stations first to enhance the network’s connectivity and further improve its efficiency. With the development of the times, significant progress has been made in the design and construction of rail transit stations in the main urban area of Chongqing. However, there is still much room for improvement. Due to the lack of attention during the early planning of rail transit in Chongqing and the differences between the planning concepts at that time and current demands, problems such as long transfer distances, complex routes, and crossing passenger flows have emerged at transfer stations.
Transfer issues are inevitable problems that arise after the networked development of urban rail transit. Chongqing is located in the southwest of China and is mainly covered by hills and mountains. Due to the large height difference, transfer stations may not be at the same height. Therefore, more consideration should be given when planning and designing the network. Before the renovation, the Shapingba Station in Shapingba District and the Xiejiawan Station in Jiulongpo District could not be transferred within the station and passengers had to transfer outside the station. This was because sufficient consideration was not given during the planning stage. Therefore, when designing transfer stations, they should be integrated into the entire network and considered from the perspective of overall network optimization to ensure the coordination and unity of the entire network. When planning new urban rail transit lines, the transfer stations in the intersection areas should be considered first in the design. On the basis of basically determining the transfer plan, the structure of the stations should be designed to further optimize the rail transit network in Chongqing.
② Network Renovation Stage
Theoretically, the resilience of the rail transit network in Chongqing can be enhanced by adding more lines. Increasing the redundancy of the network, when nodes or lines fail, other alternative nodes or lines can be used to reduce the loss of network efficiency and thereby enhance the network’s resilience. However, in reality, due to actual conditions and policy restrictions, there are many limitations in designing and adding new lines to the actual rail transit network in Chongqing.
When renovating and updating lines, the intensity of passenger flow should also be fully considered. In the research on the influencing factors of urban rail transit vulnerability, heavy passenger flow and large passenger volume are also important sources of interference. Currently, the transportation capacity of Chongqing’s Rail Transit Line 3 and Line 6 is insufficient. To alleviate the pressure of passenger flow and improve passenger comfort, more vehicles should be purchased as resources permit to increase the transportation capacity of the lines.
③ Network Operation Stage
In the network operation management work, all stations in the network should be classified and managed according to their importance and vulnerability, with priority given to protecting stations with high importance and strong vulnerability and expanding their functions and roles. In addition, the construction of integrated connection facilities between rail transit and other transportation modes should be strengthened. For example, convenient bus stops, temporary pick-up and drop-off areas for taxis, and parking and transfer areas for shared bikes and motorcycles should be set up in peripheral areas. This will provide convenient and fast transfer conditions for passengers, attract citizens to use public transportation, and also provide alternative methods for passengers when stations are damaged and unable to provide services.

5. Conclusions

5.1. Theoretical Implications

The theoretical significance is mainly reflected in the following aspects:
① It is conducive to exploring the formation mechanism of the vulnerability of urban rail transit.
With the improvement of urbanization, there are more and more urban residents, and ground travel is becoming more and more crowded. Urban rail transit has ushered in rapid development with its own advantages. But at the same time, it also puts forward higher requirements for the safety management and safety operation of urban rail transit. Scholars at home and abroad have made many achievements in the field of urban rail transit, but there is little research on the generation mechanism of the vulnerability of urban rail transit under network operation. Based on literature analysis and case study, the paper identifies the influencing factors of urban rail transit vulnerability, analyzes the formation mechanism of urban rail transit vulnerability, analyzes the formation mechanism of urban rail transit network vulnerability combined with the characteristics of the network, and enriches the theoretical research of the mechanism.
② Expand the vulnerability of the urban rail transit network.
By establishing the structure model of the urban rail transit network and the network model of urban rail transit equipment and facilities, using MATLAB software programming to simulate the network, the vulnerability index evaluates the vulnerability of the Chongqing rail transit network. The theoretical and method research of urban rail transit vulnerability is conducive to comprehensively exploring the vulnerability of urban rail transit and expanding the theoretical research of the vulnerability of urban rail transit network to a certain extent.

5.2. Practical Implications

By analyzing the formation mechanism of the vulnerability of the urban rail transit network, the problems, risks, and weak links in the network operation process are found, and the corresponding resilience improvement suggestions are put forward, so as to reduce the network vulnerability of the network, which plays a certain guiding role in formulating and improving emergency plans and enhancing the ability to respond to emergencies. Therefore, the analysis of the vulnerability formation mechanism of urban rail transit is conducive to the whole process of urban rail transit safety management before, during, and after the event. To evaluate the vulnerability of urban rail transit networks and put forward reasonable resilience improvement strategies that can effectively prevent and reduce the occurrence of accidents, which has important application value.

5.3. Limitations and Future Research

5.3.1. Limitations

Despite the valuable insights obtained from this study, several limitations should be acknowledged. Firstly, in the construction of the topological model, certain assumptions were made to simplify the analysis. For instance, assuming equal site spacing and ignoring the hierarchical structure of transfer stations might not fully capture the complexity of the real urban rail transit network. In reality, variations in site spacing and the hierarchical nature of transfer stations can significantly influence network vulnerability. The disregard for these factors could lead to an incomplete understanding of the actual vulnerability characteristics of the Chongqing rail transit network.
Secondly, the study mainly focused on the topological structure of the network and evaluated vulnerability based on network efficiency changes under deliberate attacks. However, other crucial aspects such as the dynamic nature of passenger flow, the influence of different time periods on network operation, and the impact of various types of emergencies (beyond just deliberate attacks) were not comprehensively considered. Passenger flow dynamics can cause fluctuations in network load and connectivity, and different emergency scenarios may have diverse effects on network performance. Neglecting these elements restricts the comprehensiveness of the vulnerability assessment.
Thirdly, the data used in the research were mainly based on the network status as of January 2023. With the continuous development of Chongqing rail transit, new lines and stations are being planned and constructed. The data might not reflect the future changes and evolution of the network, thereby limiting the long-term applicability of the research conclusions.

5.3.2. Future Research

Future research directions can be explored from multiple aspects. To begin with, it is essential to refine the topological model by incorporating more realistic factors. Consideration should be given to factors such as the actual distribution of site spacing, the detailed hierarchical structure of transfer stations, and the influence of geographical terrain on line layout. This will enhance the accuracy of the model in representing the real network and provide a more solid foundation for vulnerability analysis.
Subsequently, the research scope can be expanded to include a more comprehensive analysis of the impact of various factors on network vulnerability. Incorporating passenger flow data and developing dynamic models that can simulate the changes in network vulnerability under different time-varying passenger flow conditions is of great significance. Additionally, different types of emergency scenarios, such as natural disasters, equipment failures, and terrorist attacks, should be systematically analyzed to establish a more comprehensive vulnerability assessment system.
Furthermore, with the development of technology, advanced data collection and analysis methods can be utilized. For example, the application of big data technology to collect real-time data on rail transit operation and passenger flow, combined with machine learning algorithms, can help predict network vulnerability more accurately and provide timely warning and decision-making support. Longitudinal studies can also be carried out to track the changes in network vulnerability during the development process of Chongqing rail transit and continuously update and improve the research results.
In conclusion, although this study has made certain contributions to the research on the vulnerability of urban rail transit networks, there is still much room for improvement. Future research should focus on addressing the limitations of this study and continuously explore new methods and perspectives to promote the in-depth development of this field.

Author Contributions

Conceptualization, P.X. and L.X.; Methodology, T.Z. and L.X.; Software, S.Y.; Resources, P.X.; Data curation, P.X.; Writing—original draft, F.W.; Writing—review & editing, L.X.; Project administration, Y.Q.; Funding acquisition, Y.Q. All authors have read and agreed to the published version of the manuscript.

Funding

This work was supported by National Social Science Foundation “The Collaborative Promotion Mechanism of Major Engineering Projects in the Chengdu-Chongqing Economic Circle” (24XGL009).

Data Availability Statement

Some data, models, or codes generated or used during the study are available from the corresponding author by request.

Conflicts of Interest

The authors declare no competing interests.

Appendix A

Table A1. Rail Transit Network Station Number in Chongqing.
Num.SiteNum.SiteNum.SiteNum.SiteNum.Site
1Chongqing University47Gaomiaocun93Gongmao139Dalongshan185Hongyancun
2Yudaishan48Shiqiaopu94Tongyuanju140Xingfu Square186Fuhualu
3Nanqiaosi49Xietaizi95Huaxinjie141Renhe187Hualongqiao
4Sports Park50Shiyoulu96Guanyinqiao142Hemulu188Lijiaping
5Ranjiaba51Daping97Hongqihegou143Chongguang189Mahuangliang
6Dongbu Park52Eling98Jiazhoulu144Huxiajie190Liyuchi
7Honghu East Road53Lianglukou99Zhengjiayuanzi145Danhe191Liujiatai
8Min’an Ave.54Qixinggang100Tangjiayuanzi146The EXPO Garden Center192Gailanxi
9Chongqing North Station South Square55Jiaochangkou101Shiziping147Beibei193Cruise Home Port
10Yulu56Xiaoshizi102Longtousi148Southwest University194Hejialiang
11Wulidian57Chaotianmen103Tongjiayuanzi149Zhuangyuanbei195Shipanhe
12Danzishi58Yudong104Jinyu150Longfengxi196Shangwanlu
13Tushan59Dajiang105Jintonglu151Xiangjiagang197Qinggangping
14Renji60Baijusi106Yuanyang152Caijia198Baoshenghu
15Shangxinjie61Liujiaba107The EXPO Garden153Caojiawan199Xingke Ave.
16Shanghao62Jinjiawan108Cuiyun154Jinshansi200Chunhua Ave.
17Haitangxi63Jianqiao109Changfulu155Lijia201Langui Ave.
18Luojiaba64Tiantangbao110Huixing156Jiuquhe202Center Park East
19Sigongli65Xinshancun111Shuanglong157Kangzhuang203Congyansi
20Nanhu66Dadukou112Bijin158Dazhulin204Huashigou
21Haixialu67Ping’an113Shuangfengqiao159Guangdianyuan205Longtousi Park
22Xiejiawan68Mawangchang114Jiangbei Airport Terminal 2160Huahuiyuan206Minxinjiayuan
23Olympic Sports Center Station69Dayancun115Konggang Square161Huangnibang207Sanyawan
24Chenjiaping70Zoo116Gaohubao162Hongtudi208Huanshan Park
25Caiyunhu71Yangjiaping117Guanyuelu163Jiangbecheng209Changhe
26Erlang72Yuanjiagang118Lianhua164Grand Theater210Jiangbei Airport Terminal 3
27Hualong73Fotuguan119Jurenba165Liujiaping211Yubei Square
28Chongqing West Station74Liziba120Chongqing North Station North Square166Changshengqiao212Lushan
29Shangqiao75Niujiaotuo121Toutang167Qiujiawan213Central Park
30Fengmingshan76Zengjiayan122Baoshuigang168Chayuan214Central Park west
31Chongqing Library77Daxigou123Cuntan169Shaheba215Tieshanping
32Tianxingqiao78Huanghuayuan124Heizi170Hongyanping216Luqi
33Shapingba79Linjiangmen125Gangcheng171Fuxing217Guoyuan Logistics Hub
34Bishan80Jinzhu126Taipingchong172Siyuan218Yuzui
35Jiandingpo81Yuhulu127Tangjiatuo173Liujiayuanzi219Yanping
36Daxuecheng82Xuetangwan128Tiaodeng174Qingxihe220Shiheqing
37Chenjiaqiao83Dashancun129Huayan Center175Wangjiazhuang221Fusheng
38Weidianyuan84Huaxi130Jinjianlu176Yuelai222Sanbanxi
39Laijiaqiao85Chalukou131Zhongliangshan177International Expo Center223Longyi Ave.
40Shuangbei86Jiugongli132Banshan178Gaoyikou224Longxing
41Shijingpo87Linlong133Huachenglu179Huangmaoping225Gaoshita
42Ciqikou88Bagongli134Huayansi180Huanlegu226Pufu
43Lieshimu89Chongqing jiaotong University135Fengxilu181Xinqiao227Tongzilin
44Yanggongqiao90Liugongli136Bashan182Gaotanyan228Shichuan
45Xiaolongkan91Chongqing Technology and Business University137Shixinlu183Tianlilu229Huangling
46Majiayan92Nanping138Dashiba184Tuwan

Appendix B

Table A2. Chongqing Rail Transit Network Adjacency List.
Num.AdjacencyNum.AdjacencyNum.AdjacencyNum.AdjacencyNum.Adjacency
11–25131–3210174–75151121–122201173–174
21–335232–3310275–76152121–192202174–175
32–35333–4410375–95153122–123203175–176
43–45433–4510476–77154122–193204176–177
54–55533–18310577–78155123–124205176–214
65–65634–3510678–79156124–125206177–178
75–1395735–3610780–81157125–126207178–179
85–1405836–3710881–82158126–127208179–180
95–1595937–3810982–83159127–215209181–182
106–76038–3911083–84160128–129210182–183
117–86139–4011184–85161129–130211184–185
128–96240–4111285–86162130–131212185–186
138–1206341–4211386–87163131–132213186–187
149–106442–4311487–88164132–133214187–188
159–1016543–4411588–89165133–134215188–189
169–1026645–4611689–90166135–136216190–191
179–1206745–18411790–91167136–137217193–194
189–2056846–4711892–93168138–139218194–195
1910–116947–4811993–94169139–160219195–196
2011–127048–4912095–96170140–141220196–197
2111–1627148–13712196–97171141–142221196–207
2211–1637249–5012296–189172142–143222196–208
2311–1927350–5112396–190173143–144223197–198
2412–137451–5212497–98174144–145224198–199
2513–147551–7212597–160175145–146225199–200
2614–157651–7312697–161176147–148226200–201
2715–167752–5312798–99177148–149227201–202
2815–567853–5412899–100178149–150228202–203
2915–1657953–75129100–101179150–151229202–212
3016–178053–94130102–103180151–152230202–213
3117–188154–55131103–104181152–153231203–204
3218–198255–56132104–105182153–154232206–207
3319–208355–79133105–106183154–155233208–209
3419–918456–57134106–107184155–156234209–210
3519–928556–164135107–108185155–180235211–212
3620–218658–59136108–109186156–157236213–214
3721–228758–80137109–110187157–158237215–216
3822–238859–60138110–111188158–159238216–217
3922–718960–61139111–112189161–162239217–218
4022–729061–62140112–113190162–190240218–219
4123–249162–63141112–114191162–205241219–220
4224–259263–64142113–115192163–164242220–221
4325–269364–65143114–210193163–191243221–222
4426–279465–66144114–211194165–166244222–223
4527–289566–67145115–116195166–167245223–224
4628–299667–68146116–117196167–168246224–225
4728–1349768–69147117–118197169–170247225–226
4828–1359869–70148118–119198170–171248226–227
4929–309970–71149120–121199171–172249227–228
5030–3110073–74150120–206200172–173250228–229

Appendix C

Table A3. Node Vulnerability Ranking.
RankingNum.Network EfficiencyVulnerabilityDecline RatioRankingNum.Network EfficiencyVulnerabilityDecline Ratio
120.08940.010710.69%116830.09920.00090.90%
240.09020.00999.89%1171300.09920.00090.90%
3260.09090.00929.19%118290.09920.00090.90%
4330.0920.00818.09%1191990.09930.00080.80%
52050.09280.00737.29%1201880.09930.00080.80%
680.09340.00676.69%1211840.09930.00080.80%
750.0940.00616.09%1221090.09930.00080.80%
81340.09450.00565.59%123690.09930.00080.80%
9280.09450.00565.59%124680.09930.00080.80%
10670.09480.00535.29%125560.09930.00080.80%
111220.0950.00515.09%126490.09930.00080.80%
12170.09550.00464.60%1271810.09940.00070.70%
13660.09560.00454.50%1281510.09940.00070.70%
14230.09570.00444.40%1291360.09940.00070.70%
1560.09590.00424.20%1301280.09940.00070.70%
16300.09590.00424.20%1311180.09940.00070.70%
1770.09590.00424.20%132820.09940.00070.70%
182060.0960.00414.10%133730.09940.00070.70%
19150.09610.00404.00%134480.09940.00070.70%
201600.09630.00383.80%135470.09940.00070.70%
21650.09630.00383.80%136390.09940.00070.70%
2210.09630.00383.80%1372150.09950.00060.60%
232070.09640.00373.70%1382010.09950.00060.60%
24130.09640.00373.70%1392000.09950.00060.60%
251560.09650.00363.60%1401940.09950.00060.60%
261320.09650.00363.60%1411690.09950.00060.60%
271440.09660.00353.50%1421680.09950.00060.60%
282080.09680.00333.30%1431630.09950.00060.60%
291590.09680.00333.30%1441010.09950.00060.60%
301450.09680.00333.30%145720.09950.00060.60%
31640.09690.00323.20%146590.09950.00060.60%
321400.0970.00313.10%147550.09950.00060.60%
331310.0970.00313.10%148540.09950.00060.60%
341580.09710.00303.00%149460.09950.00060.60%
352090.09720.00292.90%150450.09950.00060.60%
361550.09720.00292.90%1511930.09960.00050.50%
371330.09720.00292.90%1521890.09960.00050.50%
381740.09730.00282.80%1531800.09960.00050.50%
391570.09740.00272.70%1541770.09960.00050.50%
40250.09740.00272.70%1551660.09960.00050.50%
41630.09750.00262.60%1561140.09960.00050.50%
42420.09750.00262.60%1571080.09960.00050.50%
43120.09750.00262.60%1581070.09960.00050.50%
4490.09750.00262.60%159810.09960.00050.50%
452100.09760.00252.50%160500.09960.00050.50%
461460.09760.00252.50%161360.09960.00050.50%
471230.09760.00252.50%162400.09960.00050.50%
48870.09760.00252.50%1631850.09970.00040.40%
49180.09760.00252.50%1641790.09970.00040.40%
501390.09770.00242.40%1651780.09970.00040.40%
511060.09770.00242.40%1661620.09970.00040.40%
52270.09770.00242.40%1671490.09970.00040.40%
5330.09770.00242.40%1681190.09970.00040.40%
541540.09780.00232.30%1691110.09970.00040.40%
55410.09780.00232.30%1701000.09970.00040.40%
561730.09790.00222.20%171530.09970.00040.40%
571750.09790.00222.20%172520.09970.00040.40%
581100.09790.00222.20%173510.09970.00040.40%
591210.09790.00222.20%1742160.09980.00030.30%
60340.09790.00222.20%1751920.09980.00030.30%
61140.09790.00222.20%1761910.09980.00030.30%
622110.0980.00212.10%1771900.09980.00030.30%
631640.0980.00212.10%1781870.09980.00030.30%
64620.0980.00212.10%1791820.09980.00030.30%
651150.09810.00202.00%1801430.09980.00030.30%
66860.09810.00202.00%1811260.09980.00030.30%
67190.09810.00202.00%1821200.09980.00030.30%
68110.09810.00202.00%183990.09980.00030.30%
691240.09820.00191.90%184910.09980.00030.30%
701050.09820.00191.90%185900.09980.00030.30%
71100.09820.00191.90%186800.09980.00030.30%
721380.09830.00181.80%187380.09980.00030.30%
73440.09830.00181.80%188370.09980.00030.30%
74430.09830.00181.80%1891860.09990.00020.20%
752120.09840.00171.70%1901420.09990.00020.20%
761700.09840.00171.70%1911410.09990.00020.20%
771530.09840.00171.70%1921350.09990.00020.20%
781470.09840.00171.70%1931290.09990.00020.20%
791610.09850.00161.60%1941250.09990.00020.20%
80850.09850.00161.60%1952040.09990.00020.20%
81610.09850.00161.60%196350.09990.00020.20%
82320.09850.00161.60%1971170.09990.00020.20%
83240.09850.00161.60%1981160.09990.00020.20%
84200.09850.00161.60%199940.09990.00020.20%
851760.09860.00151.50%200890.09990.00020.20%
861040.09860.00151.50%201790.09990.00020.20%
872130.09870.00141.40%2022220.10.00010.10%
881950.09870.00141.40%2032190.10.00010.10%
891120.09870.00141.40%2041670.10.00010.10%
901650.09880.00131.30%2051500.10.00010.10%
911370.09880.00131.30%206980.10.00010.10%
921270.09880.00131.30%207930.10.00010.10%
93880.09880.00131.30%208920.10.00010.10%
94310.09880.00131.30%209580.10.00010.10%
95210.09880.00131.30%210970.10010.00000.00%
96160.09880.00131.30%211960.10010.00000.00%
971960.09890.00121.20%212950.10010.00000.00%
981830.09890.00121.20%213780.10010.00000.00%
991710.09890.00121.20%214770.10010.00000.00%
1001520.09890.00121.20%215760.10010.00000.00%
1011030.09890.00121.20%216750.10010.00000.00%
102840.09890.00121.20%217740.10010.00000.00%
103710.09890.00121.20%2182170.10010.00000.00%
1042030.0990.00111.10%2191720.10010.00000.00%
1052020.0990.00111.10%2202280.10010.00000.00%
1061970.0990.00111.10%2212270.10010.00000.00%
107600.0990.00111.10%2222250.10010.00000.00%
1082140.09910.00101.00%2232230.10010.00000.00%
1091480.09910.00101.00%2242260.10010.00000.00%
1101130.09910.00101.00%2252240.10010.00000.00%
111700.09910.00101.00%2262210.10010.00000.00%
112570.09910.00101.00%2272200.10010.00000.00%
113220.09910.00101.00%2282180.10010.00000.00%
1141980.09920.00090.90%2292290.10010.00000.00%
1151020.09920.00090.90%

References

  1. Yi, P.; Huang, F.; Wang, J.; Peng, J. Topology augmented dynamic spatial-temporal network for passenger flow forecasting in urban rail transit. Appl. Intell. 2023, 53, 24655–24670. [Google Scholar] [CrossRef]
  2. Hu, H.; Li, J.; Wu, S. Simulation Evaluation of a Current Limiting Scheme in an Urban Rail Transit Network. Sustainability 2023, 15, 375. [Google Scholar] [CrossRef]
  3. Wang, X.; Zhang, Y.; Zhang, J. Large-Scale Origin–Destination Prediction for Urban Rail Transit Network Based on Graph Convolutional Neural Network. Sustainability 2024, 16, 10190. [Google Scholar] [CrossRef]
  4. Arabiun, A.; Dehkordi, A.M.; Hosseini, E.; Brahmi, M. A Framework for Strategic Analysis in Dynamic and Complex Environments. In Exploring Business Ecosystems and Innovation Capacity Building in Global Economics; Joshi, M., Brahmi, M., Aldieri, L., Vinci, C., Eds.; IGI Global Scientific Publishing: Hershey, PA, USA, 2023; pp. 26–47. [Google Scholar]
  5. Wei, W.; Yang, X.; Xiao, X.; Ma, Z.; Zhu, T.; Dou, F.; Wu, J.; Chen, A.; Gao, Z. Understanding the Resilience of Urban Rail Transit: Concepts, Reviews, and Trends. Engineering 2024, 41, 7–18. [Google Scholar] [CrossRef]
  6. Chen, Z.P.; Xie, N.; Wang, C.M.; Qian, Z. Vulnerability Evaluation and Robustness Improvement Strategy of Complex Power Network Based on Fractal Mechanism. Power Syst. Technol. 2021, 45, 657–665. [Google Scholar]
  7. Wei, J.L.; Zhao, L.Y. Urban Road Network Vulnerability Assessment and Mitigation Strategies: A Case Study in Wuhan Main City. Mod. Urban Res. 2020, 35, 6. [Google Scholar]
  8. Yang, L.P.; Qian, D.L. Vulnerability Analysis of Road Networks. J. Transp. Syst. Eng. Inf. Technol. 2012, 12, 105–110. [Google Scholar] [CrossRef]
  9. Huang, Z.; Loo Becky, P.Y. Vulnerability assessment of urban rail transit in face of disruptions: A framework and some lessons from Hong Kong. Sustain. Cities Soc. 2023, 98, 104858. [Google Scholar] [CrossRef]
  10. Deng, Y.; Li, Q.; Lu, Y.; Yuan, J. Topology Vulnerability Analysis and Measure of Urban Metro Network: The ease of Nanjing. J. Netw. 2013, 8, 1350. [Google Scholar] [CrossRef]
  11. Latora, V.; Marchiori, M. Is the Boston subway a small-world network? Phys. A Stat. Mech. Its Appl. 2002, 314, 109–113. [Google Scholar] [CrossRef]
  12. Zhang, J.H. The Research on Connectivity Vulnerability of Metro Complex Networks. Ph.D. Thesis, Huazhong University of Science and Technology, Wuhan, China, 2012. [Google Scholar]
  13. Yalçınkaya, Ö.; Bayhan, G.M. Modelling and optimization of average travel time for a metro line by simulation and response surface methodology. Eur. J. Oper. Res. 2008, 196, 225–233. [Google Scholar] [CrossRef]
  14. Raveau, S.; Muñoz, J.C.; Grange, L.D. A topological route choice model for metro. Transp. Res. Part A 2010, 45, 138–147. [Google Scholar] [CrossRef]
  15. Cheng, Y.-Y.; Lee, R.K.-W.; Lim, E.-P.; Zhu, F. DelayFlow centrality for identifying critical nodes in transportation networks. Adv. Soc. Netw. Anal. Min. 2013, 1462–1463. [Google Scholar]
  16. Cai, H.; Zhu, J.; Yang, C.; Fan, W.; Xu, T. Vulnerability Analysis of Metro Network Incorporating Flow Impact and Capacity Constraint after a Disaster. J. Urban Plan. Dev. 2016, 143, 04016031. [Google Scholar] [CrossRef]
  17. Sun, D.; Zhao, Y.; Lu, Q.-C. Vulnerability Analysis of Urban Rail Transit Networks: A Case Study of Shanghai, China. Sustainability 2015, 7, 6919–6936. [Google Scholar] [CrossRef]
  18. Sun, D.; Guan, S. Measuring vulnerability of urban metro network from line operation perspective. Transp. Res. Part A Policy Pract. 2016, 94, 348–359. [Google Scholar] [CrossRef]
  19. Xu, X.; Song, S.X.; Yuan, P.W. Evaluation of network vulnerability of subway stations based on ANP. China Saf. Sci. J. 2015, 25, 129–134. [Google Scholar]
  20. Cheng, F.F.; Chang, M.; Chen, Q. A methodology to assess vulnerability of environmental incidents in cities and towns. China Popul. Resour. Environ. 2016, 26, 48–52. [Google Scholar]
  21. Albert, R.; Jeong, H.; Barabasi, A.L. Error and attack tolerance of complex networks. Nature 2000, 406, 378–382. [Google Scholar] [CrossRef]
  22. Yang, J.F.; Zhu, D.P.; Zhao, R.L. Analysis on Characteristics of Urban Rail Transit Network and Robustness of Cascading Failure. Comput. Eng. Appl. 2022, 58, 250–258. [Google Scholar]
  23. Lv, J.; Chen, G.; Ogorzalek, M.J.; Trajković, L. Theory and applications of complex networks: Advances and challenges. In Proceedings of the IEEE International Symposium on Circuits & Systems, Beijing, China, 19–23 May 2013; IEEE: Piscataway, NJ, USA, 2013. [Google Scholar]
  24. Thai, M.T.; Pardalos, P.M. (Eds.) Handbook of Optimization in Complex Networks. Theory and Applications; Springer Optimization & Its Applications; Springer: Berlin/Heidelberg, Germany, 2011; Volume 58, pp. 0111222–0112001. [Google Scholar]
  25. Albert, R.; Albert, I.; Nakarado, G.L. Structural vulnerability of the North American power grid. Phys. Rev. E Stat. Phys. Plasmas Fluids Relat. Interdiscip. Top. 2004, 69, 025103(R). [Google Scholar] [CrossRef] [PubMed]
  26. Wang, J.W.; Rong, L.L. Cascade-based attack vulnerability on the US power grid. Saf. Sci. 2009, 47, 1332–1336. [Google Scholar] [CrossRef]
  27. Winkler, J.; Duenas-Osorio, L.; Stein, R.; Subramanian, D. Performance assessment of topologically diverse power systems subjected to hurricane events. Reliab. Eng. Syst. Saf. 2010, 95, 323–336. [Google Scholar] [CrossRef]
  28. Ezzeldin, M.; El-Dakhakhni, W.E. Robustness of Ontario power network under systemic risks. Sustain. Resilient Infrastruct. 2021, 6, 252–271. [Google Scholar] [CrossRef]
  29. Ouyang, M.; Yu, M.H.; Huang, X.Z.; Luan, E.J. Emergency response to disaster-struck scale-free network with redundant systems. Phys. A Stat. Mech. Its Appl. 2008, 387, 4683–4691. [Google Scholar] [CrossRef]
  30. Simone, A.; Ridolfi, L.; Berardi, L.; Laucelli, D.; Giustolisi, O. Complex Network Theory for Water Distribution Networks analysis. In Proceedings of the 13th International Conference on Hydroinformatics, HIC 2018, Palermo, Italy, 1–5 July 2018. [Google Scholar]
  31. Wu, J.J.; Gao, Z.Y.; Sun, H.J. Effects of the cascading failures on scale-free traffic networks. Phys. A Stat. Mech. Its Appl. 2007, 378, 505–511. [Google Scholar] [CrossRef]
  32. Zhang, J.; Cao, X.B.; Du, W.B.; Cai, K.Q. Evolution of Chinese airport network. Phys. A Stat. Mech. Its Appl. 2010, 389, 3922–3931. [Google Scholar] [CrossRef] [PubMed]
  33. Ma, Z.L.; Hu, D.W.; Chien Steven, I.; Liu, J.; Liu, Y.; Wu, K. Robustness of Urban Rail Transit Networks Considering Cascade Failure under Attacks: A Case Study of Nanjing, China. ASCE-ASME J. Risk Uncertain. Eng. Syst. Part A Civ. Eng. 2025, 11, 04024093. [Google Scholar] [CrossRef]
  34. Tang, M.; Guo, X.; Qiu, J.; Li, J.; An, B. Electric Vehicle Charging Load Demand Forecasting in Different Functional Areas of Cities with Weighted Measurement Fusion UKF Algorithm. Energies 2024, 17, 4505. [Google Scholar] [CrossRef]
  35. Lee, K.; Jung, W.-S.; Park, J.S.; Choi, M. Statistical analysis of the Metropolitan Seoul Subway System: Network structure and passenger flows. Phys. A Stat. Mech. Its Appl. 2008, 387, 6231–6234. [Google Scholar] [CrossRef]
  36. Lu, Q.-C.; Lin, S. Vulnerability Analysis of Urban Rail Transit Network within Multi-Modal Public Transport Networks. Sustainability 2019, 11, 2109. [Google Scholar] [CrossRef]
  37. Zhang, T.Y.; Song, R.; Zheng, L. Analysis of Domestic Subway Network Characteristics Based on Complex Network Theory. J. Transp. Inf. Saf. 2012, 30, 50–54. [Google Scholar]
  38. Gu, Y.; Cheng, L. The Robustness of Urban Rail Transit Network based on Complex Network Theory. In Proceedings of the 2016 3rd International Conference on Materials Engineering, Manufacturing Technology and Control, Taiyuan, China, 27–28 February 2016; Atlantis Press: Amsterdam, The Netherlands, 2016. [Google Scholar]
  39. Latora, V.; Marchiori, M. Efficient behavior of small-world networks. Phys. Rev. Lett. 2001, 87, 198701. [Google Scholar] [CrossRef] [PubMed]
  40. Holme, P.; Kim, B.J.; Yoon, C.N.; Han, S.K. Attack vulnerability of complex networks. Phys. Rev. E Stat. Nonlin. Soft Matter. Phys. 2002, 65, 056109. [Google Scholar] [CrossRef] [PubMed]
  41. Ma, M.; Hu, D.W.; Shu, L.; Ma, Z.L. Resilience assessment and recovery strategy on urban rail transit network. J. Jilin Univ. (Eng. Technol. Ed.) 2023, 53, 396–404. [Google Scholar]
Figure 1. Network topology modeling methods.
Buildings 15 00170 g001aBuildings 15 00170 g001b
Figure 2. Chongqing rail transit operation line network map.
Buildings 15 00170 g002
Figure 3. Urban rail transit network model diagram.
Buildings 15 00170 g003
Figure 4. Chongqing rail transit line network topology map. Note: Each circle represents A site, and the corresponding site number is shown in Appendix A.
Buildings 15 00170 g004
Figure 5. Topological properties of Chongqing rail transit network.
Buildings 15 00170 g005aBuildings 15 00170 g005b
Figure 6. A schematic representation of the network structure in the three states.
Buildings 15 00170 g006
Figure 7. Change in network efficiency ratio.
Buildings 15 00170 g007
Figure 8. Chongqing rail transit station vulnerability classification map.
Buildings 15 00170 g008
Table 1. Network adjacency matrix in three states.
The Initial NetworkAfter Suffering From a Node AttackAfter Suffering From the Edge Attack
N1N2N3N4N5 N1N2N3N4N5 N1N2N3N4N5
N101100N100100N100100
N210100N200000N200100
N311011N310011N311011
N400101N400101N400101
N500110N500110N500110
Table 2. Top 10 sites of node vulnerability.
NumberSiteNetwork EfficiencyVulnerabilityDecline Ratio
2Yudaishan0.08940.010710.69%
4Sports Park0.09020.00999.89%
26Erlang0.09090.00929.19%
33Shapingba0.0920.00818.09%
205Longtousi Park0.09280.00737.29%
8Min’an Ave0.09340.00676.69%
5Ranjiaba0.0940.00616.09%
134Huayansi0.09450.00565.59%
28Chonogqing West Station0.09450.00565.59%
67Ping’an0.09480.00535.29%
Disclaimer/Publisher’s Note: The statements, opinions and data contained in all publications are solely those of the individual author(s) and contributor(s) and not of MDPI and/or the editor(s). MDPI and/or the editor(s) disclaim responsibility for any injury to people or property resulting from any ideas, methods, instructions or products referred to in the content.

