Article

Spatial Analysis and Social Network Analysis for Structural Restoration of Settlements: A Case Study of the Great Wall Under the Influence of a Non-Agricultural Civilization

1
Center for Urban Renewal and Architectural Heritage Conservation, Hebei University of Technology, Tianjin 300401, China
2
School of Architecture and Art Design, Hebei University of Technology, Tianjin 300401, China
3
The People’s Government of Wuyi Town, Nanqiao District, Chuzhou 239000, China
*
Author to whom correspondence should be addressed.
Buildings 2025, 15(17), 3160; https://doi.org/10.3390/buildings15173160
Submission received: 10 July 2025 / Revised: 24 August 2025 / Accepted: 26 August 2025 / Published: 2 September 2025
(This article belongs to the Section Architectural Design, Urban Science, and Real Estate)

Abstract

The settlements of the Great Wall are the product of the overlap of ancient Chinese agricultural civilization and non-agricultural civilization. The structure of the settlement system is of great value for understanding the law of defense engineering and social spatial organization. The Great Wall, built by a non-agricultural civilization, is an important part of the development history of the Chinese civilization. Its uniqueness reflects the relationship between institution and space. However, the archaeological remains and related research methods for non-agricultural Great Wall settlements are not perfect. This paper takes the typical case of the Great Wall built by a non-agricultural civilization (Linhuang Lu settlements of the Jin Great Wall) as the object and integrates spatial analysis and social network analysis. It aims to explore the structure of the settlement system. The settlements of Linhuang Lu show non-random distribution characteristics. They can be divided into four levels. The number ratio from high-level to low-level settlements is 70:30:10:1. Through the weighted Voronoi and social network analysis of human connection and geographical connection, this paper clarifies the structural characteristics of spatial association and social association of settlements. Combined with accessibility and geographical environment, the Linhuang Lu settlements were finally divided into 10 Meng’an defense units and 12 Mouke defense units. Quantitative analysis of the settlement system structure shows the hierarchical management of nature and military by non-agricultural civilization. This provides an empirical basis for the reconstruction of the military defense system of the Great Wall of the Jin Dynasty and further explores the applicability of the research paradigm. This paper has methodological innovation value for solving the problem of spatial cognition of settlement heritage.

1. Introduction

The Great Wall is a large-scale military defense project from ancient China. It functioned not only as a barrier to prevent the northern ethnic groups from moving south but also as a balance zone between farming culture and nomadic culture. Since the Spring and Autumn Period and the Warring States Period, many regimes have taken control of Central China and built the Great Wall on a large scale for a long time. The Qin Dynasty and the subsequent Western Han Dynasty began the early development history of the Great Wall with their farming regime. Subsequently, during the Wei, Jin, Southern, and Northern Dynasties, nomadic and semi-nomadic peoples entered Central China, and the rulers of the Northern Wei Dynasty built the Great Wall to defend the north. Since then, the Great Wall built by the non-agricultural regime has taken on an important role in the historical process. Later, the Eastern Wei, Western Wei, Northern Qi, and Northern Zhou regimes all built the Great Wall. In the Liao, Jin, and Western Xia dynasties, the Great Wall broke through the “wall defense” paradigm [1] and generally adopted lightweight ramming technology, which was composed of entrenchments, trench walls, side forts, passes, and beacons, with a focus on the collaborative layout of multi-point defense. At the same time, stone masonry technology was also adopted in the mountain areas according to local conditions. After non-agricultural people became the builders and users of the Great Wall, the Great Wall went beyond its simple military defense function and evolved into a dynamic field of multi-civilization collision, adjustment, and symbiosis. The non-agricultural people in several dynasties created a Great Wall settlement system with military control, resource allocation, and cultural integration in the ecotone between grassland and farming. This kind of Great Wall is the Great Wall built for non-agricultural ethnic groups. Under the influence of non-agricultural civilization, the Great Wall system broke through the traditional paradigm of “the boundary between agricultural and non-agricultural regimes”, transforming linear fortifications into dynamic frontier governance media. Through the spatial strategy of multi-point linkage, they reflected the mobility of a non-agricultural society, the military thought of strategic depth, and the cultural characteristics of adaptability. However, this aspect of the Great Wall is less studied than the Great Wall built by the agricultural regime and has not received sufficient attention.
In the face of this kind of special linear heritage, with both the characteristics of non-agricultural civilization and the function of borderland governance, the research faces two dilemmas: one is the fragmentation and ambiguity of historical records, and the other is that the existing sites cannot fully present the original military deployment system and settlement system structure. In this context, we consider how to formulate a multi-angle research paradigm, and we speculate as to its military settlement hierarchical network and spatial organization logic. There has been a deepening of the value cognition of the Great Wall of non-agricultural civilization, which has become a realistic problem to be solved urgently to realize the living inheritance of cultural heritage.
The settlement system of the Great Wall is composed of several interrelated ancient defensive cities built to defend against the enemy. The structure of the Great Wall settlement system refers to the interactions and interconnections between different levels of settlements. It refers to the association, collocation, and arrangement between settlements, reflecting the internal organizational form of the system. The purpose of restoring the system structure of the Great Wall settlements is to go beyond the isolated study of a single site and reveal its essential operational logic and strategic thinking as a military defense project as a whole. By analyzing the hierarchical order, spatial arrangement, and visual correlation between settlements, we can reveal how the ancients weaved countless isolated “points” into an organic and deep defense network combining “lines” and “faces”. Clarifying the system structure provides a key basis for the overall protection of its cultural heritage.
In recent years, the research methods on settlement structure have become increasingly diversified. Li Chen analyzed the spatial differentiation characteristics of rural settlements in plateau lakes by using the Voronoi diagram and the nearest neighbor index [2]. Zhang Lu applied the weighted Voronoi diagram to divide the influence scope of the settlements, which provided the basis for the optimization of the spatial layout of the settlements [3]. The research methods on the settlement structure of the Great Wall have gradually expanded. There are historical documents combined with archaeological investigations to explore the distribution characteristics of settlements and the formation of their defense systems [4,5]. The spatial analysis method can be used to explore the characteristics of the internal structure of the settlements [6,7]. There is also the use of Voronoi diagram analysis to explore the spatial distribution characteristics of settlement point sets and analyze the dual fractal spatial structure of settlements [8]. The research of foreign scholars on the Great Wall settlement is mainly based on the Hadrians Wall area, and uses GIS techniques to analyze the military structure [9,10]. However, the focus of research is mostly on the planning level such as settlement space layout and spatial evolution, and the single level such as settlement shape characteristics and construction characteristics. There are still gaps in the settlement level, system structure and other aspects. What kind of structure is presented in the static space between the settlements, what kind of social connections are generated in the dynamic operation of the settlement system and what kind of social association structure the system presents have not yet been addressed by current research.
With traditional research methods, it is difficult to quantify non-spatial elements and to explain the coordination mechanism or command hierarchy between different side settlements. Therefore, it is necessary to combine spatial analysis and social network analysis to interpret the settlement level and structure. Because of its unique structural research, social network analysis can accurately quantify and formally express complex social phenomena. It is an effective method to reveal the connection between settlements. Social network analysis is applied to urban economic structure research [11], spatial structure research [12,13] and so on. Domestic scholars mainly use social network analysis to explore rural tourism social network [14,15,16], public space reconstruction [17,18], spatial network structure and its optimization [19,20], settlement protection research [21] and other aspects. Xie Dan and Zhang Weiya used the social network method to quantify the Great Wall settlements in the study of regional protection of the Great Wall settlements. It provides a basis for protection optimization [22]. Although the application of this method in the special settlement system of the Great Wall settlements has not been fully explored, the existing research has proved that this method is suitable for the study of the Great Wall settlements.
Therefore, in order to explore the structure of the Great Wall settlement system under the influence of non-agricultural civilization, this paper chooses the Jin Great Wall on Linhuang Lu settlements as the research object. This paper introduces the social network analysis method in the field of sociology, and constructs the social association network between settlements from the perspective of relationships in order to accurately express the abstract connection generated during the operation of the settlement. At the same time, combined with the GIS spatial analysis method from the image, the spatial correlation structure of the settlement is analyzed. The purpose is to identify the affiliation of the Linhuang Lu settlements, divide the settlement group from the two aspects of spatial distribution and social connection of system operation, and clarify the system structure. The dual perspective analysis breaks through the limitations of previous studies only from the perspective of space, so that the relationship between the Great Wall settlements can be fully demonstrated. It provides a new research paradigm for studying the structure of other Great Wall settlement systems under the influence of non-agricultural civilization.

2. Materials and Methods

2.1. Study Subjects

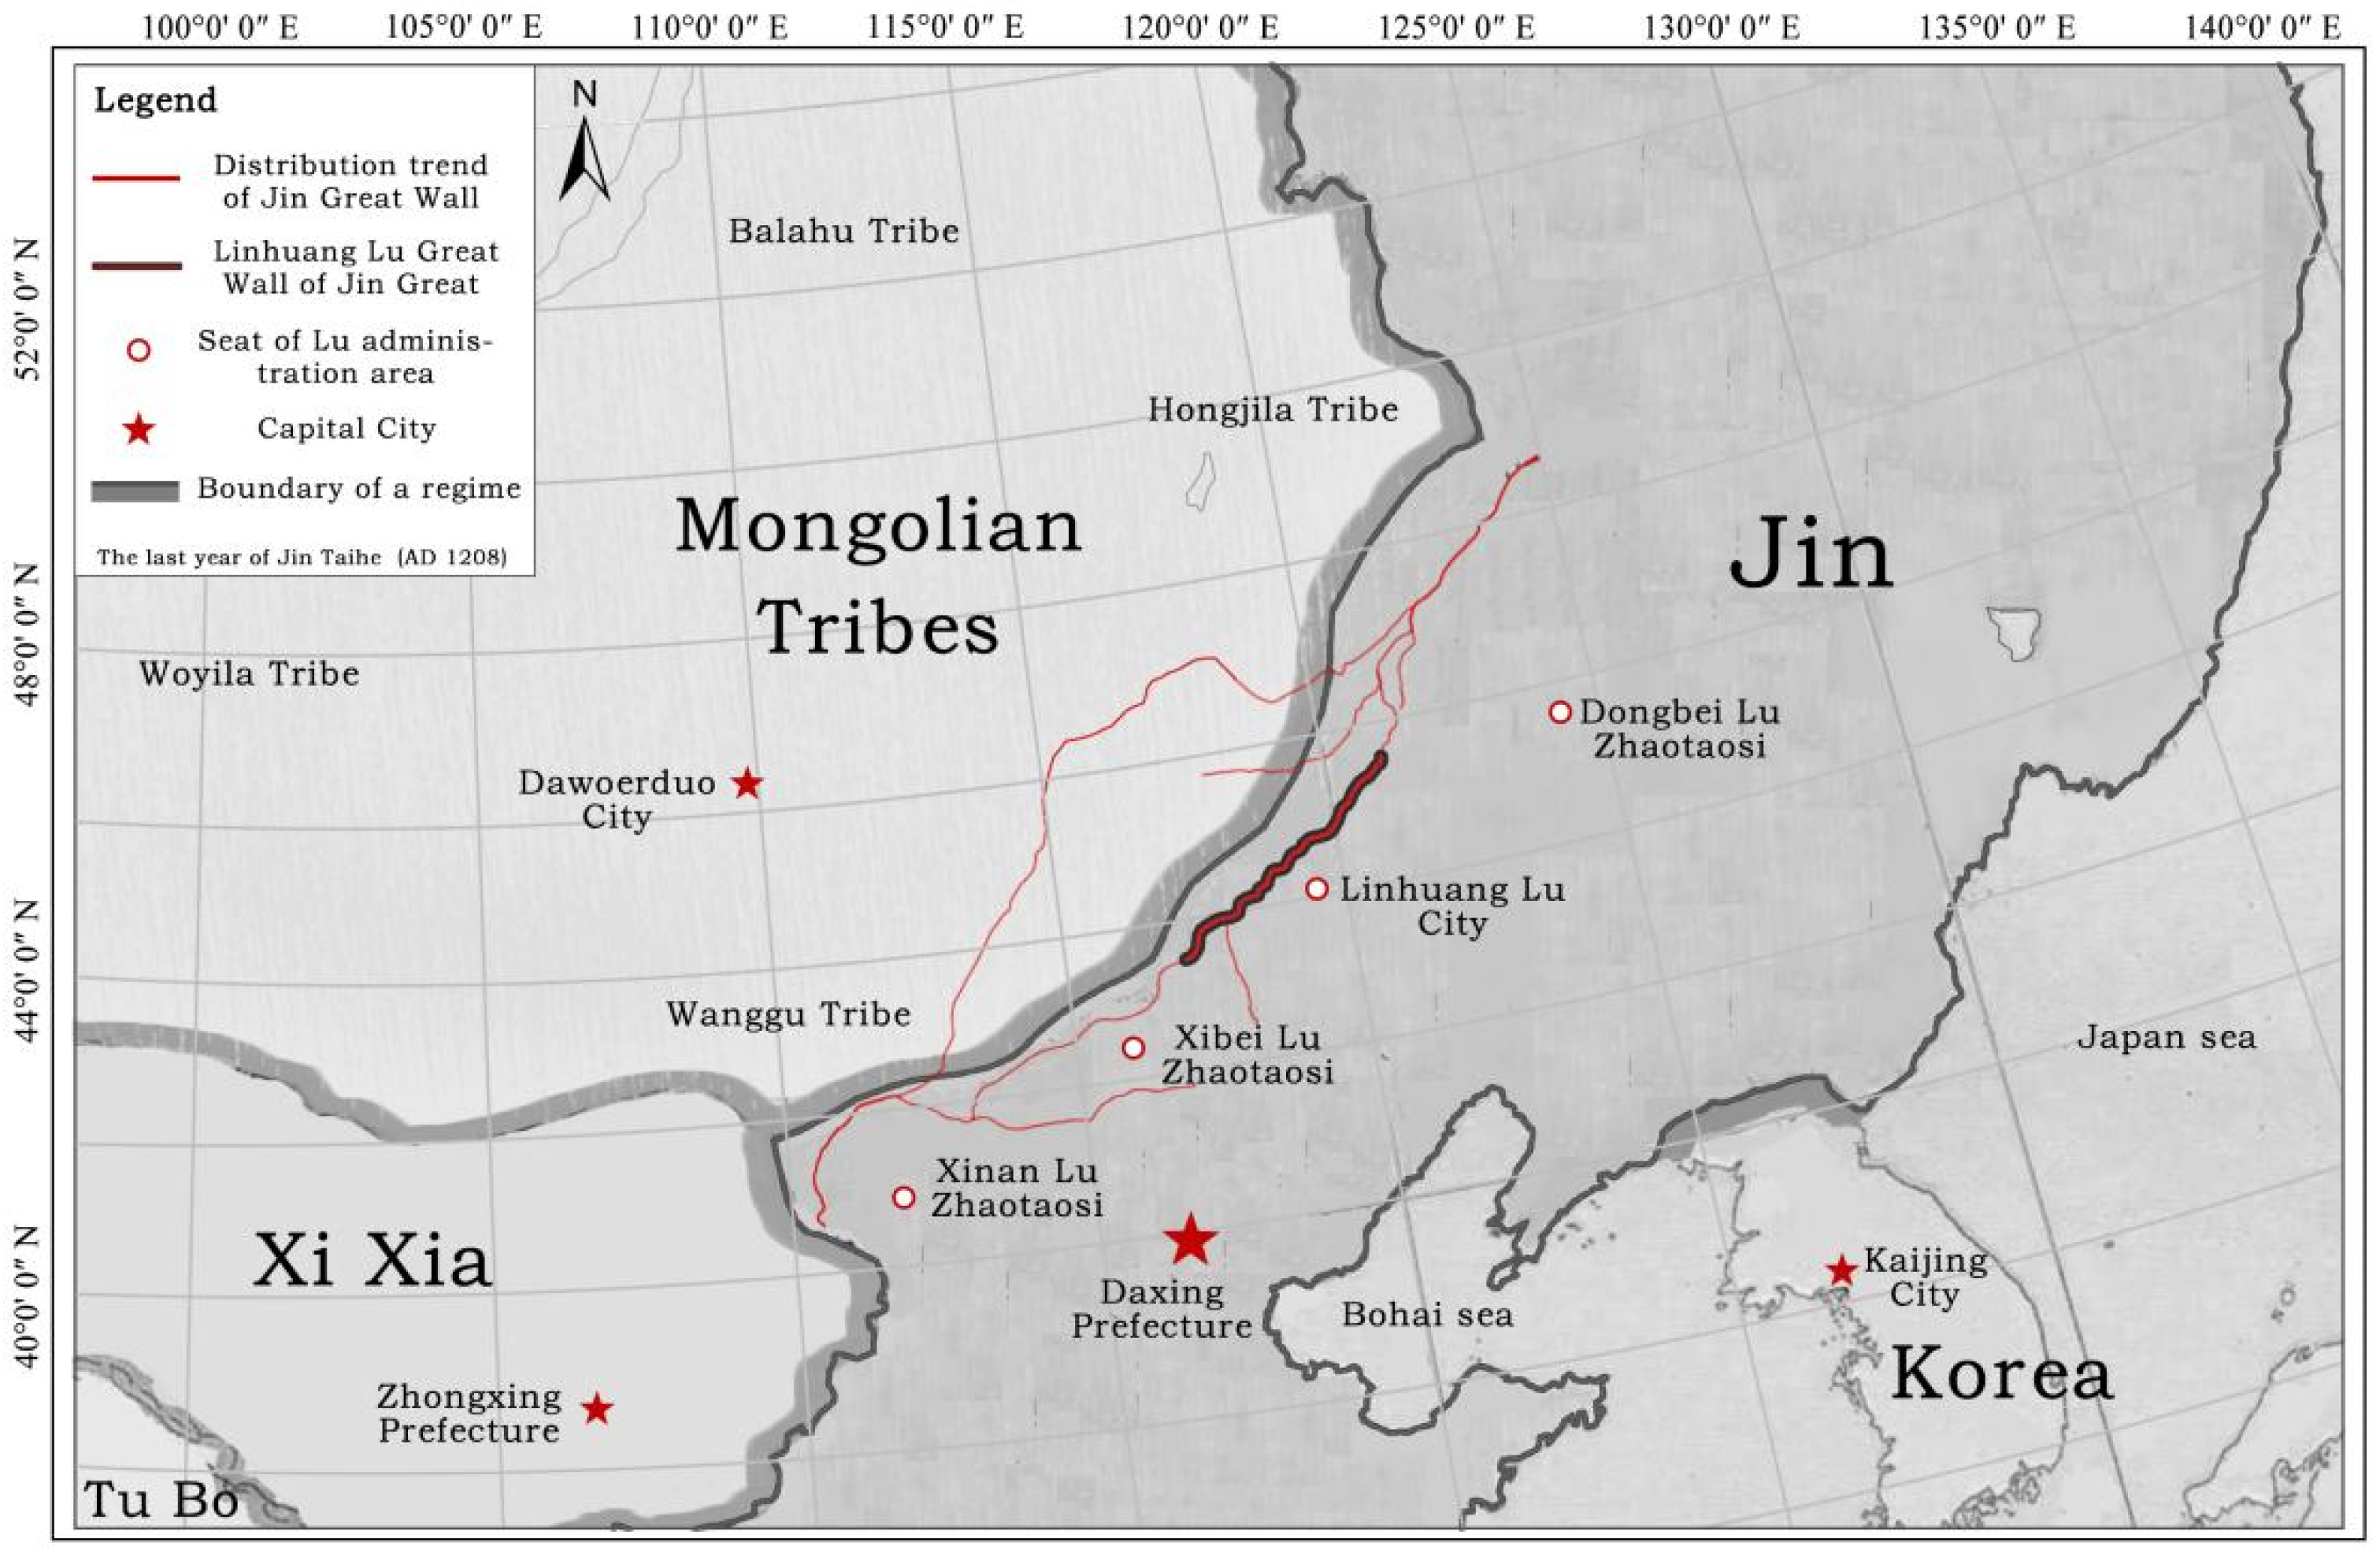
The research object of this paper is the settlements under the jurisdiction of the Jin Great Wall on Linhuang Lu. The Great Wall of the Jin Dynasty is a defense-oriented military defense system built by the Jurchen people in the northwest territory. It includes the entrenchment defense project, settlement defense project, and information transmission project. It has distinct nomadic characteristics in terms of planning layout, architectural form, and military management. The Great Wall settlements not only play the role of garrisoning the frontier and maintaining regional stability, but also accommodate living and production activities. The spatial distribution of the settlements of the Great Wall of the Jin Dynasty is mainly concentrated in four central points: Taizhou City, Linhuangfu City, Fuzhou City and Fengzhou City. Through these four central points, the Jin Great Wall settlements are divided into four defensive zones to manage, namely, Northeast Lu, Linhuang Lu, Northwest Lu and Southwest Lu. The research object area is shown in Figure 1.
Among them, Northeast Lu and Linhuang Lu are under the jurisdiction of Northeast Lu Zhaotaosi; Northwest Lu and Southwest Lu are under the jurisdiction of Northwest Lu Zhaotaosi and Southwest Lu Zhaotaosi. In the jurisdiction of Zhaotaosi, Meng’an-Mouke Organization was used as the grass-roots military management organization [23]. In addition, the four-level management level of Zhaotaosi-Meng’an-Mouke-Punian is implemented in the jurisdiction. Influenced by the hierarchy of the military management system of the Jin Great Wall, the settlements of Linhuang Lu present hierarchical characteristics in scale, space and shape. Because Linhuang Lu is under the jurisdiction of the Northeast Lu Zhaotaosi, the encampment is located in the Northeast Lu Defense Area. Therefore, the Zongguanfu settlement was established on Linhuang Lu as the highest level of settlement jurisdiction. Therefore, from top to bottom, they can be divided into Zongguanfu settlement, Meng’an settlement, Mouke settlement and Punian settlement. In previous studies, it is believed that the Zhaotaosi (Zongguanfu) settlement is the highest-level settlement, which has the function of stationing troops, garrisoning and commanding the construction of golden trenches. As a settlement organization of military and political integration, Meng’an and Mouke include military functions such as garrison. The Punian settlement is the most basic military defense unit. The typical entrenchments within the scope of Linhuang Lu are as shown in Figure 2, and the typical settlement shapes are as shown in Figure 3. Limited to space, the settlement system structure of other Jin Great Wall defense areas was not expanded.
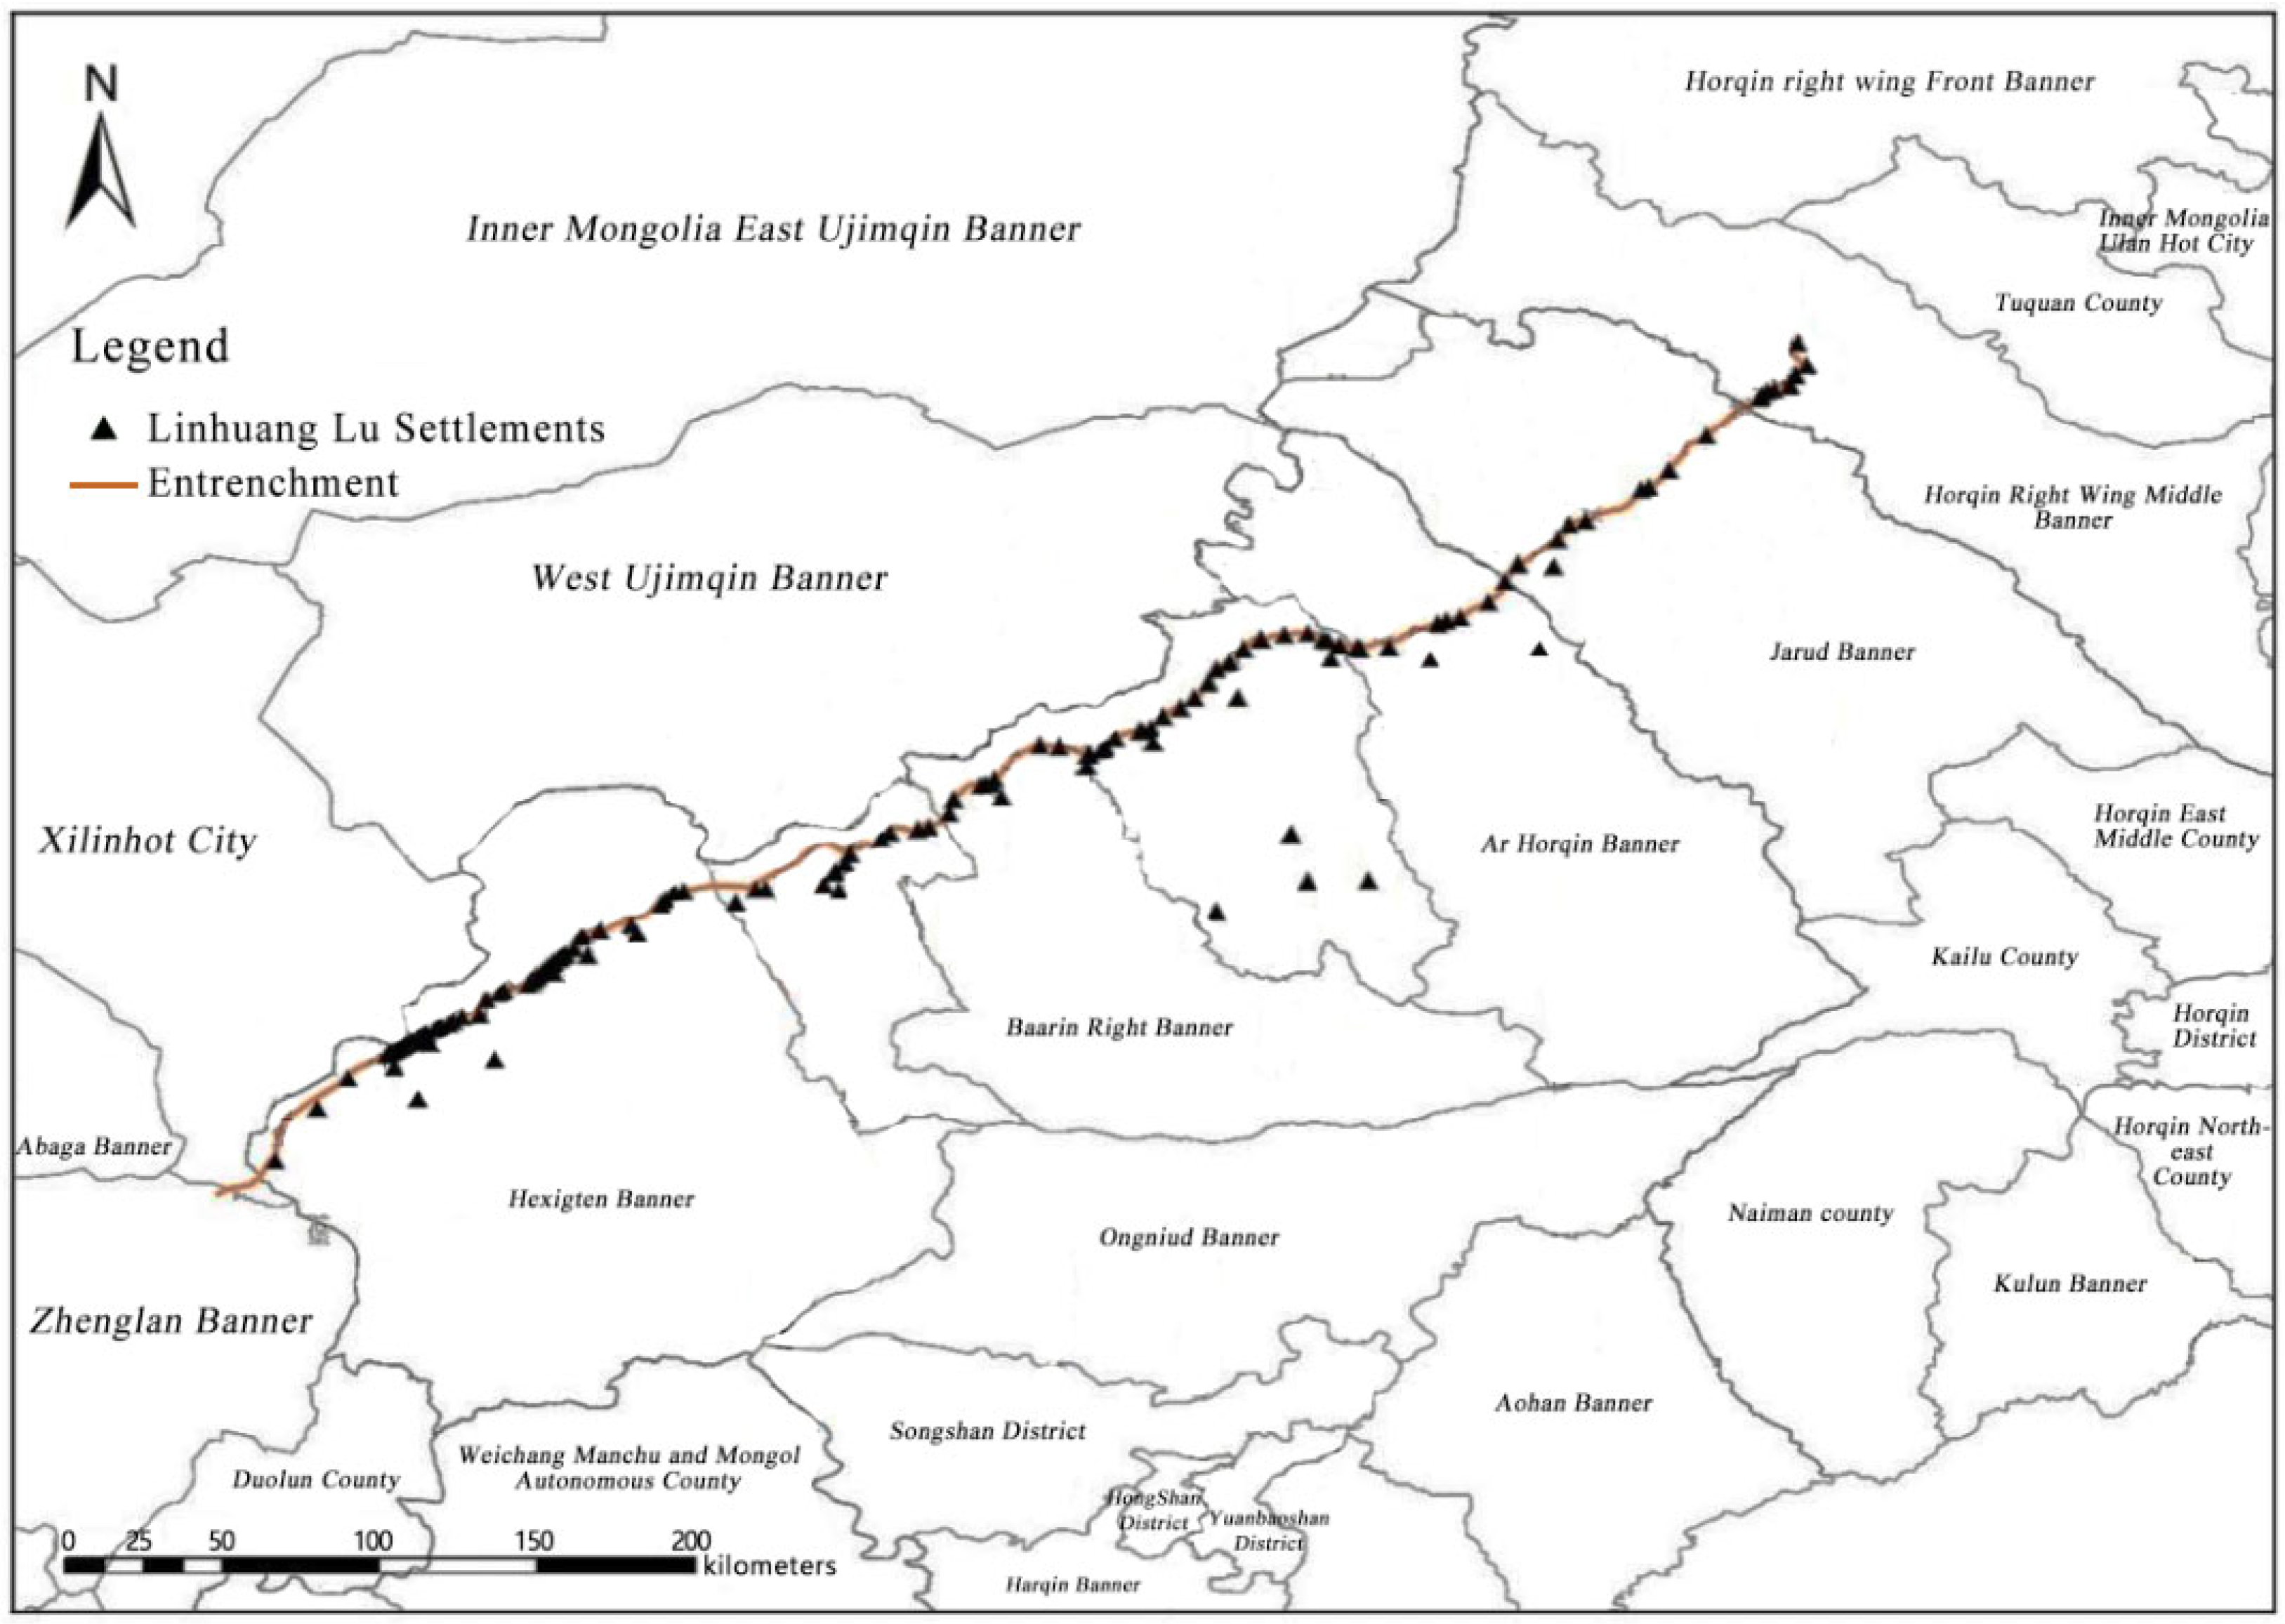
Based on the database established by the research group and through further historical research, the group checked the information of the Great Wall settlements published by the Great Wall Heritage Network. In addition, the research group collected GPS site data for spatial analysis by visiting the planning and cultural protection departments of Inner Mongolia, Heilongjiang, Hebei and other regions. Combined with Google Earth, the satellite image maps of Inner Mongolia, Heilongjiang, Hebei and other regions were searched and screened. The selection criteria were that the settlement base site is well preserved, the outline shape is relatively complete, and the defense facilities (defense towers, corners, moats) are available. Based on the previous data collection and field investigation, the data of 108 settlement sites on the Linhuang Lu of the Great Wall of the Jin Dynasty were finally determined. This paper collates and verifies 108 settlement samples of the Great Wall Linhuang Lu as the research object (Figure 4).

2.2. Data Sources

The research data include the basic historical data and geospatial data of Linhuang Lu settlements. The basic data of Linhuang Lu settlements are based on the existing data of Jin Great Wall settlements, which are provided by Inner Mongolia Institute of Cultural Relics and Archaeology and China Institute of Cultural Heritage. Based on the satellite map Google Earth, the basic information of the settlement is corrected. The basic historical data are mainly derived from historical books, archaeological materials and related research literature, mainly including Jin History published by Zhonghua Book Company in 1975, Chinese Cultural Relics Atlas (Inner Mongolia Volume) published by Cultural Relics Publishing House in 2003, Chinese Historical Atlas (Jin and Southern Song Dynasties) edited by Tan Qixiang in 1982, and Jin Great Wall Research Essays edited by Sun Wenzheng in 2008. Geospatial data contain a 30 M digital elevation model (DEM), which comes from the geospatial data cloud website. The administrative division map of the Inner Mongolia Autonomous Region, Jilin Province and Liaoning Province, and the data of China’s water system come from China National Basic Geographic Information Center.

2.3. Methods

2.3.1. Weighted Voronoi Diagram

The theoretical basis for determining the scope of urban spatial influence is the theory of spatial interaction. Based on the theory proposed by Reilly, Converse proposed the theory of breaking point in 1949 [24]. In this theory, the point where the influence of two adjacent settlements reaches equilibrium is called the breaking point. The formula is shown below:
D a = d a b 1 + P b / P a
In the formula, D a is the distance from the breaking point to the settlement a, d a b is the linear distance between the two settlements, p a and p b are the mass of the two settlements, respectively.
The contact fracture point model can only calculate one fracture point of the two settlements. It is arbitrary in determining the spatial influence range of the two settlements, which may lead to large errors. The Voronoi diagram based on spatial segmentation is more objective in theory to divide the influence range of settlements [25]. But the influence of each settlement is different. Therefore, the conventional Voronoi diagram has great limitations on the judgment of the influence of the settlement area, and it is only applicable to the analysis of the influence between regions when the influence weights of each regional point are equal. And it is not suitable to judge the situation where the influence weights of each regional point are not equal [26]. A weighted Voronoi diagram is a common extension of the Voronoi diagram, which takes into account the level of each occurrence point studied, and makes up for the shortcomings of conventional Voronoi diagrams. In the homogeneous plane range, if the weights of the two settlements are the same, the conventional Voronoi diagram is formed. If the weights are different, the boundary of the influence range is an arc, forming a weighted Voronoi diagram [27].
A Voronoi diagram has many extension forms and generation methods, and a weighted Voronoi diagram is a more commonly used diagram [24]. Let Pi (i = 1,2,…, n) be n points on two-dimensional Euclidean space, and λi (i = 1,2,…, n) be given n positive real numbers.
V n P i , λ i = j i P d p , p i λ i < d p , p j λ j , i = 1 , 2 , n
In the formula above, n means that the plane is divided into n parts; Pi is any discrete control point; n (Pi, λi) is the weighted Voronoi diagram on the point obtained by the segmentation of the plane at the point Pi, and λi is the weight of Pi. Therefore, this study selects the method of combining urban breaking point theory and weighted Voronoi diagram. The square root of the comprehensive military strength of each settlement is used as the weight of the settlement point. Based on this, a weighted Voronoi diagram based on settlement point set is constructed [28].
The following section will select four factors that influence the classification of settlements as evaluation factors: the scale of settlement sites, important defensive facilities, production and living facilities, and distinctive cultural relics. The data will then be standardized and transformed into a dimensionless pure value, removing the limitation of the measurement unit and the order of magnitude, so that the data values are in the range of (0–1). The weighted Voronoi input weight in ArcGIS is used to analyze the spatial influence range of settlements at all levels. The occurrence point is the settlement to be studied, and the convex polygon or irregular arc polygon can be seen as the control range of the settlement.

2.3.2. Social Network Analysis

Social network theory and its corresponding social network analysis method together constitute a complete research system that combines theory and methodology [29]. Social networks first emerged as a sociological concept in the 1930s. Since then, numerous scholars have deepened their research on social networks. In the 1940s, scholars proposed using “points” and “lines” to represent individuals and social relations, which thereby gave rise to the concept of “community maps”. In the 1950s, scholars continued to conduct in-depth research on the “network” of social relationships. It was not until the 1960s and 1970s that a research team from Harvard University analyzed algebraic models of social networkstructures, leading to the gradual maturation of social network analysis research [30]. As an important research method in the field of humanities and social sciences [31], social network analysis emphasizes the study of relationships and structures, focusing on the relationships between nodes. By constructing relationship models, it analyzed the overall and local structural characteristics of networks as well as the attribute characteristics of network nodes [32]. In this context, the network perspective provided by social network analysis methods offers a scientific quantitative approach for analyzing the internal structure of system and the mechanisms among settlements. It can more accurately reveal the complex and diverse relationship network patterns and operational logics in settlement spaces.
In this paper, the social network analysis method is used to construct the “point” and “line” semantic model of the Jin Great Wall settlement network of Linhuang Lu. The model takes the settlement site as the “point” and the military and geographical connection between the settlements as the “line”. The quantitative data converted according to “point” and “line” are transformed into matrix relational data, and input into UCINET6.0 software to measure and analyze its correlation. Using graphics processing, NET DRAW6.0 software was used to generate network graphics.

3. Results

3.1. Settlement Classification

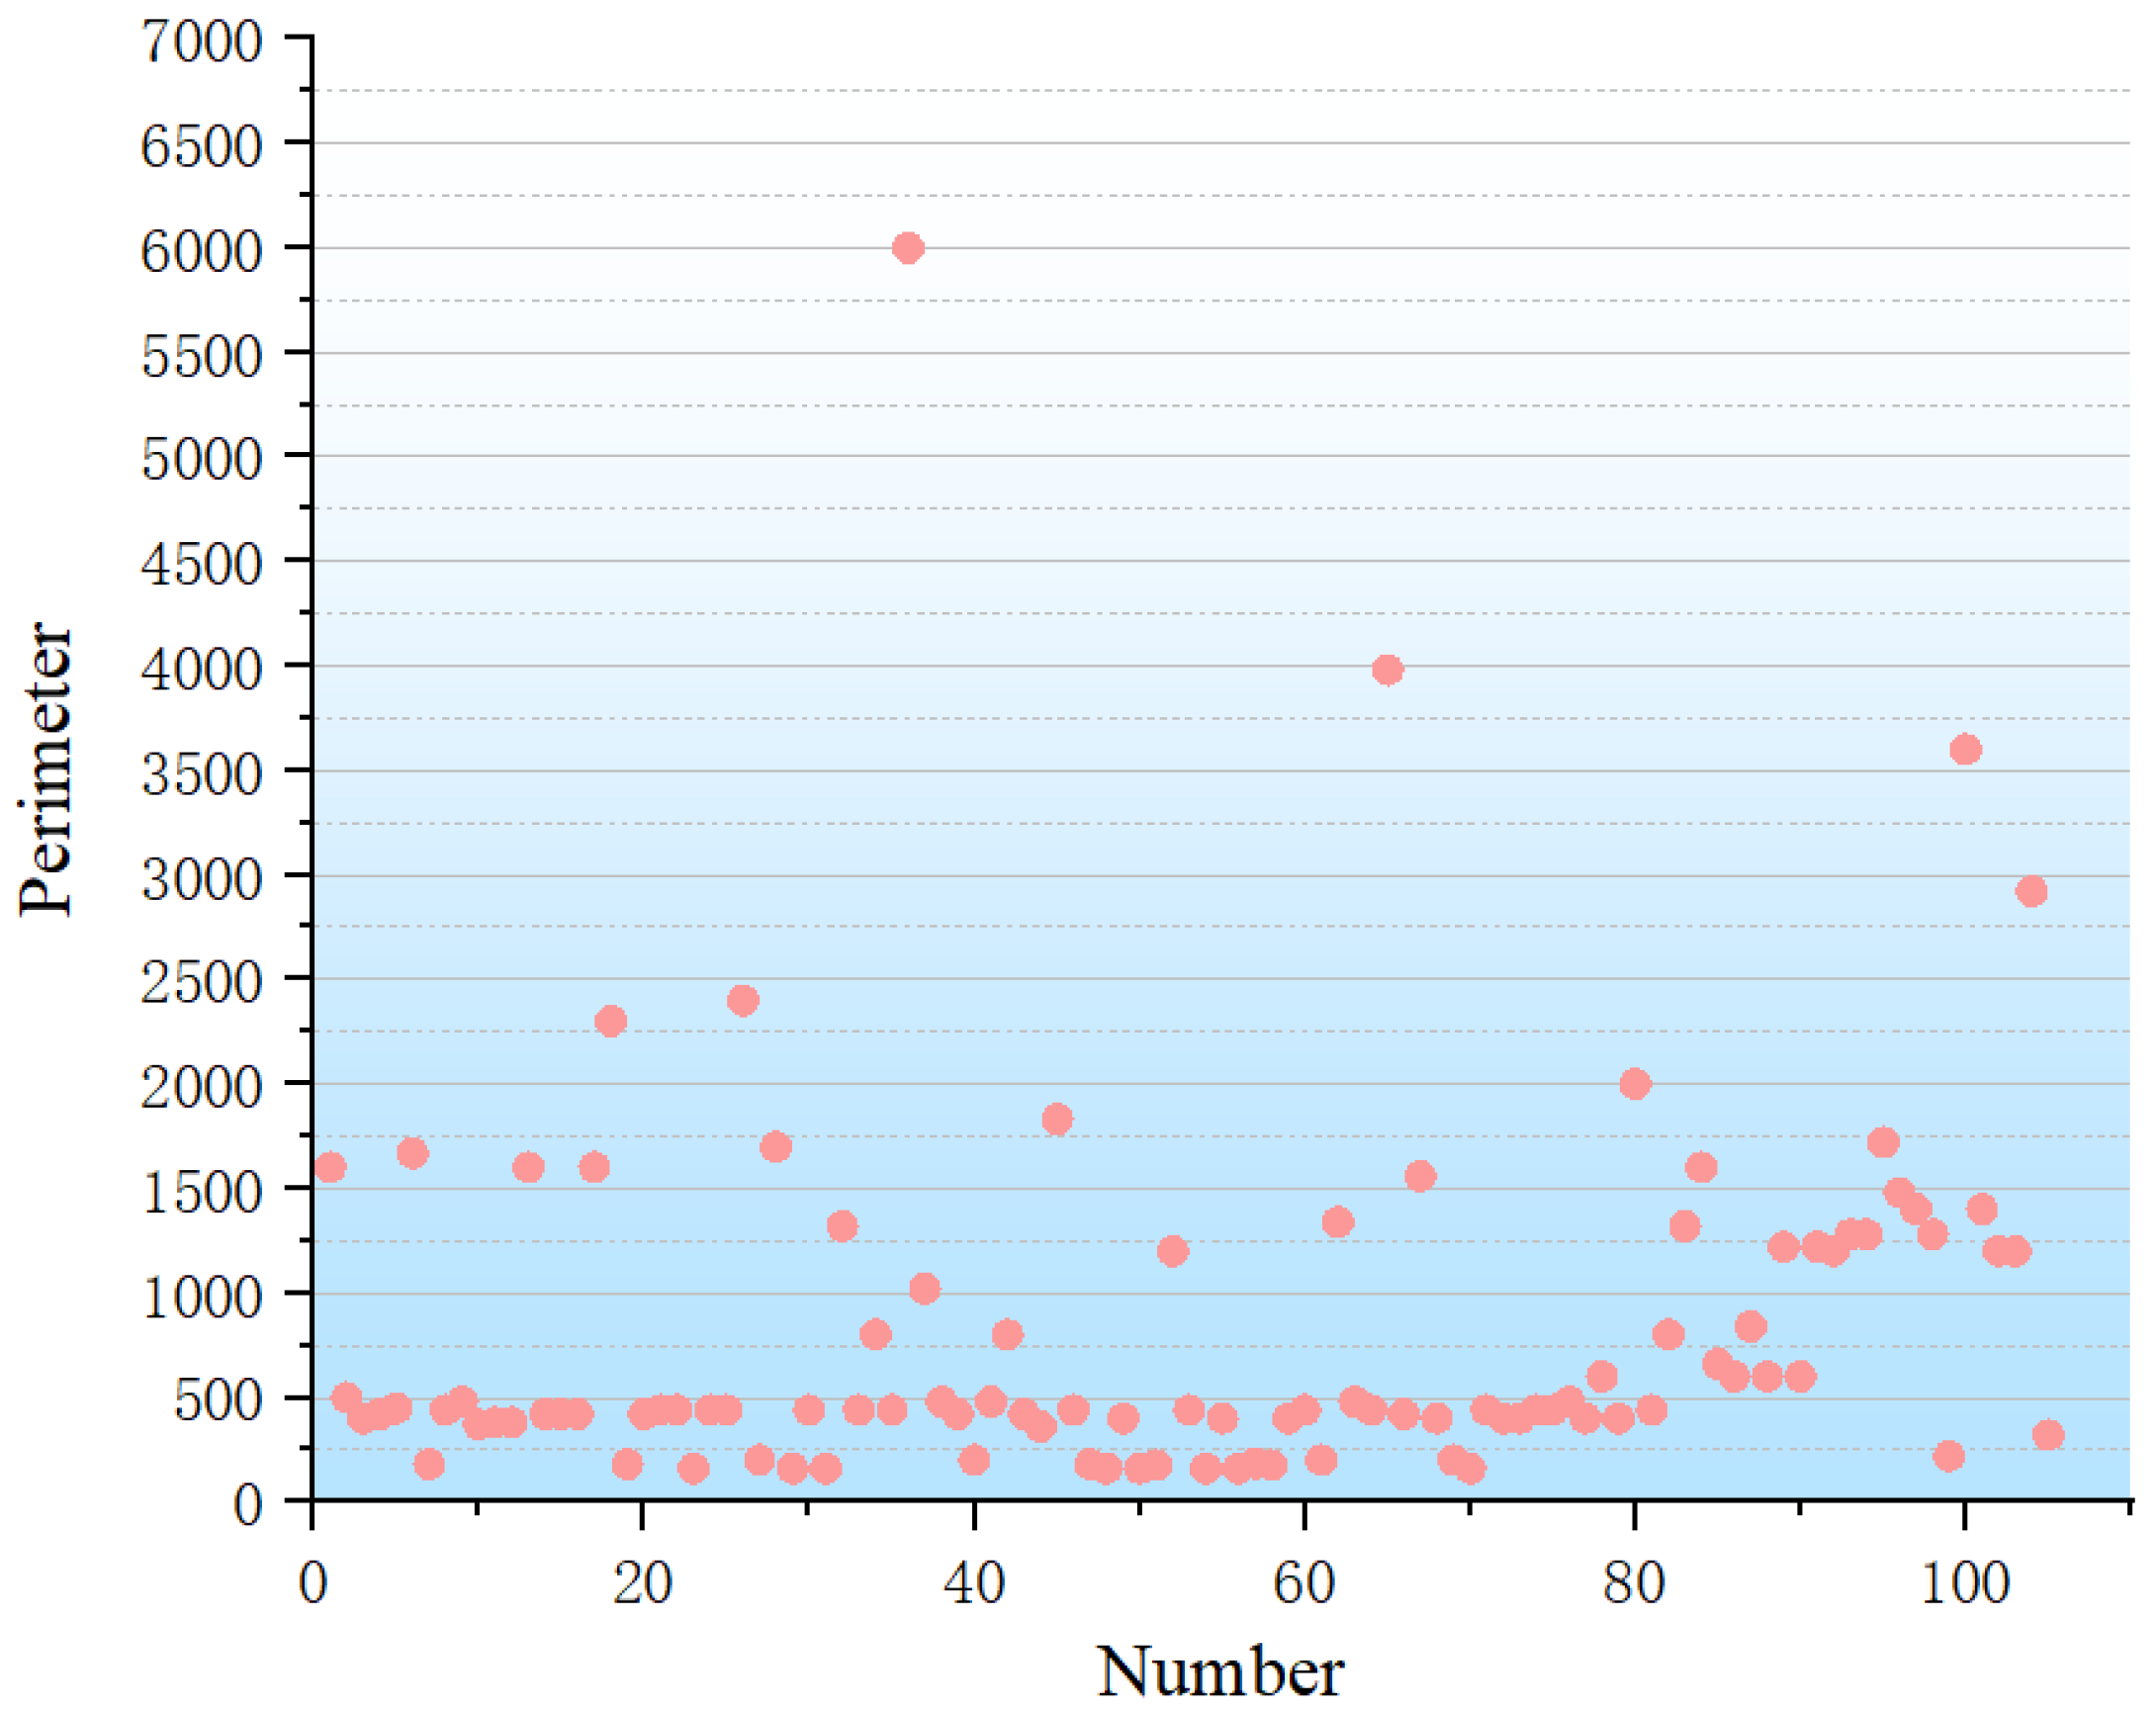
In general, the classification of settlement grades is mostly based on the size of settlement [27]. The level of the Great Wall settlement is proportional to the size of the settlement. In other words, the higher the position of the settlement, the higher the level of the settlement, the larger the scale of the settlement, and vice versa. Therefore, this section selects the scale of settlement space as an evaluation factor for hierarchical division.
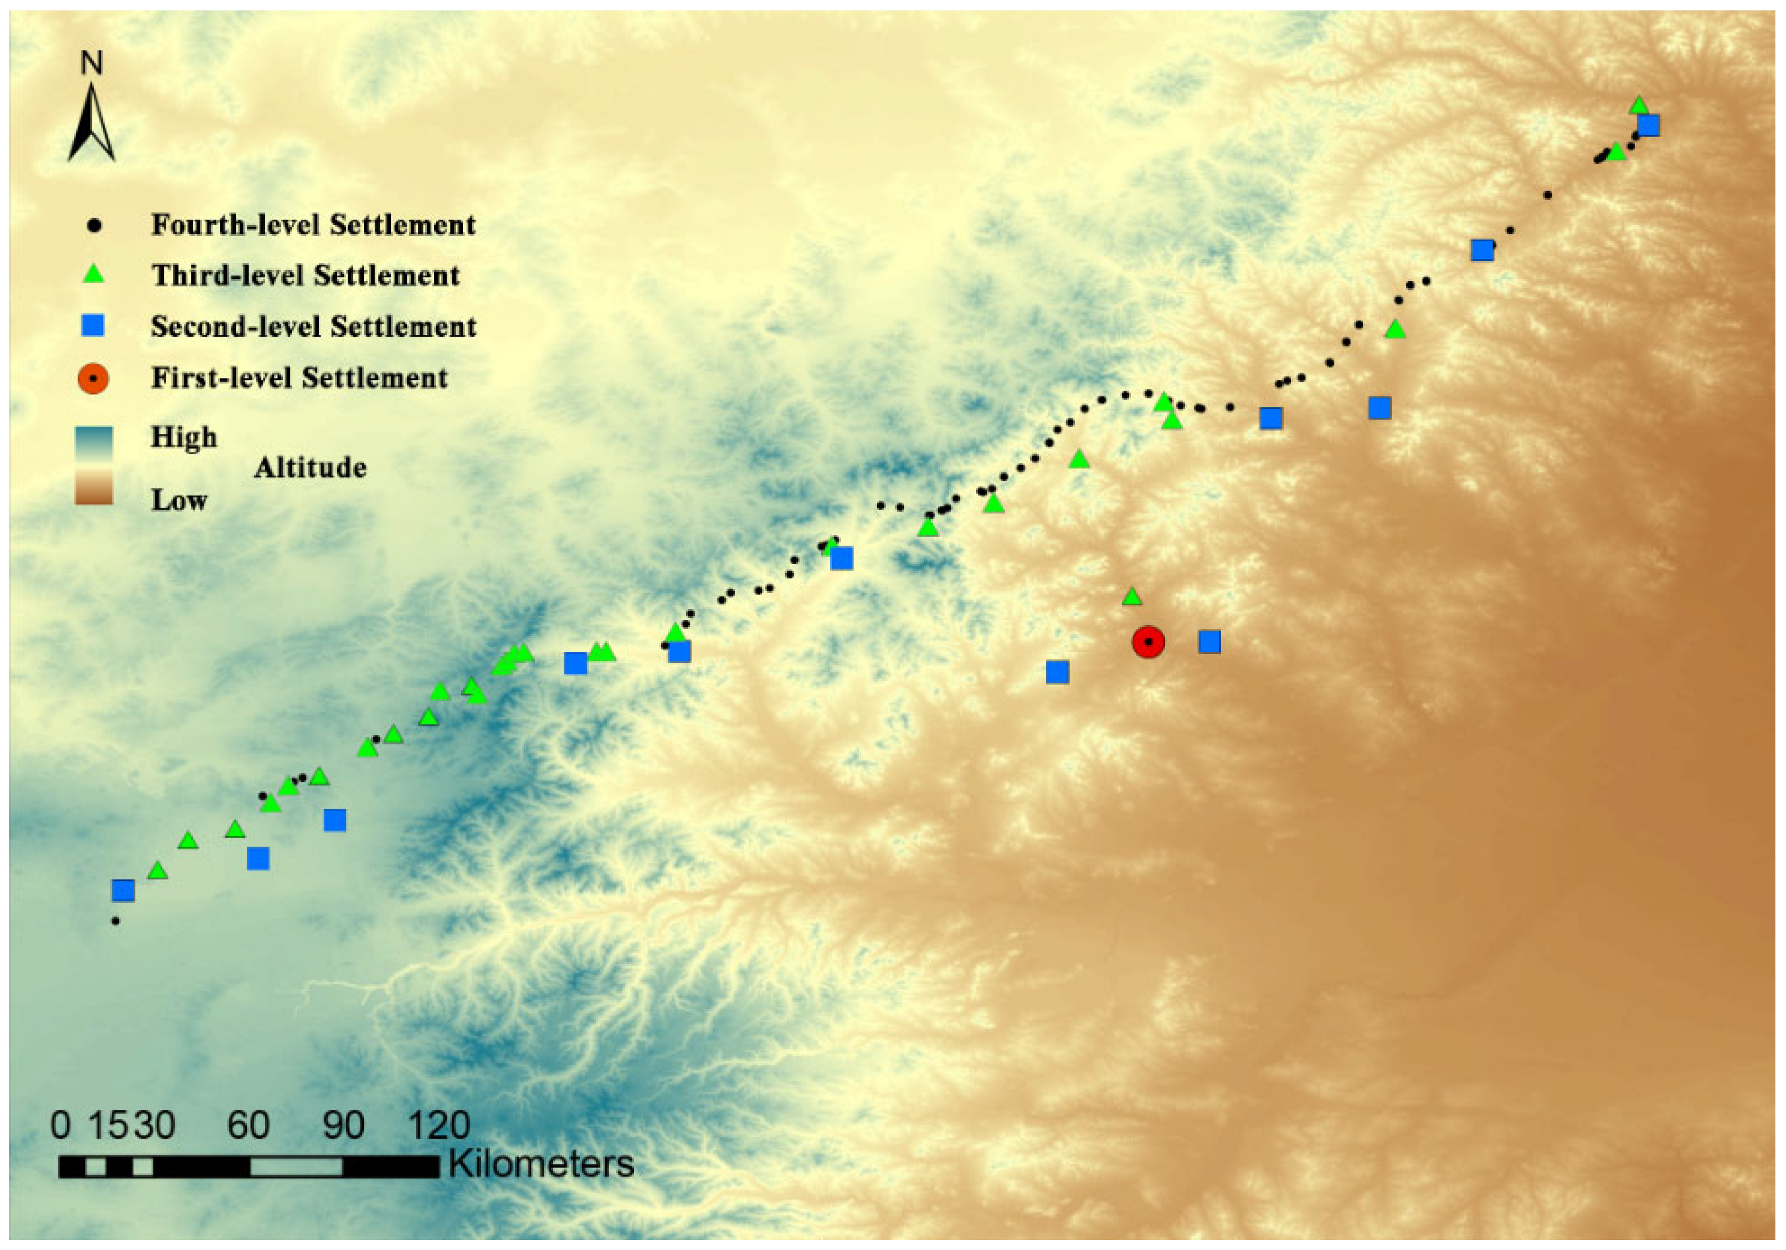
It will be organized and visualized according to the evaluation factors (Figure 5). The results show that the Great Wall settlements of Linhuang Lu were divided into four grades: 1 settlement in Zongguanfu, accounting for 1% of the total number of settlements; 12 settlements in Meng’an, accounting for 11% of the total number of settlements; 29 settlements in Mouke, accounting for 27% of the total number of settlements; 66 settlements in Punian, accounting for 61% of the total number of settlements (Table 1).
On the whole, the grade and quantity of the Great Wall settlements on Linhuang Lu are inversely proportional. In the ArcGIS10.8 platform, the spatial visualization of the classified settlements can clearly show their distribution characteristics and spatial relationships, as shown in Figure 6. Furthermore, it can be further found the number of low-grade Punian settlements is the largest, and the adjacent entrenchments are linearly distributed. The lower the settlement level, the closer it is to the entrenchment. The number of high-level Zongguanfu settlements and Meng’an settlements are relatively small, mostly located in the open land with flat terrain in the hinterland of the entrenchment, far from each other, and the distribution density is lower than that of low-level settlements.

3.2. Structure Recognition Based on Spatial Correlation

The spatial correlation structure of settlements is the material embodiment of the social organization relationship and spatial function. The division of the spatial influence scope of different levels of military settlements can analyze the subordinate relationship among settlements at all levels, so as to explore their spatial structure.
This section uses weighted Voronoi to divide the settlement defense units. Firstly, the clustering method is used to determine the weight of each settlement. Four factors that influence the grade of the settlements, including settlement scale, important defense facilities, production and living facilities, and characteristic cultural relics, were selected as the evaluation factors. Settlement scale is one of the most intuitive and basic indicators to measure the importance and grade of settlements. The strength, complexity and perfection of the important defense facilities reflected the strategic position and threat level of the settlement in the defense system. The production and living facilities reflected the composition of personnel, social hierarchy and the nature of the settlement. The overall complexity of the residential area can effectively judge the nature and function of the settlement. The total area of the residential area, the number and density of defense towers also indirectly reflected the scale of the garrison and the strategic position of the settlement. The characteristic cultural relics are the most direct evidence of the specific functions, garrison rank and identity of the settlement. An official seal or a high-level weapon can more accurately locate the status of a settlement.
Important defense facilities, production and living facilities, and characteristic cultural relics are text-based. When they are converted into numerical types, those with defense facilities are “1”, and none are “0”. There are production and living facilities for “1”, not for “0”. The remains of characteristic cultural relics are recorded as “1”, not “0”. The detailed division of evaluation indicators is shown in Table 2. Each score is added together to obtain the total score of important defense facilities, production and living facilities, and characteristic cultural relics. Then, the data of each index are standardized and transformed into dimensionless pure values, removing the limitation of measurement units and orders of magnitude, so that the data values are in the range of (0–1). This provides the comprehensive military defense force of each settlement.
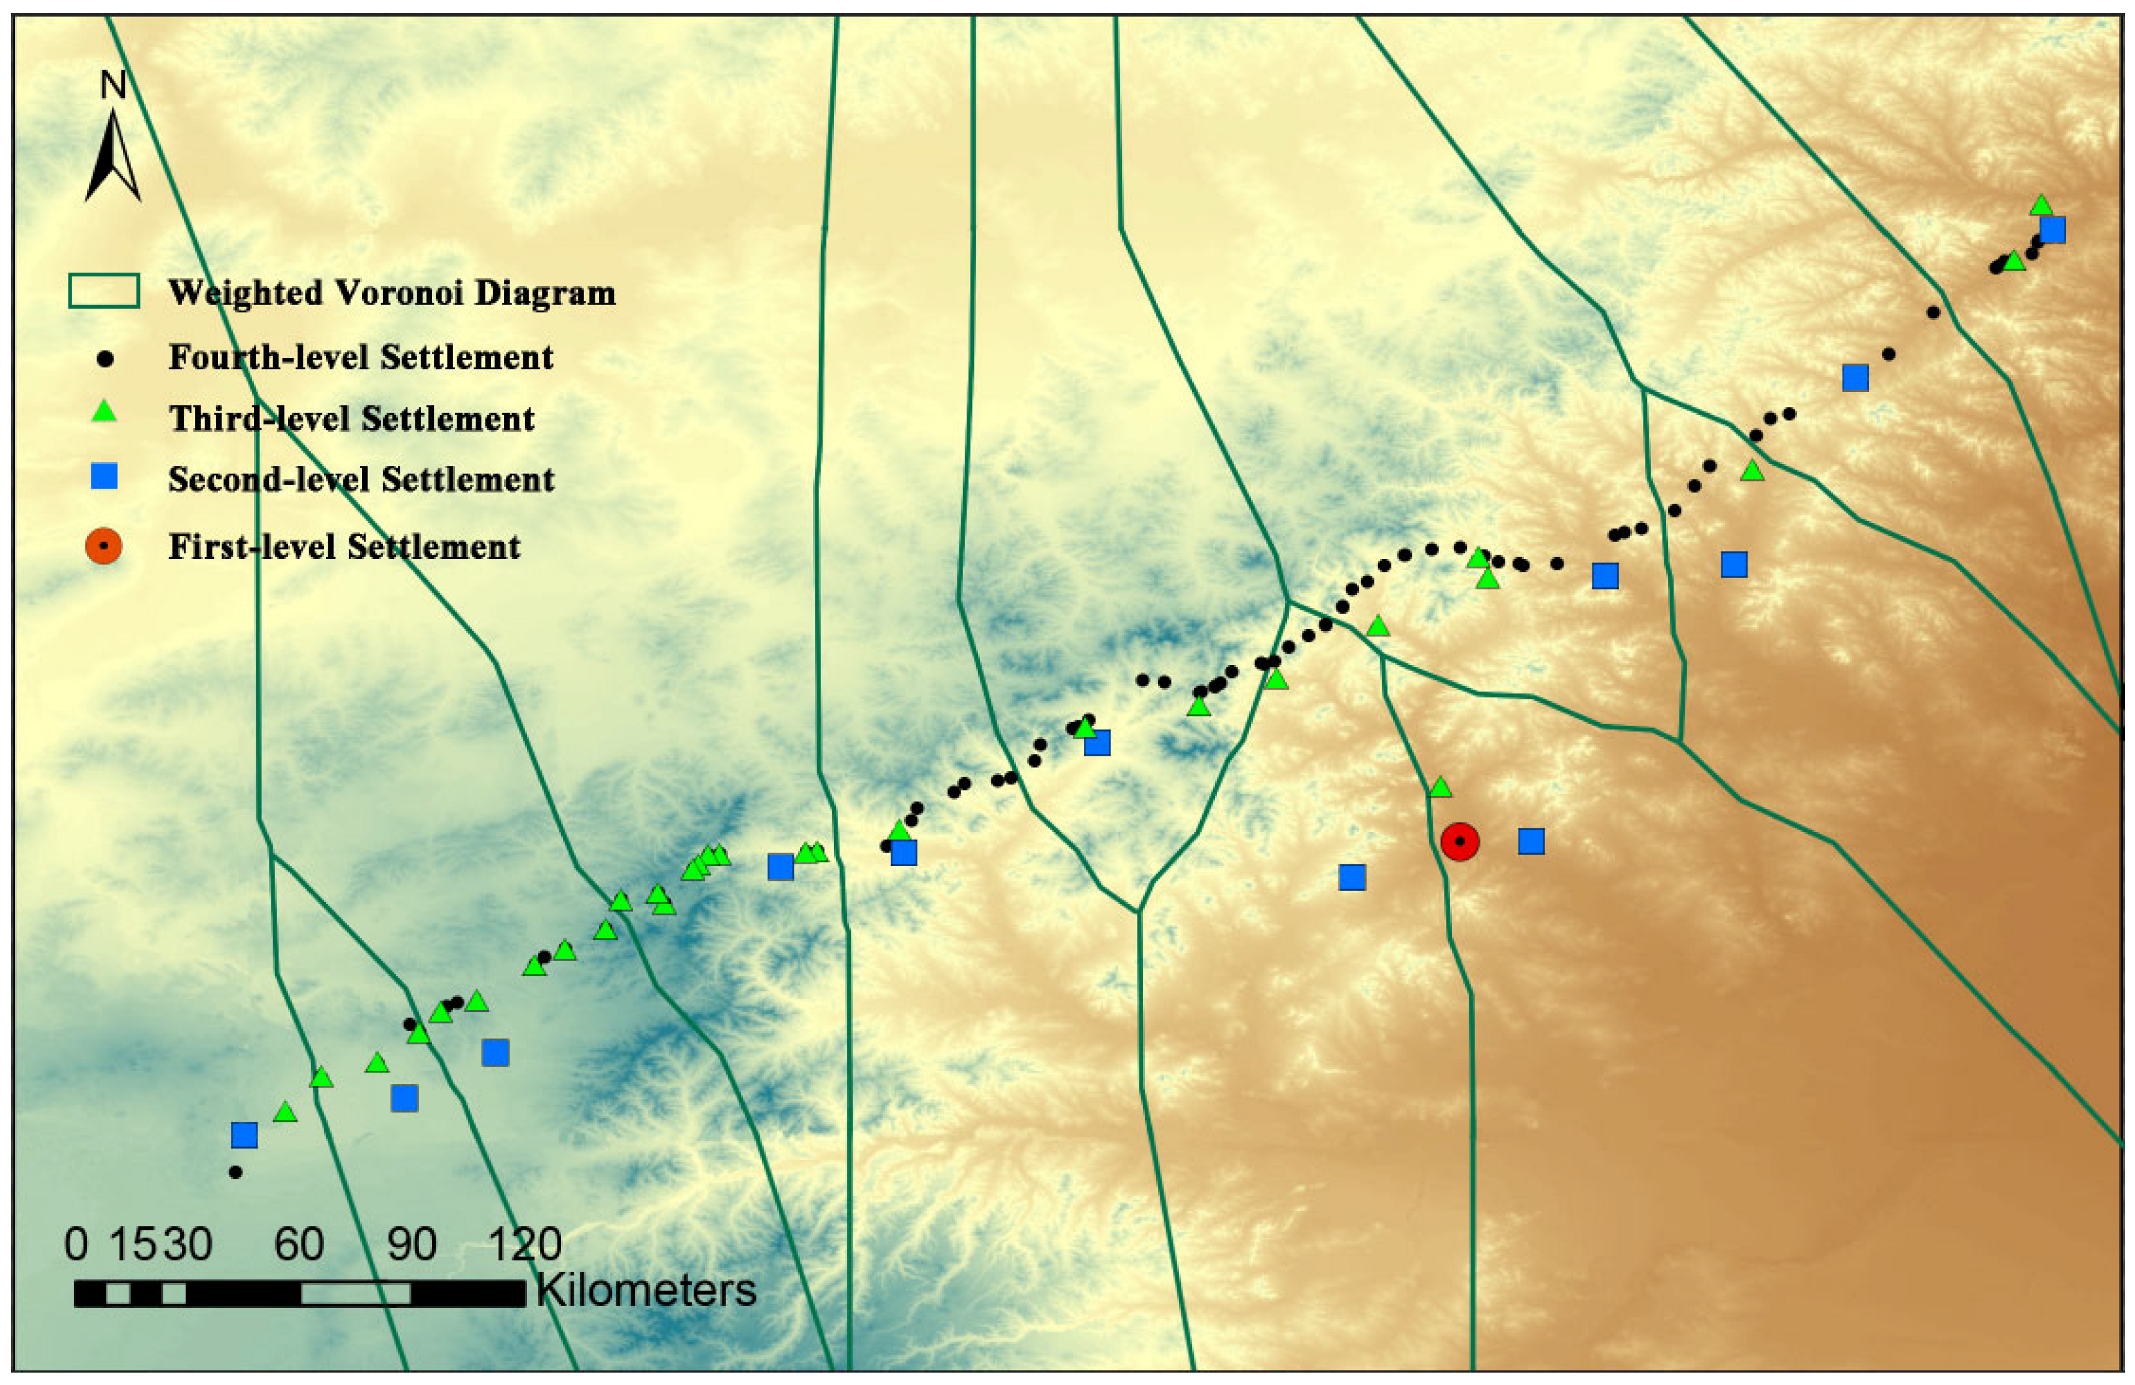
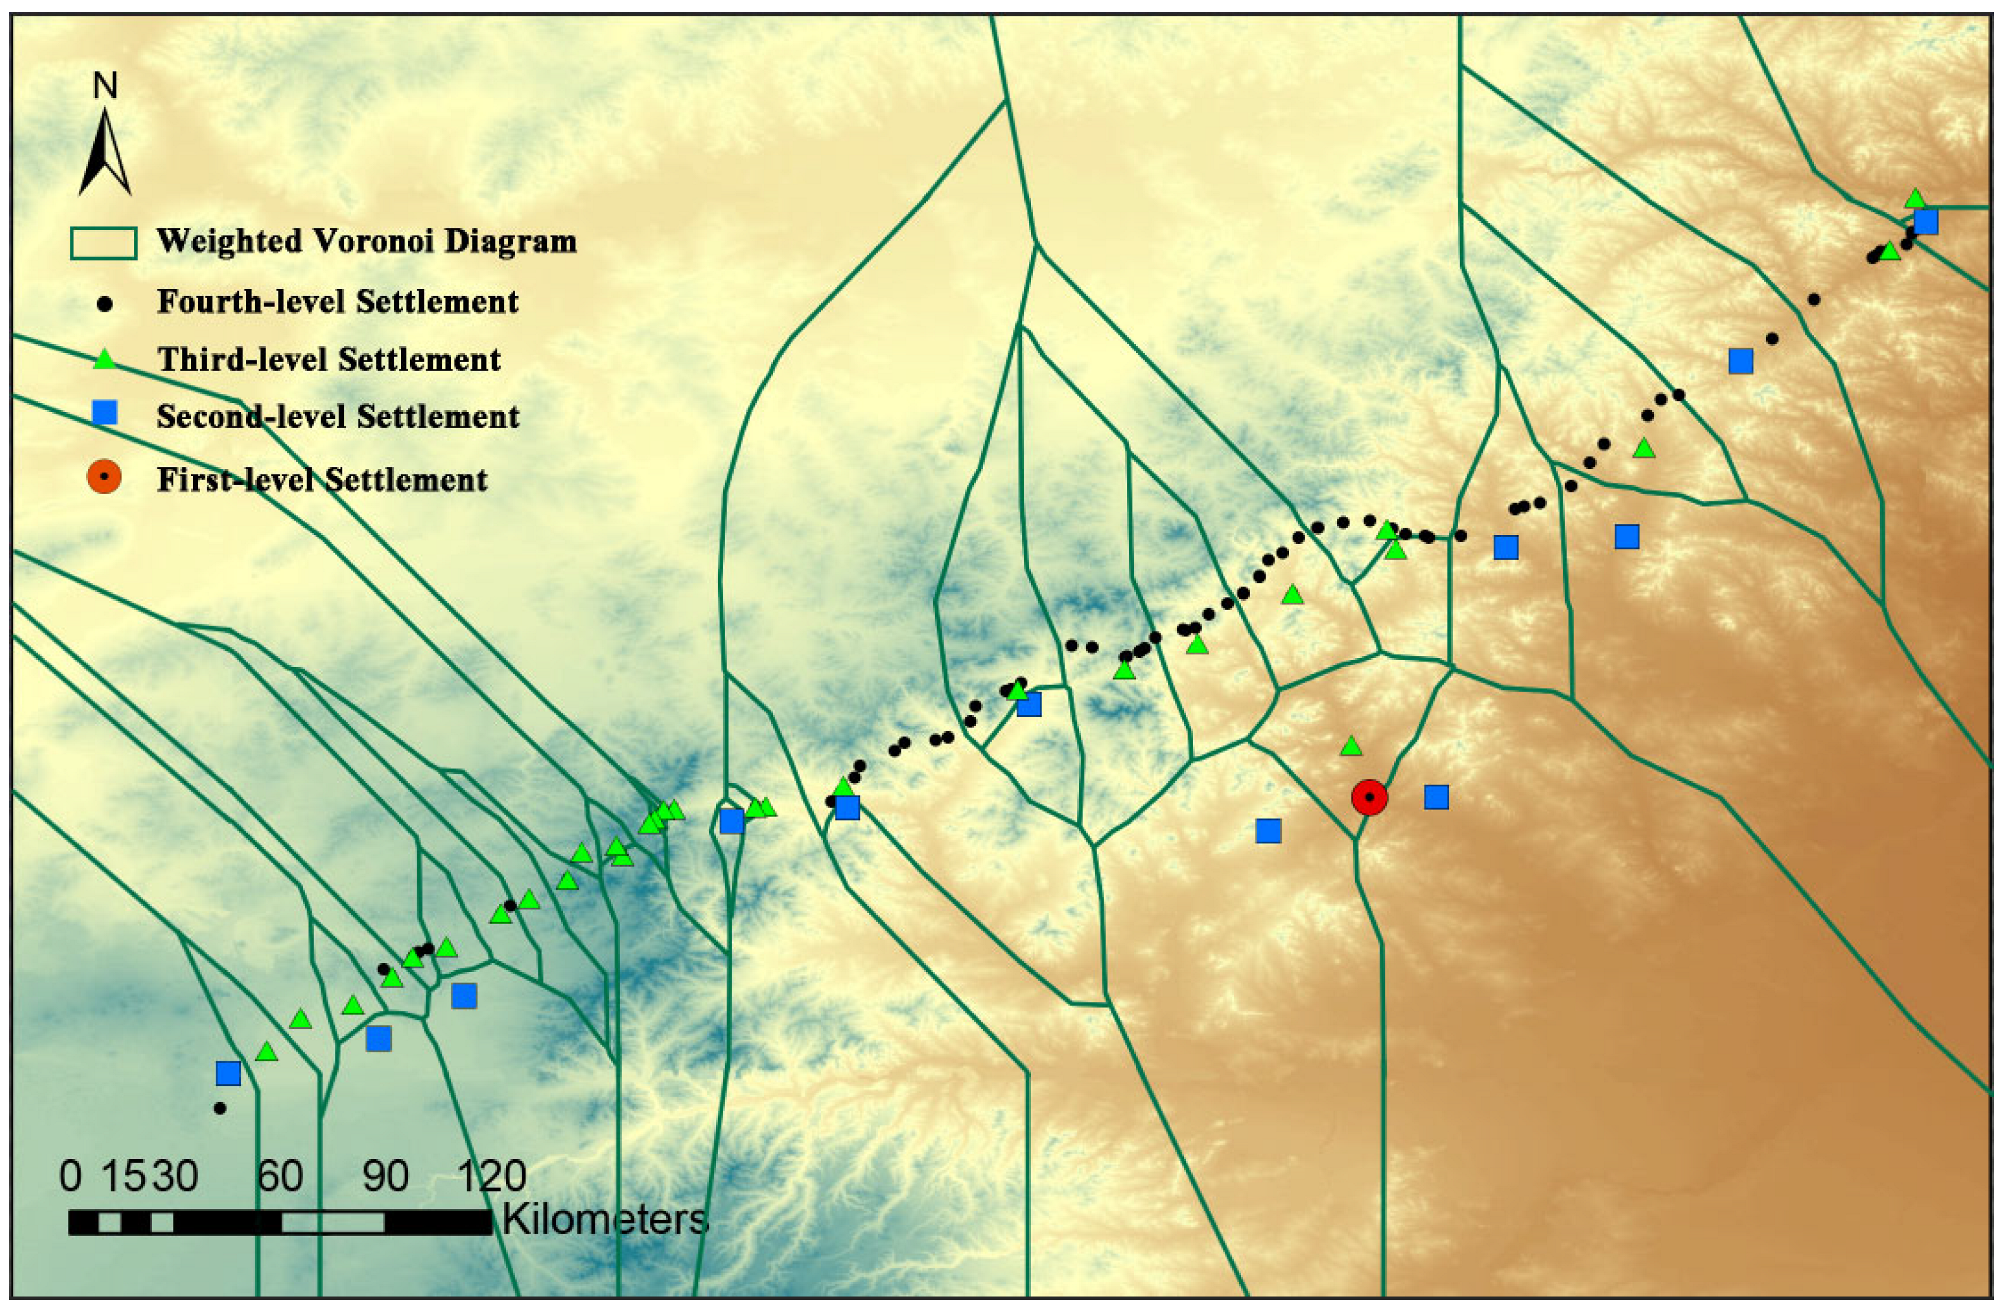
Taking 12 secondary settlements of Linhuang Lu as the occurrence element, the settlement site remains of each settlement as the center points, and the settlement comprehensive index as the weight of the settlement points. The weighted Voronoi of the 12 settlement point sets was generated by the weighted Voronoi extension plugin of ArcGIS10.8 software. Each grid area in the figure represents the spatial influence range of the corresponding secondary settlement points (Figure 7). It is found that all the third and fourth level settlements are located in the grid area. Because Liaozuzhou City, Jinchangtai City and Xinluozhai City surround Linhuang City, and the cost distance ratio of these three settlements to Linhuang City is less than the distance between themselves. Therefore, these three settlements are directly under the jurisdiction of Linhuang City. Preliminary analysis of the spatial distribution of Linhuang Lu settlements divided the settlements into 11 defense units with Meng’an settlements as the core.
Taking 12 second-level settlements and 29 third-level settlements as the occurrence elements, the influence range of second-level and third-level settlements under different weights is calculated. Each grid area in the figure is the spatial influence range of the corresponding second-level and third-level settlements (Figure 8), and each influence range contains four levels of settlements. For the four-level settlement, if it is located in the spatial influence range of the three-level settlement, it indicates that it is directly under the jurisdiction of the three-level settlement; if it is located within the spatial influence range of the second-level settlement, it indicates that the fourth-level settlement is directly governed by the second-level settlement. It is found that there are three-level settlement groups in the eastern, central and western parts of Linhuang Lu under the two-level settlement group, with 12 three-level Mouke settlements as the core defense units, including Kunduleng No. 1 Fort, Gerichaolu City, Haoertu City, Xinhaote No. 3 Fort, Xiaochengzidi City, Wulanbaiqi City, Nuhetubaiqi City, Bitu City, Zhongwulan No. 1 Fort, Aolunuoer Fort, Baomutaibian Fort and Wulasutai Fort.
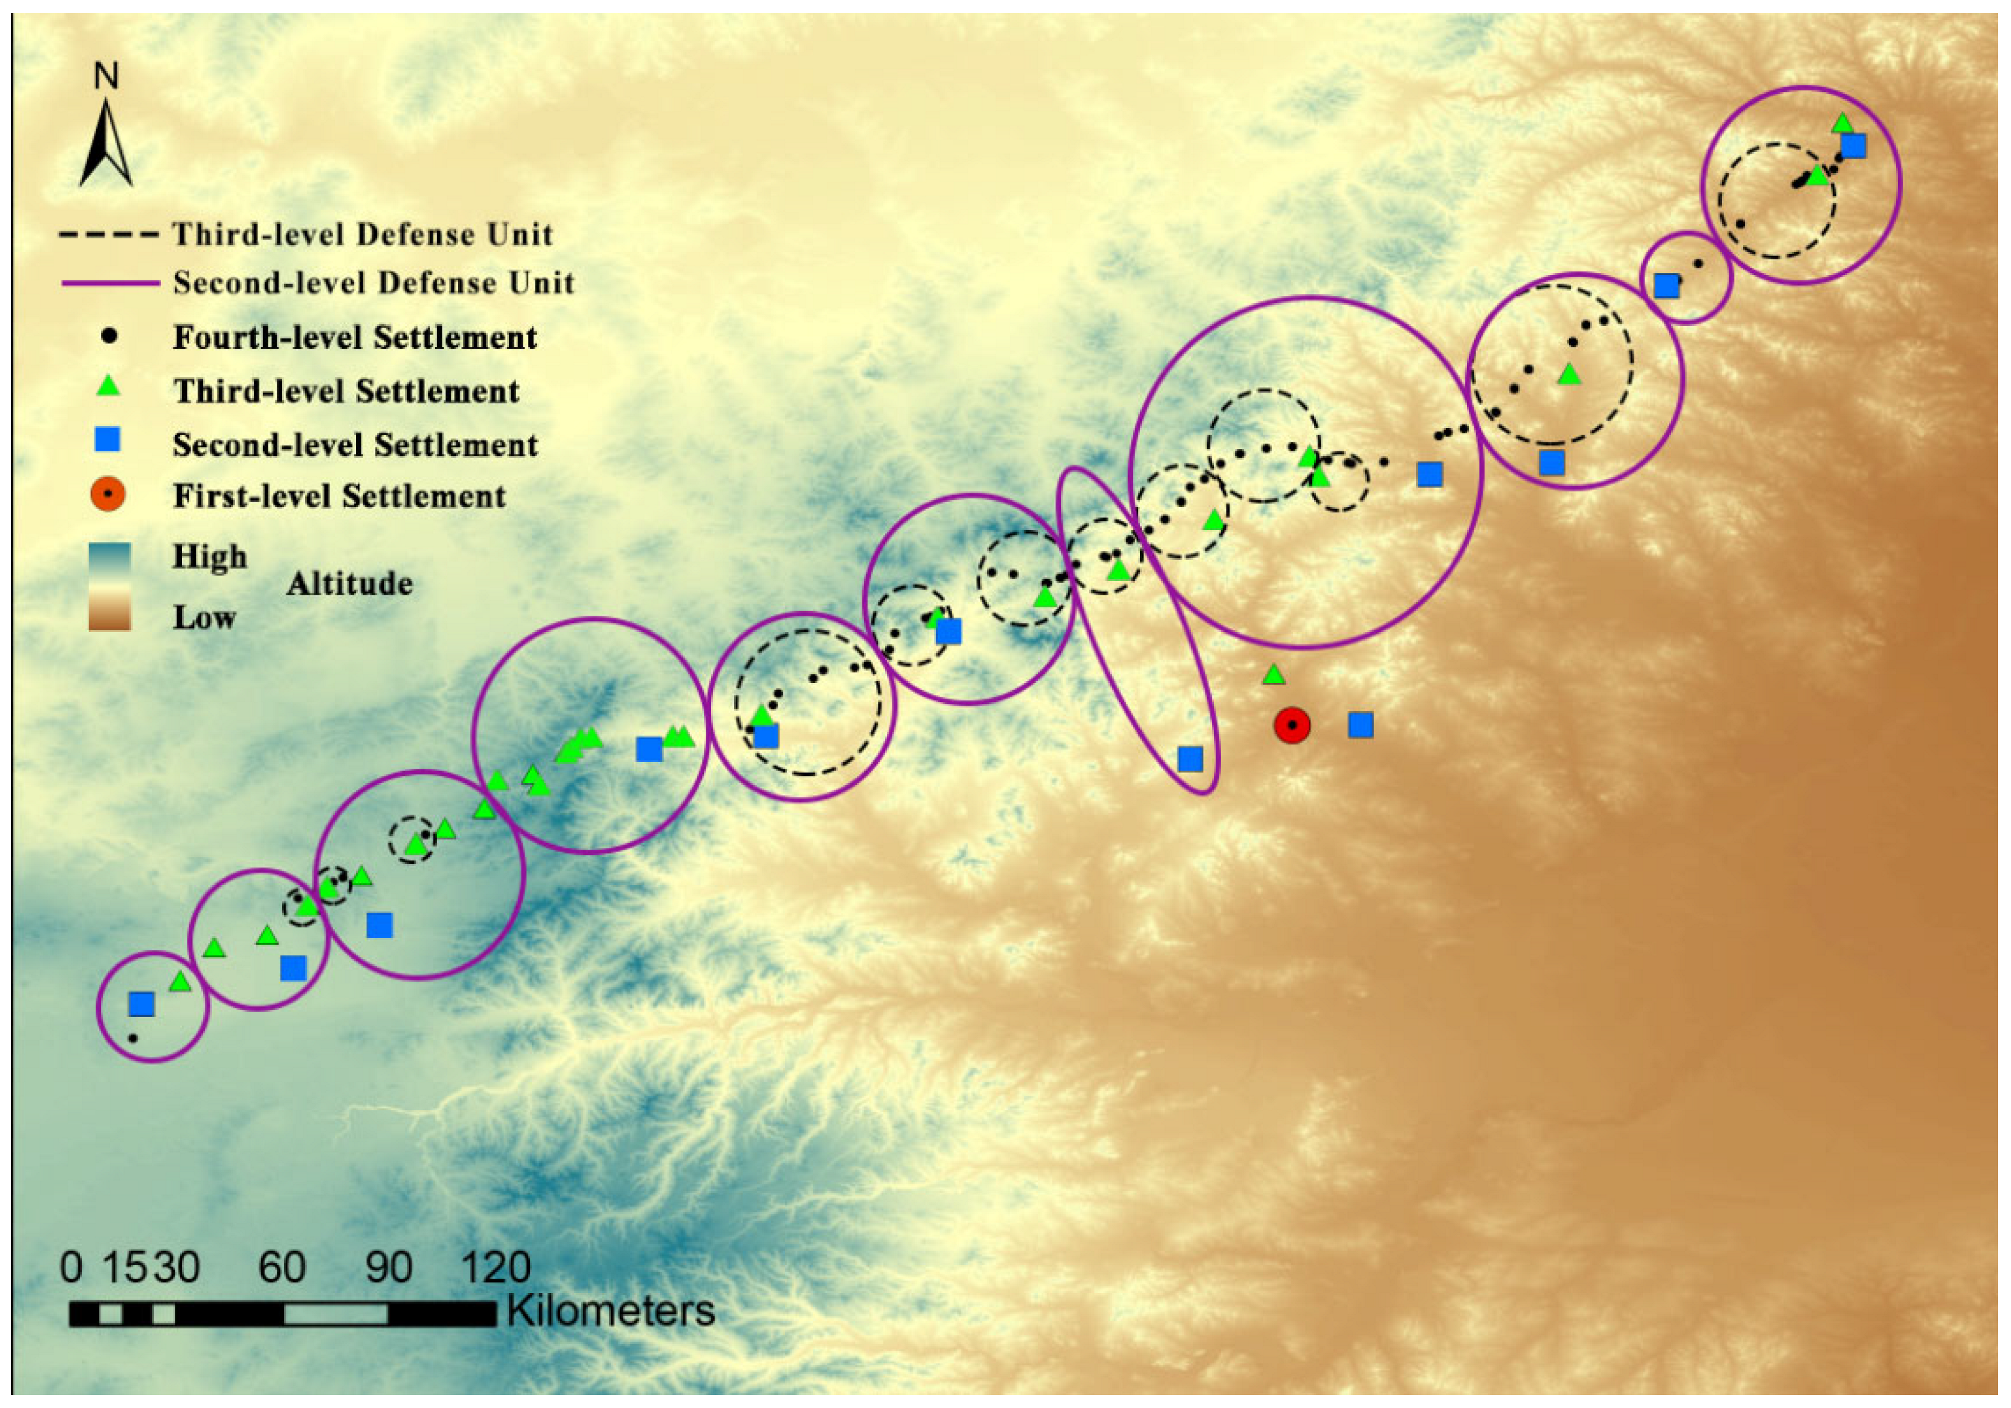
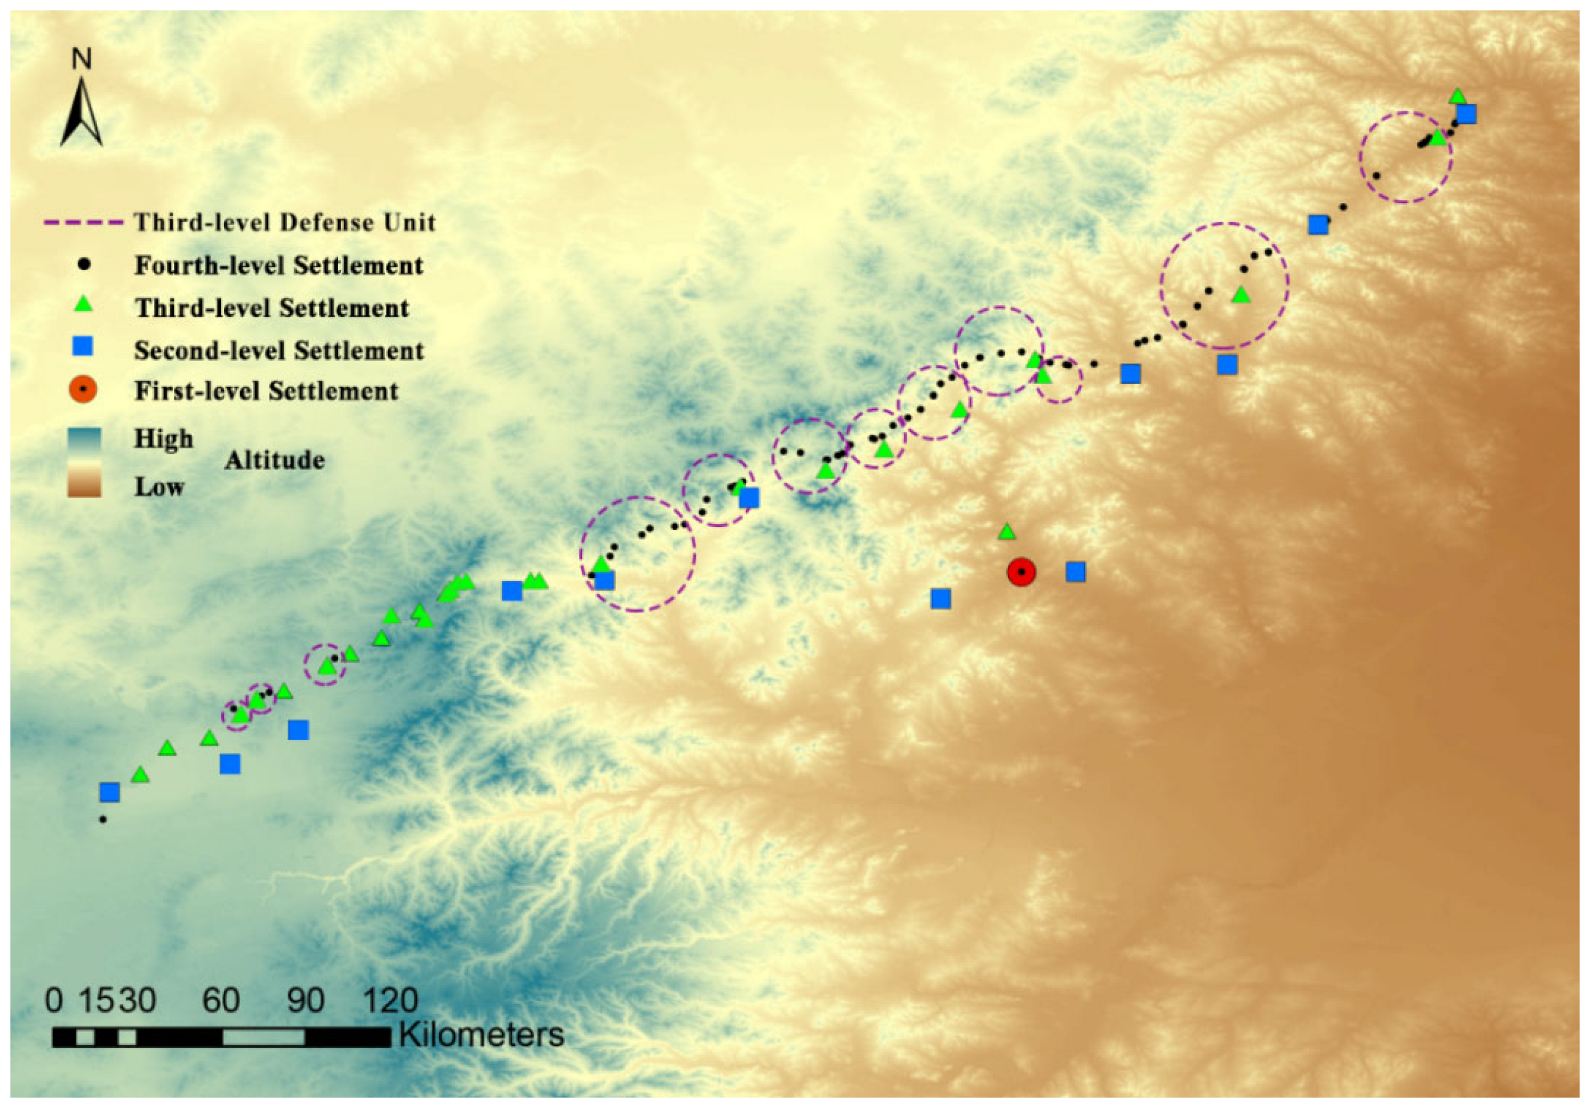
The spatial influence range of the above-mentioned defense units at all levels is superimposed. In the ArcGIS10.8 platform, the data are spatially visualized (Figure 9). From the diagram, it can be observed that the Jin Great Wall Linhuang Lu settlements form two levels of defense units, including 11 second-level defense units and 12 third-level defense units. The purple range is the second-level defense units, and the black range is the third-level defense units.

3.3. Structural Identification Based on Social Association

3.3.1. Selection of Influencing Factors of Social Correlation

The settlements of the Great Wall of the Jin Dynasty is a complex settlement system, which is related to each other through military defense, trade exchanges, material transportation and other forms to form a unified whole. Therefore, this paper draws on the relevant research on the regional relevance of rural settlements [18,31], combined with the specific characteristics of the Great Wall settlements, and comprehensively proposes a research framework for the relevance of the two dimensions of human connection and geographical connection to explore the social relations between settlements. Among them, the correlation degree of human relations reflects the cooperative defense ability among settlements. This paper intends to determine the military joint defense status of military settlements in regional space based on the military level of settlements. The geographical connection reflects the response of military settlements to the external natural environment, which is measured by surface cost as an impact factor. In this paper, after the preliminary determination of the index layer, the factor layer is further improved. Finally, four influencing factors were selected to analyze the social correlation degree of the Great Wall settlement on Linhuang Lu. The detailed impact factors are shown in Table 3.

3.3.2. Construction of Social Association Network

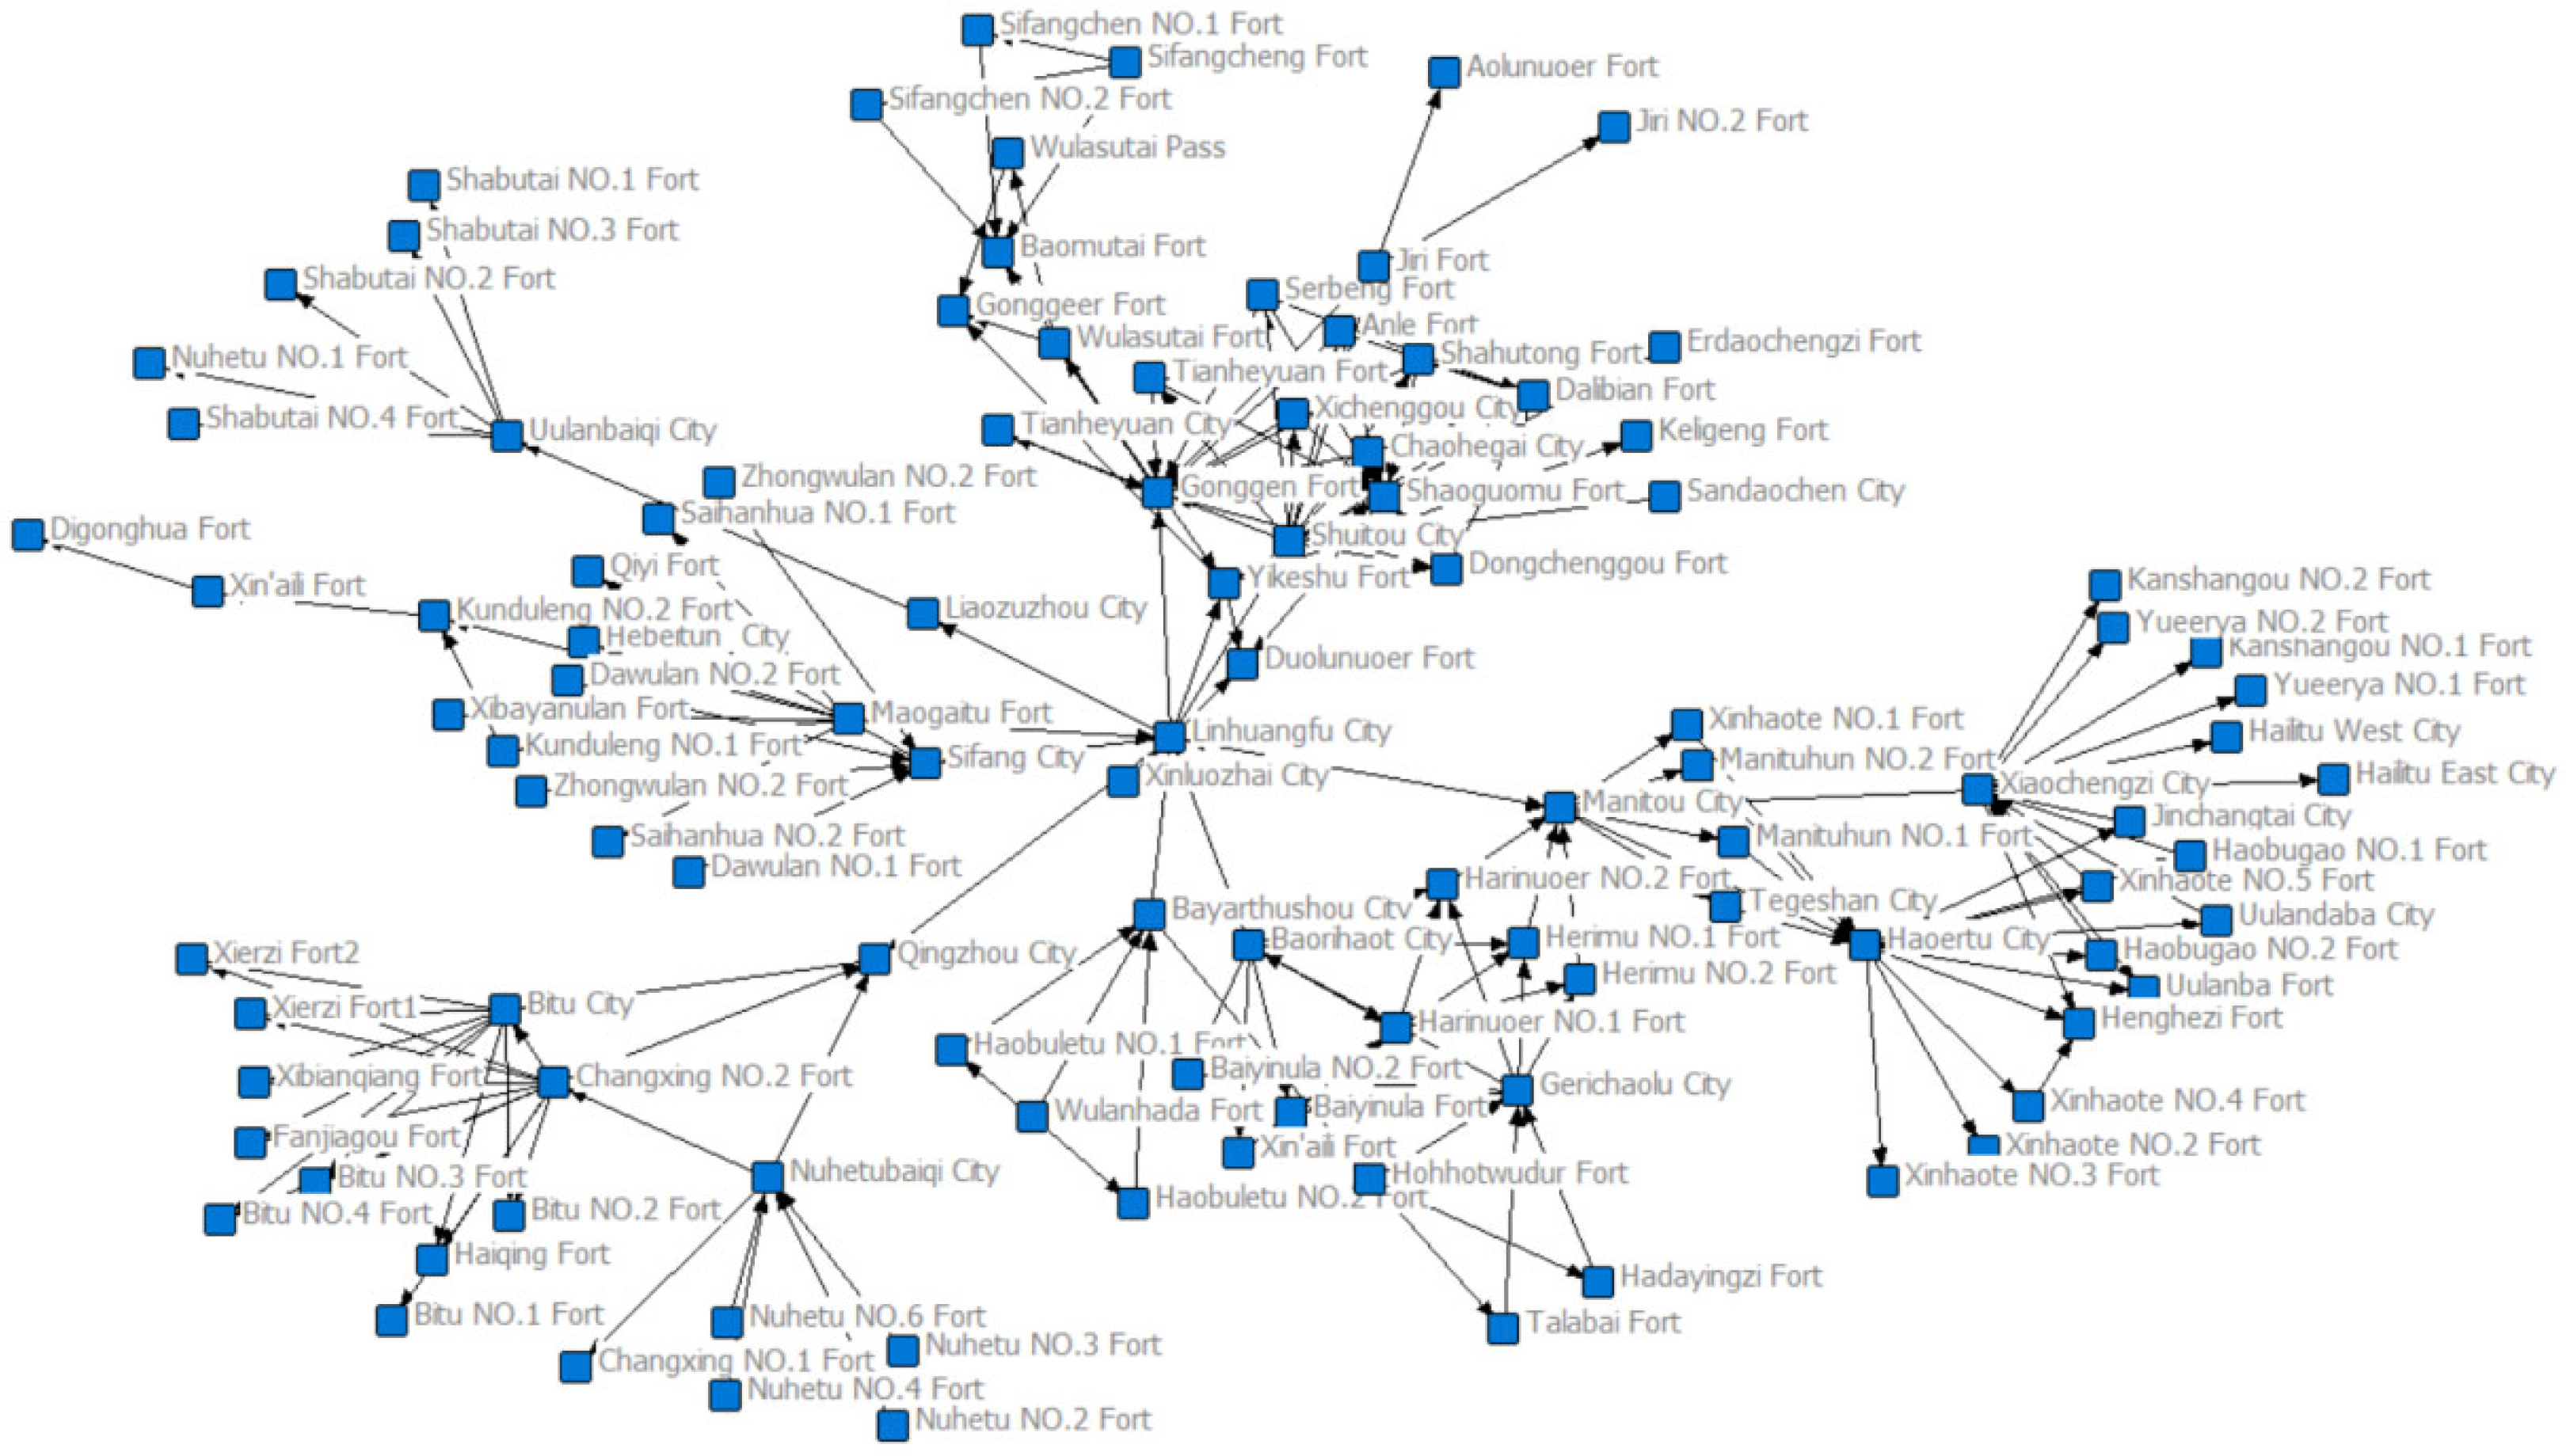
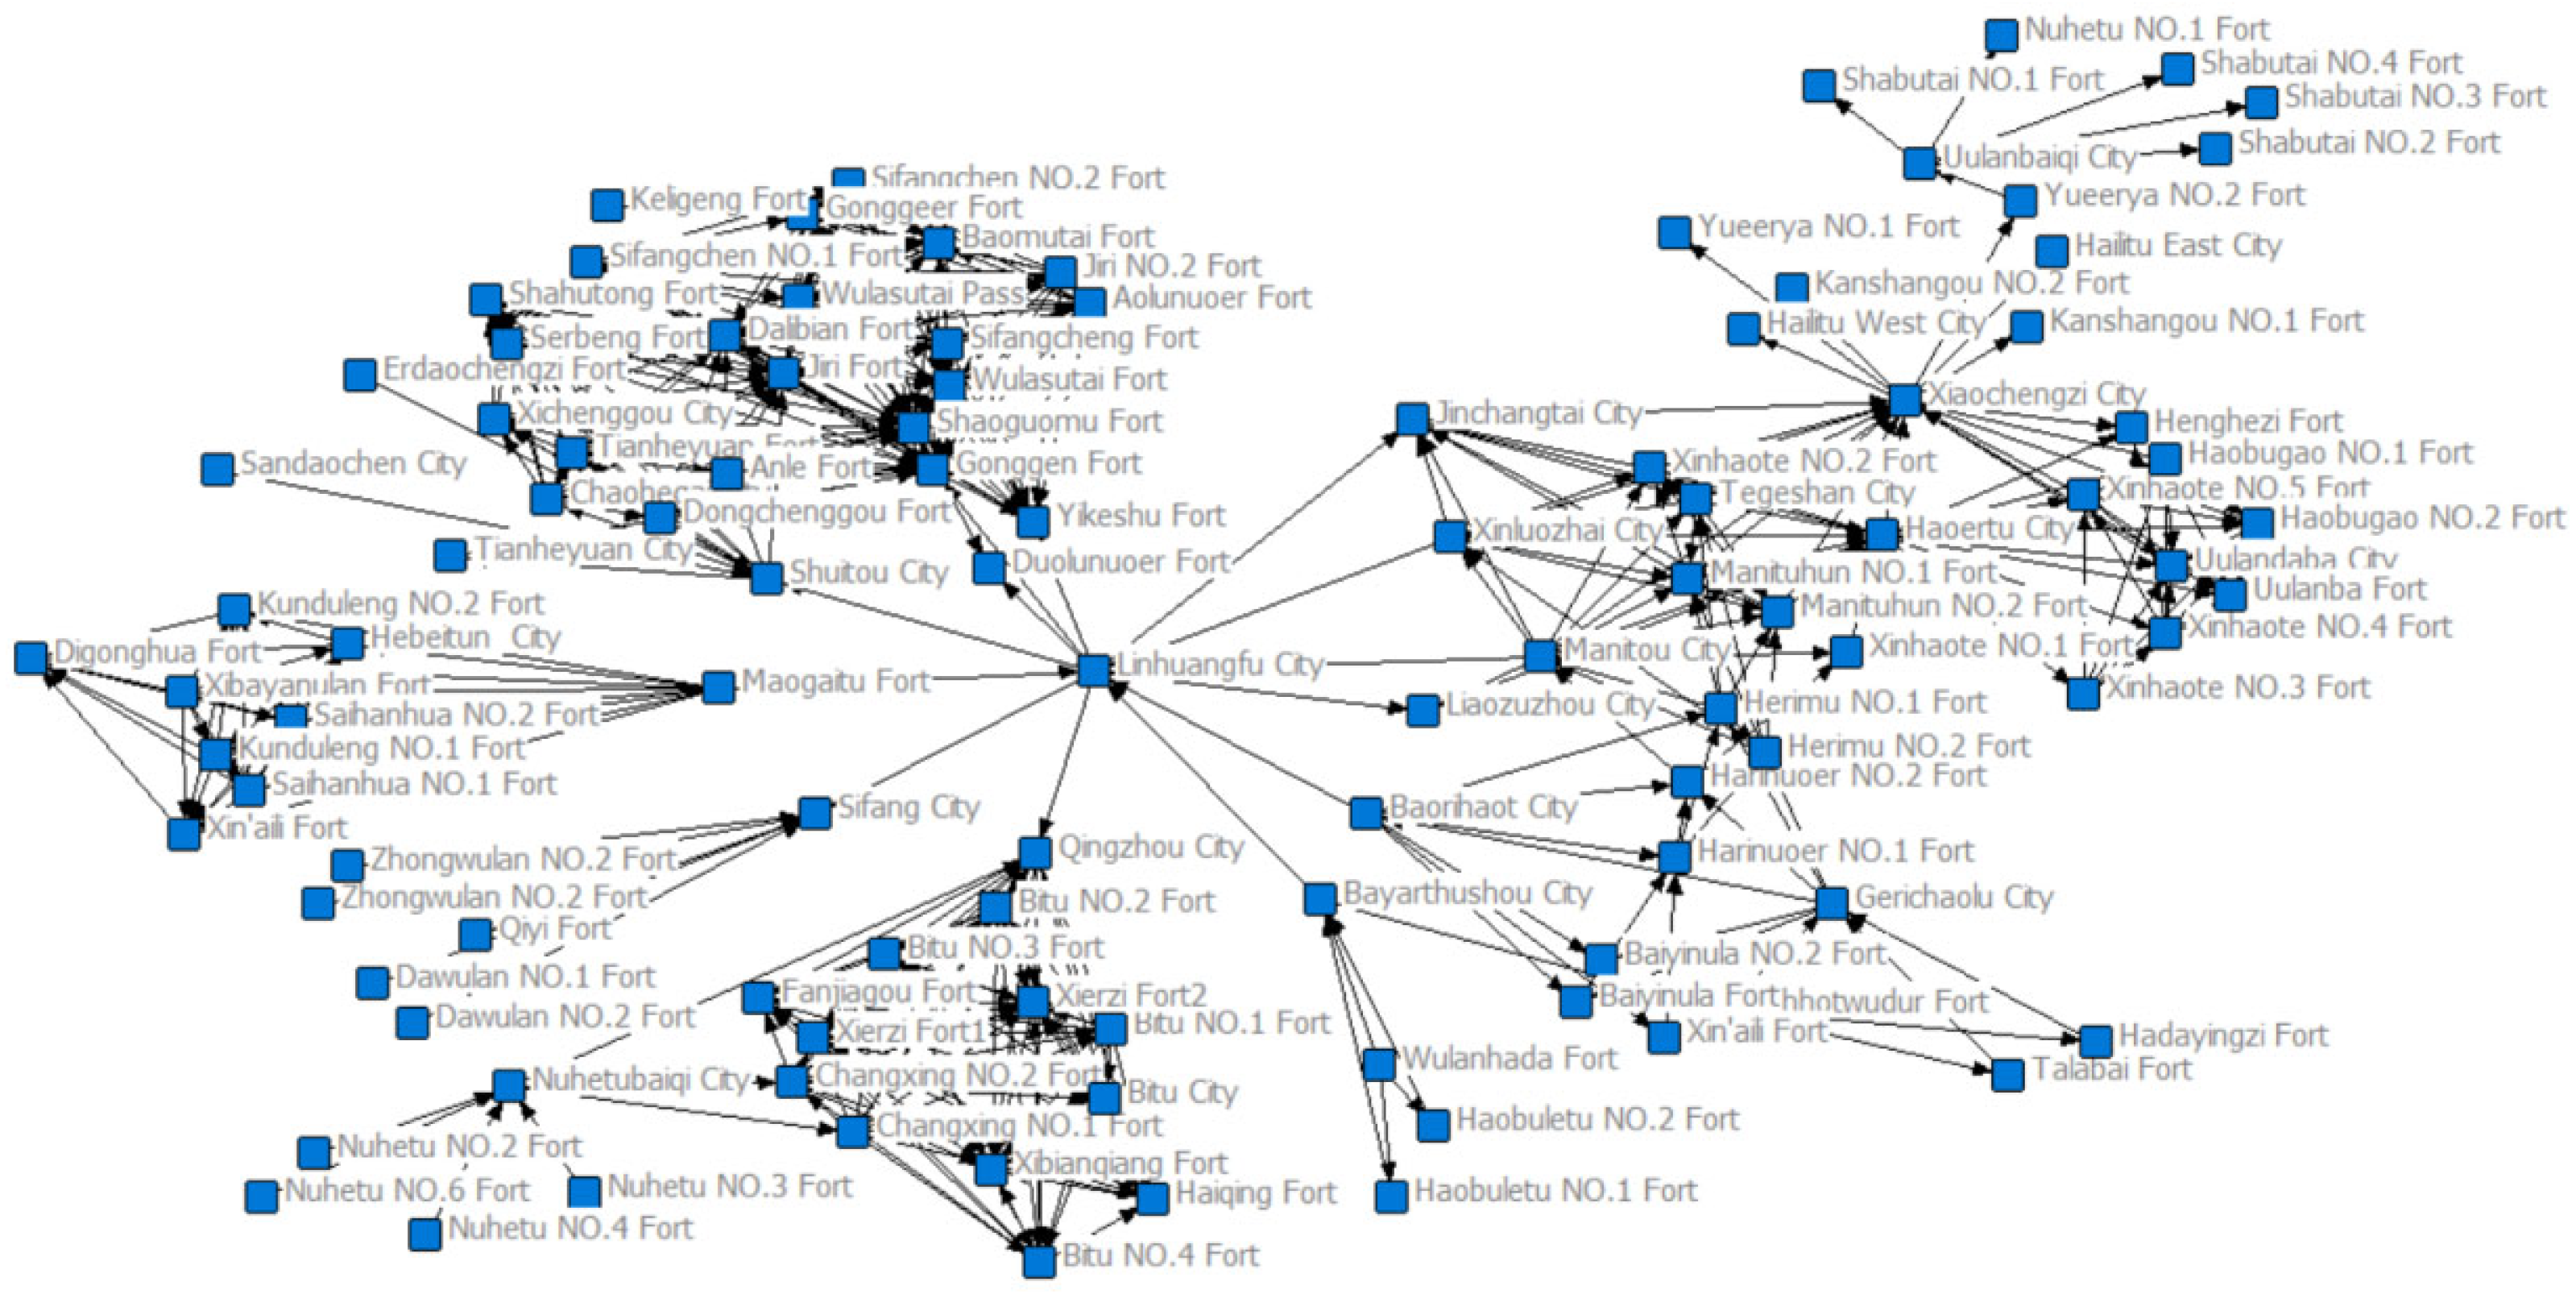
Combined with the impact factor, the “point” and “line” semantic models of the network are established, and their relevance is measured and analyzed. This model takes the city as the “point” and the military connection between settlements as the “line”. The quantitative data converted according to “point” and “line” are converted into matrix relational data. In this network model, settlements between different levels and within a certain geographical range are regarded as human connections, and assigned a value of “1”. For settlements at the same level or settlements with large geographical differences, they are regarded as not related to each other, and assigned a value of “0”. Finally, social network analysis was used to construct a network model of interpersonal relationships in the Linhuang Lu settlements by using UCINET6.0 software. The model was then visualized using the graphics processing software Net Draw (Figure 10). The figure shows that the settlement points in the network are all connected to the higher-level settlements, exhibiting a certain degree of spatial clustering. There are 11 secondary defense units and 12 tertiary defense units.
The steps of geographical connection network model are the same as those above. The specific steps of data acquisition and transformation are as follows: elevation, slope, undulation, river and trench, which are selected as resistance factors. Referring to the classification standard of resistance factor [33,34], the resistance values of elevation, slope and undulation are divided into four levels, and the resistance value is negatively correlated with the marching ability. The river data are divided into five levels of rivers according to the People‘s Republic of China River Management Regulations, and the resistance values of rivers at all levels are assigned according to the actual research. Finally, the superposition calculation is carried out based on the grid calculator in ArcGIS10.8 to form a comprehensive resistance surface. Taking all settlements on Linhuang Lu as the starting points, the distance cost of the surrounding grids is calculated.
This step is based on the Spatial Analyst Tools tool in ArcGIS10.8 software. Using the Cost Distance tool, the source data of Linhuang Lu settlements, cost data and resistance surface data are input. The cumulative minimum cost of the distance from the starting point is calculated. The Cost Backlink tool is used to calculate the minimum cost direction of each grid back to the starting point position. Finally, the Cost Path is used to calculate the starting point to the end point, that is, the lowest cost path between any two settlements, and the lowest cost is obtained. Based on the calculated minimum path between any two settlements, it is converted into a binary matrix, and the value between the two settlements whose path cost is less than the average is assigned to “1”; otherwise, it is assigned to “0”. The elevation data of each settlement are first reclassified and divided into four categories. The settlements located in the same elevation range are regarded as having geographical connections with each other, and the assignment is “1”. Otherwise, the assignment is “0”.
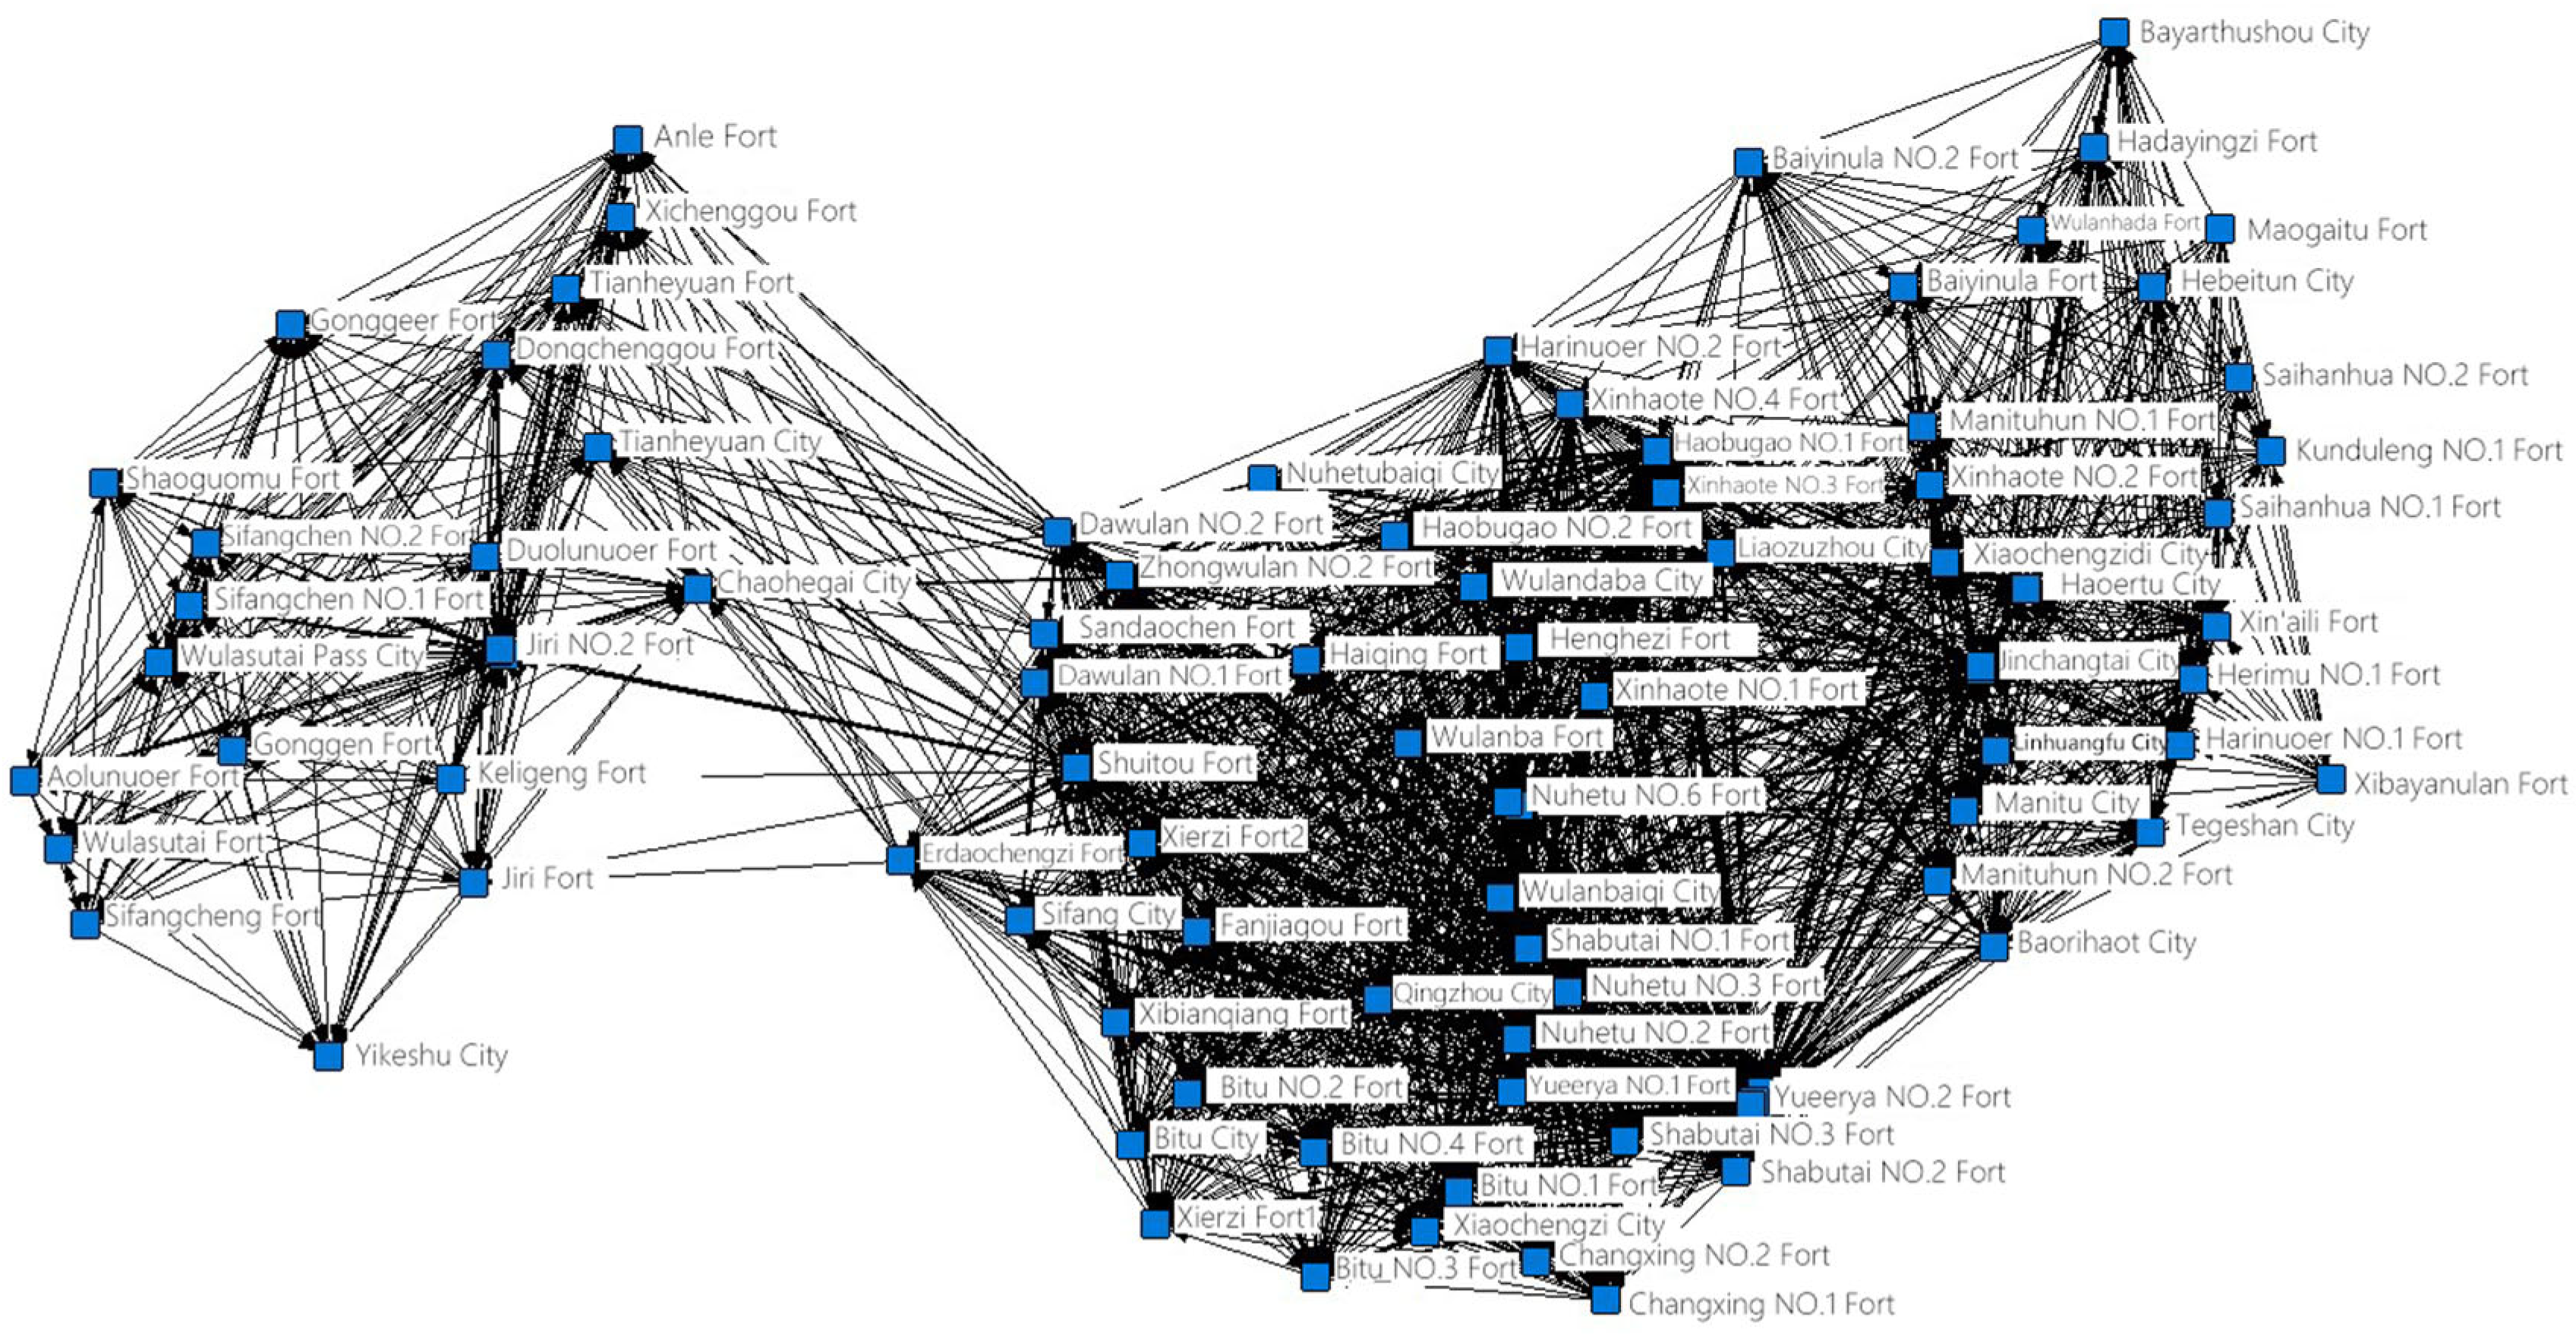
For the river system, the five-level river data in the study area are first obtained. According to the different levels of the river, the multi-ring buffer zone analysis of the river is carried out. The radius is 5, 10, 15 and 20 km, respectively. For the second-level river, the settlement within 20 km of the buffer zone of the same river is regarded as having geographical connection, assigned as “1”, and vice versa as “0”. For the third-level river, settlements within 15 km of the buffer zone of the same river are regarded as geographically connected, assigned as “1”, and vice versa as “0”. For the fourth-level and fifth-level rivers, the settlements within 10 km of the buffer zone of the same river are regarded as having geographical connections, and the assignment is “1”, or otherwise “0”. Finally, the cost distance correlation matrix, elevation correlation matrix and river system correlation matrix are superimposed to accumulate the number of correlations to form the geographical correlation matrix of the Jin Great Wall settlement on Linhuang Lu. After forming the matrix and conducting a visual analysis, as shown in Figure 11, the new data matrix obtained by superimposing various influencing factors are weighted. The more connections between two settlement points, the closer the geographical connection between the settlements. Conversely, if there are fewer connections, it cannot reflect the geographical connection between the two settlements. Therefore, building on previous work [35,36,37], a threshold method is employed to remove clusters with overly weak relationship strengths, thereby reducing interference and highlighting the core association structure. Connections with association counts of “2” or less are removed.

3.3.3. The Social Association Structure of Settlements

Social connection is the comprehensive embodiment of Linhuang Lu settlements in terms of human connection and geographical connection [38,39]. Its correlation matrix is weighted by human connection correlation matrix and geographical connection correlation matrix. After many experiments, the data with the correlation number less than or equal to “2” are assigned to “0”. At this time, the overall social association characteristics of the Jin Great Wall on Linhuang Lu settlements are obvious. Using UCINET6.0 software, a social network model of the Linhuang Lu settlements was constructed, and graphical processing software NET DRAW6.0 was used for visualization (Figure 12). The figure clearly shows the degree of settlement clustering. The primary settlement is connected to all 12 secondary settlements, and 10 secondary settlements are connected to all tertiary and quaternary settlements, forming secondary defense units. The 14 tertiary settlements are also connected to the quaternary settlements, forming tertiary defense units.
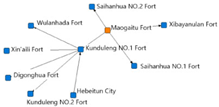
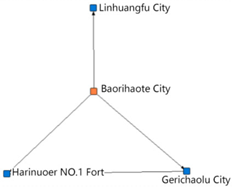
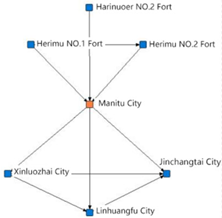
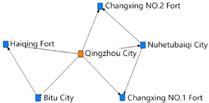
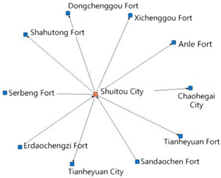
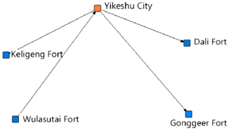
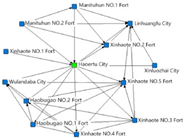
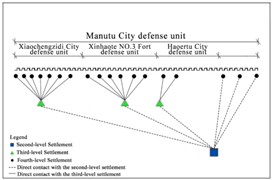
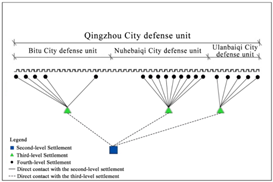
In order to further explore the settlements under the jurisdiction of the secondary settlement defense units, all secondary settlements are selected, and their social association connection matrix is further optimized with “3” as the breakpoint value to screen out strong connections. Taking the secondary settlements within each group as the core, the sub-networks of each secondary Meng’an settlement are analyzed on the basis of the social association network, and the settlements associated with the secondary settlements directly belong to this defense unit. Using this method, the 12 secondary settlements were divided into clusters in sequence. The UCINET6.0 software was used to construct a secondary settlement subnetwork model, and the graphical processing software NET DRAW6.0 was used for visualization. The division results and schematic diagram are shown in Table 4.
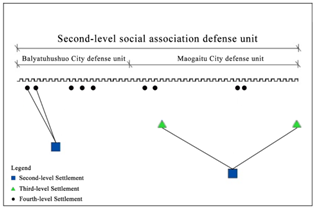
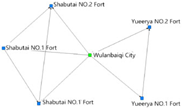
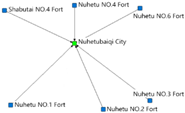
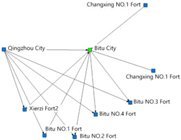
The lines in the figure represent connections between points. It can be seen that there are 10 secondary settlements that have direct connections with tertiary and quaternary settlements, resulting in 10 secondary defense units. Among them, the seven secondary settlements of Maogaitu City, Baorihaote City, Manitu City, Qingzhou City, Sifangcheng City, Gonggen City and Yikeshu City have strong links with the third-level settlements under their jurisdiction. The fourth-level settlements under its jurisdiction have a strong social connection with the fourth-level settlements. Taking the third-level settlement as the core, the sub-network of its social association network is analyzed. There is a strong connection between the fourth-level settlements and the third-level settlements and the fourth-level settlements and the third-level settlements constitute the third-level social association defense unit. Using UCINET6.0 software, a third-level cluster subnetwork model was constructed and visualized using the graphics processing software NET DRAW6.0. The results of the division are shown in Table 5.
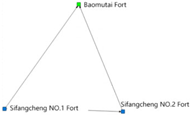
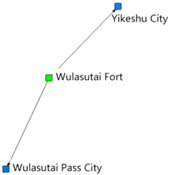
Links in the figure represent connections between points. It can be seen that there are 14 third-level settlements and fourth-level settlements that are directly connected, thus forming a total of 14 third-level defense units. The defense units at all levels of the Linhuang Lus settlement and the social associations between the settlements at all levels are superimposed. A total of 10 second-level defense units and 14 third-level defense units were formed. The lines connecting two points represent the hierarchical relationships between settlements, i.e., first-level settlement—second-level settlement/third-level settlement—third-level settlement/fourth-level settlement—fourth-level settlement, as shown in Figure 13.

3.4. Determination of the Defensive Unit of the Jin Great Wall Linhuang Lu Settlements

3.4.1. Determination of the Third-Level Mouke Defense Unit

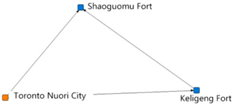
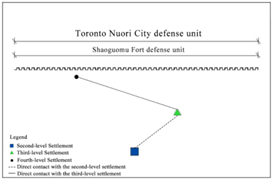
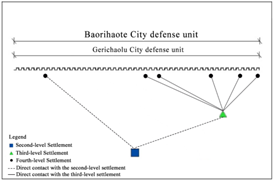
From the results of the third-level defense unit division of spatial and social association (Figure 14), it can be observed that social connection is more significant than spatial connection. The Xibayanulan Fort and the Shaoguomu Fort defense unit, that is, the four-level settlement Saihanhua No. 1 Fort, Saihanhua No. 2 Fort, and Keligen Fort, belong to different upper-level settlements.
In the social connection, Saihanhua No. 1 Fort and Saihanhua No. 2 Fort and the third-level settlement Xibayanulan Fort are in the same terrain, and there is a direct hierarchical relationship between them, thus forming a defensive unit. The reason why the fouth-level settlement Keligeng Fort belongs to the third-level settlement Shaoguomu Fort may be that the Keligeng Fort is actually within the jurisdiction of the Northwest Lu Defense Area. However, due to the limitations of the current research data, the construction of social association network only selects indicators from the two aspects of human connection and geographical connection to construct social connection. It may indicate that the division factor is not comprehensive, so that it has a strong connection with the Shaoguomu Fort, and then forms a defense unit. In the spatial correlation, these three fourth-level settlements are directly governed by the second-level settlements due to the scope of spatial influence.
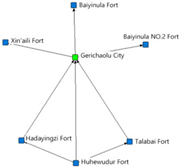
The settlements under the jurisdiction of the defense unit of Gerichaolu City are also different, that is, the superior settlements of Huhewenduer Fort are different. In the social association, Huhewenduer Fort is under the jurisdiction of Gerichaolu City. The reason may be that the selection of the correlation degree influence factor is not comprehensive, and the result has certain errors. In the spatial correlation, Huhewenduer Fort is directly under the jurisdiction of the Balyatuhushuo City, because of the strong accessibility between them. The remaining third-level defense units are consistent.
For the Great Wall settlements, the accessibility among settlements is a necessary condition for them to achieve efficient collaborative defense. The fourth-level settlements of Keligeng Fort are located in the same environment as the adjacent settlements, and there are no other special geographical obstacles. Therefore, the “analysis tool-neighborhood analysis-point distance tool” in ArcGIS10.8 is used to calculate the linear distance to the second-level and third-level settlements. The terrain of Saihanhua No. 1 Fort, Saihanhua No. 2 Fort and Huhewenduer Fort is more complex. Based on the resistance surface constructed above, the Costpath tool in ArcGIS10.8 software is used to calculate the lowest cost path to explore the three fourth-level settlements (Table 6, Table 7 and Table 8).
It shows that the cost distance from the two fourth-level settlements of Saihanhua No. 1 and Saihanhua No. 2 Fort to Kunduleng No. 2 Fort is less than that to Maogaitu Fort. It shows that the two settlements have higher accessibility to Kunduleng No. 2 Fort, so the two fourth-level settlements are classified as the third-level settlement Kunduleng No. 2 Fort.
The cost distance from Huhewenduer Fort to Gerichaolu City is less than that to Balyatuhushuo City, so Huhewenduer Fort is classified as the secondary settlement Balyatuhushuo City. The shortest distance from Keligeng Fort to Toronto Nuori City is less than that of Shaoguomu Fort, and Keligeng Fort belongs to Toronto Nuori City. Based on the above analysis, 12 third-level Mouke defense units can be determined on the Linhuang Lu of the Great Wall of the Jin Dynasty, and the final distribution is shown in Figure 15.

3.4.2. Determination of the Second-Level Meng’an Defense Unit

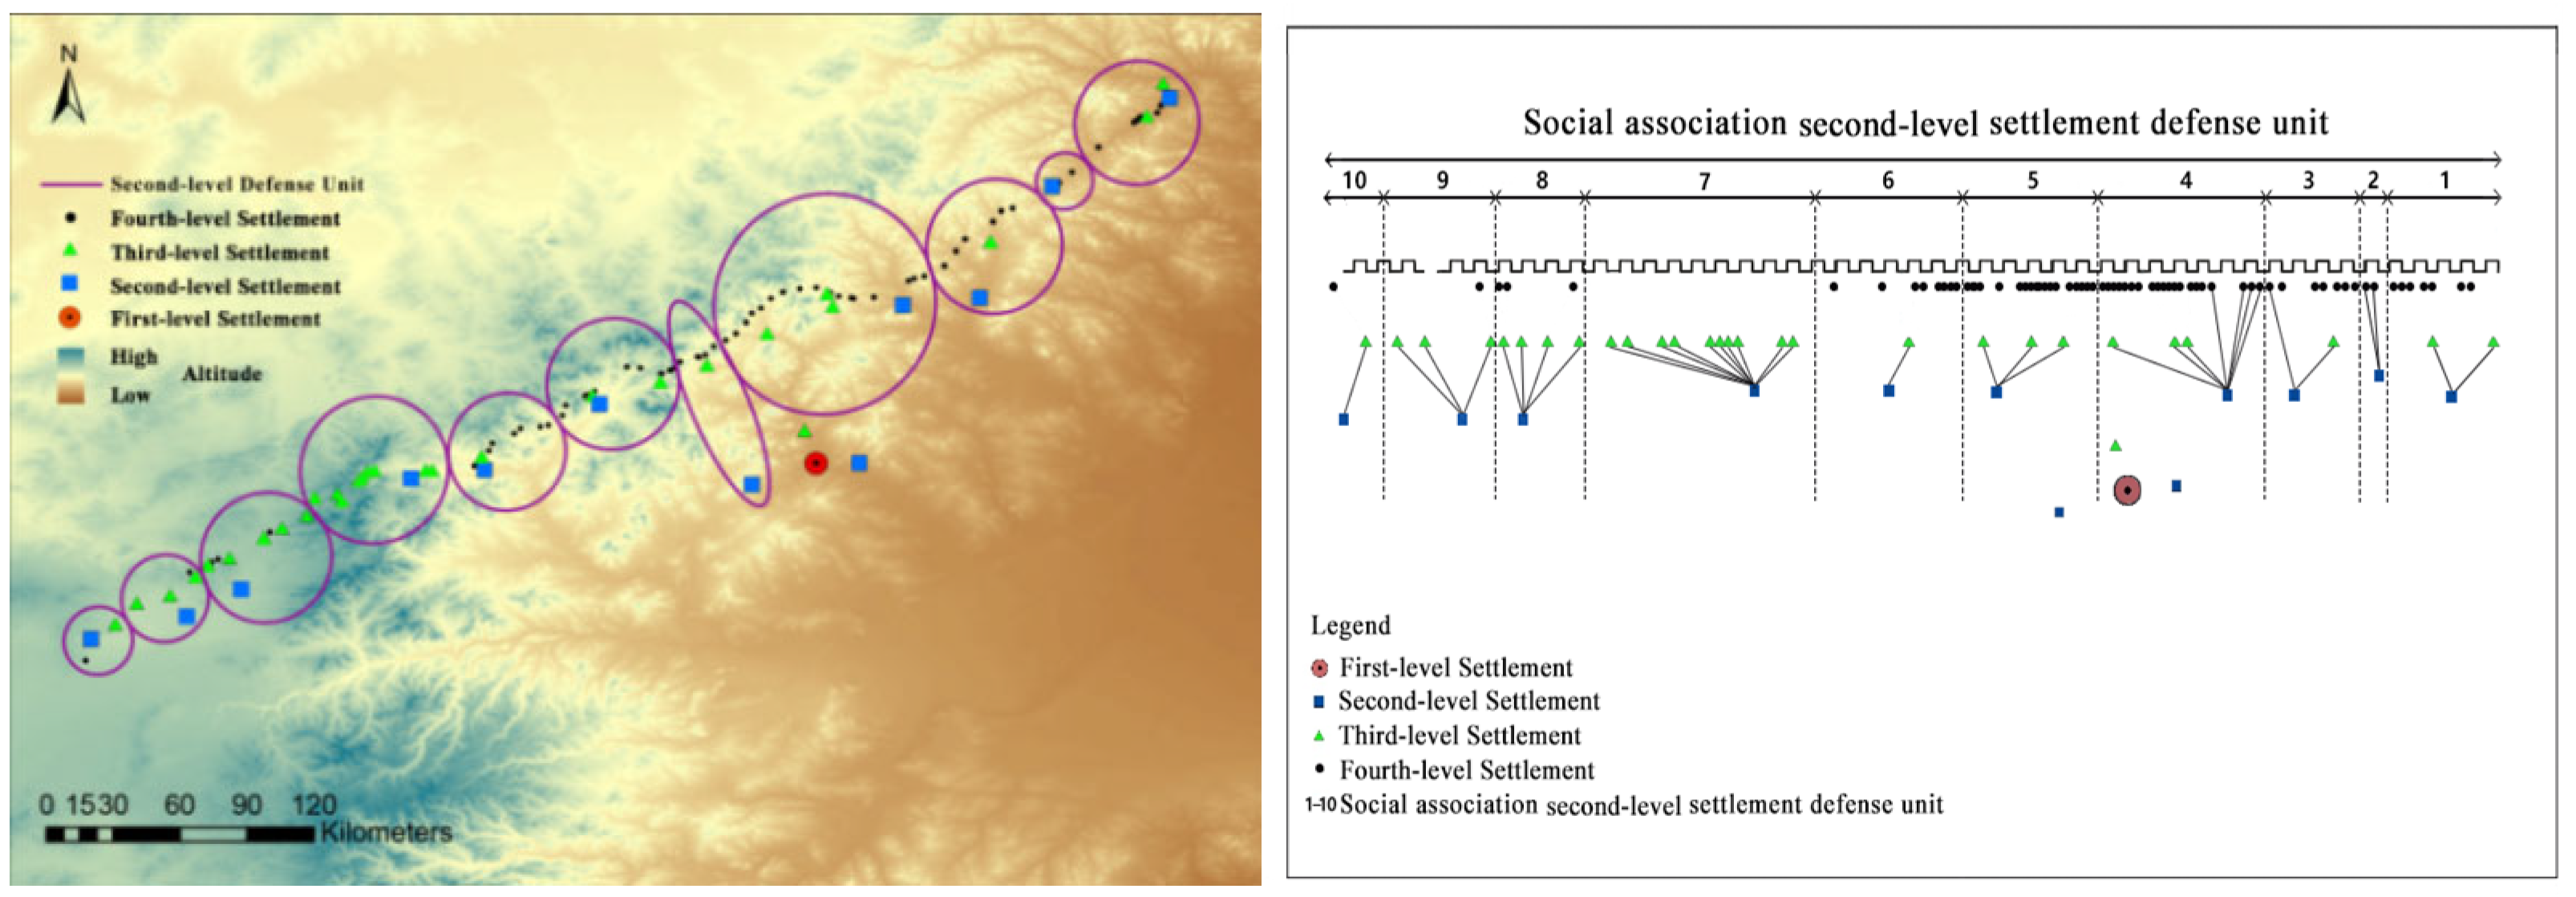
Using the results, the spatial association is divided into 11 second-level defense units, and the social association is divided into 10 second-level defense units (Figure 16). The difference in quantity is mainly due to Wulanbaiqi City, a third-level Mouke settlement. The settlements under the other second-level defense units are consistent.
In the spatial correlation, the third-level defense unit of the Wulanbaiqi City is under the jurisdiction of the second-level Liaozuzhou City, forming a second-level defense unit. The reason is that they have strong accessibility to each other, so the formation of defensive units. In the social connection, the third-level defense unit of the ancient city of Wulanbaiqi City is under the jurisdiction of the ancient city of Qingzhou City, forming a second-level defense unit. The reason is that there are two fifth-level rivers between Wulanbaiqi City and Qingzhou City, and there are one fourth-level and one fifth-level rivers between the ancient city of Liaozu. The slope position between the latter changes greatly, and the cost resistance is large in the calculation. Therefore, in the social connection, Wulanbaiqi City and Qingzhou City form a defense unit together. In order to determine the affiliation of the ancient city of Wulanbaiqi City, it is necessary to start from the geographical environment and calculate the lowest cost path. The steps are the same as those above (Table 9).
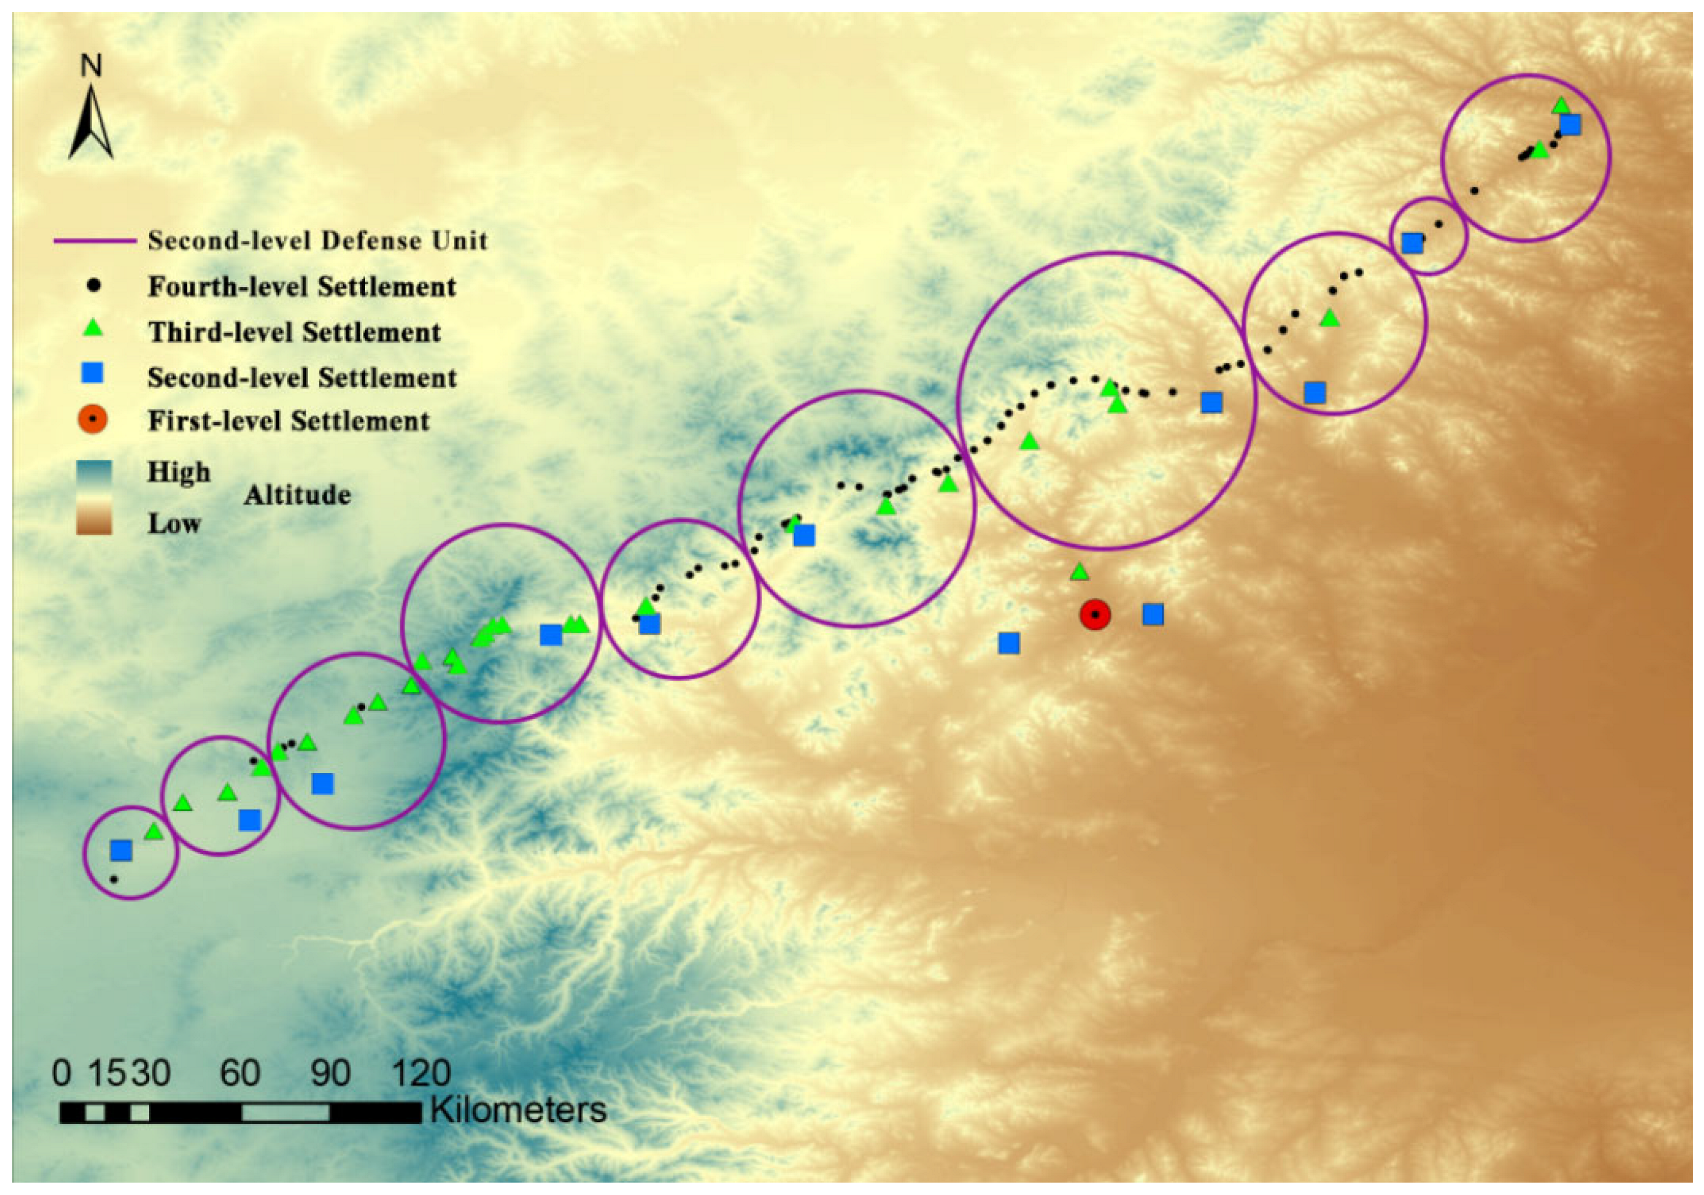
According to the analysis, the cost distance between Wulanbaiqi City and Qingzhou City is less than that of Liaozuzhou City. Therefore, Wulanbaiqi City is classified into Qingzhou City, which is a second-level settlement, and forms a defense unit together. Finally, determining the distribution of 10 second-level defense units (Figure 17). The second-level defense units distribution map is superimposed with the third-level defense units distribution map, and finally, 10 second-level defense units and 12 third-level defense units are obtained. Therefore, the Linhuang Lu Great Wall settlement defense units are divided as shown in Figure 18.

4. Discussion

This study found that the Linhuang Lu settlements have obvious hierarchy, which are the first-level general government settlement, the second-level Meng’an settlement, the third-level Mouke settlement, and the fourth-level Punian settlement. Through gradual analysis, the Linhuang Lu settlements were ultimately divided into 10 second-level defense units and 12 third-level defense units.
However, research has found that the settlement level in the western part of Linhuang Lu is weaker than others, especially where the number of four-level settlements is small. There is no fourth-level settlement in the Gunger grassland area between the second-level settlement Shuitou Fort and the second-level settlement Gonggen Fort. The area gradually transitions from Hunshandake sandy land to mountainous hills from west to east. One of the possible reasons is the influence of topography. The rear of this area is the tail mountain forest area of the Greater Khingan Range, that is, the northeast and southwest of the Huanggangliang Mountains in the southeast. As a natural barrier in the rear, it can prevent the enemy from entering the mainland through this area. If the northern enemy forces break through the trenches from this area, they will also continue to go south to the east–west valley plain, and this route will inevitably pass through the defense area of the Gonggen Fort.
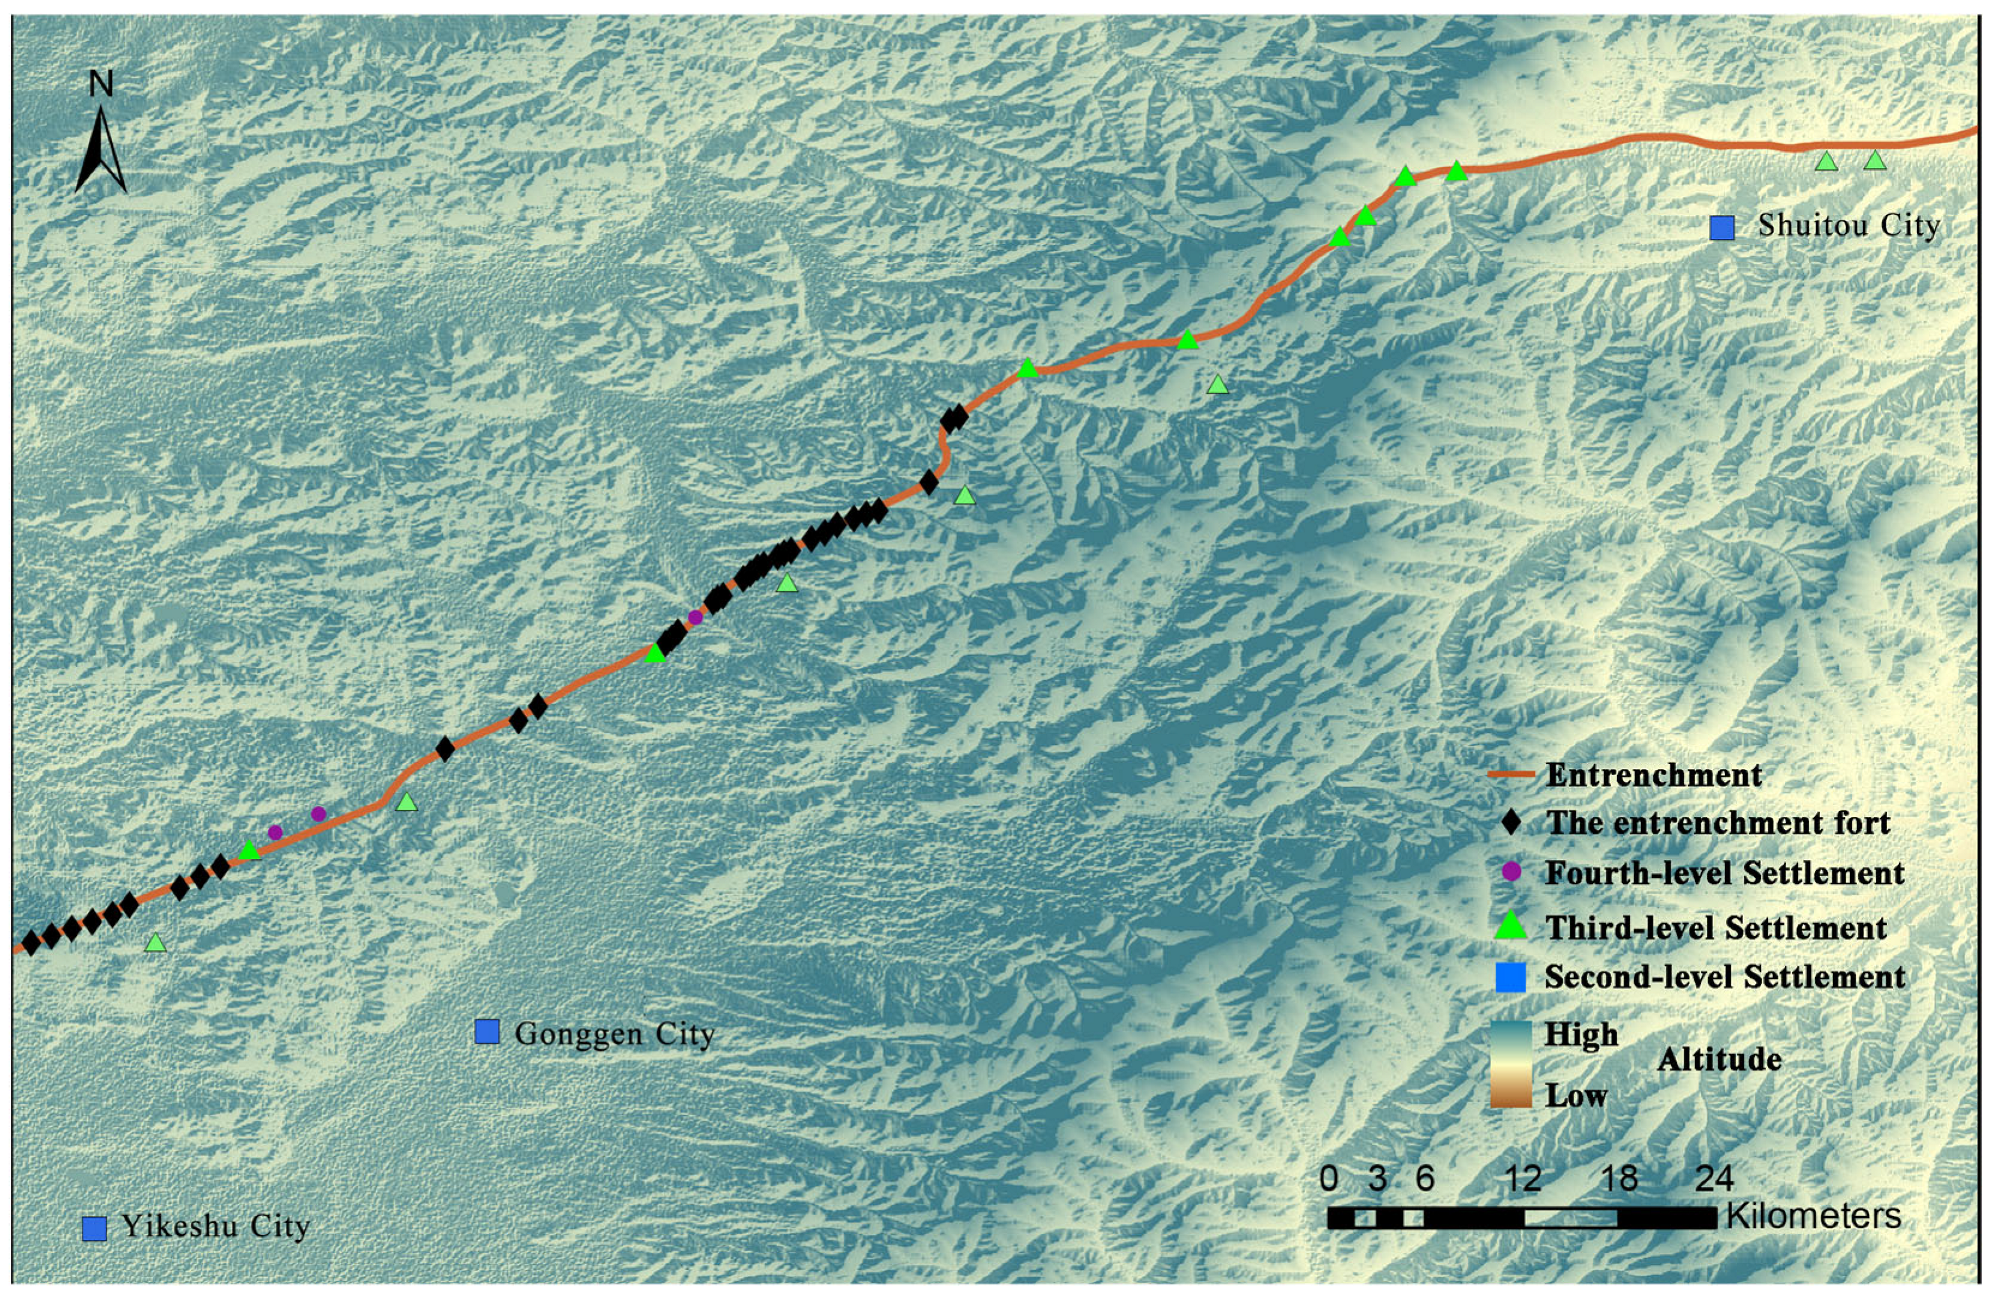
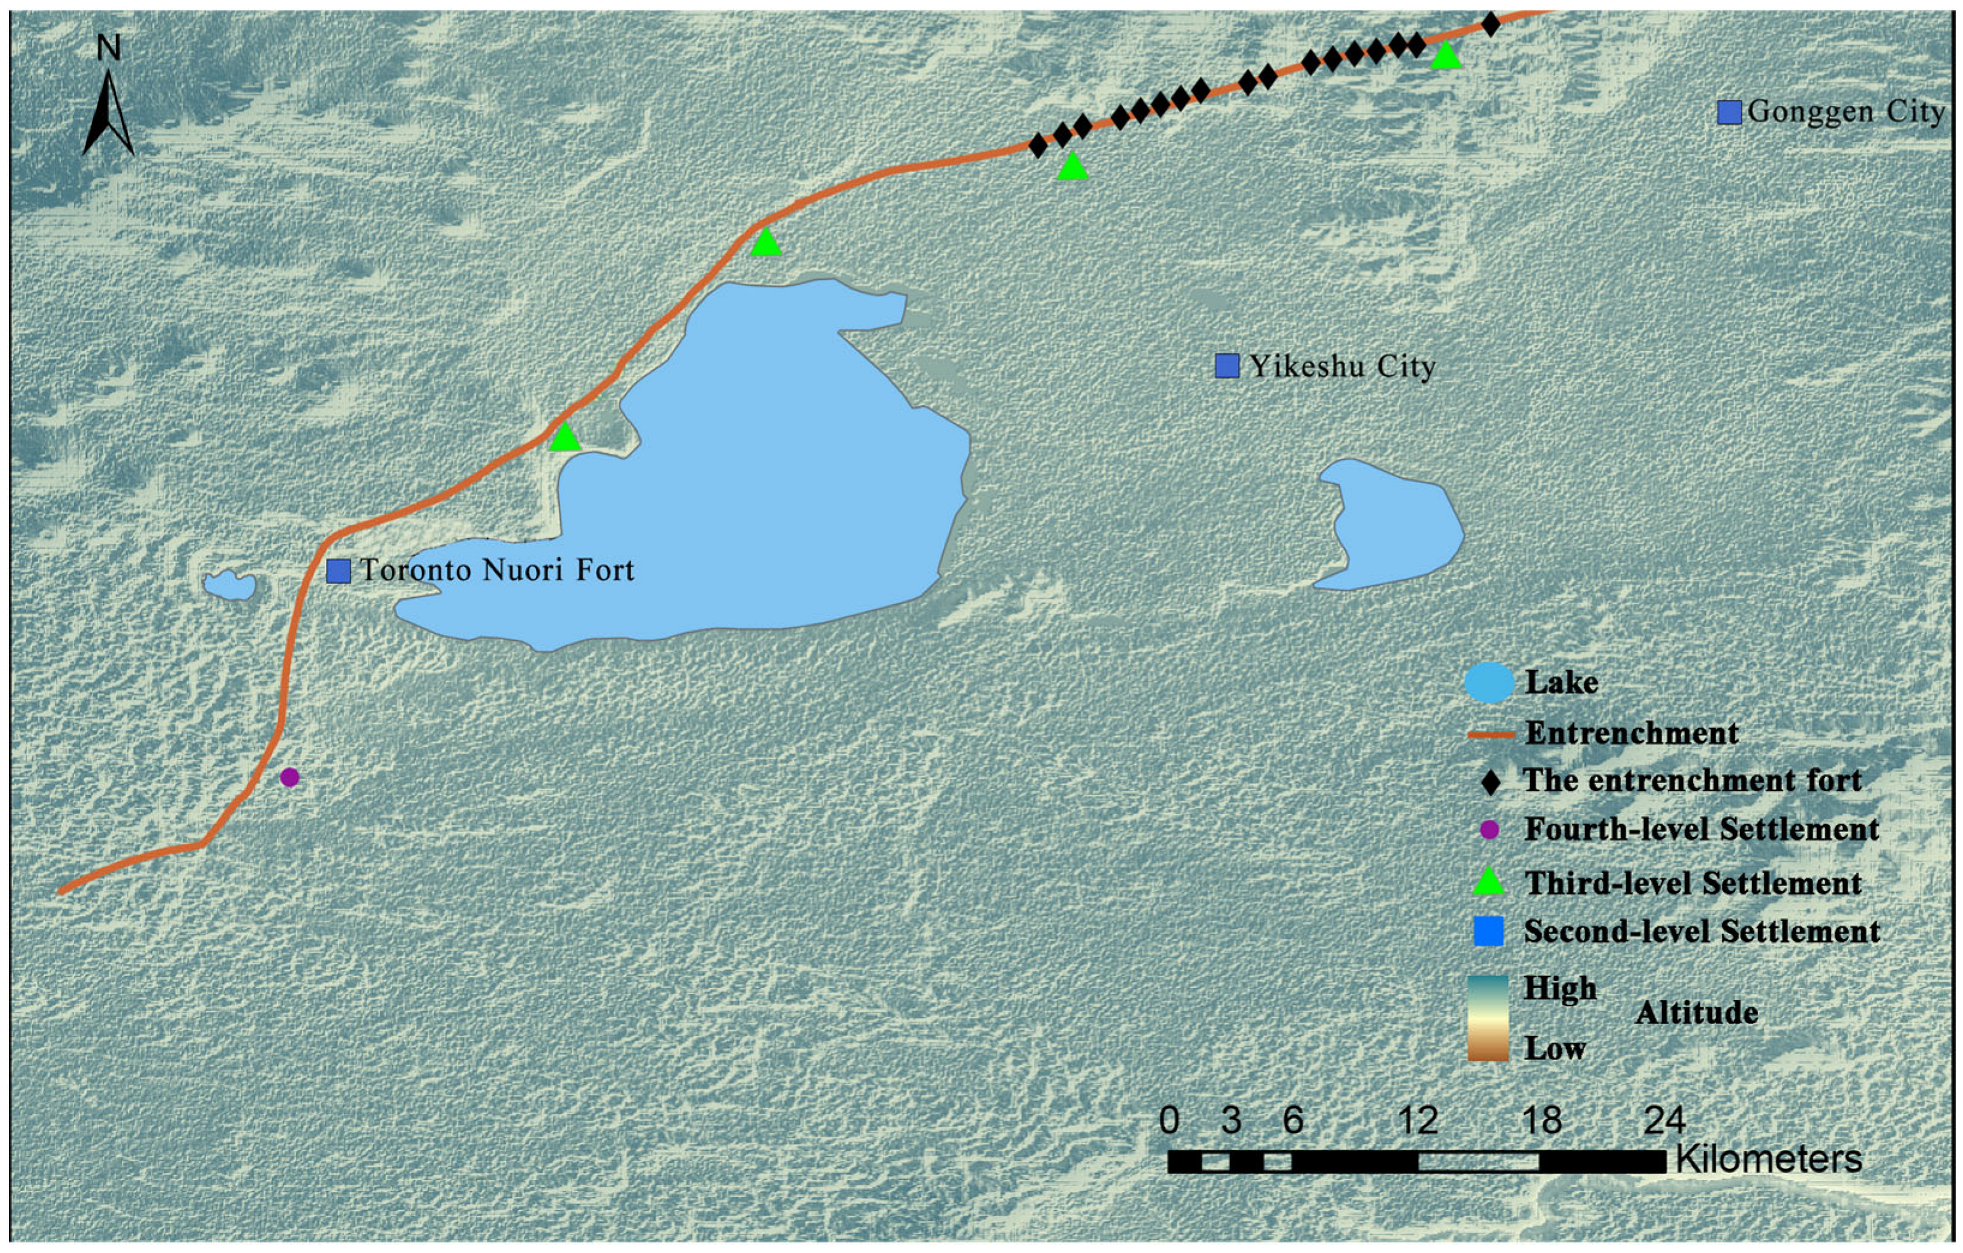
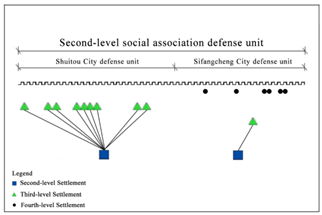
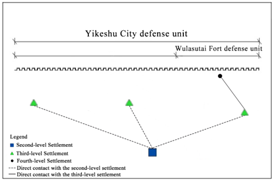
In this section, there are small forts on the inside of the western entrenchment. They have an average side length of about 20 m and are distributed at intervals of 4–6 defense towers. They belong to the entrenchment defense system. Because the western terrain is flat and open, it is convenient for the enemy to march. Therefore, the entrenchment in this area strengthens the defense force of the front line by adding densely distributed castles. No other related settlement sites have been found in this area, so there may not be a four-level settlement. As shown in Figure 19, there is no excessive distribution of four-level settlements in this area. The western part of Yikeshu Fort is a large sandy plain, with fewer and sparsely distributed third-level and fourth-level settlements. It is speculated that it is due to the location of Dalinor Lake there. The lake is one of the four famous lakes in Inner Mongolia and the largest lake in Chifeng City. The lake is more than one hundred kilometers long, with a total water storage of 1.6 billion cubic meters. The water depth is 10–13 m, and the area is 238 square kilometers. There are two lakes on the east and west sides of Dalinor Lake–Ganggenor Lake and Duolunnor Lake, which form the plateau lake area together. Because of the lake as a natural defensive barrier, the Jurchen people built the entrenchment near the west side of Dalinor Lake, and there was no need to build too many forts behind the entrenchment to enhance the longitudinal defense. As shown in Figure 20, there are no over-distributed settlements in the hinterland of the trench.
The defense system of the Great Wall of the Jin Dynasty profoundly embodies the military geography thought of “adjusting measures to local conditions”. In areas with significant geographical obstacles such as steep mountain passes, natural canyons, or crisscross river systems, these natural terrains themselves have constituted an insurmountable barrier, which greatly reduces the threat of rapid raids by the enemy‘s large-scale cavalry forces. Therefore, the rulers of the Jin Dynasty did not mechanically adopt the rigid strategy of dense construction of forts on the whole line, but optimized the allocation of limited military resources. In these areas, its fortifications rely more on a small number of elite garrison forts that control key ferries, traffic nodes and commanding heights. This deployment not only saves huge construction and long-term garrison costs, but also achieves a high balance between military benefits and resource investment, fully demonstrating its superb military strategic thinking.
Previous studies have focused on using GIS spatial analysis technology to reveal the characteristics of settlement location and diachronic evolution process, which has laid a solid foundation for understanding the material and cultural representation of settlement society [40,41,42,43]. However, such studies usually regard settlements as isolated analysis units or discrete point sets in space, and fail to fully reveal the cluster relationship and connection between settlements. There are also studies that focus on restoring the structure of the settlement system, but most of them use Voronoi diagrams and site resource domains to divide the spatial influence range of the settlements. The combination of the two makes the group division of the settlements more scientific, and creates a precedent for quantifying the Great Wall settlements. However, it failed to fully reveal the inherent and dynamic military and social connections between settlements. This study introduces the theoretical framework and quantitative model of social network analysis. Different from the traditional method of describing the attributes of settlements (such as scale and shape), this study focuses on the military hierarchy, geographical environment and other multiple relationships among settlements, and constructs them in a network system that can be quantitatively analyzed. This study not only verifies the “Meng’an-Mouke” hierarchical management system recorded in the literature, but also scientifically identifies the affiliation between settlements and the division of defense units in combination with spatial analysis. The contribution of this study is to break through the limitations of static and fragmented traditional research. From the meso-scale of system structure. It provides a new perspective, new method and new evidence to understand the operation logic of settlement system, and provides a scientific basis for the overall protection of the heritage.
Although this paper preliminarily restores the structure of the Great Wall settlement system in Linhuang Lu, there are some shortcomings. In terms of the classification of settlement levels, due to the large number of settlements in the study area and the destruction or non-existence of some settlement sites, there may be information missing in the process of information collection and data transformation, which affects the accuracy of settlement level division. In the application of the method, the selection of social association influence factors is not comprehensive enough. The operation of the Jin Great Wall settlements involves complex social connections, such as mutual trade, army farming and other activities [44]. These contextual connections have not yet been fully incorporated into the analytical framework. Due to the limitations of current historical materials and archaeological excavations, it is not enough to fully measure the correlation between settlements. It is believed that in the future, with the deepening of the excavation of historical materials related to the northwest frontier defense of the Jin Dynasty in the field of history, the discovery of more historical materials will provide richer evidence for the study of settlements. We must also further improve the reduction in the structure of the settlement system and enhance the scientific and systematic nature of the research.
The research paradigm of this paper combines spatial analysis and social network analysis, and reveals the system structure of the Great Wall settlements through a multi-level perspective. These methods are not only applicable to the settlement of the Jin Great Wall on Linhuang Lu, but also can be applied to other Great Wall settlements in the Jin Dynasty, as well as the study of the Great Wall settlements of non-agricultural or agricultural regimes. The weighted Voronoi diagram is used to determine the control range of settlements, especially in areas with complex terrain or dense settlements. However, it is necessary to adjust the weight parameters according to the differences in settlement functions, such as the horizon weight of the beacons in the Han and Ming dynasties, the weight of the scale of the garrison, etc. The spatial coupling degree can also be tested by the weighted Voronoi control range and the historical garrison activity radius. The analysis of social connections in social network analysis can be transformed into military and political system variables of different civilizations. For the Great Wall settlements with comprehensive historical records and surviving sites, the correlation of administrative subordination, military command, inter-market trade and transportation routes can be added, so as to comprehensively construct the relationship network between settlements. For sites with incomplete historical data, it is necessary to combine remote sensing archaeology and social organization models to make up for the data gap of social network analysis. This method is applicable to the Great Wall settlements with complex social networks or multi-level defense systems.
With the continuous attention of the world to cultural undertakings, the deepening of settlement-related research, the protection of the Great Wall site has been continuously strengthened. More and more historical materials related to the Great Wall of non-agricultural civilization will be excavated and analyzed, which will provide historical evidence for its basic theoretical research and protection research. More archaeological excavations of the Great Wall settlements will provide more physical data for settlement research, jointly help to determine many current uncertain views, solve the problems that have not yet been studied, and make up for the shortcomings of this study.
5. Conclusions

As a systematic and perfect military defense system in Chinese history, the research depth and paradigm expansion of the Great Wall defense system built by non-agricultural civilization still lag behind. Most of them simplify the Great Wall as a symbol of agricultural civilization to resist the invasion of foreign nationalities, which leads to the cognitive bias of the Great Wall of non-agricultural regime, ignoring its institutional innovation based on the characteristics of non-agricultural society and the political wisdom of institutional space. In addition, the historical records on the non-agricultural Great Wall defense system are scattered and few, and the weak status of its protection and research needs to be improved. This paper takes the Great Wall settlements of Jin Great Wall Linhuang Lu as an example, and divides the settlements into different levels. It also reveals the structure of the settlement system from the perspective of space and society. It provides a new paradigm for the study of the non-agricultural Great Wall defense system, and also lays a theoretical foundation for the protection and utilization of the site. The main conclusions are as follows:
(1)
The settlements of Linhuang Lu were divided into four grades. The ratio of Punian settlement to Mouke settlement, Meng’an settlement and Zhaotaosi settlement is about 70:30:10:1. Through quantitative analysis, it is revealed that the Great Wall settlements of Linhuang Lu present a “fourth-order pyramid”-type hierarchical structure. The high-level settlements show a strategic sparse layout, while the low-level settlements form a tactical dense linear organization.
(2)
The spatial correlation structure was clarified from the perspective of static space. According to the weighted Voronoi analysis, the spatial scope of each settlement was determined. Combined with ArcGIS10.8 spatial analysis technology, the Linhuang Lu settlements were divided into 11 second-level Meng’an defense units and 12 third-level Mouke defense units.
(3)
The social association structure was clarified from a dynamic social perspective. The social network analysis method was introduced to explore the relationship and social association structure between Linhuang Lu settlements in the process of system operation through the social connection between human connection and geographical connection. Finally, they were divided into 10 second-level Meng’an defense units and 14 third-level Mouke defense units.
(4)
A comparative analysis of spatial correlation structure and social correlation structure was carried out and the settlement system structure was determined. Analysis and comparison of the similarities and differences between spatial association structure and social association structure were carried out, and the accessibility and geographical environment of inconsistent related settlements were combined. Finally, it was determined that the Great Wall settlements of Linhuang Lu can be divided into 10 second-level Meng’an defense units and 12 third-level Mouke defense units.
In this paper, the research on the structure of the settlement system of Linhuang Lu of the Great Wall of the Jin Dynasty innovatively introduces quantitative research methods such as social network analysis. It is the first paper that discusses the social connection in the operation of the settlement system of the Great Wall of the Jin Dynasty. It is hoped that through such an attempt, the Great Wall settlements under the influence of non-agricultural civilization will be further studied in order to truly understand the wisdom of non-agricultural people in defending the construction of the city. It also provides an important spatial and social basis for the formulation of the overall and systematic protection strategy of the Great Wall heritage.

Author Contributions

Conceptualization, D.X.; methodology, D.X. and J.D.; software, J.D. and M.W.; validation, D.X., J.D. and M.W.; formal analysis, D.X.; investigation, J.D. and M.W.; resources, D.X. and M.W.; data curation, D.X. and M.W.; writing—original draft preparation, D.X. and J.D.; writing—review and editing, D.X. and J.D.; visualization, D.X., J.D. and M.W.; supervision, D.X.; project administration, D.X.; funding acquisition, D.X. All authors have read and agreed to the published version of the manuscript.

Funding

This research was funded by the Key Research Bases of Humanities and Social Sciences in Higher Educational Institutions in Hebei Province; National Natural Science Foundation of China (52278017); Social Science Fund Project of Hebei Province (HB24WH031); Research Project of Humanities and Social Sciences in Hebei Universities (JCZX2025034) and Hebei Province Graduate Course Ideological and Political Demonstration Course (YKCSZ2024009).

Data Availability Statement

Data can be provided upon request from the corresponding author.

Conflicts of Interest

The authors declare no conflicts of interest.

References

  1. Liu, J.; Li, S. Re-discussion on the historical stages of the Great Wall of China. Great Wall Stud. 2022, 18–31. [Google Scholar]
  2. Li, C.; Wu, Y.; Gao, B.; Wu, Y.; Zheng, K.; Li, C. Spatial differentiation and driving force detection of rural settlements in plateau lakes—A case study of the area around Erhai Lake. Econ. Geogr. 2022, 42, 220–229. [Google Scholar]
  3. Zhang, L. Spatial and Temporal Evolution and Optimization of Settlements in Pastoral Areas of Inner Mongolia-Taking Xilinguole League as An Example. Master’s Thesis, Inner Mongolia Normal University, Hohhot, China, 2023. [Google Scholar]
  4. Wei, J.; Meng, Y. Textual Research on the Great Wall of Northern Wei. Cult. Relics 2019, 7, 66–73. [Google Scholar]
  5. Yu, W. New research on the Great Wall of Eastern Wei and Northern Qi. J. Hist. Chorography 2014, 5, 46–49. [Google Scholar]
  6. Xie, D.; Zhang, B.; Wang, M.; Zhang, W. Spatial distribution characteristics and influencing factors of military settlements in the Great Wall of Jin Dynasty. J. Hebei Univ. Geosci. 2022, 45, 117–123. [Google Scholar]
  7. Cao, Y. Research on the Restoration and Spatial Correlation of the Military Settlement System in the Northeast Lu of the Great Wall. Master’s Thesis, Hebei University of Technology, Tianjin, China, 2023. [Google Scholar]
  8. Cao, Y. Ming Great Wall Xuanda Shanxi three towns military defense settlement system macro system relationship research. Ph.D. Thesis, Tianjin University, Tianjin, China, 2016. [Google Scholar]
  9. Faroug, Z. An Opposition-Based Great Wall Construction Metaheuristic Algorithm with Gaussian Mutation for Feature Selection. IEEE Access. 2024, 12, 30796–30823. [Google Scholar]
  10. Sieteski, S. Recontextualizing Military Structures along the Stanegate and Hadrian’s Wall Utilizing Aerial Photography and GIS Mapping. Ph.D. Thesis, Bryn Mawr College, Bryn Mawr, PA, USA, 2017. [Google Scholar]
  11. Junyoung, P. The Applicable Potential of Using Network Analysis Methods for Historical and Archaeological Research—Focusing on Ancient Beads Excavated from the Yeongsan River Basin and Gaya Region. J. Humanit. Seoul Natl. Univ. 2022, 79, 85–115. [Google Scholar]
  12. Xu, N.; Guan, K.; Wang, P. Improving access to urban parks through public transit optimization. Front. Archit. Res. 2024, 13, 575–592. [Google Scholar] [CrossRef]
  13. Fogliatto, F.S.; Saurin, T.A.; Tortorella, G.L.; Dora, J.M.; Tonetto, L.M. Workspace Layout for Resilient Performance using Social Network Analysis: A Case Study. HERD 2024, 17, 294–314. [Google Scholar] [CrossRef] [PubMed]
  14. Peng, X.; Xu, X.; Xu, X. Research on the joint development of rural tourism destinations based on social network analysis-Taking Haikou City as an example. J. Southwest Univ. (Nat. Sci. Ed.) 2023, 45, 149–158. [Google Scholar]
  15. Zhou, H.; Lu, L.; Jiang, Y. Influencing factors and configuration analysis of local tourism employment behavior of farmers in ethnic villages. Econ. Geogr. 2022, 42, 232–238. [Google Scholar]
  16. Zhou, L.; Ding, J.; He, F. Analysis of the social network structure of rural tourism destinations from the perspective of endogenous development—A case study of W village in Suzhou. Mod. City Res. 2020, 1, 122–130. [Google Scholar]
  17. Ding, J.; Zhou, L. Research on micro-renewal of tourism-oriented rural public space based on social network model-Taking Mingyuewan Village in Suzhou as an example. Mod. Urban Res. 2021, 12, 48–55. [Google Scholar]
  18. Lu, T.; Yu, T. Research on the reconstruction of rural social space in tourist destinations based on social network analysis -A case study of ‘Beautiful Village’ in Shiwa, Nanjing. Geogr. Sci. 2020, 40, 1522–1531. [Google Scholar]
  19. Wang, L.; Zhang, C.; Xie, T. Research on spatial structure and optimization of Chaoshan village based on spatial syntax and social network-Taking Chengyanggang village in Shantou city as an example. Ind. Archit. 2024, 54, 163–171. [Google Scholar] [CrossRef]
  20. Ding, J.; Zhang, Y. Analysis of the spatial structure of traditional villages in southern Jiangsu based on SNA-Taking the ancient village of East Village in Suzhou as an example. Mod. City Res. 2022, 12, 1–8. [Google Scholar]
  21. Xiong, C.; Xia, J. Research on the Protection Mode of Villagers Participatory Ancient Villages-Based on the Construction of Social Network. Mod. City Res. 2016, 1, 10–15. [Google Scholar]
  22. Xie, D.; Zhang, W.; Zhao, Y. Research on the regional protection and development of the Great Wall settlement based on social network analysis-Taking Chicheng County of Zhangjiakou as an example. Mod. Urban Res. 2023, 1, 48–55. [Google Scholar]
  23. Xia, Y. Preliminary Study on Mengan Mouke Organization of Khitan People in Jin Dynasty. J. Jilin Norm. Univ. (Humanit. Soc. Sci. Ed.) 2008, 4, 95–98. [Google Scholar]
  24. Yan, W.; Qin, Y.; Guo, Q. Verification, Extension and Application of Urban Breakpoint Theory. Hum. Geogr. 2004, 19, 5. [Google Scholar]
  25. Alonso, W. The economics of urban size. Regional Science Association. Meeting 1971, 26, 67–83. [Google Scholar]
  26. Li, S.; Hu, P.; Yan, W. Division of urban influence scope based on weighted Voronoi diagram. J. Wuhan Univ. (Eng. Ed.) 2004, 1, 94–97. [Google Scholar]
  27. Yan, W.; Guo, Q.; Li, S. The division method of urban economic zone based on weighted Voronoi diagram. J. Cent. China Norm. Univ. (Nat. Sci. Ed.) 2003, 4, 567–571. [Google Scholar]
  28. Wang, S. The impact of urban efficiency differences on China‘s future urbanization. Econ. Geogr. 1994, 1, 46–52. [Google Scholar]
  29. Wang, S. A Review of Tourism Research under the Foreign Social Network Paradigm. Tour. J. 2009, 24, 90–95. [Google Scholar]
  30. Liu, J. An Introduction to Social Network Analysis; Social Science Literature Publishing House: Beijing, China, 2004. [Google Scholar]
  31. Shi, Y.; Huang, Y.; Deng, L.; Cai, H.; Qiu, Y. Research on the spatial form representation of the social structure of traditional settlements-Taking Anju Town as an example. Archit. J. 2019, S1, 35–41. [Google Scholar]
  32. Scott, J. Social Network Analysis; Chongqing University Press: Chongqing, China, 2016. [Google Scholar]
  33. Wang, T.; Hui, Y.; Rui, P.; Shi, Y. Study on the shape division and formation of decentralized rural settlements based on Alpha Shape algorithm-Taking Longzhen, Mizhi County as an example. Geogr. Arid. Areas 2022, 45, 946–954. [Google Scholar]
  34. Zhou, L.; Zhang, X. Spatial hierarchy analysis of traditional settlements based on social network analysis-Taking the traditional settlements of Sanfangqixiang in Fuzhou as an example. Urban Reg. Plan. Res. 2018, 10, 26–44. [Google Scholar]
  35. Zhang, W.; Ban, Z. Global citation network influence maximization algorithm. J. Univ. Sci. Technol. China 2020, 50, 1058–1063. [Google Scholar]
  36. Chen, Y.; Luo, Z.; Qi, S.; Zhao, J.; Yuan, Y.; Li, F. Based on ecological sensitivity and ecological network, the construction of ecological security pattern in Nanchang City. Study Soil Water Conserv. 2021, 28, 342–349. [Google Scholar]
  37. Li, Z.; Li, Y.; Li, W.; Xue, M. Research on the construction of ecological security pattern in Kunming based on morphological spatial pattern analysis and minimum cumulative resistance model. J. Ecol. Rural Environ. 2023, 39, 69–79. [Google Scholar]
  38. Pumain, D. Settlement systems in the evolution. Geogr. Ann. Ser. B Hum. Geogr. 2000, 82, 73–87. [Google Scholar] [CrossRef]
  39. Holling, C.; Gunderson, L. Resilience and adaptive cycles. In Panarchy: Understanding Transformations in Human and Natural Systems; Island Press: Washington, DC, USA, 2002; pp. 25–62. [Google Scholar]
  40. Zhang, Y.; Li, S.; Tan, L.; Zhou, J. Distribution and Integration of Military Settlements Cultural Heritagin the large Pass City of theGreat Wall in the Ming Dynastyr: A Case Study of Juyong PassDefense Area. Sustainability 2021, 13, 7166. [Google Scholar] [CrossRef]
  41. Daniel, B.; Andrés-Herrero, M.; Christian, W.; Willmes, C.; Weniger, G.-C.; Bareth, G. Investigating the Influence of Different DEMs on GIS-Based Cost Distance Modeling for Site Catchment Analysis of Prehistoric Sites in Andalusia. ISPRS Int. J. Geo-Inf. 2017, 6, 36. [Google Scholar] [CrossRef]
  42. Ogas-Mendez, A.; Isoda, Y. Examining the Effect of Squatter Settlements in the Evolution of Spatial Fragmentation in the Housing Market of the City of Buenos Aires by Using Geographical Weighted Regression. ISPRS Int. J. Geo-Inf. 2021, 10, 359. [Google Scholar] [CrossRef]
  43. Jia, X.; Zhang, Z.; Liang, W.; Li, E.; Hu, X.; Lee, H.F. Subsistence strategies and climate change as key factors in the vicinity of the Great Wall in northern China from 500 BCE. Holocene 2025, 35, 159–166. [Google Scholar] [CrossRef]
  44. Lin, J.; Tian, Y.; Yao, Q.; Shi, Y. Structural Characteristics of Intergovernmental Water Pollution Control Cooperation Networks Using Social Network Analysis and GIS in Yangtze River Delta Urban Agglomeration, China. Sustainability 2023, 15, 13655. [Google Scholar] [CrossRef]
Figure 1. The trend and distribution of the Great Wall of the Jin Dynasty in the 1208 regime boundary. (Base map source: ‘Chinese Historical Atlas’ Volume 6 Jin, Southern Song Dynasty).
Buildings 15 03160 g001
Figure 2. Entrenchment formation of the Jin Great Wall on Linhuang Lu.
Buildings 15 03160 g002
Figure 3. Typical settlement sites of the Jin Great Wall.
Buildings 15 03160 g003
Figure 4. Distribution map of settlements on Linhuang Lu of the Jin Great Wall.
Buildings 15 03160 g004
Figure 5. The scatter distribution map of Linhuang Lu settlements divided by scale.
Buildings 15 03160 g005
Figure 6. Grading results of settlements on Linhuang Lu.
Buildings 15 03160 g006
Figure 7. Analysis of weighted Voronoi diagram of second-level settlements on Linhuang Lu.
Buildings 15 03160 g007
Figure 8. Analysis of weighted Voronoi diagram of the second-level and third-level settlements on Linhuang Lu.
Buildings 15 03160 g008
Figure 9. Spatial defense units of the Jin Great Wall settlements on Linhuang Lu.
Buildings 15 03160 g009
Figure 10. Diagram of the military-related network of the Jin Great Wall settlement on Linhuang Lu.
Buildings 15 03160 g010
Figure 11. Geographical connection network map of the Jin Great Wall settlement on Linhuang Lu.
Buildings 15 03160 g011
Figure 12. Social connection network diagram of the Jin Great Wall settlement on Linhuang Lu.
Buildings 15 03160 g012
Figure 13. The structure of the social associations of Jin Great Wall settlements on Linhuang Lu.
Buildings 15 03160 g013
Figure 14. Comparative Analysis of Linhuang Lu Settlements Mouke Defense Unit. (a) Spatial Correlation Mouke Defense Units; (b) Social Connection Mouke Defense Units.
Buildings 15 03160 g014
Figure 15. Mouke Defense Units of Linhuang Lu settlements.
Buildings 15 03160 g015
Figure 16. Comparative analysis of Linhuang Lu settlements Meng’an Defense Units.
Buildings 15 03160 g016
Figure 17. Meng’an Defense Units of Linhuang Lu.
Buildings 15 03160 g017
Figure 18. The division of defense units at all levels of Linhuang Lu settlements.
Buildings 15 03160 g018
Figure 19. Settlement distribution in the western section of Linhuang Lu I.
Buildings 15 03160 g019
Figure 20. Settlement distribution in the western section of Linhuang Lu II.
Buildings 15 03160 g020
Table 1. Detailed classification of Linhuang Lu settlement military forts.
Settlement LevelAdmiral Official PositionLength of Side (Meter)Perimeter (Meter)Quantity
Zongguanfu primary settlementZhaotaosi level officer≥1000≥40001
Meng’an secondary settlementMeng’an level officer400–10001600–400012
Mouke tertiary
settlement
Mouke level officer150–400600–160029
Punian quaternary
settlement
Punian level officer50–150200–60066
Table 2. Evaluation index of the classification of settlements on Linhuang Lu.
Evaluating IndicatorFirst IndexSecond IndexFactor Data Recording StandardImplication
Settlement scale Settlement perimeterIt is recorded as “1”, and “0” is not recordedReflect the size of the city site
Important defense facilitiesBeacon tower, corner tower, urn door, moat, inner cityReflect the defensive capabilities of a city site, and thereby represent the level of settlement hierarchy and strategic importance
Production and living facilitiesBeacon tower, cellars, wells, granaries, sacrificial remainsReflect the intensity and types of human activities
Characteristic cultural relic remainsBricks, tiles, pots, pots, ceramics and other production supplies, stone mills, shovels, pears and other production tools, as well as harnesses, antlers, military printing and other military combat toolsReflect the activity content and group status of the city site
Table 3. List of influencing factors associated with settlements on Linhuang Lu.
Criterion LayerIndex LayerFactor Layer
Evaluation of social association of Linhuang Lu settlementHuman connection Military gradeLevel 1, level 2, level 3, level 4
Geographical connectionCost surfaceAltitude: 0–448 m, 448–815 m, 815–1156 m, 1156–2041 m
Slope position: inter-gully land, gully slope land, gully bottom land
River system grade: Level 1, Level 2, Level 3, Level 4, Level 5
Table 4. Data table of social association secondary group division.
Name of Social Associated Secondary Defense UnitSocial Association Secondary Defense Unit Network DiagramSocial Association Secondary Defense Unit Spatial Distribution Map
Maogaitu City defense unitBuildings 15 03160 i001Buildings 15 03160 i002
Balyatuhushuo City defense unitBuildings 15 03160 i003
Baorihaote City defense unitBuildings 15 03160 i004Buildings 15 03160 i005
Manutu City defense unitBuildings 15 03160 i006
Qingzhou City defense unitBuildings 15 03160 i007
Sifangcheng City defense unitBuildings 15 03160 i008Buildings 15 03160 i009
Shuitou City defense unitBuildings 15 03160 i010
Yikeshu City defense unitBuildings 15 03160 i011Buildings 15 03160 i012
Gonggen City defense unitBuildings 15 03160 i013
Toronto Nuori City defense unitBuildings 15 03160 i014
Table 5. Data table of social association thirdly group division.
Name of Social Association Secondary Defense UnitName of Social Association Tertiary Defense UnitSocial Association Tertiary Defense Unit Network DiagramSocial Association Tertiary Defense Unit Spatial Distribution Map
Maogaitu City defense unitXibayanulan Fort defense unitBuildings 15 03160 i015Buildings 15 03160 i016
Kunduleng NO. 1 Fort defense unitBuildings 15 03160 i017
Baorihaote City defense unitGerichaolu City defense unitBuildings 15 03160 i018Buildings 15 03160 i019
Manutu City defense unitHaoertu City defense unitBuildings 15 03160 i020Buildings 15 03160 i021
Xinhaote NO. 3 Fort defense unitBuildings 15 03160 i022
Xiaochengzi-di City defense unitBuildings 15 03160 i023
Qingzhou City defense unitWulanbaiqi City defense unitBuildings 15 03160 i024Buildings 15 03160 i025
Nuhetubaiqi City defense unitBuildings 15 03160 i026
Bitu City defense unitBuildings 15 03160 i027
Sifangcheng City defense unitZhongwulan NO. 1 Fort defense unitBuildings 15 03160 i028Buildings 15 03160 i029
Gonggen City defense unitAolunuoer Fort defense unitBuildings 15 03160 i030Buildings 15 03160 i031
Baomutai Fort defense unitBuildings 15 03160 i032
Yikeshu City defense unitWulasutai Fort defense unitBuildings 15 03160 i033Buildings 15 03160 i034
Toronto Nuori City defense unitShaoguomu Fort defense unitBuildings 15 03160 i035Buildings 15 03160 i036
Table 6. Minimum cost distance statistics between settlements I.
Maogaitu City (Second-Level)Kunduleng No. 2 Fort (Third-Level)
Saihanhua No. 1 Fort6,021,0605,829,960
Saihanhua No. 2 Fort6,081,7705,769,960
Table 7. Minimum cost distance statistics between settlements II.
Balyatuhushuo City (Second-Level)Gerichaolu City (Third-Level)
Huhewenduer Fort9,644,0905,574,260
Table 8. Statistics of the shortest distance between settlements.
Toronto Nuori City (Second-Level)Shaoguomu Fort (Third-Level)
Keligeng Fort9092.4 m19,113.1 m
Table 9. Minimum cost distance statistics between settlements III.
Liaozuzhou City (Second-Level)Qingzhou City (Second-Level)
Uulanbaiqi City19,148,80018,280,200
Disclaimer/Publisher’s Note: The statements, opinions and data contained in all publications are solely those of the individual author(s) and contributor(s) and not of MDPI and/or the editor(s). MDPI and/or the editor(s) disclaim responsibility for any injury to people or property resulting from any ideas, methods, instructions or products referred to in the content.