Article

An Assessment of the Energy Performance and Initial Investment Cost of SDHW Systems: A Case Study of University Dormitory in Northern Cyprus

by
Alpay Akgüç
1,* and
Dilek Yasar
2
1
Faculty of Architecture, Istanbul Bilgi University, Kazim Karabekir Cad., No: 2/13, Eyupsultan, 34060 Istanbul, Türkiye
2
Faculty of Architecture and Design, Istanbul Aydın University, Besyol, Inonu Cad., No: 38, Kucukcekmece, 34295 Istanbul, Türkiye
*
Author to whom correspondence should be addressed.
Buildings 2025, 15(17), 3042; https://doi.org/10.3390/buildings15173042
Submission received: 26 July 2025 / Revised: 19 August 2025 / Accepted: 21 August 2025 / Published: 26 August 2025
(This article belongs to the Section Building Energy, Physics, Environment, and Systems)

Abstract

This simulation-based theoretical study addresses a critical gap by jointly assessing the technical performance and long-term economic sustainability of Solar Domestic Hot Water (SDHW) systems in economically volatile, import-dependent regions. Focusing on a fully operational system in a 700-bed dormitory at Middle East Technical University, Northern Cyprus Campus, TRNSYS 17 simulations were combined with a 15-year (2010–2024) cost trend analysis considering currency depreciation and construction price escalation. Results demonstrate that collector fluid temperatures exceeded 80 °C from April to October, maintaining domestic hot water above 60 °C for over seven months annually and reducing auxiliary heating demand by approximately 50%, translating into substantial annual energy savings. Economically, system component costs rose by 26–75 times, with circulation pumps showing the steepest increase (75×), highlighting vulnerabilities in import-dependent supply chains. Despite these cost escalations, the region’s high solar irradiation enables a competitive long-term investment profile, with potential payback periods remaining attractive under supportive policy frameworks. The originality of this work lies in its dual-focus methodology integrating performance modeling with economic resilience analysis, providing actionable insights for policymakers, designers, and investors in Mediterranean and similar climates seeking to balance renewable energy adoption with financial viability.

Graphical Abstract

1. Introduction

1.1. SDHW Systems in the Context of the Global Energy Crisis and Current Status of Northern Cyprus

Given the limited reserves of fossil fuel and adverse environmental effects associated with their use, including air pollution, ozone depletion, and global warming, it is of critical importance to promote renewable energy initiatives [1]. Solar energy has been considered one of the most promising renewable energy sources and plays a critical role in the management of long-term energy crises [2]. Solar water heaters (SWH) stand out as a significant technology leap, capturing thermal energy via solar radiation and transferring it to water [3]. The performance of solar domestic hot water (SDHW) systems is basically associated with the amount of energy captured by the solar collectors and transferred to the storage tank [4]. These systems provide significant energy savings and help reduce dependence on fossil fuels such as natural gas in a range of buildings, including hotels, sports facilities, and residential buildings, which are marked with a high demand for hot water. Recently, the increased use of electric heat pumps as auxiliary heaters has been associated with a further improvement in system efficiency and sustainability.
SDHW systems are considered an alternative to conventional fuel-based hot water systems and can be operated in hybrid mode, i.e., in combination with conventional systems when solar radiation is insufficient [5]. There is an increasing rate of development of solar energy technologies, along with wider market adoption [6]. A Canadian study by Ghorab et al. [7] reported that solar water heating systems achieved a 69.4% higher energy contribution compared to natural gas. Consistently, energy analyses in industrial facilities indicated that solar collectors could provide 34.4% of the energy required for hygienic hot water production [8]. Obalanlege et al. [9] investigated the optimal configuration of a hybrid photovoltaic–thermal (PVT) solar heat pump system for a United Kingdom residence and concluded that a 12-panel configuration was the most efficient option in terms of economic feasibility.
Long-term performance of SDHW systems is usually analyzed by using mathematical modeling tools [10]. Accordingly, TRNSYS version 17.1 software is a widely used modeling tool for the simulation of solar energy systems [11]. With its modular structure, TRNSYS allows a detailed analysis of system components and is leveraged as an effective tool for the simulation of both thermal and photovoltaic systems [12]. A number of previous studies used TRNSYS for modeling purposes [13,14,15,16,17,18,19]. Nevertheless, alternative modeling tools also provide significant contributions to the performance analysis of SDHW systems along with TRNSYS. These software solutions allow energy efficiency analyses for different climatic conditions. For instance, EnergyPlus is an open-source building energy simulation software developed and maintained under the sponsorship of the U.S. Department of Energy (DOE). The software enables detailed modeling of heating, cooling, ventilation, indoor climatic conditions, and energy consumption [20,21]. It is primarily developed at the Lawrence Berkeley National Laboratory (Berkeley, California, USA) and the National Renewable Energy Laboratory (Golden, Colorado, USA), with the DOE headquarters located in Washington, D.C., USA.Polysun is a commercial software tool used for the dynamic simulation and optimization of solar thermal, photovoltaic, and hybrid configurations; recent studies have employed it for validation and comparative analyses in applications such as industrial process heat [22,23]. Polysun was originally conceived and developed by the Institute for Solar Technology (SPF) at the University of Applied Sciences Rapperswil (Rapperswil, Switzerland) and has since been further refined, expanded, and maintained by Vela Solaris AG, a Swiss-based company headquartered in Winterthur. The System Advisor Model (SAM), developed by the National Renewable Energy Laboratory (NREL), is a techno-economic modeling tool that integrates both technical performance and financial feasibility assessments for a wide range of renewable technologies, including photovoltaic and solar thermal systems; recent research has utilized various SAM submodules (e.g., energy storage, PV) for in-depth performance evaluations [24,25,26].
Previous studies have compared different modeling techniques for the thermal efficiency analysis of SDHW systems in Cyprus and other Mediterranean climates. In this context, Gomariz, López, and Muñoz [27] investigated the performance of low-flow solar thermal systems in water heating applications and the effects of climatic factors using the Polysun software. Rodriguez-Pastor, Becerra, and Chacartegui [28] examined the compatibility of residential solar thermal systems with hybrid organic Rankine cycle (ORC) technology for domestic hot water (DHW) production using the EnergyPlus software. Their study demonstrated that high efficiency could be achieved in both domestic hot water and electricity production when combining solar thermal systems with hybrid ORC technology in temperate and sunny climatic regions, such as the Mediterranean. Harkouss, Fardoun, and Biwole [29] explored the optimization of various components, including solar energy, energy storage systems, and building energy management, to enhance energy efficiency in the design of net-zero energy buildings. They suggested that solar thermal systems operated with high efficiency to meet water heating needs in such climates and provided significant energy savings, highlighting their role in net-zero energy buildings in regions with high solar availability, particularly the Mediterranean. Notwithstanding the above, previous studies were generally simulation- and modeling-based and involved uncertainties and limitations in generalization, as they were not validated through real-world application.
There is a limited body of research specifically examining SDHW systems within the context of Cyprus. Despite the country’s heavy reliance on imported energy—stemming from the absence of indigenous fossil fuel resources—Cyprus benefits from a high solar radiation potential [30]. In this regard, Kalogirou and Papamarcou [31] modeled a hybrid photovoltaic–thermal (PV/T) solar water heating system in Nicosia, Cyprus, using the TRNSYS simulation tool and identified the optimum water flow rate as 25 lt/h. Their study further reported that the hybrid system achieved an annual mean efficiency of 31.7%. In a complementary study, Michopoulos et al. [32] demonstrated that integrating air-source heat pumps with flat-plate solar collectors resulted in the lowest primary energy consumption, highlighting the potential of hybrid configurations to enhance energy efficiency within the Cypriot context.
Unlike the majority of existing studies on Solar Domestic Hot Water (SDHW) systems—which primarily rely on short-term simulation outputs without empirical validation—this research integrates a longitudinal, component-level investment cost analysis with a performance assessment based on TRNSYS modeling. By examining the period between 2010 and 2024, it captures the dynamic interplay between macroeconomic volatility, foreign exchange fluctuations, construction sector cost escalations, and renewable energy adoption in a geopolitically sensitive and economically fragile region, namely Northern Cyprus. To the best of the authors’ knowledge, no prior study has systematically quantified the long-term evolution of SDHW system investment costs under such specific regional economic conditions while simultaneously evaluating technical performance. Furthermore, by situating the analysis within the broader context of regional energy dependency, climate characteristics, and market isolation, this study offers a multidimensional framework that bridges technical modeling with techno-economic resilience assessment. This dual emphasis not only addresses the existing gap in empirical cost–performance correlation studies but also provides policymakers, investors, and engineers with a decision-making tool tailored to regions where renewable energy adoption is constrained by economic instability and structural import dependencies.

1.2. The Current Economic Situation of Türkiye and North Cyprus

Türkiye has adopted an unconventional economic policy of lowering interest rates despite high inflation. In 2022, with an inflation rate of 85%, the Central Bank of the Republic of Türkiye reduced the benchmark one-week repo rate from 14% to 9% [33]. This policy contributed to a 200% depreciation of the Turkish lira against the U.S. dollar and the euro between 2012 and 2022, with more than a 30% devaluation occurring within the first ten months of 2022 alone [34]. The fragility of Türkiye’s economy has been further exacerbated by major shocks, including the COVID-19 pandemic [35] and the devastating earthquakes on 6 February 2023 in Kahramanmaraş and 20 February 2023 in Hatay, which caused over 50,000 fatalities, displaced 3.3 million people, and resulted in an estimated USD 81.5 billion in rehabilitation and reconstruction costs, as reported by the Government of Türkiye with support from the European Union, the United Nations, and the World Bank Group [36]. Figure 1 illustrates the long-term trend in the Turkish lira–euro exchange rate from 1990 to mid-2024.
Türkiye is the primary trading partner of the Turkish Republic of Northern Cyprus [38], accounting for approximately 60% of its imports and 50% of its exports in recent years [39]. The TRNC economy is highly dependent on imports, with both production inputs and consumer goods sourced largely from abroad. Given that the local currency is the Turkish lira, exchange rate depreciation directly impacts production costs and overall price levels [39,40]. In 2020, the highest real growth rate was recorded in the “Ownership of Dwellings” category at 3.6%, while most other sectors experienced contraction [40].
The TRNC’s export sector is significantly constrained by isolation policies and international trade restrictions. The series of rulings in the Anastasiou (C-432/92) case by the Court of Justice of the European Union established restrictive precedents regarding certification and recognition requirements, effectively limiting the export of certain TRNC-origin goods to the EU [41]. Nevertheless, Türkiye remains a vital alternative market. In the construction sector, both materials and labor are largely supplied from Türkiye, and fluctuations in foreign exchange rates (EUR and USD) have a direct effect on construction costs. Table 1 presents selected statistical data on Türkiye–TRNC trade, while Table 2 shows the annual average euro exchange rates used in cost calculations.
These exchange rate fluctuations and cost escalations in the construction sector directly influence investment trends in solar domestic hot water (SDHW) systems, which are generally regarded as long-term capital investments. Economic stability, expanded financing opportunities, and increased incentives for renewable energy are likely to have a positive impact on future SDHW adoption in both Türkiye and the TRNC.

2. Method of the Study

2.1. Research Approach and Design

This study adopts a holistic mixed-method research design that integrates the technical performance assessment of energy systems with an economic feasibility analysis. The research approach combines simulation-based modeling with quantitative analysis of economic data, with the aim of synthesizing technical and financial evaluations within an interdisciplinary framework. A case study strategy is employed, focusing on an actively operating Solar Domestic Hot Water (SDHW) system installed at the Northern Cyprus Campus of Middle East Technical University.

2.2. Simulation Process and Energy Performance Analysis

The analysis of energy performance in this study was conducted using TRNSYS 17 (Transient System Simulation Tool), an internationally recognized dynamic simulation environment for modeling renewable energy systems. The software was originally developed at the University of Wisconsin–Madison, USA and is currently maintained and distributed by Thermal Energy System Specialists (TESS LLC, Madison, Wisconsin, USA) in collaboration with TRANSSOLAR Energietechnik GmbH, Stuttgart, Germany. TRNSYS is particularly well-suited for simulating solar thermal applications due to its modular structure, which allows for the independent modeling and detailed parameterization of system components such as collectors, storage tanks, heat exchangers, and auxiliary heating units. TRNSYS version 17.1 was selected for this study based on its proven reliability, adaptability to diverse climatic conditions, and ability to handle complex system interactions within transient thermal environments. Additionally, its extensive validation in peer-reviewed research on solar domestic hot water (SDHW) systems supports its methodological robustness and scientific credibility. The simulation process in this study followed a structured sequence involving the integration of local climate data, system configuration, component specification, and evaluation of performance outputs.
Climatic Data: The climatic data used in the simulation were obtained from a Typical Meteorological Year (TMY) file [43] generated from multi-year weather records for the region between 2004 and 2018. The TMY dataset was created by selecting representative months from different years to form an “average” year, thereby eliminating anomalies caused by extreme weather events. This approach provides a more reliable basis for energy performance simulations than a Reference Year (RY), which relies on data from a single year and may reflect atypical climatic conditions [44].
The meteorological dataset used in the simulations was obtained from the Typical Meteorological Year (TMY) database. As location-specific TMY data for Güzelyurt—where the campus is situated—were not available, the Larnaca station (34°52′30.42″ N, 33°37′29.46″ E), which exhibits similar climatic characteristics, was selected as a proxy. This choice was based on the comparability of solar radiation levels and sunshine duration between the two locations, ensuring realistic and regionally representative simulation outcomes.
Modeling Parameters: All major components of the system—including 84 flat-plate solar collectors, a circulation pump, storage tanks, an auxiliary heating boiler, and a heat exchanger—were explicitly defined and modeled within the TRNSYS environment. The entire energy flow process, from solar energy collection at the collector level to delivering heated water to end users, was meticulously simulated and analyzed to ensure an accurate representation of system behavior under dynamic operating conditions.
Energy Consumption and Gain Calculations: The system’s useful energy output was evaluated on a monthly and annual basis, taking into account parameters such as solar irradiance levels, ambient temperature, working fluid temperatures, and thermal losses in the heat exchanger. The auxiliary heating demand was calculated for periods when the water temperature dropped below 60 °C, thereby allowing the identification of time intervals during which the system could operate solely on solar energy while meeting the full demand.
In order to quantify these energy flows, the SDHW system was modeled in TRNSYS version 17.1, where each system component is represented by a set of established thermodynamic equations embedded in the component library [45]. The governing formulations of the principal components are presented below, with the definition and units of variables explicitly provided under each equation.
The flat-plate collector component models the thermal performance of various collector types based on theoretical principles. The overall collector array may comprise modules connected in both series and parallel configurations. The thermal performance of the array is determined by the number of modules arranged in series as well as the individual characteristics of each module. For the flat-plate collector, the governing equation (Equation (1)) is utilized to calculate the useful heat gain,
Q u = F R ( τ α ) n F R ·   U L ·   ( T i T a ) I T
Qu: useful heat gain [W],
FR: overall collector heat removal efficiency factor [-],
τ: short-wave transmittance of the collector cover(s) [-],
α: short-wave absorptance of the absorber plate [-],
(τα)n: (τα) at normal incidence,
UL: overall thermal loss coefficient of the collector per unit area [kJ/h.m2.K],
Ti: inlet temperature of fluid to collector [°C],
Ta: outlet temperature of fluid from collector [°C],
IT: global radiation incident on the solar collector (tilted surface) [kJ/h.m2].
The thermal performance of a fluid-filled sensible energy storage tank with thermal stratification can be modeled by representing the tank as n (≤100) fully mixed, equal-volume segments. The degree of stratification is governed by the value of n. When n = 1, the storage tank is represented as a single fully mixed volume, and stratification effects are not accounted for. Using Equation (2) below expresses an energy balance written about the storage tank,
M i · C p f · d T i d t = α i · m h ˙ · C p f ·   T h T i + β i · m L ˙ · C p f ·   T L T i + U A i · T L T i
Mi: mass of fluid in the ith section [kg],
Cpf: specific heat of the tank fluid [J/kg.K],
Ti: temperature of the ith tank segment [°C],
αi: a control function defined by αi = 1 if i = Sh; 0 otherwise,
Sh: number of the tank segment to which the fluid from the heat source enters 1 ≤ Shn,
h: fluid mass flow rate to tank from the heat source [kg/s],
Th: temperature of the fluid entering the storage tank from the heat source [°C],
βi: a control function defined by βi = 1 if i = Sh; 0 otherwise,
L: fluid mass flow rate to the load and/or of the makeup fluid [kg/s],
TL: temperature of the fluid replacing that extracted to supply the load [°C],
UAi: conductance for heat loss to gas flue for node i [W/K].
The pump model computes a mass flow rate using a variable control function, which must be between 0 and 1, and a fixed (user-specified) maximum flow capacity. This flow rate is calculated by using Equation (3), below,
m ˙ o = γ · m ˙ m a x
o: outlet mass flow rate [kg/s],
γ: control function (0 ≤ γ ≤ 1),
max: outlet mass flow rate [kg/s].
A boiler is modeled to increase the temperature of a flow stream through internal control, external control, or a combination of both. The system is designed to supply heat to the flow stream at a rate up to, but not exceeding, a user-defined maximum value (Qmax), provided that the control function (γ) is equal to 1 and the outlet temperature remains below the setpoint temperature (Tset). It should be noted that the actual maximum thermal energy transferred to the flow stream is not Qmax itself, but rather ηboiler × Qmax.
Q b = m ˙ · C p f ·   T s e t T i + U A · T o + T i 2 T e n v η b o i l e r
Qb: required heating rate including efficiency effects [kJ/h],
: mass flow rate [kg/h],
Cpf: specific heat of the tank fluid [J/kg.K],
Tset: set temperature of heater internal thermostat [°C],
Ti: fluid inlet temperature [°C],
To: fluid outlet temperature [°C],
UA: overall loss coefficient between the heater and its surroundings during operation [kJ/h],
Tenv: temperature of heater surroundings for loss calculations [°C],
ηboiler: efficiency of boiler.
The heat exchanger is modeled using the effectiveness–minimum capacitance approach. Within this framework, the user specifies the heat exchanger’s UA value along with the inlet conditions. The model subsequently identifies whether the cold (load) side or the hot (source) side has the minimum capacitance rate and, based on this determination, calculates the effectiveness according to the defined flow configuration and the provided UA. Finally, the outlet conditions of the heat exchanger are computed for all flow configurations using Equation (5), as presented below.
Q T = ε · C m i n · ( T h i T c i )
QT: heat-transfer rate [W],
ε: heat exchanger effectiveness [-],
Cmin: minimum heat capacity rate [W/K],
Thi: hot fluid inlet temperature [°C],
Tci: cold fluid inlet temperature [°C].
In thermal systems, the use of mixers and diverters, often governed by external control, is frequently required. Equations (6)–(8) are employed to determine the outlet temperature, humidity, and mass flow rate of the fluid, as presented below.
T o = m ˙ 1 · T 1 + m ˙ 2 · T 2 m ˙ 1 + m ˙ 2
w o = m ˙ 1 · w 1 + m ˙ 2 · w 2 m ˙ 1 + m ˙ 2
m ˙ o = m ˙ 1 + m ˙ 2
To: temperature of outlet fluid [°C],
1: mass flow rate at position 1 [kg/h],
2: mass flow rate at position 2 [kg/h],
T1: temperature at position 1 [°C],
T2: temperature at position 2 [°C],
wo: humidity ratio of outlet fluid [%],
w1: humidity ratio at position 1 [%],
w2: humidity ratio at position 2 [%],
o: humidity ratio of outlet fluid [kg/h].
The controller generates a control function, γ0, which can assume values of either 0 or 1. The value of γ0 is determined based on the difference between the upper and lower temperatures (TH and TL) relative to the dead-band temperature differences (ΔTH and ΔTL). The updated value of γ0 depends on the preceding state of γi (i.e., whether γi = 0 or 1). Typically, the controller is configured with γ0 linked to γi, thereby producing a hysteresis effect. Mathematically, the control function is expressed as follows:
If the controller was previously on:
If γi = 1 and ΔTL ≤ (THTL), γ0 = 1
If γi = 1 and ΔTL > (THTL), γ0 = 0
If the controller was previously off:
If γi = 0 and ΔTH ≤ (THTL), γ0 = 1
If γi = 0 and ΔTH > (THTL), γ0 = 0
The pipe component models the thermal behavior of fluid flow in a pipe or duct by representing the stream as variable-sized fluid segments. As new fluid enters, it displaces the existing segments accordingly. The temperature of each newly formed segment is assigned to that of the incoming fluid. The pipe outlet is represented by the collection of segments displaced, or “pushed out”, by the inlet flow. The average outlet temperature is then determined as the mass-weighted average of the exiting segments, as expressed in Equation (13) below.
T o = 1 m ˙ t j = 1 k 1 M j · T j + a · M k · T k
where a and k must satisfy 0 < a < 1,
To: outlet temperature of fluid in pipe [°C],
: mass flow rate of fluid [kg/h],
Δt: simulation time step [h],
j, k: refer to segments of fluid in pipe,
M: mass of fluid inside the pipe [kg],
T: temperature of fluid [°C].

2.3. Usage Scenario and Domestic Hot Water Consumption Profile

Based on the established user profile of the dormitory building, the daily domestic hot water (DHW) consumption was estimated at 60 lt/person/day, and the total demand was calculated accordingly. The system design parameters were based on four-person dormitory rooms and shared sanitary facilities serving a total of approximately 28 occupants. To reflect temporal fluctuations and variations in user behavior regarding hot water usage, a usage factor of 0.5 was applied. These input parameters were subsequently used to compute the annual hot water flow rates, which were integrated into the TRNSYS simulation model to ensure that system performance predictions closely represented realistic operating conditions under representative occupancy scenarios.
In the current literature, when comparing the performance of Solar Domestic Hot Water (SDHW) systems with hybrid photovoltaic–thermal (PV-T) and heat pump systems, hybrid PV-T + heat pump configurations have been reported to provide 5–10% higher annual efficiency, albeit with system costs approximately 20–30% higher [46]. In this context, single-layer SDHW systems offer the advantages of lower investment cost and simpler installation due to their less complex piping arrangements, while still delivering competitive energy savings depending on climatic conditions and usage profiles [47,48].
When specifically evaluated for regions such as Northern Cyprus, which has a Mediterranean climate and is dependent on foreign currency for energy inputs, SDHW systems are considered more suitable in terms of technical and economic sustainability due to their lower maintenance requirements, less complex control mechanisms, and the advantage of being operable by locally available technical staff [49]. Conversely, hybrid PV-T + heat pump systems can be an attractive alternative for long-term investments when energy autonomy and maximum efficiency are prioritized; in particular, under state-supported incentive schemes, their payback periods can be reduced to levels comparable with SDHW systems [50].

2.4. Economic Analysis and Cost Variation Model

The economic assessment of the system was conducted for four distinct years—2010, 2015, 2019, and 2024—within a comparative evaluation framework. These years were deliberately selected to capture key temporal milestones in the economic context: 2010 marks the year when the system was initially commissioned; 2015 serves as an intermediate reference point to observe mid-term cost evolution; 2019 represents the pre-pandemic economic conditions; and 2024 reflects the post-pandemic period, characterized by inflationary pressures, currency fluctuations, and construction sector volatility. Within this scope, the unit and total costs of the main system components—including solar collectors, boilers, storage tanks, circulation pumps, and piping systems—were analyzed for each target year. The cost data were sourced from the Construction and Assembly Unit Price Guide published by the Ministry of Environment, Urbanization, and Climate Change of the Republic of Türkiye. To ensure comparability over time, monetary values were converted into both Turkish lira (TRY) and euro (EUR) using the respective annual average exchange rates.
Accordingly, the initial investment cost of each system component was calculated using the following equation (Equation (14)):
C i , y T R Y = U C i , y T R Y · N i
where
C i , y T R Y : total investment cost of component i in year y [TRY],
U C i , y T R Y : labor-inclusive unit cost of component i in year y [TRY/unit],
N i : number of components i used in the system.
The conversion of the total investment cost from Turkish lira to euro was expressed as in Equation (15) below.
C i , y E U R = C i , y T R Y E R y
where
C i , y E U R : total investment cost of component i in year y [EUR],
E R y : annual average exchange rate in year y [TRY/EUR].
Thus, the total system investment cost in a given year is obtained by summing over all components as presented in Equations (16) and (17) below.
C s y s ,   y T R Y = i = 1 n C i , y T R Y
C s y s ,   y E U R = i = 1 n C i , y E U R
where
C s y s ,   y T R Y : total system cost in year y [TRY],
C s y s ,   y E U R : total system cost in year y [EUR],
n: total number of system components.
This set of equations provides a systematic and reproducible basis for the cost variation analysis across different economic conditions. In addition to this, this approach enabled a detailed understanding of how macroeconomic variables—such as inflation, currency devaluation, and material cost escalation—have influenced the investment profile of solar domestic hot water systems over time.

2.5. Validity and Limitations

The methodological approach employed in this study was grounded in both established standards and up-to-date data sources, with the aim of enhancing the accuracy of the energy simulation outputs and the economic analysis. Nevertheless, certain limitations should be acknowledged:
The reliability of the simulation results is inherently dependent on the accuracy of the input climatic data and system parameters within the TRNSYS software environment.
The cost data used in the economic evaluation were obtained from publicly available pricing guidelines; however, short-term market fluctuations—such as abrupt exchange rate variations, import tariffs, and localized supply chain disruptions—were not explicitly incorporated into the analysis.
As the system was specifically modeled for a single dormitory building, the generalizability of the findings to buildings with different typologies and operational profiles may be constrained.
These limitations, while not undermining the overall validity of the study, define the scope of applicability and highlight areas for further research in both more diverse operational and economic contexts.

3. SDHW System Description

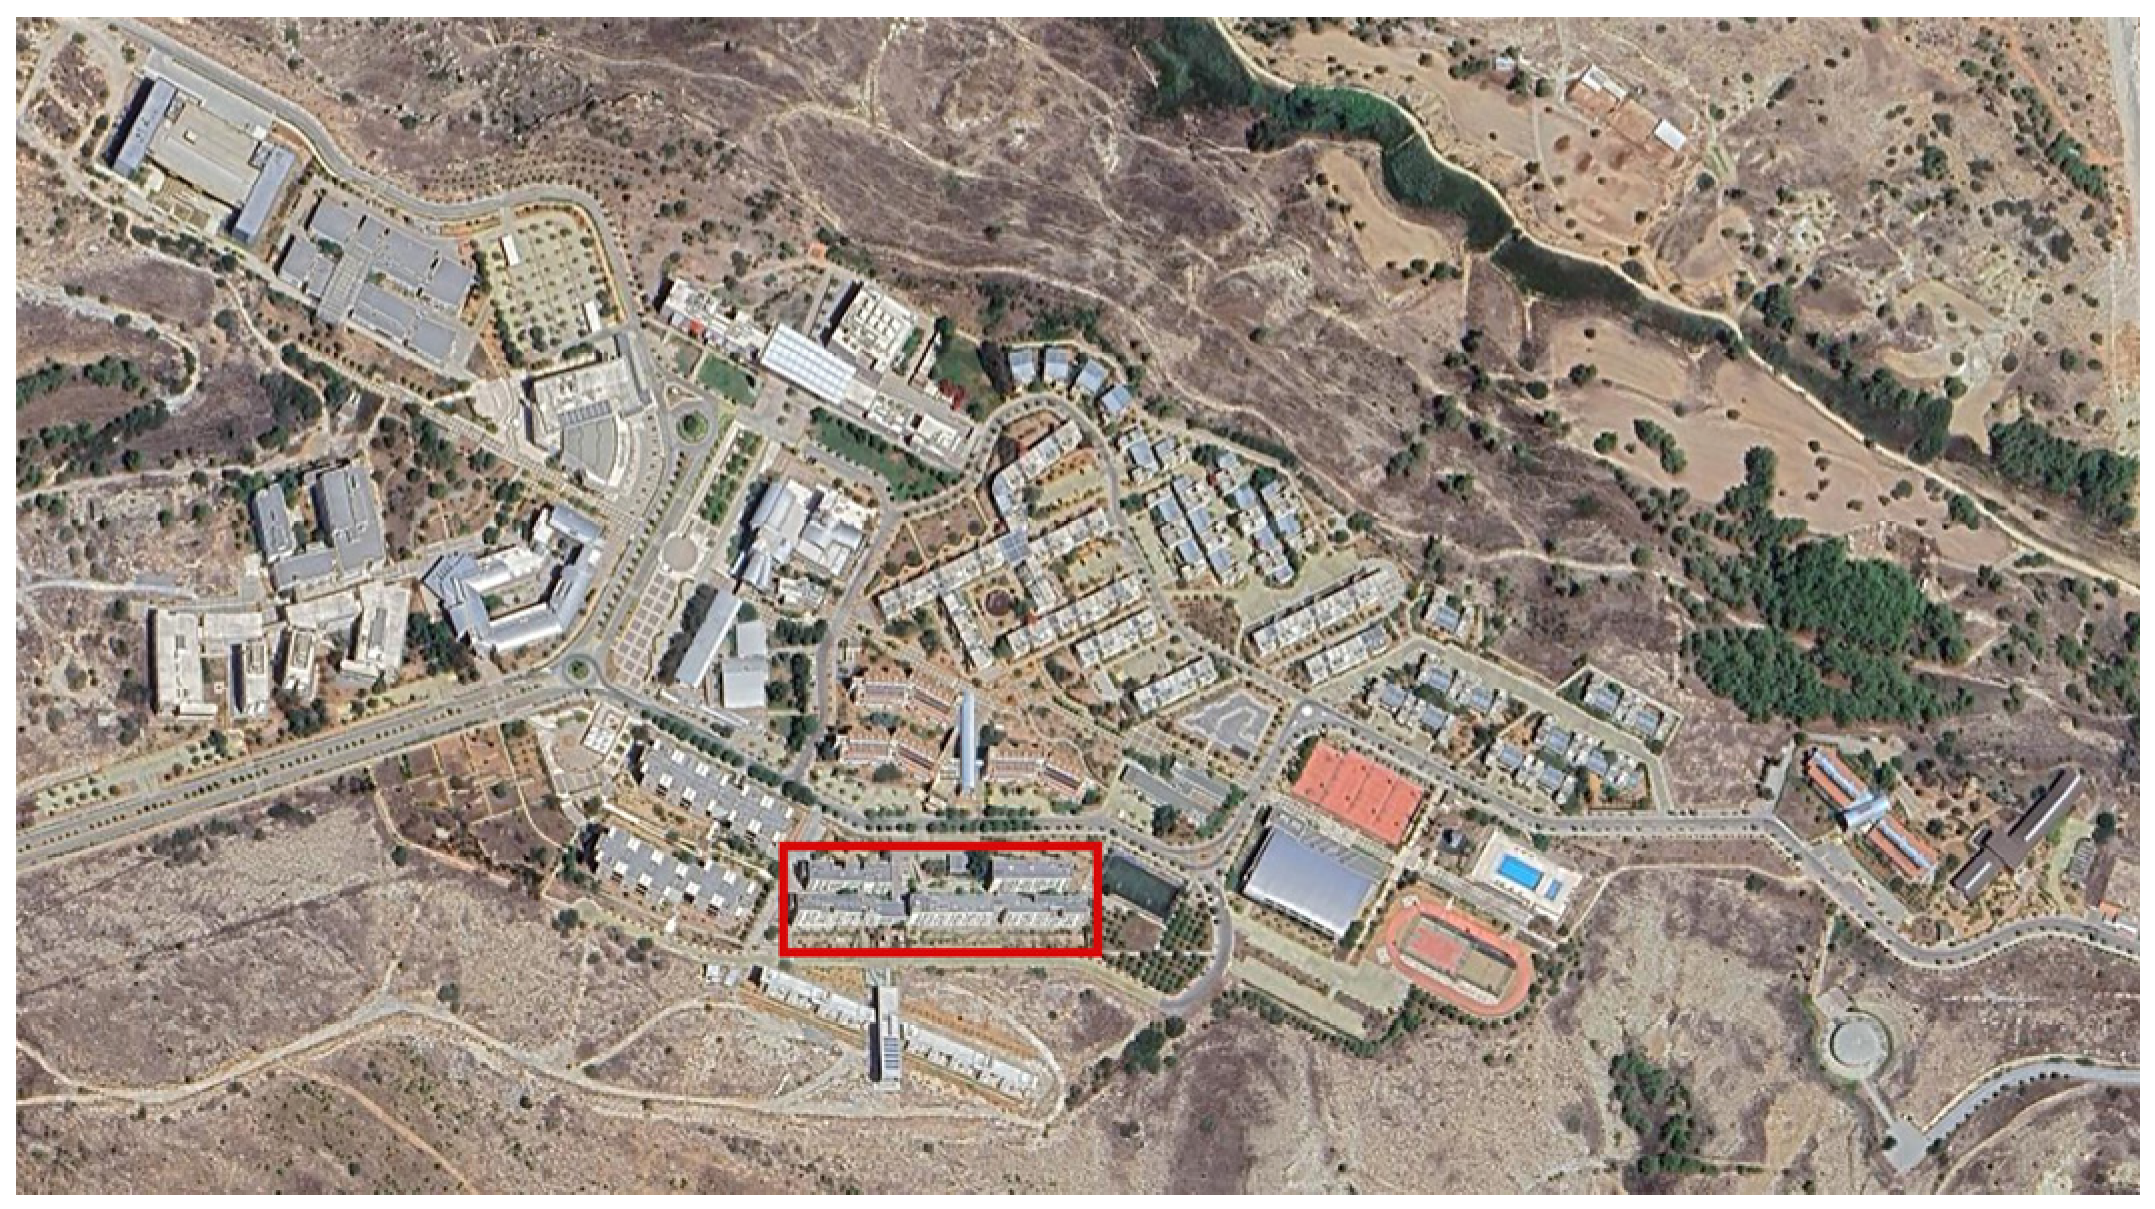
METU Northern Cyprus Campus is the first overseas campus of a Turkish university and was established upon the invitation of the governments of the Republic of Türkiye and the Turkish Republic of Northern Cyprus in 2000. An aerial view of the METU Northern Cyprus Campus is shown in Figure 2.
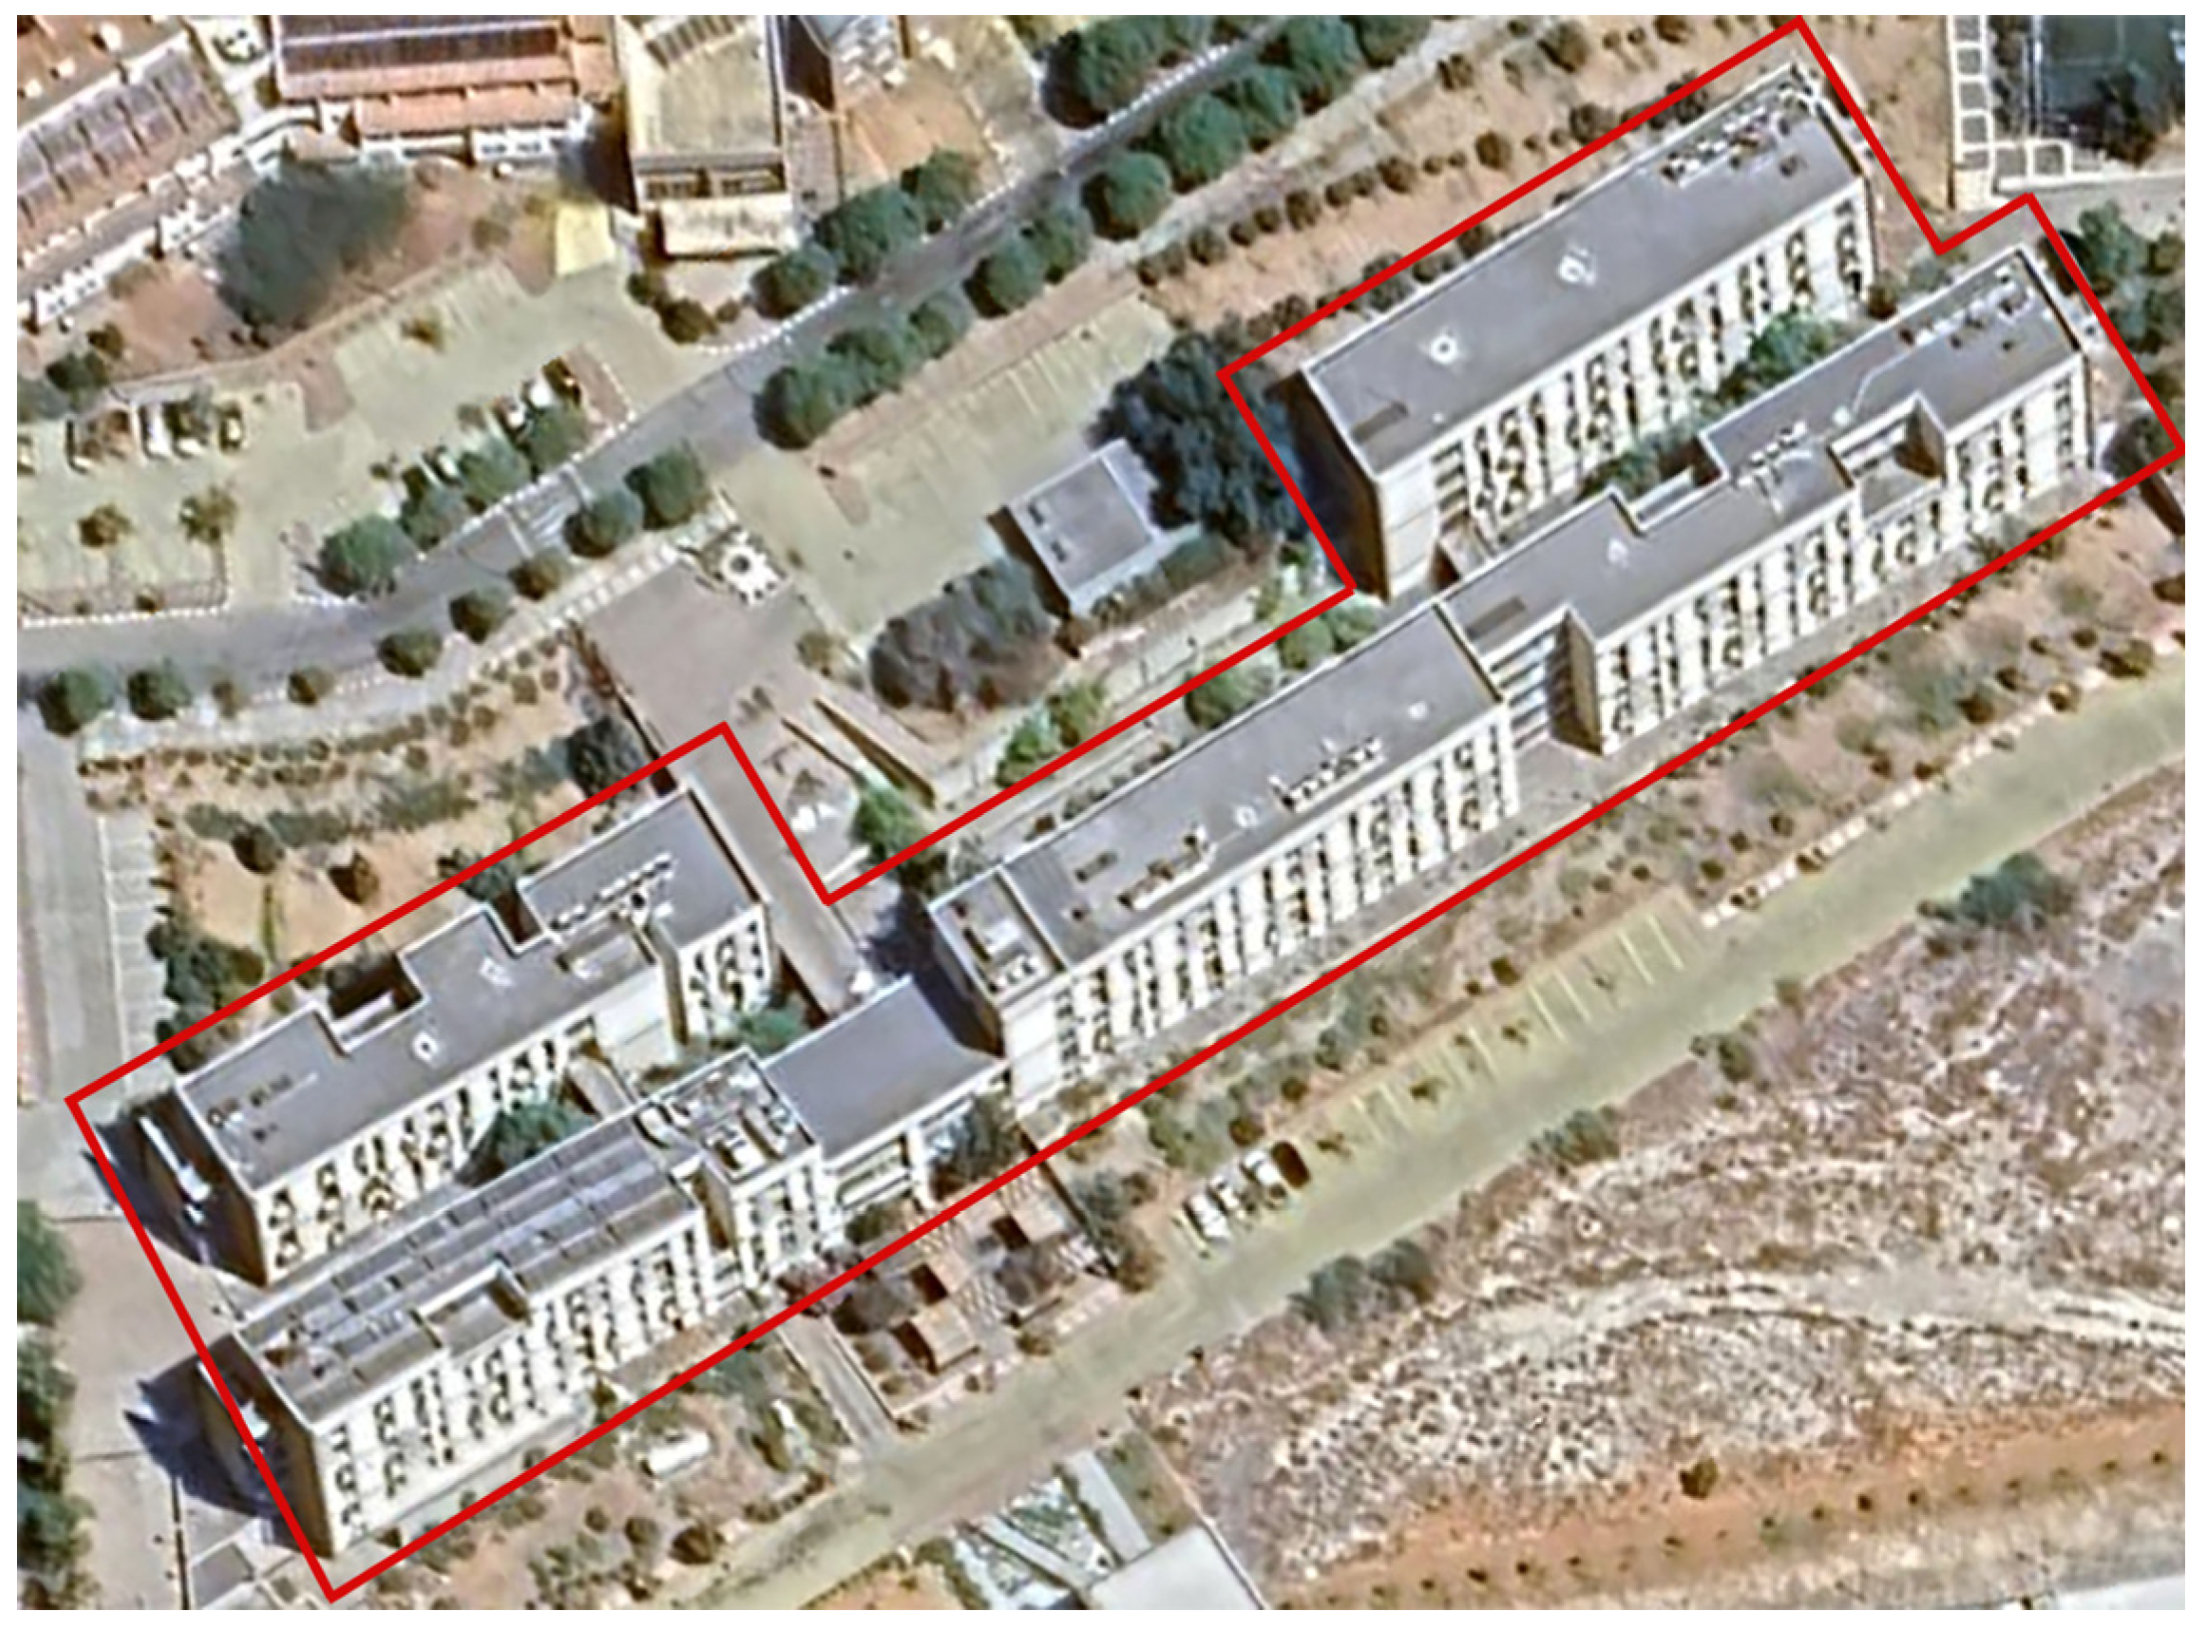
METU Northern Cyprus Campus dormitories are furnished with state-of-the-art technology, offering students a safe, comfortable, and well-maintained environment. In the 3rd dormitory, rooms are designed to accommodate either two or four students (double-occupancy rooms). The WCs, bathrooms, and kitchens are available for common use, serving approximately 26–32 persons. Additionally, there are study rooms on each floor. Other facilities and services are similar to those in the 1st and 2nd dormitories [52]. An exterior view of the 3rd dormitory at the METU Northern Cyprus Campus is shown in Figure 3 below.
The baseline water demand for the bathroom sink, shower, and kitchen sink in the wet areas was established to determine the hot water requirements of the 3rd dormitory. Accordingly, the required flow rate for the DHW demand was calculated and is presented by area of use in Table 3 below. The number of fixtures indicated in this table refers to the quantities of bathroom sinks, showers, and kitchen sinks in the dormitory building, as specified in its mechanical installation project. The DHW demand of a fixture per hour is based on reference values provided in the book Technical Principles for Preparing Sanitary Installation Projects, published by the Istanbul Branch of the Chamber of Mechanical Engineers of TMMOB [43], which was used during the preparation of the building’s mechanical installation design. The standards TS 1258—Rules for Calculation for Installation Water Supply in Buildings [53] and TS EN 12056—Gravity Drainage Systems inside Buildings [54] form the foundation of this book, serving as essential references for the preparation of sanitary installation projects. The total DHW demand of the building (lt/h) was obtained by multiplying the number of fixtures by the corresponding DHW demand per hour for each fixture type and summing the resulting products.
For the bathroom sinks, showers, and kitchen sinks listed in this table, the required water temperature for users was considered to be up to 60 °C. This temperature was adopted in accordance with the TS 1258—Rules for Calculation for Installation Water Supply in Buildings standard [53]. This standard has been used for calculating per capita water demand in Türkiye since 1983.
A utilization factor of 0.5 was applied to the total DHW demand to determine the maximum hot water flow rate, reflecting the assumption that the system is not operated at full capacity throughout the year. This factor was adopted from the TS 1258—Rules for Calculation for Installation Water Supply in Buildings standard. The maximum hot water flow rate was calculated by multiplying the utilization factor by the total DHW demand, as shown in Equation (18).
Maximum hot water flow rate = 0.5 × 29,580 = 14,790 lt/h,
Therefore, the maximum hot water flow rate was set to 15,000 lt/h. The system was designed as a central system for the dormitory building. The storage tanks in the primary and secondary lines, supplied by flat-plate collectors, are integrated into the hot water boiler system. Eighty-four flat-plate collectors were installed horizontally in the system. The technical specifications of the collectors are presented in Table 4.
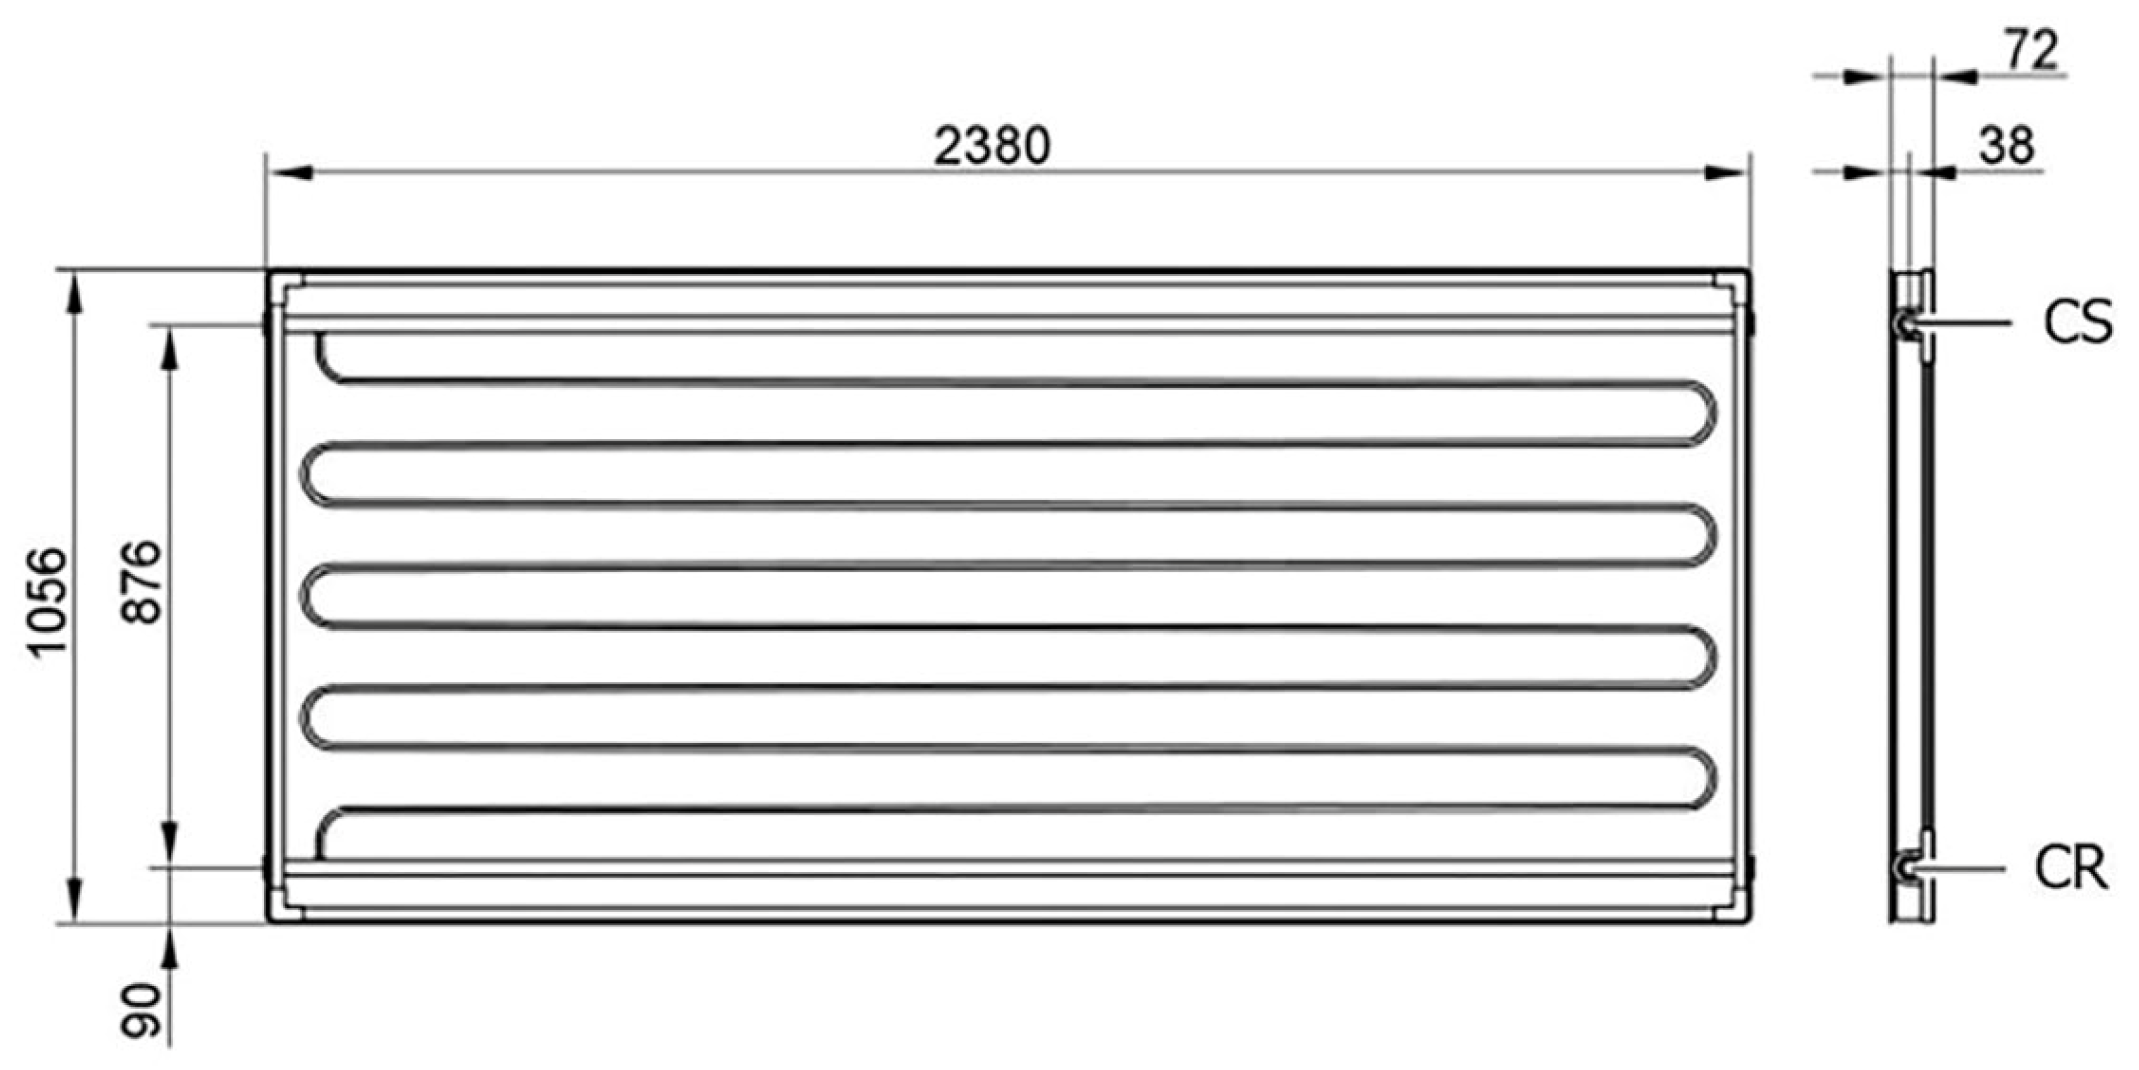
The main component of the collector is the selective absorber surface, coated with copper or aluminum plates. This design ensures longer service life, higher absorption of solar radiation, and lower emissivity of thermal radiation. Lower reflective losses are achieved by the tempered solar glass panel with reduced iron content. The 3-mm solar glass is set into the collector frame with a continuous profiled seal, preventing water penetration into the collector. The galvanized ground sheet of the collector is made of corrosion-resistant stainless steel and is fully impenetrable. The collector is insulated with a melamine resin foam or mineral fiber blanket, providing higher thermal insulation and thereby minimizing radiative losses. Up to ten collectors can be joined in series using plug-in connection kits. The plug-in connection kits are made of stainless steel and feature flexible copper piping with sealed connections. The dimensions of the collector in the system are illustrated in Figure 4.
The schema of the collector layout is shown in Figure 5. In the system, three collectors are connected in series and the flow rate through each collector is 0.01283 lt/h.
Located between the primary storage tank line and the collector line, the circulation pump had a flow rate of 5000 lt/h, delivering a 50% propylene glycol–water mixture to the collector line through a 65 mm distribution pipe. The fluid, which is separated for each collector, is then combined as heated fluid in a pipe of the same diameter and passes through the plate heat exchanger, facilitating heat transfer between the storage tanks and the collector line. The efficiency of the plate heat exchanger varies between 70% and 85%, depending on the inlet water temperature. The technical data of the heat-transfer fluid are presented in Table 5.
The storage capacity of the SDHW system was designed in two parallel parts:
  • Primary solar side: The primary line includes three storage tanks, each with a capacity of 5000 lt, designed to store DHW heated by the solar collectors via the heat-transfer fluid circulating through the plate heat exchanger. This configuration yields a total primary storage capacity of 15,000 lt, ensuring that the high hot-water flow rate demand (14,790 lt/h) can be buffered and managed effectively.
  • Secondary boiler-assisted side: On the auxiliary line, which is backed up by boilers, an additional three storage tanks are employed, each again with a 5000 lt capacity. This provides a further 15,000 lt of storage, enabling a continuous hot-water supply during periods of insufficient solar radiation.
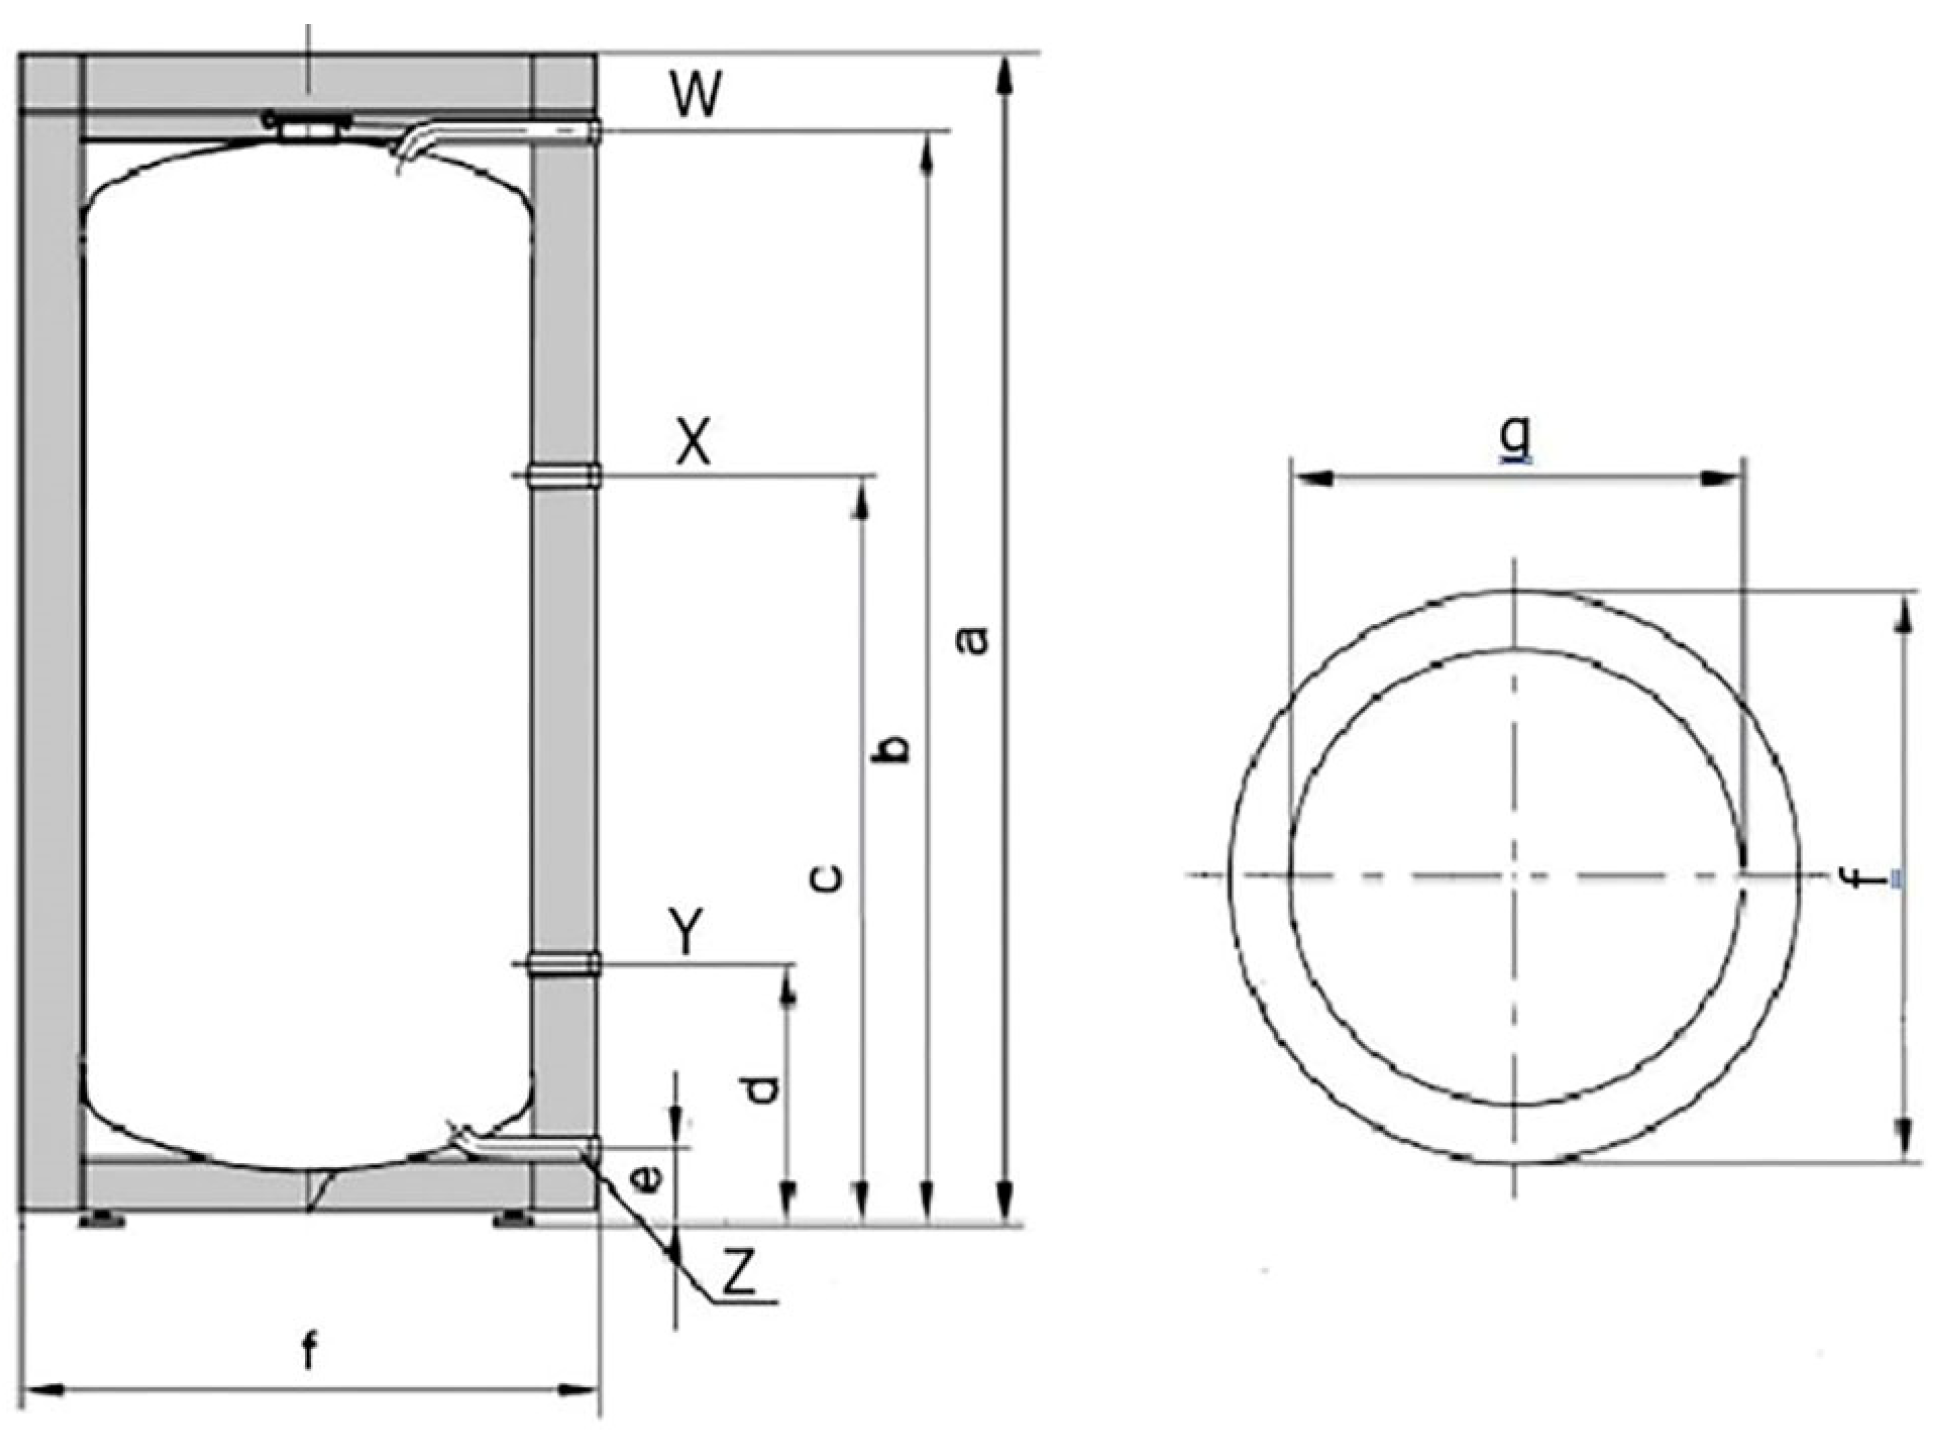
Accordingly, the system does not rely on a single 5000 lt tank but rather on six tanks in total (3 solar + 3 boiler-assisted), providing an aggregate storage capacity of 30,000 lt. The 5000 lt module size was selected based on conventional tank manufacturing standards and system modularity, while the number of tanks was scaled to match the maximum hot-water flow rate calculated using Equation (18). The technical specifications of the tanks are presented in Table 6, and their arrangement is illustrated in Figure 6.
In the SDHW system, the stored hot water is supplied in response to demand, and when the water temperature in the storage tank falls below the required temperature threshold of 60 °C, the system automatically activates auxiliary heating. This ensures that the water remains at a usable temperature for DHW requirements. During periods of low solar radiation, typically in winter, the auxiliary boiler with a thermal power of 1100 kW is brought into operation to raise the water temperature to the necessary level.
Furthermore, when the tank is refilled with water, it is conducted in a manner that maintains temperature consistency and optimizes energy use. The auxiliary heating system is engaged if the water temperature is insufficient, particularly during the winter months. In contrast, during sunnier months, the solar collectors can meet the temperature requirements without additional heating. This operational strategy ensures that the SDHW system efficiently maintains the required water temperature throughout the year, even during periods of low solar energy input.

4. Description of the SDHW System Energy Model

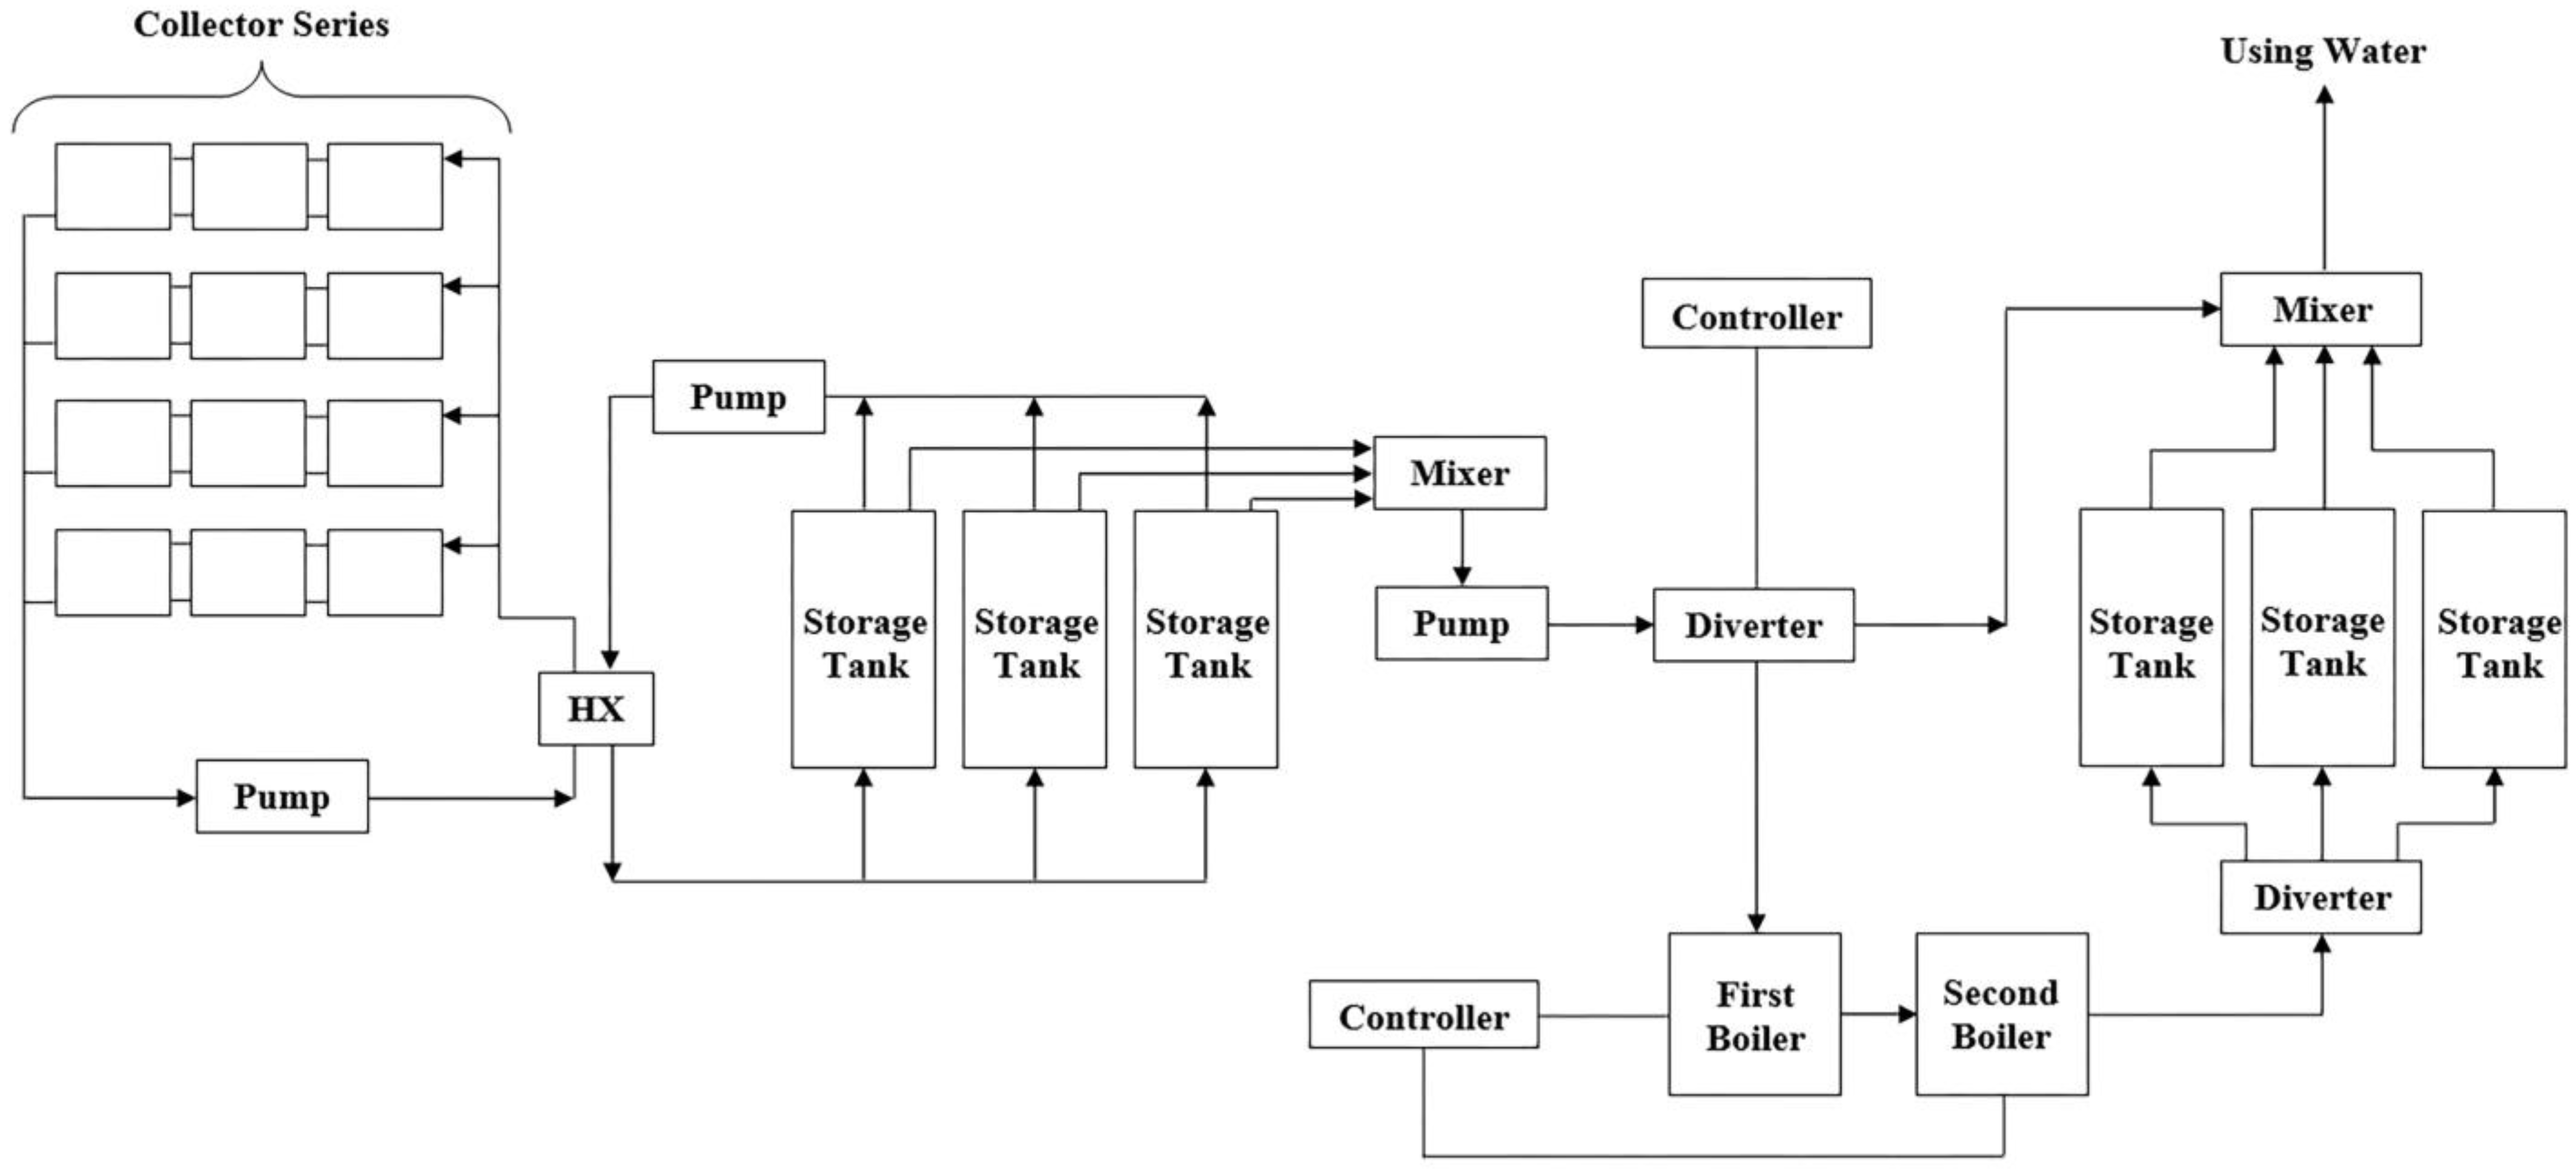
In the present study, the system was modeled to provide DHW for the 3rd dormitory building of the Northern Cyprus Campus of Middle East Technical University. The campus is located six kilometers north of Guzelyurt in Northern Cyprus (35°14′52″ N latitude and 33°01′19″ E longitude). The climatic data of the region for the simulation were retrieved from a typical meteorological year (TMY) file in TRNSYS. It was determined that eighty-four flat-plate collectors were required for the system to utilize solar energy efficiently in this location. The collectors were divided into groups of twelve, and each three-collector component was connected in series, as shown in Figure 7. The heat-transfer fluid passing through the collectors circulates via a circulation pump, and the heat gained by the fluid from diffuse and beam radiation is transferred to the running water stored in storage tanks in the primary line through a heat exchanger. Heated water is then carried by a pump to a controlled flow diverter. An iterative feedback controller measures the temperature level and sends a control signal to the diverter if the water temperature is within the required range. If the temperature of the water passing through the diverter exceeds 60 °C, the controller directs it to the loading pipe for use in the kitchen and bathroom. Otherwise, the water is diverted to the boiler for heating, ensuring that it remains above the minimum threshold of 60 °C. The SDHW system includes two boilers, each with a capacity of 800,000 kcal/h, configured in a cascade arrangement: the first boiler raises the temperature of water that has been pre-heated by solar energy to the desired usage level, while the second boiler serves as a backup and is activated only when the capacity of the first boiler is insufficient. Each boiler operates at an efficiency of 94%, based on the gas’s lower heating value (LHV), with the system functioning within a temperature range of 90 °C to 70 °C.
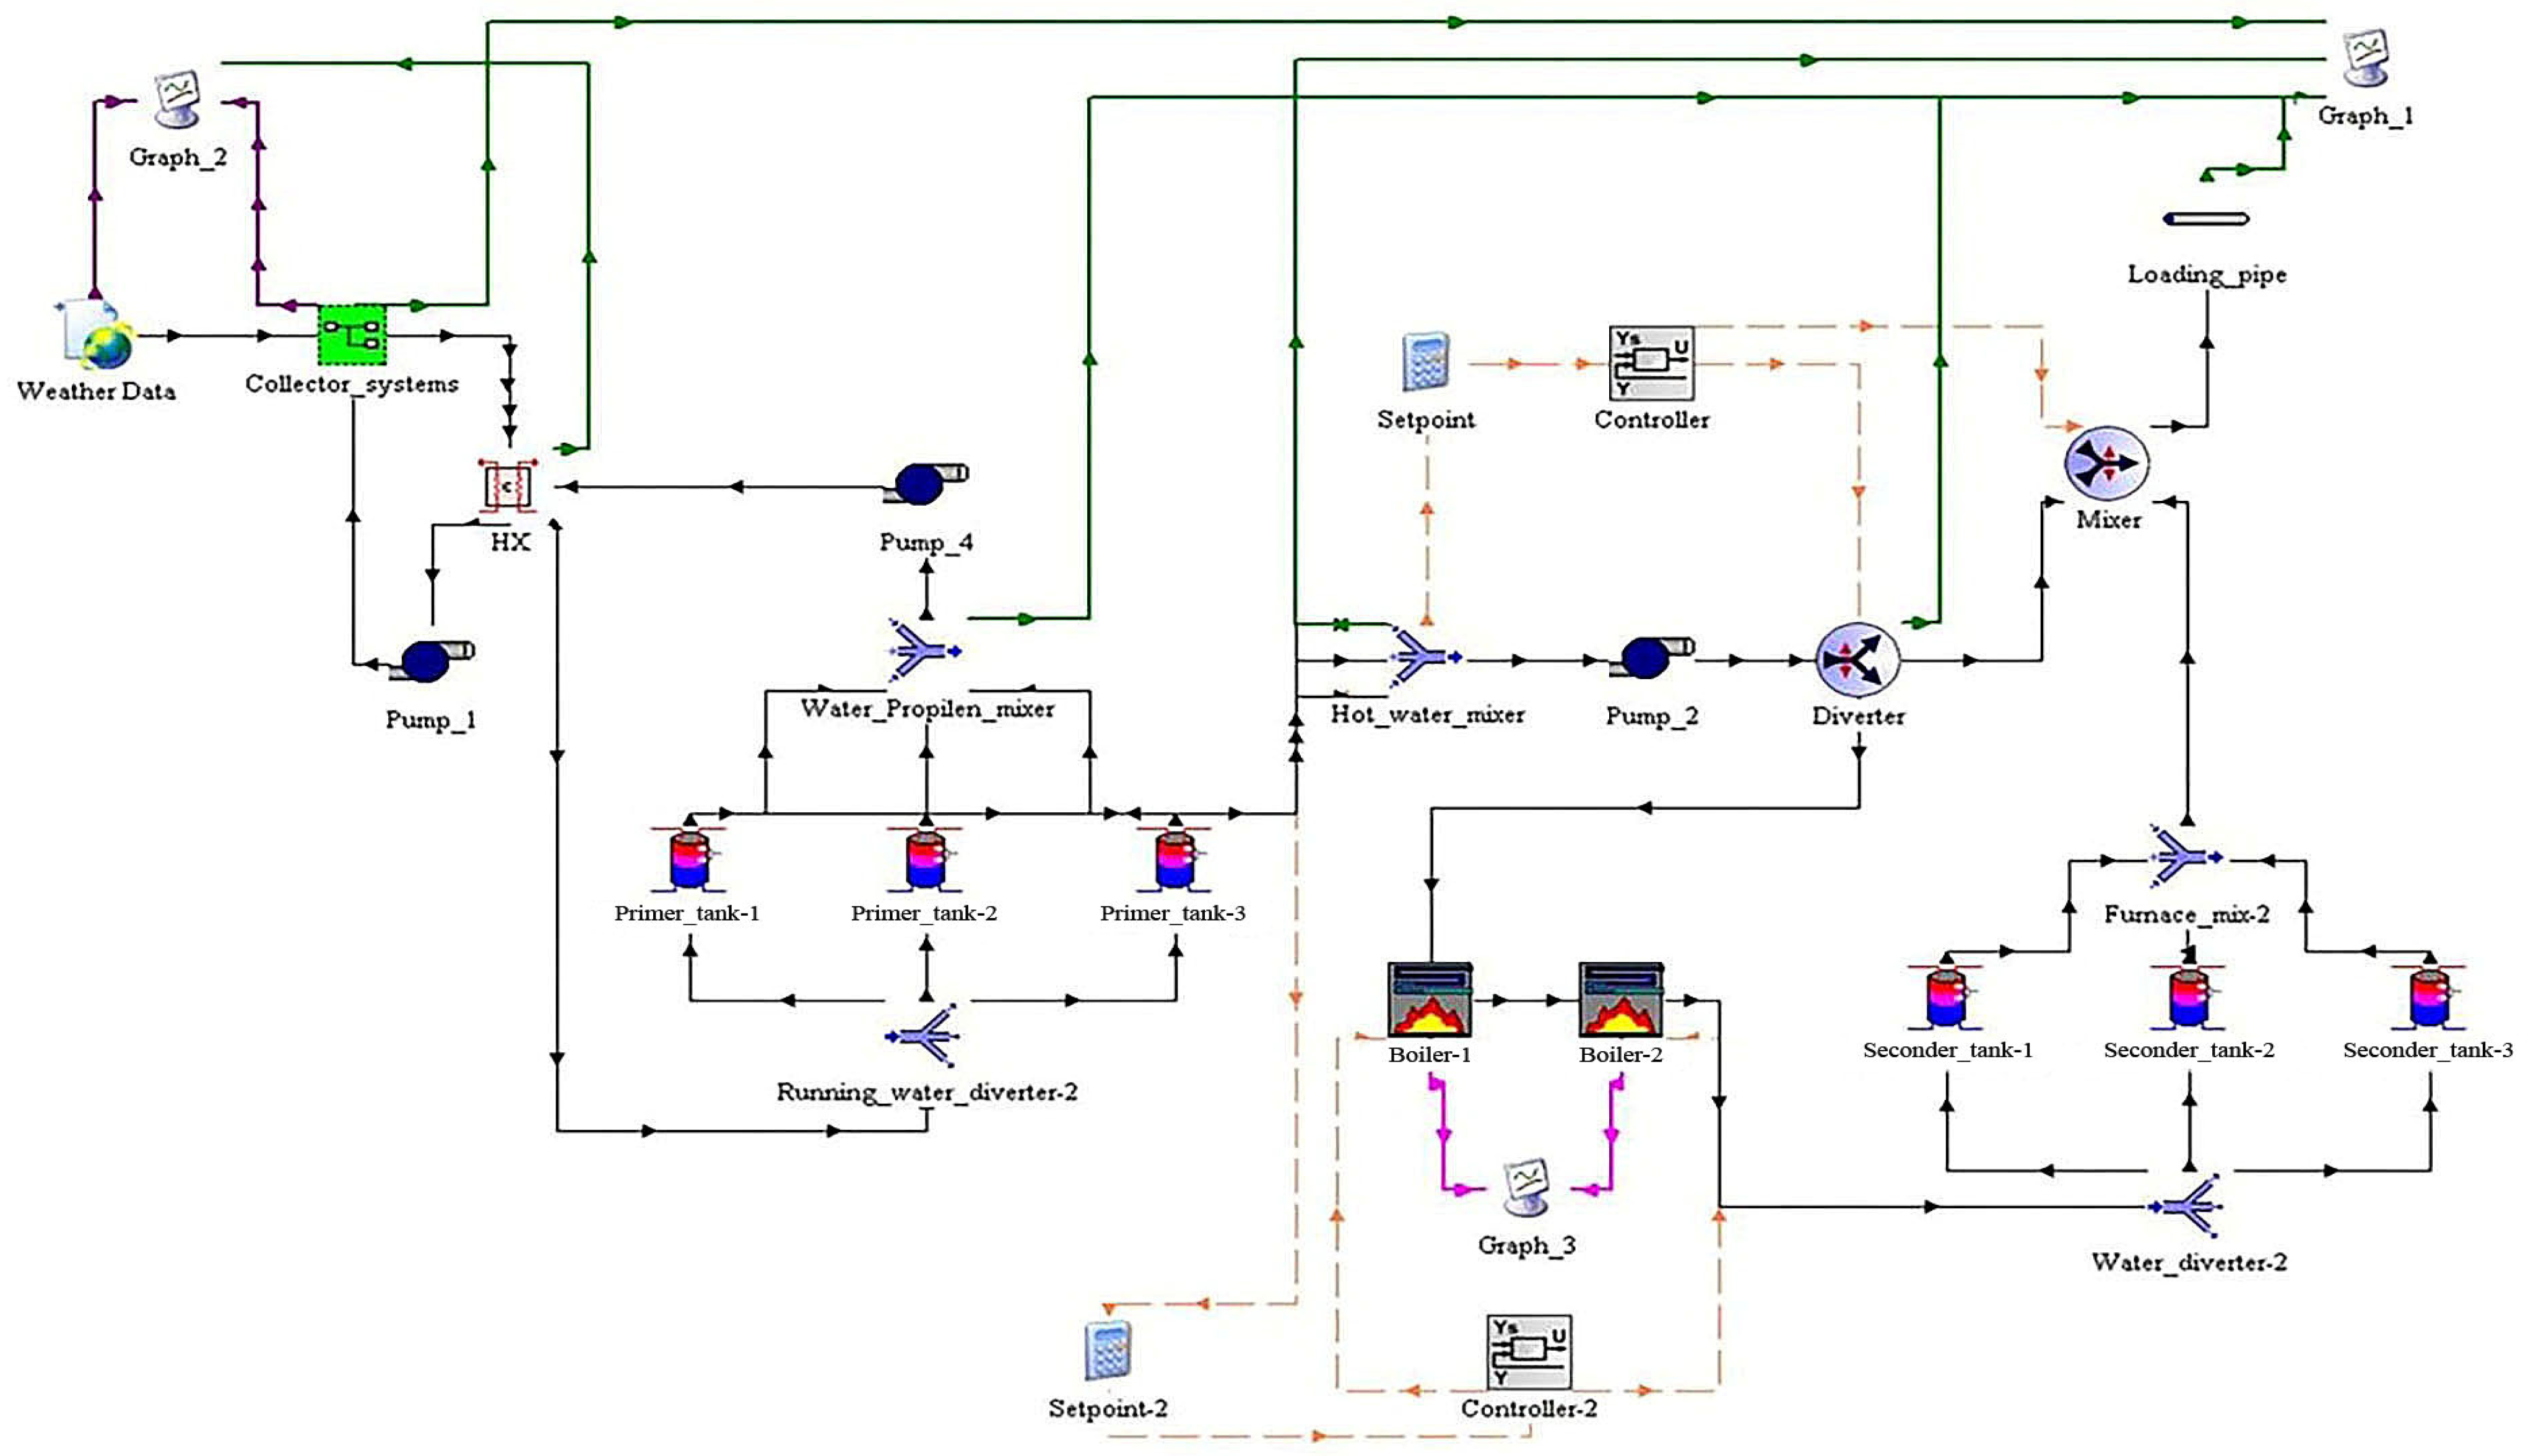
Figure 8 illustrates the DHW system modeled in TRNSYS, and all components that constitute the system are listed in Table 7. Each component was selected based on its specific role in the system’s operation.
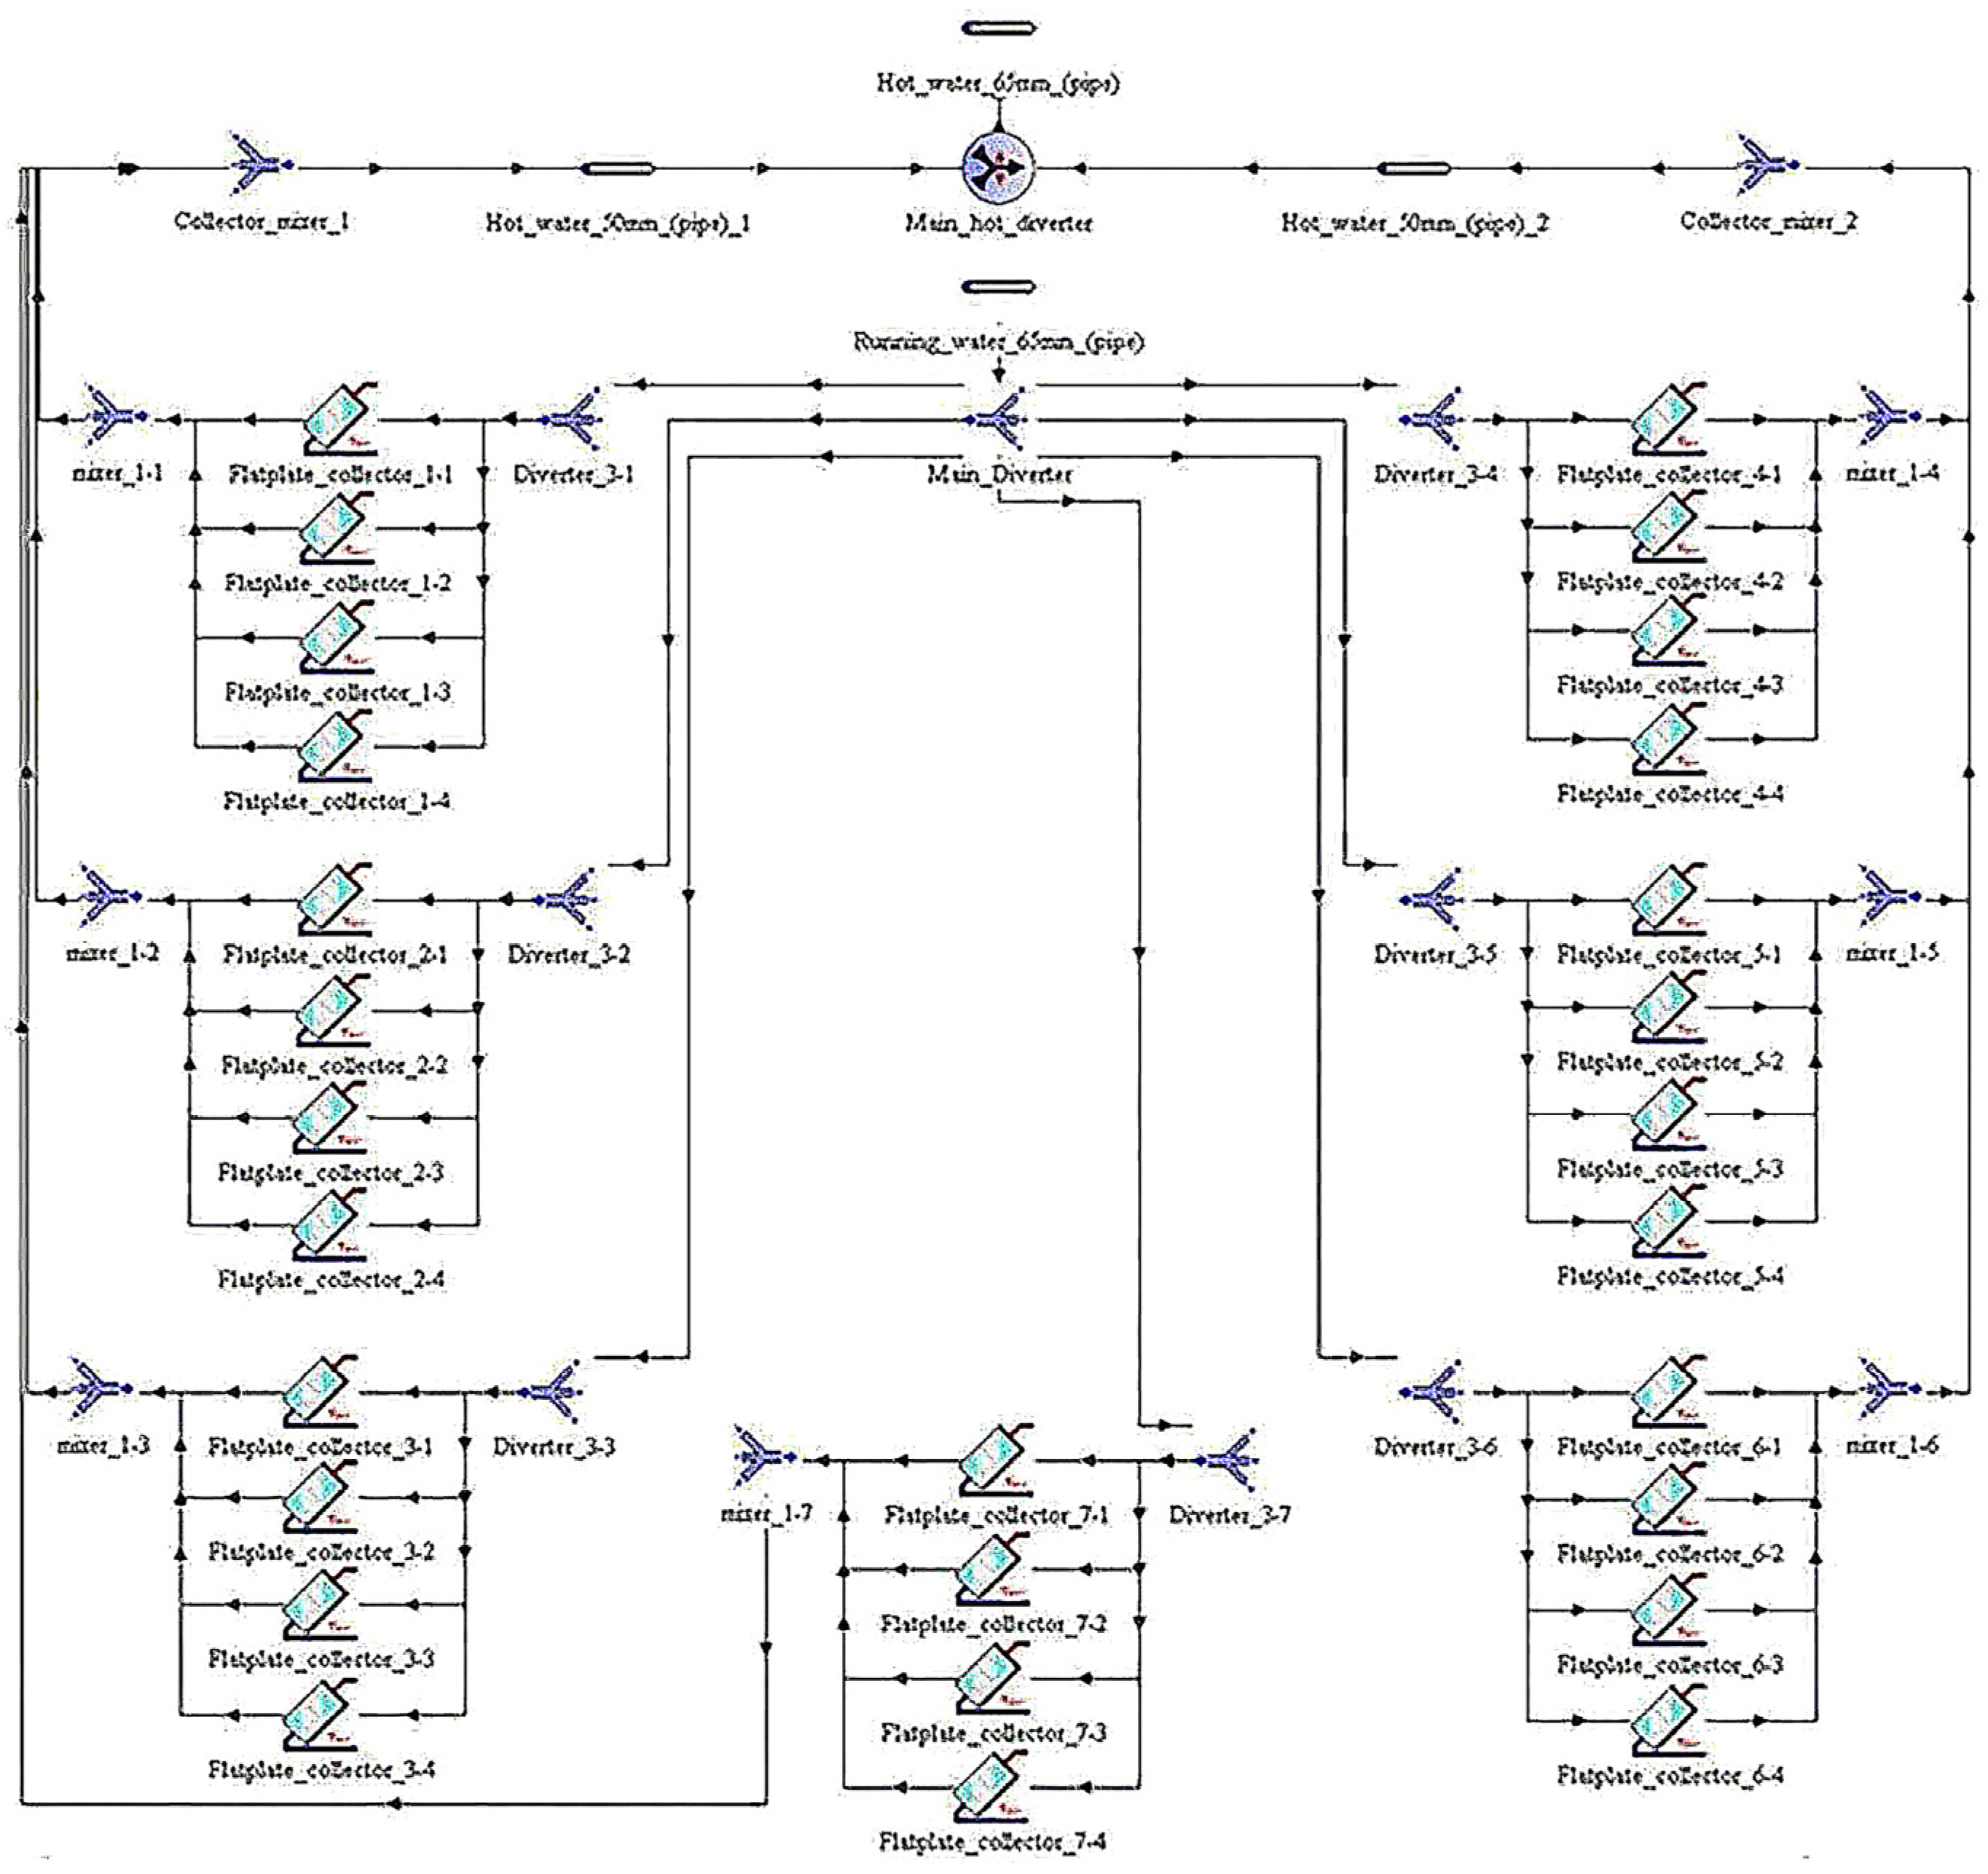
Figure 9 shows the schematic of the collector series modeled in TRNSYS. This schematic is not visible in Figure 8 because it was created as a macro model and corresponds to the “Collector Series” element shown in Figure 7. Both the SDHW and collector systems are large and complex; therefore, the collector system was designed as a macro model to avoid complications. The macro model functioned without any issues, as it behaved like any other component in the simulation. In Figure 8, twenty-eight collectors are shown; however, each collector actually represents an array of three identical solar collectors connected in series.

5. Results and Analysis

5.1. Analyzing Energy Performance of SDHW System

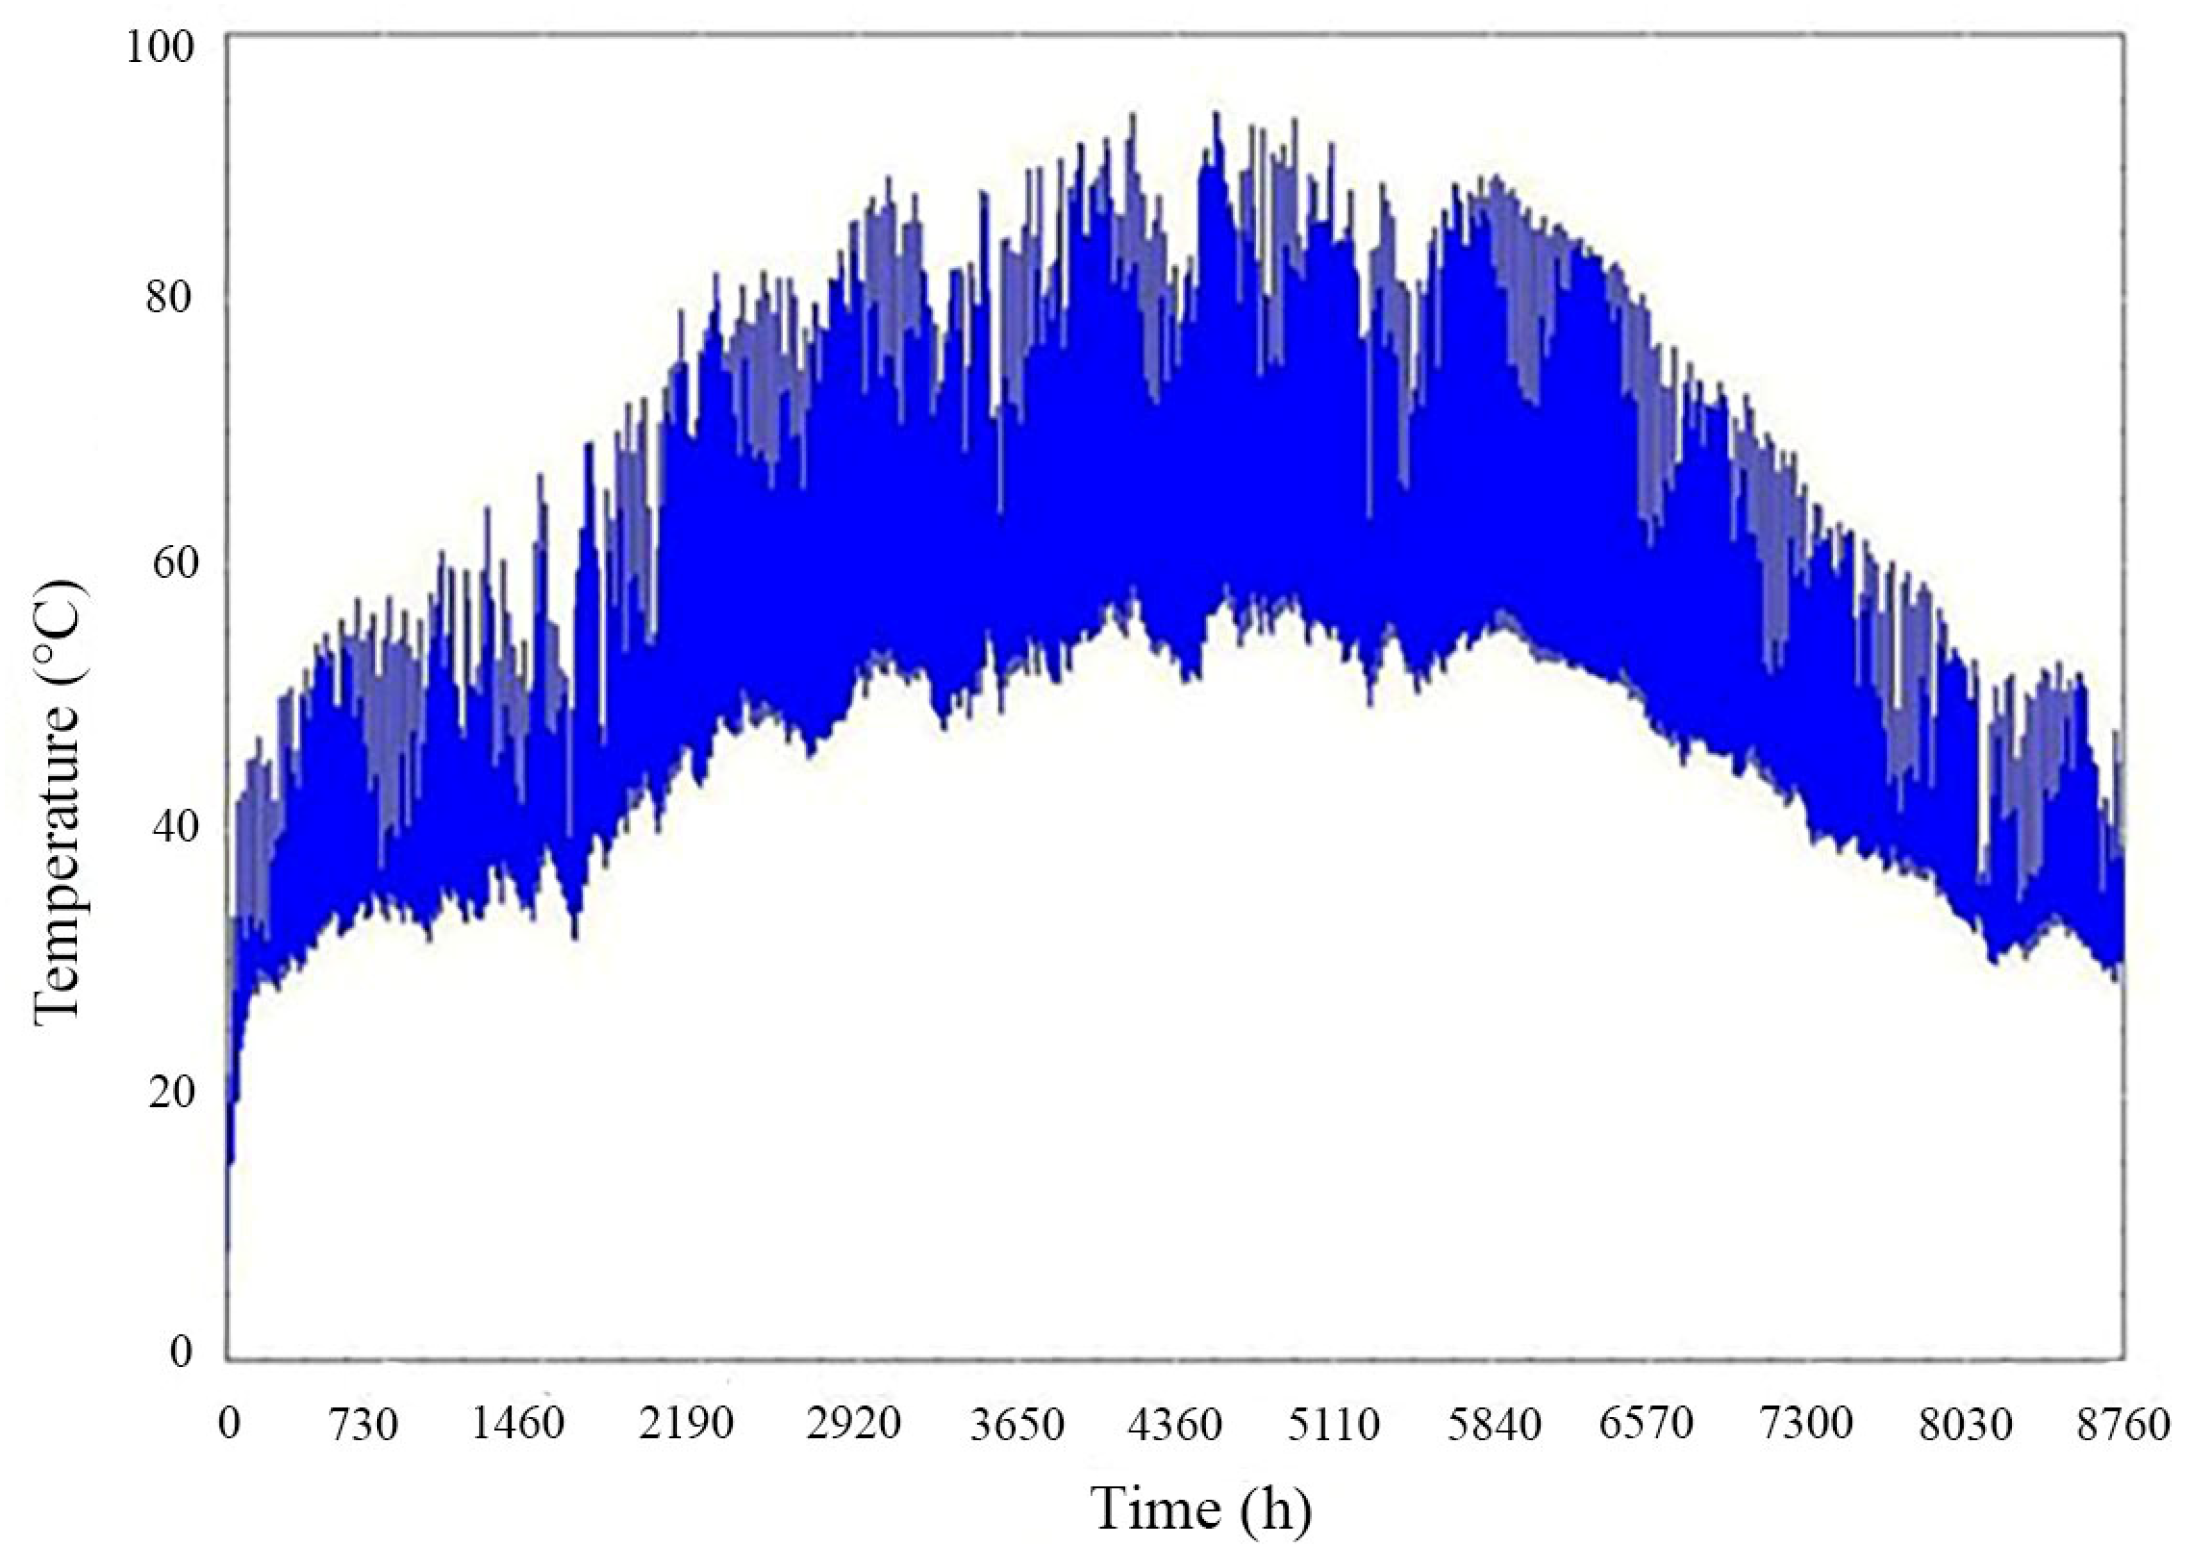
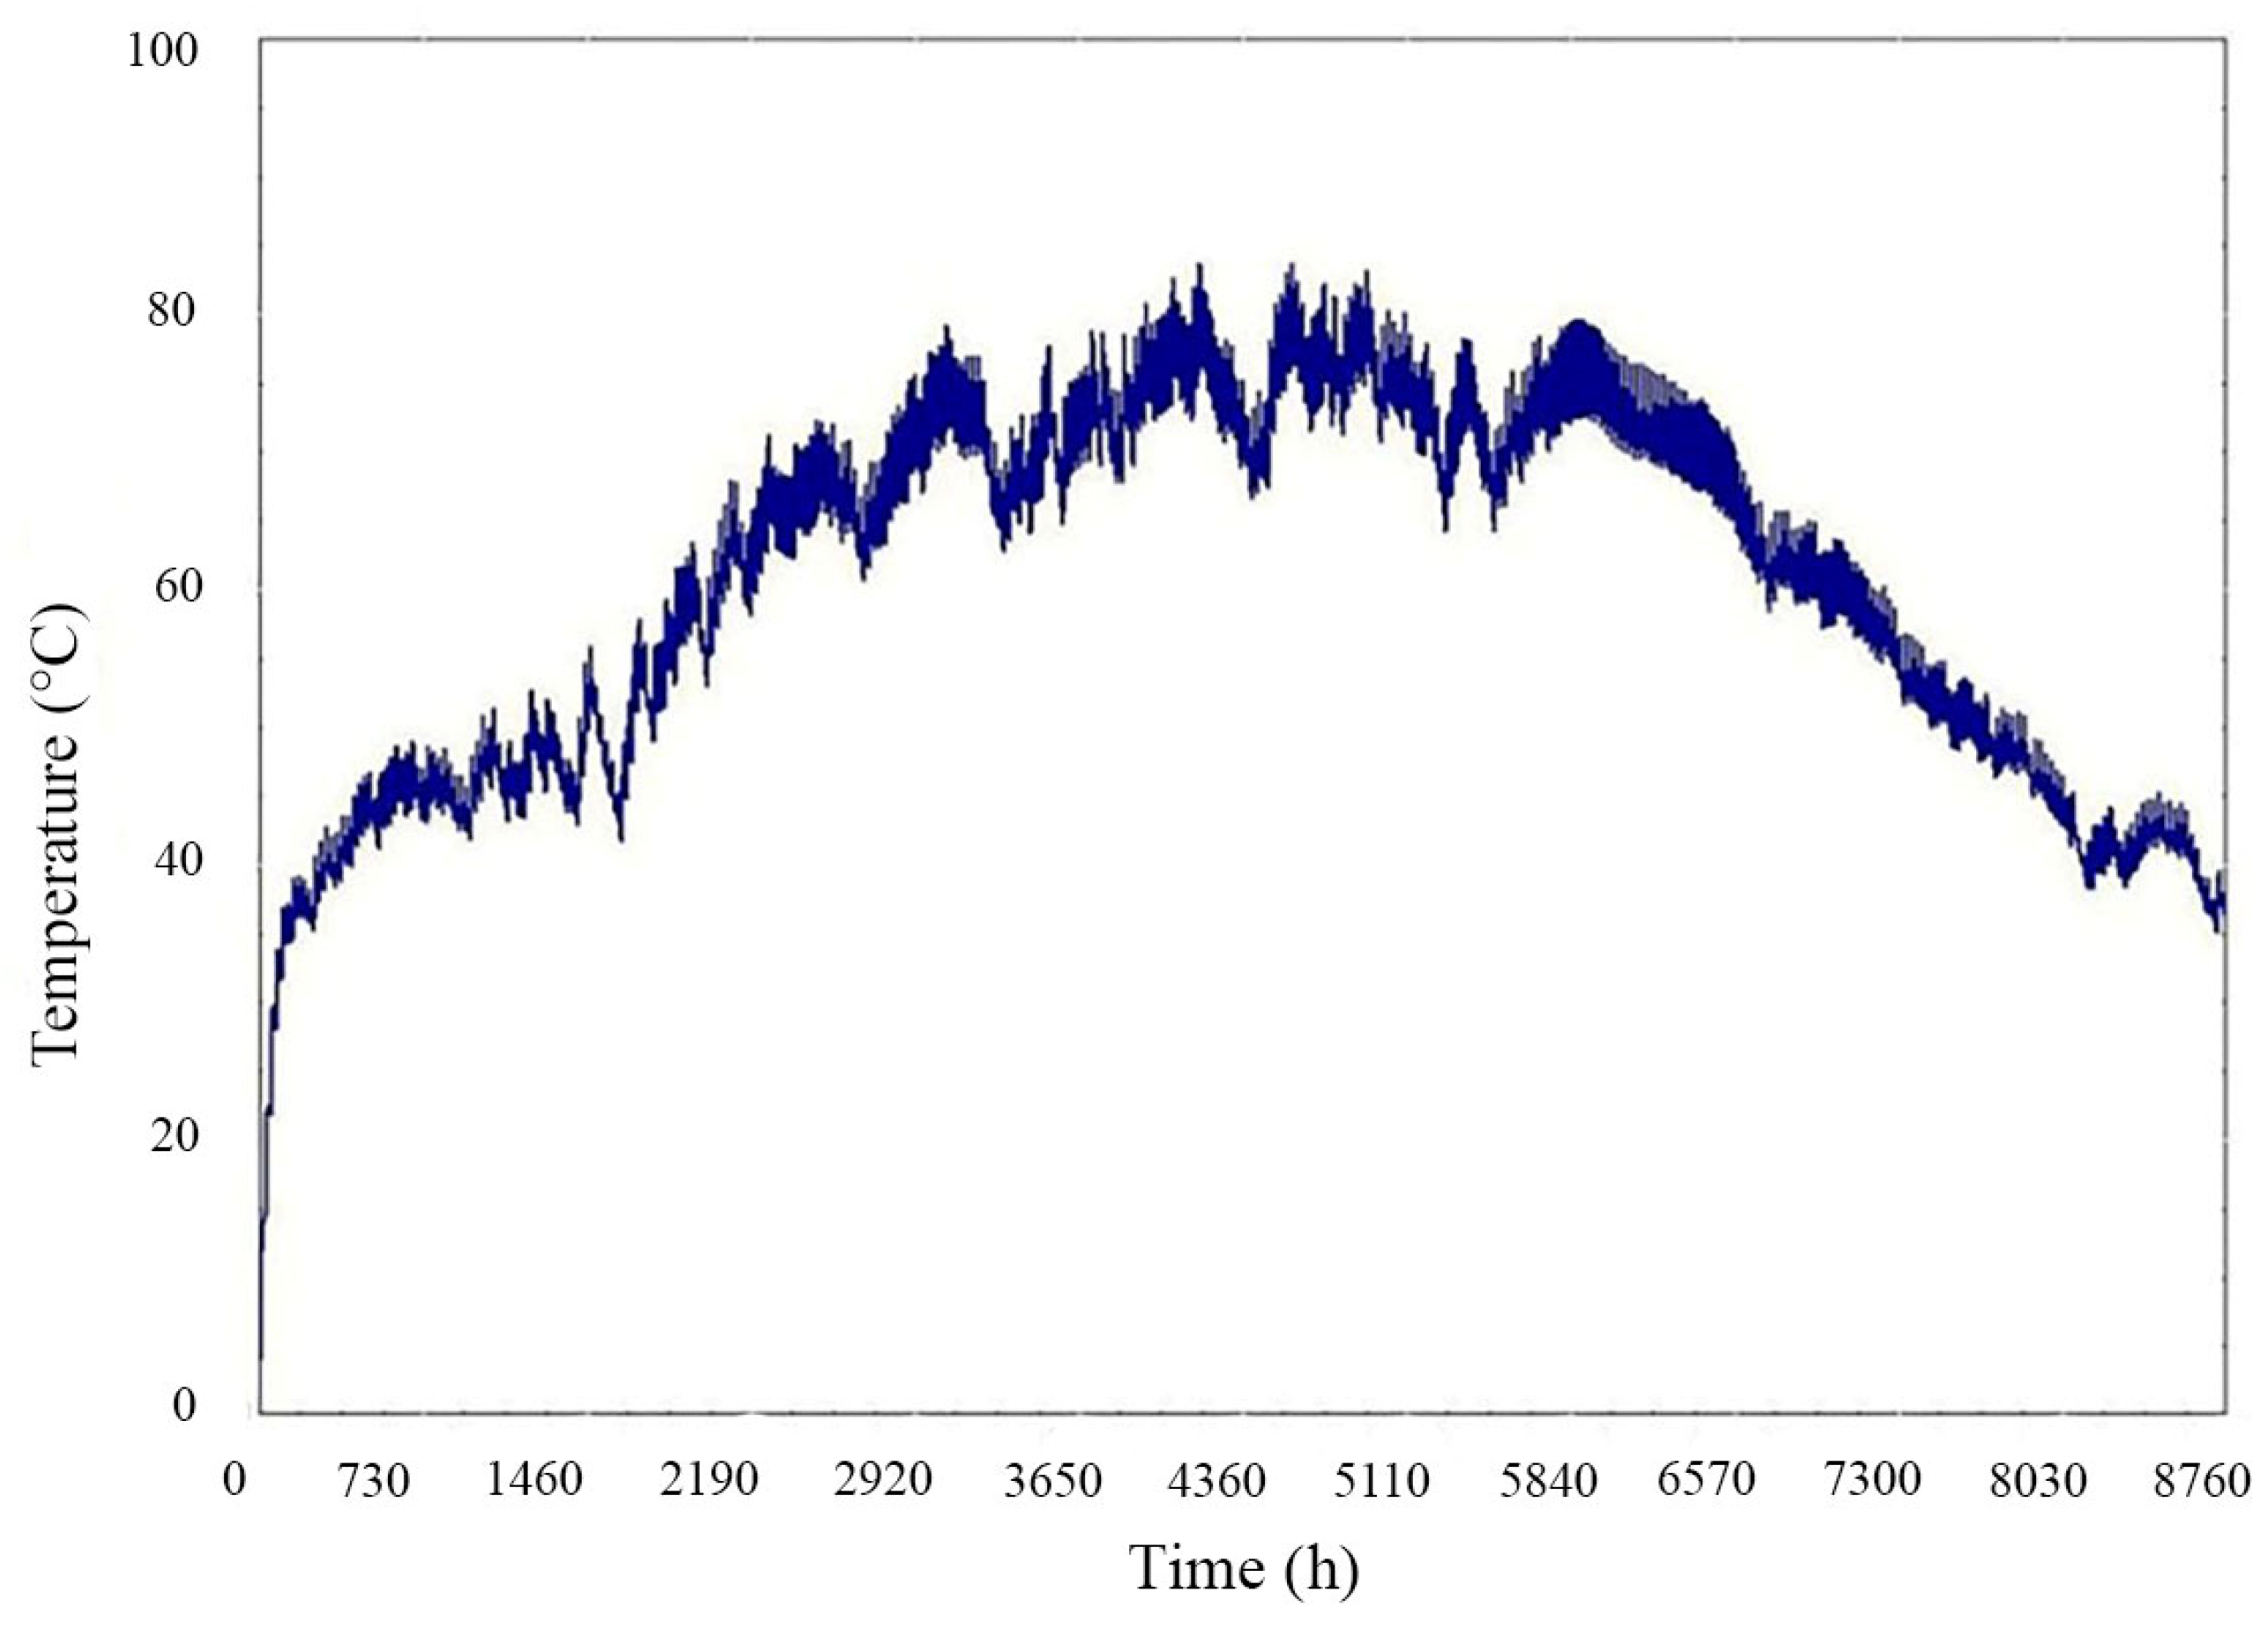
A propylene glycol–water solution is used to prevent freezing. Furthermore, the boiling point of the solution is higher than that of water, allowing the DHW system to reach higher temperatures through the effective use of solar radiation. In the figures, each interval on the x-axis corresponds to one month; for instance, the interval from 0 to 730 represents January. In Figure 10, the temperature of the collector fluid rises above 80 °C starting in April and continues at this level until October. Within a day, the temperature gradually decreases by approximately 45 °C. The system operates consistently, and the temperature does not drop below 0 °C even during the winter season.
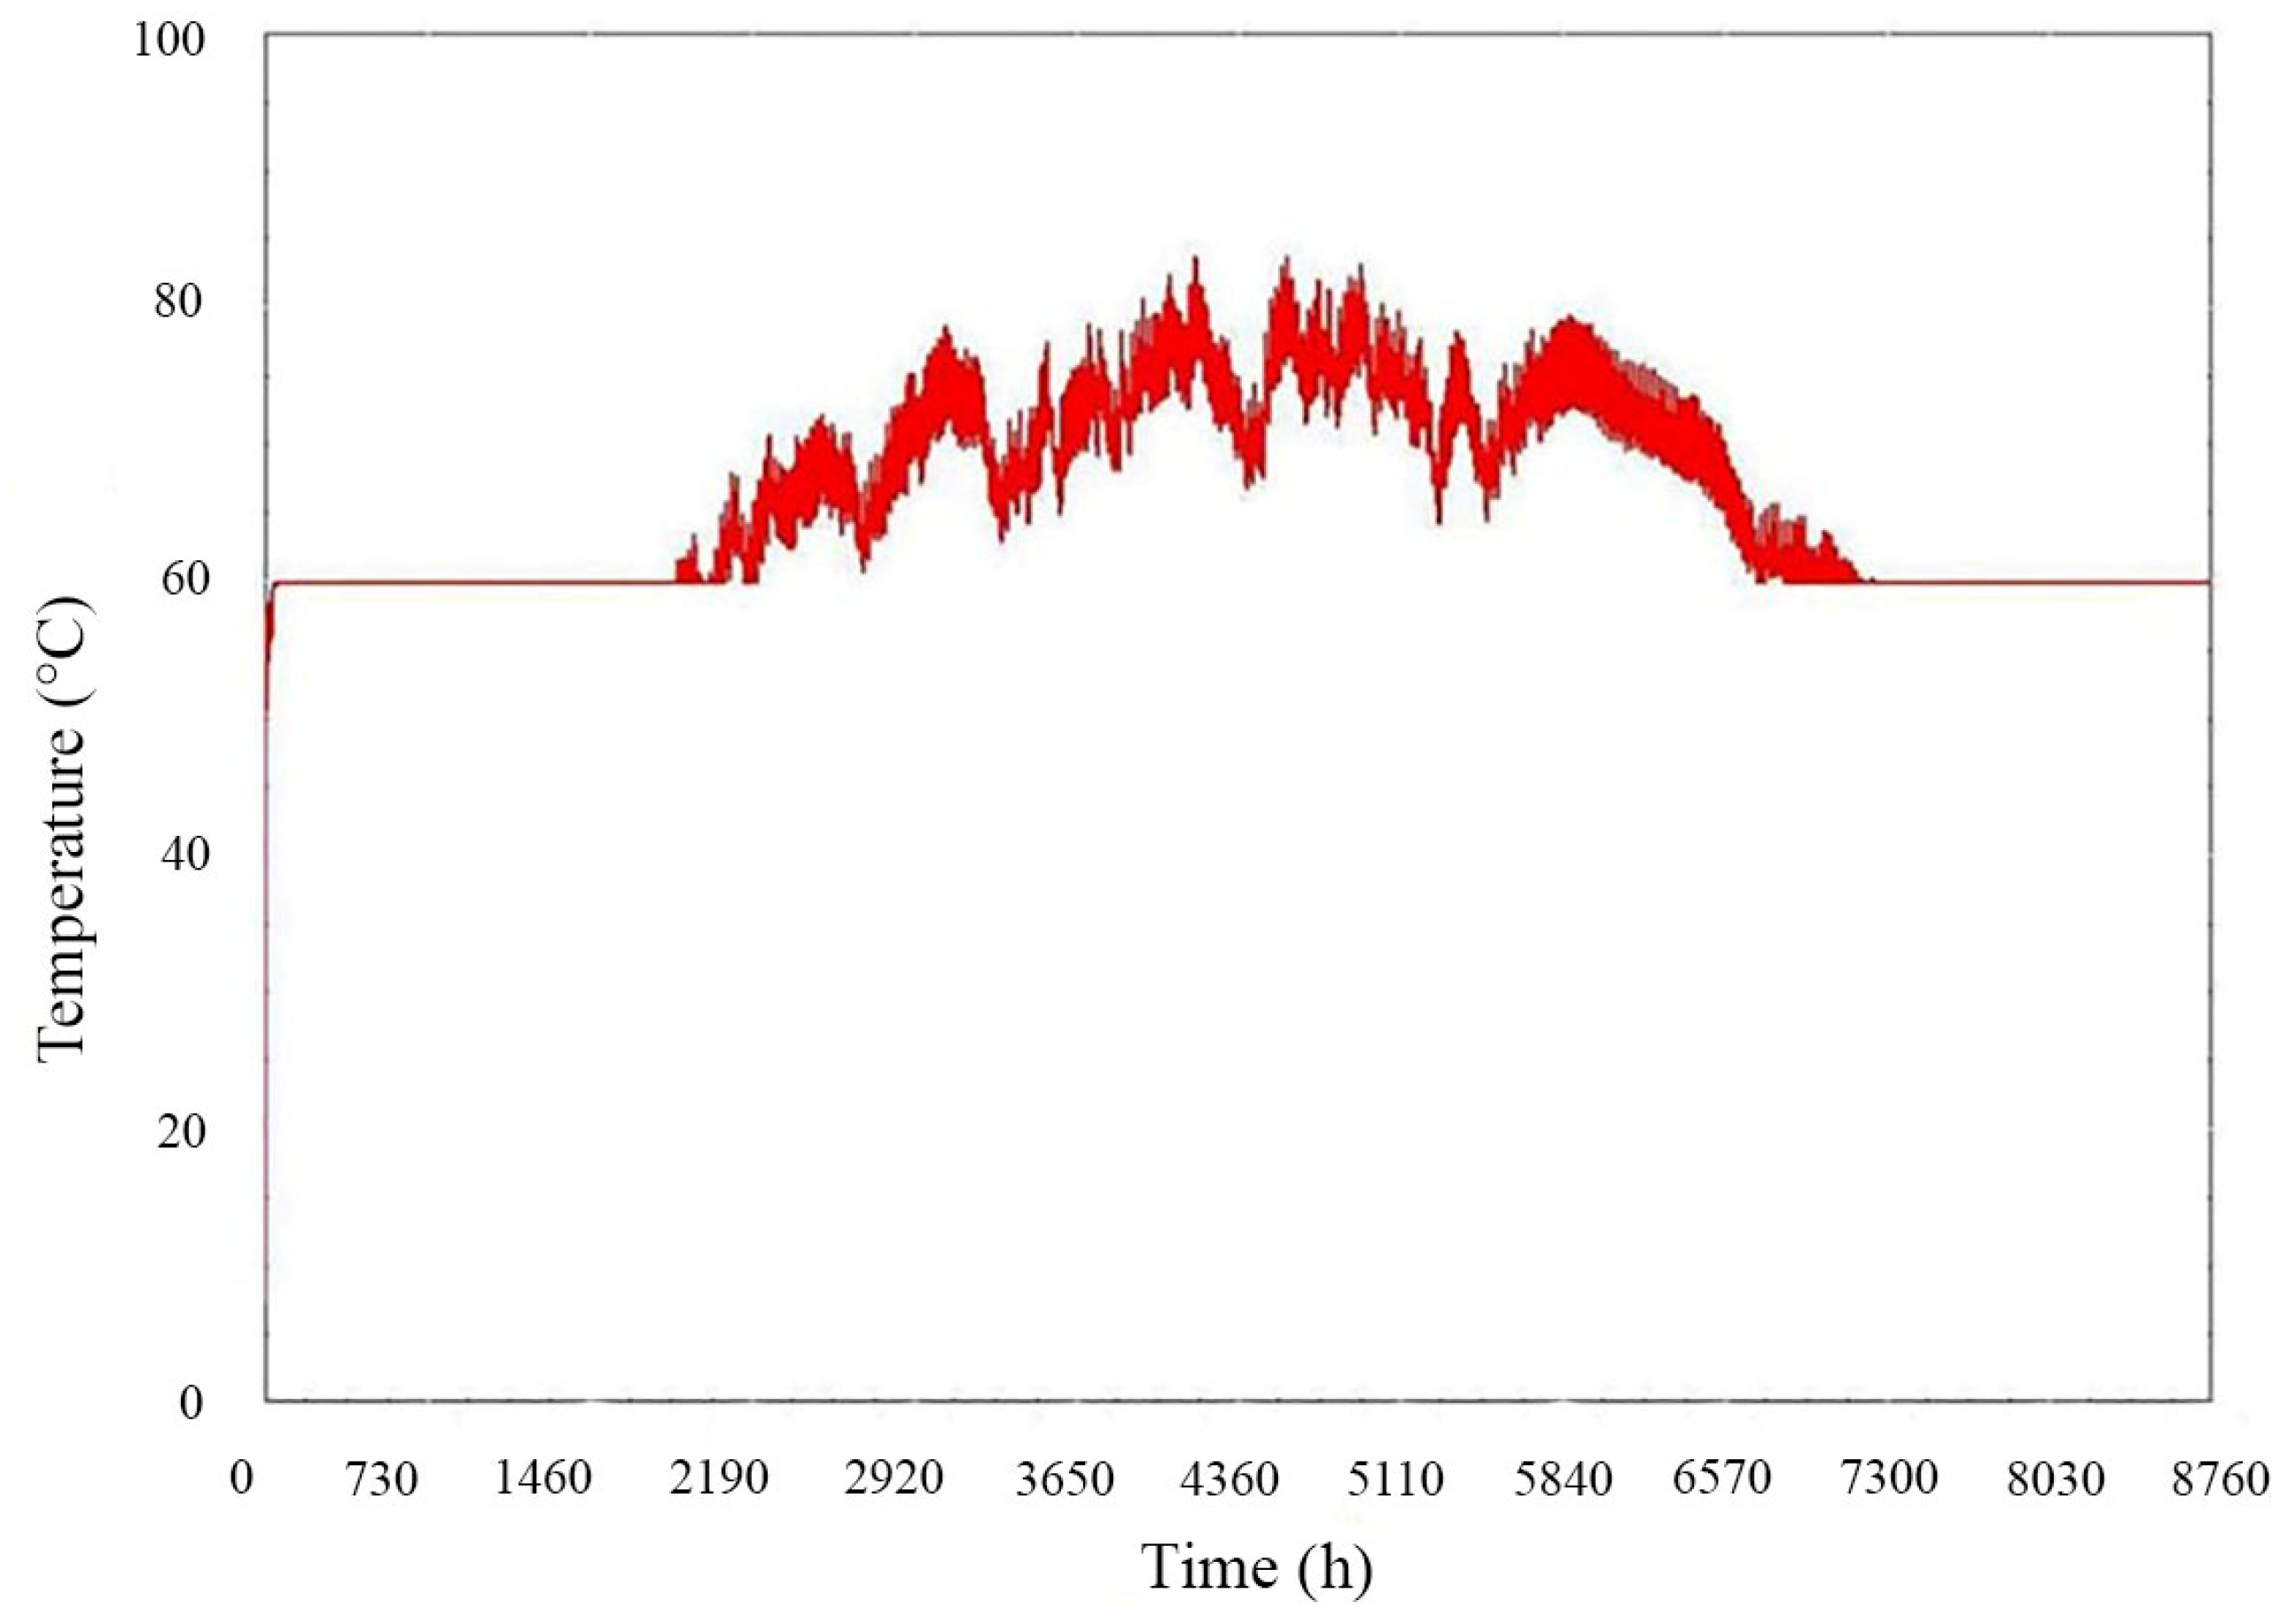
In Figure 11, the DHW temperature is lower than the collector fluid temperature due to losses through the heat exchanger. The water temperature rises to 60 °C by the end of March, meeting the temperature requirement specified in the project. The maximum temperature reaches approximately 80 °C in mid-June, and the water temperature remains above 60 °C until the end of October.
The minimum DHW temperature must be 60 °C to meet occupant requirements. In Figure 12, the water must be heated by the auxiliary heater during periods of lower solar radiation, particularly in winter. Nevertheless, from early spring to mid-autumn, there is no need for auxiliary heating due to higher solar radiation levels. In the modeled system, the iterative feedback controller was programmed to start the boilers if the water temperature dropped below 60 °C.
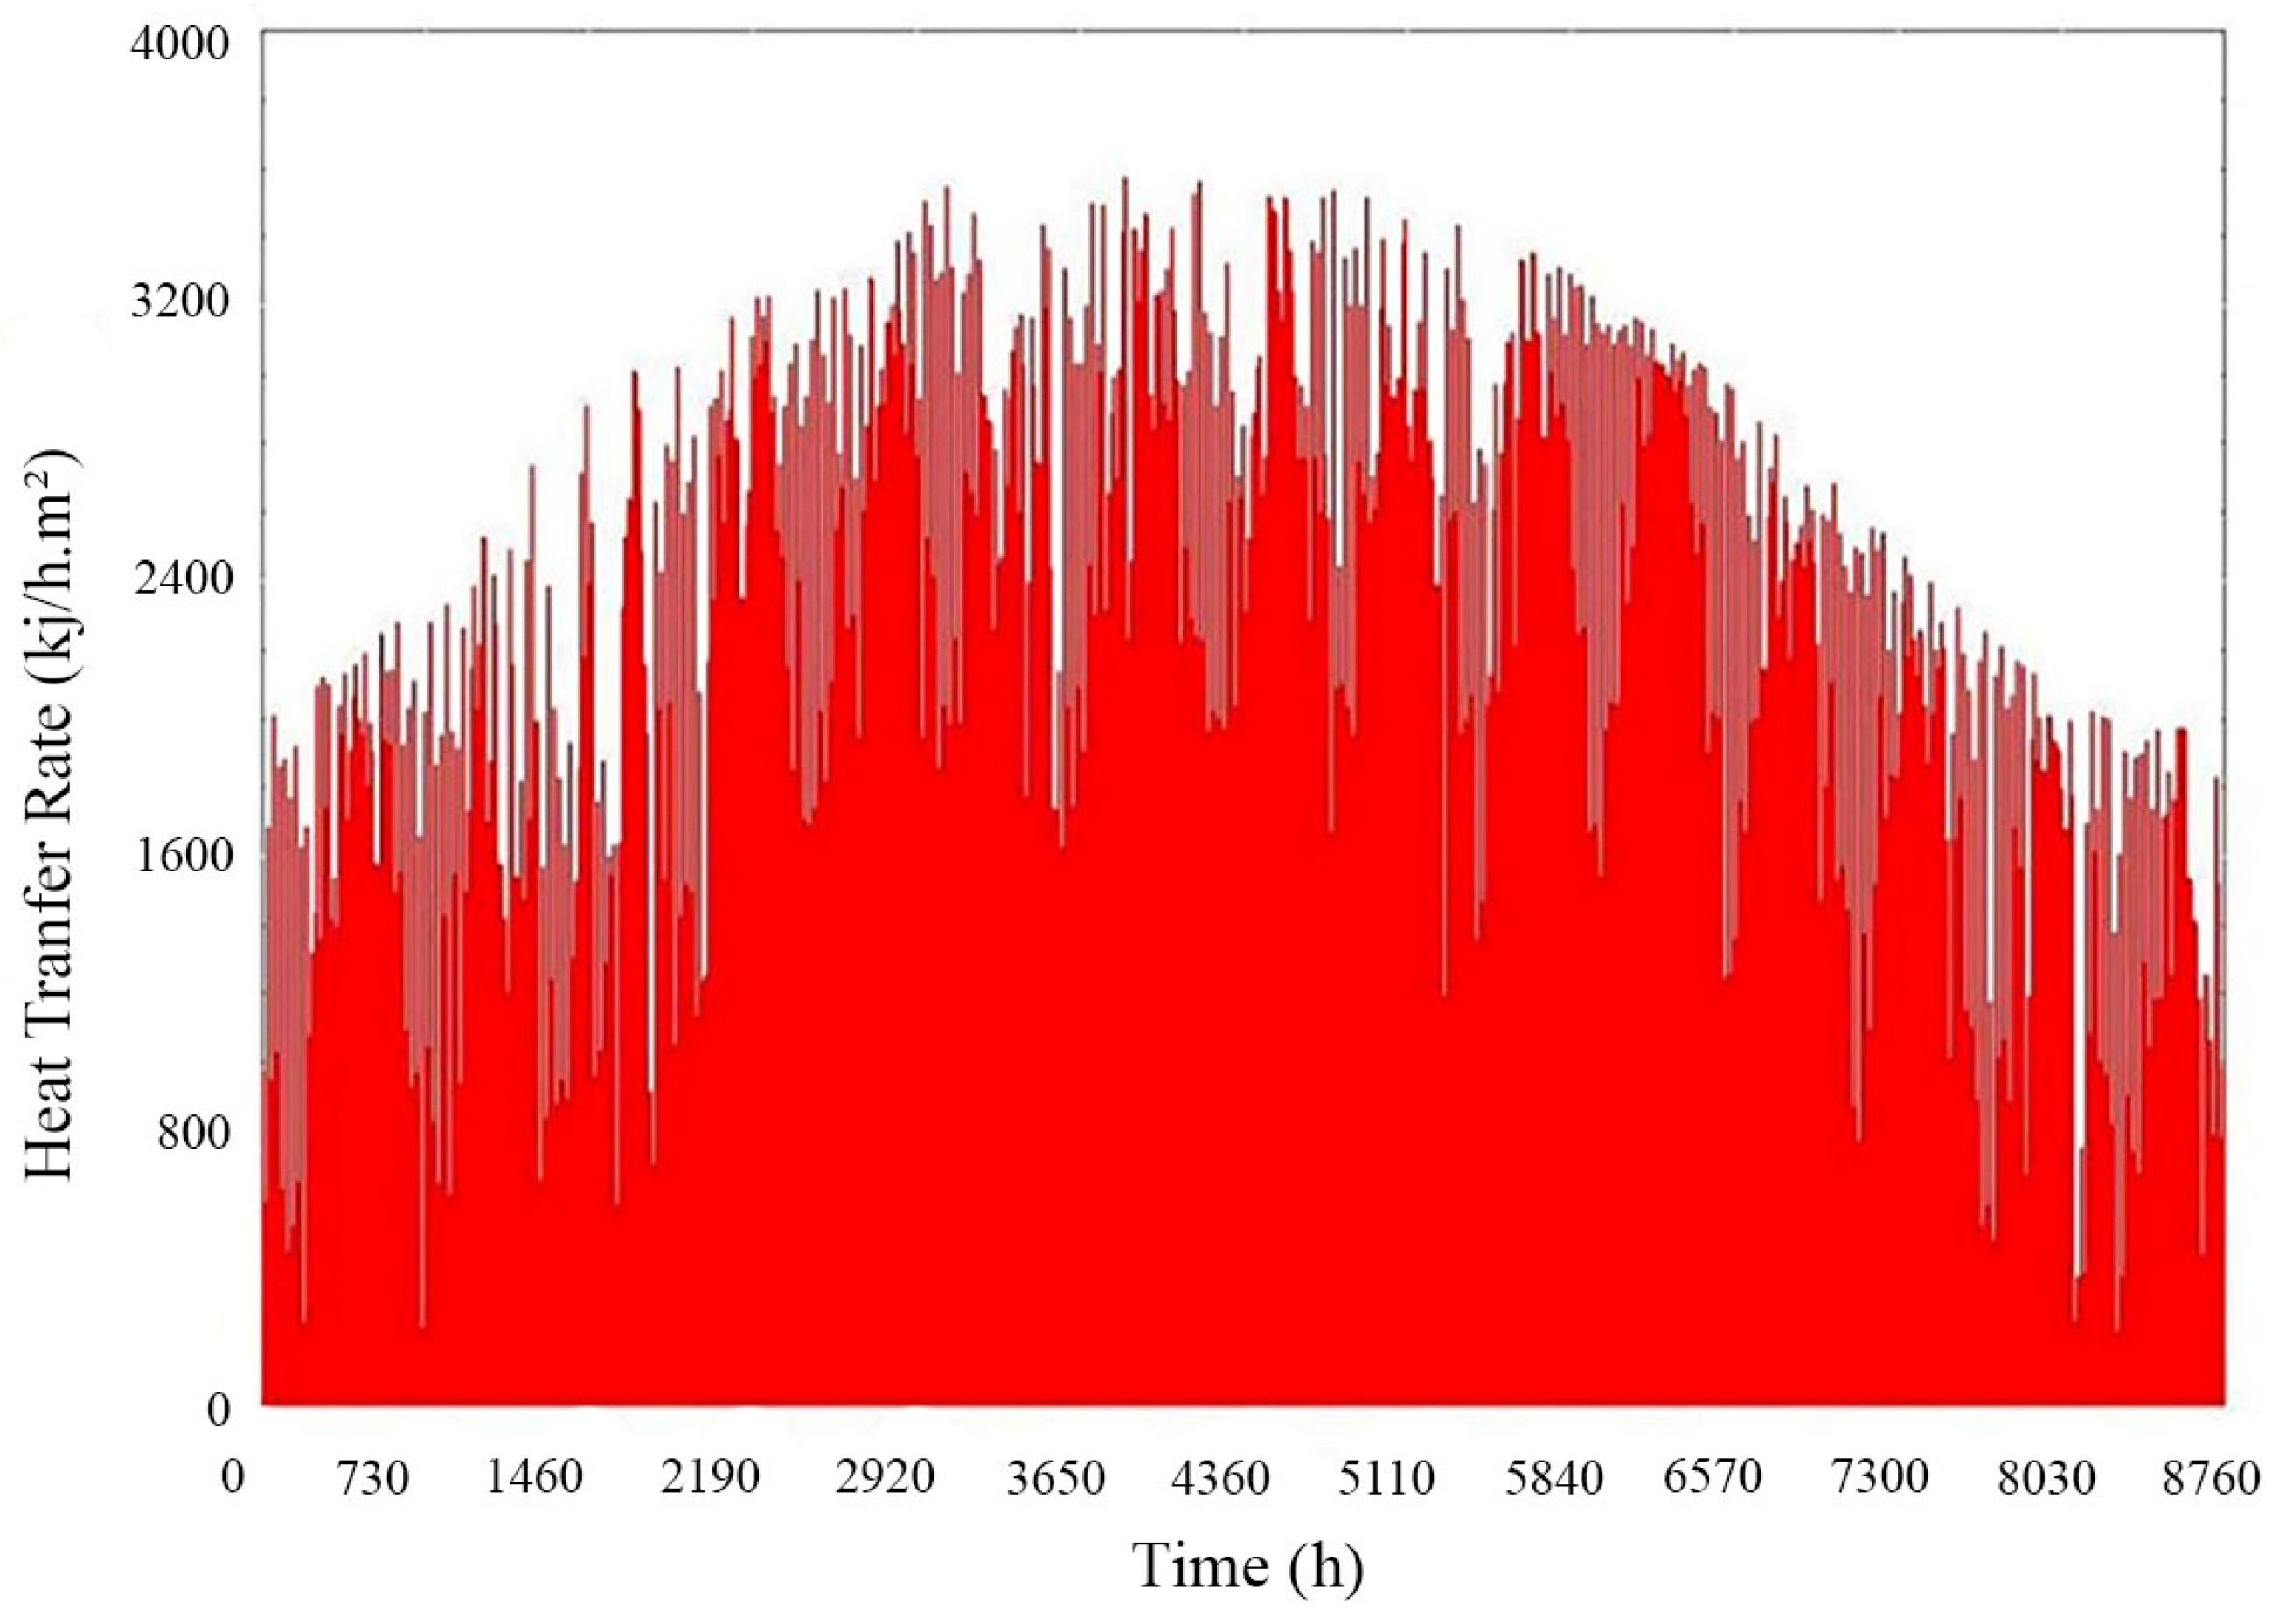
Figure 13 presents a simulation output from TRNSYS illustrating the annual variation of total tilted surface radiation. The climate data used in the simulation were sourced from the TMY database [55] for Larnaca, Northern Cyprus. Overall, the radiation values exhibit a clear seasonal pattern. During the winter months (0–1460 h and 7300–8760 h), total radiation is relatively low due to shorter daylight duration and lower solar altitude; however, occasional peaks occur on clear-sky days when the beam component increases significantly. From early spring to midsummer (approximately 1460–5840 h), both the beam and diffuse components increase, with the beam fraction dominating under clear-sky conditions. This period records the highest daily maxima, reaching approximately 3200–3500 kJ/h·m2. In the autumn transition period (5840–7300 h), radiation levels decline as the beam component decreases and the diffuse fraction becomes more prominent. Daily fluctuations correspond to the diurnal solar cycle, with radiation rising sharply in the morning, peaking around solar noon, and declining toward sunset. The inclination of the receiving surface enhances the collection of beam radiation, particularly in winter, resulting in higher total incident radiation compared to that on a horizontal surface. This configuration is advantageous for solar collector systems, as it enables a more balanced annual energy capture.
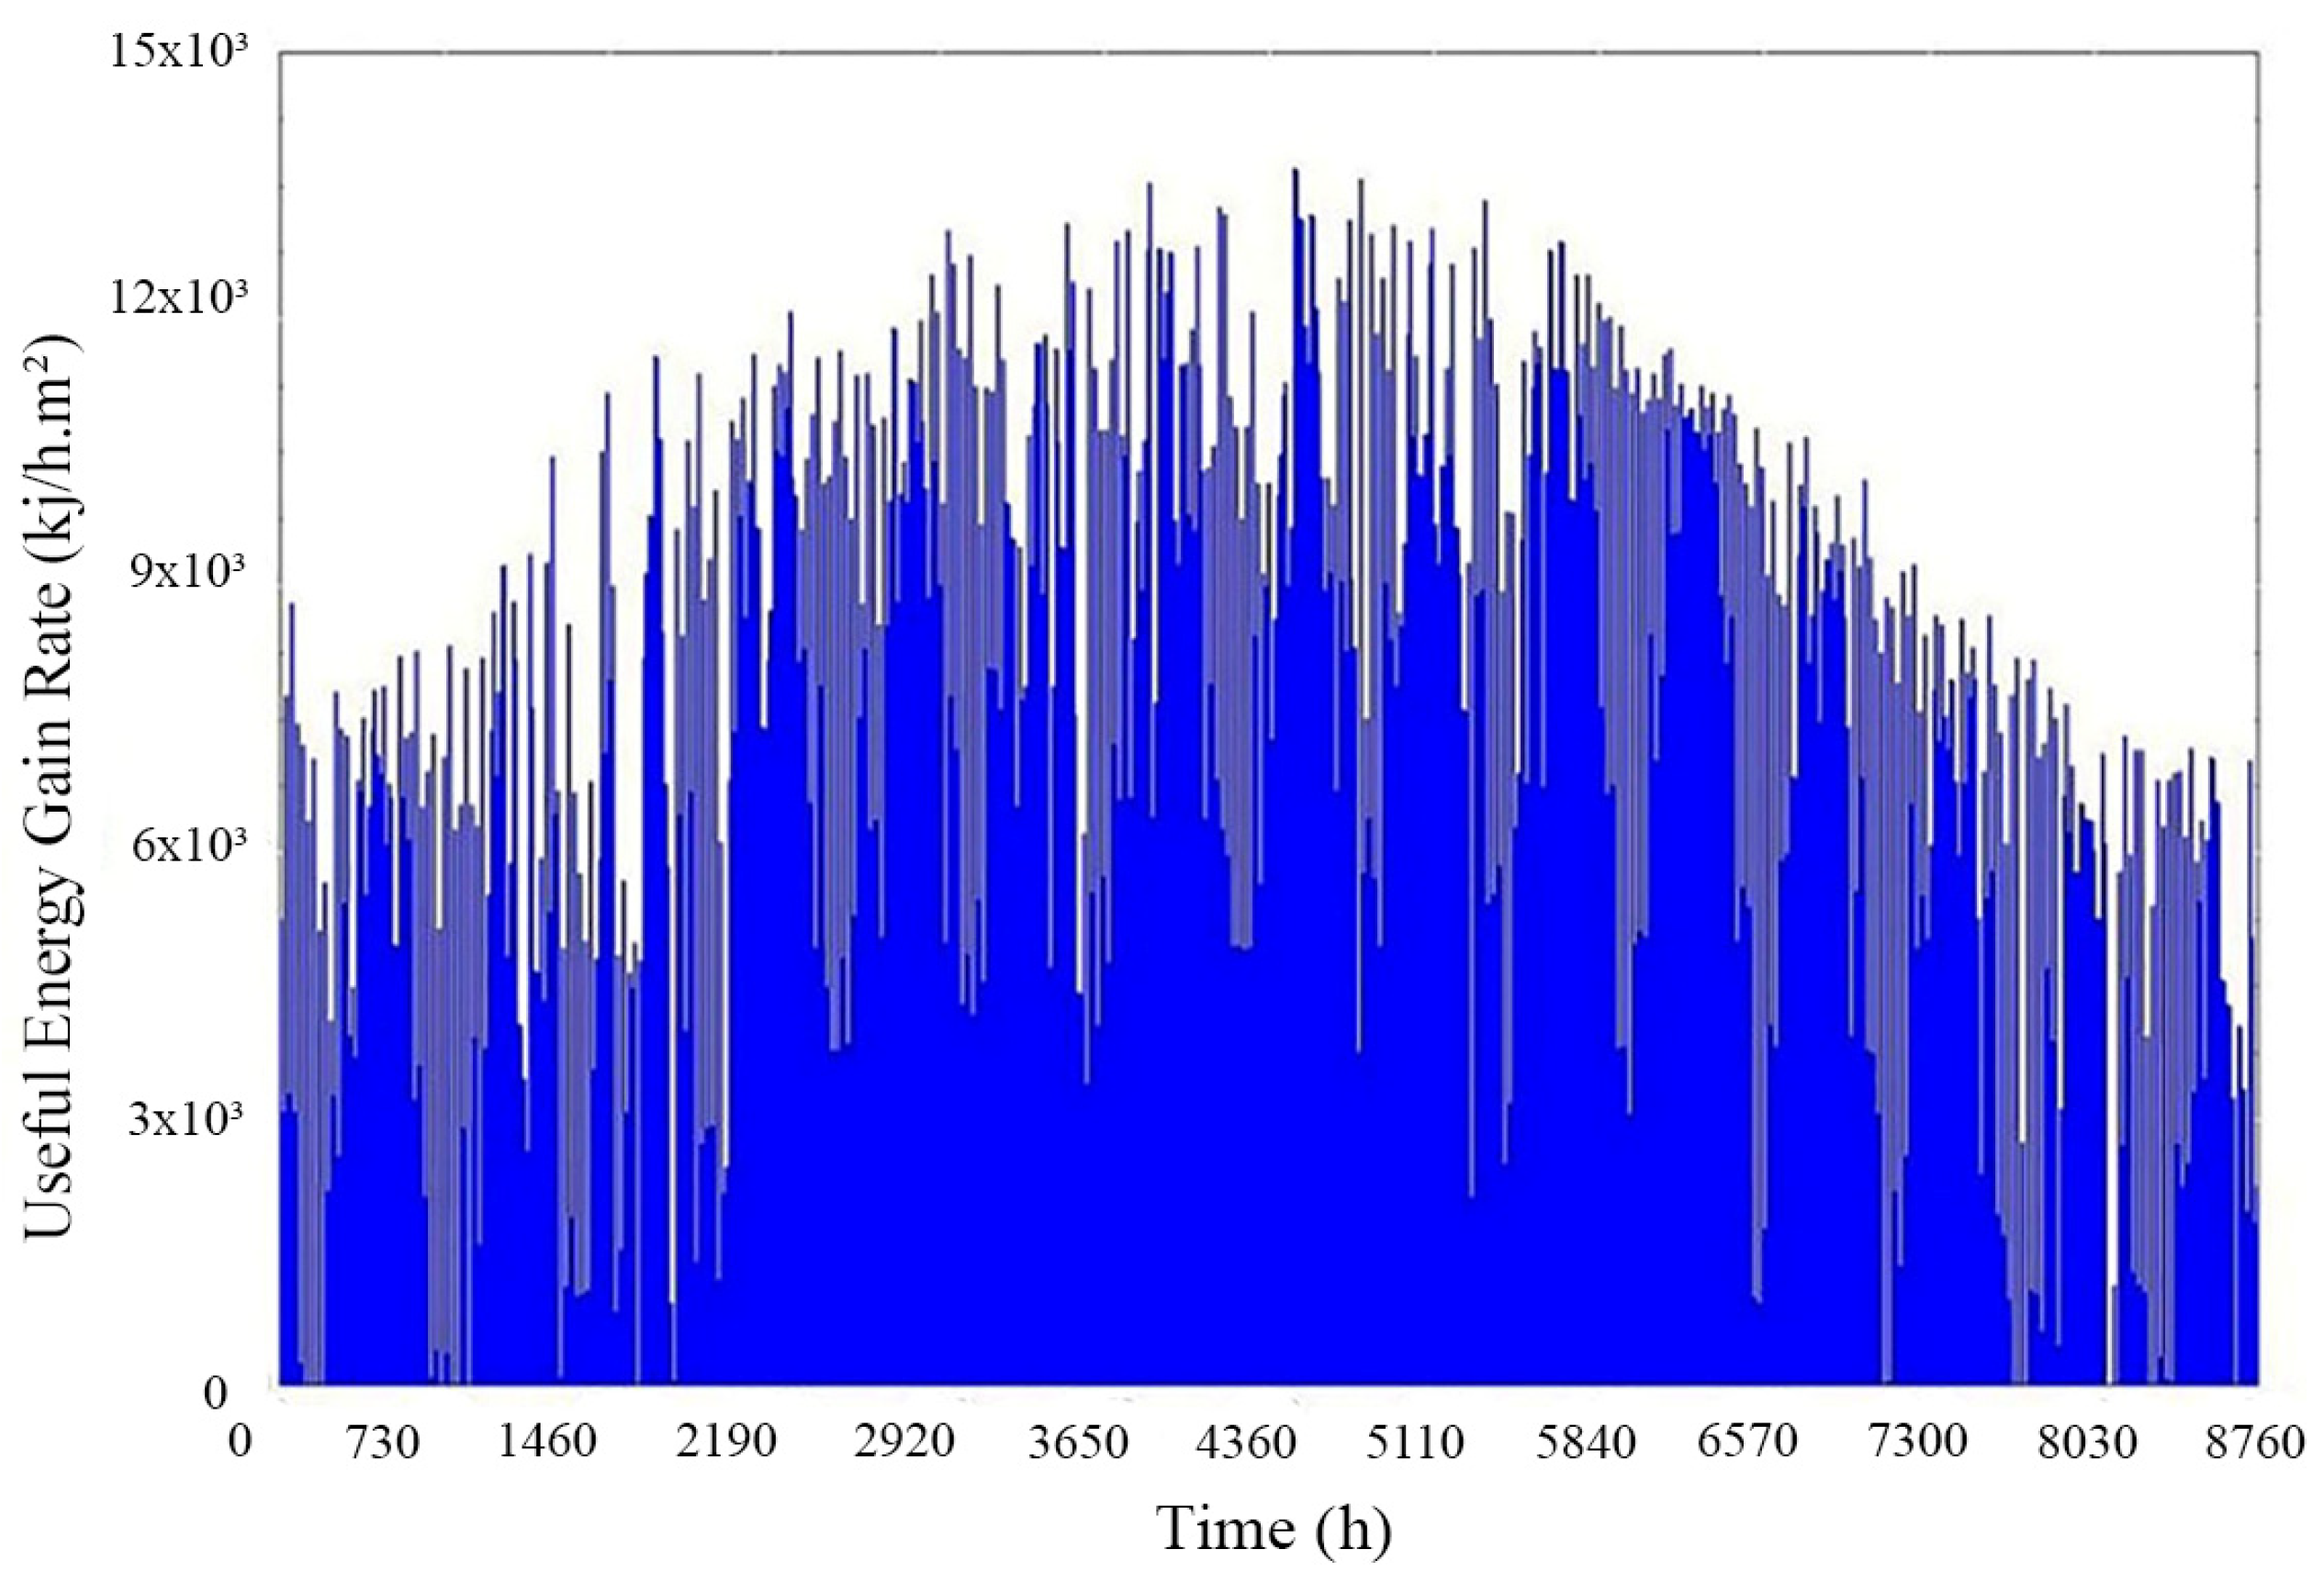
In the current system, the collectors are unable to convert the available solar radiation into sufficient useful energy to fully heat the collector fluid, as the useful energy output depends on the characteristics of the collector (such as absorber plate area, loss coefficient, emittance, and absorbance). Furthermore, weather conditions (irradiance, ambient temperature, and wind speed) and installation features (collector slope and the specific heat of the heat-transfer fluid) are important factors influencing efficiency. Figure 14 illustrates the total solar radiation converted into useful energy by a flat-plate collector, as determined by all of these factors.
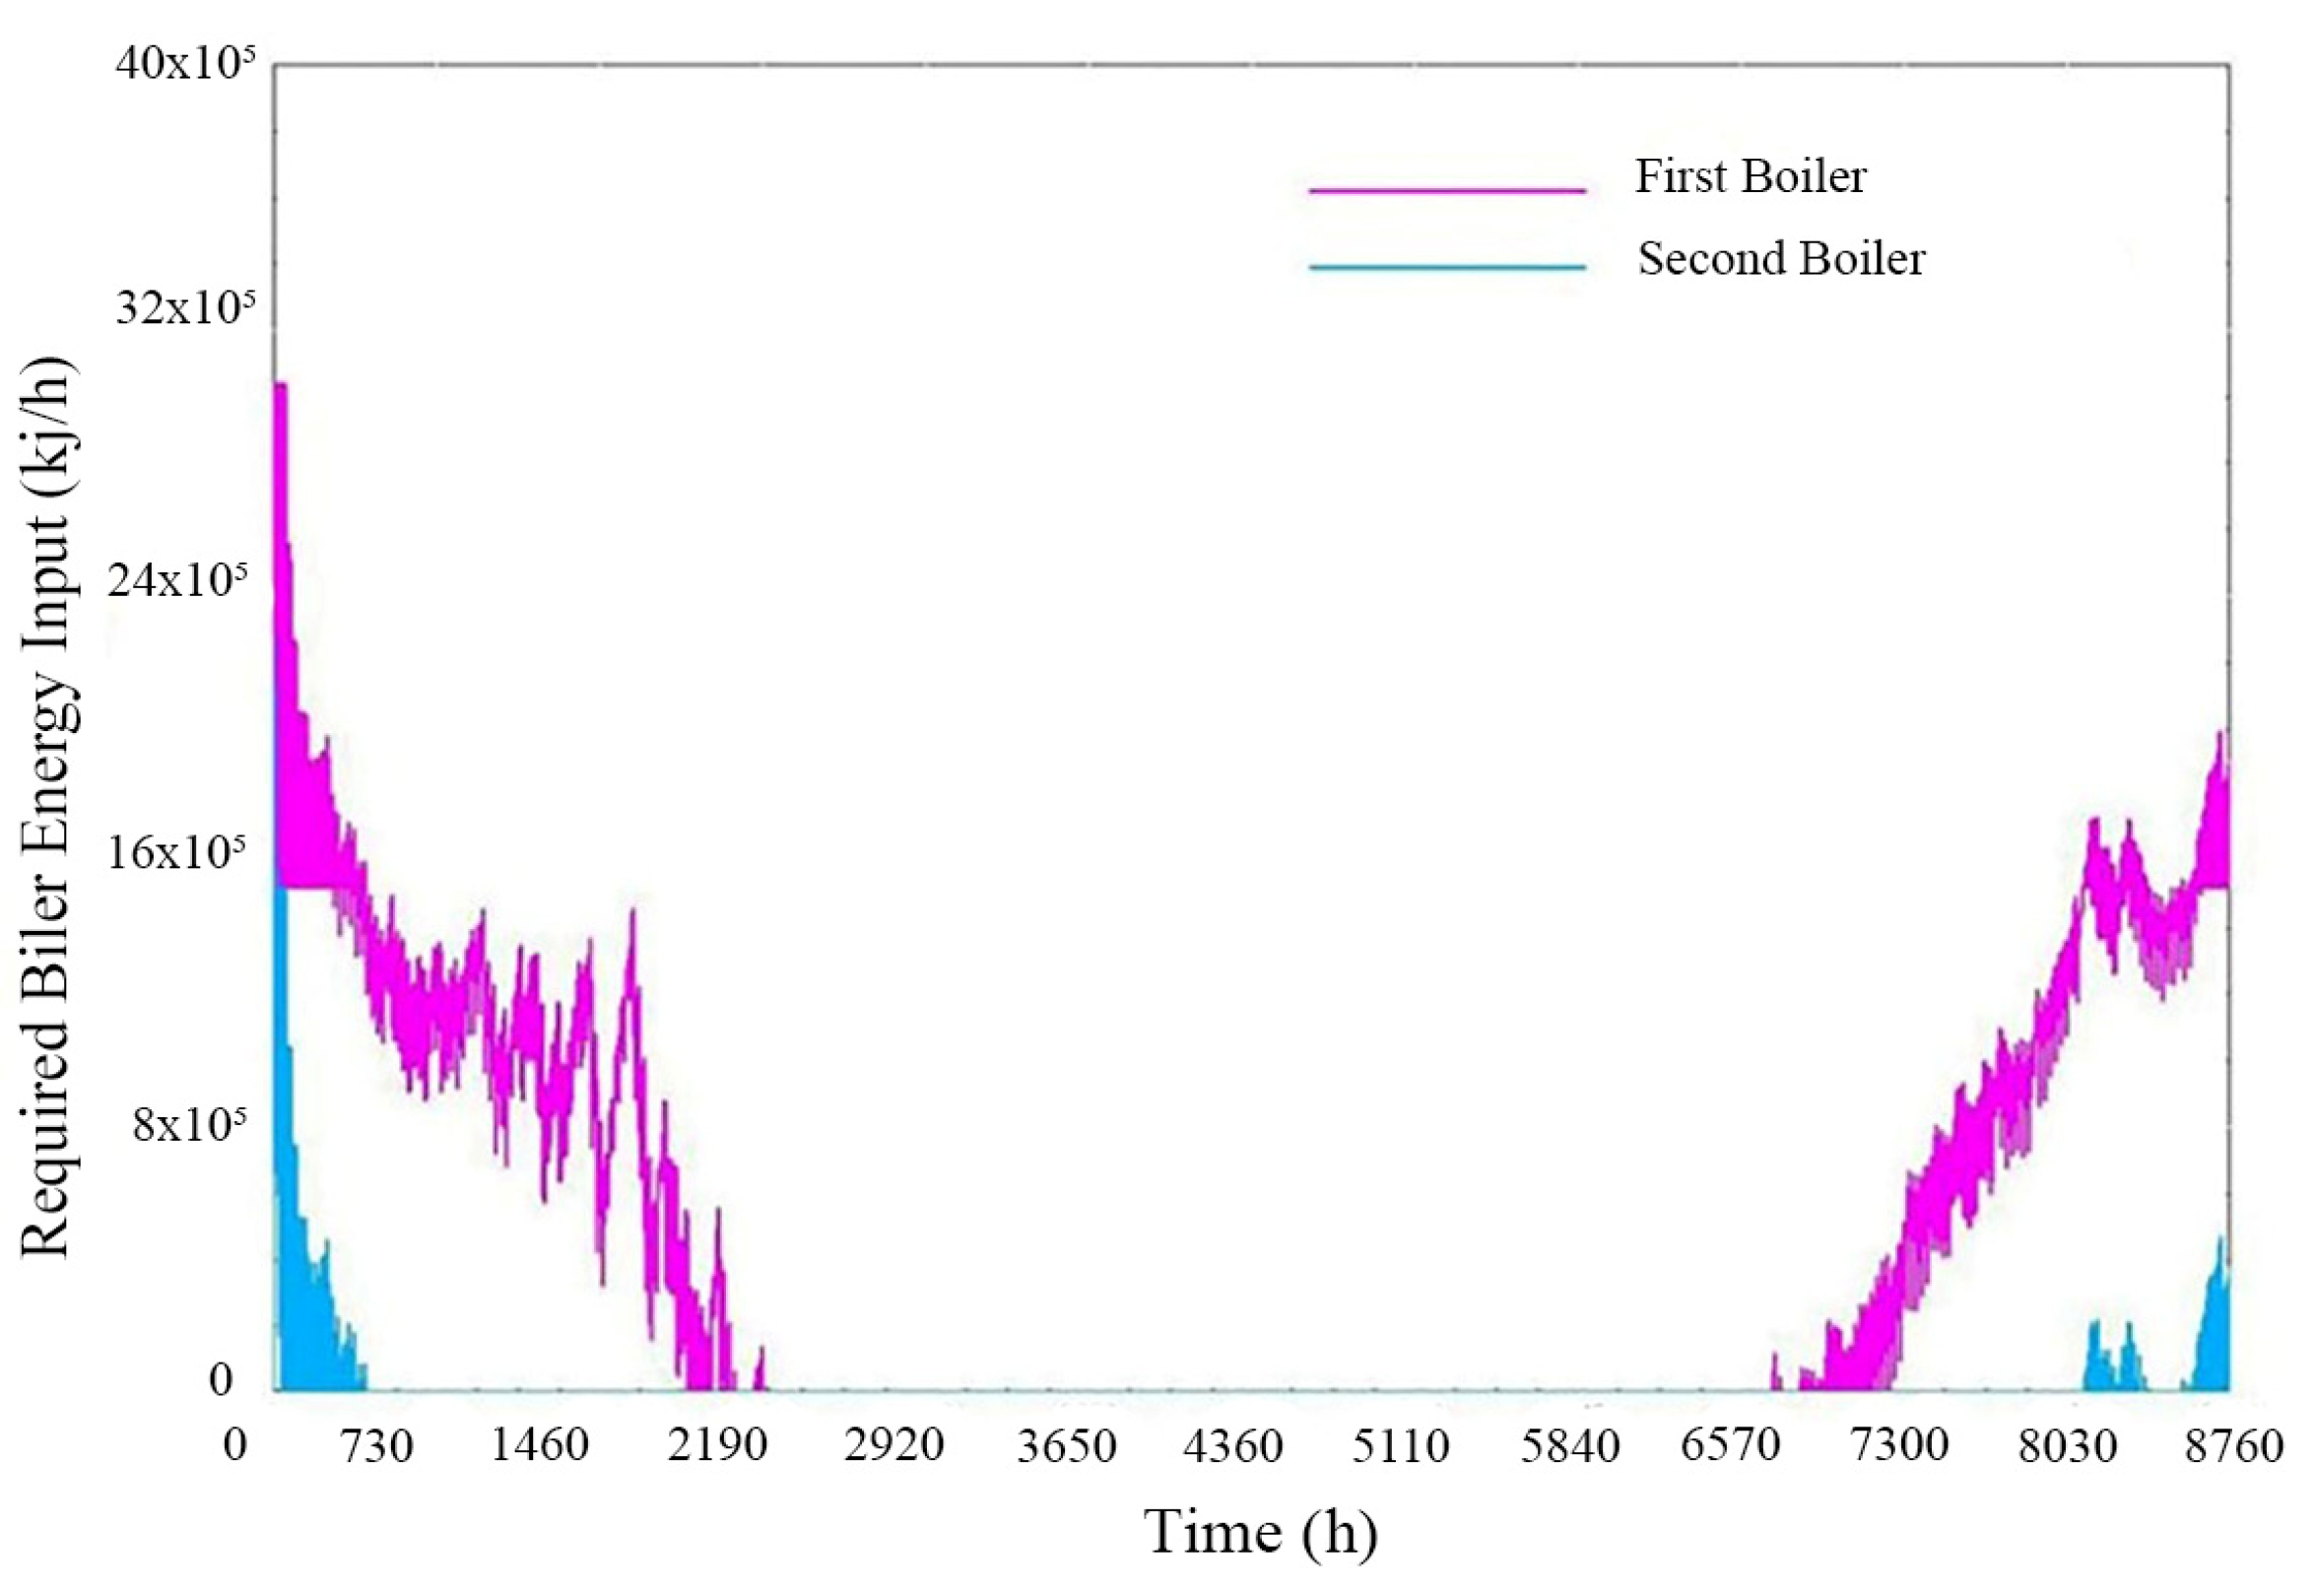
Figure 15 shows the boiler energy required to heat the DHW. The energy consumed by the first boiler is higher than that of the second boiler, as seen in the figure. In the first stage, a large volume of water is heated to a reasonable temperature range; therefore, the second boiler operates less frequently and, in some cases, is not needed when the first boiler is operational. From the end of March to the beginning of October, the boilers are not used at all, as shown in Figure 15, because solar radiation is sufficient to heat the water to the required temperature. This results in potential energy savings for a period of approximately six months.
A concise quantitative summary is presented to facilitate a clearer comparison of the SDHW system’s energy performance with that of other systems. The design domestic hot water (DHW) load of the dormitory building was calculated using the general heat-transfer equation (Equation (19)), as presented below:
Q = m · c p · T
where:
m = 15,000 kg/h (mass flow rate, assuming 1 lt ≈ 1 kg)
cp = 4.186 kJ/(kg·K) (specific heat capacity of water)
ΔT = 60 − 10 = 50 °C
Substituting these values (Equation (20)):
Q = 15,000 × 4.186 × 50 = 3.14 × 10⁶ ≈ 872 kWh
This value represents the peak hourly heating requirement for DHW production. The first boiler has a nominal capacity of approximately 930 kW (800,000 kcal/h ≈ 3,349,440 kJ/h ≈ 930 kW), which is sufficient to meet the design load. Simulation results (Figure 14 and Figure 15) indicate that, between late March and late October, the SDHW system—together with the storage tanks—meets the entire DHW demand without any auxiliary heating. During the remaining months, the solar collectors still provide partial coverage, thereby reducing the auxiliary load. This operational pattern corresponds to an estimated annual solar fraction of about 50%, indicating that the SDHW system reduces the yearly auxiliary heating requirement by roughly half compared with a boiler-only scenario. A summary of the monthly operational profile is presented in Table 8.

5.2. Analyzing Initial Investment Cost of SDHW System

Table 9 presents the technical specifications of the mechanical installation systems required to meet the sanitary hot water needs of the dormitory building using the SDHW system. All elements, except the piping systems, are listed in the table according to their quantities specified in the mechanical project, while the pipe types are listed based on their lengths in the project. The unit costs of all system elements were obtained from the aforementioned Construction and Installation Unit Prices Guide, taking into account the technical specifications provided in Table 10. These costs are reported separately in Table 9 for the years 2010, 2015, 2019, and 2024.
In this study, the initial investment costs of all components in the SDHW system were calculated by including labor expenses. The cost estimation process was carried out as follows: for example, to determine the initial investment cost of the boilers for the year 2010, the Construction and Installation Unit Prices Guide published in 2010 was first consulted, and a boiler type consistent with the technical specifications of the boilers used in the project (e.g., heating capacity) was selected from this guide. In the guide, both labor-inclusive and labor-exclusive unit costs for each system are provided separately. In this study, the labor-inclusive unit costs were adopted. The unit cost was then multiplied by the number of boilers used in the project to obtain the total cost. Accordingly, the labor-inclusive unit cost of a boiler with a heating capacity of 800,000 kcal/h was TRY 23,056.55 in the 2010 guide, and the total cost for two boilers was calculated as TRY 46,113.10. As shown in Table 10, System No. 5 represents the boilers in this project, with a total cost of TRY 46,113.10 for both boilers in 2010.
The initial investment cost of each system in euros was calculated using the euro exchange rates provided in Table 2. Accordingly, the total initial investment cost of the two boilers in 2010, amounting to TRY 46,113.10, was multiplied by the average exchange rate for 2010 (EUR/TRY 1.9983), resulting in EUR 23,076.01. As shown in Table 10, the total cost of System No. 5 in 2010 was therefore calculated as EUR 23,076.01.
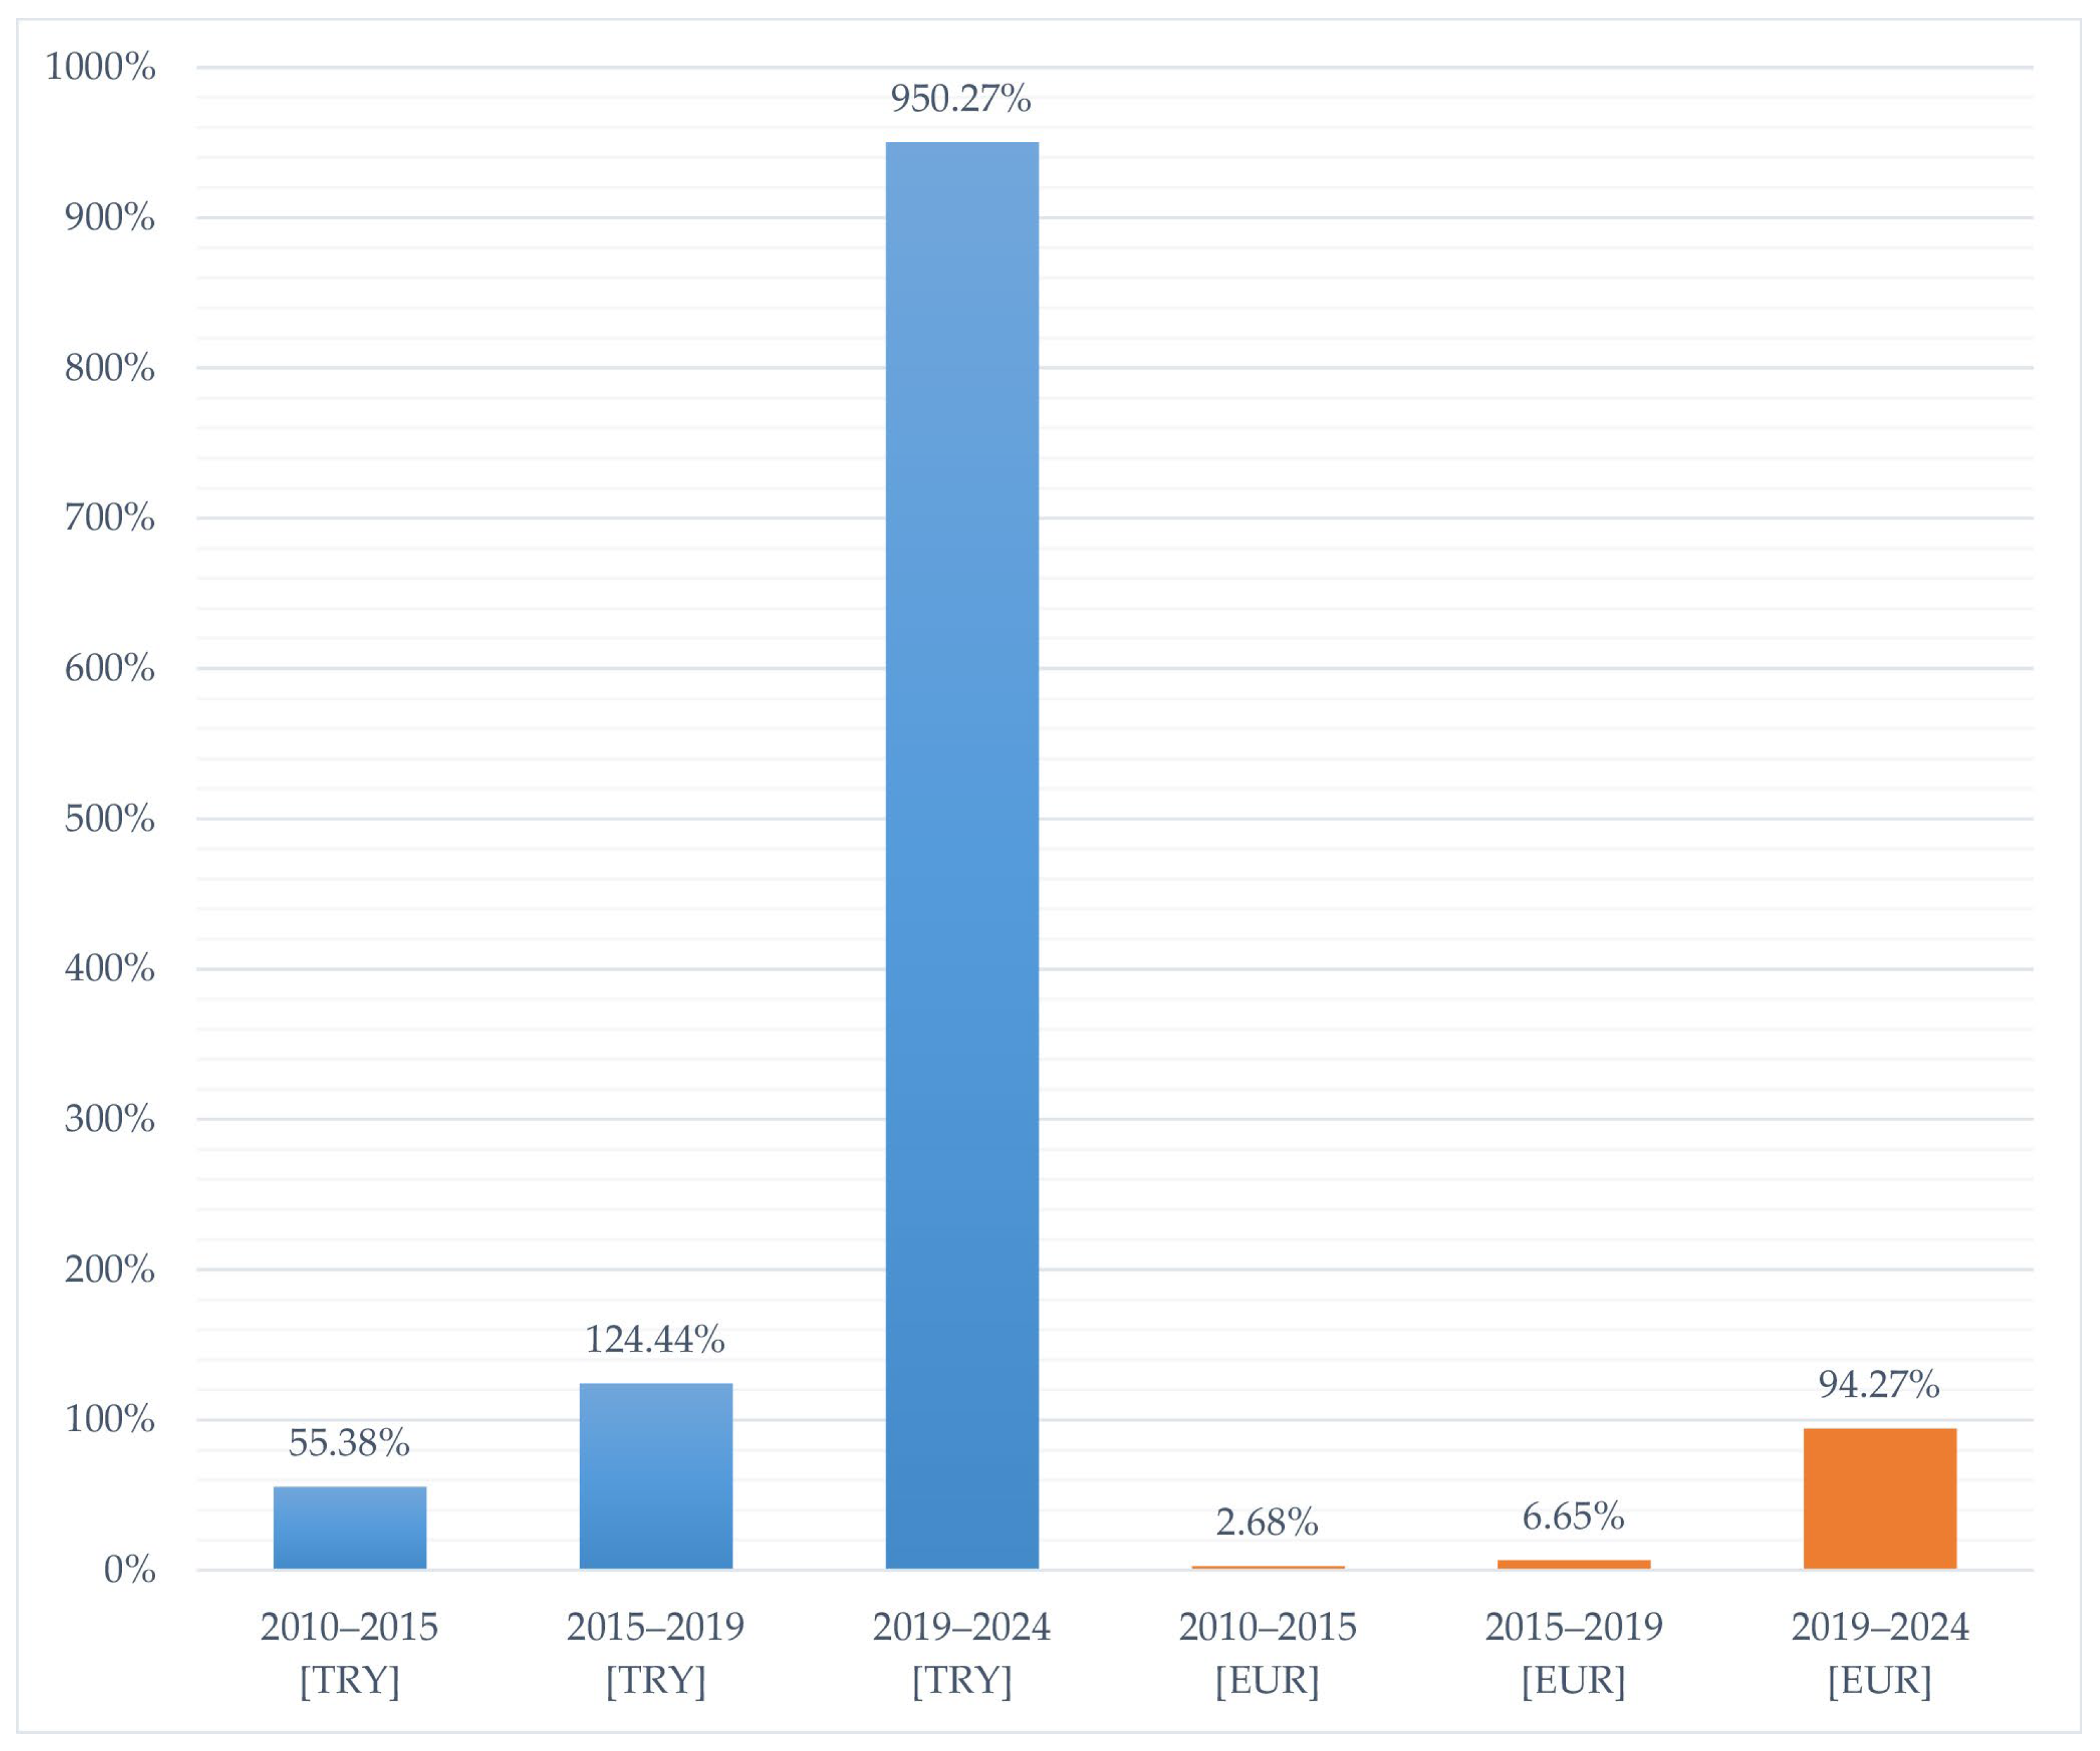
As seen in Table 10, there was a significant increase in the costs of many components between 2010 and 2024. The most remarkable increase occurred between 2019 and 2024, primarily due to high inflation rates in Türkiye, rising material prices, and fluctuations in foreign exchange rates. For the main systems, the unit costs of solar collectors, gas-fired boilers, hot water storage tanks, and circulation pumps increased by approximately 60 times between 2010 and 2024. The cost of gas-fired boilers alone rose by about 26 times, indicating a high initial investment requirement.
The increase in the prices of raw materials—including glass, metal, and insulation materials used in solar collector production, as well as steel, copper, and other metals used in boiler manufacturing—has directly affected total system costs. Furthermore, exchange rate fluctuations, customs duties, and changes in energy prices have contributed to these increases. In particular, rising fossil fuel prices have driven up production costs. Türkyılmaz [56] reported that natural gas prices of the Pipelines and Petroleum Transportation Joint Stock Company (BOTAŞ) increased by 153.9% for residences, 238% for small businesses, 599% for large industry, and 805.5% for power plants during the forty-month period between 31 December 2018 and 1 May 2022. The authors also noted that the increase in BOTAŞ’s natural gas sales prices was 34.8–605.6% higher than the inflation rate.
Circulation pumps experienced the highest increase, rising by approximately 75 times. This was largely driven by the increased cost of materials used in pump production (metal, plastic, etc.) and, in particular, fluctuations in steel and copper prices tied to exchange rates. As shown in Table 9, the total pipe length in the system was substantial. Given that piping costs scale with length, it is clear that they were also significantly impacted by the general increase in metal and plastic material prices. In the present study, pipe purchasing costs rose by approximately 42 times between 2010 and 2024. Upon a general evaluation of the components.
  • Certain components—such as the boiler, solar collector, boiler-supported hot water tank, and circulation pump—constitute the largest share of the total system cost.
  • Other components—such as the thermometer, manometer, and safety valve—account for the smallest share of the total system cost.
  • As a result of the study, the primary factors contributing to the increase in construction costs between 2010 and 2024 included rising fuel and material prices, higher taxes and customs duties, and increased labor costs associated with the economic policies of the Turkish government—particularly the significant devaluation of the Turkish lira against the euro following the COVID-19 pandemic. Figure 16 illustrates the change in the total initial investment cost of the SDHW system designed for the dormitory building, expressed in both Turkish lira and euro, over the years. The most pronounced cost increase occurred between 2019 and 2024, largely due to the inability to control price escalations within Türkiye’s recent free-market conditions. Furthermore, the lack of adequate support for domestic producers has increased foreign dependency, causing materials purchased in foreign currency to impose an excessive financial burden on investors.
  • The increase in construction costs in Northern Cyprus has become inevitable due to shipping expenses for transporting materials, combined with the aforementioned dependency of the region. The appreciation of the euro may have discouraged investors from pursuing solar energy projects, especially given that such systems are generally imported. The rise in costs in euro terms can extend the payback period of solar energy investments in Northern Cyprus. Nevertheless, this situation could be reversed through government support aimed at strengthening domestic production.

6. Discussion

This study evaluated the annual energy performance of the SDHW system integrated into a 700-bed dormitory building at the Northern Cyprus Campus of Middle East Technical University using the TRNSYS simulation tool. In addition, changes in the system’s initial investment costs between 2010 and 2024 were analyzed within the context of broader economic fluctuations. When considered in light of both the region’s solar energy potential and its economic vulnerabilities, the findings suggest that the system has largely retained its feasibility from both technical and economic perspectives.
The TRNSYS-based simulation results indicate that the collector fluid temperature reached up to 80 °C between April and October, while the domestic hot water temperature exceeded the 60 °C threshold by the end of March and remained above this level until late October. These results align with the findings of Obalanlege et al. [9], who reported that a hybrid photovoltaic–thermal system with 12 panels met 68% of domestic hot water demand in the United Kingdom. Similarly, Ghorab et al. (2018) [7] demonstrated that SDHW systems in Canada achieved 69.4% higher efficiency compared to conventional natural gas–based water heating systems. This notable performance advantage underscores the potential of solar thermal technologies to deliver substantial energy savings, even in moderate climatic zones. In this context, the present study’s results reinforce the view that regions with high solar irradiation—such as Northern Cyprus—provide particularly favorable conditions for optimizing both the operational efficiency and long-term viability of SDHW systems.
The activation of the auxiliary heating unit during the winter months—when water temperatures drop below the 60 °C threshold—highlights the importance of hybrid configurations in maintaining seasonal efficiency. This observation is consistent with the findings of Michopoulos et al. [32], who reported that combining flat-plate collectors with air-source heat pumps yielded the lowest primary energy consumption among the configurations tested. Similarly, Kalogirou and Papamarcou [31] demonstrated that a hybrid PV/T system in Cyprus achieved an annual average efficiency of 31.7%, with an optimal water flow rate of 25 lt/h enhancing overall performance. Within this context, the maximum hot water flow rate of 15,000 lt/h determined in the present study falls well within the operational ranges reported in the literature, underscoring both the system’s scalability and its suitability for high-occupancy facilities.
In the economic analysis, the observed 26- to 75-fold increase in system component costs between 2010 and 2024 underscores the critical factors shaping long-term investment decisions in renewable energy projects. This escalation aligns with the findings of IRENA [57], which identify currency volatility and high inflation as major barriers to renewable energy deployment in developing economies. The nearly 75-fold increase in the cost of circulation pumps, in particular, illustrates the susceptibility of import-dependent supply chains to macroeconomic instability. Likewise, Harkouss et al. [29] emphasize that for net-zero energy building designs, economic viability is as important as technical performance, and that incorporating energy storage solutions can mitigate long-term cost burdens.
In this context, the present study is among the limited body of research that evaluates the applicability of SDHW systems from both technical and economic sustainability perspectives. Although substantial cost escalations have been observed over the analysis period, the high solar potential of the region indicates that initial capital investments can be recovered through long-term energy savings. These results are consistent with those reported by Rodriguez-Pastor et al. [28] who, through an EnergyPlus-based simulation in Spain, demonstrated that solar thermal systems can achieve favorable payback periods when deployed in regions with high solar irradiance. Their findings demonstrated that hybrid systems are capable of achieving high efficiencies in both electricity generation and domestic hot water production, thereby reinforcing the feasibility of attaining a reasonable payback period, even though no specific numerical value was reported in the study [28].
Comparative assessments have shown that Solar Domestic Hot Water (SDHW) systems incur substantially lower operational costs than conventional electric and gas-based water heating methods. In particular, solar water heating can offset approximately two-thirds of the conventional water heating demand and achieve payback periods ranging from 4 to 8 years, thereby offering clear advantages in terms of cost efficiency [58].
Additionally, with respect to emissions reduction, solar thermal systems—particularly when paired with electric backup—can achieve up to a 90% reduction in greenhouse gas emissions compared to conventional gas tank water heaters. This performance surpasses the average 81% reduction reported for heat pump water heaters operating in comparable climates [59]. When contextualized within the Mediterranean region, and specifically in Northern Cyprus, these findings underscore that SDHW systems offer not only substantial cost advantages but also superior environmental performance.
In conclusion, this study confirms the technical adequacy of the existing SDHW system while demonstrating its potential for long-term economic sustainability, even under conditions of significant macroeconomic volatility. The results provide empirically grounded insights that extend beyond the Northern Cyprus context, offering transferable implications for other Mediterranean regions with similar climatic and economic profiles. These findings can serve as evidence-based guidance for policymakers, energy planners, and investors seeking to promote the adoption of solar thermal technologies as a viable pathway toward reducing reliance on fossil fuels and enhancing energy security.

7. Conclusions

This study assessed both the technical performance and the long-term economic viability of a Solar Domestic Hot Water (SDHW) system serving a 700-bed dormitory at the Northern Cyprus Campus of Middle East Technical University. TRNSYS version 17.1 simulation results revealed that the system maintained domestic hot water temperatures above 60 °C for more than seven months each year, effectively eliminating the need for auxiliary heating for nearly half the annual cycle. These results confirm the system’s capacity to achieve substantial energy savings under Mediterranean climatic conditions, underscoring its suitability as a sustainable alternative to conventional water heating methods in similar regions.
The economic analysis revealed a substantial escalation in initial investment costs between 2010 and 2024, with component prices rising by approximately 26–75 times. This surge was primarily driven by currency depreciation, increases in material and fuel prices, and dependence on imported equipment. The most pronounced cost growth occurred after 2019, reflecting heightened macroeconomic instability in Türkiye alongside additional logistical expenses associated with Northern Cyprus. Nevertheless, the region’s high solar irradiation continues to support the long-term viability of SDHW investments. This potential can be further enhanced through targeted policy interventions, including government incentives, tax exemptions, and the promotion of local manufacturing to reduce import reliance and mitigate cost volatility.
Future research should prioritize the integration of empirical performance monitoring with simulation-based analyses to improve model accuracy and predictive reliability. Comparative evaluations of SDHW systems and alternative renewable heating technologies under similar climatic and economic conditions could yield deeper insights into relative cost-effectiveness. Furthermore, investigating innovative financing mechanisms and supportive policy frameworks has the potential to accelerate adoption, particularly in developing and import-dependent regions where economic constraints and supply chain vulnerabilities remain significant barriers.

Author Contributions

Conceptualization, A.A. and D.Y.; methodology, A.A. and D.Y.; software, A.A.; formal analysis, A.A. and D.Y.; investigation, A.A. and D.Y.; resources, A.A. and D.Y.; data curation, A.A. and D.Y.; writing—original draft preparation, A.A. and D.Y.; writing—review and editing, A.A. and D.Y.; visualization, A.A. and D.Y.; supervision, A.A. and D.Y. All authors have read and agreed to the published version of the manuscript.

Funding

This research received no external funding.

Data Availability Statement

The data presented in this study are shown in the paper.

Acknowledgments

We would like to thank Abdullah Bilgin, who is the designer of the mechanical project, for making technical specifications of the SDWH system of the dormitory in Northern Cyprus available for the purposes of the present study.

Conflicts of Interest

The authors declare no conflicts of interest.

References

  1. Pillai, I.R.; Banerjee, R. Methodology for estimation of potential for solar water heating in a target area. Sol. Energy 2007, 81, 162–172. [Google Scholar] [CrossRef]
  2. Kannan, N.; Vakeesan, D. Solar energy for future world: A review. Renew. Sustain. Energy Rev. 2016, 62, 1092–1105. [Google Scholar] [CrossRef]
  3. Kusakana, K.; Hohne, P.A. A survey of domestic water heating technologies. In Proceedings of the 25th Southern African Universities Power Engineering Conference, Stellenbosch, South Africa, 30 January–1 February 2017; pp. 1–5. [Google Scholar]
  4. Kicsiny, R. Transfer functions of solar heating systems for dynamic analysis and control design. Renew. Energy 2015, 77, 64–78. [Google Scholar] [CrossRef]
  5. Soriga, I.; Badescu, V. Performance of SDHW systems with fully mixed and stratified tank operation under radiative regimes with different degree of stability. Energy 2017, 118, 1018–1034. [Google Scholar] [CrossRef]
  6. Ma, S.; Lu, S.; Ma, D.; Li, C.; Liu, C.; Wu, L.; Ma, H. Investigation on the thermal performance and economy of a solar assisted air source heat pump domestic hot water system. Appl. Therm. Eng. 2023, 232, 121007. [Google Scholar] [CrossRef]
  7. Ghorab, M.; Entchev, E.; Yang, L. Inclusive analysis and performance evaluation of solar domestic hot water system (a case study). Alex. Eng. J. 2017, 56, 201–212. [Google Scholar] [CrossRef]
  8. Dudkiewicz, E.; Fidorów-Kaprawy, N. Hybrid domestic hot water system performance in industrial hall. Resources 2020, 9, 65. [Google Scholar] [CrossRef]
  9. Obalanlege, M.A.; Xu, J.; Markides, C.N.; Mahmoudi, Y. Techno-economic analysis of a hybrid photovoltaic-thermal solar-assisted heat pump system for domestic hot water and power generation. Renew. Energy 2022, 196, 720–736. [Google Scholar] [CrossRef]
  10. Andrés, A.C.; Cejudo López, J.M. TRNSYS model of a thermosiphon solar domestic water heater with a horizontal store and mantle heat exchanger. Sol. Energy 2002, 72, 89–98. [Google Scholar] [CrossRef]
  11. Klein, S.A. TRNSYS—A Transient System Simulation Program; Engineering Experiment Station Report 38-12; University of Wisconsin-Madison: Madison, WI, USA, 1988. [Google Scholar]
  12. Hobbi, A.; Siddiqui, K. Optimal design of a forced circulation solar water heating system for a residential unit in cold climate using TRNSYS. Sol. Energy 2009, 83, 700–714. [Google Scholar] [CrossRef]
  13. Ayompe, L.M.; Duffy, A.; McCormack, S.J.; Conlon, M. Validated TRNSYS model for forced circulation solar water heating systems with flat plate and heat pipe evacuated tube collectors. Appl. Therm. Eng. 2011, 31, 1536–1542. [Google Scholar] [CrossRef]
  14. Belmonte, J.F.; Ramírez, F.J.; Almendros-Ibáñez, J.A. A stochastic thermo-economic analysis of solar domestic hot-water systems in compliance with building energy code requirements: The case of Spain. Sustain. Energy Technol. Assess. 2022, 52, 102007. [Google Scholar] [CrossRef]
  15. Cadafalch, J.; Carbonell, D.; Consul, R.; Ruiz, R. Modelling of storage tanks with immersed heat exchangers. Sol. Energy 2015, 112, 154–162. [Google Scholar] [CrossRef]
  16. Celador, A.C.; Odriozola, M.; Sala, J.M. Implications of the modelling of stratified hot water storage tanks in the simulation of CHP plants. Energy Convers. Manag. 2011, 52, 3018–3026. [Google Scholar] [CrossRef]
  17. Colle, S.; Koller, T. Simulation and performance analysis of a solar domestic hot water system controlled by weather forecast information. Energy Procedia 2014, 57, 2496–2505. [Google Scholar] [CrossRef]
  18. Dannemand, M.; Sifnaios, I.; Tian, Z.; Furbo, S. Simulation and optimization of a hybrid unglazed solar photovoltaic-thermal collector and heat pump system with two storage tanks. Energy Convers. Manag. 2020, 206, 112429. [Google Scholar] [CrossRef]
  19. Joubert, E.C.; Hess, S.; Van Niekerk, J.L. Large-scale solar water heating in South Africa: Status, barriers and recommendations. Renew. Energy 2016, 97, 809–822. [Google Scholar] [CrossRef]
  20. U.S. Department of Energy. EnergyPlus Essentials; EnergyPlus™ Is a Whole-Building Energy Simulation Program; Successor to DOE-2.1E; U.S. Department of Energy: Washington, DC, USA, 2023; Available online: https://energyplus.net/assets/nrel_custom/pdfs/pdfs_v23.2.0/EnergyPlusEssentials.pdf (accessed on 12 August 2025).
  21. U.S. Department of Energy. EnergyPlus Official Website. Available online: https://energyplus.net/ (accessed on 12 August 2025).
  22. Vela Solaris, A.G. Polysun User Manual. 2022. Available online: https://www.velasolaris.com/en/user-manual/ (accessed on 12 August 2025).
  23. Berger, M. Assessment of residential scale renewable heating solutions with thermal energy storages. Energy 2022, 244, 122618. [Google Scholar] [CrossRef]
  24. National Renewable Energy Laboratory (NREL). System Advisor Model (SAM) Official Website. Available online: https://sam.nrel.gov/ (accessed on 12 August 2025).
  25. Hamilton, W.; Neises, T. Dispatch optimization of electric thermal energy storage within System Advisor Model. J. Energy Storage 2023, 61, 106805. [Google Scholar] [CrossRef]
  26. Hayibo, K.S.; Pearce, J.M. Vertical free-swinging photovoltaic racking energy modeling using SAM. Renew. Energy 2023, 211, 1370–1383. [Google Scholar]
  27. Gomariz, F.P.; López, J.M.C.; Munoz, F.D. An analysis of low flow for solar thermal system for water heating. Sol. Energy 2019, 179, 67–73. [Google Scholar] [CrossRef]
  28. Rodriguez-Pastor, D.A.; Becerra, J.A.; Chacartegui, R. Adaptation of residential solar systems for domestic hot water (DHW) to hybrid organic Rankine Cycle (ORC) distributed generation. Energy 2023, 263, 125901. [Google Scholar] [CrossRef]
  29. Harkouss, F.; Fardoun, F.; Biwole, P.H. Multi-objective optimization methodology for net zero energy buildings. J. Build. Eng. 2018, 16, 57–71. [Google Scholar] [CrossRef]
  30. Maxoulis, C.N.; Charalampous, H.P.; Kalogirou, S.A. Cyprus solar water heating cluster: A missed opportunity? Energy Policy 2007, 35, 3302–3315. [Google Scholar] [CrossRef]
  31. Kalogirou, S.A.; Papamarcou, C. Modelling of a thermosyphon solar water heating system and simple model validation. Renew. Energy 2000, 21, 471–493. [Google Scholar] [CrossRef]
  32. Michopoulos, A.; Ziogou, I.; Kerimis, M.; Zachariadis, T. A study on hot-water production of hotels in Cyprus: Energy and environmental considerations. Energy Build. 2017, 150, 1–12. [Google Scholar] [CrossRef]
  33. Soylu, R. Turkish Lira: What is Erdogan’s New Economic Model for Turkey? Middle East Eye. 18 December 2021. Available online: https://www.middleeasteye.net/news/turkey-lira-erdogan-new-economic-model-what (accessed on 20 June 2024).
  34. Thorbecke, W.; Sengonul, A. The impact of exchange rates on Turkish imports and exports. Int. Econ. 2023, 174, 231–249. [Google Scholar] [CrossRef]
  35. World Bank. Türkiye Ekonomik Izleme Raporu, Şubat 2022: Akıntıya Karşı Kürek Çekmek; World Bank: Washington, DC, USA, 2022; Available online: https://www.worldbank.org/tr/country/turkey/publication/economic-monitor (accessed on 20 June 2024).
  36. World Bank: Washington, DC, USA. 2023. Overview. Available online: https://www.worldbank.org/tr/country/turkey/overview (accessed on 20 June 2024).
  37. Investing. Euro/Try Chart. Available online: https://www.investing.com/currencies/eur-try-chart (accessed on 1 July 2024).
  38. Ministry of Commerce of the Republic of Turkey. Uluslararası Anlaşmalar ve Avrupa Birliği Genel Müdürlüğü, KKTC Ülke Profili; Ministry of Commerce: Ankara, Turkey, 2022. [Google Scholar]
  39. Kuzey Kıbrıs Türk Ticaret Odası. Northern Cyprus in Figures and Investment Climate 2023; KKTC: Lefkoşa, Cyprus, 2023; Available online: https://www.ktto.net/wp-content/uploads/2024/05/Northern-Cyprus-in-Figures-and-Investment-Climate-2023.pdf (accessed on 12 August 2025).
  40. KKTC İstatistik Kurumu. Gayri Safi Millî Hasıla (2015–2020); KKTC: Lefkoşa, Cyprus, 2020. Available online: https://istatistik.gov.ct.tr/TEMEL-%C4%B0STAT%C4%B0ST%C4%B0KLER/GAYR%C4%B0-SAF%C4%B0-M%C4%B0LL%C4%B0-HASILA/GAYR%C4%B0-SAF%C4%B0-M%C4%B0LL%C4%B0-HASILA-2015-2020 (accessed on 12 August 2025).
  41. Court of Justice of the European Union. Case C-432/92, The Queen v. Minister of Agriculture, Fisheries and Food, Ex Parte S. P. Anastasiou (Pissouri) Ltd. and Others (Judgment of 5 July 1994); Luxembourg. 1994. Available online: https://eur-lex.europa.eu/legal-content/EN/TXT/PDF/?uri=CELEX%3A61992CJ0432 (accessed on 12 August 2025).
  42. OFX. Yearly Average Rates. Available online: https://www.ofx.com/en-au/forex-news/historical-exchange-rates/yearly-average-rates/ (accessed on 1 July 2024).
  43. Parmaksızoğlu, İ.C.; Kürekci, N.A. Technical Principles for Preparing Sanitary Installation Projects, 8th ed.; TMMOB Chamber of Mechanical Engineers, Istanbul Branch: Istanbul, Turkey, 2018; ISBN 978-605-01-1256-6. [Google Scholar]
  44. Crawley, D.B.; Lawrie, L.K. Rethinking the TMY: Is the “Typical” Meteorological Year best for building performance simulation? In Proceedings of the 14th Conference of International Building Performance Simulation Association, Hyderabad, India, 7–9 December 2015; pp. 2707–2714. Available online: https://publications.ibpsa.org/proceedings/bs/2015/papers/bs2015_2707.pdf (accessed on 13 August 2025).
  45. University of Wisconsin–Madison, Solar Energy Laboratory. TRNSYS 17: Transient System Simulation Program; Volume 4: Mathematical Reference; University of Wisconsin–Madison: Madison, WI, USA, 2012. [Google Scholar]
  46. Obalanlege, K.; Smith, J.; Brown, L. Economic and energy performance comparison between SDHW and PV-T heat pump hybrid systems. Renew. Energy J. 2020, 145, 1345–1356. [Google Scholar]
  47. Xie, Y.; Zhao, H.; Li, M. Comparative cost-benefit analysis of solar water heating and hybrid PV-T systems in Mediterranean climates. Sol. Energy 2022, 230, 123–134. [Google Scholar]
  48. Lee, A.; Wang, P. Lifecycle assessment of SDHW vs. hybrid solar-heat-pump systems in small-scale buildings. Energy Build. 2023, 297, 113510. [Google Scholar]
  49. Çakır, Ö.; Demir, F.; Yıldız, S. Feasibility of solar domestic hot water systems in energy-import-dependent areas: A case study in Northern Cyprus. Appl. Energy 2024, 365, 120000. [Google Scholar]
  50. Fernández-González, M.; López, A.; Pérez, J. Long-term investment analysis of PV-T heat pump hybrid systems under renewable energy incentives. J. Sustain. Energy 2023, 19, 95–110. [Google Scholar]
  51. Google. [Metu Northern Cyprus Campus, Satellite Image]. Google Earth. 2025. Available online: https://earth.google.com/ (accessed on 20 August 2025).
  52. Middle East Technical University (METU). Available online: https://ncc.metu.edu.tr/accommodation/dorm-and-room-options (accessed on 20 March 2024).
  53. TS-1258; Rules for Calculation for Installation Water Supply in Buildings. Turkish Standards Institution: Ankara, Turkey, 1983.
  54. TS EN 12056; Gravity Drainage Systems Inside Buildings. Turkish Standards Institution: Ankara, Türkiye, 2000.
  55. Huld, T. Typical Meteorological Data Access Service; [Dataset] PID; European Commission, Joint Research Centre (JRC): Brussels, Belgium, 2017; Available online: http://data.europa.eu/89h/jrc-tmy-tmy-download-service (accessed on 20 August 2025).
  56. Türkyılmaz, O. Enerji Fiyatları Artıyor, Enerji Yoksulluğu Yaygınlaşıyor. In Türkiye’nin Enerji Görünümü 2022; TMMOB: Ankara, Turkey, 2022; pp. 58–62. [Google Scholar]
  57. International Renewable Energy Agency (IRENA); Climate Policy Initiative (CPI). Global Landscape of Renewable Energy Finance 2023; International Renewable Energy Agency (IRENA): Abu Dhabi, United Arab Emirates, 2023; Available online: https://www.irena.org/-/media/Files/IRENA/Agency/Publication/2023/Feb/IRENA_CPI_Global_RE_finance_2023.pdf (accessed on 26 July 2025).
  58. U.S. Department of Energy. Estimating the cost and energy efficiency of a solar water heater. In Energy Saver 2025; U.S. Department of Energy: Washington, DC, USA, 2025. Available online: https://www.energy.gov/energysaver/estimating-cost-and-energy-efficiency-solar-water-heater (accessed on 13 August 2025).
  59. California Solar & Storage Association. New study documents superior performance of solar water heating. In CALSSA Press Release; California Solar & Storage Association: Sacramento, CA, USA, 2020; Available online: https://calssa.org/press-releases/2020/12/1/new-study-documents-superior-performance-of-solar-water-heating (accessed on 13 August 2025).
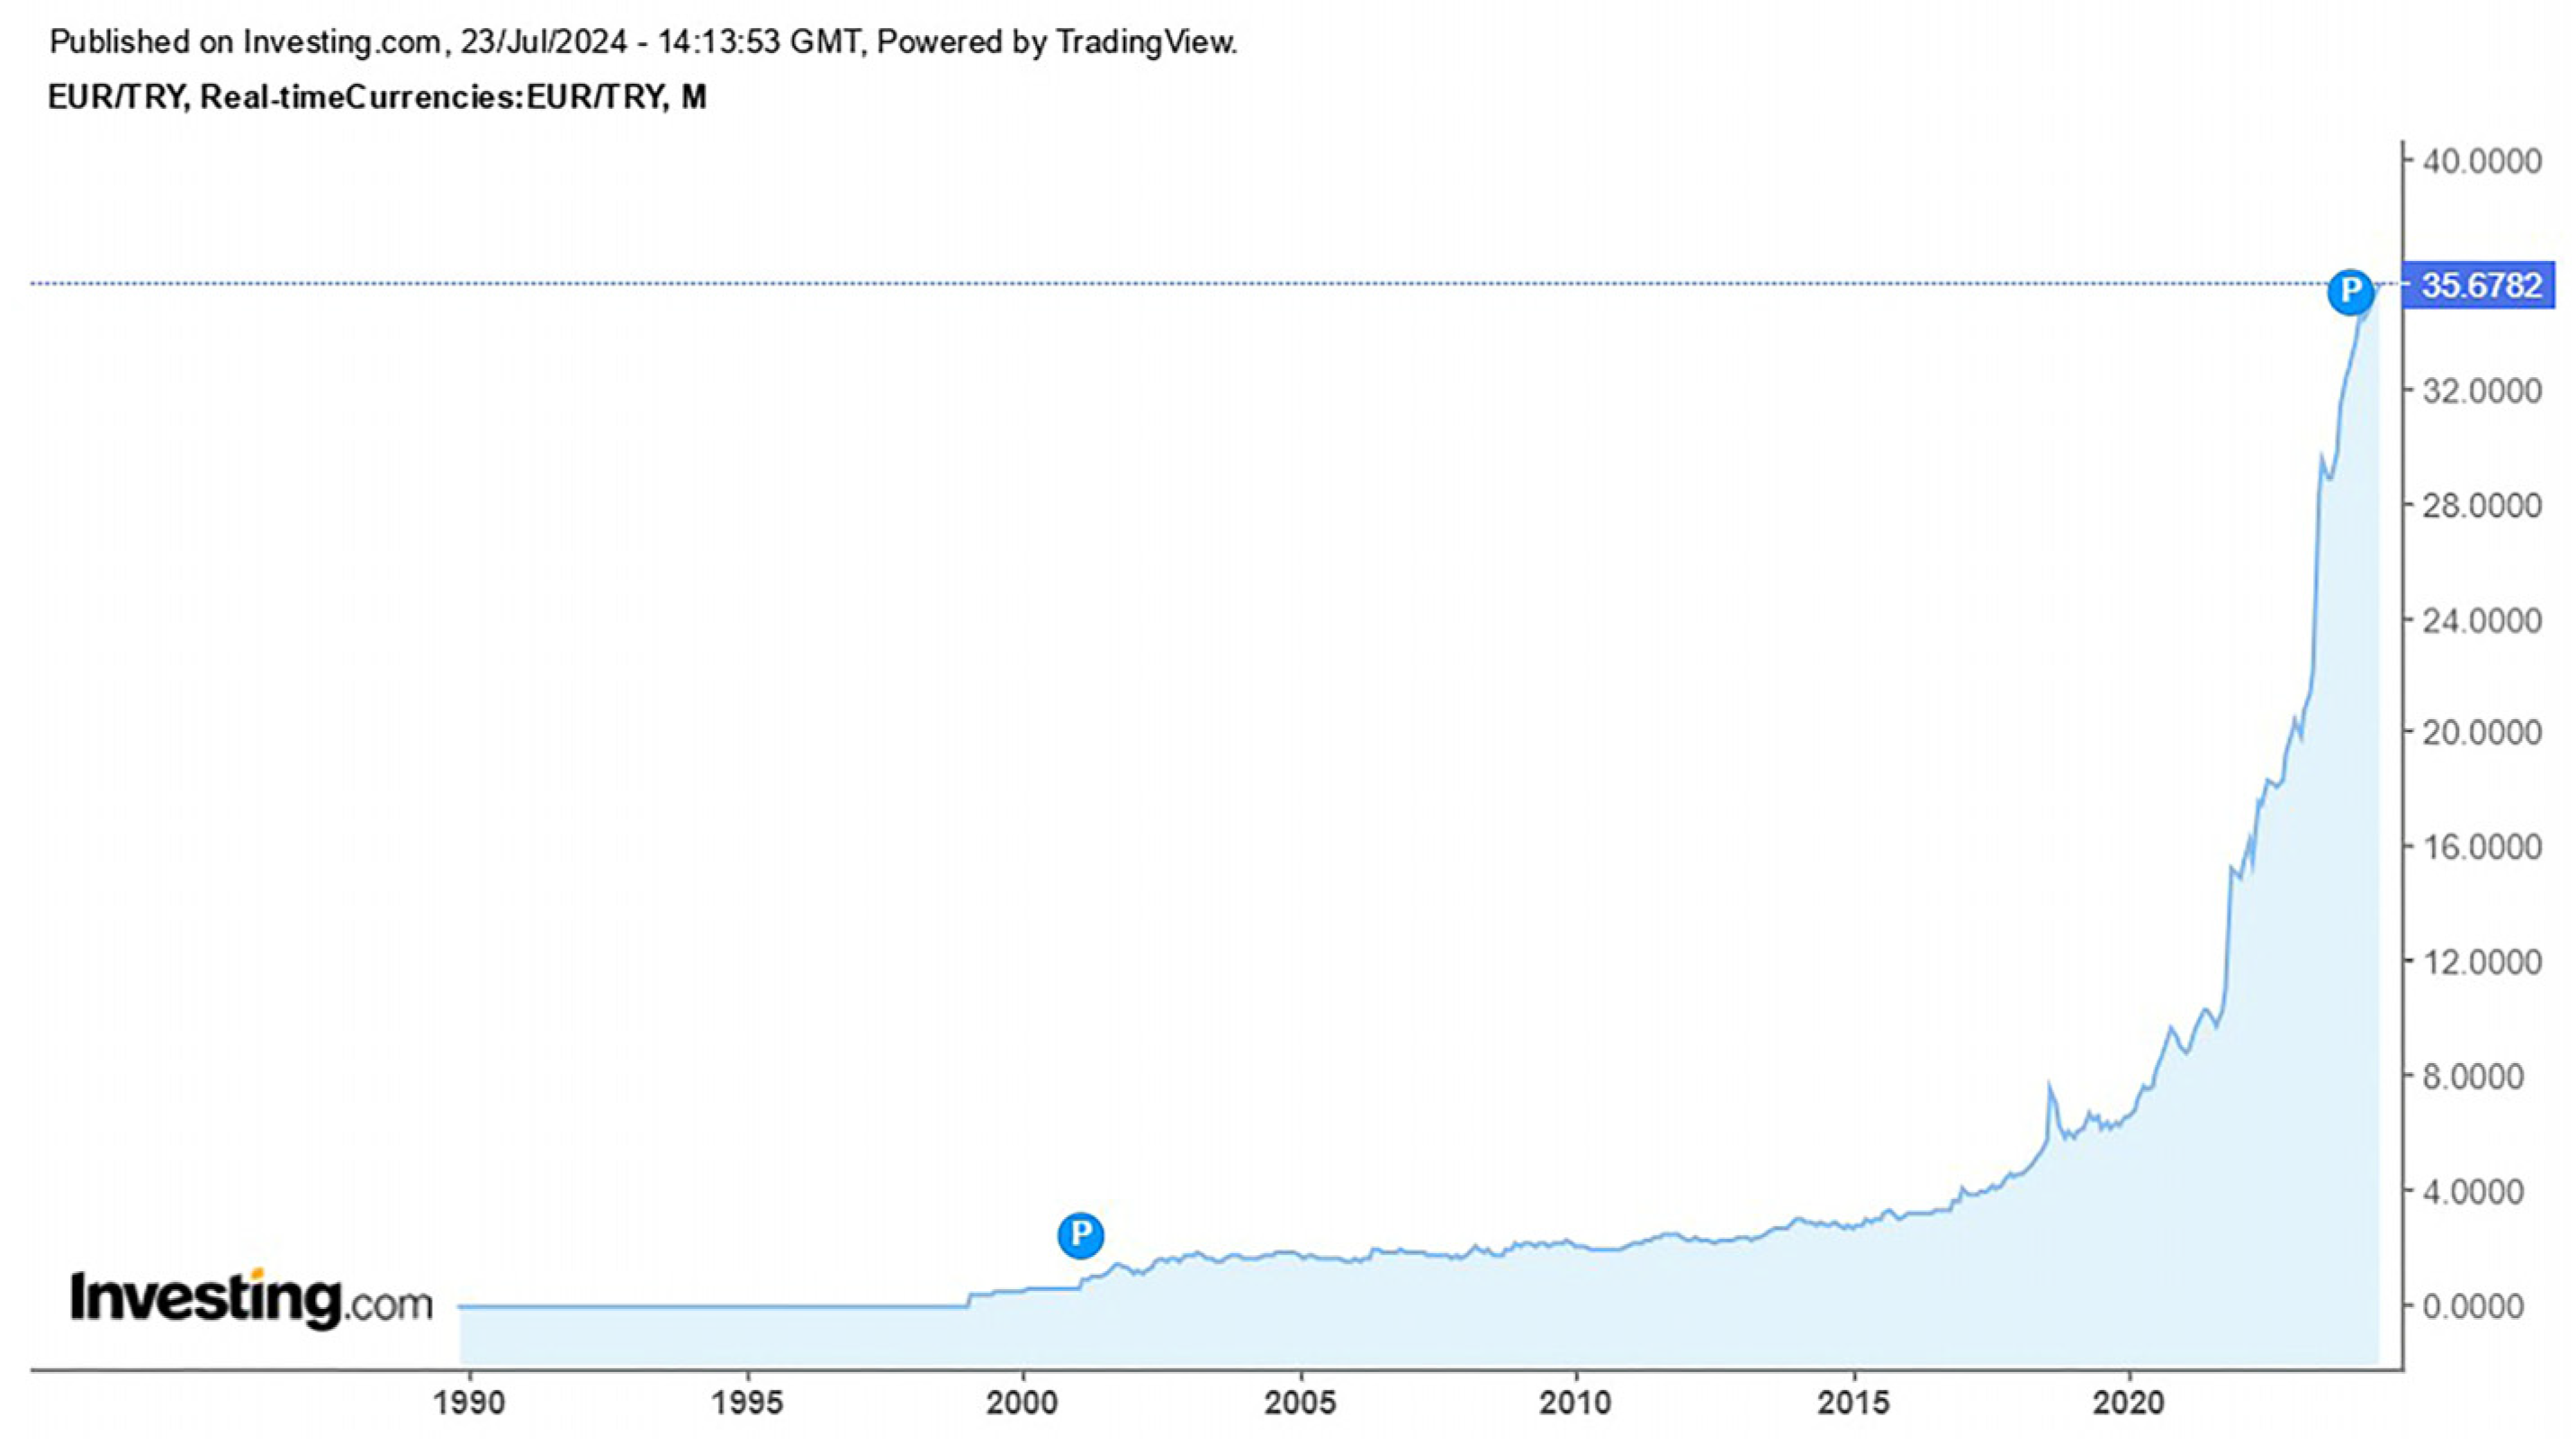
Figure 1. Change in the exchange rate of the Turkish lira against euro from 1990 to the first half of 2024 [37].
Buildings 15 03042 g001
Figure 2. The view from above of METU Northern Cyprus Campus [51]. The building shown within the red square frame corresponds to the 3rd dormitory.
Buildings 15 03042 g002
Figure 3. The red square frame highlights the 3rd dormitory building in the present study [51].
Buildings 15 03042 g003
Figure 4. The front side view and dimensions of the collector (CS: Collector supply (outlet), CR: Collector return (inlet)).
Buildings 15 03042 g004
Figure 5. The schema of the collector layout.
Buildings 15 03042 g005
Figure 6. The view of the storage tank (W: Hot water, X: Circulating water, Y: Return of heating water, Z: Entry of running water).
Buildings 15 03042 g006
Figure 7. The simplified schema of the SDHW system.
Buildings 15 03042 g007
Figure 8. The SDHW system model in TRNSYS.
Buildings 15 03042 g008
Figure 9. The schema of the collector series modeled in TRNSYS.
Buildings 15 03042 g009
Figure 10. Annual variation of solar collector fluid temperature at input of the heat exchanger.
Buildings 15 03042 g010
Figure 11. Annual variation of SDHW temperature at the outlet of the storage tank.
Buildings 15 03042 g011
Figure 12. Annual variations in using SDHW temperature.
Buildings 15 03042 g012
Figure 13. Annual variation of total (beam and diffuse) tilted surface radiation for the collector surface.
Buildings 15 03042 g013
Figure 14. Annual variation of the useful energy gain rate by the solar flat-plate collector.
Buildings 15 03042 g014
Figure 15. Annual variation in the power rate at which fuel is consumed by the boiler to heat the SDHW.
Buildings 15 03042 g015
Figure 16. The change in total incremental cost of the SDHW system designed for the dormitory in North Cyprus over the years, by Turkish lira and euro.
Buildings 15 03042 g016
Table 1. Import and export data between Türkiye and Northern Cyprus between 2016 and 2019 [36].
Türkiye—Northern CyprusExports of TürkiyeImports of Türkiye
2016$906 million$64.5 million
2017$1.09 billion$66.7 million
2018$1.22 billion$67.8 million
2018$1.27 billion$57.5 million
Table 2. Euro exchange rate averages over the years [42].
Exchange Rate Averages2010201520192024
EUR/TRY1.99833.02386.363434.4146
Table 3. Demand for DHW per day.
Technical FeaturesBath SinkShowerKitchen Sink
Number of fixtures1309648
DHW demand of fixture in an hour [lt/h]3025035
Total amount of DHW demand in an hour [lt/h]390024,0001680
Total DHW demand [lt/h]29,580
Table 4. Technical data of the flat-plate collector for horizontal installation.
Technical FeaturesValues
Total surface area [m2]2.51
Absorber surface area [m2]2.32
Aperture area [m2]2.33
Optical efficiency [%]74.3
Heat loss coefficientU1 [W/m2.K]4.16
U2 [W/m2.K2]0.0124
Thermal capacity [kJ/m2.K]6.4
Fluid capacity (heat-transfer medium) [lt]2.33
Maximum stagnation temperature [°C]221
Maximum working pressure [bar]6
Table 5. The technical data of propylene glycol-water mixture.
Technical FeaturesValues
Water content [%]50
Density (38 °C) [kg/m3]1025
Viscosity (38 °C) [kg/m.s]0.0031
Specific heat (38 °C) [kJ/kg.K]3.64
Heat-transfer rate [W/m.K]0.39
Boiling point [°C]110
Frost protection [°C]−33
Table 6. The technical data of each storage tank.
Technical FeaturesLetterValues
Volume [lt]-5000
Diameter [mm]f1890
Total height [mm]a2200
Height of exiting hot water [mm]b2100
Height of exiting circulation water [mm]c1373
Height of returning heated water [mm]d332
Height of entering running water [mm]e104
Except thermal isolation [mm]g1750
Table 7. The system components.
System Components
Buildings 15 03042 i001Flat-plate solar collectorBuildings 15 03042 i002Fluid diverting valve
Buildings 15 03042 i003BoilerBuildings 15 03042 i004Fluid mixing valve
Buildings 15 03042 i005Storage tankBuildings 15 03042 i006Pipe
Buildings 15 03042 i007Single-speed pumpBuildings 15 03042 i008Weather data processor
Buildings 15 03042 i009Heat exchangerBuildings 15 03042 i010Iterative feedback controller
Buildings 15 03042 i011Controlled flow mixerBuildings 15 03042 i012Calculator
Buildings 15 03042 i013Controlled flow diverterBuildings 15 03042 i014Printer
Table 8. Monthly operation schedule of the SDHW system.
MonthDHW LoadSolar Useful HeatBoiler Status (B1/B2)Remarks
Jan872 kWhLowB1 On/B2 OffSolar partial coverage
Feb872 kWhLowB1 On/B2 OffSolar partial coverage
Mar872 kWhMediumB1 On/B2 OffSolar gains increasing
Apr872 kWhHighB1 Off/B2 OffFull solar coverage
May872 kWhHighB1 Off/B2 OffFull solar coverage
Jun872 kWhHighB1 Off/B2 OffFull solar coverage
Jul872 kWhHighB1 Off/B2 OffFull solar coverage
Aug872 kWhHighB1 Off/B2 OffFull solar coverage
Sep872 kWhHighB1 Off/B2 OffFull solar coverage
Oct872 kWhMediumB1 On/B2 OffSolar gains decreasing
Nov872 kWhLowB1 On/B2 OffSolar partial coverage
Dec872 kWhLowB1 On/B2 OffSolar partial coverage
Table 9. The technical specifications of SDHW system components.
System NoSystem ComponentCapacityPressureFlow RateTemperaturePowerNumberSize
1Solar collector2.3 m2----84-
2Solar-assisted HW tank5000 lt16 Atu---3-
33-Speed circulation pump-6 mwc5 m3/h--2-
4Expansion tank for solar-assisted HW tank1500 lt10 Atu---1-
5Boiler800,000 kcal/h6 Atu-90/70 °C-2-
6Boiler-assisted HW tank5000 lt16 Atu 60/10 °C-3-
73-Speed circulation pump-5 mwc3 m3/h--4-
8Fuel preheater tank50 lt---2000 Watt2-
9Two-stage fuel-oil burner--110 kg/h--2-
103-Speed circulation pump-10 mwc10 m3/h--2-
113-Speed circulation pump-10 mwc11 m3/h--2-
123-Speed circulation pump-10 mwc11.5 m3/h--2-
133-Speed circulation pump-10 mwc27.5 m3/h--2-
14Daily heating fuel-oil storage1000 lt----1-
15Main heating fuel-oil storage40,000 lt----1-
16Fuel-oil pump-3 bar1000 kg/h--2-
17Expansion tank5 lt----18-
18Supply manifold-----12 m
19Return manifold-----12 m
20Ball valve-----160-
21Pressure holding valve-----18-
22Strainer-----9-
23Fuel-oil filter-----2-
24Thermometer-----24-
25Manometer-----26-
26Safety valve-----10-
27Outlet air temperature sensor-----4-
28Pipe (1/2″)------169.66 m
29Pipe (3/4″)------24.07 m
30Pipe (1″)------42.88 m
31Pipe (11/4″)------121.48 m
32Pipe (11/2″)------75.04 m
33Pipe (2″)------194.87 m
34Pipe (Ø65)------139.96 m
35Pipe (Ø80)------520.89 m
36Pipe (Ø100)------20.63 m
37Pipe (Ø125)------229.17 m
38Pipe (Ø150)------18.88 m
Table 10. The investment costs of SDHW system components based on Turkish lira (TRY) and euro (EUR).
System No(2010)
[TRY]
(2015)
[TRY]
(2019)
[TRY]
(2024)
[TRY]
(2010)
[EUR]
(2015)
[EUR]
(2019)
[EUR]
(2024)
[EUR]
112,768.0039,900.0086,683.80776,055.006389.3913,195.2513,622.2022,558.06
214,726.2528,500.0053,888.28764,601.997369.349425.188468.4422,225.15
31206.602160.006939.5647,235.00603.81714.331090.541373.01
42885.752960.004138.3338,552.411444.09978.90650.331120.63
546,113.1050,200.00126,137.781,223,414.4023,076.0116,601.5419,822.3235,561.73
614,726.2528,500.0053,888.28764,601.997369.349425.188468.4422,225.15
72256.604040.0013,247.9690,220.001129.251336.062081.892622.48
8141.30212.00472.985940.5070.7170.1174.33172.68
95963.107580.0022,124.90198,727.322984.072506.773476.895776.53
101255.202240.0013,451.1894,677.00628.13740.792113.832752.03
111255.202240.0013,451.1894,677.00628.13740.792113.832752.03
121255.202240.0013,451.1894,677.00628.13740.792113.832752.03
133114.703940.0014,818.10117,552.001558.661302.992328.643416.96
141388.652110.003479.5348,307.15694.91697.79546.801404.17
1515,123.9522,620.0034,352.79387,384.807568.367480.625398.4811,260.35
16662.001140.003066.2238,792.50331.28377.01481.851127.61
17144.00356.40683.826783.8472.06117.86107.46197.19
1821.9549.90125.261237.5010.9816.5019.6835.97
1921.9549.90125.261237.5010.9816.5019.6835.97
209488.009920.0022,305.60257,400.004748.003280.623505.287482.00
211982.702916.004771.4486,823.00992.19964.34749.822523.74
228781.307623.009912.42108,211.504394.362520.991557.723145.45
2351.50103.00257.182864.5025.7734.0640.4283.26
24832.80916.801347.848025.12416.75303.19211.81233.27
25782.60824.201224.608531.38391.63272.57192.44247.99
26520.00925.002368.4043,012.50260.22305.90372.191250.27
27453.00528.00556.007885.00226.69174.6187.37229.20
28475.05941.612020.6521,144.73237.72311.40317.54614.63
2975.82156.46349.743622.5437.9451.7454.96105.30
30184.38377.34842.598726.0892.27124.79132.41253.65
31649.921311.982911.8834,226.99325.23433.88457.60994.90
32469.00900.482004.3223,693.88234.70297.80314.97688.72
331578.453078.956668.4576,511.81789.891018.231047.932224.02
341497.572645.245780.3567,059.03749.42874.80908.371949.25
357136.1912,761.8127,904.08302,637.093571.114220.434385.078796.94
36389.91722.051557.3615,549.86195.12238.79244.74452.00
375901.1310,541.8222,355.53219,001.732953.053486.263513.136365.86
38570.181010.082176.1121,289.65285.33334.04341.97618.84
Total Investment cost166,849.24259,242.02581,840.926,110,891.2983,495.0585,733.4391,435.21177,629.00
Disclaimer/Publisher’s Note: The statements, opinions and data contained in all publications are solely those of the individual author(s) and contributor(s) and not of MDPI and/or the editor(s). MDPI and/or the editor(s) disclaim responsibility for any injury to people or property resulting from any ideas, methods, instructions or products referred to in the content.