Article

Retrofitting Design of Residential Building Rooftops with Attached Solar Photovoltaic Panels and Thermal Collectors: Weighing Carbon Emissions Against Cost Benefits

1
School of Architecture and Art Design, Hebei University of Technology, Tianjin 300130, China
2
Key Laboratory of Healthy Human Settlements in Hebei Province, Tianjin 300130, China
3
Tianjin Scientific Academy of Residential Building, Tianjin 300060, China
4
Tianjin Key Laboratory of Green Buildings and Low-Carbon Technologies, Tianjin 300060, China
*
Author to whom correspondence should be addressed.
Buildings 2025, 15(17), 3012; https://doi.org/10.3390/buildings15173012
Submission received: 3 July 2025 / Revised: 5 August 2025 / Accepted: 19 August 2025 / Published: 25 August 2025
(This article belongs to the Section Building Energy, Physics, Environment, and Systems)

Abstract

To reduce the carbon emissions of existing residential buildings while pursuing maximum cost benefits, a multi-optimization design method for the existing residential building rooftops, retrofitted by attaching the solar photovoltaic panels and thermal collectors, was proposed in the study. At first, the life cycle carbon emission and cost benefit of the retrofitted buildings were assigned as the optimization objectives, and the models of carbon emission and cost benefit were developed. Furthermore, a typical existing residential community located in the cold zone of China was selected to perform the multi-optimization based on the Grasshopper platform. Meanwhile, the laying area, laying angle, and allocation ratio of the solar photovoltaic panels and thermal collectors were selected as the design parameters. And then the best retrofitting solution suitable for the existing residential buildings was proposed. The results show that the weightings of the carbon emission of retrofitting life cycle are 42.68%, and that for the cost benefit is 57.32%. Significantly, there is a 31% reduction in carbon emissions compared to the building before retrofitting, and a 24.7% reduction in cost benefit.

1. Introduction

At this stage, the carbon emissions of the whole life cycle of buildings in China account for more than 40% of the total national carbon emissions, and the operational carbon emissions of buildings account for more than 50% of the total building carbon emissions [1]. Therefore, it is of great significance to reduce the carbon emissions of building operations. For photovoltaic panels, reduced cost, improved conversion efficiencies, and a high degree of integration with the building skin have laid the groundwork for a presence in the field of building retrofitting. PV systems in buildings are mainly divided into two types of applications. One type is the building-integrated photovoltaic (BIPV) system, which combines with building materials and directly forms part of the building, such as PV walls, PV rooftops, PV curtain wall, PV exterior window, and PV shading approaches [2]. The other is a building-attached photovoltaic system (BAPV), which mainly refers to solar PV panels additionally installed after the completion of the original building. Therefore, BAPV is more suitable for retrofitting projects because of its shorter construction period and lower installation cost [3]. In this paper, photovoltaic PV panels and solar thermal collectors, two emerging renewable energy utilization technologies, are poised for rapid development. Meanwhile, the integration of solar PV panels and thermal collectors on building rooftops can supplement electric energy and provide hot water for users.
In order to promote the development of photovoltaic and solar thermal collector technologies applied to building rooftops, many scholars have conducted different innovative research. Elaouzy and Fadar [4] demonstrated that solar PV panels and thermal collectors have the shortest discounted payback periods, the lowest levelized cost of energy and the highest saving-to-investment ratio compared to source heat pump systems, and green rooftops. Sun [5] analyzed the carbon reduction factors of PV rooftops and obtained the optimal combination of the design parameters under the case of the lowest carbon emission. Wang et al. [6] proposed a novel rural building PV/thermal wall and investigated the comprehensive performance of the demo building integrated with this wall. Furthermore, Li et al. [7] proposed an innovative adjustable PV green facade combining an adjustable PV blind system with a green facade. Kang et al. [8] utilized EnergyPlus to study the comprehensive thermoelectric performance of amorphous silicon PV windows with varying transmittances in typical cities across five climatic zones in China. Zhan et al. [9] developed a data prediction–MOO two-stage BIPV design model for PV rooftops and PV opaque facades. Balamurali et al. [10] present a solar concrete water heater as a structural rooftop component. Overall, the use of solar PV and heat collection technologies on the walls and rooftops of buildings is usually accepted to reduce the energy consumption of buildings.
Many scholars have also explored the energy-saving potential of solar PV panels and thermal collectors for buildings using multi-objective optimization. Ascione et al. [11] optimized the primary energy consumption, initial investment and operating cost for hospitals. Qiao et al. [12] considered four variables, including building orientation, window size, window visible light transmittance, and type of PV to minimize both the annual net electricity cost and the extra investment cost of BIPV windows. Luo et al. [13] evaluated the office buildings in three scenarios of no PV, PV on the rooftops, and PV on both the rooftops and facade with the objectives of energy consumption, thermal comfort, embodied carbon and economy, and dynamic payback period. Chen et al. [14] selected building orientation, north–south window-to-wall ratio, north–south window type, and insulation thickness as optimized design variables and carried out the multi-objective optimization of minimizing carbon emissions of buildings and the active system. Jiang et al. [15] assessed the cost and payback period to determine the optimal combination of envelop and solar systems for rural residences in China. In summary, the combination of energy consumption and investment costs is closely followed in the multi-objective optimization for existing buildings.
The existing studies on building retrofitting have predominantly concentrated on the trade-off between energy consumption and investment costs. However, they remain insufficient in quantitatively elucidating the synergistic balance between carbon emissions and cost benefits. Furthermore, considering the rooftops are more exposed to the environment than outside facades and are sensitive to a significant amount of solar radiation at an exceptionally high angle. Therefore, in this study, a multi-optimization design method for existing residential building rooftops, retrofitted by attaching solar photovoltaic panels and thermal collectors, is presented. The innovations of this research are as follows:
(1)
Based on photovoltaic panels and collector synergistic rooftops, the simulation model of full life cycle carbon emission and cost benefit was developed to assess the carbon emission and cost benefit of existing building rooftops retrofitting.
(2)
NSGA-II multi-objective evolutionary algorithm with entropy-TOPSIS integrated workflow was proposed based on a parametric platform. It covers energy model development, multi-objective optimization, and multi-quasi-measurement decision-making, which provides technical support for retrofitting design of existing buildings.
(3)
The existing buildings in the cold zone of China were used for an objective, and the generalizability of the proposed method in case climate regions was explored through the performance verification of carbon emission and cost benefits.

2. Methodology

In building rooftop renovation projects, the application of solar photovoltaic panels and thermal collectors can significantly reduce the building’s dependence on traditional energy sources, even surplus electricity can be fed back to the power grid after meeting the needs of buildings. In addition, China provides policy support such as subsidies or feed-in tariff subsidies to encourage the use of renewable energy, all of which will help shorten the investment payback period. In this study, carbon emissions and cost benefits over the whole life cycle of retrofitted residential buildings were selected as the evaluation indices for multi-objective optimization to pursue the balance between environmental and economic benefits.

2.1. Models of Carbon Emission and Cost Benefit

The life cycle of retrofitted residential buildings includes the pre-retrofitting phase, retrofitting phase, post-retrofitting phase, demolition, and disposal phase [16]. This study focuses on the whole life cycle of solar PV panels and thermal collector retrofitted buildings. The life cycle carbon emissions of the retrofitted buildings for solar PV panels and thermal collectors are divided into four stages: production, transport and installation, operation, and decommissioning.
The environmental benefits are mainly increased by reducing carbon emission (CE) during the operation phase of the retrofitted residential buildings, which can be calculated as follows:
C E = C E S C LCA
where CES is carbon emission from the operational phase in the remaining years of the retrofitted residential buildings, kgCO2e; CLCA is carbon emission from the retrofitting life cycle of the residential buildings, kgCO2e.
C LCA = E PRE + E RE + E POST + E D E M
where EPRE, ERE, EPOST, EEND, represent the carbon emissions of pre-retrofitting phase, retrofitting phase, post-retrofitting phase, demolition and disposal phase, kgCO2e, respectively, which involves a specific calculation model as shown in Table 1.
The cost benefit was defined as the sum of the new cost benefit after deducting the incremental cost of renovation and the cost during the operational phase of the existing residential buildings over the whole life of the retrofitted building, demonstrated as follows [18]:
C B = P EXP + P EXC I C + S ACT
where PEXP is the revenue from surplus PV power generation sold to the grid throughout the life cycle of the retrofitted building, CNY, PEXC is the revenue from surplus solar thermal collector heat generation throughout the life cycle of the retrofitted building, CNY, as shown in Equation (4), IC is incremental cost of building renovation, CNY, SACT is the cost during the operational phase of the existing residential buildings over the whole life of the retrofitted building, CNY.
P EXP = i = 1 n ( S p P n , PV ) × C EXP
P EXC = i = 1 n ( S c P n , PV ) × C EXC
where Sp is the power generation of PV panels in n-th year (kWh), Sc is heating generation of solar thermal collectors in n-th year (kWh), Pn,PV is substitution power of PV panels in n-th year, (kWh), CEXP is grid-connected electricity prices for renewable energy generation (CNY/kWh), and CEXC is measured price of heat consumption (CNY/kWh). To facilitate the calculation, the heat generated by the solar thermal collectors was converted into electricity for calculation.
S ACT = i = 1 n ( P n , PV + P n , PT ) × C E
where CE is unit price of electricity consumption, CNY/kWh, Pn,PT is replacement from collectors in n-th year, kWh.
The total incremental cost of the retrofitting (IC) can be measured and can be expressed as:
I C = C A + C B + C C
where CA is the cost of solar PV panels and thermal collectors, CNY; CB is the construction cost of solar PV panels and thermal collectors, CNY; and CC is the demolition cost of solar PV panels and thermal collectors, CNY.
The PV was selected as monocrystalline silicon cells with high power generation efficiency and long service life. The average annual power generation of PV panels can be calculated as follows [19]:
S p = H A × A p × K 1 × ( 1 K 2 )
where AP is the laying area of PV panels, m2; HA is the total solar irradiation on the light-gathering surface of PV panels, kWh/m2; K1 is power generation efficiency of PV panels, %; and K2 is system loss efficiency, %.
Considering the heat collection efficiency and ease of maintenance, it is appropriate to prioritize flat-plate type collectors. The average annual heat gain from the solar thermal collectors is calculated using Equation (9) [19]:
S C = A C × J T × ( 1 η c ) × η cd 3.6
where AC is laying area of solar thermal collector, m2; JT is total solar irradiation on the light-gathering surface of solar thermal collectors, MJ/m2; ηcd is annual average thermal efficiency of solar thermal collectors; and ηc is heat loss rate of the device such as pipes, pumps, tanks and other system, which is 15%, 10%, and 25% [20,21], respectively.

2.2. Multi-Objective Optimization

As shown in Figure 1, the multi-objective optimization study of the rooftop retrofitting design for the existing residential building in the community using solar photovoltaic panels and thermal collectors can be divided into three stages: development of the energy model, definition of objectives and design parameters, and optimization and decision-making.
In this study, a three-step process was performed to retrofit the rooftops of residential buildings using solar photovoltaic panels and thermal collectors.
Step 1: A site survey was conducted to collect building geometry information, envelope information, energy equipment data, and schedules of occupancy rate, appliance usage rate, and lighting activation rate, which were used to develop a typical model of an existing residential building in the community and create its energy model.
Step 2: Carbon emission was selected as the evaluation index for retrofitted residential buildings for multi-objective optimization. Meanwhile, EnergyPlus 24.2.0 was used to simulate the energy consumption of the retrofitted residential buildings in the community.
Step 3: A multi-objective optimization was performed using the Wallacei X 2.55module of Grasshopper 1.0.0007 embedded with the NSGA-II genetic algorithm, which is an evolutionary multi-objective optimization method with the ability to optimize non-linear and discrete decision variables and objective functions [22]. And then the Pareto frontier formed by non-dominated solutions was obtained. Furthermore, the optimal solution set was selected by making decisions on the Pareto frontier solution set using the entropy weight-TOPSIS method [23].
At first, the non-dominated set solved by NSGA-II multi-objective algorithm was normalized, as follows:
C E q * = max ( C E q ) C E q max ( C E q ) min ( C E q )
C B q * = C B q min ( C B q ) max ( C B q ) min ( C B q )
where C B q * and C E q * are q-th normalized values of the carbon emission and cost benefit in the Pareto frontier solution, respectively.
The weight of the two indices, carbon emission and cost benefit, was obtained as follows:
W CE = 1 E CE ( 1 E CE ) + ( 1 E CB )
W CB = 1 E CB ( 1 E CE ) + ( 1 E CB )
where the information entropy of each index was calculated according to Equations (14) and (15):
E CE = k q = 1 30 x CE , q q = 1 30 x CE , q ln ( x CE , q q = 1 30 x CE , q )
E CB = k q = 1 30 x CB , q q = 1 30 x CB , q ln ( x CB , q q = 1 30 x CB , q )
where ECE and ECB are information entropies of carbon emission and cost benefit, respectively, x CE , q and x CB , q are carbon emissions, and cost benefit will be the probability of taking the q-th value. Furthermore, the weighting factors are calculated as follows:
V CE , q = W CE × C E q *
V CB , q = W CB × C B q *
The positive and negative ideal solutions were determined as (1, 1) and (0, 0), which are the maximum and minimum values of each normalized index, respectively.
d + = ( 1 V CE , q ) 2 + ( 1 V CB , q ) 2
d = ( 0 V CE , q ) 2 + ( 0 V CB , q ) 2
The relative closeness coefficient of each non-dominated solution to the ideal solution was calculated, as follows:
C q = d d + + d
The larger the value of Cq, the better the evaluated solution is. And then, the optimal retrofitting design parameters for existing residential buildings using solar photovoltaic panels and thermal collectors can be obtained to weigh carbon emission against cost benefit.

3. Case Study

3.1. Information of the Case Buildings

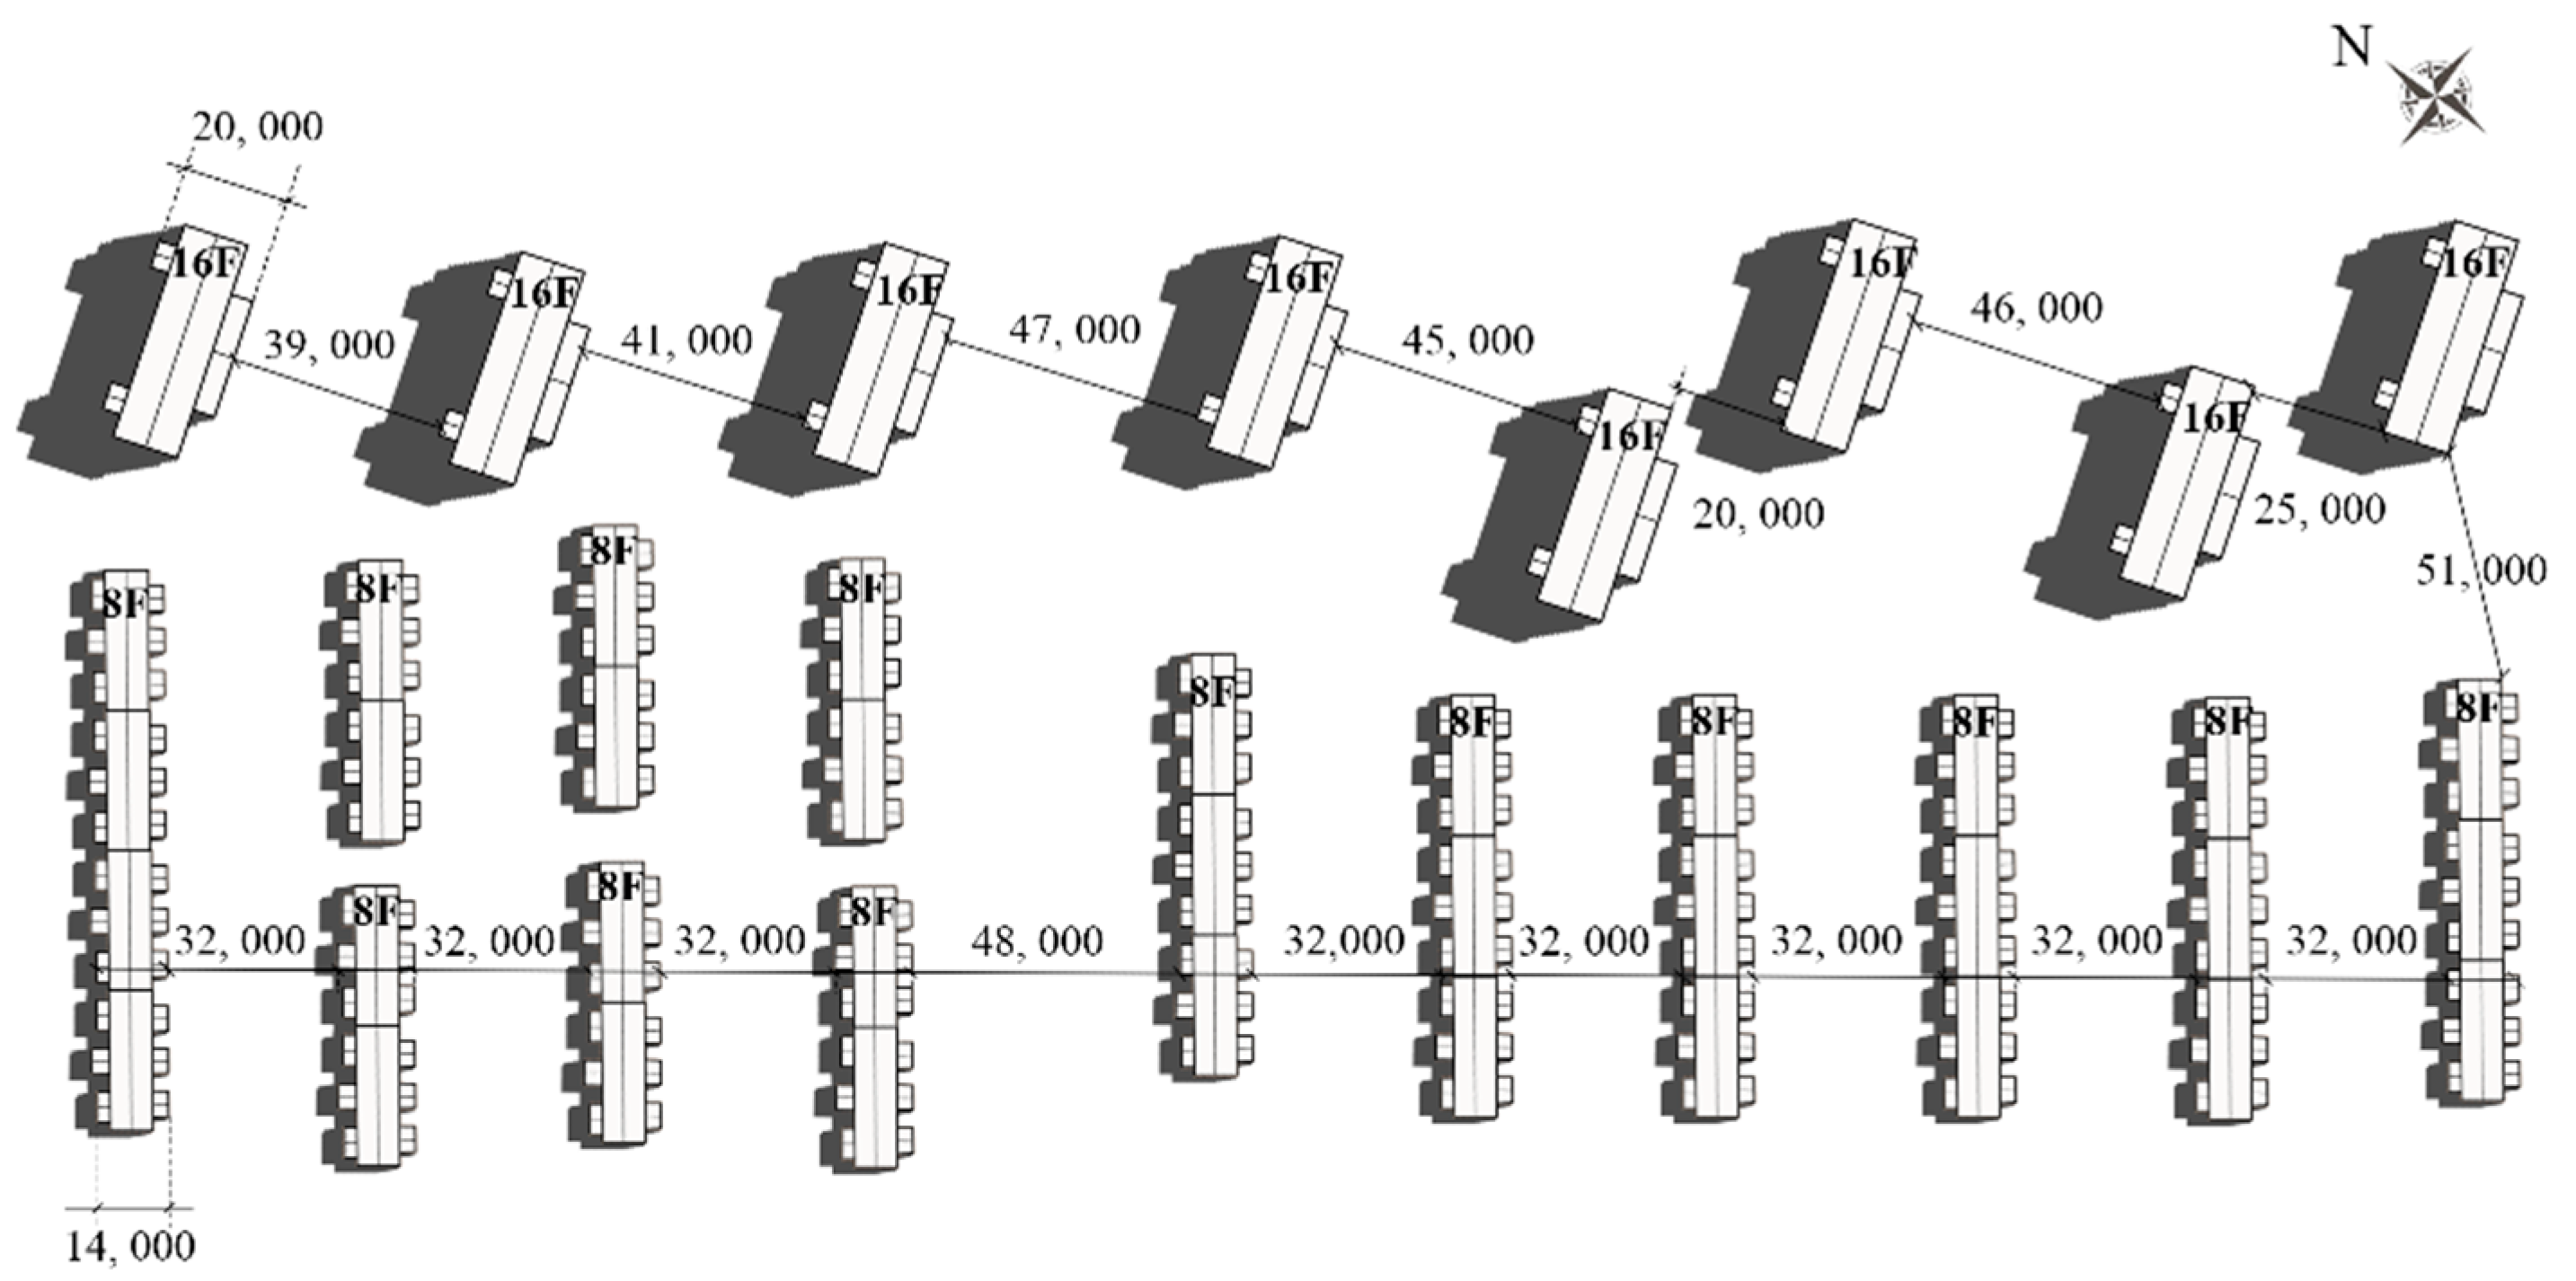
The cold zone of China is mainly located in solar resource-rich areas [24]. Therefore, installing solar PV panels and thermal collectors on the rooftops of existing residential buildings in the community is promising. Therefore, the buildings of a residential area located in Tianjin of China, cold climate zone, were selected as a case to research, as shown in Figure 2. Tianjin belongs to the more abundant solar resource area, and the solar energy guarantee rate was taken as 50% [25]. The residential area was constructed in 2014, covering an area of 78,300 m2, with a building area of 171,000 m2 and a total number of 21 buildings and 940 households. Meanwhile, the residential buildings are divided into two parts, including thirteen 8-story slab buildings and eight 16-story tower buildings, where all residential buildings have a floor height of 3 m. In addition, the buildings use municipal electricity and central heating systems.
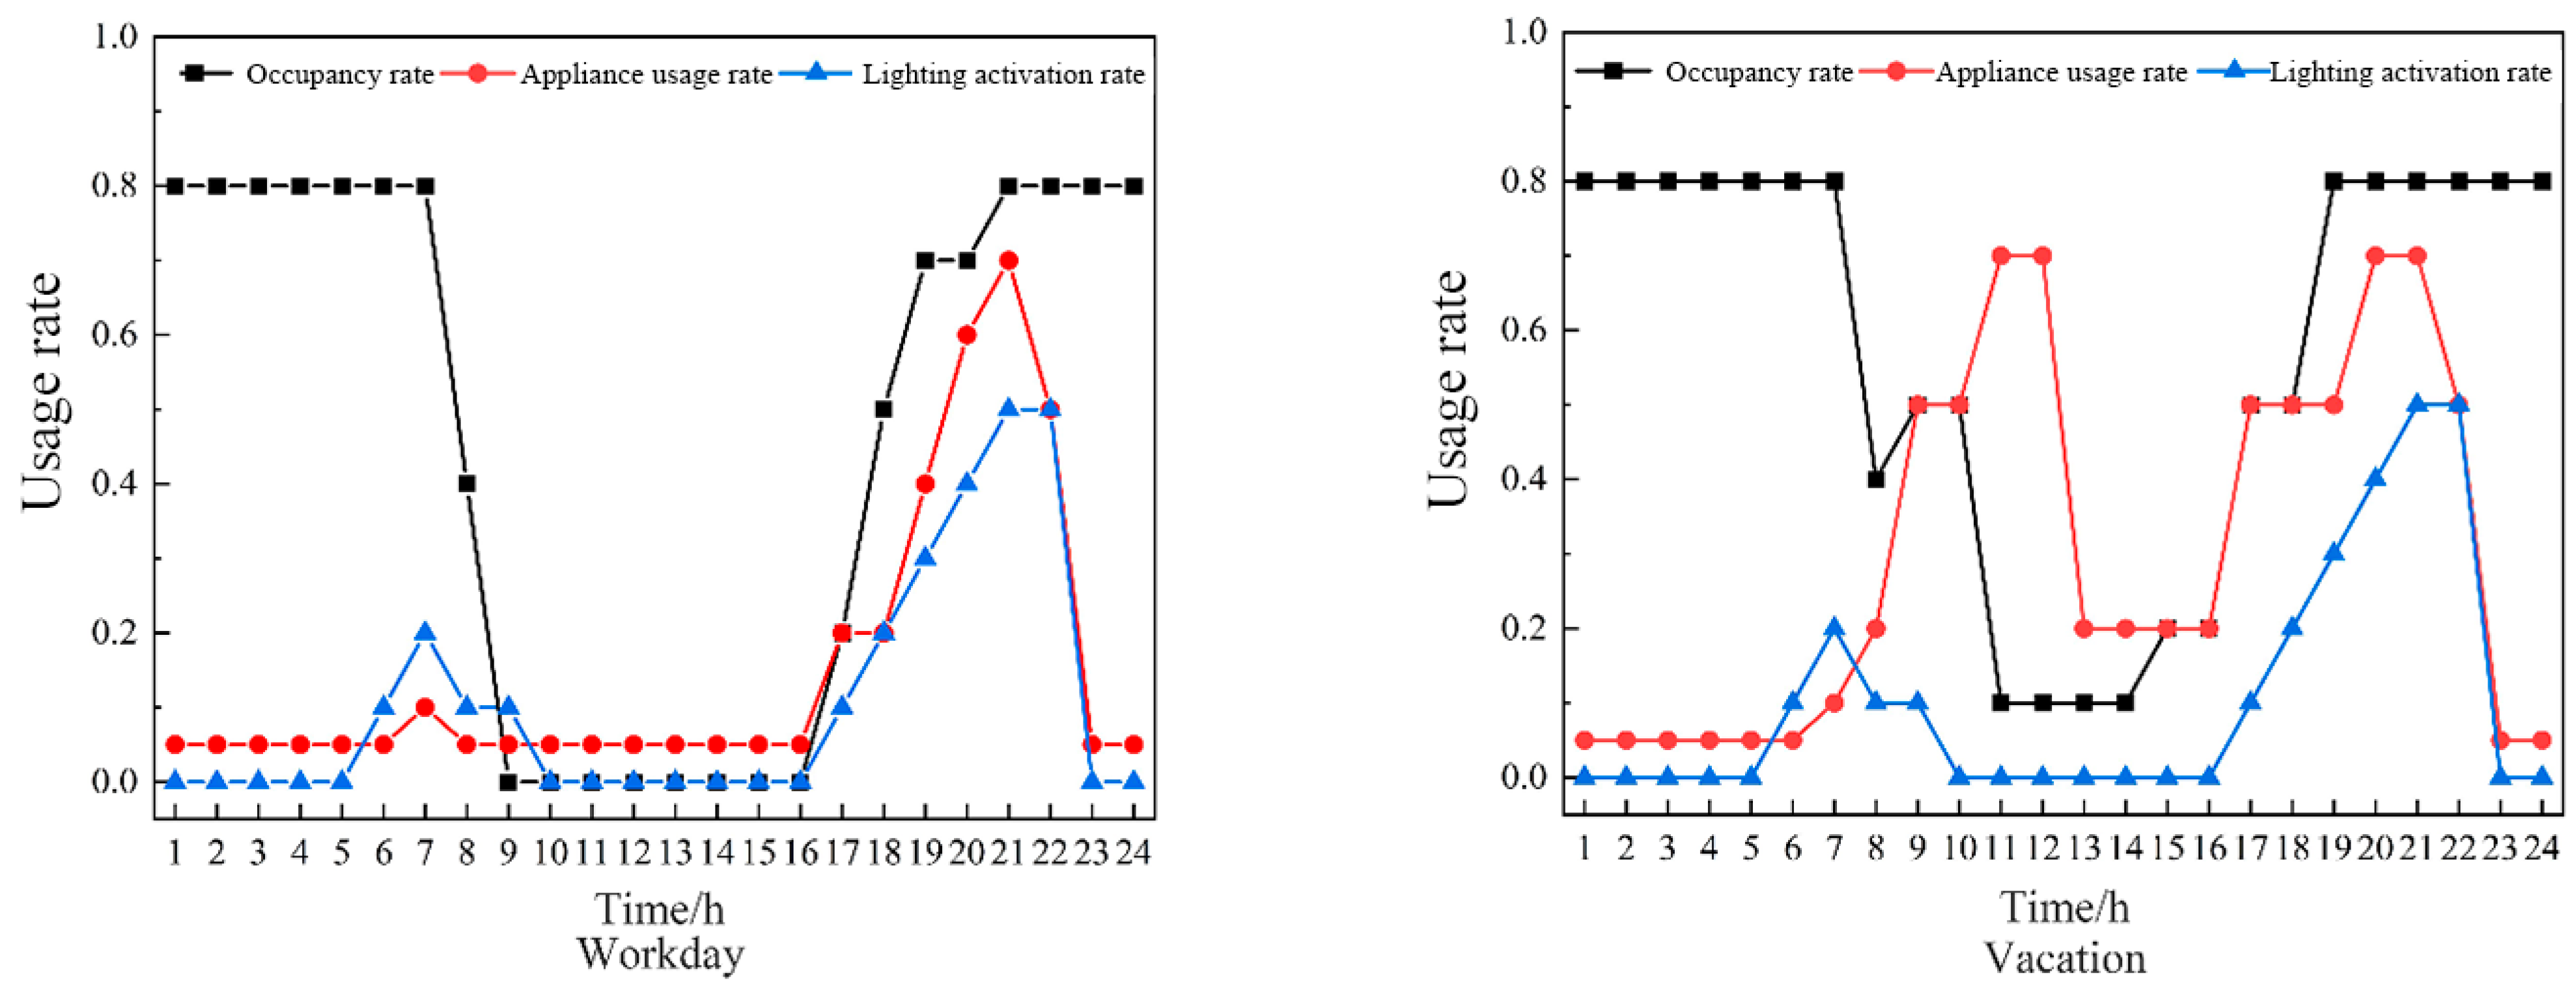
The internal spatial layout and interior wall performance have little influence on the overall carbon emissions of buildings. Therefore, in this study, the simplified model was developed in which the internal space of the buildings was divided into indoor spaces and stairwells [26]. When conducting building energy consumption calculations, the heating requirements of both stairwells and indoor spaces are usually taken into account. This is because, although stairwells do not directly serve as living spaces, they are part of the overall building’s energy consumption. The cooling requirements for stairwells may not be necessary. In energy consumption calculations, air conditioning is mainly used for cooling in summer, and stairwells may not require such equipment to maintain a comfortable indoor environment. The heat transfer coefficients of the building envelope are shown in Table 2. During the transitional seasons, when indoor conditions do not meet thermal comfort requirements, natural ventilation is achieved by opening windows. Indoor thermal disturbances are mainly affected by factors such as occupants, equipment, and lighting, the parameters of which for the case buildings during the operation are shown in Table 3. The air-conditioning period was set from 15 June to 15 September each year, with an indoor design temperature of 26 °C. The heating period was selected from 15 November to 15 March of the following year, with an indoor design temperature of 18 °C, and the heating system was set to operate in a 24 h mode. Moreover, the occupancy rate of people, usage rate of appliances, and lighting activation rate are shown in Figure 3 [27].
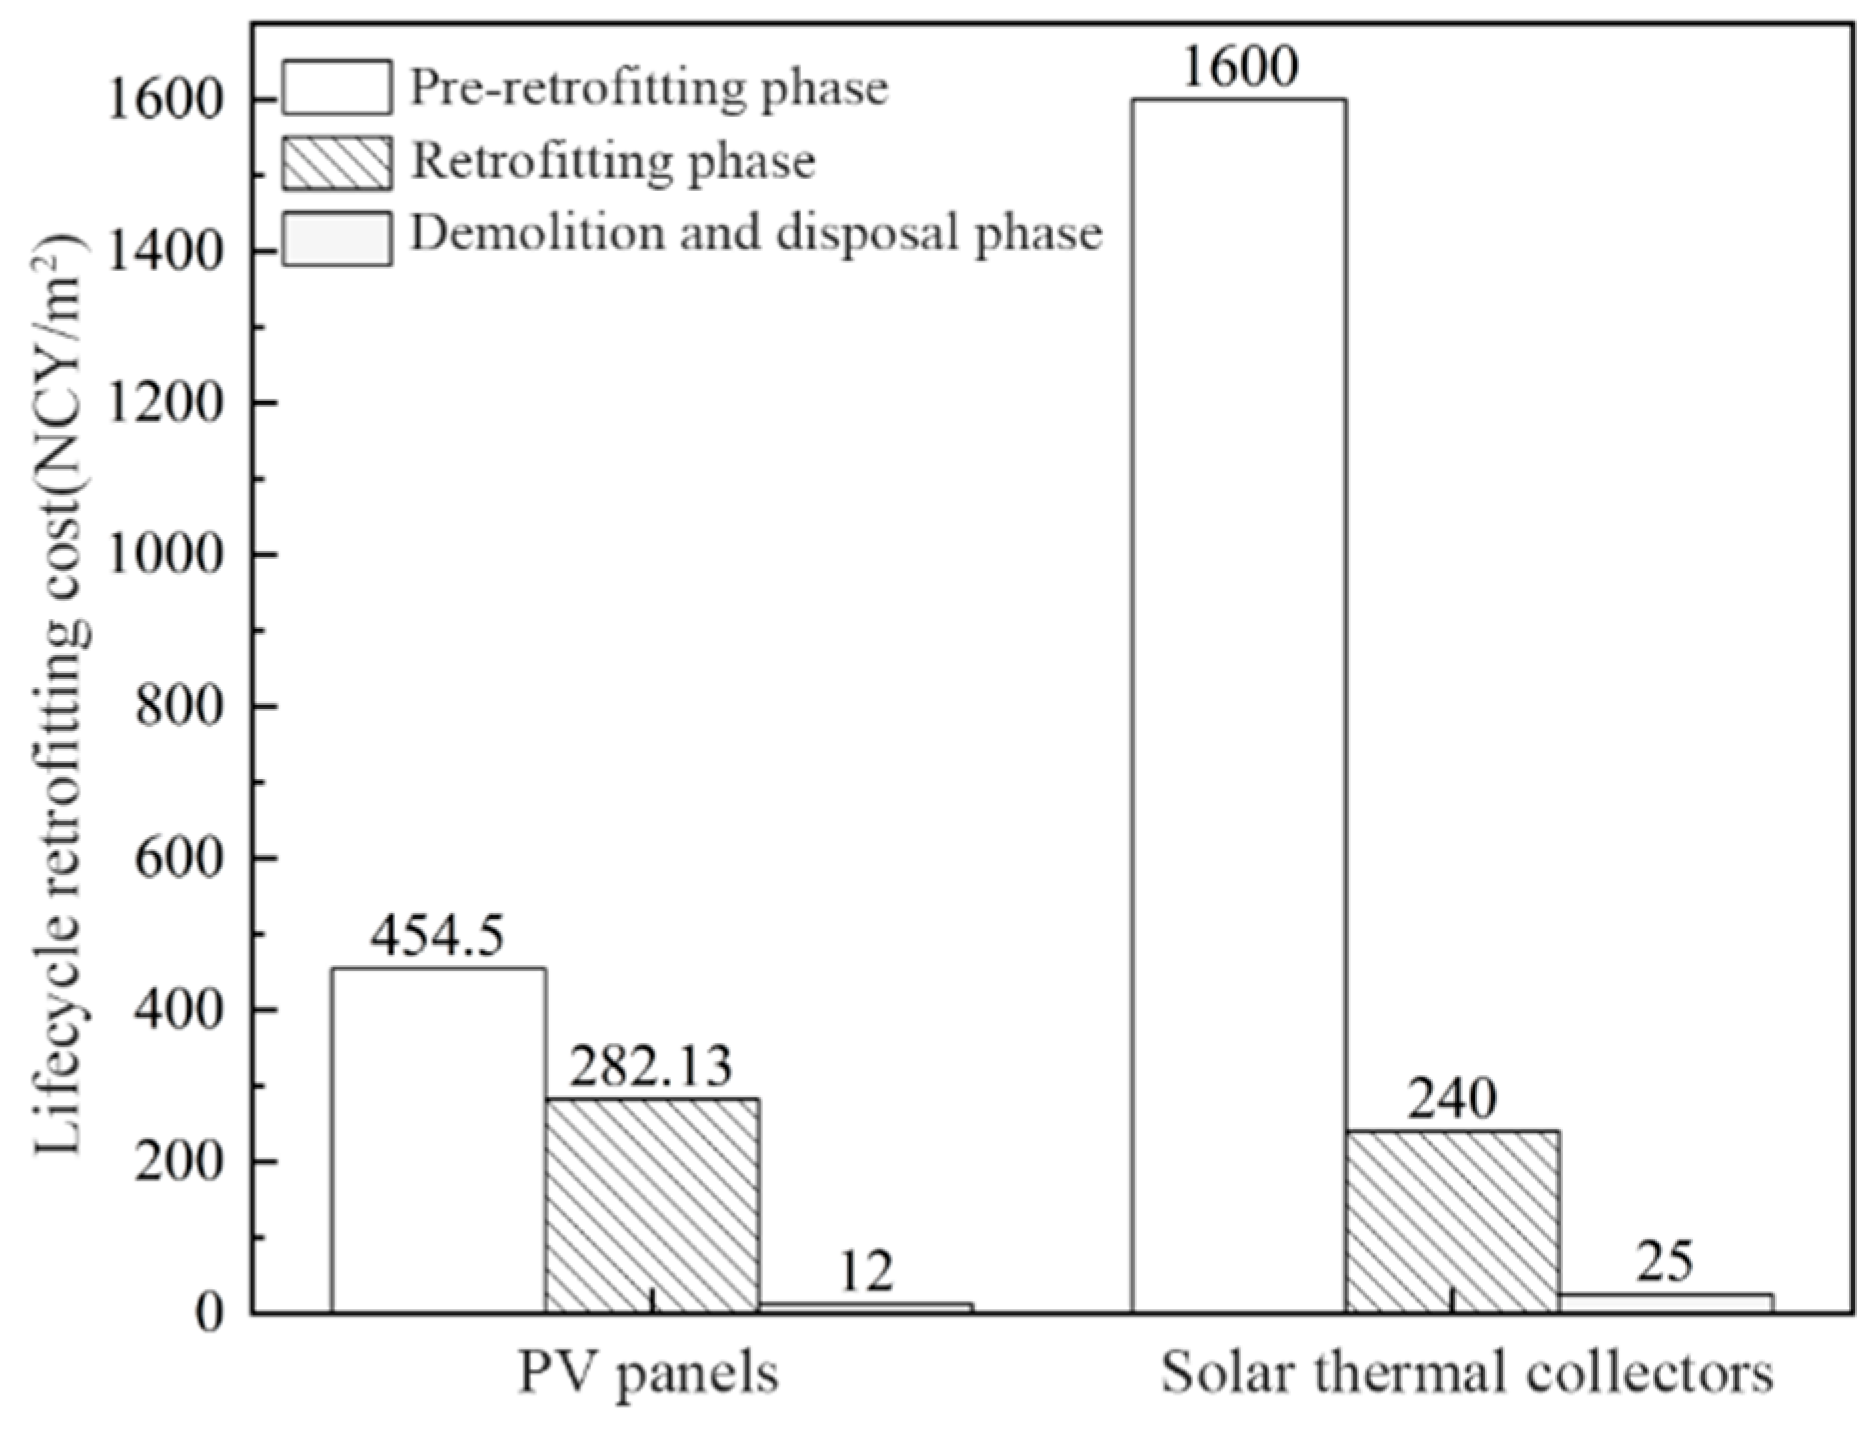
The life cycle retrofitting costs of solar PV panels and thermal collectors are shown in Figure 4. The residential electricity price in Tianjin was 0.49 CNY/kWh, the PV feed-in tariff was 0.3655 CNY/kWh, and the PV subsidy policy was 0.03 CNY/kWh. The power generation efficiency of PV panels was taken as 0.15, and the annual average thermal efficiency of the thermal collectors was 0.9. The life cycle of the PV panels was 25 a, and that of the thermal collectors was 15 a [29]. The degradation rate of the power generation efficiency for the PV panels was calculated as 2.5% attenuation in the first year and 0.7% attenuation in the next year and every year thereafter [30], and the thermal efficiency of the thermal collectors was calculated as 4% attenuation in the first year and 2% attenuation in the next year and every year thereafter [31]. At the same time, the PV system used the self-generation and self-consumption, and the residual power in the grid mode.
In this study, the building energy consumption simulation was mainly based on the Grasshopper, a visual programming software based on the Rhino platform, which is commonly used by architects for parametric design and building performance simulation [32]. The physical environment of the site was constructed in Rhino and Grasshopper based on a site-survey. The Ladybug plugin 1.8.0 calls the CSWD database and imports the hourly meteorological data of Tianjin, China. Table 4 shows the annual radiant illuminance in Tianjin. Ladybug and Honeybee were used to calculate the building energy consumption. There are three main phases for the energy consumption simulation: development of the site physical model, development of the energy model, and installation of the solar PV panels and thermal collectors on building rooftops. The simulation process of building energy consumption is shown in Figure 5.

3.2. Design Parameters and Constraints

The main parameters that affect the average annual power generation of PV panels are solar radiation intensity, laying angle, PV panel area and power generation efficiency [33]. Meanwhile, the average annual heat gain of the thermal collectors was also affected by the total solar radiation intensity, laying angle, thermal collector area, and annual average thermal efficiency. The allocation ratio of area covered by solar PV panels and thermal collectors depends on the electric energy and thermal energy consumption of buildings. In general, electric energy consumption peaks in the summer, and thermal energy consumption reaches its peak in the winter. Therefore, in the study, laying angle and area of the solar PV panels and thermal collectors were screened as the design parameters, and the optimal allocation ratio of the area covered by solar PV panels and thermal collectors was studied.
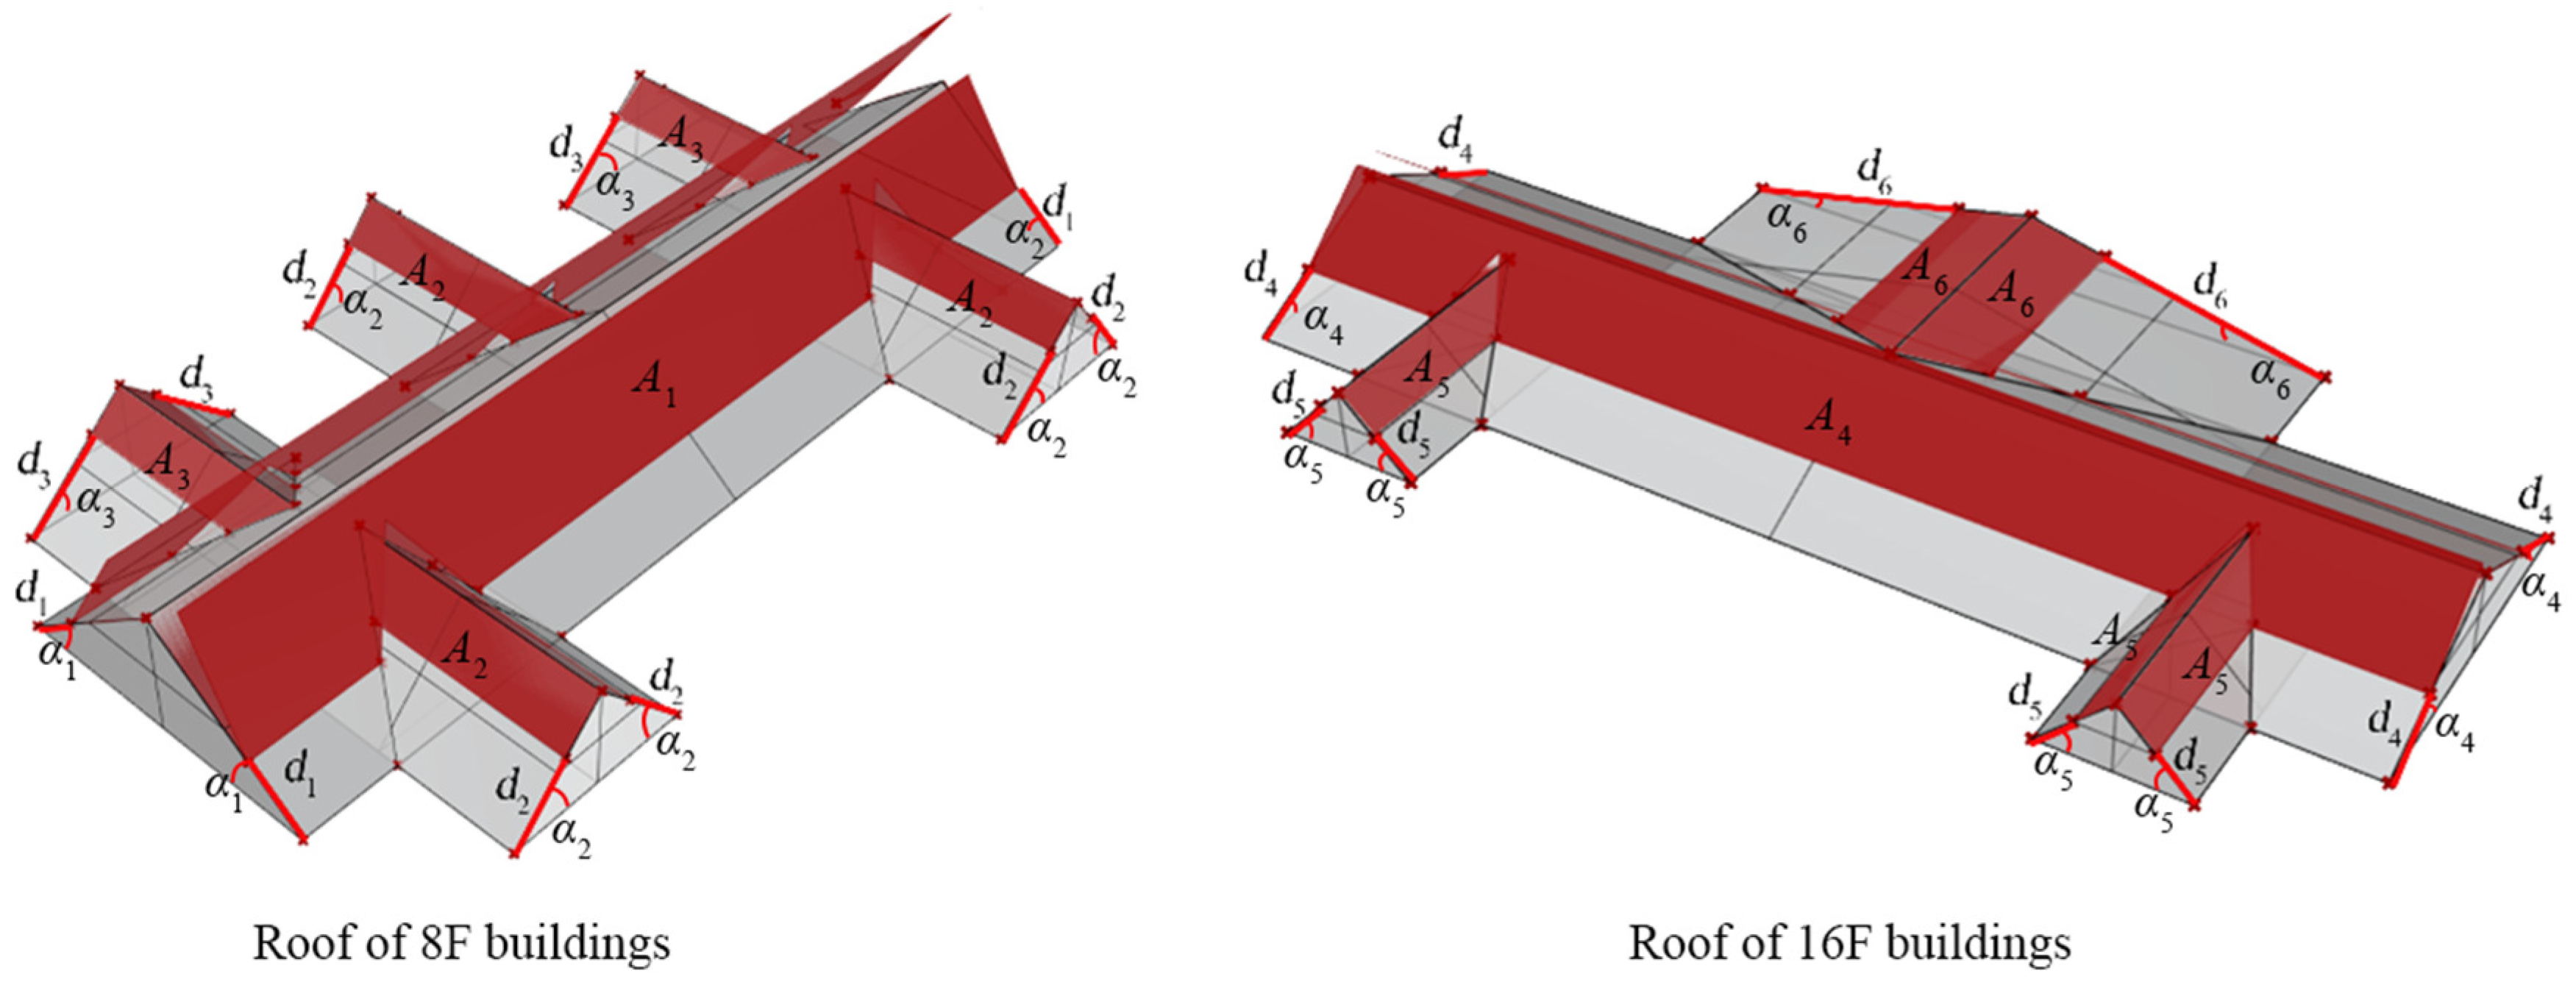
As shown in Figure 6, the layout of solar PV panels or thermal collectors was oriented along the direction of the rooftop surface of the buildings, with the length of the rooftop surface in the slope direction as the boundary, thereby controlling the area of PV panels installation by adjusting the length of the rooftop surface where the solar PV panels or thermal collectors were laid out. With the bottom edge of the solar PV panels or thermal collectors as the axis and the rooftop surface as the starting plane, the solar PV panels or thermal collectors were rotated along the axis according to its laying angle. The rooftops of the case buildings were divided into six types of slopes. The total area of solar PV panels or thermal collectors and thermal collectors is the sum of the areas for the six slope types. Therefore, the laying area of solar PV panels (Ap) and thermal collectors (Ac) can be expressed as Equation (21) and Equation (22), respectively.
A p = p ( A 1 + A 2 + A 3 + A 4 + A 5 + A 6 )
A c = ( 1 p ) ( A 1 + A 2 + A 3 + A 4 + A 5 + A 6 )
where p is the allocation ratio of the area covered by solar PV panels and thermal collectors, namely, the proportion of PV panels area to total rooftop area, and A1, A2, A3, A4, A5, A6 are the areas of solar PV panels or thermal collectors on a slope of α1, α2, α3, α4, α5, α6, respectively, as shown in Equations (23)–(28).
A 1 = 246.08 50 d 1 0 d 1 0.82 8.26 d 1 2 24.54 d 1 + 204.65 0.82 < d 1 4.92
A 2 = 0.49 d 2 2 2.99 d 2   +   15.59 0 d 2 3.39
A 3 = 0.44 d 3 2 2.15 d 3 + 14.03 0 d 3 3.72
A 4 = 536.64 80 d 4 0 d 4 1.12 2.84 d 4 2 48.14 d 4 + 447.59 1.12 < d 4 3.39
A 5 = 0.72 d 5 2 3.43 d 5 + 21.04 0 d 5 3.53
A 6 = 0.23 d 6 2 3.98 d 6 + 72.72 0 d 6 11.19
The retrofitting design of residential buildings aims to add the solar PV panels and thermal collectors. As shown in Figure 6, the design parameters for the case buildings in the community involve the low-level PV panel laying angle and small-slope laying area, intermediate-slope laying area, large slope laying area, high-level PV panel laying angle and small-slope laying area, intermediate-slope laying area, large-slope laying area. In addition, the proportion of PV panels area to total laying rooftop area was defined. The optimization boundary conditions of the design parameters are shown in Table 5, where all the design parameters are all continuous variables.

4. Results and Discussion

4.1. Analysis of Solution Sets

The multi-objective optimization was used for the existing residential building rooftop, attached solar photovoltaic panels, and thermal collectors, in the case that community was carried out to weigh carbon emission against cost benefit, where the number of populations was set to 30 and the number of iterations was set to 50 generations. Considering that the optimization mechanism of engine always seeks to minimize the objective function value, the negative value of CB was selected as the objective function of optimization. Due to the vast search space of the optimal solutions, the range of objective function values is large. Therefore, in the optimization process, the optimal solutions are randomly constructed by a large population of individuals. After crossover and mutation, the objective values for each generation of individuals decrease, and the evolutionary process continuously converges until the allowed number of optimization iterations is reached.
Figure 7 provides the variation of carbon emissions and carbon benefits at different generations. Clearly, in the preliminary iterations, the crossover probability is too large, resulting in the solution population not having converged yet, which makes the fluctuation range of the average values of CE and CB larger. As the number of iterations increases, the average values of both the CE and CB gradually become stable. Meanwhile, the cost benefits are highest at the 50th iteration.
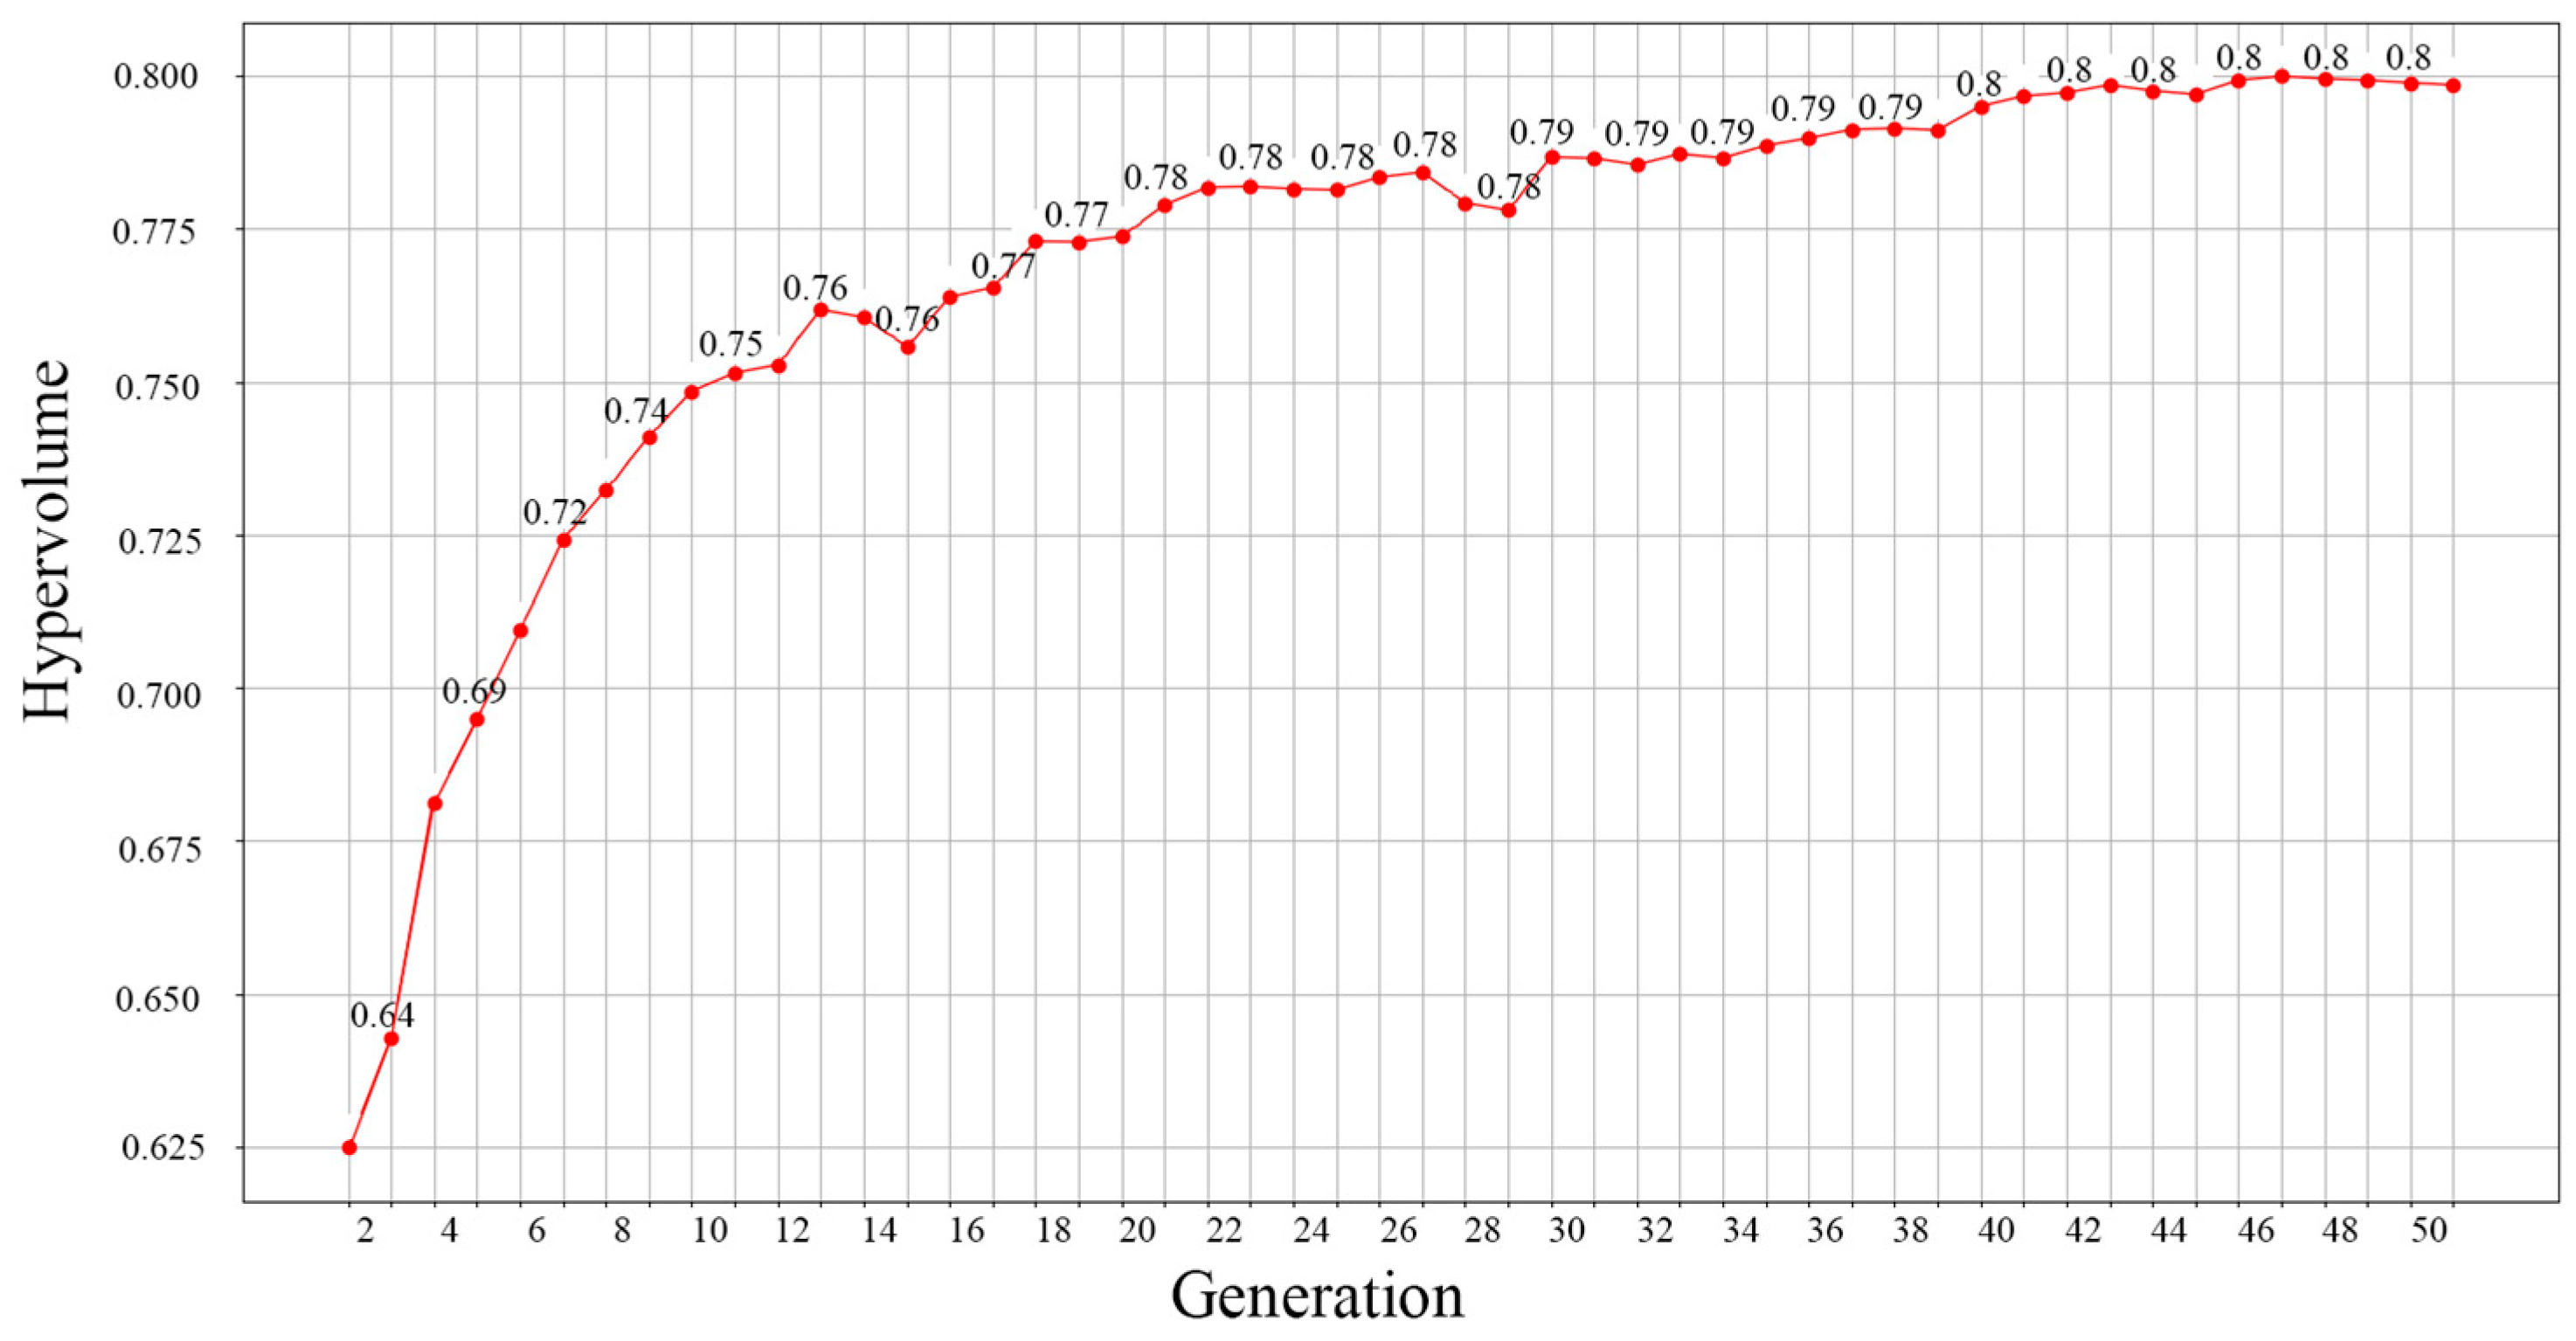
The hypervolume of the non-dominated solution set is one of the important indicators for evaluating the convergence and diversity of the non-dominated solutions in the multi-objective optimization process [34]. The larger the value of hypervolume, the better the optimization solutions. Figure 8 gives the change in hypervolume during the multi-objective optimization process. It can be found that the value of hypervolume starts to stabilize near the iteration of about 39 generations. Thus, the quality of the non-dominated solution exhibits pronounced superiority.
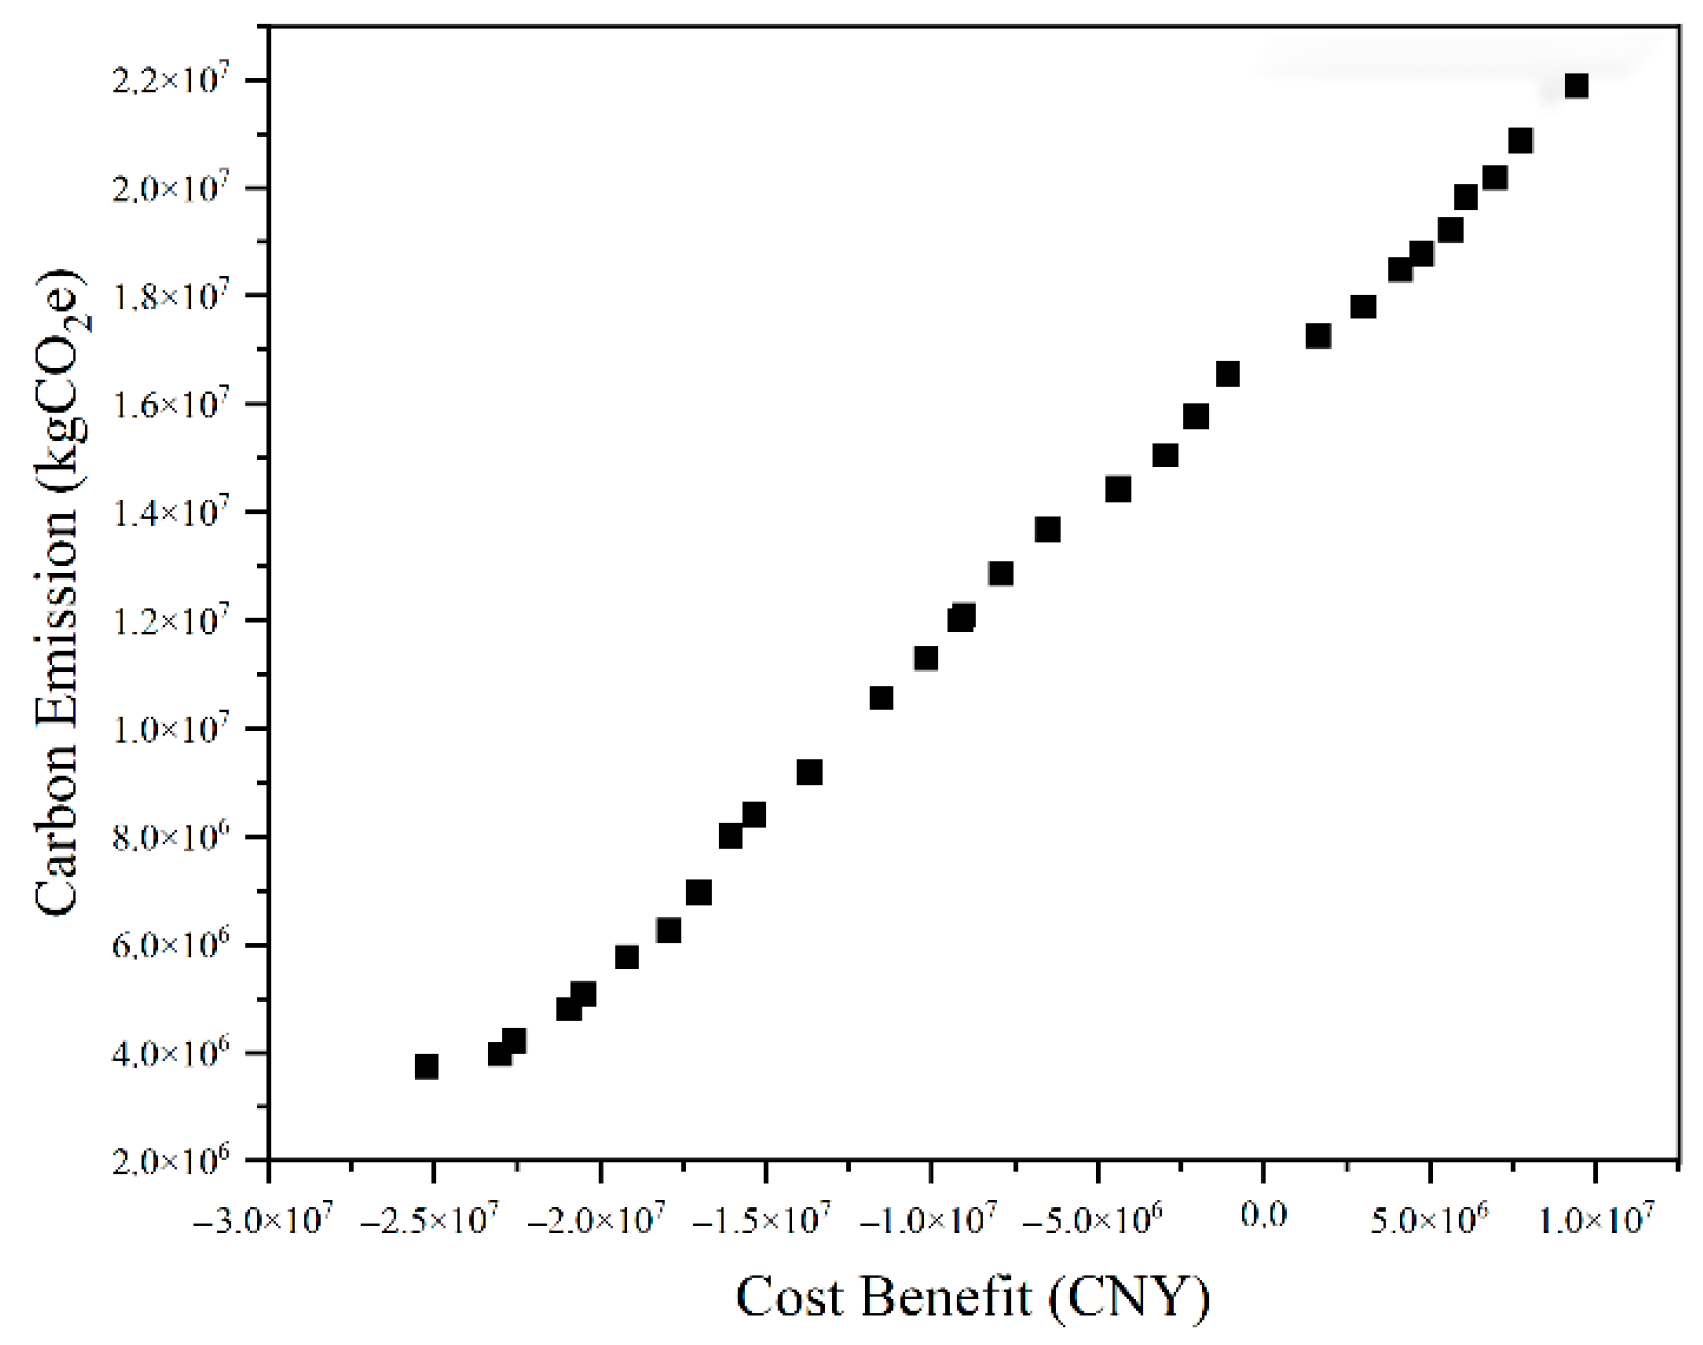
It is difficult to obtain optimal solutions for the objective functions at the same time because of the contradictions between the optimization objectives. Therefore, the solution set of multi-objective optimization is often a series of non-dominated solutions, usually called the Pareto frontier. The distribution of Pareto solutions for the multi-objective optimization is shown in Figure 9.

4.2. Selection of Optimal Solution

After obtaining the Pareto frontier, the entropy-TOPSIS was used to decide on the optimal solution. Table 6 shows the information entropy and weights of the two optimization objectives by the entropy-TOPSIS. It can be seen that the weight of carbon emissions accounts for a proportion of 42.68%, whereas cost benefit accounts for 57.32%. Therefore, cost benefit was set as the primary decision-making objective, and solution with the highest potential for cost benefit was prioritized, while ensuring that carbon emissions meet sustainable development objectives. Furthermore, the positive and negative ideal solutions were determined, and the Euclidean distances of non-dominated solutions and the relative closeness of each solution were calculated. And then, the solution with the largest relative closeness coefficient was chosen as the optimal solution.
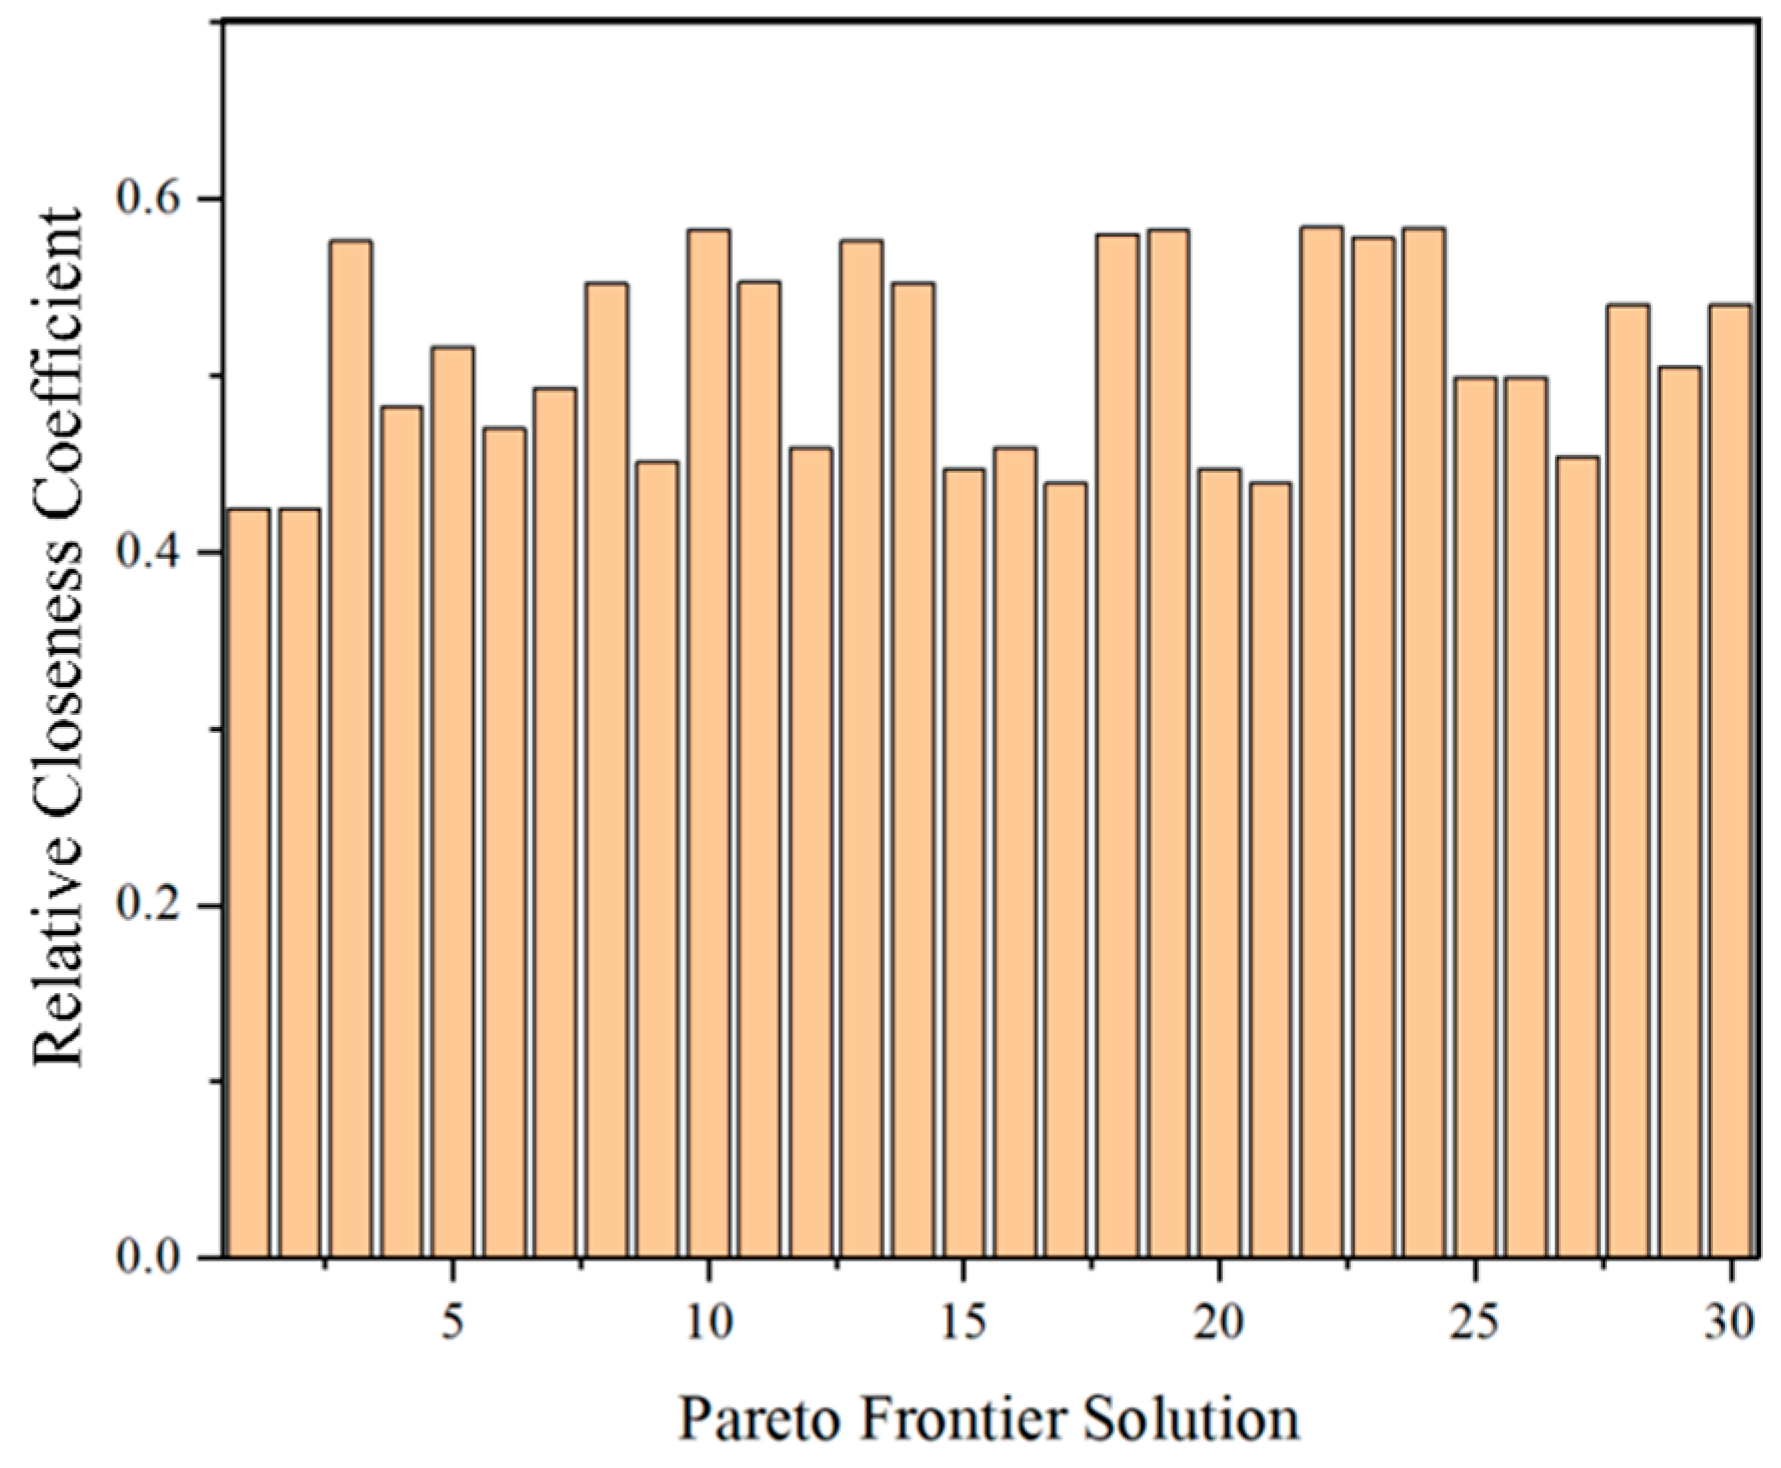
The TOPSIS comprehensive evaluation method was employed to select the optimal solution. The non-dominated solutions were then ranked according to the size of relative closeness coefficients as shown in Figure 10. Furthermore, the optimal objectives and design parameters are shown in Table 7.
For the case study, there have been significant improvements in carbon emissions and cost benefits after the optimal retrofitting design. Compared to the residential building before the retrofitting, a 31% reduction in carbon emission over the remaining life of the buildings, and a 24.7% reduction in cost during the operational phase of the existing residential buildings in the case community were revealed.

5. Conclusions

In the study, an optimization design method for the existing residential building rooftops retrofitted with the installation the solar photovoltaic panels and thermal collectors was proposed to weigh the carbon emission and cost benefit. Notably, the mathematical models of the carbon emission and cost benefit were developed. Furthermore, a case study for the typical residential community, located in the cold zone of China, was conducted. The main conclusions are as follows:
(1)
Carbon emission is the primary objective of the retrofitting design for the existing residential building rooftops by using solar photovoltaic panels and thermal collectors, of which the weight of the carbon emission based on the entropy value method is 42.68%, while that for the cost benefit is 57.32%. Cost benefit should be set as the primary decision-making objective, while ensuring that carbon emissions meet sustainable development objectives.
(2)
The optimal installation parameters for the solar photovoltaic panels and thermal collectors are as follows: the optimal allocation ratio of the area covered by solar PV panels and thermal collectors is 0.2. Moreover, the solar photovoltaic panels and thermal collectors on the lower building have a laying angle of 20°, and that on the higher building have a laying angle of 2.08°. It provides a reference for retrofitting and installation of solar photovoltaic panels and thermal collectors in existing buildings.
(3)
Compared to the residential building before the retrofitting, a 31% reduction in carbon emission over the remaining life of the buildings, and a 24.7% reduction in cost during the operational phase of the existing residential buildings in the case community were revealed. The reliability of the research method is verified, and an empirical evidence basis is laid for the promotion of solar photovoltaic panels and thermal collectors in the retrofitting of existing buildings.

Author Contributions

Conceptualization, S.Y.; Methodology, Y.W.; Formal Analysis, X.L.; Investigation, S.Z. and M.L.; Data Curation, X.L.; Writing—Original Draft Preparation, Y.W. and X.L.; Writing—Review and Editing, S.Y.; Visualization, Y.W.; Supervision, J.W.; Project Administration, J.W.; Funding Acquisition, S.Y. All authors have read and agreed to the published version of the manuscript.

Funding

This research was funded by Youth Foundation of Ministry of Education of China on Humanities and Social Sciences Research (Grant No. 23YJCZH276) and Hebei Natural Science Foundation (Grant No. E2024202167).

Data Availability Statement

The data that support the findings of this study are available from the corresponding author upon reasonable request.

Conflicts of Interest

The author declares no conflicts of interest.

Nomenclature

AC
(m2)
Laying area of solar thermal collectorAP (m2)Laying area of solar PV panel
Ai
(m2)
Laying area of PV panels or solar thermal collectors on a slope of αiC
(kgCO2e/unit)
Amount of solar PV panels and thermal collectors used
CB
(CNY)
Cost benefitCE
(kg CO2e)
Carbon emission
CES
(kg CO2e)
Carbon emission from the operational phase in the remaining years of the retrofitted residential buildings C B q * A non-dimensionalised quantization of the Pareto frontier solution
CB
(CNY)
Construction cost of solar PV panels and thermal collectorsCA
(CNY)
Cost of solar PV panels and thermal collectors
CEXP (CNY)Grid-connected electricity prices for renewable energy generationCC
(CNY)
Demolition cost of solar PV panels and thermal collectors
CLCA
(kg CO2e)
Carbon emission from the life cycle retrofittingCEXC
(CNY)
Measured price of heat consumption
CqRelative closeness coefficient of each evaluation object to the ideal solutionCP
(kg CO2e/a)
Annual carbon reductions from photovoltaic and solar thermal collector system
d q + Euclidean distance between each evaluation object and the positive ideal solutionCi (kgCO2e/unit)Carbon emission factor for each machine
Ei
(unit/a)
Annual consumption of building energy type d q Euclidean distance between each evaluation object and the negative ideal solution
EFi (kgCO2e/unit)Carbon emission factors for energy type iEi,mate (kgCO2e/unit)Carbon emission factor for solar PV panels and thermal collectors
EPOST
(kg CO2e)
Carbon emission of post-retrofitting phaseECE, ECBInformation entropy of index q
ERi,j
(unit/a)
Amount of category i energy supplied by photovoltaic and solar thermal collector systemEPRE
(kg CO2e)
Carbon emission of pre-retrofitting phase
HA
(W/m2)
Total solar irradiation on the light-gathering surface of the PV panelEEND
(kg CO2e)
Carbon emission of demolition and disposal phase
IC
(CNY)
Incremental cost of life cycle retrofittingiType of end-use energy consumed in buildings
JT
(W/m2)
Total solar irradiation on the light-gathering surface of the solar thermal collectorjTypes of building energy systems
pProportion of PV panels area to total laying areaMNumber of various types of construction machinery
Pn,PT
(kWh)
Replacement heat from collectors in n-th yearPn,wElectricity savings from air conditioning in n-th year
PEXP
(CNY)
Revenue from surplus photovoltaic power generation sold to the grid throughout the life cycle retrofittingPn,PV
(kWh)
PV panels substitution power in n-th year
PSA
(CNY)
Cost saved in the pre-retrofitting phasePEXC
(CNY)
Revenue from surplus solar thermal collector heat generation throughout the life cycle of the retrofitted building
Sc
(kWh)
Heat generation of solar thermal collectors in n-th year qEvaluation objective
Sp
(kWh)
Power generation of PV panels in n-th yearSnPower generation of PV panels in n-th year
VCE,q, VCB,qProduct of evaluation index and weightsWCE, WCBWeight of evaluation object CE, CB
YbuilService life of buildingYmateService life of solar PV panels and thermal collectors

References

  1. China Building Energy Efficiency Association. China Building Energy Consumption Research Report; China Building Energy Efficiency Association: Shanghai, China, 2020. [Google Scholar]
  2. Baljit, S.; Chan, H.; Sopian, K. Review of building integrated applications of photovoltaic and solar thermal systems. J. Clean. Prod. 2016, 137, 677–689. [Google Scholar] [CrossRef]
  3. Santos, I.; Ricardo, R. The potential of building-integrated (BIPV) and building-applied photovoltaics (BAPV) in single-family, urban residences at low latitudes in Brazil. Energy Build. 2012, 50, 290–297. [Google Scholar] [CrossRef]
  4. Elaouzy, Y.; El Fadar, A. Investigation of building-integrated photovoltaic; photovoltaic thermal, ground source heat pump and green roof systems. Energy Convers. Manag. 2023, 283, 116926. [Google Scholar] [CrossRef]
  5. Sun, W. Research on the Integrated Design of Building Roofs and Solar Photovoltaic Systems under Low Carbon Orientation. Master’s Thesis, Shandong University of Architecture, Jinan, China, 2023. [Google Scholar]
  6. Wang, C.; Ji, J. Comprehensive performance analysis of a rural building integrated PV/T wall in hot summer and cold winter region. Energy 2023, 282, 128302. [Google Scholar] [CrossRef]
  7. Li, C.; Xie, J.; Liu, R.; Tan, J.; Zhu, X.; Li, N.; Tang, H. Fully exploiting solar energy with building envelops: Experimental study on an adjustable photovoltaic green facade. Energy Build. 2025, 332, 115431. [Google Scholar] [CrossRef]
  8. Kang, Y.; Cui, Y.; Zhang, D.; Xu, W.; Pang, F.; Lu, S.; Wu, J.; Zhao, Y.; Mao, R. Study of overall energy performance of amorphous silicon photovoltaic window based on variable transmittances. J. Build. Eng. 2025, 104, 112320. [Google Scholar] [CrossRef]
  9. Zhan, J.; He, W.; Huang, J. Comfort, carbon emissions, and cost of building envelope and photovoltaic arrangement optimization through a two-stage mode. Appl. Energy 2024, 356, 122423. [Google Scholar] [CrossRef]
  10. Duraivel, B.; Muthuswamy, N. Optimizing energy efficiency in residential buildings: A comprehensive evaluation of solar concrete water heaters integrated with photovoltaics and thermoelectric cooling. Case Stud. Therm. Eng. 2025, 72, 106218. [Google Scholar] [CrossRef]
  11. Ascione, F.; Bianco, N.; Stasio, C.D.; Mauro, G.M.; Vanoli, G.P. Multi-stage and multi-objective optimization for energy retrofitting a developed hospital reference building: A new approach to assess cost-optimality. Appl. Energy 2016, 174, 37–68. [Google Scholar] [CrossRef]
  12. Qiao, X.; Zhao, T.; Zhang, X.; Li, Y. Multi-objective optimization of building integrated photovoltaic windows in office building. Energy Build. 2024, 318, 114459. [Google Scholar] [CrossRef]
  13. Luo, X.; Zhang, Y.; Lu, J.; Ge, J. Multi-objective optimization of the office park building envelope with the goal of nearly zero energy consumption. J. Build. Eng. 2024, 84, 108552. [Google Scholar] [CrossRef]
  14. Chen, Y.; Chen, Z.; Wang, D.; Liu, Y.; Zhang, Y.; Liu, Y.; Zhao, Y.; Gao, M.; Fan, J. Co-optimization of passive building and active solar heating system based on the objective of minimum carbon emissions. Energy 2023, 275, 127401. [Google Scholar] [CrossRef]
  15. Jiang, W.; Ju, Z.; Tian, H.; Liu, Y.; Arıcı, M.; Tang, X.; Li, Q.; Li, D.; Qi, H. Net-zero energy retrofit of rural house in severe cold region based on passive insulation and BAPV technology. J. Clean. Prod. 2022, 360, 132198. [Google Scholar] [CrossRef]
  16. Peng, X. Measurement and Comprehensive Evaluation of Carbon Emissions in the Process of Renovation of Existing Buildings. Master’s Thesis, Dongbei University, Shenyang, China, 2019. [Google Scholar]
  17. Zhu, S. Study on Life Cycle CO2 Emissions of Exterior Wall Insulation Systems for Typical Buildings in Chongqing Region. Master’s Thesis, Chongqing University, Chongqing, China, 2015. [Google Scholar]
  18. Yuan, J.; Huo, Q.; Huang, L.; Liu, X. Research on optimization design of low-carbon retrofitting of existing residential community in cold zone based on active-passive coupling. J. Hum. Settl. West China 2025, 40, 129–137. [Google Scholar]
  19. GB/T 51366—2019; Building Carbon Calculation Standards. China Academy of Building Research, China Standard Design & Research Institute Co.; China Construction Industry Press: Beijing, China, 2019; pp. 21–22.
  20. GB 50495-2019; Technical Standard for Solar Heating System. Ministry of Housing and Urban-Rural Development of the People’s Republic of China; China Architecture & Building Press: Beijing, China, 2019.
  21. GB 50364-2018; Technical Standard for Solar Water Heating System of Civil Buildings. Ministry of Housing and Urban-Rural Development of the People’s Republic of China; China Architecture & Building Press: Beijing, China, 2018.
  22. Lee, J. Multi-objective optimization case study with active and passive design in building engineering. Struct. Multidiscip. Optim. 2019, 59, 507–519. [Google Scholar] [CrossRef]
  23. Deb, K.; Pratap, A.; Agarwal, S.; Meyarivan, T. A fast and elitist multiobjective genetic algorithm: NSGA-II. IEEE Trans. Evol. Comput. 2002, 6, 182–197. [Google Scholar] [CrossRef]
  24. Jin, Z.; Li, T. Adding More Greenery to the Sino-Singapore Tianjin Eco-City; State Grid News: Beijing, China, 2022. [Google Scholar]
  25. China Meteorological Administration Wind Energy and Solar Energy Resource Assessment Center. China Solar Energy Resources and Zoning; Meteorological Press: Beijing, China, 2020. [Google Scholar]
  26. Wu, W. Multi-Objective Optimization Design Study of Zero Energy Solar Residential Buildings in Cold Regions—Take the Beijing-Tianjin Area as an Example. Master’s Thesis, Tianjin University, Tianjin, China, 2015. [Google Scholar]
  27. National Statistical Office. China Population Census Yearbook—2020; China Statistics Press: Beijing, China, 2022. [Google Scholar]
  28. JGJ 26-2018; Design Standard for Energy Efficiency of Residential Buildings in Severe Cold and Cold Zones. Ministry of Housing and Urban–Rural Development of the People’s Republic of China: Beijing, China; China Architecture & Building Press: Beijing, China, 2018.
  29. DB37/T 5074—2016; Energy-Saving Design Standards for Passive Ultra-Low-Energy Residential Buildings. Shandong Academy of Building Research; China Building Material Industry Press: Beijing, China, 2018; pp. 61–63.
  30. Wang, R.; Wang, H.; Fan, T. Design of rooftop photovoltaic solar thermal systems based on different area ratios. Sci. Technol. Eng. 2021, 21, 14576–14581. [Google Scholar]
  31. Wang, D.; Wang, L.; Huang, J. Analysis of annual attenuation rate of natural aging of photovoltaic modules. J. Xinyang Norm. Coll. 2018, 31, 375–380. [Google Scholar]
  32. Hu, J.; Wang, Z.; Chen, W. “Ladybug + Honeybee” IOP Conference Series: Earth and Environmental Science. IOP Publ. 2020, 531, 012020. [Google Scholar]
  33. Liu, X.; Cui, W. Economic Analysis and Optimal Design for a Grid-Connected Microgrid System; Institute of Electrical and Electronics Engineers: Piscataway, NJ, USA, 2020; pp. 363–368. [Google Scholar]
  34. Guerreiro, P.; Fonseca, M.; Paquete, L. The Hypervolume Indicator: Computational Problems and Algorithms. ACM Comput. Surv. 2021, 54, 119. [Google Scholar] [CrossRef]
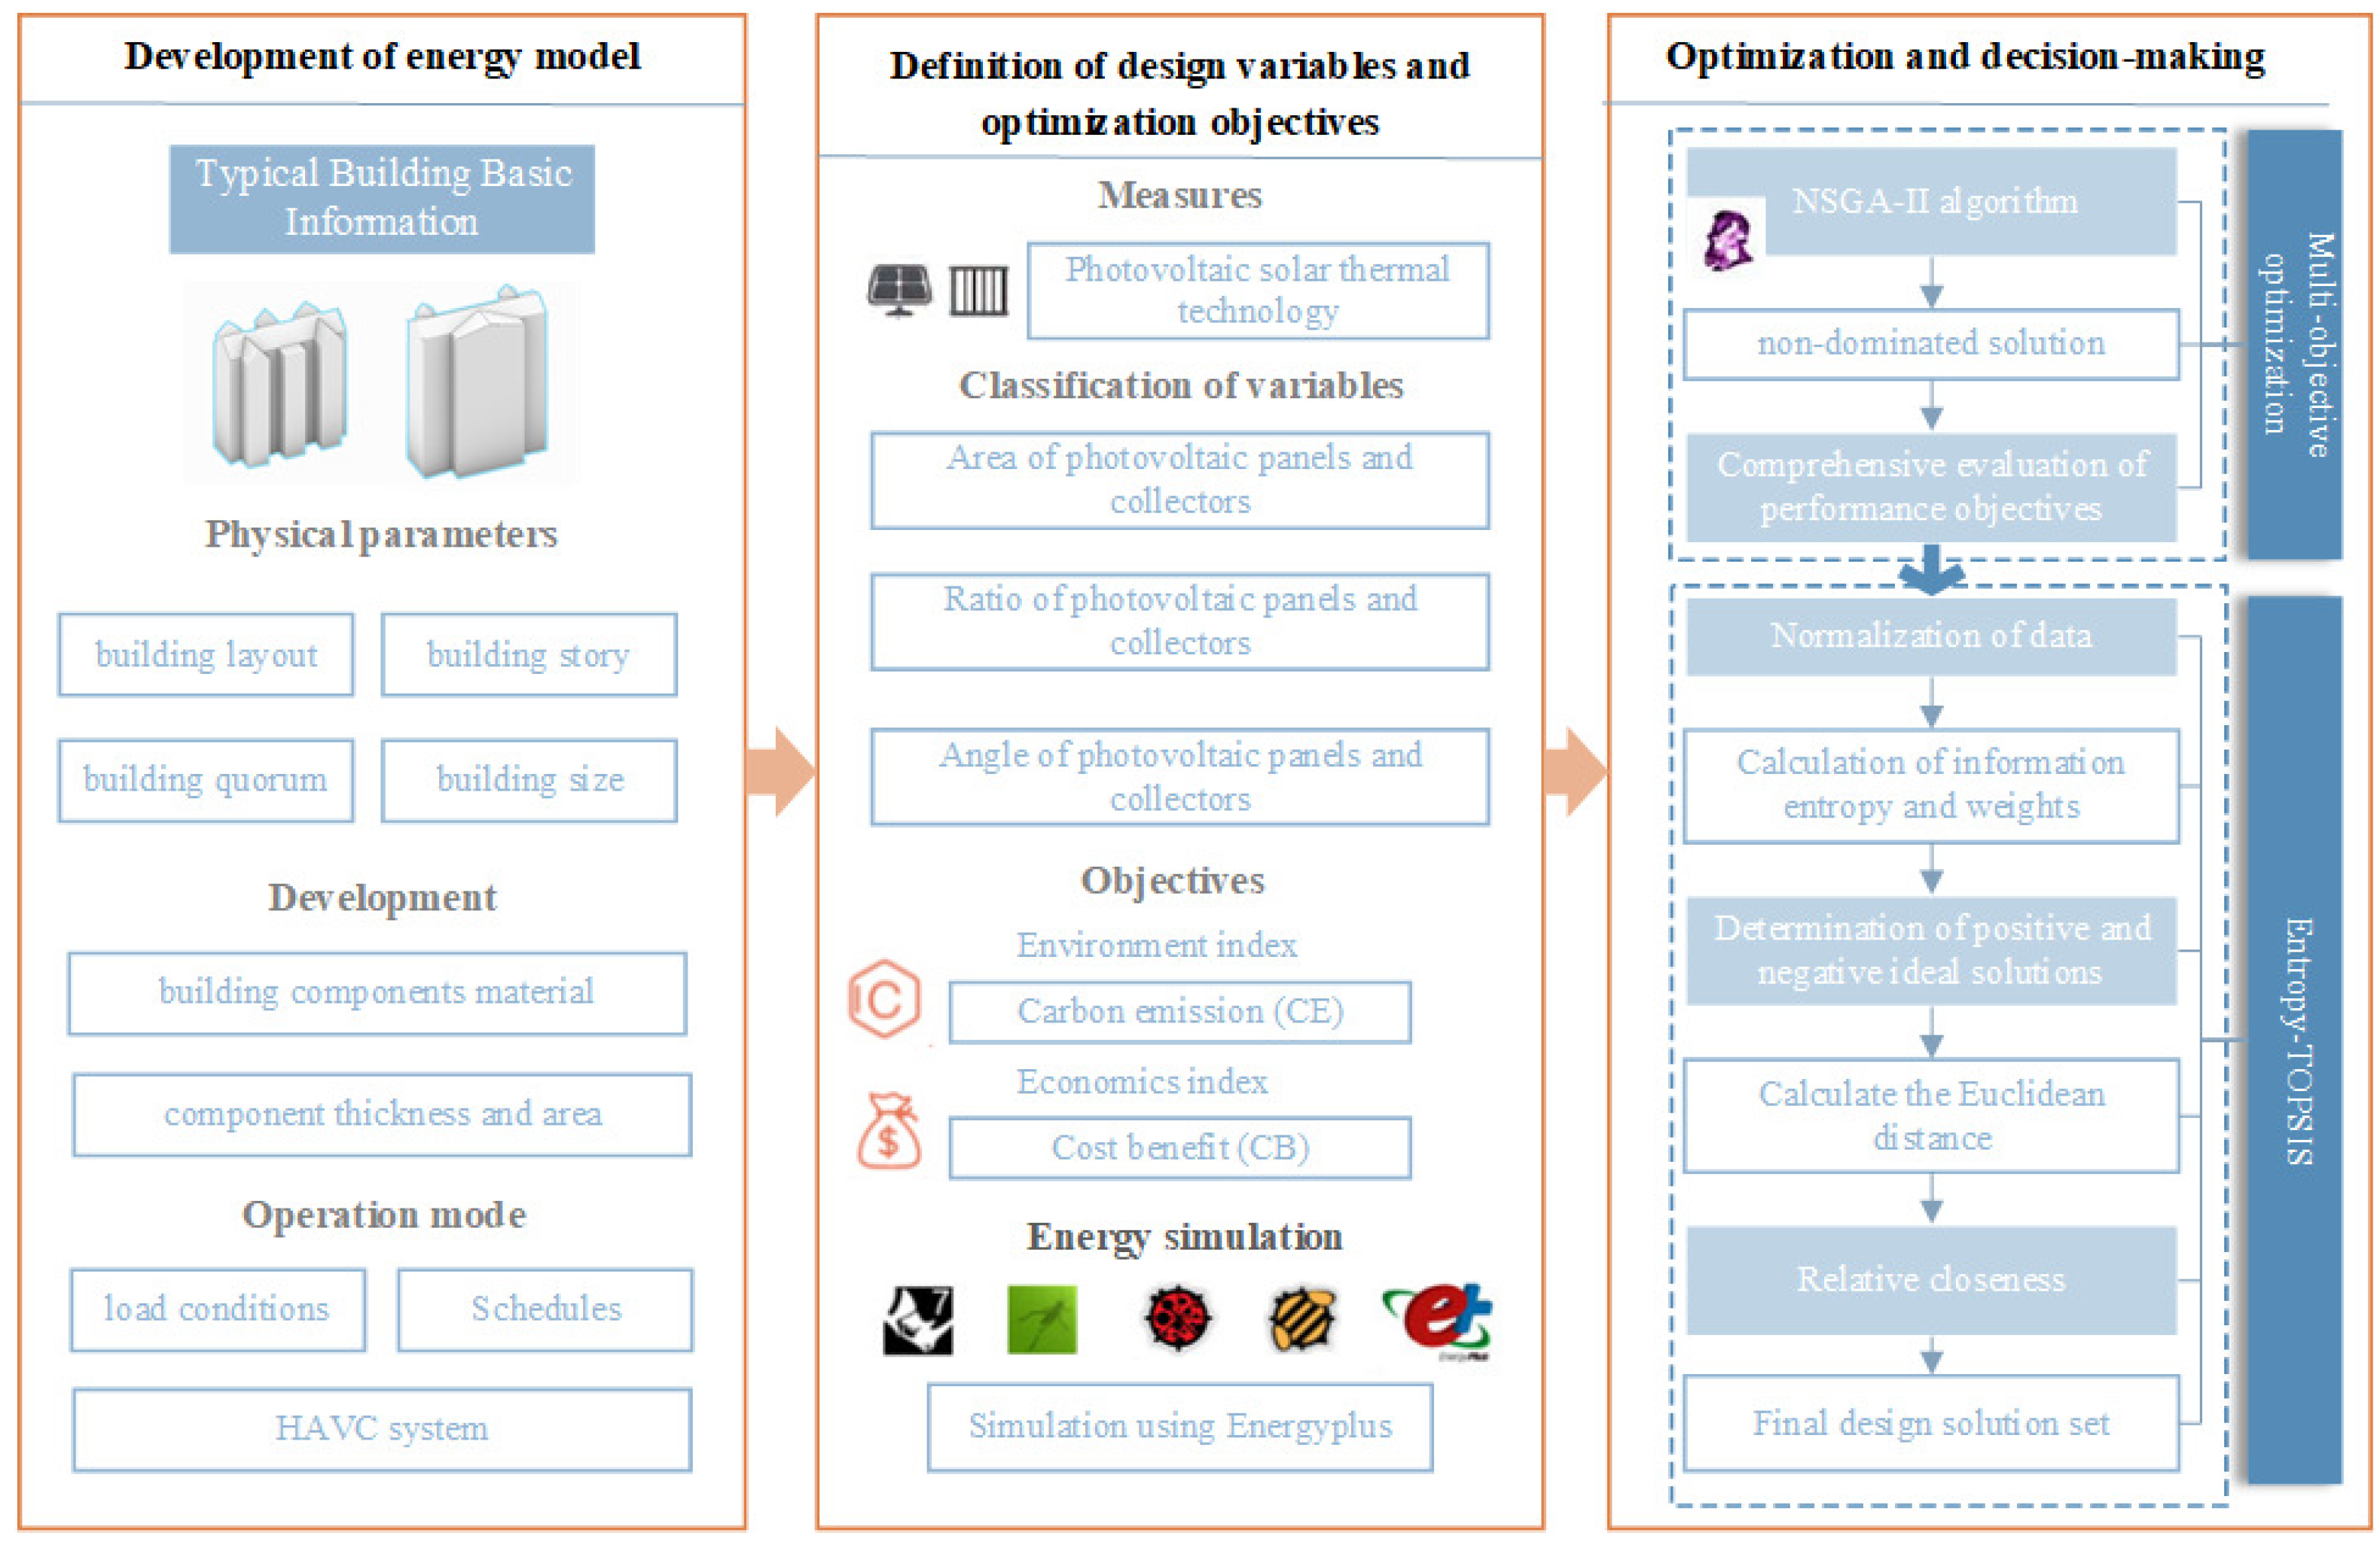
Figure 1. Overall procedure of multi-objective optimization design.
Buildings 15 03012 g001
Figure 2. Geometry information of buildings in residential community (unit: mm).
Buildings 15 03012 g002
Figure 3. Occupancy rate, appliance usage rate, and lighting activation rate.
Buildings 15 03012 g003
Figure 4. Life cycle retrofitting cost of solar PV panels and thermal collectors.
Buildings 15 03012 g004
Figure 5. Framework of simulation process.
Buildings 15 03012 g005
Figure 6. Schematic of the design parameters.
Buildings 15 03012 g006
Figure 7. Variation in carbon emissions and cost benefits at different generations.
Buildings 15 03012 g007
Figure 8. Changes in the hypervolume.
Buildings 15 03012 g008
Figure 9. Distribution of the Pareto solution set.
Buildings 15 03012 g009
Figure 10. Relative closeness coefficient of each non-dominated solution.
Buildings 15 03012 g010
Table 1. Carbon emission model for each phase of retrofitting life cycle [17].
Phase NameCarbon Emission EquationMeaning
Pre-retrofitting phase E PRE = ( Y buil / Y mate ) i = 1 n C E i , mate Ybuil: Service life of building
Ymate: Service life of solar PV panels and thermal collectors
C: Areas of solar PV panels and thermal collectors used
Ei,mate: Carbon emission factor for solar PV panels and thermal collectors, kgCO2e/unit
Retrofitting phase E RE = ( Y buil / Y mate ) i = 1 n T j × ω j M: Number of various types of construction machinery, unit
Ci: Carbon emission factor for each machine, kgCO2e/unit
Post-retrofitting phase E POST = i = 1 n ( E i E F i ) C p Y buil E i = j = 1 n ( E i j E R i j ) Ei: Annual consumption of building energy type i, unit/a
EFi: Carbon emission factors for energy type i
Ei,j: Type i energy consumption for systems in type j, unit/a
ERi,j: Amount of category i energy supplied by solar PV panels and thermal collectors, unit/a
i: Type of end-use energy consumed in buildings
j: Types of building energy systems
CP: Annual carbon reductions from solar PV panels and thermal collectors, kgCO2e/a
Demolition and disposal phase E DEM = 0.9 ( Y buil / Y mate 1 ) E pro Carbon emission from the demolition and disposal phase are 0.9 times that of the construction phase
Table 2. Heat transfer coefficient of the building envelope.
Building EnvelopeExternal WallInterior WallRoofingExternal WindowFloor
Heat transfer coefficient, W/(m2·K)1.472.053.325.64.0
Table 3. Parameters of the case buildings during the operation.
ParameterValueUnitReference
Equipment power density3.8W/m2[28]
Lighting power density6W/m2[28]
Air changes per hour0.5h−1[28]
Quota for hot water50L/person·d[21]
Water heater inlet/outlet water temperature10/60°C[21]
Personnel density0.0027person/m2[27]
Table 4. Irradiance in Tianjin throughout the year.
MonthJanuaryFebruaryMarchAprilMayJune
Irradiance (W/m2)14.7316.4918.2317.6319.5017.98
MonthJulyAugustSeptemberOctoberNovemberDecember
Irradiance (W/m2)15.5015.8917.3816.4113.8112.61
Table 5. Range of design parameters.
ParametersUnitRange of ValuesStep
X1Low-level PV panel laying angle°0.00–20.000.01
X2A1m20.00–28.000.01
X3A2m20.00–31.000.01
X4A3m20.00–67.000.01
X5Angle of laying of high-rise PV panels°0.00–20.000.01
X6A4m20.00–42.000.01
X7A5m20.00–146.000.01
X8A6m20.00–209.000.01
X9PV solar thermal laying area ratio0.0–1.00.1
Table 6. Weights of the two objectives.
ParameterInformation EntropyInformation Utility ValueWeighting Factor
Carbon emissions0.98920.010842.68%
Cost benefits0.98550.014557.32%
Table 7. Optimization solution.
ParameterX1 (°)X2 (m2)X3 (m2)X4 (m2)X5 (°)X6 (m2)X7 (m2)X8 (m2)X9CE (kgCO2e)CB (CNY)
Value20.00120.2113.5112.502.08482.2420.721.920.21.9228 × 1075.6425 × 106
Disclaimer/Publisher’s Note: The statements, opinions and data contained in all publications are solely those of the individual author(s) and contributor(s) and not of MDPI and/or the editor(s). MDPI and/or the editor(s) disclaim responsibility for any injury to people or property resulting from any ideas, methods, instructions or products referred to in the content.