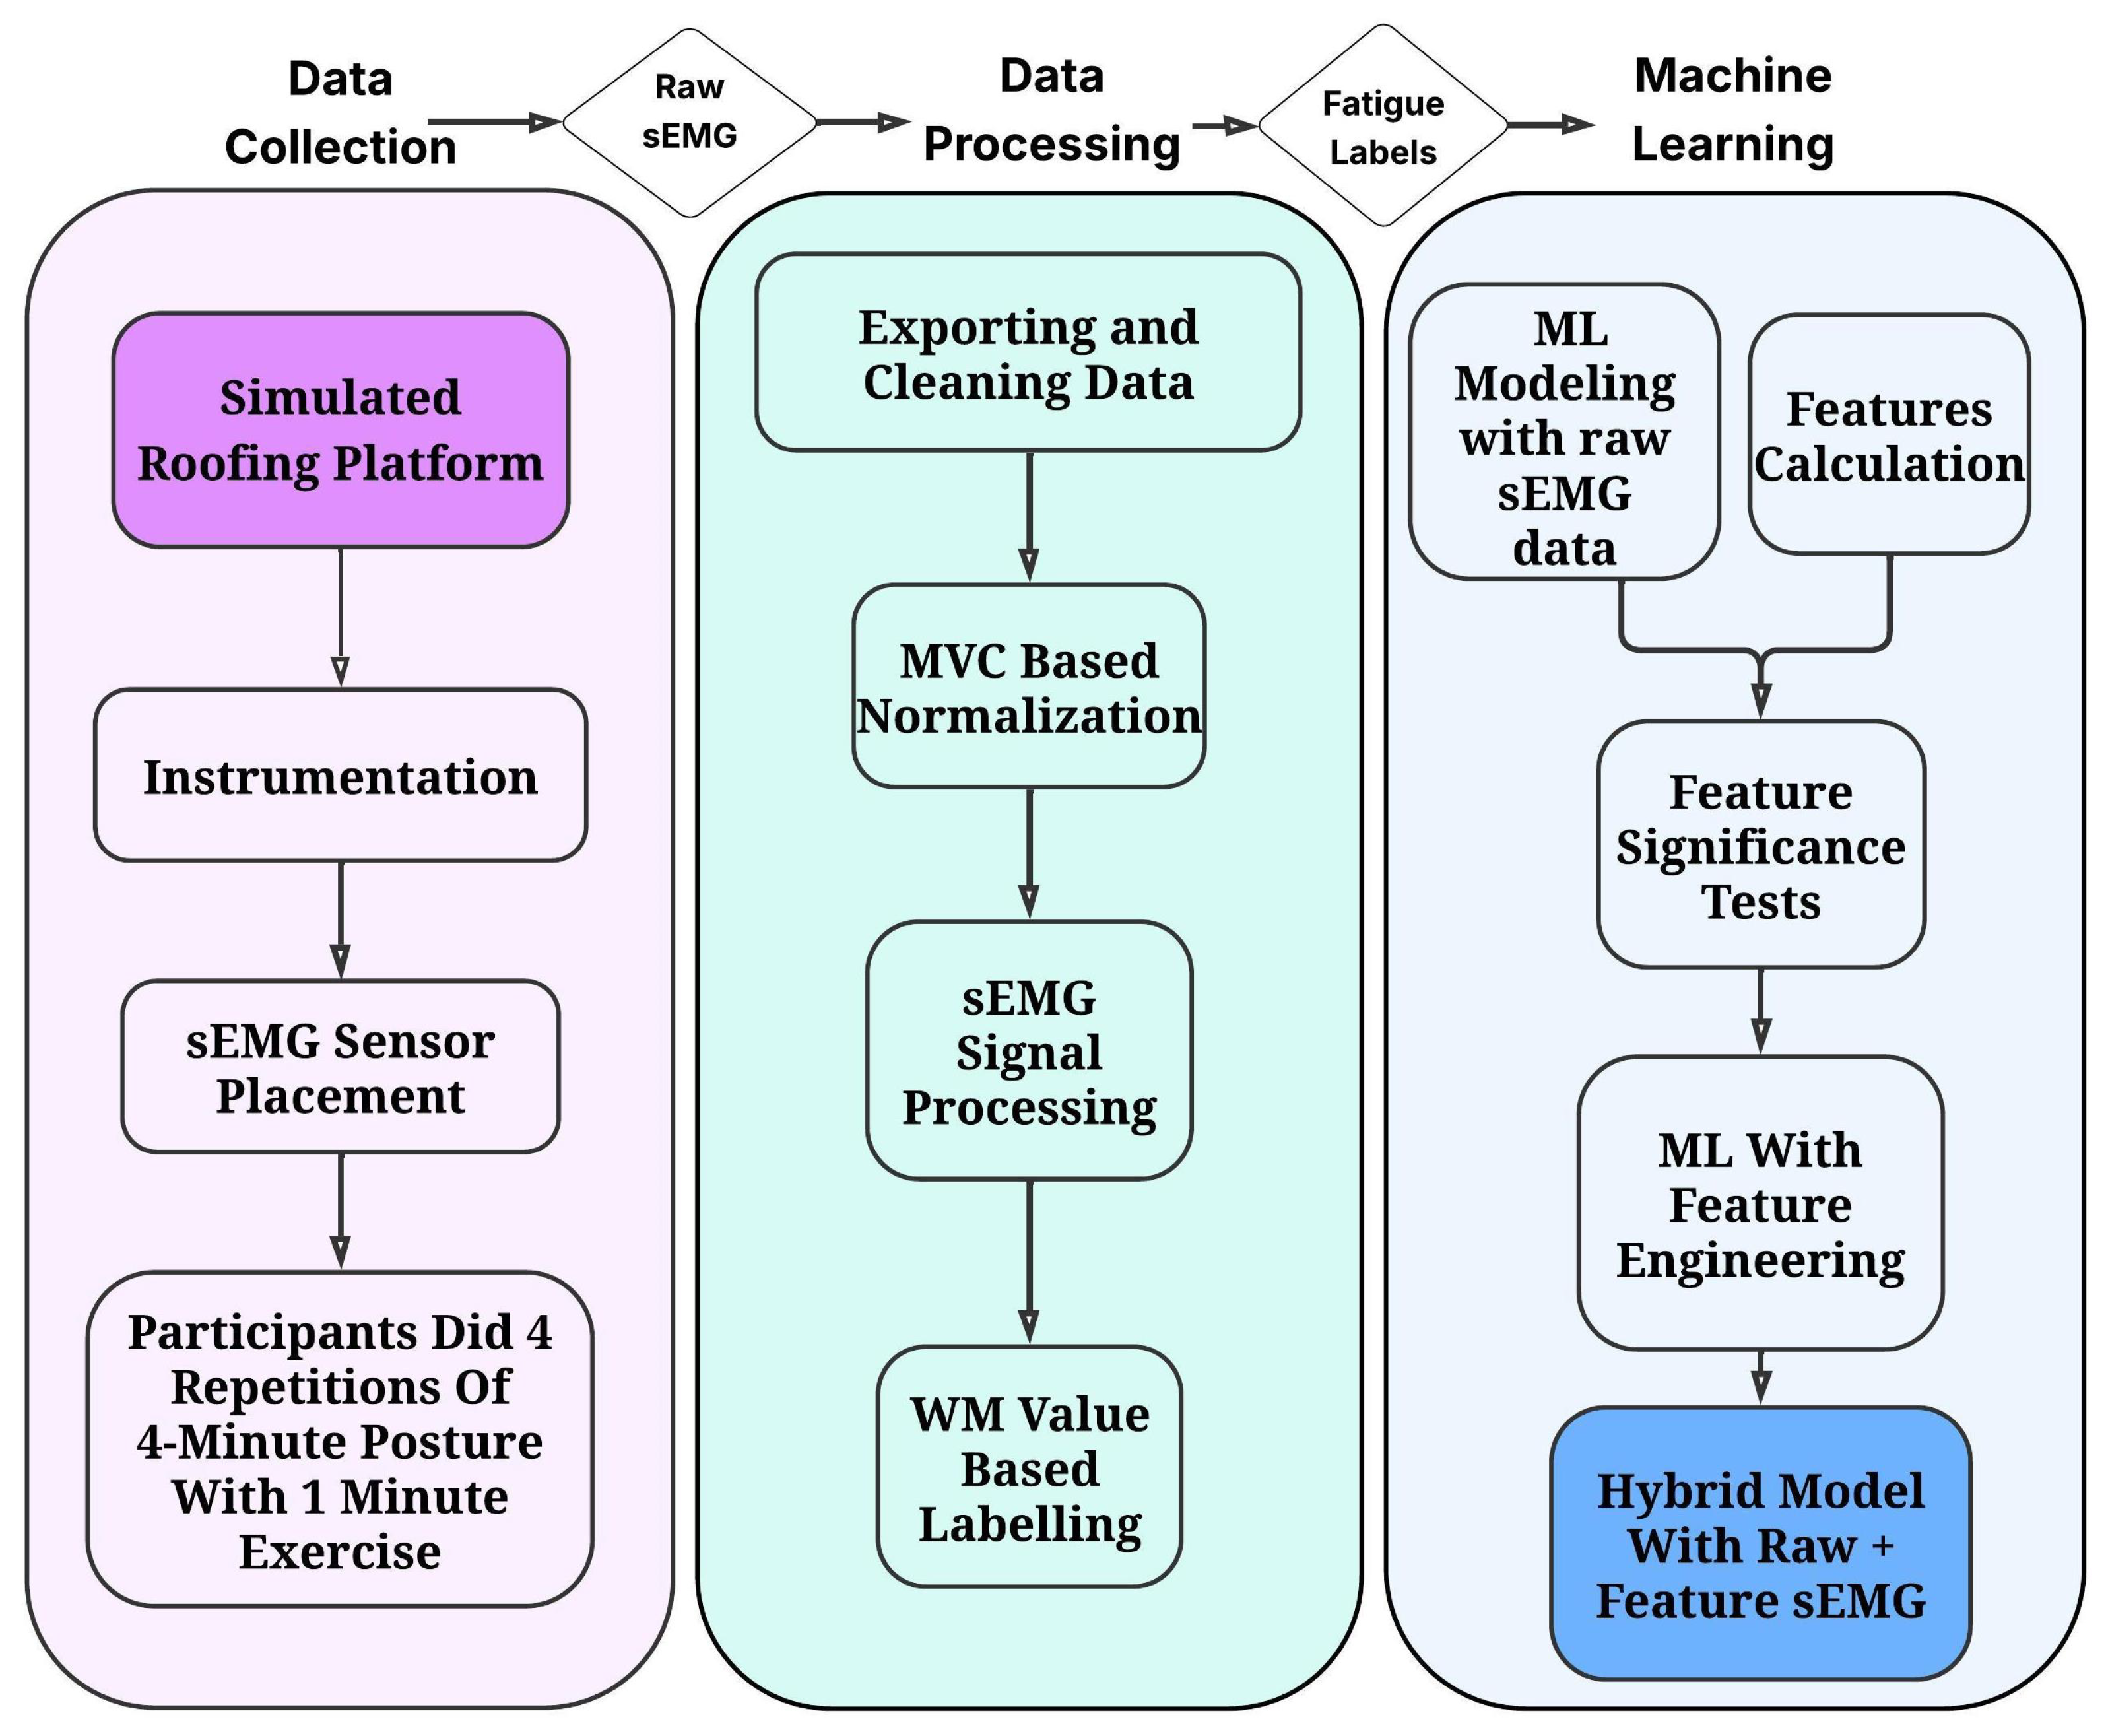
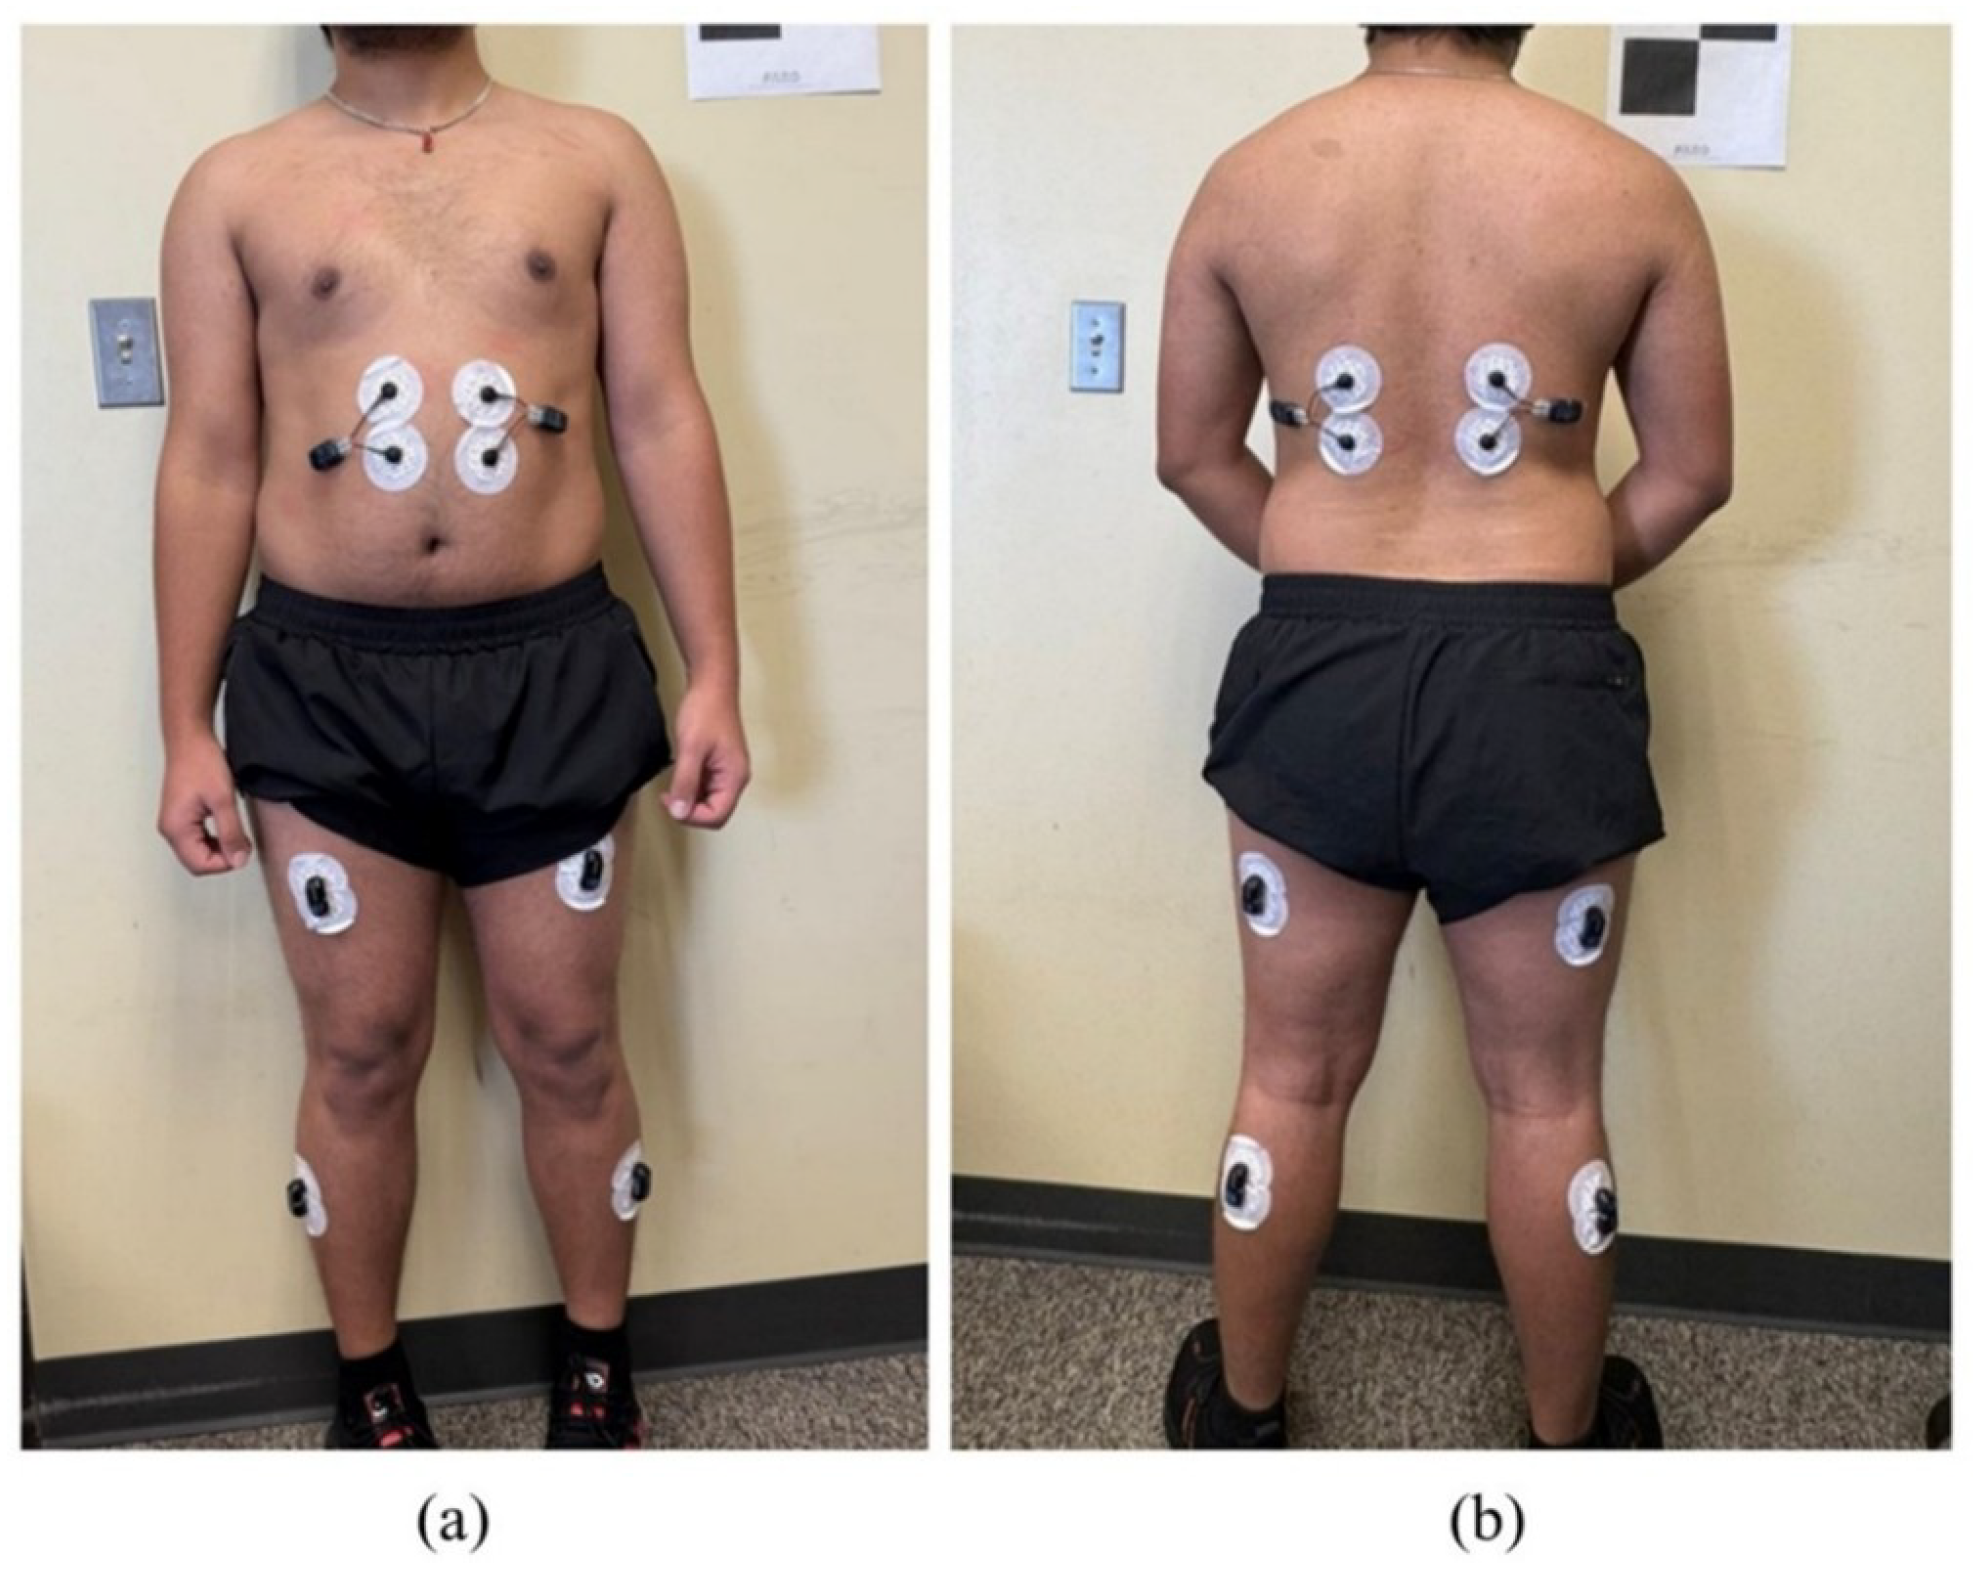
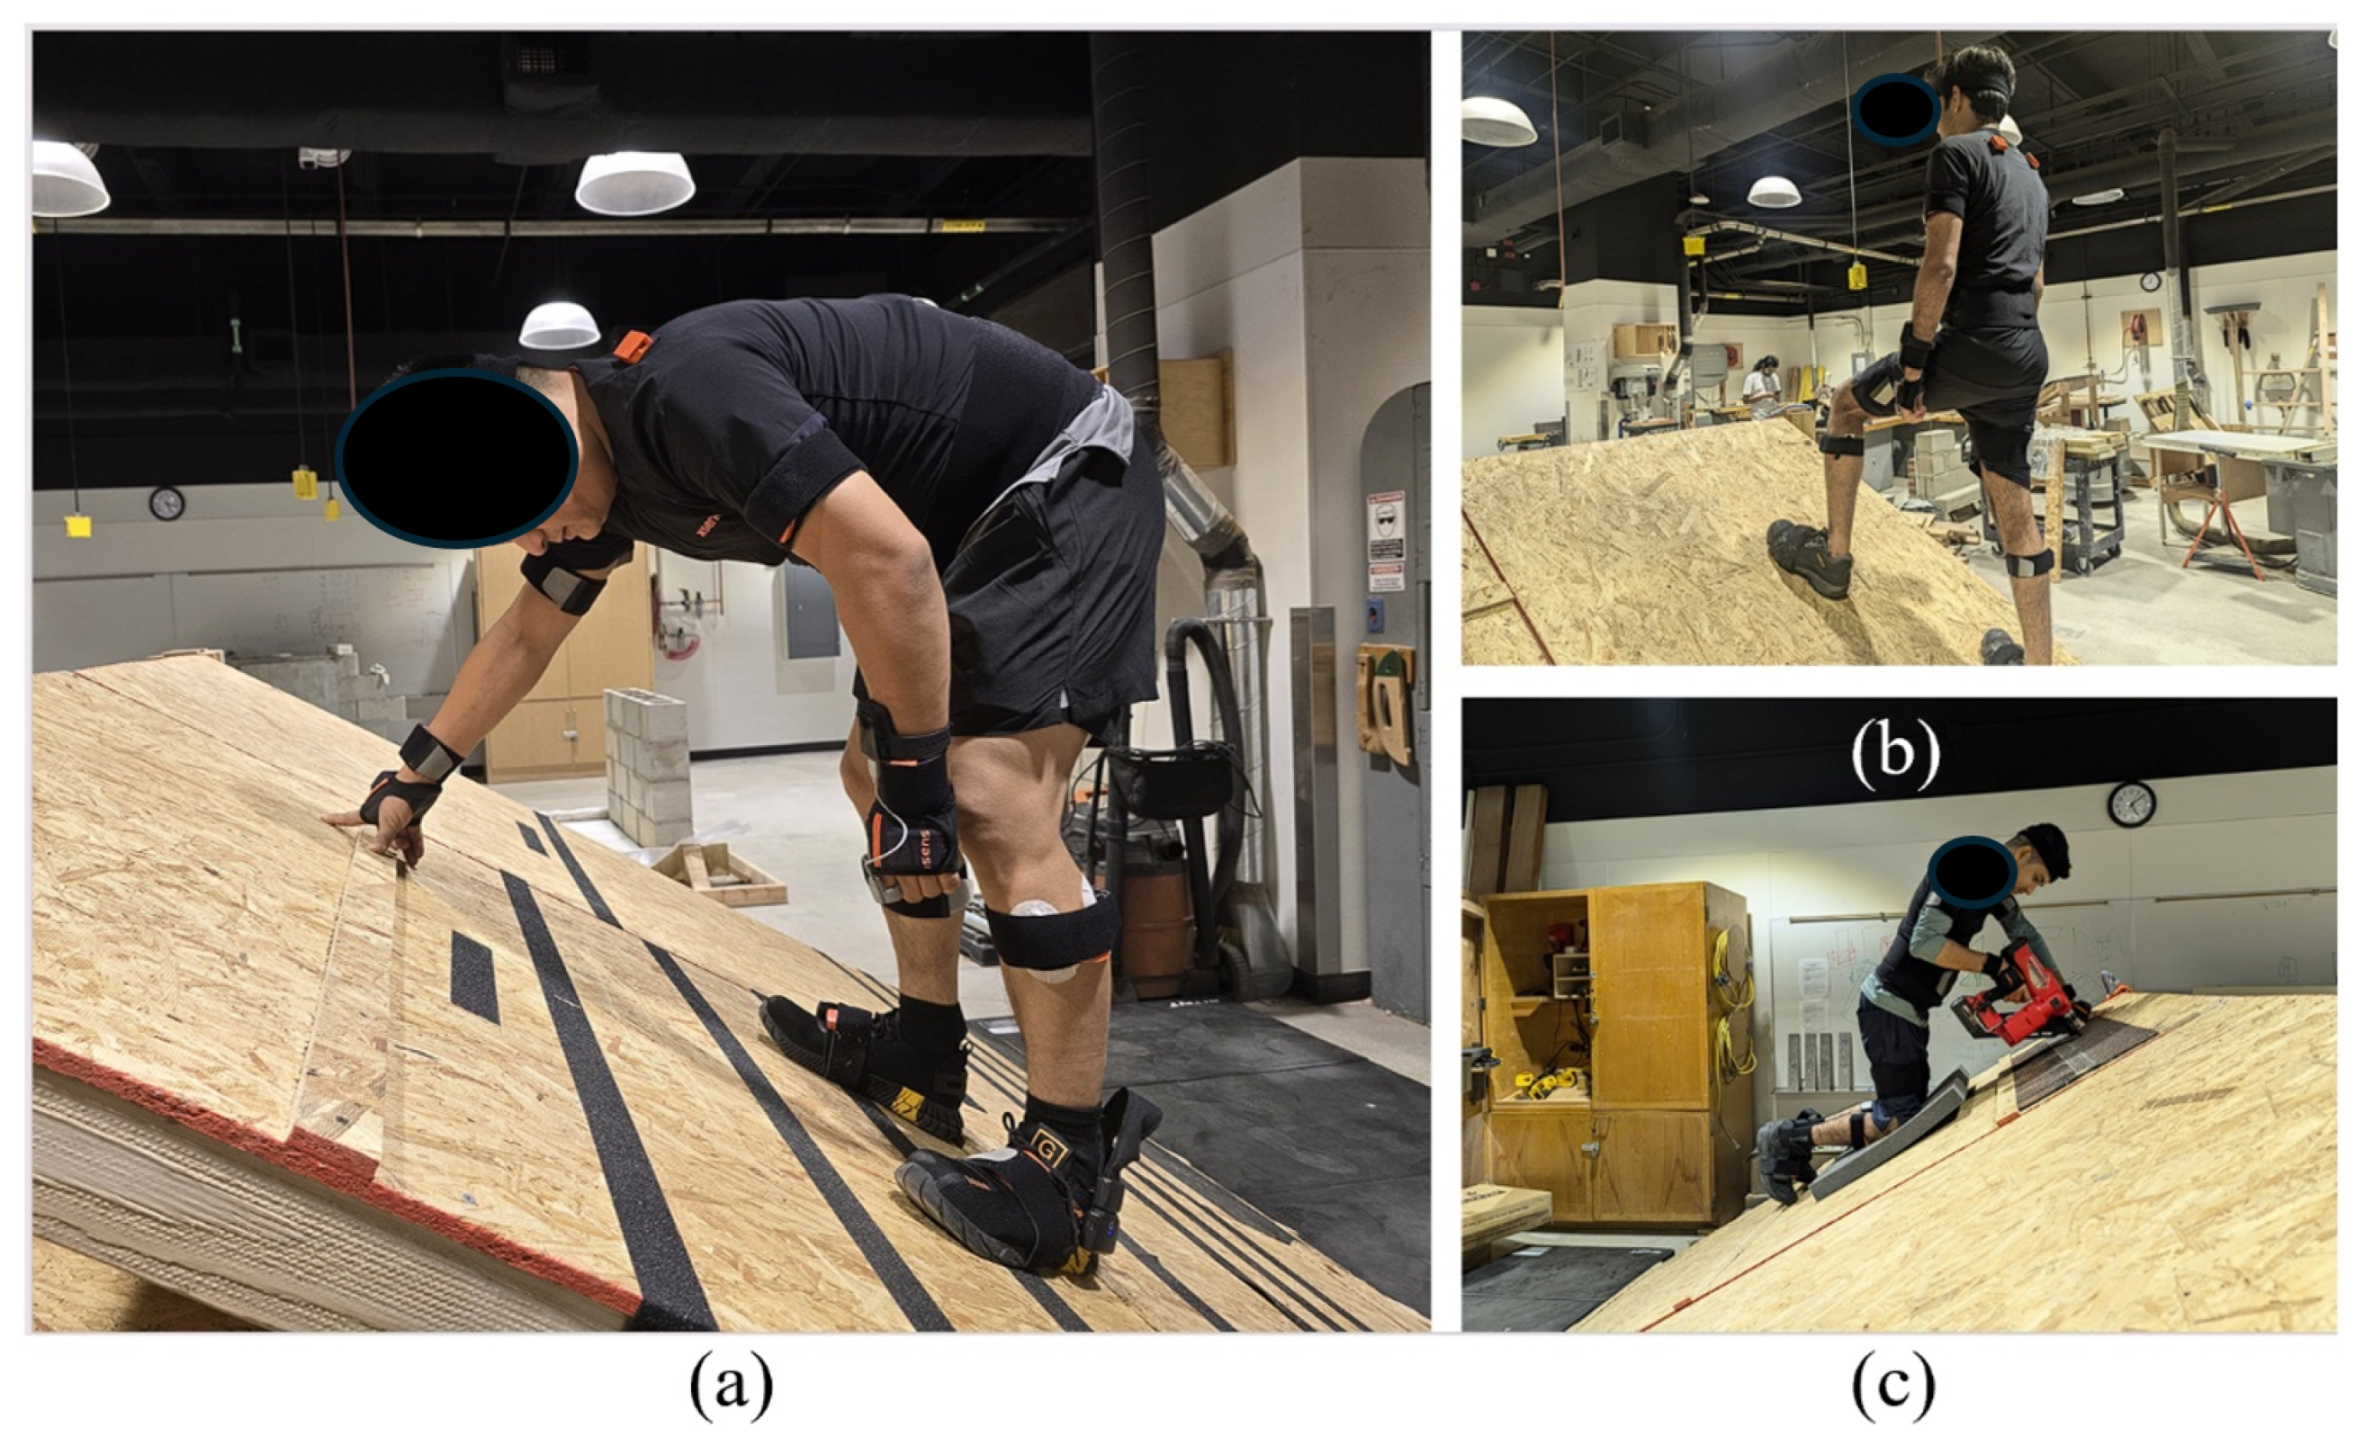
1. Introduction
The construction industry, a vital pillar of economic development, consistently ranks among the most hazardous sectors for its workforce in the United States [
1]. This sector was responsible for approximately one in every five workplace deaths in private industry in 2023, recording 1075 fatal injuries, the highest number in over a decade [
2]. Within this hazardous landscape, roofing stands out as an exceptionally high-risk occupation [
3]. Roofing work is characterized by physically strenuous tasks, repetitive motions, and awkward postures. These ergonomic hazards are the primary contributors to Work-Related Musculoskeletal Disorders (WMSDs), which are defined as injuries and disorders affecting the body’s movement system and are caused or exacerbated by physical exertion [
4]. The ergonomic burdens of roofing, such as spending up to 75% of working time in non-neutral positions like kneeling or stooping, lead to cumulative overloading and predispose workers to these debilitating conditions [
5,
6].
These WMSDs, which often arise specifically from overexertion and bodily reactions, represent a significant portion of the economic and human toll, costing U.S. businesses over USD 16 billion annually in direct costs alone [
7]. The direct physiological driver of this overexertion is muscle fatigue, defined as a decline in a muscle’s force-generating capacity from prolonged or repetitive activity [
8]. As muscles tire, performance degrades, increasing the likelihood of biomechanical errors. Detecting this state is therefore critical to preventing overexertion that leads to injury.
Despite this clear causal link, its assessment in the field has been traditionally problematic. A significant body of research has relied on subjective methods where workers rate their perceived exertion. While useful, these methods capture a perception rather than the objective physiological state of the muscle tissue, and they are prone to individual bias and interpretation. To truly prevent WMSDs, there is a critical need for proactive interventions built on objective, physiological measurement. Wearable sensor technology offers a transformative paradigm, and for localized fatigue, surface electromyography (sEMG) is an ideal tool. sEMG is a non-invasive technique that measures the electrical potential generated by muscle cells, providing a time-varying representation of the underlying muscle activity [
9,
10].
The raw sEMG signal is a complex time series from which numerous features can be extracted to track fatigue. These include amplitude-domain features like Root Mean Square (RMS) and frequency-domain features such as Median Frequency (MDF), which are considered classic and reliable indicators [
9,
11]. While these features are established, their relative effectiveness for identifying fatigue during the specific, physically demanding, and varied postures of roofing work is not well understood. This ambiguity necessitates a systematic investigation to determine which sEMG features are most effective at identifying muscle fatigue during roofing tasks.
The true potential of these features is unlocked through sophisticated machine learning (ML) algorithms [
12]. Previous studies have explored various ML techniques, employing classical ensemble methods like Extreme Gradient Boosting (XGBoost) and deep learning models such as BiLSTM and CNN-LSTM to analyze sEMG signals [
13,
14,
15]. While previous studies have demonstrated the potential of ML for fatigue detection, a critical review reveals that the translation of this research into practical, real-world safety systems has been stalled by two fundamental barriers.
The first is the critical barrier of subject-dependency, a multifaceted challenge that has severely limited the translation of research into practice. At a fundamental physiological level, comparing raw sEMG signals between individuals is inherently problematic due to vast differences in muscle size, skin impedance, and electrode placement, factors that create significant inter-individual variability [
10]. Without robust signal processing, particularly normalization to a subject’s Maximum Voluntary Contraction (%MVC), any model is built on a foundation of uncalibrated, inconsistent data, rendering inter-subject comparisons unreliable [
16,
17]. Compounding this physiological challenge is a widespread methodological flaw in model validation. Many published findings rely on protocols that fail to test for inter-subject generalizability, instead opting for less stringent methods that lead to artificially inflated performance metrics. The failure to adopt rigorous validation, particularly Leave-One-Subject-Out (LOSO) cross-validation, means that many reported models, while accurate for the individuals they were trained on, are fundamentally unreliable when applied to new workers. Together, the neglect of proper normalization and rigorous validation has populated the literature with solutions that are ultimately impractical for deployment, creating a false sense of progress and hindering the development of truly universal systems.
The second is the critical barrier of subjective and unscalable data labeling. The development of modern supervised machine learning is contingent on large, accurately labeled datasets, a need that presents a critical bottleneck as generating such data is often expensive and time-consuming [
18]. To circumvent this, the field has frequently relied on creating ground-truth labels from subjective, self-reported measures [
12]. However, this reliance on subjective perception is not merely a minor inconvenience; it is a fundamental obstacle that introduces ambiguity and noise into the very ground-truth data used for model training. Human judgment of internal states is essentially ordinal and can be matched to interval scales only with difficulty, and single ratings are often tainted with measurement errors [
19]. This compromises the reliability of the resulting models and prevents the development of the large-scale, objectively labeled datasets required to train truly robust and generalizable AI systems.
Finally, while hybrid ML models exist, the potential synergy between different modeling paradigms has not been fully exploited. The performance of advanced multi-stage hybrid architectures, for instance, a model that uses a deep learning network like a Transformer–LSTM for automated feature representation before feeding these features into a powerful classical classifier like XGBoost, is an underexplored area. Such an approach could offer the combined benefits of both paradigms, but its efficacy for fatigue detection has not been systematically evaluated. This points to a clear need to investigate whether advanced hybrid models perform better than traditional machine learning and deep learning models.
To dismantle these barriers and build a foundational component for a truly practical AI-enhanced safety management system, this study implements a framework designed to directly confront these challenges. Therefore, our research is guided by the following questions:
Which sEMG features are most effective at identifying muscle fatigue during roofing tasks?
Which machine learning models have the best performance in predicting muscle fatigue using the sEMG data?
Do advanced hybrid models perform better than traditional machine learning and deep learning models?
3. Results
This chapter presents the findings derived from the multi-stage sEMG data processing, feature extraction, and machine learning model training. The results are organized to sequentially address the research questions, detailing the data labeling process, the performance of various models on raw and engineered data, the identification of key sEMG features for fatigue detection, and finally, the evaluation of advanced hybrid model architecture. The analysis was conducted on data collected from a cohort of novice participants, whose demographic characteristics are summarized below.
The demographic characteristics of the participant cohort were analyzed per postural condition. The mean age for the standing, stooping, and kneeling postures was 27.88 (SD = 7.30), 26.57 (SD = 7.52), and 27.38 (SD = 7.12) years, respectively. Average height was similarly recorded as 172.88 cm (SD = 8.21), 173.14 cm (SD = 8.97), and 172.13 cm (SD = 8.07), while mean weight was 74.60 kg (SD = 11.83), 77.94 kg (SD = 13.23), and 73.24 kg (SD = 12.63) for the respective postures.
3.1. Data Labeling and Dataset Characteristics
This section details the outcomes of the sEMG data preprocessing and the two-stage fatigue labeling methodology. The objective here is to characterize the final dataset used for model training, ensuring transparency and validation in labels established for muscle fatigue prediction. The entire process was designed to create high-confidence, data-driven ground-truth labels for the subsequent supervised machine learning tasks.
The initial phase of establishing labels involved applying the WM trend analysis to the normalized sEMG data for all three postures. This method, adapted from [
23] with thresholds refined for the current datasets, provided a preliminary labeling of fatigue states. The specific thresholds we used, which we obtained through exploratory study, were
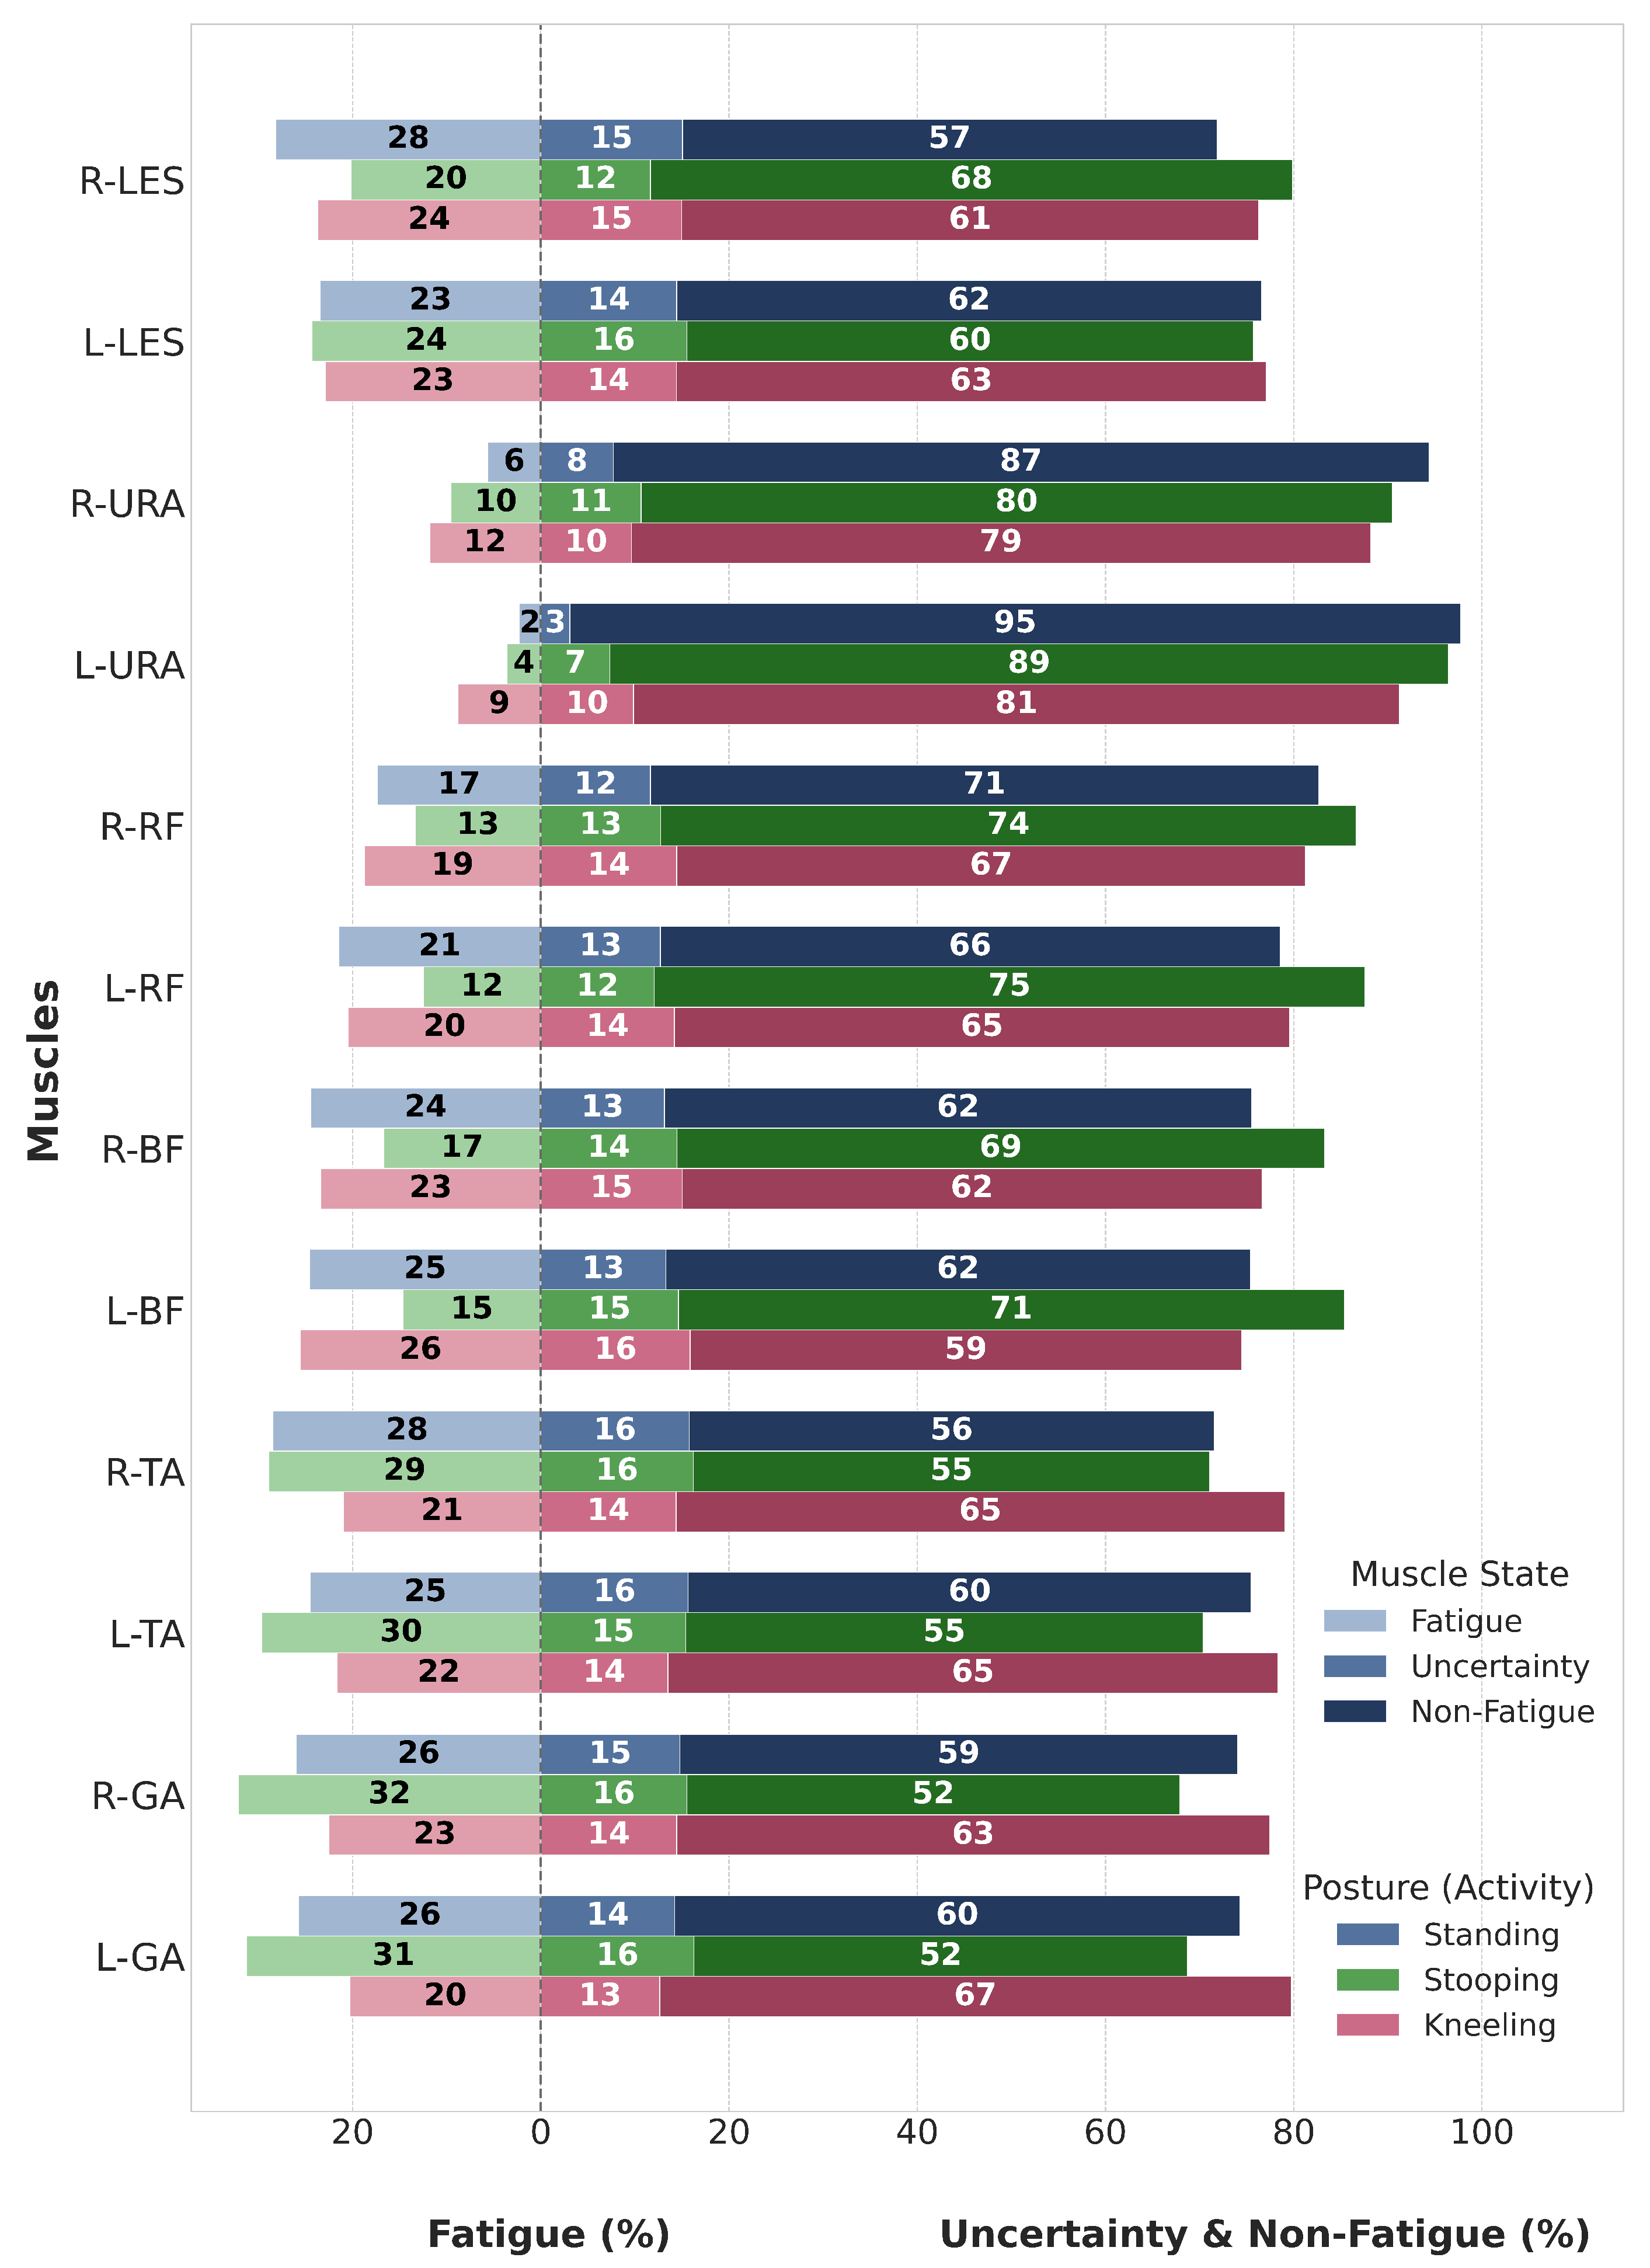
The distribution of these initial labels across the 12 monitored muscles for the standing, stooping, and kneeling postures is detailed in
Figure 5.
Figure 5 provides a detailed comparative analysis of muscle state distribution, utilizing a grouped stacked horizontal bar chart to facilitate a direct comparison across the three distinct postures. In this visualization, each of the twelve muscles, identified by an abbreviation on the y-axis, is represented by a cluster of three bars, where each bar corresponds to a specific posture (standing, stooping, or kneeling). This allows for an immediate assessment of how a single muscle’s activation state changes with activity.
From the figures, we can see that the right and left upper rectus abdominis (R-URA and L-URA) consistently had the lowest percentages of fatigue among all the muscles for all postures. For example, R-URA registered fatigue in only 6%, 10%, and 12% of segments for standing, stooping, and kneeling, respectively. After these muscles, the least fatigued were the right and left rectus femoris. On the other hand, the muscles with the most instances of ‘fatigue’ were the right lumbar erector spinae and the right and left tibialis anterior.
The results also reveal a critical insight into postural ergonomics: the impact of a given posture is highly muscle-specific. A notable disparity in fatigue was observed in the lower leg musculature. For example, the gastrocnemius (calf muscle) demonstrated substantial variation, with the stooping posture inducing the highest fatigue levels (31–32%), likely due to the increased demand for ankle plantarflexion to counteract the forward shift in the body’s center of mass on the incline. Conversely, kneeling, which provides a larger and more stable base of support, reduced the load on the gastrocnemius, resulting in lower fatigue levels (20–23%).
To maintain the highest integrity and confidence in the ground-truth labels used for subsequent machine learning model development, a conservative approach was adopted for the data curation stage. The segments initially classified by the WM trend analysis as ‘uncertain’ (0.52 ≤ WM ≤ 0.58) represented ambiguous states that could not be definitively categorized. On average, 13.2% of the data was categorized as ‘uncertain’ and was flagged for exclusion. All segments falling into this ‘uncertain’ category were treated as Not a Number (NaN) and systematically excluded from the dataset used for training and evaluating the fatigue prediction models. This decision ensures that the models were trained exclusively on data segments with clear, high-confidence labels of either ‘non-fatigue’ or ‘fatigue,’ thereby minimizing potential noise and ambiguity in the learning process.
The final composition of the dataset used for modeling, after the exclusion of these uncertain segments, is presented in
Table 1. As shown in the table, for all three postures, the final dataset available for modeling exhibited a notable class imbalance. Across the postures, approximately 76% of the total segments were categorized as ‘non-fatigue,’ while only 24% were categorized as ‘fatigue’. This characteristic of the final dataset is an important consideration for the subsequent evaluation of model performance, particularly when interpreting metrics sensitive to class distribution like the F1-score.
3.2. Baseline Model Performance on Raw sEMG Data
Before undertaking comprehensive feature engineering, an initial exploration analysis was conducted to establish a performance baseline for muscle fatigue prediction using only the raw sEMG signals. This crucial step aimed to assess the inherent discriminative information present in the time-series data itself and to provide a benchmark against which the more complex, feature-based models could be compared. By evaluating models on the raw signal, we can quantify the precise value added by the subsequent feature engineering process.
For this baseline evaluation, three different machine learning models were selected: an LSTM network, an RF model, and an XGBoost model. These models were trained and tested directly on the normalized and outlier-removed raw sEMG time-series data. To investigate the potential for a universal model even at this raw data stage, signals from all twelve monitored muscles were pooled for each of the three distinct roofing postures: stooping, standing, and kneeling. The classification performance of these models on the raw data is summarized in
Table 2.
As tabulated in
Table 2, the results reveal a consistent pattern of model efficacy on the unprocessed time-series data. The LSTM network consistently outperformed the other two models, Random Forest and XGBoost, in all of the postures. This is a logical conclusion, as the LSTM model architecture was specifically built to understand and learn from temporal relationships, a characteristic that is crucial for extracting meaningful deep features from sequential raw signals.
A closer examination of the performance metrics reveals the following:
For the standing posture, the LSTM achieved an accuracy of 55.34% and an F1-score of 59.01%. In contrast, the Random Forest model performed near the level of random chance with an accuracy of 48.13%, and the XGBoost model achieved 51.78% accuracy.
For the stooping posture, all models showed a slight improvement. The LSTM model reached an accuracy of 58.2% and an F1-score of 62.33%, while the Random Forest model achieved its best performance here with a 63.83% F1-score, despite a lower accuracy (55.23%).
The best baseline performance was observed during the kneeling posture, where the LSTM model achieved an accuracy of 57.88% and a comparatively stronger F1-score of 66.76%. The relatively better performance during this posture might be attributed to the more static nature of the muscle contractions involved, leading to less signal non-stationarity compared to the more dynamic elements present in stooping or the subtle postural adjustments in standing.
While these accuracy and F1-score values demonstrate that the raw sEMG signal contains some discernible patterns related to muscle fatigue, which is yielding results better than random chance, they also clearly highlight the limitations of relying solely on unprocessed time-series data for reliable fatigue classification. The performance, even for the best-performing LSTM model, does not meet the requirements for a practical and dependable application.
Overall, the baseline performance achieved with raw sEMG data was deemed insufficient for developing a robust fatigue prediction system. This outcome strongly motivated and justified the subsequent, more intensive approach of detailed feature engineering. The following sections will therefore focus on the performance of models trained using a comprehensive set of physiologically relevant sEMG features designed to enhance the discriminability between fatigued and non-fatigued states.
3.3. Significance of sEMG Features in Fatigue Detection
Having established that raw sEMG data alone provides limited predictive power, the subsequent analysis focused on a multi-step statistical process to identify the most important engineered features for fatigue detection. This section details the methodology and findings used to answer Research Question 1, “Which sEMG features are most effective at identifying muscle fatigue during roofing tasks?”, by identifying and ranking the most discriminative features.
The first step was to determine the appropriate statistical test for comparing feature distributions between ‘fatigue’ and ‘non-fatigue’ states. A Shapiro–Wilk test for normality was performed on the distributions of each engineered sEMG feature for each muscle group across all participant data.
As illustrated by the representative Q-Q plots in
Figure 6, the data consistently and significantly deviated from a normal distribution. The data points on the plots consistently diverge from the theoretical quantile line, a pattern that is statistically confirmed by the accompanying Shapiro–Wilk test results, which yielded a
p-value < 0.001 for all tests. This finding rejected the null hypothesis of normality and confirmed our initial suspicion that the sEMG data would not be normally distributed, particularly as the muscles become increasingly activated during the task. This step was crucial as it formally validated the decision to use a non-parametric statistical test for the subsequent analysis.
Based on the results of the normality testing, a non-parametric approach was required. To quantify the discriminative power of each feature, a one-way Kruskal–Wallis H-test was performed. The test was applied systematically to compare the distribution of each of the 26 engineered features between the ‘fatigue’ and ‘non-fatigue’ states. This process was repeated for each of the 12 monitored muscles within every individual data file (32 total files from eight participants × four repetitions).
This granular analysis resulted in a large set of significance tests, assessing the ability of every feature to detect fatigue in every muscle for every experimental trial. To account for the large number of comparisons and control for the false discovery rate, a Benjamini–Hochberg False Discovery Rate (FDR) correction was applied with an alpha of 0.05. A feature was considered to have strong discriminative power for a given muscle in a given trial if the FDR-corrected p-value was less than 0.05.
To synthesize the granular statistical results into a high-level comparison of feature effectiveness, the outcomes were systematically aggregated. The process began by quantifying how frequently each feature detected a significant trend for each muscle within a given posture. For example, analysis of the MDF feature during the sustained kneeling task revealed it was a highly consistent indicator for the biceps femoris (showing a significant trend in 31–32 out of 32 experimental files) but was less consistent for the upper rectus abdominis (15–20 significant files). Summing out these instances for just the kneeling posture showed that the MDF feature successfully identified fatigue in 338 of the 384 possible muscle-trial combinations, yielding an overall consistency of 88%.
This aggregation method was then applied to all key sEMG features across all three postures (standing, stooping, and kneeling). For each feature and posture, the total count of significant instances was summed and divided by the total number of experimental files to calculate a final “consistency percentage.” The complete results of this comprehensive analysis are presented in
Table 3. As summarized in the table, the analysis reveals a clear hierarchy of feature effectiveness. The frequency-domain features, MDF and MNF, emerge as the most consistent, showing a significant change in an average of 88% of all datasets across all postures. Other metrics such as VCF, Skew, PSR, and SampEn also proved highly reliable, with average significance rates ranging from 76% to 81%. While the amplitude-based features RMS and MAV were also frequently significant, they demonstrated slightly lower consistency (73% and 72%, respectively).
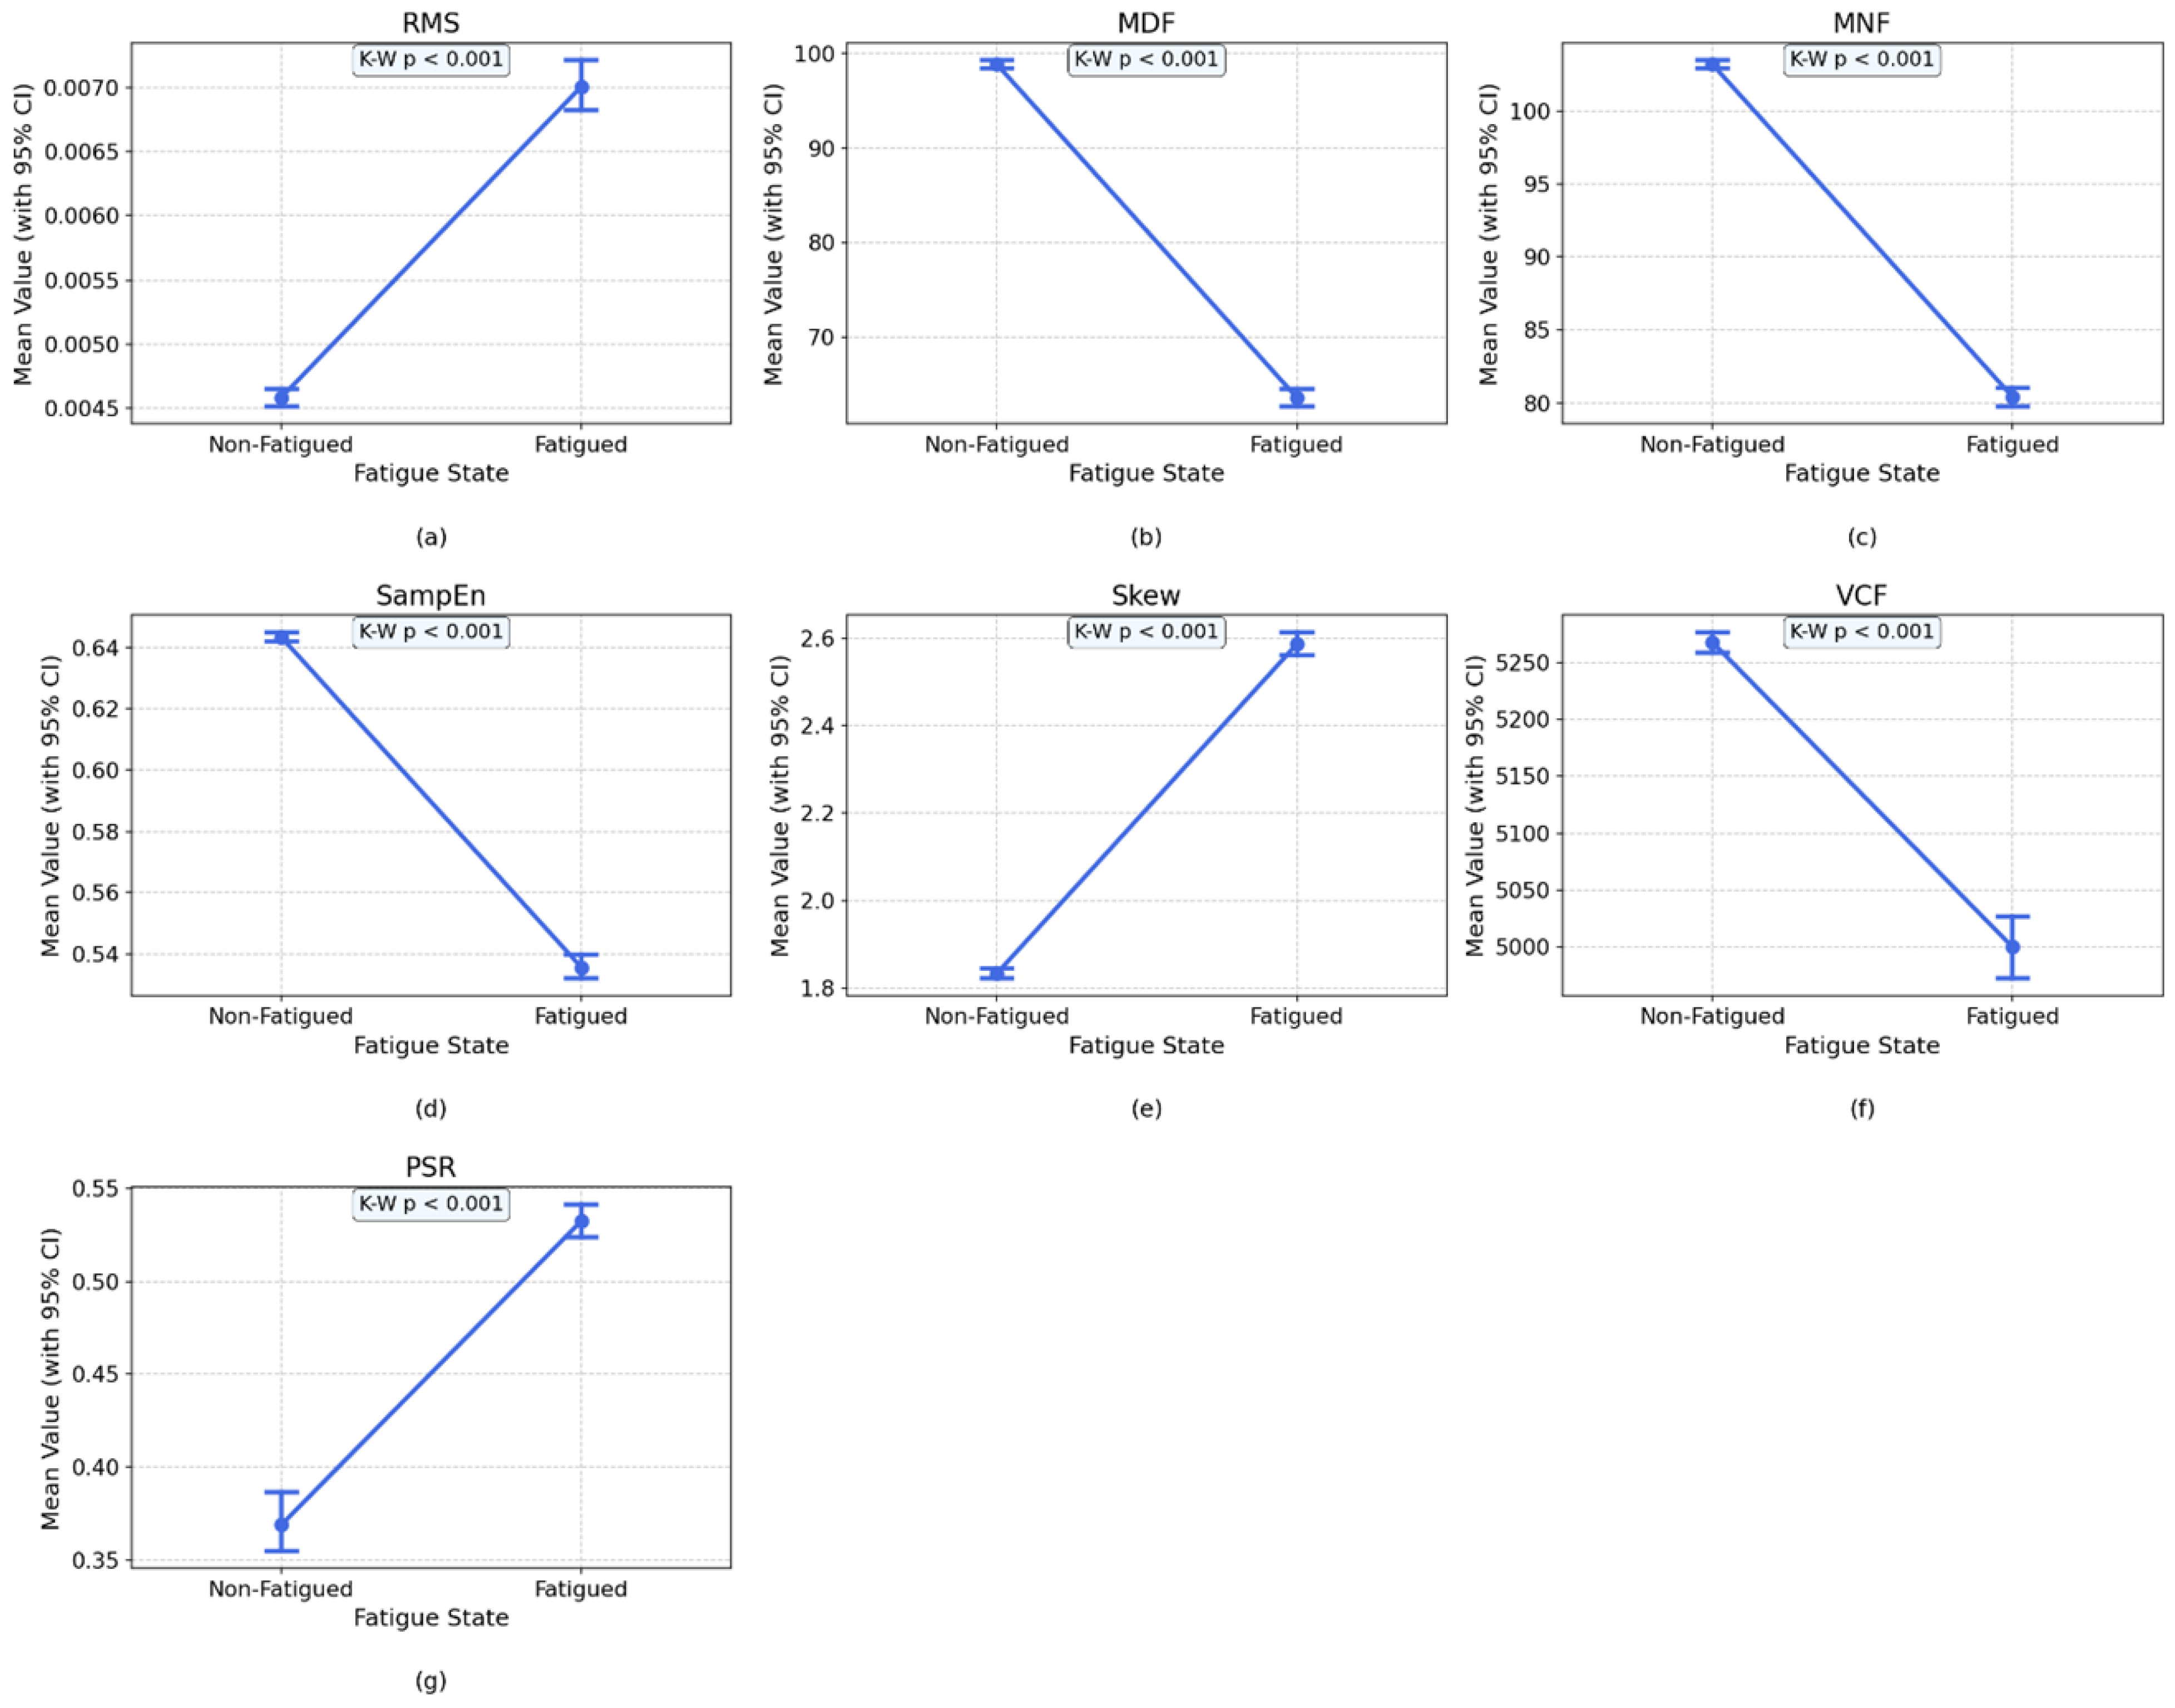
These statistical findings are visually corroborated by main effect plots, which depict the general trends of these features.
Figure 7 presents these main effects for the left rectus femoris muscle as a representative example, illustrating the characteristic physiological changes from a non-fatigued to a fatigued state. All features demonstrated a highly significant statistical difference between the two conditions (Kruskal–Wallis
p < 0.001). A subset of features showed a clear increase with the onset of fatigue: RMS (a) rose substantially from a mean value of approximately 0.0047 to 0.0069, while Skew (e) increased from approximately 1.8 to 2.5. Conversely, the remaining features exhibited a significant decrease, most notably the frequency-domain features MDF (b) and MNF (c), which showed pronounced drops from nearly 100–102 Hz down to 65–81 Hz.
To complement the statistical significance identified by the Kruskal–Wallis H-test, a Random Forest model was also trained using the full set of extracted features. The purpose of this approach was to evaluate the relative predictive power of each feature in distinguishing between non-fatigued and fatigued states. The model’s built-in feature importance mechanism provides a quantitative ranking based on how much each feature contributes to classification accuracy, offering a practical perspective on feature utility beyond statistical significance.
Figure 8 depicts the mean feature importance scores derived from this model across all participants and postures. The ranking provides strong corroboration for the findings from the statistical analysis, with the same group of features emerging as the most valuable. Frequency-domain metrics MNF, MDF, PSR, and VCF are again ranked as the most influential predictors, reinforcing their status as primary indicators of fatigue. Similarly, Skew, SampEn, and RMS also demonstrated substantial importance, confirming their value in a predictive context.
Considering the converging evidence from both the statistical significance tests (
Table 3) and the model-based importance ranking (
Figure 8), a final set of seven features was chosen to definitively answer Research Question 1. Based on their superior and consistent performance in this dual analysis, MDF, MNF, RMS, VCF, PSR, Skew, and SampEn were selected for further investigation and for building the machine learning models in the subsequent sections.
3.4. Performance of Feature-Extracted sEMG Models
Building upon the feature selection process detailed in the previous section, this section presents a comparative evaluation of machine learning models to answer research question 2: “Which machine learning models have the best performance in predicting muscle fatigue using the sEMG data?”
A diverse set of models were selected to assess the performance on the engineered seven-feature set. This selection includes the following:
Traditional Ensemble Models: Random Forest (RF) and XGBoost, which are well-established benchmarks renowned for their robustness on structured, tabular data.
Deep Learning Architectures:
- –
A one-dimensional Convolutional Neural Network (1D-CNN);
- –
A hybrid CNN-LSTM with an Attention mechanism;
- –
A Transformer-based model.
The classification performance metrics for models trained on sEMG features from the standing posture are presented in
Table 4. The results for the standing posture indicate that the CNN-LSTM with Attention model yielded the best performance. It achieved the highest test accuracy (0.7830 ± 0.0120) and the best F1-score of 0.7135. The XGBoost model also performed competitively, positioning it as the clear second-best performer.
Conversely, the Transformer architecture underperformed significantly, with the lowest accuracy (0.6717) and F1-score (0.6120).
The superior classification capability of the leading models is further detailed in the confusion matrices presented in
Figure 9.
An analysis of the models in
Figure 9 reveals their predictive capabilities.
The CNN-LSTM with Attention model (a) correctly identified 33,127 fatigued segments (TP) and 64,354 non-fatigued segments (TN), demonstrating its balanced classification strength.
The XGBoost model (c), while having slightly fewer TPs, notably committed the fewest false negative errors (10,290 instances). This is important as it indicates the lowest rate of missed fatigue cases among all models.
The poor performance of the Transformer (b) is explained by its high number of FPs where it misclassified a high number of non-fatigued segments as fatigued, indicating a model bias that reduces its reliability.
This detailed breakdown confirms that for the standing posture, the CNN-LSTM and XGBoost models were better.
The stooping posture imposes a significant load on the lumbar and leg muscles, creating a different set of fatigue patterns. The performance of the models for this task is detailed in
Table 5. An analysis of model performance for the stooping posture reveals a shift in the top-performing model. The XGBoost model demonstrated superior performance with the highest test accuracy (0.7809 ± 0.0109) and the highest F1-score (0.6943 ± 0.0120). This suggests that the feature patterns indicative of fatigue while stooping are captured most effectively by the XGBoost model. The CNN-LSTM with Attention model followed closely with a test accuracy of 0.7753 and a F1-score of 0.6808. In contrast, RF, while achieving a reasonable accuracy (0.7599), showed a significant weakness in its F1-score (0.6163).
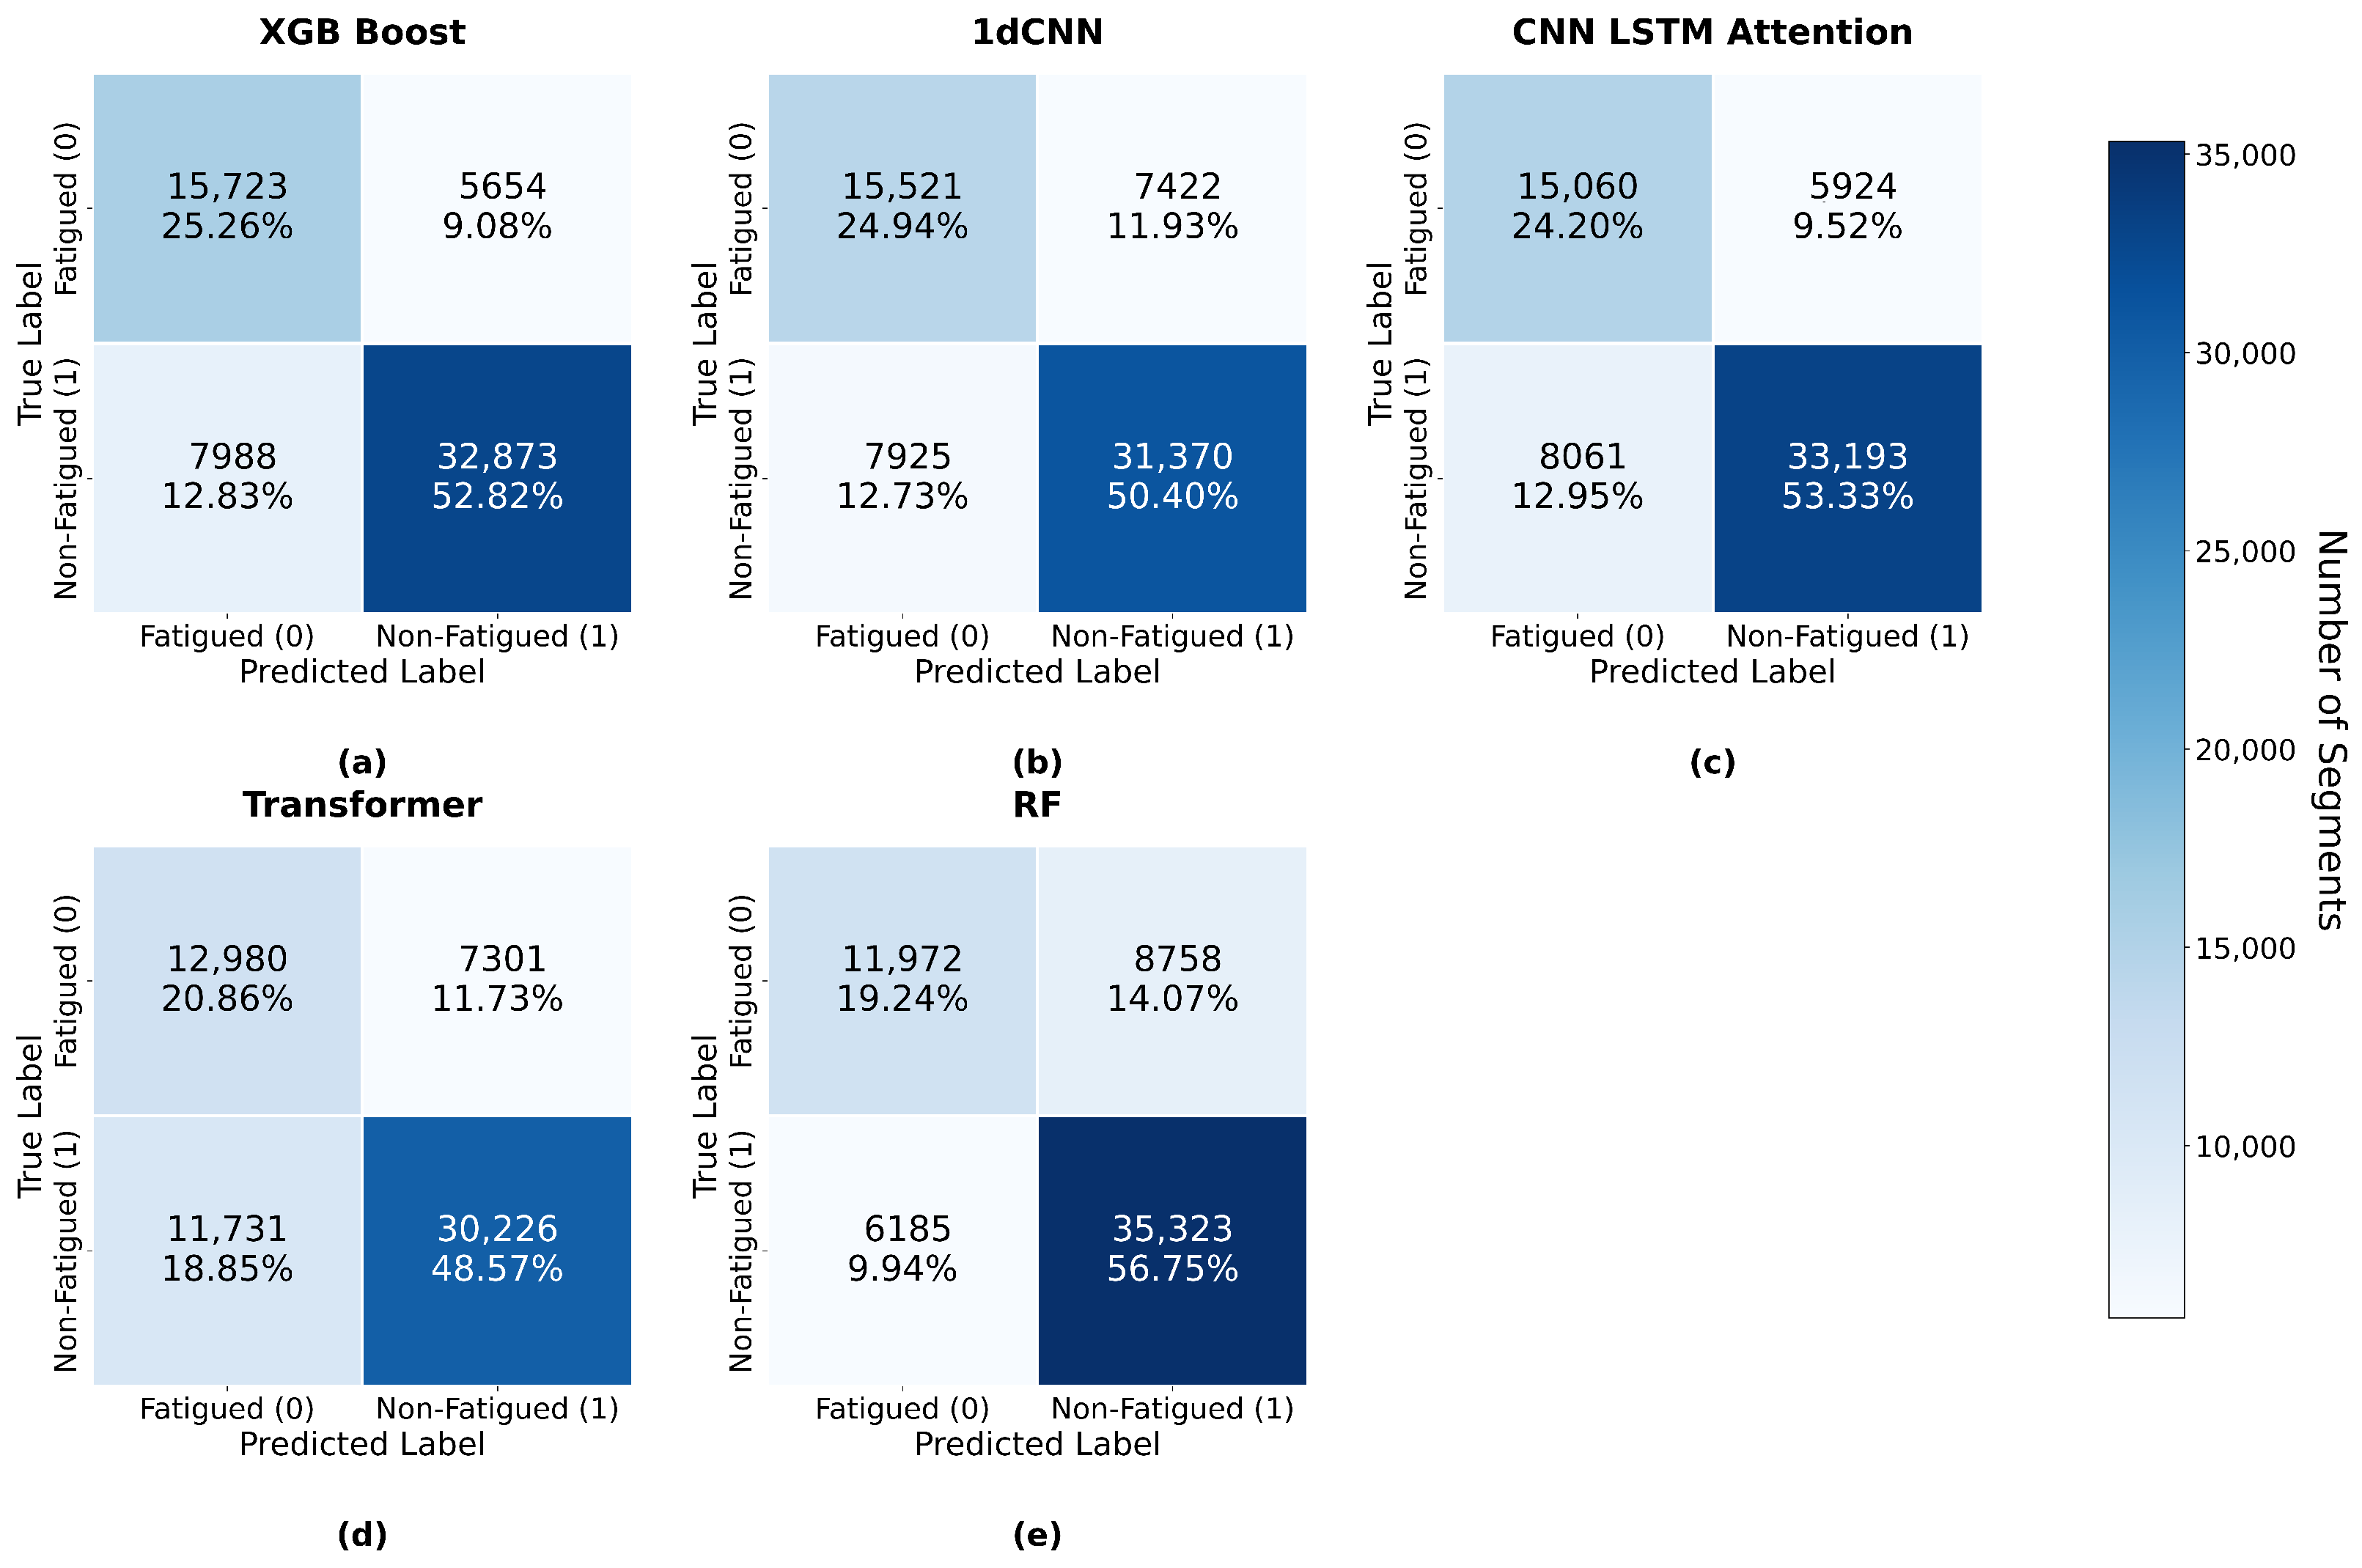
A detailed examination of the classification behavior is provided by the confusion matrices in
Figure 10.
The confusion matrices (
Figure 10) confirm the strength of the XGBoost model (a), which minimized the critical False Negative errors, indicating high sensitivity to fatigue. In contrast, the Random Forest model (e) showed a significant weakness in fatigue detection, misclassifying a high number of fatigued segments as not fatigued.
This analysis confirms that for the stooping posture, the XGBoost model achieves high overall accuracy.
The kneeling posture introduces unique physiological demands. The performance of the models under this posture is detailed in
Table 6.
The CNN-LSTM with Attention model emerged as the most balanced and effective classifier, achieving the highest overall test accuracy (0.7469 ± 0.0325) and the highest F1-score (0.6527 ± 0.0272). RF model attained the highest non-fatigue F1-score (0.8134), suggesting a specialization in correctly identifying non-fatigued states, but this came at the expense of lower performance on the fatigue class (fatigue F1-score of 0.5904). The Transformer model continued its consistent underperformance.
The confusion matrices for kneeling (
Figure 11) confirm the strong, balanced performance of the CNN-LSTM model (b), which correctly identified a high number of fatigued segments while maintaining a low rate of False Negatives. This analysis also highlights the specific trade-offs of other models, such as the high number of False Negatives for Random Forest (d) and the high number of False Positives for XGBoost (c).
This detailed error analysis confirms that the CNN-LSTM with Attention provides the performance for the kneeling posture.
In direct response to Research Question 2, the comparative analysis across the three distinct postures confirms that classification performance was posture-dependent, with no single machine learning model demonstrating universal superiority. This result highlights the challenge of using standalone models for diverse ergonomic demands and motivated the development of a more robust, hybrid solution. The ensemble models, particularly XGBoost, showcased high efficacy in specific contexts, proving optimal for the biomechanically demanding stooping posture. However, the CNN-LSTM with Attention model emerged as the most consistently balanced performer overall. It achieved the highest performance in the standing and kneeling postures and remained highly competitive in stooping.
3.5. Performance of the Advanced Hybrid Model
The preceding analyses evaluated two distinct modeling philosophies: deep learning models trained on raw sEMG data and various machine learning models trained on a set of engineered features. The results demonstrated that while raw-signal models can automatically learn complex patterns, feature-based models excel by leveraging known physiological indicators of fatigue. This outcome naturally leads to the central research question for this final stage of analysis: Can an advanced hybrid model, which integrates both raw data and engineered features, outperform the standalone deep learning and traditional machine learning models?
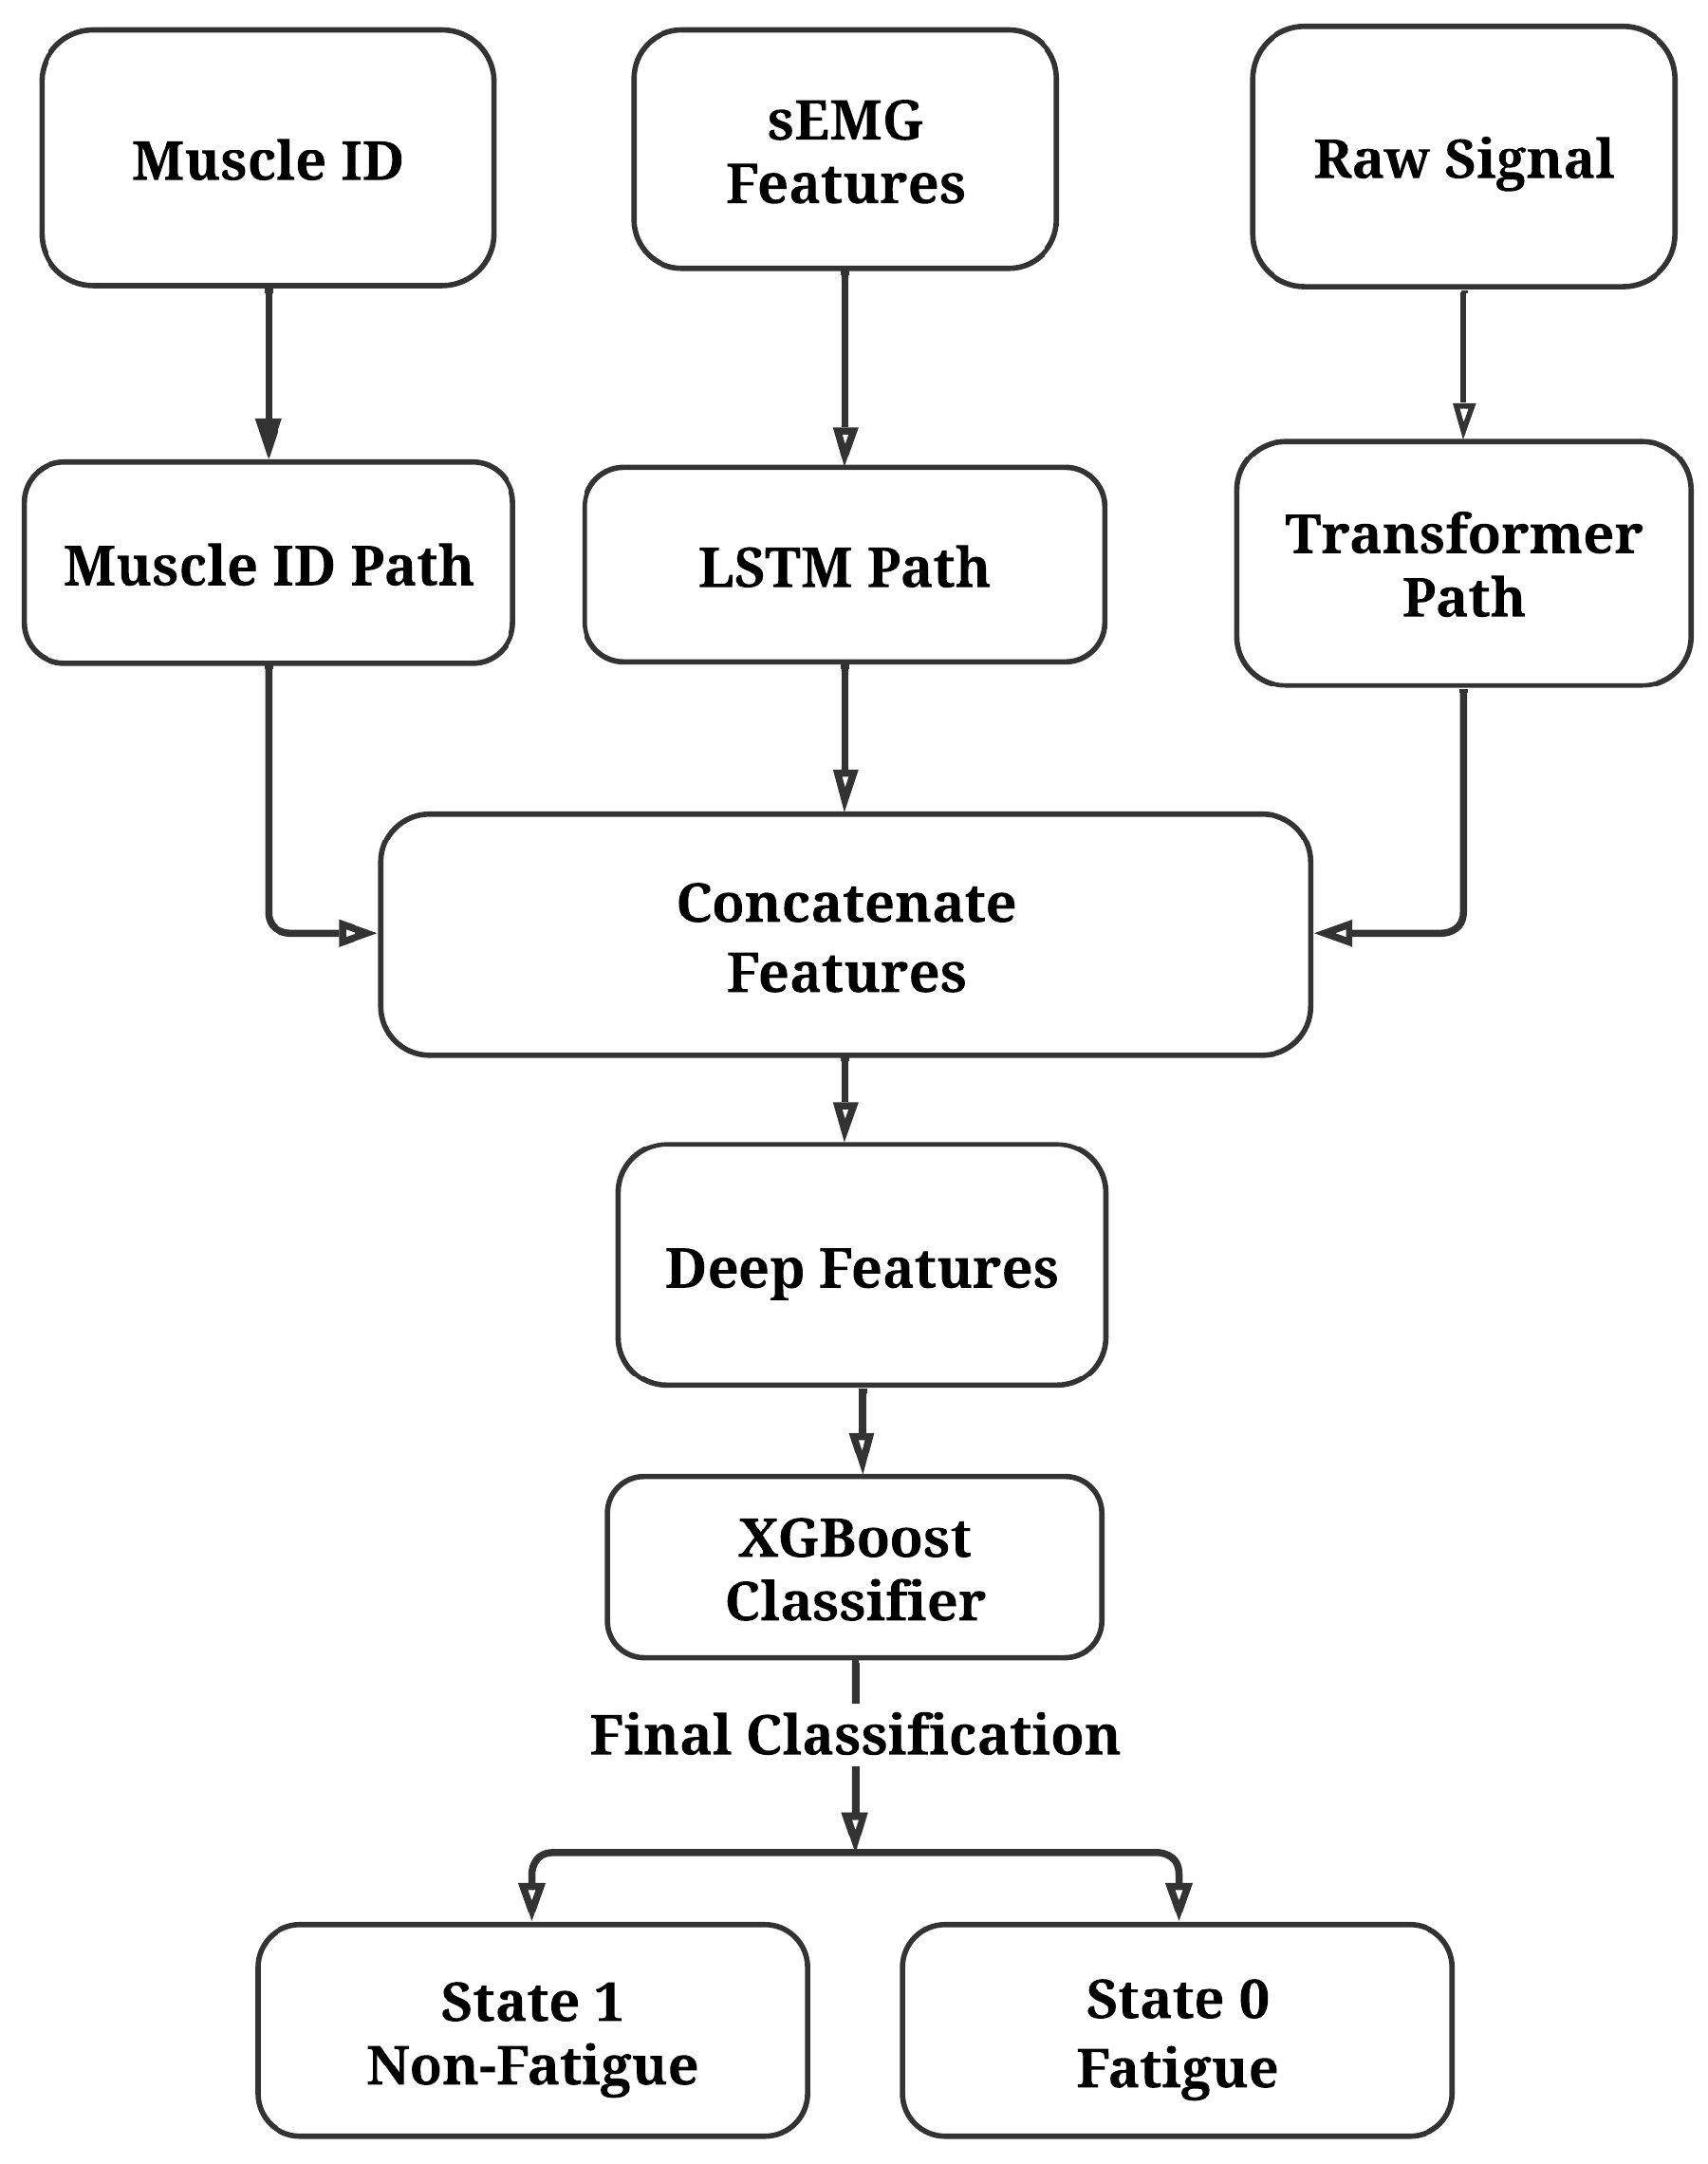
To answer this question, and in direct response to Research Question 3, a hybrid architecture was developed. It was hypothesized to achieve synergistic performance by integrating the complementary strengths of these two data types. The model’s design, illustrated in
Figure 12, is a direct result of the preceding insights. It employs sophisticated, multi-stage architecture to make a final, decisive classification.
The architecture detailed in
Figure 12 operates in two distinct stages.
Stage 1 (Feature Extraction): This stage processes four parallel input streams to generate a rich, contextualized feature representation.
- –
Raw sEMG Signal (Input A): A Transformer path autonomously extracts complex, hierarchical patterns directly from the raw sEMG waveform, capitalizing on its ability to discern intricate patterns that may not be captured by pre-defined features.
- –
Engineered sEMG Features (Input B): An LSTM path processes the time series of the seven selected engineered features (MDF, MNF, RMS, etc.) to explicitly model the signal’s evolution and learn its temporal dynamics.
- –
Muscle ID (Input C): Separate dense layers learn embedding representations for these categorical variables, allowing the model to account for muscle-specific and subject-specific physiological variations.
The outputs from these paths are concatenated into a unified feature vector, which is passed through a final dense layer to produce a rich, 64-dimensional latent vector of deep features.
Stage 2 (Final Classification): This stage then takes the learned latent feature vector as its sole input. An XGBoost classifier, selected for its robust performance in the preceding feature-based analyses, performs the final binary classification into fatigued (State 0) or non-fatigued (State 1).
The performance of this hybrid model, evaluated for each posture, is presented in
Table 7. The performance of the hybrid model demonstrates a significant advancement over the single-paradigm models. It achieves not only high but also remarkably consistent performance across all three distinct postural conditions. The model’s overall accuracy is clustered in a narrow and stable range, from 82.13% for standing to a peak of 82.66% for stooping. This indicates a strong capability to generalize its predictive power regardless of the specific biomechanical demands, a marked improvement over the posture-specific efficacy observed in the previous models.
A more granular, posture-by-posture analysis reveals the nuances of the model’s superior behavior.
For the Standing Posture: The model achieved an accuracy of 82.13% with a fatigue F1-score of 0.7772. A deeper dive into the constituent metrics for the fatigue class shows a precision of 0.7342 and a recall of 0.8257. This disparity, with recall significantly exceeding precision, indicates that the model is highly sensitive in detecting true instances of fatigue, a crucial attribute for ergonomic applications.
For the Stooping Posture: In this more demanding posture, the model yielded its highest accuracy of 82.66%. The fatigue F1-score was 0.7688, derived from a precision of 0.7154 and the highest recall value observed across all tests at 0.8309. The precision for the non-fatigued class was also exceptionally high at 0.9017, signifying that when the model predicts a non-fatigued state during stooping, it does so with very high confidence.
For the Kneeling Posture: The model maintained its robust performance with an accuracy of 82.38% and a fatigue F1-score of 0.7675. The precision–recall profile for the fatigue class (0.7249 and 0.8154, respectively) mirrored that of the other postures, again prioritizing the correct identification of fatigued states over precision.
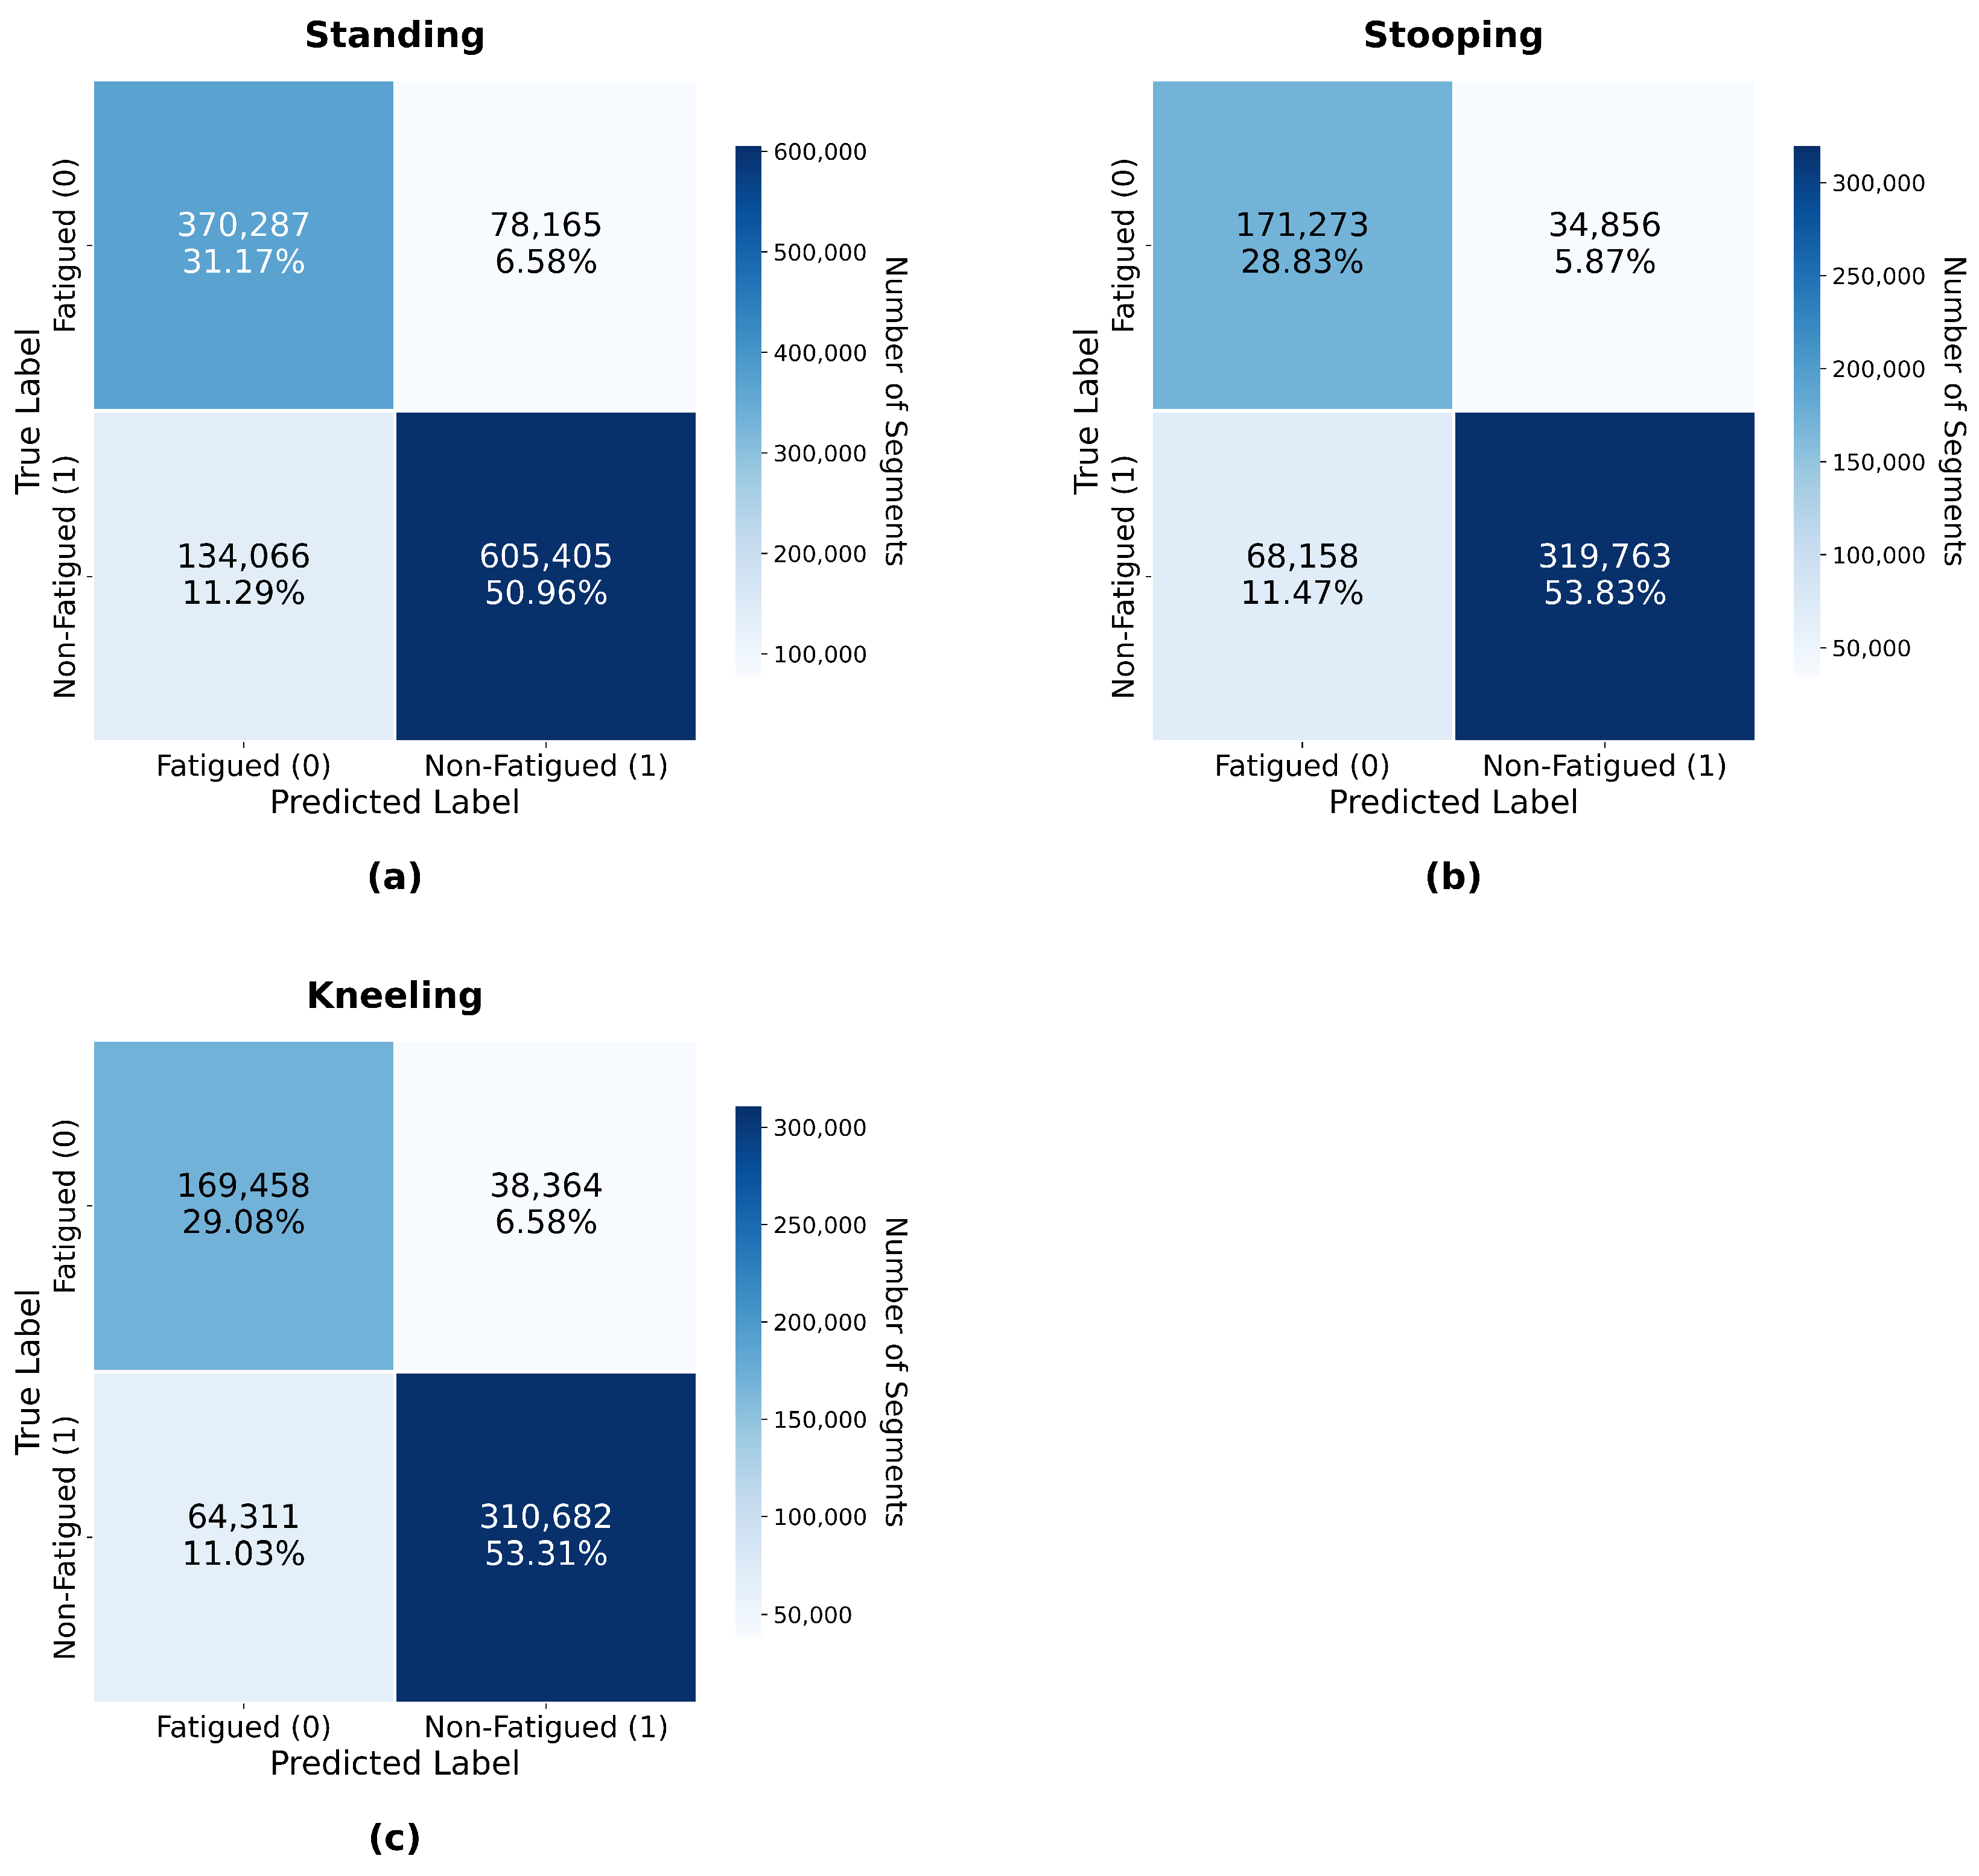
To visually deconstruct these numerical results, the corresponding confusion matrices are presented in
Figure 13. The confusion matrices offer a granular view of the hybrid model’s classification behavior and visually confirm a critical performance characteristic. Across all three postures, the model demonstrates exceptionally high sensitivity (recall) for the fatigue class. For instance, in the standing posture (a), the model correctly identified 370,287 fatigued segments (TPs) while misclassifying only 78,165 (FNs). This pattern, where TPs for fatigue substantially outnumber FNs, holds for both stooping (b) and kneeling (c).
This performance profile is highly desirable for an ergonomic monitoring system. The high recall signifies a low false negative rate, meaning the model is adept at correctly identifying true instances of fatigue, thus minimizing the risk of overlooking a worker’s fatigued state, the most critical error to avoid in a safety context. The trade-off for this high sensitivity is a slightly lower precision, evidenced by the number of FP (e.g., 134,066 for standing). This indicates the model may occasionally flag a non-fatigued state as fatigued. However, this is a far more acceptable error from a safety perspective than missing an actual case of fatigue.
In conclusion, and in direct answer to Research Question 3, this two-stage hybrid approach, by leveraging deep learning for feature representation and XGBoost for classification, has successfully created a robust model that not only performs with high accuracy but is also optimized for the most crucial requirement of an ergonomic tool: minimizing missed detections of fatigue. It clearly outperforms the standalone models evaluated previously.
4. Discussion
The preceding chapter detailed the results of a multi-faceted investigation into predicting muscle fatigue among novice roofers using wearable sensor technology and machine learning. This chapter provides an interpretation of these findings, contextualizing the performance of sEMG-based and hybrid modeling approaches within the existing literature and the specific demands of roofing tasks. The significance of the findings, methodological considerations, limitations of the study, and directions for future research are critically examined.
4.1. Recapitulation of Principal Findings
The comprehensive analysis of sEMG data yielded several key findings pertinent to the detection and assessment of muscle fatigue during simulated roofing tasks.
Firstly, the study established a robust two-stage sEMG labeling methodology, adapting the WM trend analysis and incorporating physiological markers to define ‘fatigue’ and ‘non-fatigue’ states, with ‘uncertain’ segments being conservatively excluded to ensure high-confidence ground-truth labels for model training.
Secondly, an initial baseline assessment revealed that models trained directly on raw sEMG data exhibited modest predictive performance across the standing, stooping, and kneeling postures (e.g., LSTM F1-scores ranging from approximately 59% to 67%). This underscored the necessity for subsequent feature engineering to enhance discriminability.
Thirdly, the analysis of engineered sEMG features identified MDF, MNF, RMS, Skew, VCF, PSR, and Sample Entropy as statistically significant and consistent indicators of fatigue. Frequency-domain features (MDF and MNF) showed the highest consistency (significant in 88% of datasets on average) in differentiating fatigue states across postures, aligning with known physiological responses to fatigue.
Fourthly, the performance of feature-based sEMG models in terms of overall test accuracy varied by posture. For the standing posture, the CNN LSTM Attention model achieved the highest accuracy (approximately 78.3%). In the stooping posture, the XGBoost model demonstrated the highest accuracy, reaching approximately 78.1%. These results highlighted that no single sEMG-only model universally achieved the highest accuracy across all specific tasks.
Fifthly, to explore the potential benefits of combining raw signal information with engineered features from sEMG, an advanced hybrid sEMG model was developed. This model utilized a Transformer–LSTM architecture to process both raw sEMG segments and the corresponding engineered sEMG features, with the extracted deep features then classified by an XGBoost classifier. This hybrid sEMG approach demonstrated strong and consistent performance across all three postures, achieving accuracies of approximately 82.1% for standing, 82.7% for stooping, and 82.4% for kneeling. The fatigue F1-scores were also robust, around 0.77–0.78 for all postures.
4.2. Discussion of sEMG-Based Fatigue Detection
This section critically evaluates the findings related to sEMG-based fatigue detection. It begins by interpreting the physiological significance of the observed feature behaviors, grounding them in established myoelectric principles. It then transitions to a comparative analysis of the machine learning model performances.
4.2.1. Significance and Physiological Interpretation of sEMG Feature Behavior
A foundational step in this research was to validate that the engineered sEMG features are physiologically meaningful indicators of muscle fatigue. The results presented in
Section 3.3 confirm this unequivocally. The frequency-domain features, MDF and MNF, proved to be the most consistent indicators of fatigue. The characteristic downward trend of both MDF and MNF with developing fatigue is a classic hallmark of peripheral muscle fatigue and directly corroborates literature. This spectral compression is primarily attributed to a decrease in muscle fiber conduction velocity (MFCV) as metabolic byproducts accumulate and impair the efficiency of the sodium–potassium (Na+/K+) pump [
15,
27]. The high consistency of this finding across the varied biomechanical demands of standing, stooping, and kneeling validates the study’s labeling methodology and underscores the fundamental nature of this myoelectric signature of fatigue.
The time-domain feature RMS, which quantifies the amplitude or power of the sEMG signal, was also a powerful differentiator and exhibited a clear, marked increase with the onset of fatigue. This phenomenon reflects an augmented neural drive from the central nervous system. As individual muscle fibers begin to fatigue, the nervous system attempts to compensate by recruiting additional, often larger, motor units and/or by increasing the firing rate of already active units [
28]. Finally, the nonlinear feature Sample Entropy (SampEn) also proved to be a strong indicator, showing a distinct decrease as fatigue progressed. A lower SampEn value indicates a loss of signal complexity and an increase in its regularity, which is consistent with literature suggesting that the nervous system may adopt a more synchronized firing pattern across motor units as a mechanism to maintain force output under duress [
29].
4.2.2. Methodological Framework for Feature Selection
The answer to Research Question 1 rests on a methodological framework that warrants discussion. The process involved applying the Kruskal-Wallis H-test to features derived from overlapping time-series windows. While the use of overlapping windows is a standard practice in biosignal processing that increases dataset density and enhances feature stability [
30], it introduces autocorrelation that violates the independence assumption of the test for formal inference. However, in this study, the test was not used for formal inference but was instead repurposed as a computationally efficient, non-parametric heuristic to score and rank features based on their class separability. This reframing of a statistical test as a feature ranking tool is a well-precedented, cross-disciplinary practice [
24]. Therefore, the findings regarding feature importance are based on a sound engineering approach, where the statistical test was used as an exploratory tool and its findings were corroborated by a model-based feature importance analysis.
4.2.3. Performance of sEMG Machine Learning Models
The evaluation of various machine learning models revealed nuanced performance differences that depend heavily on the nature of the task. For posture-specific tasks, which represent a more constrained and homogeneous feature space, different models excelled under different conditions. Notably, for the highly demanding stooping posture, the XGBoost model achieved the highest accuracy (78.1%). XGBoost, a powerful tree-based gradient boosting ensemble, is exceptionally effective at discovering complex, non-linear decision boundaries within well-defined, structured feature sets like those derived from a single, consistent posture [
31]. A particularly insightful, albeit counterintuitive, finding was the consistent underperformance of the Transformer model. This result provides a crucial lesson on the practical application of different deep learning architectures. Transformers, while state of the art in fields like natural language processing, are notoriously data-hungry and lack the strong inductive biases for the locality and sequentiality that are inherent to CNNs and RNNs, respectively [
32]. The superior performance of the CNN-LSTM model strongly suggests that for this type of physiological data and at this data scale, architectures with built-in spatial and temporal priors are more effective.
Finally, the study explored an advanced hybrid sEMG model that used a Transformer–LSTM network as a sophisticated feature extractor, with an XGBoost classifier making the final prediction. This two-stage pipeline delivered the highest and most consistent accuracies in the posture-specific contexts, achieving over 82% accuracy for standing, stooping, and kneeling. This approach successfully leverages the strengths of both paradigms: deep learning’s ability to learn rich, latent representations from both raw and engineered data, and gradient boosting’s exceptional power in classifying structured data. The success of the high-performance hybrid machine learning model is particularly noteworthy, confirming its potential as the core of a predictive analytics engine.
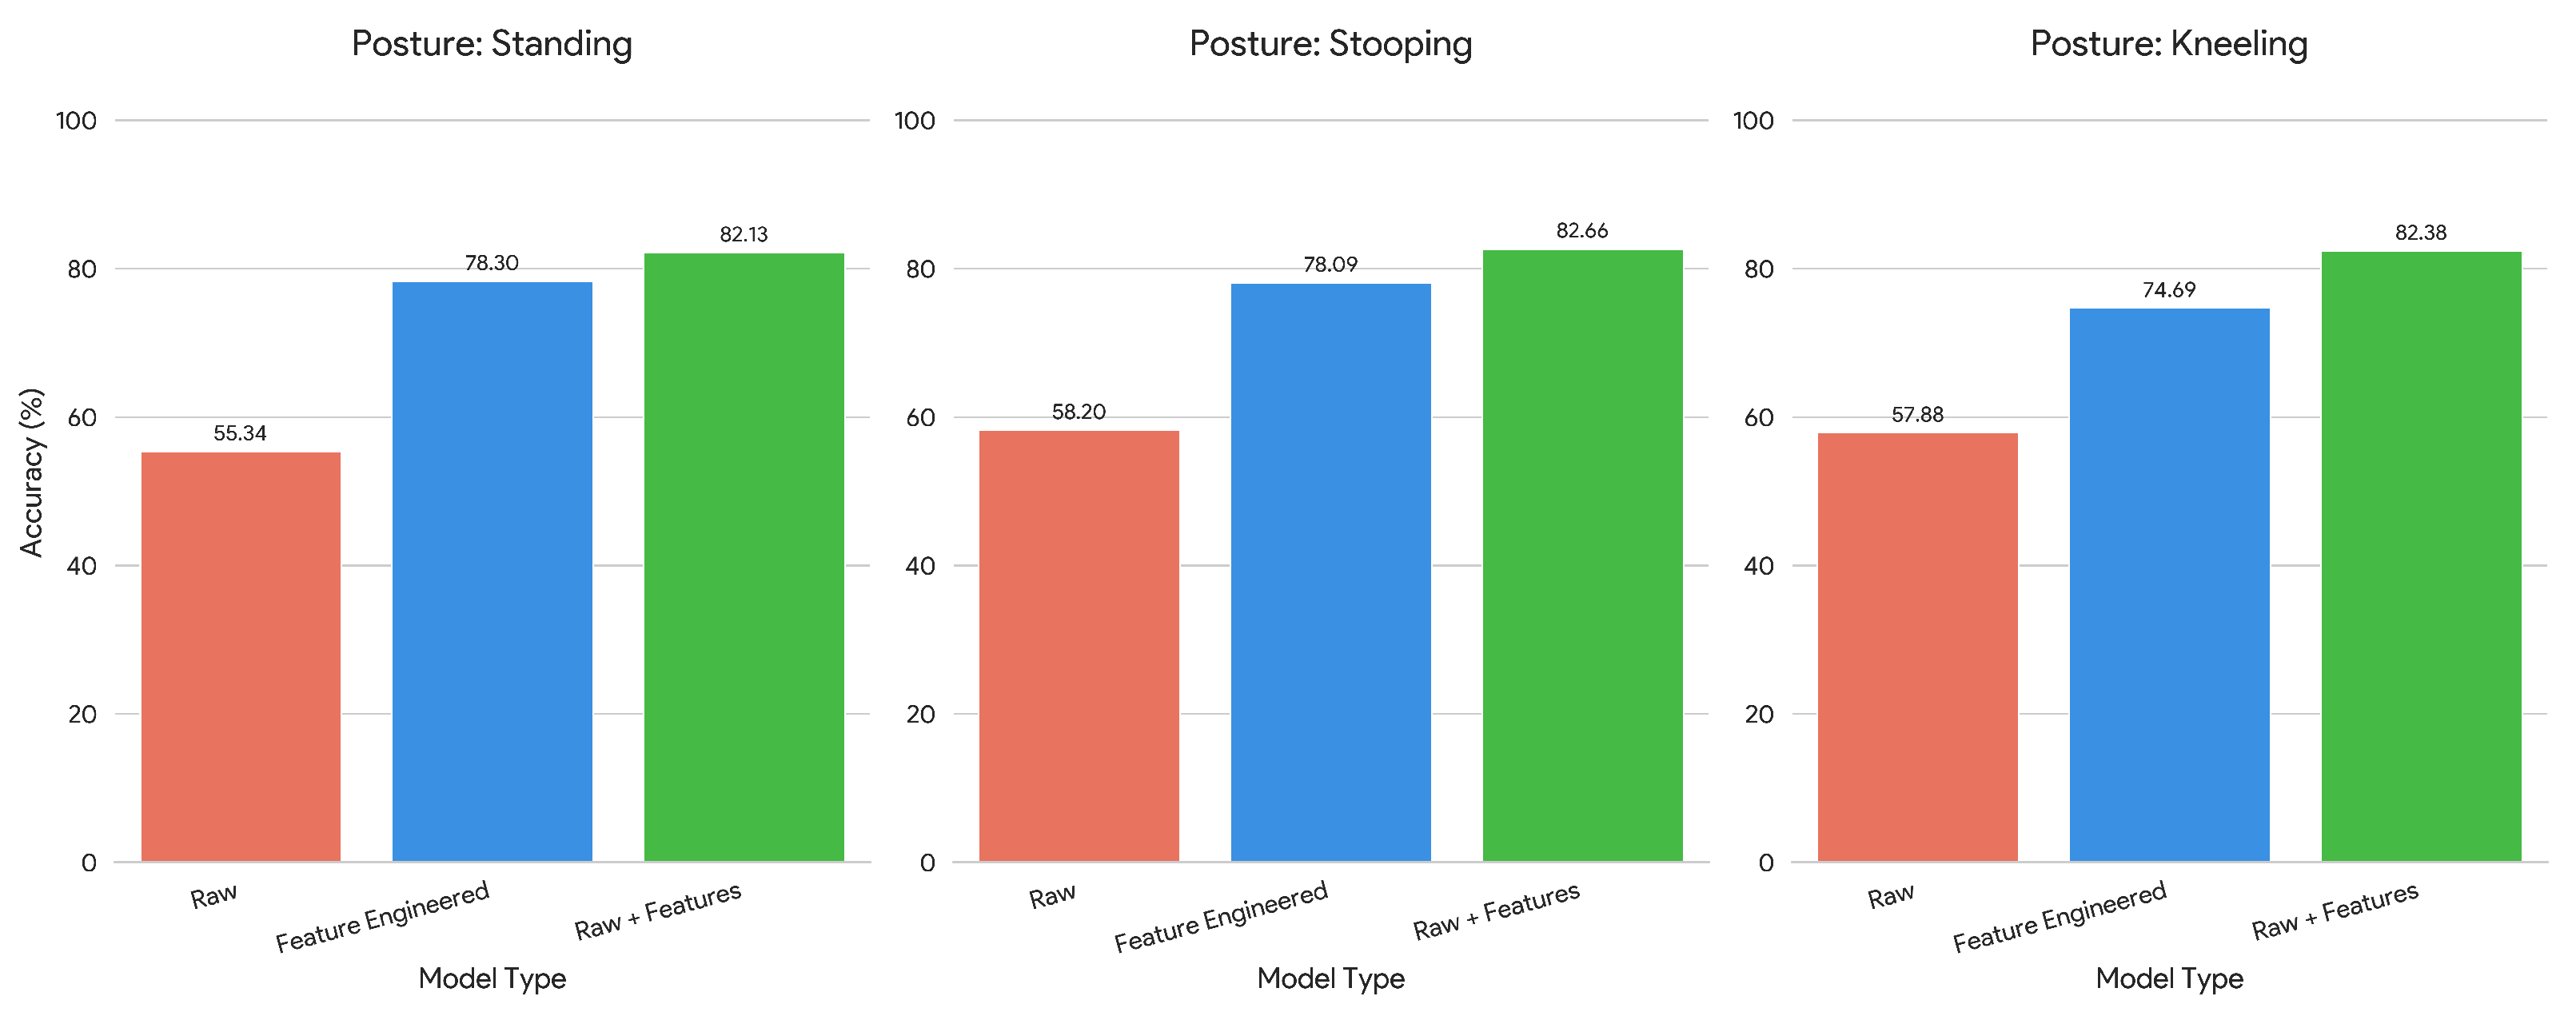
This architecture’s superiority, as demonstrated in
Figure 14, is attributable to this synergistic design, which allows it to consistently outperform standalone ensemble learning and deep learning alternatives across all postures. The ablation study (
Section 4.2.4) further confirmed that each of these components is a critical contributor to the model’s high performance.
The figure illustrates the value of methodological progression. For every posture, standing, stooping, and kneeling, there is a distinct, stepwise improvement in accuracy. The baseline models using only raw data show modest performance, with accuracy ranging from 55.3% to 58.2%. The introduction of feature engineering provides a substantial boost, with the best feature-based models achieving accuracies between 74.7% and 78.3%. Finally, the advanced hybrid model, which integrates raw + features, demonstrates clear superiority, pushing the accuracy to over 82% for all three postures. This visual evidence provides a compelling answer to the research questions, confirming the necessity of feature engineering and the superior performance of advanced hybrid architecture.
4.2.4. Ablation Study of the Hybrid Architecture
To validate the design of the hybrid architecture, an ablation study was conducted to quantify the contribution of its individual components. The full Transformer–LSTM–XGBoost model served as the performance baseline. Three ablated versions were then evaluated.
With the transformer path removed;
With the LSTM path removed;
With the final XGBoost classifier replaced by standard softmax layer.
The results for the kneeling posture are presented in
Table 8. The results confirm that each component provides a critical contribution to the model’s performance. The removal of the LSTM path, which processes the engineered features resulted in a catastrophic drop in F1 score. Similarly, removing either Transformer path or the XGBoost led to significant degradation in both accuracy and F1 score. This ablation study validates that performance of the hybrid model is because of the synergy between all of its components.
4.3. Considerations for Real-Time Implementation and Deployment
The practical implementation of the proposed framework requires acknowledging both its reasoning delay and deployment hardware. The methodology’s 2.5 s data acquisition window represents the minimum fixed latency. An analysis of the subsequent computational delay (end-to-end computational time that includes signal processing, seven selected feature calculations, deep feature extraction using LSTM and Transformer models, and final classification) was performed on a laptop (AMD Ryzen 9 CPU, NVIDIA RTX 4060 GPU, 16 GB RAM, and SSD with ∼3500 MBps read and write speed). The timing of each cross-validation fold was calculated as an average computational time of 100 iterations within that fold.
The results yielded an average end-to-end average inference time of ms with a standard deviation of (ranging from ms to ms) for all computational steps following data acquisition. When this computational delay is added to the 2.5 s acquisition delay, the total inference time from data capture to classification is approximately 3.4 s, which is feasible for a near-real-time monitoring system. For deployment, the study used an offline method to train and test the models. The intended future implementation involves wearable sensors streaming data to a local PC for processing.
4.4. Methodological Considerations and Limitations
Although this study provides valuable information on the application of wearable technology for fatigue detection, its findings must be interpreted within the context of several methodological limitations. The study was conducted in a controlled laboratory environment, which, while necessary for ensuring data quality and participant safety, does not fully replicate the complexities of a real-world roofing worksite. Factors such as environmental stressors like extreme heat and sun exposure, variable surface conditions, and the psychological stress associated with working at significant heights were not incorporated. Moreover, the scope of the physical tasks was limited to three specific quasi-static postures. Actual roofing involves a much wider range of dynamic movements, including carrying materials and using tools, so the findings from these sustained postures may not be directly generalizable to the more variable physical demands encountered in the field. The participant cohort consisted exclusively of novice individuals. Although this was a deliberate choice to ensure a homogeneous sample and establish a critical physiological baseline for this foundational proof-of-concept study, it is also a limitation. Experienced roofers are likely to exhibit more efficient motor patterns and different fatigue signatures developed through long-term adaptation. Consequently, the models developed here are not yet validated for a professional workforce and their real-world generalization is limited until they are validated with professional roofers. This underscores the importance of the next planned phase of this research with professional roofers, which is stated in our future directions. Finally, the sample size, while adequate for this exploratory investigation, is relatively small for the development of highly generalized deep learning models. Architectures like the Transformer and LSTM are known to be data-hungry, and their performance can be constrained by limited datasets.
5. Conclusions and Future Directions
This study presents a data-driven framework for classifying muscle fatigue in simulated roofing tasks using sEMG data and advanced machine learning. A dual-analysis approach identified a core set of effective features spanning spectral, amplitude, and complexity domains, confirming the necessity of feature engineering over raw signal analysis. Model evaluation showed that performance depends on task-specific biomechanical demands, with different algorithms excelling in different postures.
An advanced hybrid model, combining a Transformer–LSTM for deep feature extraction with an XGBoost classifier, consistently outperformed all alternatives. Supported by a stringent cross-validation protocol, the findings establish a subject-independent, high-performance fatigue classification approach. This work sets a new benchmark for ergonomic monitoring systems and offers a clear pathway toward practical, real-world deployment.
Future Directions
Building on this validated framework and acknowledging its limitations, several key avenues emerge for translating this research into a practical, real-world ergonomic monitoring system. The next step is to move from the laboratory to the field for field validation with professional roofers. In parallel with this, and as a direct extension of this study’s findings, research will focus on a comparative analysis of novice and professional workers. This will quantify the effects of long-term adaptation on sEMG fatigue signatures and will be essential for developing models accurate for experienced workforce. Future work will aim to build a more holistic model of worker fatigue by integrating additional physiological data streams, such as heart rate variability (HRV), to assess autonomic nervous system response.
