Abstract
The green renovation of existing residential buildings is a key way for the construction industry to achieve sustainable development and the dual carbon goals of China, which makes it urgent to make collaborative decisions among multiple stakeholders. However, because of divergent interests and risk perceptions among governments, energy service companies (ESCOs), and owners, the implementation of green renovation is hindered by numerous obstacles. In this study, we integrated prospect theory and evolutionary game theory by incorporating core prospect-theory parameters such as loss aversion and perceived value sensitivity, and developed a psychologically informed tripartite evolutionary game model. The objective was to provide a theoretical foundation and analytical framework for collaborative governance among stakeholders. Numerical simulations were conducted to validate the model’s effectiveness and explore how government regulation intensity, subsidy policies, market competition, and individual psychological factors influence the system’s evolutionary dynamics. The findings indicate that (1) government regulation and subsidy policies play central guiding roles in the early stages of green renovation, but the effectiveness has clear limitations; (2) ESCOs are most sensitive to policy incentives and market competition, and moderately increasing their risk costs can effectively deter opportunistic behavior associated with low-quality renovation; (3) owners’ willingness to participate is primarily influenced by expected returns and perceived renovation risks, while economic incentives alone have limited impact; and (4) the evolutionary outcomes are highly sensitive to parameters from prospect theory, The system’s evolutionary outcomes are highly sensitive to prospect theory parameters. High levels of loss aversion (λ) and loss sensitivity (β) tend to drive the system into a suboptimal equilibrium characterized by insufficient demand, while high gain sensitivity (α) serves as a key driving force for the system’s evolution toward the ideal equilibrium. This study offers theoretical support for optimizing green renovation policies for existing residential buildings in China and provides practical recommendations for improving market competition mechanisms, thereby promoting the healthy development of the green renovation market.
1. Introduction
With the rapid advancement of urbanization in China, the proportion of carbon emissions attributable to existing residential buildings has risen significantly in the building sector. Energy consumption in Chinese residential buildings increased continuously between 2001 and 2015, leading to a substantial rise in operational-phase carbon emissions [1]. The building sector as a whole contributes approximately 40% of the nation’s total carbon emissions [2,3,4], with existing residential buildings accounting for around 59% of these operational emissions [5]. In 2022, the total floor area of existing buildings in China reached 69.6 billion square meters, of which residential buildings comprised as much as 77.87%. Against the backdrop of tightened real estate regulatory policies and a stabilizing trend in new housing prices, real estate developers have become increasingly cautious about investing in new construction projects. Meanwhile, there is a growing demand among owners of existing residential buildings for improved living conditions. As a result, promoting the green renovation of existing residential buildings has emerged as a key pathway for enabling low-carbon transformation and sustainable development in the building sector [6,7,8], offering valuable insights from the Chinese context for green renovation practices in existing buildings worldwide.
To promote the green development of existing buildings, China’s Ministry of Housing and Urban–Rural Development issued the “Notice on Further Improving the Preservation, Utilization, and Renovation of Urban Existing Buildings”, which explicitly calls for upgrading existing buildings in accordance with green and energy-saving standards to enhance their functionality and make them more comfortable, and energy-efficient. Despite growing policy support, the green renovation market continues to face numerous challenges, particularly in the domain of existing residential buildings, where progress remains limited [9,10]. Key obstacles include underdeveloped regulatory mechanisms, inconsistent service capabilities among ESCOs, and owners’ lack of willingness to participate [11]. Therefore, determining how to effectively promote the collaborative participation of governments, enterprises, and owners has become a critical issue for the efficient implementation of green renovation in existing residential buildings, warranting in-depth research and practical exploration.
Green renovation typically refers to upgrading the energy efficiency and environmental performance of a building’s construction methods, structural systems, and mechanical facilities while preserving its primary structural framework, rather than demolishing and rebuilding the entire structure [12]. Compared to new construction projects, green renovation offers advantages such as lower investment costs, shorter construction periods, reduced resource consumption, and significant environmental benefits. Studies have shown that green renovation can reduce buildings’ energy consumption by 30% to 40% [13], thereby substantially enhancing their environmental sustainability [14].
Extensive research has been conducted on the green renovation of various types of existing buildings. Because of their high energy consumption, large public buildings have become a primary focus, with studies mainly addressing improvements in energy efficiency, optimization of operational management, and evaluations of policy effectiveness. Liang et al. (2019) proposed a multi-objective optimization decision support system aimed at balancing lifecycle cost, energy reduction, and environmental impact in renovation processes, providing a scientific basis for complex decision-making [15]. Papadakis et al. (2023) examined the dynamics of energy efficiency in non-residential public buildings, exploring the economic drivers of retrofit decisions and the intricate relationships between advanced technological solutions, building operators, and user behavior [16]. In the context of commercial buildings, research on green renovation has primarily focused on economic drivers and market feedback. Through an empirical study of LEED- and Energy Star-certified buildings in the United States, Fuerst et al. (2011) found significant rental and sales price premiums for green-certified properties, indicating that environmental certification positively impacts commercial real estate value [17]. Similarly, based on empirical research on commercial office buildings in Toronto, Canada, Carlson et al. found that green renovation of existing commercial buildings can reduce operational costs, improve occupancy rates, and thus increase net operating income. These findings demonstrate the strong economic enabled by green renovation in commercial buildings, enhancing tenant recognition and incentivizing owner investment [18].
In contrast, research on the green renovation of existing residential buildings has developed at a relatively slower pace. In recent years, particularly in China, increasing academic attention has been directed toward identifying key factors that influence the implementation of renovation, covering economic, technical, social, and policy dimensions. Lai et al. (2022), through a survey of urban and rural residents in China, found that housing conditions and renovation subsidies significantly affect residents’ willingness to renovate [11]. He et al. (2019) conducted questionnaire-based research and revealed that policy factors, individual behavior, subjective norms, and perceived behavioral control significantly influence residents’ intentions toward green renovation, providing targeted pathways for promoting the renovation of existing residential buildings [19].
Although substantial studies have been conducted on this topic, some research gaps are still remaining. First, the existing research has primarily focused on external factors such as government subsidies and penalties, with limited attention paid to internal market mechanisms. While many studies have confirmed that external governmental interventions are crucial for guiding market development, they often overlook the role of market competition as an endogenous force influencing the behavior of ESCOs. In practice, ESCOs are affected not only by policy incentives but also by the competitive pressure of being replaced because of low-quality renovation performance. Second, current studies on stakeholder behavior in the green renovation of existing buildings predominantly employ traditional evolutionary game theory, in which the payoff matrices are typically constructed based on objective returns. The influence of psychological factors (e.g., strong loss aversion and risk perception) decision-making under uncertainty have not been fully considered on.
The main contributions include the following: (1) This study reveals the dynamic evolutionary mechanisms and key pathways of multi-stakeholder collaborative governance in residential green renovation. Focusing on existing residential buildings, a critical sector in green renovation, this study moves beyond static identification of influencing factors and systematically uncovers the dynamic strategic interactions among governments, ESCOs, and owners. The research clarifies the conditions under which the evolutionary game system converges toward an ideal equilibrium characterized by active regulation, high-quality renovation, and active participation. It also identifies the mechanisms through which endogenous factors such as market competition influence stakeholder decision-making, thereby providing a concrete theoretical foundation for the dynamic optimization of policy tools, the construction of market-oriented governance mechanisms, and the resolution of owner participation bottlenecks. (2) We constructed and validated an innovative analytical framework that incorporates psychological dimensions, offering a new theoretical perspective for understanding current renovation challenges. By integrating prospect theory with evolutionary game theory in the context of green renovation for existing residential buildings, we developed a dynamic model capable of quantifying psychological perception factors. This model transcends the conventional assumption of fully rational agents in traditional game models and more accurately captures the boundedly rational decision-making preferences of stakeholders when faced with potential gains and losses. It not only identifies the presence of psychological factors but also reveals the pathway mechanisms through which these factors influence the evolution and equilibrium outcomes of the game, providing a theoretical explanation for the market failure phenomenon reflected in the impeded promotion of real-world green renovation projects.
The remainder of this article is structured as follows. Section 2 presents the literature review. Section 3 details the construction of the tripartite game model. Section 4 presents the results of an equilibrium analysis and explores the dynamic evolutionary mechanisms. Section 5 provides the results of numerical simulations. Section 6 discusses our research findings. Section 7 provides our conclusions and offers practical implications.
2. Literature Review
2.1. Evolutionary Game Theory
Evolutionary game theory, first proposed by Maynard Smith and Price in 1973, differs from classical game theory in its interpretation of Nash equilibria. In classical game theory, a Nash equilibrium represents a strategy profile where each player’s strategy is the best response to those of others [20]. In contrast, evolutionary game theory views Nash equilibria as the result of repeated interactions over time, requiring a dynamic adjustment process. The core concept of evolutionary game theory is the Evolutionarily Stable Strategy (ESS), which refers to a strategy that, once adopted by the majority within a population under specific structural and interaction rules, cannot be replaced by alternative strategies.
During the course of a game, ESS emerges through a process of trial and error driven by individual choices. The underlying mechanism typically manifests as an imitation dynamic, where strategies yielding higher payoffs attract more adopters. This indicates that participants do not remain static in their strategy choices [21]. This imitation-based learning paradigm aligns well with the behavioral characteristics of stakeholders involved in green renovation. Simulation analyses of evolutionary game models are typically conducted through computational numerical experiments [22]. Simple graphical methods can be employed to visualize how participants’ strategic choices change under the influence of different factors [23].
In the green renovation of existing residential buildings, the government, ESCOs, and owners represent three distinct stakeholder groups whose differences in interests, risk perceptions, and goal preferences create a complex dynamic game system. The decisions of each party are interdependent and mutually constrained, with strategy choices continuously adjusted in response to the behaviors of others. Given that the core strength of evolutionary game theory lies in analyzing how boundedly rational players adapt and evolve their strategies through long-term interaction and learning, it offers an effective analytical framework for examining issues of cooperation and conflict among multiple stakeholders. As a result, it has been widely applied in studies on the green renovation of existing buildings. For instance, Feng et al. (2020) developed evolutionary game models of dealings between developers and homebuyers, as well as between governments and construction entities [24]. Their findings revealed that government incentives can effectively promote developers’ adoption of green building strategies, while regulatory oversight plays a crucial role in the renovation process. Similarly, Yang et al. (2023) constructed a tripartite evolutionary game model involving the government, private investors, and residents in PPP projects for the green renovation of traditional apartment complexes [25]. Their analysis showed that government regulation, public awareness campaigns, and proactive behavior by private capital can significantly enhance residents’ willingness to participate.
Based on these insights, we adopted an evolutionary game model to investigate the strategy selection behaviors of the key actors involved in the green renovation of existing residential buildings.
2.2. Prospect Theory
Prospect theory was first introduced by Daniel Kahneman and Amos Tversky in 1979 to explain human decision-making behavior under conditions of uncertainty. Its core premise challenges traditional expected utility theory, particularly the assumption that the agents are fully rational. Prospect theory posits that individuals exhibit systematic biases when facing risk and uncertainty, primarily reflected in psychological mechanisms such as loss aversion, reference dependence, and nonlinear probability weighting [26]. The prospect theory model consists of two phases: editing and evaluation. In the editing phase, decision-makers simplify and organize available choices, often framing them in terms of “gains” or “losses.” In the evaluation phase, outcomes are not assessed based on their objective probabilities but rather through a nonlinear probability weighting function that reflects subjective judgment. According to prospect theory, individuals experience a stronger negative emotional response to losses than the positive impact of gains of the same magnitude [27]. The strength of prospect theory lies in its consideration of psychological perception, allowing it to more accurately reflect actual human behavior. It effectively explains various forms of bounded rationality observed in contexts such as consumer choice, policy preference, and risk aversion. As a result, it has been widely applied across multiple disciplines, including behavioral economics, management science, and energy decision-making [28].
Compared with traditional evolutionary game theory, prospect theory places greater emphasis on individuals’ subjective perceptions and psychological evaluations of gains and losses, building upon the foundation of bounded rationality. It highlights the asymmetry in how decision-makers evaluate gains versus losses. This theoretical perspective challenges the conventional assumptions of objectivity in payoff matrices and fully rational behavior in classical game models, allowing for a more realistic representation of the complexity and irrationality often observed in actual decision-making processes [29,30,31,32,33]. Green renovation of existing residential buildings, as a complex and multi-stakeholder undertaking, is characterized by long renovation cycles, delayed returns on investment, and uneven levels of participation. Participants are often influenced by information asymmetry, loss aversion, and uncertainty regarding future benefits, which results in notable psychological perception biases and behavioral heterogeneity. Incorporating prospect theory into an evolutionary game framework enables a more accurate depiction of how subjective perceptions shape strategic choices among the three key stakeholders involved in green renovation. It reveals their behavioral tendencies and evolutionary patterns, thereby offering a more realistic explanation for deviations from the predictions of traditional expected utility theory. This approach provides stronger theoretical support and more practical policy guidance for advancing the green renovation of existing residential buildings.
2.3. Application of Stakeholder Theory in Green Renovation
Green renovation projects typically involve multiple types of stakeholders whose interests, behavioral preferences, and interactions play a decisive role in determining renovation outcomes. As a result, stakeholder theory has been widely adopted in this field to identify and analyze the key actors, their interrelationships, and behavioral mechanisms throughout the renovation process [34].
In existing studies, stakeholders in green renovation are commonly categorized into groups such as government entities, project implementers (ESCOs), building owners, end users, and financial institutions. These stakeholders differ significantly in their roles and objectives. For example, the government, as a policymaker and regulator, influences the participation of other stakeholders through tools such as fiscal subsidies, tax incentives, and energy efficiency standards [35]. ESCOs are primarily responsible for technical implementation and energy performance delivery, yet their willingness to invest is shaped by factors such as cost recovery periods, contract uncertainties, and the complexity of coordinating with residents [36]. Meanwhile, owners and users of existing buildings act as the ultimate decision-makers, and their energy-saving awareness, willingness to pay, and expectations regarding renovation outcomes constitute the core driving forces behind their willingness to participate [37].
To enhance renovation efficiency and improve multi-stakeholder coordination, some studies have examined the interaction mechanisms among stakeholders to explore the conditions under which various governance structures and cooperation models are applicable. For example, Martiskainen and Kivimaa (2018) investigated the roles of innovation intermediaries and champions in promoting zero-carbon residential development [38]. They found that in the absence of effective intermediation, other stakeholders often assume advocacy roles to advance the project. This finding highlights the importance of multi-party collaboration in facilitating green transitions within the residential sector. Tharindu (2022) further revealed that differing interests and varying risk-bearing capacities among stakeholders increase the complexity of planning energy performance contracts (EPCs) in building renovations [39]. This suggests that effective EPC planning must incorporate mechanisms for aligning stakeholder interests and ensuring a fair distribution of risks and benefits.
However, existing literature on the green renovation of existing residential buildings often overlooks the heterogeneity in risk perception and psychological preferences among stakeholders such as governments, ESCOs, and owners during strategic interactions. There are also limitations in understanding how these stakeholders dynamically adjust their strategies in response to environmental changes throughout the evolutionary process. In addition, traditional game-theoretic models generally rely on the assumption of full rationality, which makes them insufficient for explaining the influence of irrational behaviors on green renovation decisions. Consequently, this study integrates prospect theory with evolutionary game theory by incorporating psychological perception factors, thereby providing a systematic depiction of the dynamic game processes among key stakeholders.
3. Tripartite Evolutionary Game Model
3.1. Model Description
The development of the green renovation market for residential buildings involves three primary stakeholders: the government, energy service companies (hereafter referred to as “ESCOs”), and owners of residential buildings (hereafter referred to as “owners”). Within this market, the government primarily serves as a guiding and supervisory entity. By regulating and subsidizing both ESCOs and owners, the government aims to standardize and promote the green renovation process while achieving environmental benefits. The government’s level of regulatory engagement is influenced by the cost of supervision and the intensity of subsidies [9,40].
As the main suppliers in the green renovation market, ESCOs choose strategies aimed at maximizing their own profits and bear the majority of the risks throughout the renovation process. Given the current underdeveloped regulatory framework in the green renovation sector, ESCOs may attempt to increase their gains by exploiting information asymmetries with owners and engaging in speculative behaviors such as delivering low-quality renovations [41,42,43].
Owners constitute the demand side of the green renovation market. Their willingness to participate in green renovation directly affects the success of corresponding projects. Upon completion, owners benefit from a greener and more comfortable living environment. However, since green renovation typically takes a long time to implement, owners may experience a temporary decline in quality of life during the process and are also required to bear part of the renovation costs [44].
Accordingly, in this study, we applied evolutionary game theory to derive the equilibrium points of the tripartite game, analyze the stability of each local equilibrium, and explore the evolutionary conditions and processes under which the government engages in active regulation, ESCOs deliver high-quality renovation, and owners participate actively. Since green renovation projects for existing buildings are currently concentrated in first- and second-tier cities, the government in this study is defined as the municipal governments of those cities. Consistent with China’s classification of aging residential communities, this study focuses on owners of residential buildings constructed before the year 2000 as the research sample [45]. By incorporating psychological perception factors from prospect theory, this model provides a comprehensive analysis of the factors influencing the evolution of the system. Based on these assumptions, we provide a depiction of the tripartite relationship in Figure 1.
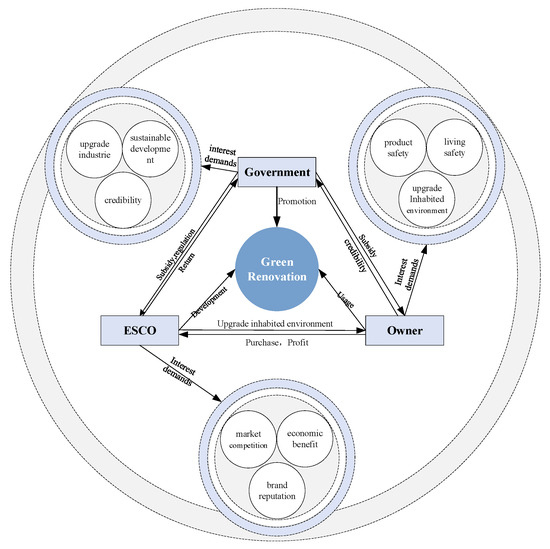
Figure 1.
Stakeholder demand analysis.
3.2. Basic Assumptions
Assumption 1.
The evolutionary game of green renovation in existing residential buildings involves three stakeholders: the government, ESCOs, and owners. The government chooses between {active regulation, passive regulation} with probabilities x and 1 − x, respectively. ESCOs choose between {high-quality renovation, low-quality renovation} with probabilities y and 1 − y, respectively. Owners choose between {active participation, passive participation} with probabilities z and 1 − z, respectively.
Assumption 2.
The government, ESCOs, and owners are all boundedly rational stakeholders who make strategic choices based on the value function and decision-weighting function defined by prospect theory. Psychological perception and behavioral evolution influence each other, and strategy adjustments result from updates in subjective cognition.
Let V represent the perceived value of gains and losses from the decision-maker’s perspective. According to prospect theory, the perceived value V is jointly determined by the value function and the probability weighting function , and can be expressed as follows:
Equation (1) indicates that the perceived value of a given strategy is equal to the sum of the perceived values of n possible outcomes, each weighted by its corresponding subjective probability. Specifically, Δxi = xi − x0, where xi is the i-th possible outcome of the event (i = 1, 2, …, n), and x0 is the reference point. Thus, Δxi represents the relative gain or loss of outcome i compared to the reference point. The value function v(Δxi) is defined as follows:
In Equation (2), Δxi ≥ 0 indicates a gain relative to the reference point x0, while Δxi < 0 indicates a loss. Parameters α and β reflect the degree of diminishing sensitivity in the value function for gains and losses, respectively. A larger value of either parameter implies a more steeply diminishing marginal effect. The parameter λ represents the degree of loss aversion in decision-making and is typically set such that λ > 1, indicating that decision-makers are more sensitive to losses than equivalent gains.
The specific form of the decision-weighting function π(pi) is expressed as follows:
In Equation (3), pi denotes the objective probability of occurrence for outcome i. The parameter σ serves as a curvature coefficient of the weighting function, reflecting the degree of distortion in probability perception. Typically, 0 < σ < 1.
In this study, we incorporate the value function and probability-weighting function from prospect theory to represent psychological factors in decision-making, capturing how subjective elements such as sensitivity to perceived value and the degree of loss aversion influence strategic behavior. The reference point was set as x0 = 0, allowing for the measurement of perceived value in response to objective gains and losses [3].
Assumption 3.
When the government adopts active regulation, the perceived benefit from enhanced credibility is expressed as V(Rg) = (Rg)α, and the perceived loss from the incurred regulatory cost is expressed as V(−C1) = −λ(C1)β. Under active regulation, the perceived loss associated with subsidies granted to ESCOs that conduct high-quality renovation is expressed as V(−Ie) = −λ(Ie)β, and the perceived loss from subsidies provided to owners who actively participate is expressed as V(−Ic) = −λ(Ic)β. If the government opts for passive regulation, the perceived loss due to a decline in public credibility is expressed as V(−W) = −λ(W)β, and the perceived loss from regulatory expenditure is expressed as V(−C2) = −λ(C2)β.
Assumption 4.
When the ESCO selects high-quality renovation, the perceived benefit is expressed as V(G) = Gα. If the ESCO opts for low-quality renovation, the additional perceived benefit is expressed as V(ΔG) = ΔGα. Given the presence of multiple ESCOs in the market, choosing low-quality renovation may lead to a perceived loss due to competitive substitution effects, expressed as V(−S) = −λ(θS)β, where θ represents the intensity coefficient of market competition. A higher value of θ indicates stronger substitution effects resulting from competition. When the government adopts active regulation, the perceived loss from penalties imposed on ESCOs conducting low-quality renovation is expressed as V(−D) = −λDβ. If the owner actively participates and the ESCO implements high-quality renovation, the perceived benefit of enhanced brand reputation for the ESCO is expressed as V(L) = Lα.
Assumption 5.
When the owner chooses active participation in the renovation, the perceived benefit is denoted as V(H1) = H1α. If the owner actively participates while the ESCO provides low-quality renovation, the resulting gap between expected and actual outcomes leads to a perceived loss expressed as V(−P) = −π(p0)λPβ, where π(p0) is the subjective probability assigned to the occurrence of the loss event p0. When the owner opts for passive participation, the perceived benefit is expressed as V(H2) = H2α.
Assumption 6.
Since the decision-weighting function is used to evaluate the subjective probability of uncertain gains and losses, we assume that the primary source of uncertainty in the green renovation of existing residential buildings lies in potential failure to meet the owner’s expectations. Therefore, the subjective probability assigned to the perceived loss V(−P) is −π(p0), while the decision weights for all other parameters are set to 1.
A summary of the value function forms and corresponding meanings of the key model parameters is presented in Table 1.

Table 1.
The main parameters of the model and what they indicate.
3.3. Payoff Matrix
Based on the above model assumptions and parameter settings derived from prospect theory, an evolutionary payoff matrix for the government, ESCO, and owners was constructed. This matrix integrates the payoff outcomes for each stakeholder under different combinations of strategies. The strategy sets for the government, ESCO, and owner are defined as {active regulation, passive regulation}, {high-quality renovation, low-quality renovation}, and {active participation, passive participation}, respectively. The details of the payoff matrix are presented in Table 2.

Table 2.
Payoff matrix for stakeholders.
4. Analysis of Equilibrium and Mechanisms of Dynamic Evolution
4.1. Strategy Stability Analysis
4.1.1. Stability Analysis Regarding Government Strategies
The perceived payoff for the government under active and passive regulation are denoted as Ug1 and Ug2, respectively. The expected average payoff is represented by and defined as follows:
The replicator dynamic equation for the government’s selection of a strategy is expressed as follows:
The derivative of F(x) with respect to x is given by the following:
Let
According to the stability theorem of differential equations, regarding the probability of the government choosing active regulation in order to remain in a stable state, the following conditions must be satisfied: F(x) = 0 and . Since , G(y, z) is a decreasing function with respect to y. Let G(y, z) = 0; then, we must obtain the critical value . At this point, ; in this case, the government is unable to determine a stable strategy. When y ≠ y*;, solving F(x) = 0 yields two equilibrium points, namely, x = 0 and x = 1. Consequently, a case-by-case analysis is necessary.
Proposition 1.
When y > y*, it follows that G(y, z) < 0, and thus , implying that x = 0 is the government’s evolutionarily stable strategy (ESS). In contrast, when y < y*, G(y, z) > 0, and , indicating that x = 1 serves as the government’s evolutionarily stable strategy.
At this point, the response function for the probability x that the government will choose active regulation expressed as follows:
Equation (10) indicates that when y > y*, the government adopts a strategy of passive regulation; when y = y*, the system exhibits uncertainty, and the government may waver between the two strategies without reaching a stable equilibrium; when y < y*, the government chooses active regulation. The threshold y* reflects the government’s psychological trade-off between regulatory cost and benefit—that is, when the government expects that ESCOs will generally and voluntarily opt for high-quality renovation, the marginal perceived benefit of active regulation becomes lower than its marginal perceived cost, prompting the government to retreat into a role of passive regulation in order to reduce fiscal and administrative burdens.
A phase diagram of the evolution of the government’s strategy is shown in Figure 2.
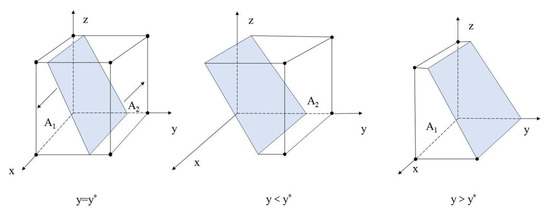
Figure 2.
Dynamic evolution of government policy options.
Proposition 1 indicates that in the initial stage of green renovation, when speculative behavior in the form of choosing low-quality renovation is common among ESCOs, the government invests additional resources and adopts active regulation to standardize market operations. As green renovation work progresses and a sound market order is established, ESCOs increasingly choose high-quality renovation. In this context, the government gradually reduces regulatory expenditures and adopts passive regulation, allowing the inherent vitality of the green renovation market to be fully realized.
Figure 2 shows that the probability of the government stably choosing active regulation corresponds to the volume of region A1, denoted as VA1, while the probability of stably choosing passive regulation corresponds to the volume of region A2, denoted as VA2. The calculations are as follows:
Proposition 2.
The probability that the government will choose active regulation is positively correlated with the perceived benefit from penalizing ESCOs engaged in low-quality renovation V(D), the perceived benefit from enhancing public credibility V(Rg), the perceived loss associated with the cost of passive regulation V(−C2), and the perceived loss resulting from a decline in public credibility V(−W). It is negatively correlated with the perceived loss from the cost of active regulation V(−C1), the perceived loss from subsidies given to owners V(−Ic), and the perceived loss from subsidies given to ESCOs V(−Ie).
Proof.
Based on the expression for the probability VA1 that the government will choose active regulation, the first-order partial derivatives with respect to each variable can be derived as follows:
Proposition 2 indicates that the partial derivatives of VA1 with respect to V(D), V(Rg), V(−C2), and V(−W) are positive, while the partial derivatives with respect to V(−C1), V(−Ic), and V(−Ie) are negative, implying that VA1 is positively correlated with V(D), V(Rg), V(−C2), and V(−W), and negatively correlated with V(−C1), V(−Ic), and V(−Ie). □
4.1.2. Stability Analysis Regarding ESCO Strategies
The expected payoff for ESCOs choosing high-quality renovation, Ue1; the expected payoff for choosing low-quality renovation, Ue2; and the average expected payoff, , are given as follows:
The replicator dynamic equation for the ESCO’s strategy selection is expressed as follows:
The derivative of F(y) with respect to y is expressed as follows:
Let
The stability of the ESCO’s high-quality renovation strategy requires the following conditions to be satisfied: F(y) = 0 and . Since , it follows that G(x, z) is an increasing function with respect to x. By setting G(x, z) = 0, we can obtain the critical value . At this point, , and the ESCO is unable to determine a stable strategy. When y ≠ y*, solving F(y) = 0 yields two equilibrium points, y = 0 and y = 1. Therefore, a case-by-case analysis is required.
Proposition 3.
When x > x*, it follows that G(x, z) > 0, and , indicating that y = 1 is the evolutionarily stable strategy (ESS) for the ESCO. Conversely, when x< x*, G(x, z)< 0, and , indicating that y = 0 constitutes the ESCO’s evolutionarily stable strategy.
The best response function for the probability y that the ESCO chooses high-quality renovation is expressed as follows:
Equation (19) indicates that when x < x*, the ESCO adopts a strategy of low-quality renovation; when x = x*, the system exhibits uncertainty, and the ESCO may oscillate between the two strategies without reaching a stable equilibrium; when x > x*, the ESCO chooses high-quality renovation. The threshold x* defines the minimum effective intensity of government intervention required to alter the ESCO’s expected behavior. When the probability of active regulation exceeds this critical point, the ESCO’s perceived punishment costs and market substitution risks (such as reputation loss, project loss) outweigh the short-term benefits of low-quality renovation, thereby shifting its strategy preference toward high-quality renovation.
A phase diagram of the evolution of the ESCO’s strategy is shown in Figure 3.
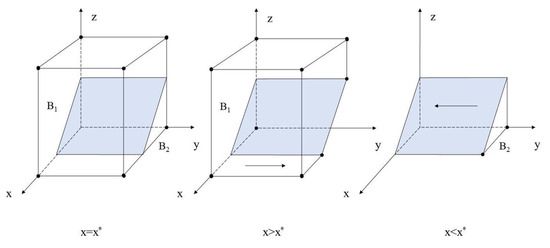
Figure 3.
Dynamic evolution of ESCO strategy choices.
Proposition 3 indicates that as the probability of the government choosing active regulation increases, the ESCO tends to stably choose high-quality renovation. Stronger government regulation helps to encourage ESCOs to adopt high-quality renovation. Conversely, when the government’s strategy gradually shifts toward passive regulation, the probability that ESCOs engage in speculative behavior by choosing low-quality renovation increases, because of the existence of incremental gains from low-quality renovation.
Figure 3 shows that the probability of the ESCO stably choosing high-quality renovation corresponds to the volume of region B1, denoted as VB1, while the probability of stably choosing low-quality renovation corresponds to the volume of region B2, denoted as VB2. The corresponding calculations are as follows:
Proposition 4.
The probability that the ESCO chooses high-quality renovation is positively correlated with the perceived loss precipitated by the substitution effect of competition V(−S), the perceived benefit from enhanced brand image V(L), the perceived benefit from government subsidies V(Ie), and the perceived loss from penalties when choosing low-quality renovation V(−D). This probability is negatively correlated with the perceived value of additional gains obtained from low-quality renovation V(ΔG).
Proof.
Based on the expression for the probability VB1 that the ESCO chooses high-quality renovation, the following first-order partial derivatives with respect to each variable can be obtained:
Proposition 4 indicates that the partial derivatives of VB1 with respect to V(−S), V(L), V(Ie), and V(−D) are positive, while the partial derivative with respect to V(ΔG) is negative, implying that VB1 is positively correlated with V(−S), V(L), V(Ie), and V(−D), and negatively correlated with V(ΔG). □
4.1.3. Stability Analysis for Owner Strategies
The expected payoff for owners choosing active participation Uo1, the expected payoff for owners choosing passive participation Uo2, and the average expected payoff are given as follows:
The replicator dynamic equation for owners’ strategy selection is expressed as follows:
The derivative of F(z) with respect to z is given by the following:
Let
The stability of the owner’s active participation strategy requires the following conditions to be satisfied: F(z) = 0 and . Since , it follows that G(x, y) is an increasing function with respect to x. By setting G(x, y) = 0, we can obtain the critical value . At this point, , and the owners are unable to determine a stable strategy. When x ≠ x*, solving F(z) = 0 yields two equilibrium points, z = 0 and z = 1. Therefore, a case-by-case analysis is required.
Proposition 5.
When x > x*, it follows that G(x, y) > 0, and , suggesting that z = 1 is the evolutionarily stable strategy (ESS) for owners. In contrast, when x < x*, we have G(x, y) < 0, and , signifying that z = 0 constitutes the owners’ evolutionarily stable strategy.
The best response function for the probability z that the owner chooses active participation is expressed as follows:
Equation (28) indicates that when x < x*, the owner adopts a strategy of passive participation; when x = x*, the system exhibits uncertainty, and the owner may waver between the two strategies without reaching a stable equilibrium; when x > x*, the owner chooses active participation. The threshold x* represents the owner’s risk perception inflection point in response to institutional signals. When the probability of regulation is low, owners are more concerned about the potential psychological losses associated with renovation failure (such as disruption to living conditions, substandard quality, or wasted investment) and therefore tend to avoid risk in line with typical loss-aversion behavior. However, once regulatory intensity surpasses a certain psychological threshold, owners gain greater confidence in future returns, and their perceived benefits gradually outweigh expected risks, leading to a strategic shift toward participation.
A phase diagram of the evolution of the owner’s strategy is shown in Figure 4.
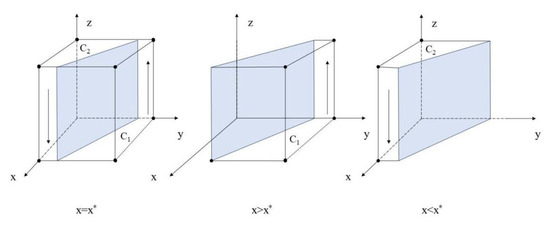
Figure 4.
Dynamic evolution of owner strategy choices.
Proposition 5 indicates that as the probability of the government choosing active regulation increases, owners tend to stably choose active participation. When the government’s strategy gradually shifts toward passive regulation, the probability that owners will choose passive participation increases.
Figure 4 shows that the probability of owners stably choosing active participation corresponds to the volume of region C1, denoted as VC1, while the probability that they will stably choose passive participation corresponds to the volume of region C2, denoted as VC2. The corresponding calculations are as follows:
Proposition 6.
The probability that owners will choose active participation is positively correlated with the perceived benefit from engaging in active participation in renovation V(H1) as well as the perceived benefit from government subsidies received through active participation V(Ic). It is negatively correlated with the perceived benefit from passive participation in renovation V(H2) and the perceived loss V(−P) resulting from unmet expectations when the owner actively participates but the ESCO carries out a low-quality renovation.
Proof.
Based on the expression for the probability VC1 that the owner will choose active participation, the first-order partial derivatives with respect to each variable can be obtained:
Proposition 6 indicates that the partial derivatives of VC1 with respect to V(H1) and V(Ic) are positive, while the partial derivatives with respect to V(H2) and V(−P) are negative, implying that VC1 is positively correlated with V(H1) and V(Ic), and negatively correlated with V(H2) and V(−P). □
4.2. Stability Analysis of Equilibrium Points
The evolutionarily stable strategy (ESS) of the differential equation system can be determined through a local stability analysis of the system’s Jacobian matrix. By taking the partial derivatives of the replicator dynamic equations for the three stakeholders described above, we obtained the following Jacobian matrix:
By combining the replicator dynamic equations of the government, ESCOs, and owners, and setting F(x) = F(y) = F(z) = 0, the local equilibrium points can be derived: D1(0, 0, 0), D2(0, 1, 0), D3(0, 0, 1), D4(0, 1, 1), D5(1, 0, 0), D6(1, 1, 0), D7(1, 0, 1), and D8(1, 1, 1). According to evolutionary game theory, an equilibrium state is considered an evolutionarily stable strategy (ESS) if all the eigenvalues of the Jacobian matrix are non-positive. To investigate the evolutionarily stable strategies within the system composed of the government, ESCOs, and owners, it is sufficient to conduct a detailed analysis of the asymptotic stability of these eight equilibrium points. By substituting each of the eight equilibrium points into the Jacobian matrix, the corresponding eigenvalues for each point can be obtained, as shown in Table 3.

Table 3.
Each equilibrium points and its characteristic value.
4.2.1. Mathematical Analysis of the Eight Equilibrium Scenarios
Based on the results of the stability analysis of the system’s equilibrium points described above, the following eight scenarios were identified, as illustrated in Figure 5.
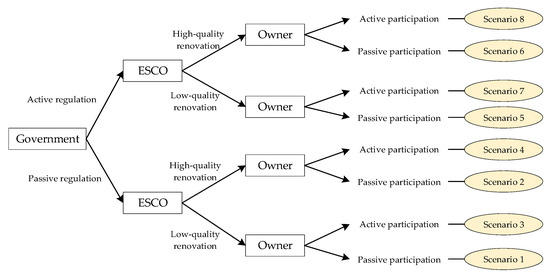
Figure 5.
Green renovation stakeholder behavior strategy diagram.
Scenario 1. When V(Rg) + V(−C1) + V(D) < V(−C2) + V(−W), V(ΔG) + V(−S) > 0, and V(H1) + V(−P) < V(H2), the point (0, 0, 0) represents the evolutionarily stable strategy. In this case, the government chooses passive regulation, the ESCO opts for low-quality renovation, and the owner chooses passive participation. This scenario reflects a complete failure of the green renovation market, in which all three parties adopt the most passive strategies. The government, facing high regulatory costs and low returns, chooses passive regulation. In a weakly regulated and insufficiently competitive market, the ESCO engages in speculative behavior by selecting the more profitable low-quality renovation. Anticipating high risks and unsatisfactory outcomes, owners respond by adopting passive participation.
Scenario 2. When V(Rg) + V(−C1) < −V(−Ie) + V(−W) + V(−C2), V(ΔG) + V(−S) < 0, and V(H1) < V(H2), the point (0, 1, 0) represents the evolutionarily stable strategy. In this case, the government chooses passive regulation, the ESCO opts for high-quality renovation, and the owner chooses passive participation. This scenario reflects a supply–demand imbalance in the green renovation market, where high-quality services exist but lack sufficient market uptake. ESCOs, recognizing the long-term value of brand reputation under intense market competition, actively choose high-quality renovation. However, for owners, even with assured renovation quality, the perceived direct benefits are insufficient to offset non-monetary costs such as the time spent during the renovation process, resulting in low willingness to participate.
Scenario 3. When V(Rg) + V(−C1) + V(−Ic) + V(D) < V(−C2) + V(−W), V(ΔG) + V(−S) > V(L), and V(H2) < V(H1) + V(−P), the point (0, 0, 1) represents the evolutionarily stable strategy. In this case, the government chooses passive regulation, the ESCO selects low-quality renovation, and the owner opts for active participation. This scenario reflects an abnormal and typically unstable market condition. Owners may face extremely poor living conditions and thus urgently require renovation, making them willing to accept significant risk in order to actively participate. At the same time, ESCOs still find room for speculation and choose low-quality renovation, while the government remains absent from effective regulatory intervention.
Scenario 4. When V(Rg) + V(−C1) + V(−Ic) + V(−Ie) < V(−C2) + V(−W), V(ΔG) + V(−S) < V(L), and V(H1) > V(H2), the point (0, 1, 1) represents the evolutionarily stable strategy. In this case, the government chooses passive regulation, the ESCO opts for high-quality renovation, and the owner chooses active participation. This scenario suggests that the ESCO’s motivation to build brand reputation outweighs the incentive for short-term speculative behavior. High-quality renovation becomes the norm, earning the trust of owners, who actively participate even in the absence of strong government intervention.
Scenario 5. V(Rg) + V(−C1) + V(D) > V(−C2) + V(−W), V(Ie) < V(ΔG) + V(−S) + V(−D), and V(H2) > V(H1) + V(−P) + V(Ic), the point (1, 0, 0) represents the evolutionarily stable strategy. In this case, the government chooses active regulation, the ESCO opts for low-quality renovation, and the owner chooses passive participation. This scenario reflects a state of “regulatory failure,” in which government policy is ignored by market actors and the input of public resources proves ineffective. Although the government adopts an active regulatory approach, the intensity of penalties or incentives is insufficient to alter the speculative behavior of ESCOs. As a result, owners, perceiving the ineffectiveness of regulation, choose passive participation.
Scenario 6. When V(Rg) + V(−C1) + V(−Ie) > V(−C2) + V(−W), V(Ie) > V(ΔG) + V(−S) + V(−D), and V(H1) + V(Ic) < V(H2), the point (1, 1, 0) represents the evolutionarily stable strategy. In this case, the government chooses active regulation, the ESCO opts for high-quality renovation, and the owner chooses passive participation. This scenario indicates that under government regulation, the supply-side quality of the green renovation market is ensured, but the participation barrier on the demand side remains unresolved. The government’s incentive and regulatory policies effectively influence ESCOs, encouraging them to choose high-quality renovation. However, for owners, even with subsidies and guaranteed renovation quality, the overall perceived return from participation remains unattractive. This situation suggests that non-economic factors play a significant role in shaping owners’ participation decisions.
This scenario closely mirrors the current situation of green renovation for existing residential buildings in many pilot cities across China. The market exhibits a pattern in which the supply side has been preliminarily activated by policy incentives, while the demand side remains insufficiently responsive. Under the guidance of national strategies such as the “dual carbon” goals and sustainable development, a series of policies have been introduced, including the “Notice on Further Enhancing the Preservation, Utilization, and Renovation of Existing Urban Buildings” and the “Work Plan for Accelerating Energy Conservation and Carbon Reduction in the Building Sector”. Through subsidies and enhanced regulatory efforts, the government aims to promote green renovation in pursuit of environmental benefits and improved public credibility.
For ESCOs, the dual effects of government incentives, V(Ie), and penalties, V(–D), significantly increase the speculative cost of pursuing low-quality renovation. With the advancement of market-oriented reform, the success or failure of renovation projects directly affects corporate brand reputation and future market share, bringing the competitive substitution effect, θ, into play. As a result, an increasing number of market-oriented ESCOs are abandoning short-term speculative behavior and instead adopting high-quality renovation as their core competitive strategy in order to align with policy expectations and build long-term market advantages.
On the owner side, despite improved service quality in the market, owners remain the central bottleneck in advancing green renovation in China. Their decision-making behavior is characterized by strong loss aversion, represented by the coefficient λ. Perceived losses, such as lifestyle disruptions during renovation, uncertainty regarding future benefits V(H1), and potential dissatisfaction with renovation outcomes V(−P), often outweigh the attractiveness of government subsidies (Ic) and long-term gains. Consequently, even when external conditions are favorable, most owners still choose passive participation and adopt a wait-and-see attitude.
Scenario 7. When V(Rg) + V(−C1) + V(D) + V(−Ic) > V(−C2) + V(−W), V(ΔG) + V(−S) + V(−D) > V(Ie) + V(L), and V(H1) + V(−P) + V(Ic) > V(H2), the point (1, 0, 1) represents the evolutionarily stable strategy. In this case, the government chooses active regulation, the ESCO selects low-quality renovation, and the owner chooses active participation. This scenario indicates that the efforts of both the government and the owners have failed to incentivize ESCOs to choose high-quality renovation and that they may even be exploited by speculative actors. The policy design may contain loopholes, as subsidies are not effectively linked to a strong penalty mechanism. As a result, ESCOs identify greater profit potential in complying with surface-level policy requirements while continuing to pursue low-quality renovation.
Scenario 8. When V(Rg) + V(−C1) + V(−Ic) + V(−Ie) > V(−C2) + V(−W), V(Ie) + V(L) > V(ΔG) + V(−S) + V(−D), and V(H1) + V(Ic) > V(H2), the point (1, 1, 1) represents the evolutionarily stable strategy. In this case, the government chooses active regulation, the ESCO opts for high-quality renovation, and the owner chooses active participation. Under these conditions, high-quality renovation becomes the most profitable option for ESCOs, providing owners with assurance of the reliability of the service. Combined with appropriate incentives, this encourages owners to actively participate. The green renovation market achieves collaborative governance, with policies, market forces, and social demand forming a virtuous cycle that promotes healthy and sustainable market development.
This scenario represents the current policy objective for promoting green renovation of existing residential buildings in China. It reflects the vision of a healthy and sustainable market in which policies, market forces, and social demand interact positively and reinforce one another. In the Chinese context, achieving this ideal equilibrium is not an immediate outcome, but rather a gradual and dynamic evolutionary process.
In the first stage, during the early phase of renovation, the market is characterized by significant information asymmetry and speculative behavior, while owners generally lack confidence. At this point, the government must take the lead by adopting an active regulation strategy. This includes setting clear energy efficiency standards, providing initial financial subsidies, and imposing penalties on low-quality renovation practices to regulate market behavior. The primary objective of this stage is to establish policy credibility and offer market participants stable expectations.
In the second stage, under effective government guidance, the behavior of ESCOs begins to diverge. Enterprises with long-term development goals actively respond to policy signals by selecting high-quality renovation strategies, aiming to obtain subsidies and build brand reputation. As more high-quality demonstration projects are implemented, their notable energy savings and improved living comfort begin to generate word-of-mouth and demonstration effects. At the same time, market competition mechanisms gradually come into play. Speculative ESCOs are progressively eliminated, and the overall market environment improves.
In the third stage, the shift in owners’ perceptions and the activation of demand mark a key turning point in the transition from the suboptimal state (1, 1, 0) to the ideal equilibrium (1, 1, 1). As the number of successful cases increases and market information becomes more transparent, owners’ reference points in decision-making begin to change. The perceived loss associated with unsatisfactory renovation outcomes, V(−P), is significantly reduced. At this point, the direct perceived benefits of renovation, V(H1), such as lower energy expenditures and more comfortable indoor environments, combined with moderate government subsidies, V(Ic), begin to consistently outweigh the value of maintaining the status quo, V(H2), as well as concerns about potential risks. Consequently, owners’ decision-making logic shifts from risk aversion to value acquisition, leading to a stable preference for active participation.
Eventually, a virtuous and self-reinforcing market ecosystem emerges. Once owners engage in active participation at scale, market demand is fully activated. This expanded demand creates greater market opportunities and higher brand premiums for ESCOs that pursue high-quality renovation, further reinforcing their strategic orientation. At this stage, the government’s role transitions from strong intervention to maintaining market order and supporting continuous innovation. As a result, both regulatory costs and fiscal burdens are reduced, giving rise to a mutually beneficial cycle involving government, enterprises, and owners.
In summary, under the current policy-driven market conditions in China, the evolution of the system toward the ideal equilibrium of (1, 1, 1) depends on a dynamic process that shifts from external policy intervention to the development of endogenous market mechanisms. The success of this transition hinges on effectively mitigating psychological biases such as loss aversion among key stakeholders and ultimately fostering a shared understanding of the long-term value of green renovation.
4.2.2. The Path to Achieving the Ideal Equilibrium (1, 1, 1)
As indicated by the above analysis, the system allows for multiple stable states. Among them, Scenario 8 represents the optimal strategy combination under current conditions, in which all three stakeholders adopt the strategy set {active regulation, high-quality renovation, active participation}. The conditions required to achieve the ideal equilibrium (1, 1, 1) are as follows: V(Rg) + V(−C1) + V(−Ic) + V(−Ie) > V(−C2) + V(−W), V(Ie) + V(L) > V(ΔG) + V(−S) + V(−D), and V(H1) + V(Ic) > V(H2). Given that theoretical analysis alone may lack intuitive clarity, the following section presents a simulation-based analysis of the decision-making behaviors of the government, ESCOs, and owners. Specifically, we focused on equilibrium point C8 (1, 1, 1), examining the evolutionary paths of the three stakeholders and conducting sensitivity analysis of key parameters through numerical simulation.
5. Simulation of Evolutionary Dynamics
5.1. Model Validation
To further clarify how the system can stably evolve toward the ideal equilibrium point D8(1, 1, 1) and explore the corresponding evolutionary paths, we conducted numerical simulations using MATLAB R2023a. Key influencing factors were analyzed through simulation. The following approaches are often adopted in numerical simulations in evolutionary game theory research: (1) assigning values within empirically reasonable ranges that satisfy equilibrium conditions [46,47,48] and (2) assigning parameter values based on case studies or relevant policies [42,49].
Based on the research objectives and the practical context of green renovation in existing buildings in China, we conducted numerical simulation with reference to the works of Fan et al., Su, and Wang et al. [46,47,48]. After a comprehensive investigation of the actual situation, model parameters were appropriately set within specific intervals.
Currently, the green renovation of existing residential buildings in China is hampered by several issues, such as underdeveloped incentive mechanisms, inadequate regulatory frameworks, and insufficient owner participation. In practice, some ESCOs pursue short-term gains by lowering construction standards or reducing material costs. Inadequate regulatory enforcement results in low penalties for noncompliance, incentivizing low-quality renovation. Although the government plays a critical role in promoting green renovation, it is constrained by fiscal pressures, keeping subsidies and regulatory expenditures within a limited range. Owners, on the other hand, exhibit a clear tendency toward risk aversion due to information asymmetry, lack of trust, and concerns about renovation outcomes.
To capture the bounded rationality of stakeholder behavior, according to the experimental results of Kahneman and Tversky, the core parameters of prospect theory were set as λ = 1.1, α = β = 0.88, σ = 0.69, and subjective probability p0 = 0.8, consistent with previous studies [27,50]. The values of α and β are derived from Kahneman and Tversky’s seminal empirical study, reflecting the general psychological pattern of diminishing sensitivity to gains and losses among decision-makers. For example, the government may offer subsidies to owners in order to promote green renovation. A value of λ = 1.1 represents a relatively moderate level of loss aversion, which aligns with China’s policy orientation. Policies such as the “Notice on Further Enhancing the Preservation, Utilization, and Renovation of Existing Urban Buildings,” issued by the Ministry of Housing and Urban–Rural Development, have established green renovation as a key strategic objective. Within this policy context, although the government bears certain “losses” in the form of subsidies and regulatory costs during the implementation process, it also secures strategic “gains”, such as enhancing public credibility and achieving sustainable development goals. This emphasis on strategic benefits tends to reduce the government’s sensitivity to cost-related losses. For owners, loss aversion is more pronounced. They are typically concerned about renovation costs, construction-related disturbances, and the risk of unsatisfactory outcomes. In China’s green renovation efforts, the government is usually deeply involved. It provides subsidies, designates reputable state-owned enterprises to serve as ESCOs, and conducts community mobilization. These measures significantly reduce owners’ perceived risks and lower their resistance to decision-making. The probability weighting parameter σ, together with the subjective probability p0, jointly quantifies owners’ early-stage psychological tendencies toward trust deficit and risk overestimation. These cognitive biases represent urgent challenges that must be addressed in the promotion of green renovation for existing residential buildings in China.
On the government side, the perceived benefit of reputation enhancement under active regulation was set as Rg = 20, which is higher than the regulatory cost, C1 = 14, reflecting the government’s strong commitment to green renovation policies. In contrast, under passive regulation, although the regulatory cost C2 = 8 is relatively low, the associated reputation loss W = 4 makes passive regulation less beneficial overall, consistent with the following policy logic: “activeness is rewarded; passiveness is penalized.” The subsidies given to owners and ESCOs were set as Ic = 7 and Ie = 5, respectively, reflecting local governments’ stronger focus on stimulating end-user demand.
For ESCOs, the additional short-term profit from low-quality renovation is ΔG = 2, which is significantly lower than the potential reputation loss, S = 8, and government penalty, D = 5, indicating that ESCO behavior is subject to both institutional constraints and market pressures. The long-term brand benefit from high-quality renovation is L = 3, which, although limited, provides a degree of positive incentive. The market substitution effect, θ = 0.2, indicates that while full market competition has not yet been established, substitution mechanisms have begun to emerge, reflecting the current state of the green renovation market.
In the decision-making process, owners display a “loss anticipation” bias. The perceived benefit from active participation, H1 = 12, is slightly lower than that of maintaining the status quo, H2 = 14, suggesting concerns about construction disruption and outcome uncertainty. In the event of renovation failure, the perceived loss, P = 5, combined with a subjective probability of p0 = 0.8, leads owners to favor a more conservative course of action.
Based on the above analysis, we established the following specific parameter values:
λ = 1.1, α = 0.88, β = 0.88, Rg = 20, C1 = 14, Ie = 5, H1 = 12, Ic = 7, H2 = 14, ΔG = 2, S = 8, D = 5, P = 5, C2 = 8, W = 4, L = 3, θ = 0.2, p0 = 0.8, and σ = 0.69. By substituting these values into the model, we obtained the simulation results presented in Figure 6.
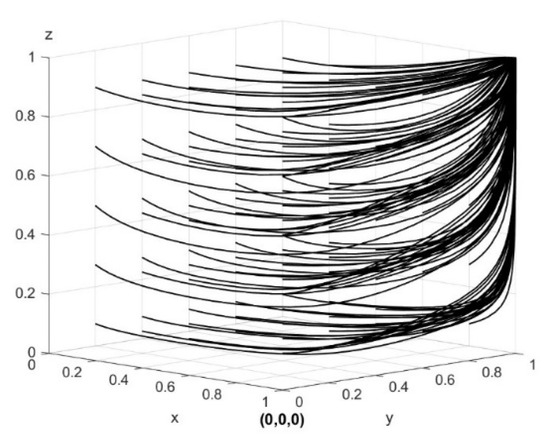
Figure 6.
System evolution path diagram.
As illustrated in Figure 6, x, y, and z represent the probabilities that the government chooses active regulation, ESCO chooses high-quality renovation, and owners choose active participation, respectively (the same applies below). The system ultimately evolves toward and stabilizes at the equilibrium point D8(1, 1, 1). Further analysis of the model indicates that the simulation outcomes are consistent with the conclusions drawn from the analysis of the stability of the stakeholders’ strategies, thereby confirming the validity and accuracy of the model. To eliminate the potential influence of initial strategy probabilities on the system’s evolutionary dynamics and facilitate a clearer comparison of the strategic adaptation trends among the government, ESCOs, and owners, the initial strategy probability for each party was uniformly set to 0.5.
5.2. Influence of Initial Strategy Probabilities on Evolutionary Trajectories
To eliminate the influence of initial condition bias on the simulation results, all agents in the game were assigned an initial strategy probability of 0.5. This setting follows the “Principle of Indifference” commonly adopted in evolutionary game theory, representing a completely neutral starting point for the game in which, in the absence of prior information, each participant has an equal propensity to choose either strategy.
5.2.1. Government
With the initial strategy probability of the government set to x = 0.5, the evolutionary trajectories of government strategy selection under the influence of different initial probability combinations of y and z are shown in Figure 7. Under all the probability settings, the government eventually evolves toward active regulation. The lower the initial strategy probabilities of ESCOs and owners, the faster the government converges toward active regulation, reflecting the government’s proactive role in guiding the development of the green renovation market for existing residential buildings.
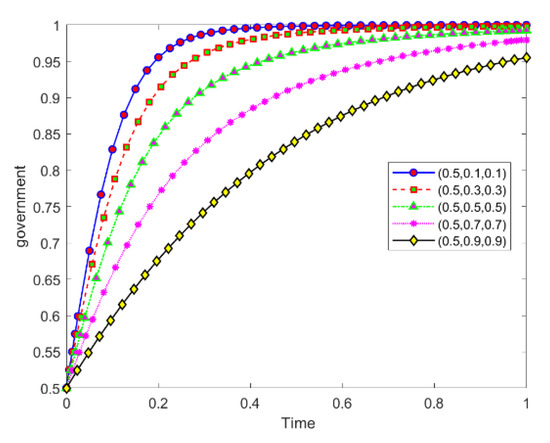
Figure 7.
Evolutionary trajectories of government strategy selection under the influence of changes in y and z.
5.2.2. ESCO
With the initial strategy probability of the ESCO set to y = 0.5, the evolutionary trajectories of ESCO strategy selection under the influence of different initial probability combinations of x and z are shown in Figure 8. Under all probability settings, the ESCO ultimately evolves toward high-quality renovation. As the probabilities of the government adopting active regulation and owners engaging in active participation increase, the ESCO’s evolution toward high-quality renovation accelerates. This finding indicates that as the green renovation market and regulatory framework for existing residential buildings gradually take shape, ESCOs will ultimately shift toward the high-quality renovation strategy.
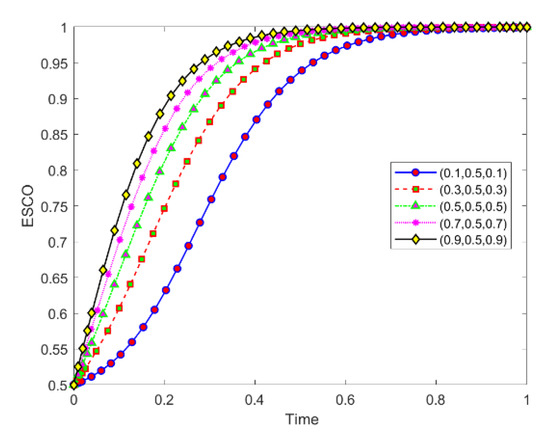
Figure 8.
Evolutionary trajectories of ESCO strategy selection under the influence of changes in x and z.
5.2.3. Owners
With the initial strategy probability of the owner set to z = 0.5, the evolutionary trajectories of owner strategy selection under different initial probability combinations of x and y are illustrated in Figure 9. Under all probability settings, the owner’s strategy ultimately evolves toward active participation. However, owing to the initially low probabilities of active regulation by the government and high-quality renovation by ESCOs, owners tend to adopt passive participation in the early stages of the interaction. As incentive policies are implemented, regulatory mechanisms improve, and technologies related to green renovation mature, owners eventually shift toward active participation.
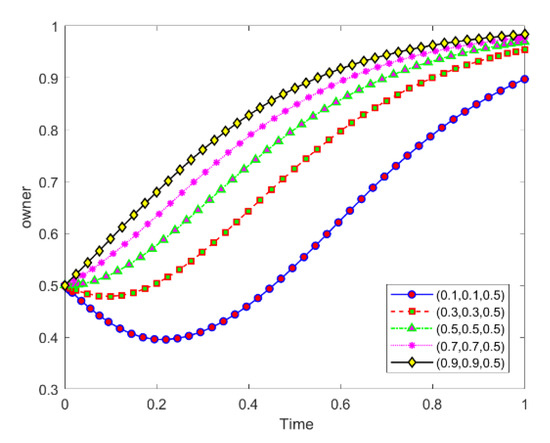
Figure 9.
Evolutionary trajectories of owners’ strategy choices under the influence of changes in x and y.
5.3. Sensitivity Analysis
5.3.1. Impact of Government Subsidies on Evolutionary Trajectories
Based on the initial parameter settings, the initial strategy probabilities of the government, ESCOs, and owners were set to 0.5, 0.5, and 0.5. Different initial values of Ie and Ic were selected to examine how subsidies given to ESCOs (Ie) influence the strategy evolution of the government and ESCOs and how subsidies given to owners (Ic) affect the strategic evolution of the government and owners. The corresponding simulation results are illustrated in Figure 10 and Figure 11, respectively.
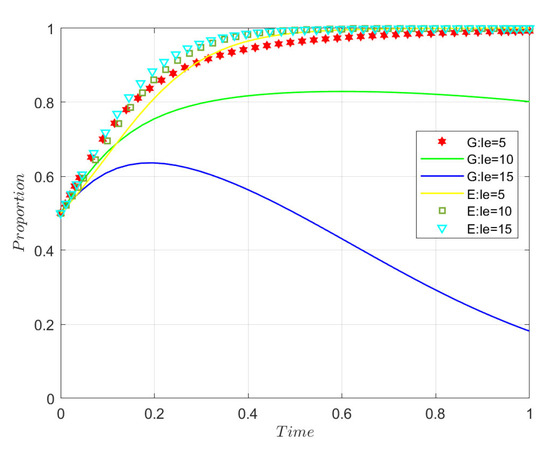
Figure 10.
The impact of Ie on government and ESCO evolution strategies.
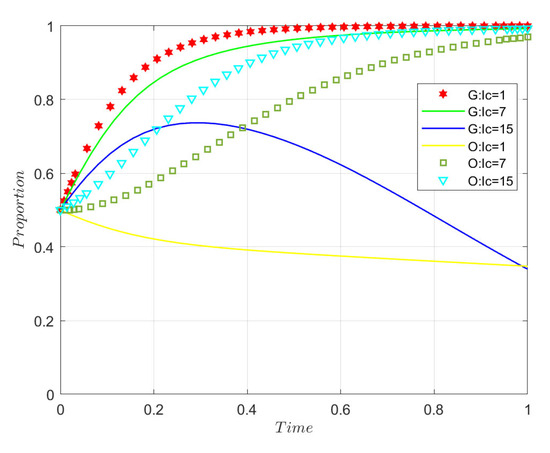
Figure 11.
The impact of Ic on governments’ and owners’ strategies.
Figure 10 illustrates the impact of varying subsidy levels Ie, provided by the government to support high-quality renovation by ESCOs, on the evolutionary trajectories of government and ESCO strategies. Based on the initial parameter settings, the initial strategy probabilities of the government, ESCOs, and owners were set to 0.5, 0.5, and 0.5, with Ie assigned values of 5, 10, and 15. When Ie = 5, the government adopts active regulation. As Ie increases, the convergence rate toward active regulation slows down. When Ie reaches 10, the government no longer consistently chooses active regulation and begins to shift toward passive regulation. As Ie further increases to 15, the evolution toward passive regulation accelerates. At Ie = 5, the ESCO opts for high-quality renovation. When Ie reaches 10, the convergence rate toward high-quality renovation increases. As Ie increases further to 15, this convergence becomes even faster, indicating a positive correlation between the strength of Ie and the evolutionary speed of the ESCO’s preference for high-quality renovation. This occurs because government subsidies effectively compensate for the high initial costs ESCOs face in the early stages of green renovation for existing residential buildings. Increasing the subsidy reduces speculative behavior driven by cost pressures and encourages high-quality renovation. However, when the subsidy exceeds a certain threshold (Ie = 10), the resulting fiscal burden reduces the government’s willingness to maintain active regulation.
Figure 11 depicts the impact of varying subsidy levels Ic, offered by the government to incentivize active participation by owners, on the evolutionary trajectories of government and owner strategies. Based on the initial parameter settings, the initial strategy probabilities of the government, ESCOs, and owners were set at 0.5, 0.5, and 0.5, with Ic taking values of 1, 7, and 15. The results indicate that the government’s willingness to adopt active regulation is negatively correlated with Ic, while the owner’s tendency to engage in active participation is positively correlated with Ic. On the government side, when Ic = 1, the government adopts active regulation. As Ic increases, the evolutionary speed toward active regulation gradually decreases. When Ic reaches 15, the government no longer consistently chooses active regulation and begins to evolve toward passive regulation. On the owner side, when Ic = 1, the owner’s strategy is unstable and tends to lean toward passive participation. When Ic reaches 7, the owner adopts active participation. As Ic further increases to 15, the evolutionary speed toward active participation becomes even faster. Excessive subsidies impose a considerable fiscal burden on the government (Ic = 15), leading to a shift toward passive regulation. Conversely, insufficient subsidies fail to provide meaningful incentives for owners (Ic = 1) and result in a strategic shift toward passive participation. Compared to the situation depicted in Figure 8, here, the owners exhibit lower sensitivity to changes in subsidy intensity than ESCOs, suggesting that subsidies are more effective when directed toward ESCOs as opposed to owners, under equivalent conditions.
5.3.2. Impact of the Competition Influence Coefficient θ on Evolutionary Trajectories
Figure 12 illustrates the effect of varying levels of the competition influence coefficient θ on the evolutionary trajectory of ESCO strategies. As shown, the convergence speed of the ESCOs toward high-quality renovation is positively correlated with the competition influence coefficient θ. As θ increases, the ESCO’s strategy evolves more rapidly toward high-quality renovation and eventually stabilizes at this choice. Although the competition intensity in the early stage of green renovation in existing residential buildings is relatively low, ESCOs tend to pursue high-quality renovation as part of their long-term business strategies, aiming to build up a positive reputation and secure an early market share. As the market gradually matures, increasing competitive pressure drives ESCOs to adopt more standardized and regulated behavior to ensure sustainable development. In the context of the green renovation of existing residential buildings, the core of competition among ESCOs lies in renovation quality. A higher competition coefficient raises the cost of speculative behavior; if an ESCO engages in low-quality renovation, the government may reassign the renovation project to a competing ESCO or even terminate the collaboration. Additionally, poor renovation quality can negatively affect owner satisfaction, and negative feedback from owners may prompt the government to switch to a more reliable ESCO. Therefore, establishing an effective competition mechanism and improving credit rating and oversight systems for ESCOs are essential for promoting the healthy development of the green renovation market for existing residential buildings.
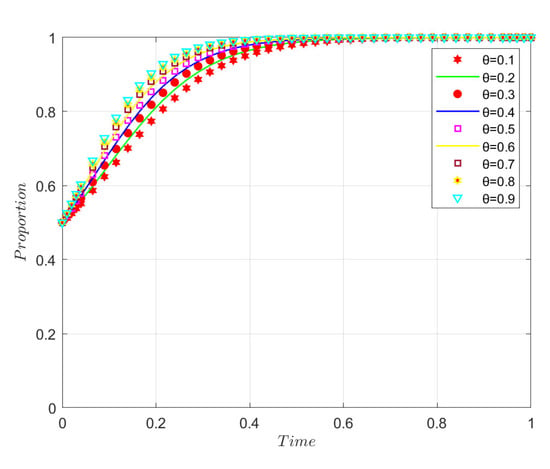
Figure 12.
The impact of the competition influence coefficient θ on ESCOs’ evolution strategies.
5.3.3. Impact of the Loss Aversion Coefficient λ on Evolutionary Trajectories
To examine how decision-makers’ degrees of loss aversion affect the system’s evolutionary process, the value of λ was varied. A higher value of λ indicates stronger risk aversion and a higher sensitivity to losses. Figure 13 shows the impact of different levels of the loss aversion coefficient λ on the evolutionary trajectory of government strategies. As the degree of loss aversion increases, the government’s convergence toward active regulation slows down. When λ exceeds a critical threshold between 1.2 and 1.5, a shift in the government’s strategy occurs. At λ = 1.5, the government’s strategy gradually transitions to passive regulation. As λ further increases to 2, the evolutionary speed toward passive regulation accelerates. This indicates that when the government exhibits excessive psychological aversion to perceived “losses”, such as regulatory costs and subsidy expenditures, it tends to abandon the pursuit of benefits such as enhanced public credibility, ultimately resulting in the government relinquishing its regulatory responsibilities.
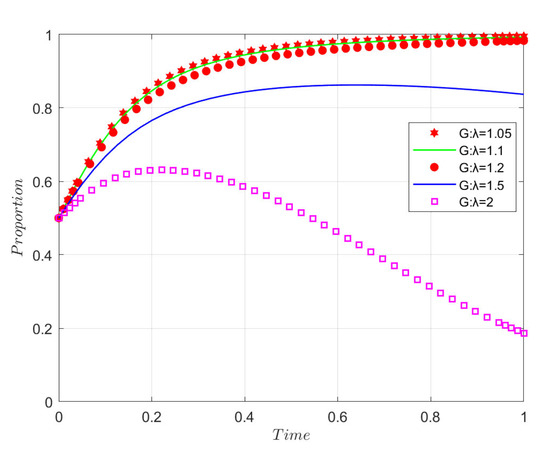
Figure 13.
The impact of the loss aversion coefficient λ on government evolution strategies.
Figure 14 illustrates the impact of varying levels of the loss aversion coefficient λ on the evolutionary trajectories of ESCO strategies. As the degree of loss aversion increases, the ESCO converges more rapidly toward high-quality renovation. The willingness of the ESCO to choose high-quality renovation is positively correlated with the value of the loss aversion coefficient λ. This phenomenon may be attributed to the presence of government penalties and competitive pressure in the green renovation market for existing residential buildings. The more loss-averse the ESCOs, the greater their inclination to choose high-quality renovation as a strategy to mitigate potential risks.
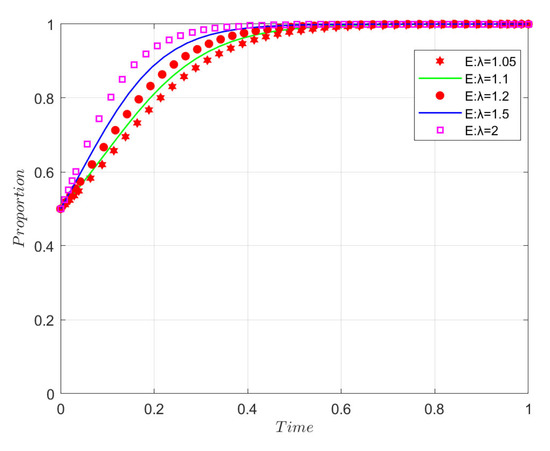
Figure 14.
The impact of the loss avoidance coefficient λ on ESCOs’ evolution strategies.
Figure 15 illustrates the impact of varying values of the loss aversion coefficient λ on the evolutionary trajectories of owner strategies. As the degree of loss aversion increases, the owner’s convergence toward active participation slows down. When λ exceeds a critical threshold between 1.5 and 2.0, a shift in the owner’s strategy occurs. At λ = 2, the owner’s strategy gradually evolves toward passive participation. As λ further increases to 2.5, the convergence toward passive participation accelerates. This finding indicates that, in the early stages of green renovation for existing residential buildings, owners with higher loss aversion are more inclined to choose passive participation. This tendency may be due to the underdeveloped regulatory framework and the immature state of renovation technologies, which give rise to a high degree of uncertainty and the risk that renovation outcomes may fall short of owners’ expectations.
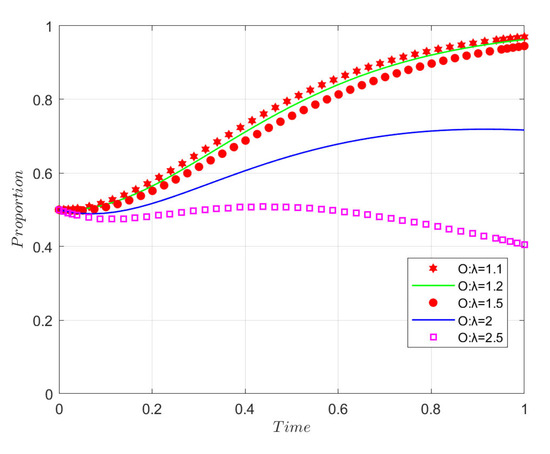
Figure 15.
The impact of loss avoidance coefficient λ on owners’ strategies.
In summary, the sensitivity analysis of the loss aversion coefficient λ reveals its asymmetric impacts on different stakeholders. For both the government and owners, a higher λ triggers negative strategic tipping points, making it a key psychological factor contributing to market failure. In contrast, for ESCOs, λ serves as a positive constraining force.
5.3.4. Impact of the Sensitivity Coefficients α and β for Perceived Gains and Losses on Evolutionary Trajectories
To examine how sensitivity to perceived gains and losses influences system evolution, the values of α and β were varied. The parameters α and β represent the degree of diminishing marginal sensitivity in the value functions for gains and losses, respectively; higher values indicate a greater degree of diminishing sensitivity.
As shown in Figure 16, when α = 0.5, the strategy set of the three stakeholders is {passive regulation, high-quality renovation, passive participation}. When α increases to 0.7, the strategy set remains the same, but the ESCO exhibits a faster convergence rate, while the convergence speeds of the government and owners slow down. This is because, at lower values of α, the government and owners have a weak perception of the long-term benefits associated with adopting proactive strategies—such as enhanced public credibility for the government or improved living conditions for owners. These perceived benefits are insufficient to offset their associated costs and risks. When α increases to 0.9, the strategy set of all three stakeholders shifts to {active regulation, high-quality renovation, active participation}, and the convergence speeds of all stakeholders increase. This result reveals the existence of a critical threshold for α between 0.7 and 0.9. Once α surpasses this threshold, the system transitions from a suboptimal equilibrium characterized by insufficient demand (0, 1, 0) to an ideal, mutually beneficial equilibrium (1, 1, 1). This indicates that achieving a virtuous cycle in the green renovation market depends on enhancing the government’s and owners’ perceived value and sense of gain from participating in the process. Only when they are sufficiently sensitive to the long-term benefits of green renovation can the system be triggered into a trajectory of positive evolution.
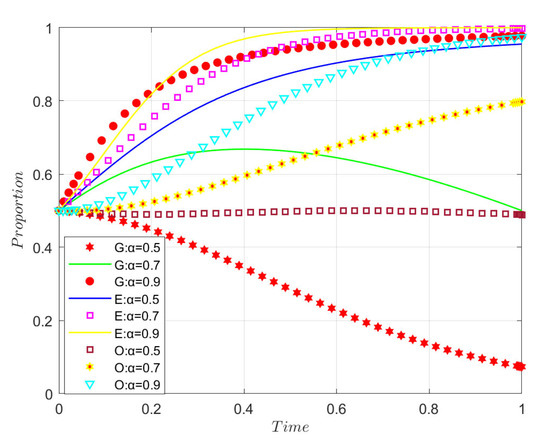
Figure 16.
Analysis of the impact of α on the evolutionary dynamics of the system.
As shown in Figure 17, when β = 0.6, the strategy set of the three stakeholders is {active regulation, high-quality renovation, active participation}. When β increases to 0.8, the strategy set remains unchanged; however, the convergence speed of the government and owners slows down, while the ESCO converges more rapidly. This may be attributed to the ESCO’s heightened sensitivity to potential penalties and market losses. In contrast, the slower convergence of the government and owners reflects an increased sensitivity to costs and risks, leading to more cautious decision-making. When β further increases to 1.0, the strategy set shifts to {passive regulation, high-quality renovation, active participation}. At this point, the convergence of owners slows even further, while the ESCO continues to converge more quickly. The results indicate the existence of a critical threshold for β between 0.8 and 1.0 that triggers a shift in the government’s strategy. When β is below this threshold, although the government perceives regulatory and subsidy-related costs as losses, these remain within an acceptable range. Once β exceeds the threshold, the government’s sensitivity to fiscal expenditures and other perceived “losses” becomes excessively high. As a result, persistent cost pressure leads to a decline in perceived value, ultimately prompting the government to abandon the strategy of active regulation and instead rely on market self-regulation.
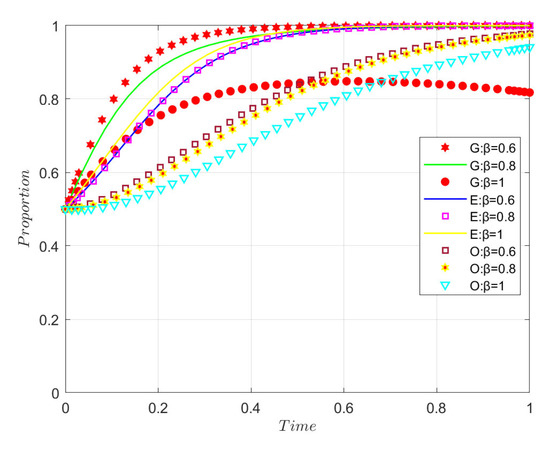
Figure 17.
Analysis of the impact of β on the evolutionary dynamics of the system.
6. Discussion
In this study, we developed an evolutionary model based on prospect theory to examine the decision-making behaviors and interaction mechanisms among the three key stakeholders—government, ESCOs, and owners—in the context of the green renovation of existing residential buildings in China. Comparing with previous studies, this study quantified the nonlinear effects of psychological perception factors such as risk aversion and loss aversion on equilibrium outcomes, thereby offering a mechanism-based perspective for explaining real-world phenomena such as the “boundary of policy effectiveness” and “market failure”.
Regarding government guidance, this study reveals the dual effect of policy incentives and deepens our understanding of their boundaries of influence. Although supporting technological innovation is essential and advanced tools such as multi-criteria decision-making models and data-driven platforms have already been applied to green renovation [51,52,53], technology-oriented policies alone are not sufficient. Our findings confirm that government subsidies and regulation play a crucial role in guiding the market during the early stages of green renovation. This conclusion is consistent with the findings of many previous studies [54,55,56]. In addition, we further identified a dynamic feedback mechanism in government subsidies, revealing the existence of an optimal incentive range and a diminishing returns effect. When the subsidy given to ESCOs (Ie) increases from 5 to 10, the incentive effect becomes significantly stronger. However, as the subsidy increases to 15, the excessive fiscal burden provokes the government to shift its strategy toward passive regulation. This shift is an active policy adjustment based on the government’s perceived financial loss, rather than a passive system response. These findings highlight the need for policymakers to transition from employing static incentives to dynamic regulation in order to avoid the negative consequences of policy overreach.
Regarding market mechanisms, market competition serves as an endogenous and effective governance tool with which to constrain the behavior of ESCOs. Most of the existing studies have approached the regulation of ESCOs from an external governmental perspective, overlooking the influence of internal market forces [4,57]. Zhao et al. proposed a synergistic framework of “Technology-Reputation-Policy” by constructing a tripartite evolutionary game model involving government, construction enterprises, and consumers [58]. Building upon this framework, this study introduces a market competition coefficient, denoted as θ, which translates the abstract concept of “reputation” into specific, measurable marketing-related factors. Government can directly influence the structure of market competition by promoting information disclosure, publishing performance rankings, and lowering entry barriers for compliant enterprises. These measures effectively increase the value of θ, thereby enhancing the perceived risk of replacement among low-quality service providers, represented as V(−S). This finding suggests that, compared to direct point-to-point reward-and-punishment mechanisms employed by the government, cultivating a transparent, efficient, and highly competitive market ecosystem offers a more cost-effective and sustainable approach to governance
Regarding owner decision-making, this study verifies and extends our understanding of the critical influence of psychological factors on the demand side. Owners’ tendency to avoid potential losses and risks represents a major barrier to their participation in decision-making, a result highly consistent with recent research findings [59,60,61]. Furthermore, this study demonstrates how owners’ loss-averse behavior functions as a signal that transmits upward, subsequently influencing the strategic choices of both the government and ESCOs. In some cases, this behavior may even lead the system into a suboptimal equilibrium characterized by insufficient demand, as illustrated in Scenario 6. These findings suggest that policy tools should transcend simple economic subsidies and place greater emphasis on offering risk protection, establishing trust mechanisms, improving communication strategies, and breaking down information barriers. Such measures are essential to effectively reduce owners’ perceived risks and thereby enhance end-user demand.
Different from conventional evolutionary game models that rely solely on objective payoff matrices while neglecting the cognitive mechanisms underlying individual behavior, previous approaches often fail to incorporate the subjective perceptions of participating agents, leading to a disconnect between theoretical modeling and real-world decision-making, making it difficult to capture the underlying motivations of strategic changes [62,63]. In this study, we introduced prospect theory into the evolutionary game framework by applying value and weighting functions to define perceived gains and losses, allowing for a dynamic, nonlinear representation of each participant’s response to policy and market changes, thereby aligning the model more closely with real-world conditions. This improved framework effectively explains behavioral phenomena that traditional models cannot capture. The results show that even when policy returns are clearly defined, stakeholders may still adopt suboptimal strategies because of psychological mechanisms such as risk amplification and loss aversion. This type of irrational behavior is particularly prevalent in the early stages of green renovation, when technologies are immature and information asymmetries are significant. These findings underscore the importance of addressing and guiding stakeholder expectations and risk perceptions in the green renovation of existing residential buildings.
7. Conclusions and Policy Recommendations
7.1. Conclusions
In this study, we integrated prospect theory with evolutionary game theory to construct a tri-party evolutionary game model driven by psychological perception. The model reveals the dynamic interaction patterns among stakeholders in the green renovation of existing residential buildings. The following main conclusions were drawn from this analysis:
(1) The ideal equilibrium depends on constructive strategic interaction and interest alignment among stakeholders.
Government guidance and trade-offs: Active regulation by the government serves as both the initial catalyst and a critical precondition for guiding the market toward an ideal equilibrium. The sustainability and effectiveness of this strategy depend on whether the benefits it generates, such as enhanced public credibility, can sufficiently compensate for the costs associated with regulatory enforcement and fiscal subsidies. This relationship is subject to a certain threshold. We have found that when the intensity of the subsidy given to ESCOs and owners (Ie, Ic) exceeds a critical point, for example, when Ie = 15, Ic = 15 in numerical simulations, the excessive fiscal pressure may provoke the government to shift its strategy from active regulation to passive regulation, thereby weakening the long-term effectiveness of the policy. In addition, the government’s decision-making exhibits dynamic feedback characteristics. Once ESCOs widely adopt high-quality renovation strategies, the marginal benefit of active regulation decreases, and the government’s regulatory tendency shifts toward passive regulation. This situation reflects a dynamic balancing process between guiding the market and conserving public resources.
Returns and constraints for ESCOs: The core driving force behind ESCOs’ adoption of high-quality renovation lies in a combination of government-imposed incentives and constraints, as well as the active participation of owners. Active regulation by the government directly increases the cost risk associated with opportunistic behavior, such as penalties and losses resulting from competitive market replacement, thereby enhancing the economic return for compliance. At the same time, owners’ active participation generates additional brand and reputation value for ESCOs. Only when these combined benefits outweigh the short-term extra profits from low-quality renovation will ESCOs consistently opt for a high-quality strategy.
Trust and risk for owners: Active participation by owners is a critical component in achieving a virtuous market cycle, and their decision-making heavily depends on the level of trust in the behavior of both the government and ESCOs. On the one hand, the government’s position of active regulation and the provision of subsidies can directly enhance owners’ willingness to participate. On the other hand, the higher the probability that ESCOs will adopt high-quality renovation, the lower the perceived loss owners associate with unsatisfactory renovation outcomes. Owners will develop a stable willingness to participate only when the combined value of their perceived direct benefits from renovation and government subsidies is sufficient to offset their perceived risk and exceeds the expected return from passive participation.
(2) Different factors exert varying driving effects on supply and demand actors in the market.
ESCOs’ decisions are most sensitive to government subsidies V(Ie), penalties for low-quality renovation V(−D), and the intensity of market competition θ, indicating that their behavior is primarily driven by cost–benefit calculations and external market pressure. In contrast, owners’ willingness to participate mainly depends on a trade-off between the direct perceived benefit from renovation V(H1) and the potential loss associated with underperformance V(−P). Our simulation results show that, compared to owners, ESCOs respond more quickly to subsidies of the same intensity. In addition, market competition serves as an efficient endogenous mechanism for constraining their opportunistic behavior.
(3) Psychological perception has a significant impact on evolutionary paths and equilibrium outcomes.
The psychological parameters derived from prospect theory play a decisive role in determining which stable strategies the system ultimately converges toward. When decision-makers’ loss aversion coefficient (λ) and loss sensitivity coefficient (β) are high, the system tends to converge toward a suboptimal equilibrium characterized by passive regulation, high-quality renovation, and passive participation. This is particularly evident in the early stages of renovation, when uncertainty and risk are more pronounced. In contrast, when the perceived sensitivity to gains (α) is high, the system is more likely to evolve toward the ideal equilibrium: active regulation, high-quality renovation, and active participation. This finding suggests that when stakeholders are more responsive to the positive value of cooperation, the attractiveness of proactive strategies increases accordingly. The nonlinear effects of these psychological parameters help explain why the system may fall into a suboptimal equilibrium. Even when objective benefits are considerable, strong loss aversion may provoke both owners and the government to adopt conservative strategies, resulting in insufficient market demand and regulatory inaction. This evidence highlights the fact that when designing incentive policies, managing and guiding stakeholders’ subjective perceptions of risk are as important as traditional economic incentives.
7.2. Policy Recommendations
Based on the above findings, and in order to effectively address the challenges faced in the green renovation of existing residential buildings in China and promote the evolution of the market toward an ideal equilibrium, we have proposed a collaborative governance framework involving the government, ESCOs, and owners. The key policy recommendations that have emerged from this study are outlined below:
(1) Optimizing top-level design by establishing dynamic incentive and market-oriented governance mechanisms.
Design incentive policies that are dynamic and performance-based. We have found that long-term, static, high-intensity subsidies can increase fiscal pressure and may even provoke governments to exhibit loss-averse behavior, resulting in a shift toward passive regulation. Subsidies provided to ESCOs (Ie) and owners (Ic) should be maintained within a fiscally sustainable range, as exemplified in this study by Ie values below 10 and Ic values below 15. This approach helps prevent unintended strategic reversals by the government. In addition, incentive mechanisms should be tied to performance indicators that enhance owners’ long-term perceived benefits, V(H1), in order to more effectively stimulate end-user demand. Therefore, the government should move away from universal subsidies and develop a dynamic incentive mechanism that links subsidy levels to actual energy-saving and carbon-reduction outcomes achieved through renovation. While the authors of previous studies, such as Gao et al., have used evolutionary game models to simulate the effects of dynamic government subsidies, our study further reveals the underlying psychological driver: a dynamic, performance-based approach can mitigate the government’s own perceived fiscal loss, thus making active regulation a more sustainable strategy [56]. In addition, since ESCOs are more responsive to subsidy incentives than owners, policies may initially place greater emphasis on the supply side in order to efficiently stimulate market vitality.
Shift from administrative regulation to market-oriented governance. The government should redirect its governance focus from relying solely on administrative oversight and penalties to building a fair and transparent market-oriented governance environment. While many studies have rightly emphasized the critical role of government regulatory oversight [24], our findings suggest that fostering market competition is a more cost-effective and sustainable endogenous force in constraining ESCOs’ opportunistic behavior and encouraging them to adopt high-quality renovation strategies. Establishing and promoting platforms for ESCO credit rating and project performance information disclosure can directly influence the market competition structure by increasing the competition coefficient θ. Leveraging market competition to guide ESCO behavior is more cost-effective and sustainable than relying solely on administrative regulation. In addition, a transparent information environment can effectively mitigate the psychological risks owners face due to information asymmetry. It significantly reduces their perceived losses, V(−P), related to unsatisfactory renovation outcomes, thereby strengthening their decision-making confidence. This, in turn, fundamentally increases their willingness for active participation and promotes a more positive response on the demand side.
(2) Focusing on long-term value to align corporate strategy with market credibility.
To acquire long-term competitive advantages in the green renovation market, ESCOs should move beyond a passive cost-control mindset and establish business strategies centered on long-term value. When making project decisions, ESCOs should not focus solely on short-term profits but instead conduct systematic evaluations that quantify a broad range of influencing factors. Through quantitative assessment, ESCOs can more clearly identify and prioritize projects that offer higher long-term comprehensive returns. This strategic approach ensures that high-quality renovation becomes a rational and deliberate choice, enabling ESCOs to internalize it as a core competitive strength rather than resorting to opportunistic behavior driven by short-term gains.
Treat building owner trust as a strategic investment and foster long-term trust relationships. The results of this study indicates that brand reputation is a key driving force behind ESCOs’ overall returns. Therefore, ESCOs should systematically invest resources to reduce owners’ perceived losses, V(−P), associated with unsatisfactory renovation outcomes. This can be achieved by providing transparent renovation information, reliable quality assurance, and comprehensive after-sales services. Such efforts help enhance brand value and increase owners’ willingness for active participation. As a result, ESCOs can secure a competitive advantage in an increasingly dynamic market, thereby stabilizing and expanding their market share and ensuring long-term competitiveness.
(3) Generating end-user demand by strengthening risk management and promoting awareness of green consumption.
Strengthen risk management to establish a foundation for participation. The results of our study confirm that owners’ high sensitivity to potential losses and their tendency to be risk-averse are primary barriers to participation in decision-making. Therefore, owners’ focus should not remain solely on economic subsidies but should also shift toward managing risks throughout the renovation process. Practical tools for risk management within the market may include requiring supervision by authoritative third-party agencies to ensure construction quality, adopting standardized contracts with clearly defined rights and responsibilities, and establishing clear channels for after-sales protection. These measures can help reduce uncertainty in the decision-making process and lay a solid foundation allowing owners to adopt active participation strategies.
Foster shared value recognition to stimulate intrinsic motivation. Risk management alone is not sufficient to generate strong participation enthusiasm; the fundamental driving force lies in full recognition of the value of renovation. This end requires collaborative efforts among governments, ESCOs, and owners. The government should promote a green and low-carbon consumption culture through policy advocacy and demonstration-based guidance. ESCOs should clearly present the long-term benefits of renovation in their service delivery in order to enhance owners’ perceived value, V(H1). Owners, in turn, should shift their understanding of green renovation from a short-term expenditure to a long-term investment in quality of life and asset value. Through multi-stakeholder collaboration, the intrinsic motivation of owners can be effectively activated.
7.3. Limitations and Future Works
Although this study yields several interesting findings, it also has certain limitations. On the one hand, although we have made efforts to ensure generalizability, due to data limitations, we need to include additional cases in future research to further explore stakeholder heterogeneity in green renovation (e.g., local and central governments, energy service companies of different sizes, individual owners, and associations). On the other hand, this study confirms the significant impact of psychological factors on stakeholders involved in green renovation. Future research may further explore these psychological dimensions by integrating theories such as mental accounting in order to gain a deeper understanding of how perception and cognition influence decision-making in this context.
Author Contributions
Conceptualization, Y.G., J.L. and J.Z.; methodology, Y.G.; software, Y.G.; validation, Y.G. and J.Z.; formal analysis, Y.G.; investigation, Y.G.; resources, J.L.; data curation, Y.G.; writing—original draft preparation, Y.G.; writing—review and editing, J.L., J.Z. and H.X.; visualization, Y.G.; supervision, Y.G. and J.Z. All authors have read and agreed to the published version of the manuscript.
Funding
This research is financially supported by the Chizhou University High level Talent Research Start up Fund (CZ2025YJRC21).
Data Availability Statement
The original contributions presented in this study are included in the article.
Conflicts of Interest
Author Jinjian Liu was employed by the company Shandong Transportation Engineering Supervision Consulting Co., Ltd. The remaining authors declare that the research was conducted in the absence of any commercial or financial relationships that could be construed as a potential conflict of interest.
References
- Yan, R.; Ma, M.; Pan, T. Estimating energy savings in Chinese residential buildings from 2001 to 2015: A decomposition analysis. J. Eng. Sci. Technol. Rev. 2017, 10, 105–133. [Google Scholar] [CrossRef]
- Niu, M.H.; Ji, Y.; Zhao, M.; Gu, J.F.; Li, A.A. A study on carbon emission calculation in operation stage of residential buildings based on micro electricity usage behavior: Three case studies in China. Build. Simul. 2024, 17, 147–164. [Google Scholar] [CrossRef]
- Liu, G.; Li, X.H.; Tan, Y.T.; Zhang, G.M. Building green retrofit in China: Policies, barriers and recommendations. Energy Policy 2020, 139, 111356. [Google Scholar] [CrossRef]
- Zhao, X.; Tan, Y.T.; Shen, L.Y.; Zhang, G.M.; Wang, J.H. Case-based reasoning approach for supporting building green retrofit decisions. Build. Environ. 2019, 160, 106210. [Google Scholar] [CrossRef]
- Huang, B.J.; Chen, Y.X.; McDowall, W.; Türkeli, S.; Bleischwitz, R.; Geng, Y. Embodied GHG emissions of building materials in Shanghai. J. Clean. Prod. 2019, 210, 777–785. [Google Scholar] [CrossRef]
- Ma, Z.J.; Cooper, P.; Daly, D.; Ledo, L. Existing building retrofits: Methodology and state-of-the-art. Energy Build. 2012, 55, 889–902. [Google Scholar] [CrossRef]
- Pombo, O.; Allacker, K.; Rivela, B.; Neila, J. Sustainability assessment of energy saving measures: A multi-criteria approach for residential buildings retrofitting-A case study of the Spanish housing stock. Energy Build. 2016, 116, 384–394. [Google Scholar] [CrossRef]
- Bertone, E.; Stewart, R.A.; Sahin, O.; Alam, M.; Zou, P.X.W.; Buntine, C.; Marshall, C. Guidelines, barriers and strategies for energy and water retrofits of public buildings. J. Clean. Prod. 2018, 174, 1064–1078. [Google Scholar] [CrossRef]
- Li, Y.L.; Wang, Z.; Liang, W.Q.; Yang, F.; Wu, G.B. Green renovation of existing public buildings in China: A synergy mechanism of state-owned enterprises based on evolutionary game theory. J. Clean. Prod. 2024, 434, 140454. [Google Scholar] [CrossRef]
- Li, T.J.; Li, Q.X. Virtual Reality in Historic Urban District Renovation for Enhancing Social and Environmental Sustainability: A Case of Tangzixiang in Anhui. Sustainability 2024, 16, 2665. [Google Scholar] [CrossRef]
- Lai, Y.P.; Li, Y.T.; Feng, X.Y.; Ma, T. Green retrofit of existing residential buildings in China: An investigation on residents’ perceptions. Energy Environ. 2022, 33, 332–353. [Google Scholar] [CrossRef]
- Jin, X.; Meng, C.; Wang, Q.Q.; Wei, J.S.; Zhang, L. A study of the green retrofit industry chain. Sustain. Cities Soc. 2014, 13, 143–147. [Google Scholar] [CrossRef]
- Asadi, E.; da Silva, M.G.; Antunes, C.H.; Dias, L.; Glicksman, L. Multi-objective optimization for building retrofit: A model using genetic algorithm and artificial neural network and an application. Energy Build. 2014, 81, 444–456. [Google Scholar] [CrossRef]
- Love, P.; Arthur Bullen, P. Toward the sustainable adaptation of existing facilities. Facilities 2009, 27, 357–367. [Google Scholar] [CrossRef]
- Liang, X.; Shen, G.Q.; Guo, L. Optimizing Incentive Policy of Energy-Efficiency Retrofit in Public Buildings: A Principal-Agent Model. Sustainability 2019, 11, 3442. [Google Scholar] [CrossRef]
- Papadakis, N.; Al Katsaprakakis, D. A Review of Energy Efficiency Interventions in Public Buildings. Energies 2023, 16, 6329. [Google Scholar] [CrossRef]
- Fuerst, F.; McAllister, P. Green Noise or Green Value? Measuring the Effects of Environmental Certification on Office Values. Real Estate Econ. 2011, 39, 45–69. [Google Scholar] [CrossRef]
- Carlson, K.; Pressnail, K.D. Value impacts of energy efficiency retrofits on commercial office buildings in Toronto, Canada. Energy Build. 2018, 162, 154–162. [Google Scholar] [CrossRef]
- He, Q.; Zhao, H.Y.; Shen, L.; Dong, L.Q.; Cheng, Y.; Xu, K. Factors Influencing Residents’ Intention toward Green Retrofitting of Existing Residential Buildings. Sustainability 2019, 11, 4246. [Google Scholar] [CrossRef]
- Le Cadre, H.; Jacquot, P.; Wan, C.; Alasseur, C. Peer-to-peer electricity market analysis: From variational to Generalized Nash Equilibrium. Eur. J. Oper. Res. 2020, 282, 753–771. [Google Scholar] [CrossRef]
- Yu, Y.Y.; Yin, S.; Zhang, A.J. Clean energy-based rural low carbon transformation considering the supply and demand of new energy under government participation: A three-participators game model. Energy Rep. 2022, 8, 12011–12025. [Google Scholar] [CrossRef]
- Tang, Y.; Hong, K.R.; Zou, Y.C.; Zhang, Y.W. Impact of Emotional Perceived Value on the Uncertain Evolution of the Housing Bubble. Mathematics 2021, 9, 1543. [Google Scholar] [CrossRef]
- Abedini, M.; Zhang, C.W. Performance Assessment of Concrete and Steel Material Models in LS-DYNA for Enhanced Numerical Simulation, A State of the Art Review. Arch. Comput. Methods Eng. 2021, 28, 2921–2942. [Google Scholar] [CrossRef]
- Feng, Q.; Chen, H.; Shi, X.J.; Wei, J. Stakeholder games in the evolution and development of green buildings in China: Government-led perspective. J. Clean. Prod. 2020, 275, 122895. [Google Scholar] [CrossRef]
- Yang, Y.H.; Sun, R.C.; Wang, Y.H.; Zhu, M.J.; Yang, P.S. Evolutionary analysis of resident groups’ intention to participate in green retrofit PPP projects of traditional apartment complexes. Sci. Rep. 2023, 13, 1039. [Google Scholar] [CrossRef] [PubMed]
- Kai-Ineman, D.; Tversky, A. Prospect theory: An analysis of decision under risk. Econometrica 1979, 47, 363–391. [Google Scholar] [CrossRef]
- Tversky, A.; Kahneman, D. Advances in prospect theory: Cumulative representation of uncertainty. J. Risk Uncertain. 1992, 5, 297–323. [Google Scholar] [CrossRef]
- Barberis, N.C. Thirty Years of Prospect Theory in Economics: A Review and Assessment. J. Econ. Perspect. 2013, 27, 173–195. [Google Scholar] [CrossRef]
- Liu, X.; Wang, Q.J.; Li, Z.R.; Jiang, S. An Evolutionary Game Analysis of Decision-Making and Interaction Mechanisms of Chinese Energy Enterprises, the Public, and the Government in Low-Carbon Development Based on Prospect Theory. Energies 2025, 18, 2041. [Google Scholar] [CrossRef]
- Lin, M.Q.; Liu, S.Q.; Luo, K.; Zhu, L.J. A prospect-theory evolutionary game model to analyse cooperation of long-term energy contracts. Energy 2025, 330, 136855. [Google Scholar] [CrossRef]
- Zhao, J.H.; Lan, T.; Rong, H.Y.; Liu, S.S. Exploring the evolutionary game of rumor control based on prospect theory. Neural Comput. Appl. 2023, 36, 9675–9685. [Google Scholar] [CrossRef]
- Wang, Y.Y.; Fan, R.G.; Du, K.; Lin, J.C.; Wang, D.X.; Wang, Y.T. Private charger installation game and its incentive mechanism considering prospect theory. Transp. Res. Part D-Transp. Environ. 2022, 113, 103508. [Google Scholar] [CrossRef]
- Ding, C.Y.J.; Liu, H.; Chen, Y.H.; Qiu, W.Y. Collaborative Innovation in Construction Supply Chain under Digital Construction: Evolutionary Game Analysis Based on Prospect Theory. Buildings 2024, 14, 2019. [Google Scholar] [CrossRef]
- Lützkendorf, T.; Lorenz, D. Capturing sustainability-related information for property valuation. Build. Res. Inf. 2011, 39, 256–273. [Google Scholar] [CrossRef]
- Filippidou, F.; Nieboer, N.; Visscher, H. Energy efficiency measures implemented in the Dutch non-profit housing sector. Energy Build. 2016, 132, 107–116. [Google Scholar] [CrossRef]
- Lee, M.-K.; Park, H.; Noh, J.; Painuly, J.P. Promoting energy efficiency financing and ESCOs in developing countries: Experiences from Korean ESCO business. J. Clean. Prod. 2003, 11, 651–657. [Google Scholar] [CrossRef]
- Berg, F.; Flyen, A.C.; Godbolt, Å.; Broström, T. User-driven energy efficiency in historic buildings: A review. J. Cult. Herit. 2017, 28, 188–195. [Google Scholar] [CrossRef]
- Martiskainen, M.; Kivimaa, P. Creating innovative zero carbon homes in the United Kingdom—Intermediaries and champions in building projects. Environ. Innov. Soc. Transit. 2018, 26, 15–31. [Google Scholar] [CrossRef]
- Prabatha, T.; Hewage, K.; Sadiq, R. An Energy Performance Contract Optimization Approach to Meet the Competing Stakeholder Expectations under Uncertainty: A Canadian Case Study. Sustainability 2022, 14, 4334. [Google Scholar] [CrossRef]
- Zheng, D.; Xu, H.J.; Ali, S.; Jia, Z.F.; Ma, X.J. Quadripartite Evolutionary Game of Incentives for Green Retrofitting of Historical Buildings. Sustainability 2024, 16, 10623. [Google Scholar] [CrossRef]
- Yin, Y.L.; Lin, Q.; Xiao, W.Y.; Yin, H. Impacts of Risk Allocation on Contractors’ Opportunistic Behavior: The Moderating Effect of Trust and Control. Sustainability 2020, 12, 9604. [Google Scholar] [CrossRef]
- Yang, X.D.; Zhang, J.Y.; Shen, G.Q.; Yan, Y.Y. Incentives for green retrofits: An evolutionary game analysis on Public-Private-Partnership reconstruction of buildings. J. Clean. Prod. 2019, 232, 1076–1092. [Google Scholar] [CrossRef]
- Ren, Y.; Yuan, P.W.; Dong, X.Q.; Liu, H.K. How to prevent “greenwash” in green retrofit process under PPP model: An evolutionary game theory-based analysis. Appl. Econ. 2025, 57, 1888–1908. [Google Scholar] [CrossRef]
- Zheng, S.N.; Zhou, Y.H.; Yuan, J.F.; Liu, R.; Lyu, P.D.; Han, Z.Z.; Zhang, C. Understanding Governments, ESCOs, and Clients’ Behavioral Strategies in Public Building Energy-Efficiency Renovation Based on Evolutionary Game Theory. J. Manag. Eng. 2025, 41, 4. [Google Scholar] [CrossRef]
- Zhang, W.; Zhang, X.X.; Wu, G.D. The network governance of urban renewal: A comparative analysis of two cities in China. Land Use Policy 2021, 106, 105448. [Google Scholar] [CrossRef]
- Fan, W.; Wang, S.; Gu, X.; Zhou, Z.Q.; Zhao, Y.; Huo, W.D. Evolutionary game analysis on industrial pollution control of local government in China. J. Environ. Manag. 2021, 298, 113499. [Google Scholar] [CrossRef]
- Su, Y.B. Multi-agent evolutionary game in the recycling utilization of construction waste. Sci. Total Environ. 2020, 738, 139826. [Google Scholar] [CrossRef]
- Wang, S.Y.; Lee, K.T.; Kim, J.H. Green Retrofitting Simulation for Sustainable Commercial Buildings in China Using a Proposed Multi-Agent Evolutionary Game. Sustainability 2022, 14, 7671. [Google Scholar] [CrossRef]
- Zhao, R.; Peng, L.; Zhao, Y.L.; Feng, Y.B. Coevolution mechanisms of stakeholder strategies in the green building technologies innovation ecosystem: An evolutionary game theory perspective. Environ. Impact Assess. Rev. 2024, 105, 107418. [Google Scholar] [CrossRef]
- Hu, X.Q.; Wang, R.N.; Wei, Y.Y.; Lin, H.W.; Gui, X.M. Evolutionary game analysis of the longitudinal integration of electronic health record based on prospect theory. Sci. Rep. 2025, 15, 20583. [Google Scholar] [CrossRef]
- Liu, Y.; Chen, H.Y.; Wang, X.J. Research on green renovations of existing public buildings based on a cloud model -TOPSIS method. J. Build. Eng. 2021, 34, 101930. [Google Scholar] [CrossRef]
- Li, Q.X.; Zhao, B.Y.; Wang, X.Y.; Yang, G.D.; Chang, Y.Y.; Chen, X.; Chen, B.M. Autonomous building material stock estimation using 3D modeling and multilayer perceptron. Sustain. Cities Soc. 2025, 130, 106522. [Google Scholar] [CrossRef]
- Yang, Q.X.; Xu, F.; Lu, W.Z.; Yang, Z.X.; Bai, Y.F.; Wen, B.H. Green renovation and multi-objective optimization of Tibetan courtyard dwellings. Build. Environ. 2025, 279, 113071. [Google Scholar] [CrossRef]
- He, L.H.; Chen, L.Y. The incentive effects of different government subsidy policies on green buildings. Renew. Sustain. Energy Rev. 2021, 135, 110123. [Google Scholar] [CrossRef]
- Teng, J.Y.; Xu, C.; Wang, W.; Wu, X.G. A system dynamics-based decision-making tool and strategy optimization simulation of green building development in China. Clean Technol. Environ. Policy 2018, 20, 1259–1270. [Google Scholar] [CrossRef]
- Gao, Y.; Jia, R.F.; Yao, Y.; Xu, J.H. Evolutionary Game Theory and the Simulation of Green Building Development Based on Dynamic Government Subsidies. Sustainability 2022, 14, 7294. [Google Scholar] [CrossRef]
- Fan, C.M.; Li, X.Y. Exploring effective incentive policies for sustainable development of green buildings in China: Based on evolutionary game theory and numerical simulation analysis. Eng. Constr. Archit. Manag. 2025, 32, 3326–3348. [Google Scholar] [CrossRef]
- Zhao, Y.X.; Ma, Y.H.; Zhong, F.L. Sustaining Green Building Incentives: A Tripartite Evolutionary Game Analysis and the Synergistic “Technology-Reputation-Policy” Pathway. Buildings 2025, 15, 1537. [Google Scholar] [CrossRef]
- Li, Y.; Zhang, J.L. Evolutionary Game Analysis of Low-Carbon Incentive Behaviour of Power Battery Recycling Based on Prospect Theory. Sustainability 2024, 16, 2793. [Google Scholar] [CrossRef]
- Wang, Y.L.; Wang, C.F.; Deng, X.P.; Wu, Z.Z. Evolutionary Game Analysis of the Utilization of Construction Waste Resources Based on Prospect Theory. Sustainability 2023, 15, 2577. [Google Scholar] [CrossRef]
- Meng, Q.F.; Liu, Y.Y.; Li, Z.; Wu, C.Z. Dynamic reward and penalty strategies of green building construction incentive: An evolutionary game theory-based analysis. Environ. Sci. Pollut. Res. 2021, 28, 44902–44915. [Google Scholar] [CrossRef]
- Liu, X.F.; Yue, J.J.; Luo, L.; Liu, C.; Zhu, T. Evolutionary analysis of nuclear wastewater collaborative governance based on prospect theory. J. Clean. Prod. 2024, 465, 142856. [Google Scholar] [CrossRef]
- Wu, Y.E.; Yin, A.R.; Zheng, Y.; Wang, X.Y.; Zhang, S.H. Research on the diffusion of electric vehicles based on dynamic games under the influence of environmental regulations. Energy Econ. 2025, 146, 108502. [Google Scholar] [CrossRef]
Disclaimer/Publisher’s Note: The statements, opinions and data contained in all publications are solely those of the individual author(s) and contributor(s) and not of MDPI and/or the editor(s). MDPI and/or the editor(s) disclaim responsibility for any injury to people or property resulting from any ideas, methods, instructions or products referred to in the content. |
© 2025 by the authors. Licensee MDPI, Basel, Switzerland. This article is an open access article distributed under the terms and conditions of the Creative Commons Attribution (CC BY) license (https://creativecommons.org/licenses/by/4.0/).