Article

Calculation Model for the Degree of Hydration and Strength Prediction in Basalt Fiber-Reinforced Lightweight Aggregate Concrete

1
School of Civil Engineering, Qingdao University of Technology, Qingdao 266520, China
2
Guangdong Huayi Sanitary Ware Industry Co., Ltd., Jiangmen 529331, China
3
Shandong Luqiao Group Co., Ltd., Jinan 250014, China
4
Engineering Research Center of Concrete Technology Under Marine Environment, Ministry of Education, Qingdao 266520, China
*
Authors to whom correspondence should be addressed.
These authors contributed equally to this work.
Buildings 2025, 15(15), 2699; https://doi.org/10.3390/buildings15152699
Submission received: 13 June 2025 / Revised: 9 July 2025 / Accepted: 28 July 2025 / Published: 31 July 2025

Abstract

The combined application of fibers and lightweight aggregates (LWAs) represents an effective approach to achieving high-strength, lightweight concrete. To enhance the predictability of the mechanical properties of fiber-reinforced lightweight aggregate concrete (LWAC), this study conducts an in-depth investigation into its hydration characteristics. In this study, high-strength LWAC was developed by incorporating low water absorption LWAs, various volume fractions of basalt fiber (BF) (0.1%, 0.2%, and 0.3%), and a ternary cementitious system consisting of 70% cement, 20% fly ash, and 10% silica fume. The hydration-related properties were evaluated through isothermal calorimetry test and high-temperature calcination test. The results indicate that incorporating 0.1–0.3% fibers into the cementitious system delays the early hydration process, with a reduced peak heat release rate and a delayed peak heat release time compared to the control group. However, fitting the cumulative heat release over a 72-h period using the Knudsen equation suggests that BF has a minor impact on the final degree of hydration, with the difference in maximum heat release not exceeding 3%. Additionally, the calculation model for the final degree of hydration in the ternary binding system was also revised based on the maximum heat release at different water-to-binder ratios. The results for chemically bound water content show that compared with the pre-wetted LWA group, under identical net water content conditions, the non-pre-wetted LWA group exhibits a significant reduction at three days, with a decrease of 28.8%; while under identical total water content conditions it shows maximum reduction at ninety days with a decrease of 5%. This indicates that pre-wetted LWAs help maintain an effective water-to-binder ratio and facilitate continuous advancement in long-term hydration reactions. Based on these results, influence coefficients related to LWAs for both final degree of hydration and hydration rate were integrated into calculation models for degrees of hydration. Ultimately, this study verified reliability of strength prediction models based on degrees of hydration.

1. Introduction

Under the impetus of structural innovation and sustainable development, the application demand for lightweight aggregate concrete (LWAC) has evolved from a sole focus on lightweight properties to encompassing high strength, multifunctionality, and overall performance optimization [1,2,3]. A substantial number of studies on LWAC have been published, as illustrated in Figure 1. These studies have confirmed that the inherently low elastic modulus of lightweight aggregates (LWA) remains the primary factor limiting the enhancement of concrete strength relative to traditional crushed stone aggregates [3,4]. Wu et al. [5] used five distinct types of LWAs to develop the high-strength LWAC with 28-days compressive strength ranging from 47 to 86 MPa and dry apparent densities varying between 1720 and 1940 kg/m3. The studies indicated that crushed shale aggregates, characterized by a dense shell structure and low water absorption rate, were the optimal choice for achieving superior mechanical properties. Additionally, the incorporation of fibers has been demonstrated to be an effective strategy for achieving enhanced strength in LWAC [5,6]. Among all fibers, BF has been recognized as a promising material due to its high elastic modulus and excellent chemical stability [7,8,9]. The work performed by Li et al. [10] showed that the incorporation of BF can effectively inhibit crack development and improve stiffness and flexural strength with volume fractions ranging from 0% to 0.2%. Saradar et al. [9] evaluated the effect of different contents of BF on the fresh and mechanical properties of LWAC. They found that adding BF with volume fractions from 0% to 0.5% enhanced tensile and flexural strength but decreased slump and compressive strength. Furthermore, research also emphasized that inadequate dispersion of fibers may introduce internal defects, which could weaken their mechanical properties [7,11]. Zhang et al. [12] observed BF bridging and agglomeration phenomena through scanning electron microscopy, recommending that the maximum BF content should be restricted to 0.3%.
The cement hydration process, which establishes the initial microstructure (including hydration product distribution and capillary porosity), plays a critical role in determining the performance of cementitious composites [13,14]. The study has proven that the degree of hydration (i.e., the extent to which cementitious materials react with water) is directly correlated with the mechanical properties of concrete [15]. A higher degree of hydration leads to a greater amount of hydration products (e.g., C-S-H gel, calcium hydroxide) being formed in the cement paste, resulting in a denser microstructure and consequently improved macroscopic mechanical performance. The degree of hydration is influenced by multiple factors, including supplementary cementitious materials (SCM), nano additives, the water-to-binder ratio (w/b), and curing conditions [16,17,18,19,20]. Research also indicates that the simultaneous hydration of silicate cement and the pozzolanic reaction of SCM (e.g., fly ash, silica fume) introduces additional complexity into the system [21]. Furthermore, for LWAC, due to the porous nature of LWA, pre-wetting treatment is typically necessary to achieve a saturated surface-dry condition [22]. On the one hand, this significantly enhances the workability of concrete; on the other hand, pre-wetted LWAs can release stored moisture in response to fluctuations in internal relative humidity, thereby facilitating sustained cement hydration [23,24,25]. Lyu et al. [26] indicated that the combined effect of internal curing and BF promotes further hydration of cement, resulting in a more compact interfacial transition zone between the fibers and the matrix, thereby significantly enhancing the mechanical properties of concrete. Consequently, the internal curing effect of pre-wetted LWAs emerges as a critical factor that governs the hydration process.
Currently, low water absorption LWAs are predominantly selected for the preparation of high-strength LWAC. However, these LWAs exhibit limited water storage capacity, and the extent to which their internal curing effect influences hydration performance remains insufficiently understood. In addition to aggregate selection, achieving high strength in LWAC also relies on the incorporation of SCM, chemical admixtures, and reinforcing materials such as fibers. These supplementary measures not only enhance mechanical properties but also significantly influence the hydration process of LWAC. Ja’e et al. [27] highlighted the improvement in mechanical properties arising from the synergistic effect of BF and SF. However, there remains a lack of strength development models for LWAC that are established from a hydration-based perspective. Therefore, the primary objective of this study is to conduct an in-depth investigation into the hydration behavior of fiber-reinforced LWAC and to develop a quantitative relationship model between the degree of hydration and mechanical properties. This will enable more accurate prediction of the strength development of LWAC, thereby facilitating the optimization of mix proportion design and performance assessment.
In this study, low water absorption shale ceramsite, BF, and a ternary cementitious system composed of cement, fly ash, and silica fume were utilized to prepare fiber-reinforced LWAC with a strength grade of 50 MPa. Hydration-related properties are investigated through tests for hydration heat and chemically bound water content. Furthermore, by incorporating the influence coefficient associated with LWAs, a calculation model for the degree of hydration in fiber-reinforced LWAC was developed. Based on this calculation model, it is possible to predict the compressive strength of LWAC as well as other mechanical properties associated with the degree of hydration (Figure 2).

2. Materials and Methods
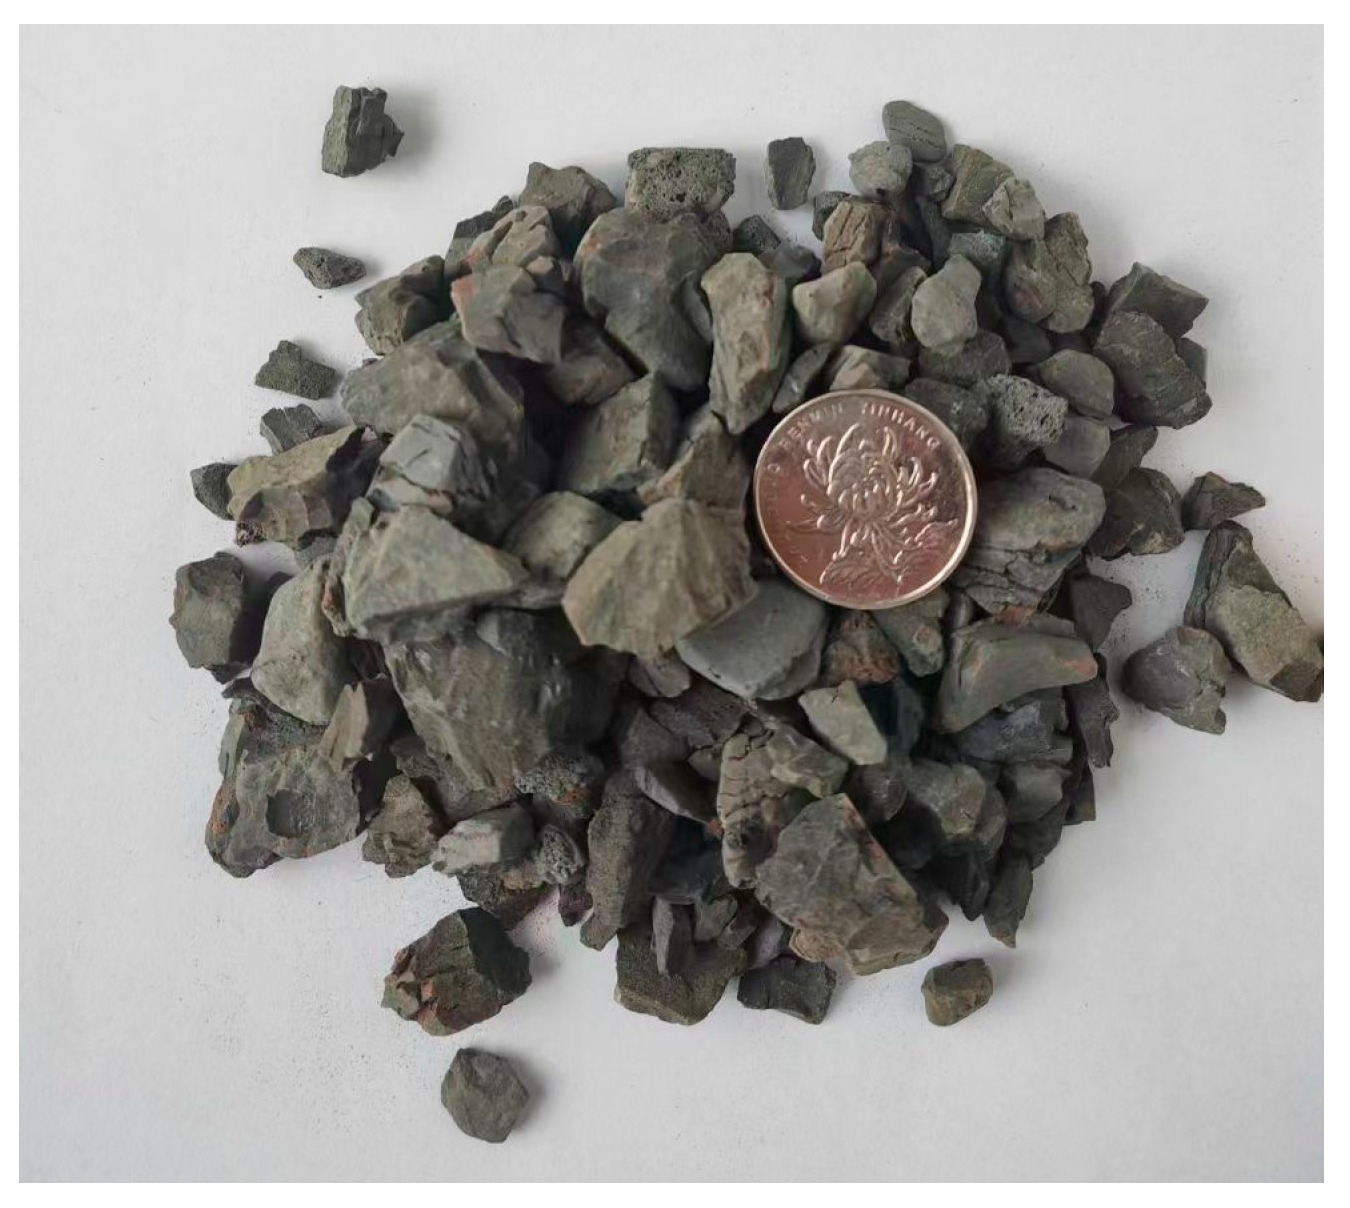
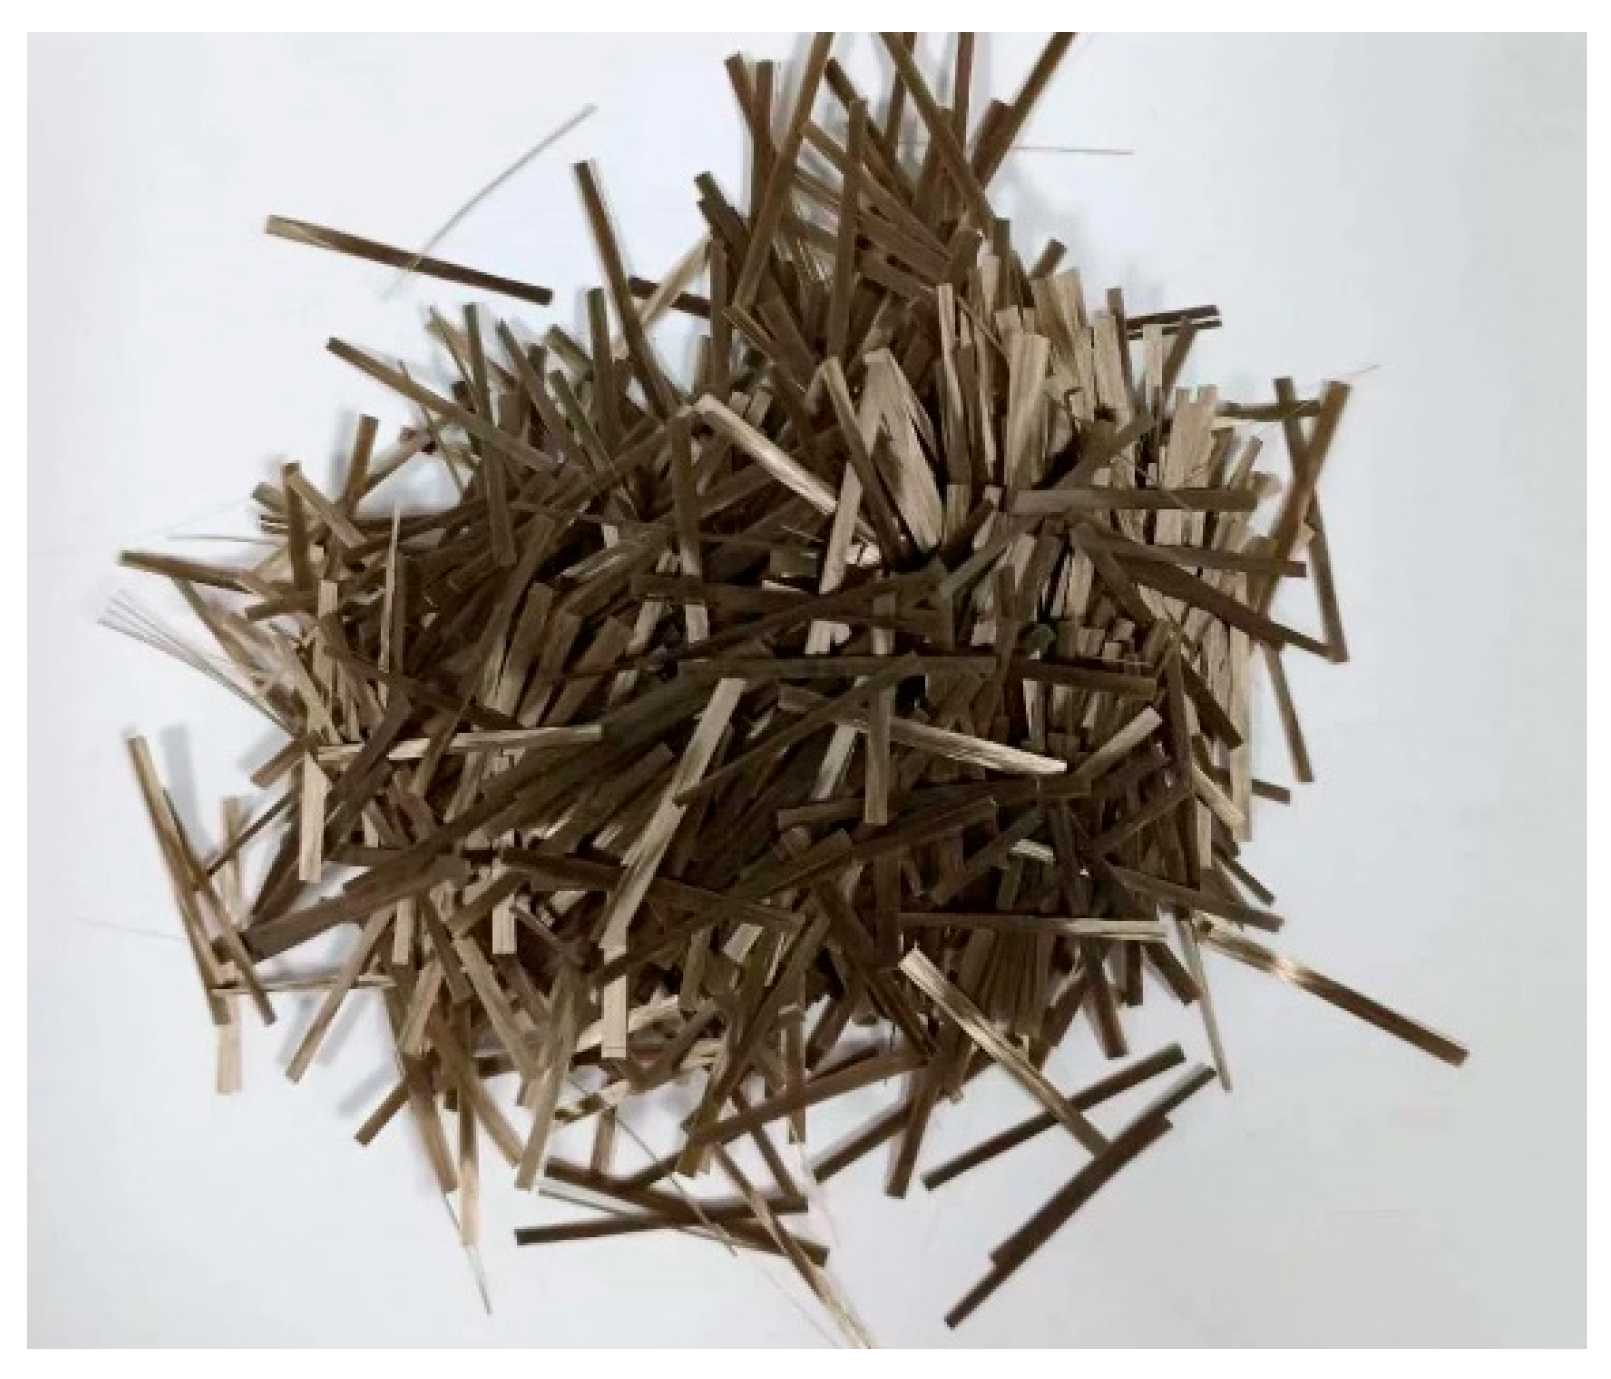
2.1. Materials

The binding materials used in this study included P.O. 42.5 ordinary Portland cement (OPC), fly ash (FA), and silica fume (SF). The chemical compositions and physical properties of these binding materials, as provided by the manufacturer, are summarized in Table 1. Crushed shale ceramsite of grade 900 was selected as LWAs. The properties of the LWAs, tested in accordance with Chinese standard GB/T 17431.1 [28], are summarized in Table 2. In addition, Figure 3, Figure 4 and Figure 5 illustrate the appearance, water absorption characteristics, and pore structure distribution (as tested by nuclear magnetic resonance) of the LWAs, respectively. Naturally graded river sand was employed as fine aggregate, and its properties are detailed in Table 3. The geometry and properties of the BF are summarized in Figure 6 and Table 4. Additionally, to improve the workability of LWAC and ensure uniform fiber distribution in fresh concrete, a polycarboxylate-based superplasticizer (SP) with a water-reducing rate of 30% was incorporated.

2.2. Mix Proportions and Test Methods

2.2.1. Mechanical Properties Test

In this study, the mix proportions of LWAC with a compressive strength grade of 50 MPa were determined using the absolute volume method in accordance with Chinese Standard JGJT 12-2019 [29], and are presented in Table 5. The total quantity of cementitious materials employed in the mixture amounts to 550 kg/m3. SF and FA were incorporated as cementitious material replacements, accounting for 10% and 20% of the cement weight, respectively. To achieve the target compressive strength, the net w/b was maintained at 0.28. The sand volume fraction was set to 40%. It is also noteworthy that the apparent density of the LWAs is used in the calculating of its dosage. Specimens were designated as LC50-BF0, LC50-BF0.1, LC50-BF0.2, and LC50-BF0.3, corresponding to fiber contents of 0%, 0.1%, 0.2% and 0.3%, respectively. To ensure pumpability, the SP content was adjusted to achieve a slump value of 180 ± 20 mm for all concrete mixtures. Slump tests were performed in accordance with Chinese Standard GB/T 50080-2016 [30] during the preparation of the concrete mixes.
Prior to the mixing process, LWAs that require pre-wetting were immersed in water for 1 h, subsequently maintained in a saturated surface-dry condition, and then set aside for subsequent use. An appropriate amount of cementitious materials and sand was used to disperse the BF through friction, facilitating their uniform incorporation in the subsequent mixing stage. During the mixing process, the remaining fine aggregates and cementitious materials were dry-mixed for 30 s. Then, the LWAs were added, and the mixture was stirred for 60 s. Next, the previously dispersed BF was evenly sprinkled into the mixture, followed by the addition of water and superplasticizer three times while stirring continuously for 120 s. After mixing, the fresh concrete was cast into molds and vibrated. Following coverage with plastic film and curing at room temperature for one day, all specimens were demolded and placed in a standard curing room maintained at 20 ± 2 °C and a relative humidity of ≥95% for continued curing until the designated testing age was achieved.
The specimens with dimensions of 100 mm × 100 mm × 100 mm were used to measure the cubic compressive strength in accordance with Chinese standard GB/T 50081-2019 [31]. Three replicate specimens were prepared for each concrete mixture, and measured at the ages of 3 d, 7 d, 28 d, 60 d, and 90 d, respectively. The dimension conversion factor was determined with reference to NWC.

2.2.2. Isothermal Calorimetry Test

The TAM Air eight-channel isothermal calorimeter was employed to measure the hydration heat release rate of cementitious materials at 20 °C. The mix proportions are detailed in Table 6. The fibers were first dry-mixed with the cementitious material to ensure their even dispersion, followed by the addition of water. After mixing, 5 g of paste (measurement error of ±0.01 g) was placed into the glass ampoule. Measurements were conducted immediately and continued for a duration of 72 h. The measured heat flow was normalized to the mass of the binder. The cumulative heat release was determined by integrating the heat flow curve.

2.2.3. High-Temperature Calcination Test

The chemically bound water content was determined using the high-temperature calcination method. The mix proportions are presented in Table 7. In group BF0-A, the LWA were pre-wetted for 1 h, whereas in groups BF0-B and BF0-C, no pre-wetting was applied. Three replicate specimens were prepared for each concrete mixture and measured at the ages of 3 d, 7 d, 28 d, 60 d, and 90 d, respectively. Samples were collected and crushed from three specific locations (interior, middle, and corner) of each specimen. Nine samples per group were then mixed, crushed, and meticulously processed to remove sand and gravel. Subsequently, the samples were sieved through a 150 μm sieve to ensure the complete removal of coarse particles. The samples were ground into powder, soaked in anhydrous ethanol for 48 h to terminate hydration, and subsequently dried at 105 °C until a constant weight was achieved to remove free water. Finally, after drying, the samples were sieved through an 80 μm sieve. Approximately 1 g of the dried powder (accurate to 0.0001 g) was weighed and placed in a crucible, which was then heated to 950 °C in a muffle furnace for 3 h to ensure complete decomposition of the hydrated products and release of chemically bound water. Following calcination, the samples were cooled in a dry environment and weighed using an analytical balance with an accuracy of 0.0001 g.
Determining the chemically bound water content requires subtracting the loss on ignition (LOI). LOI represents the percentage weight loss occurring after drying a cementitious material to constant weight at 105 °C, followed by calcination at approximately 950 °C. The calculation proceeds as follows:
L O I = m 105 m 950 / m 105
m 105 = m n + m b
m 950 = m b 1 L b
L b = f c × L c + f F A × L F A + f S F × L S F
where m105 °C represents the mass of the powder samples after drying at 105 °C, in g; m1000 °C represents the mass of the powder samples after drying at 950 °C, in g; mn represents the mass of chemically bound water, in g; mb represents the mass of cementitious materials in g; Lb represents the total LOI of cementitious materials; fc, fFA, fSF represents the mass fraction of OPC, FA and SF, respectively, in %; Lc, LFA, LSF represents the LOI of OPC, FA and SF, respectively.
Thus, the chemically bound water content (Wn) could be calculated by Equation (5).
W n = m n m 950 C = m b ( L O I L b ) / ( 1 L O I ) m b ( 1 L b ) = ( L O I L b ) ( 1 L O I ) ( 1 L b )

3. Results and Discussion

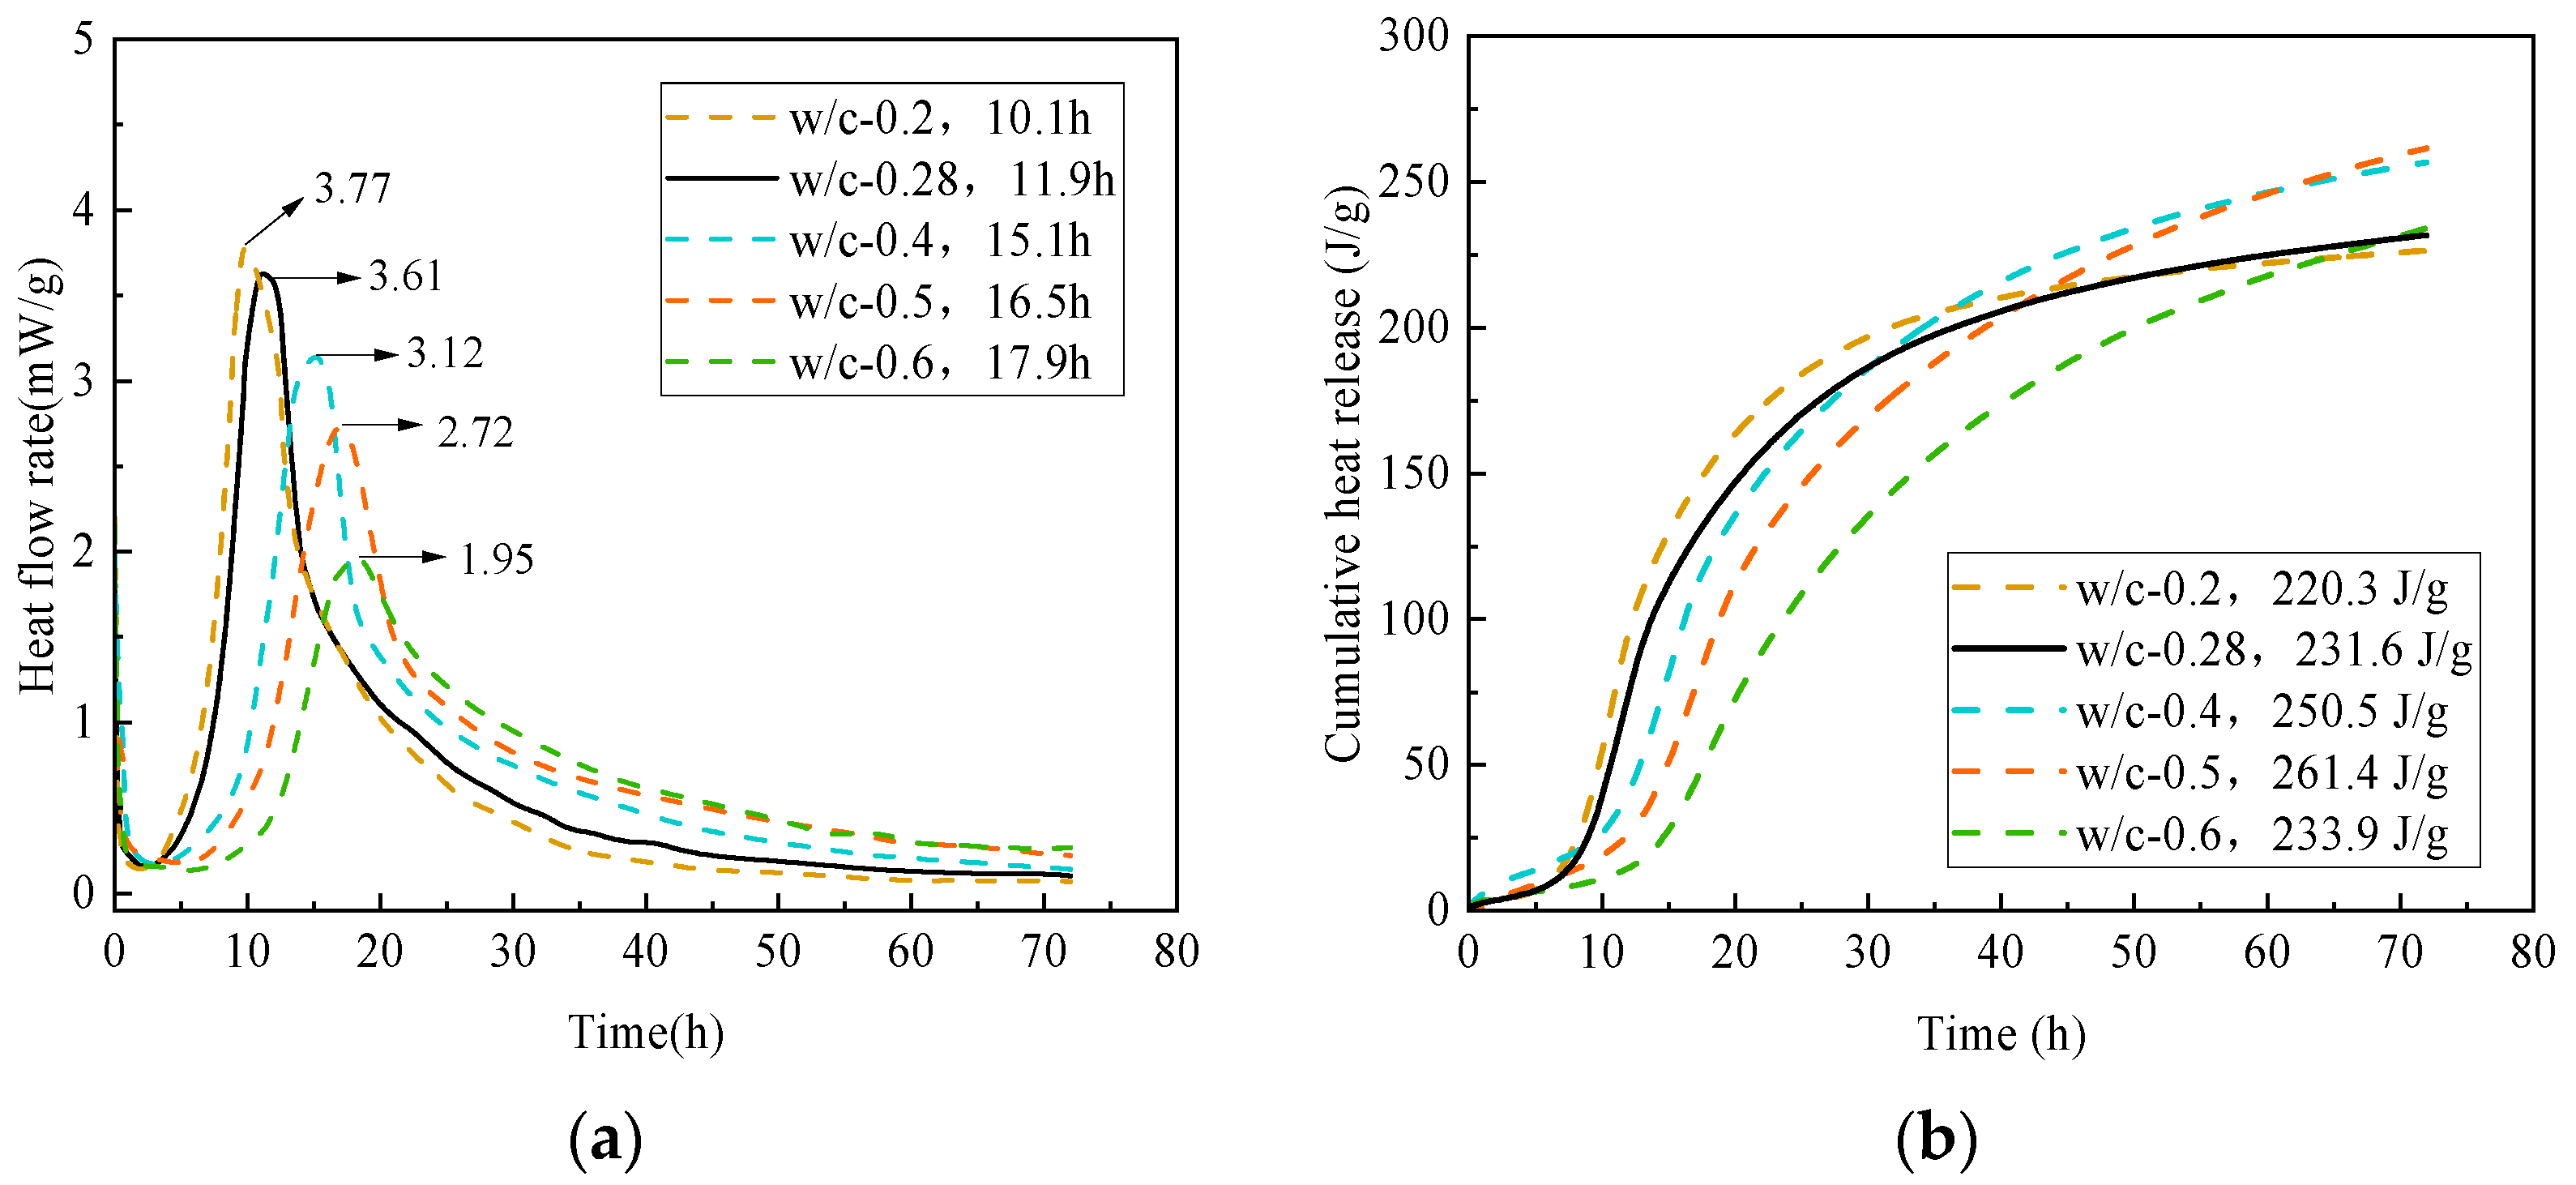
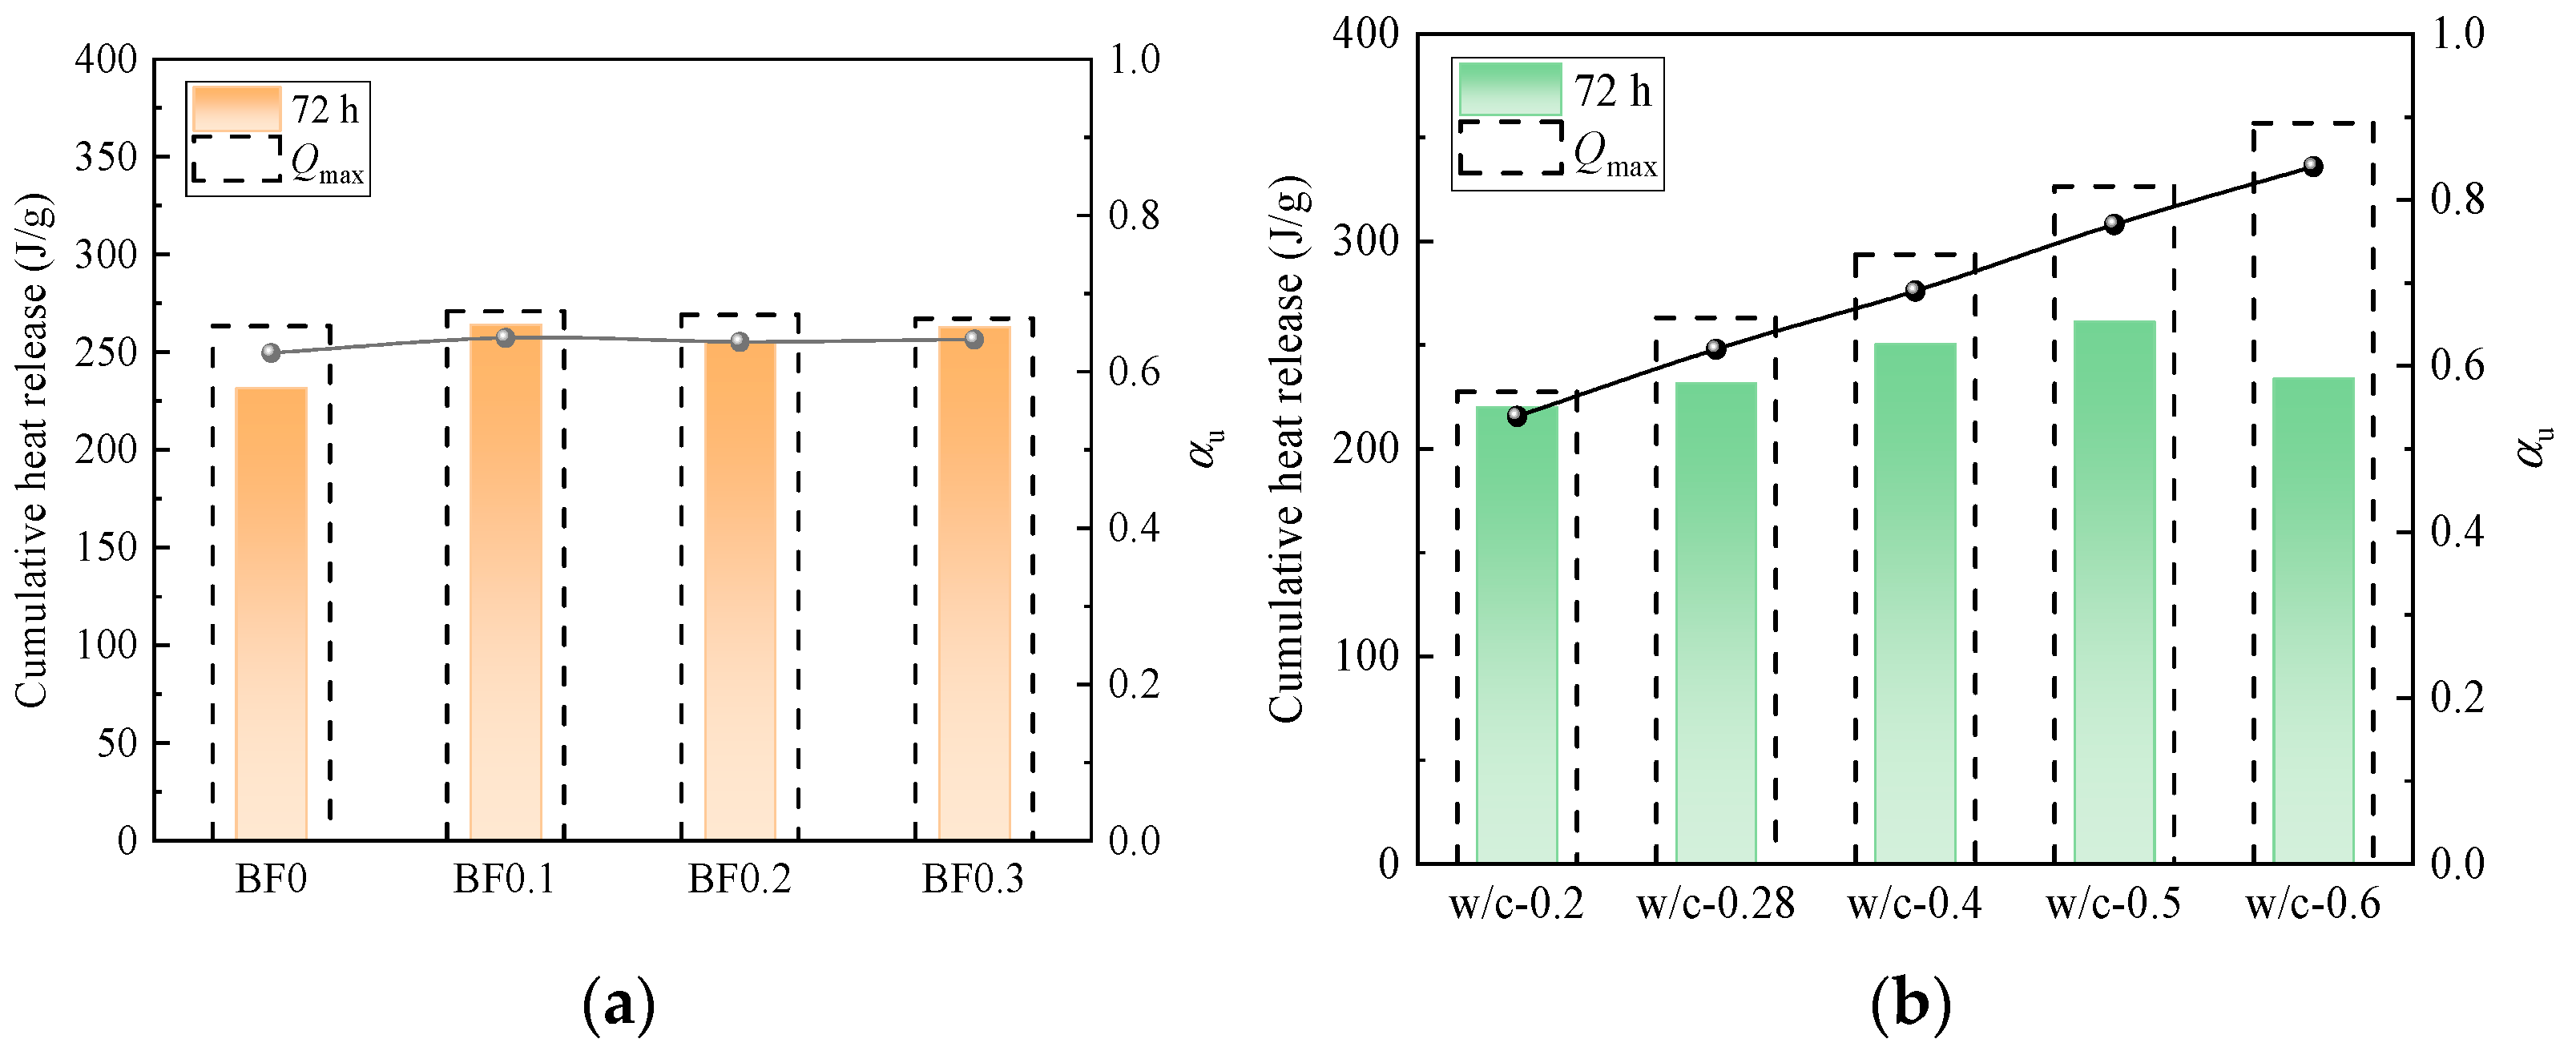
3.1. The Effect of w/b on Hydration Heat

Figure 7a,b illustrate the hydration heat release rate and the cumulative heat release over 72 h for cementitious systems with varying w/b, respectively. To enhance the strength of LWAC to a higher level, this study adopted a ternary cementitious system consisting of 80% cement, 20% FA, and 10% SF. The results showed that the reference group w/c-0.28 (BF0) reached its heat release peak at 11.9 h, with a maximum rate of 3.61 mW/g and a cumulative heat release of 231.6 J/g at 72 h.
Generally, different w/b significantly influence the hydration heat release rate by altering the reaction environment, such as pore structure and ion concentration. As illustrated in Figure 7a, a lower w/b resulted in earlier peak times of hydration heat release and higher peak values, indicating a greater degree of early hydration and a more rapid strength development. For instance, at a w/b of 0.2, the heat release peak occurred at 10.1 h with a rate of 3.77 mW/g. This is attributed to the reduced water content in low w/b, which increases the ion concentration in the pore solution, thereby accelerating the initial dissolution and hydration of cement particles. Conversely, an excess of water dilutes the pore solution, reducing ion concentration and slowing down the early hydration reaction rate. For instance, at a w/b of 0.6, the heat release peak occurred at 17.9 h with a maximum rate of only 1.95 mW/g.
Furthermore, the cumulative heat release curve indicated that, as the w/b ratio increased from 0.2 to 0.6, the cumulative heat release at 72 h initially rose and subsequently declined. For lower w/b (e.g., 0.2 and 0.28), the insufficient availability of water and space may constrain the hydration reaction. It was observed that the cumulative heat release at 72 h for a w/b of 0.2 was the lowest. For medium w/b (e.g., 0.4 and 0.5), optimal contact between water and particles, along with sufficient water availability, allowed the hydration reaction to proceed continuously. Notably, a water-to-binder ratio (w/b) of 0.5 yielded the highest cumulative heat release at 72 h. A higher w/b typically results in a more developed capillary pore structure and potentially extends the hydration reaction time. The experimental results indicated that, at a w/b ratio of 0.6, the cumulative heat release at 72 h was comparable to that observed at a w/b ratio of 0.28. Nevertheless, even following the conclusion of the test, the cumulative heat release curve continued to exhibit a pronounced upward trend. This indicates that in a high w/b system, the hydration process of cementitious materials lasts longer and is associated with a higher degree of hydration. This trend is consistent with previous research [32].

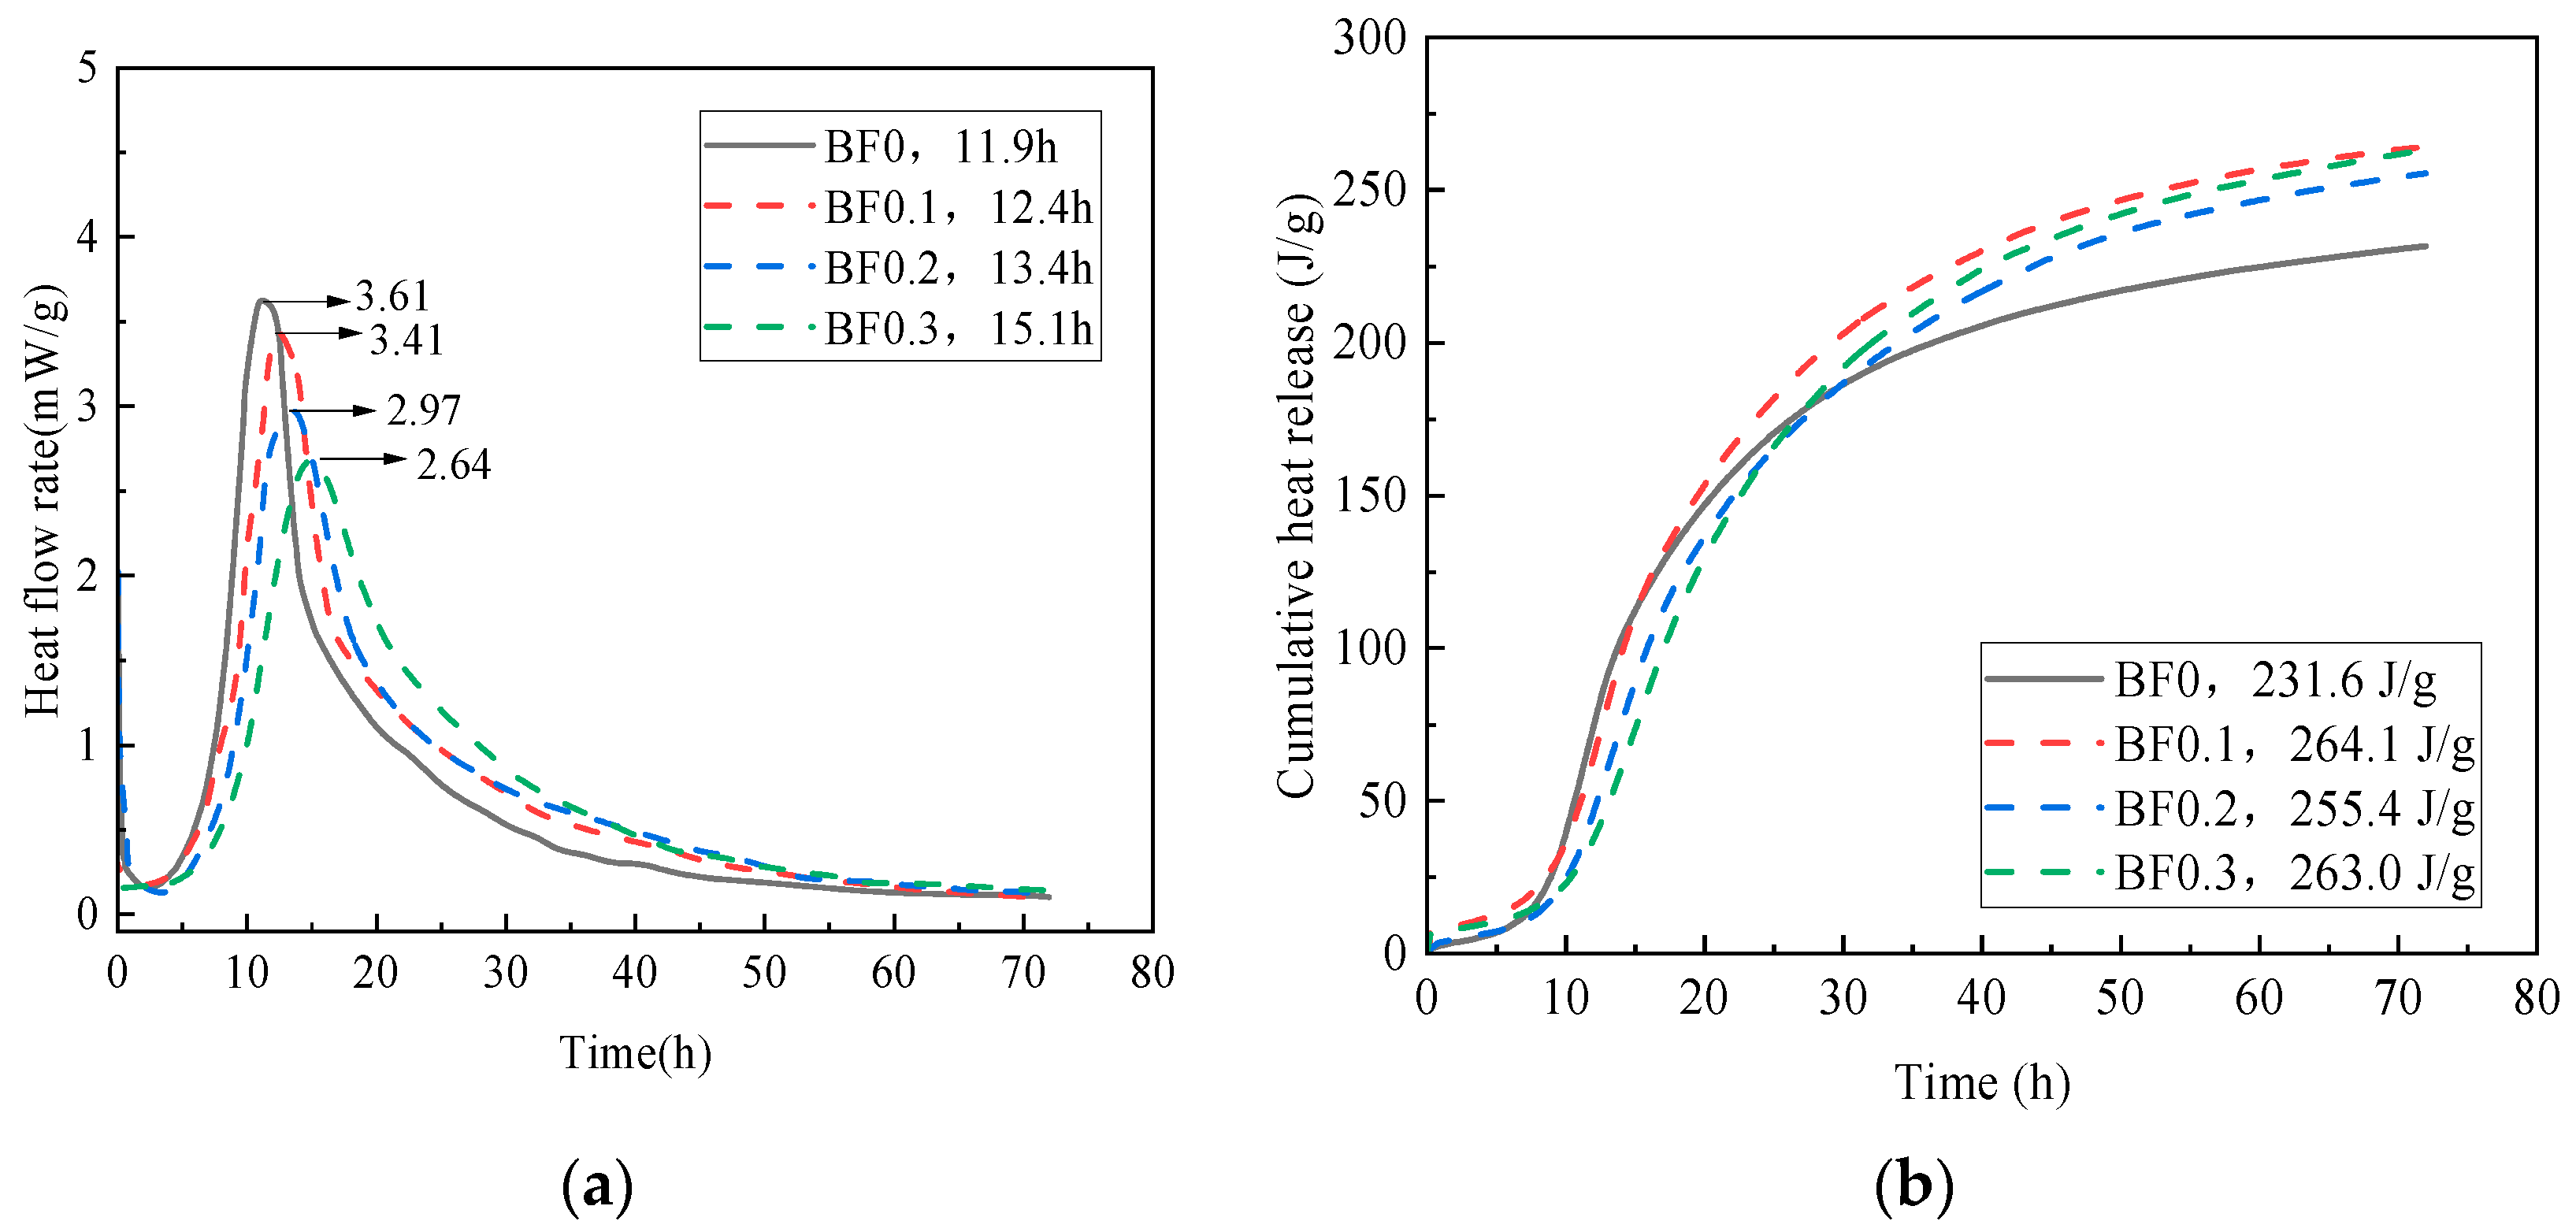
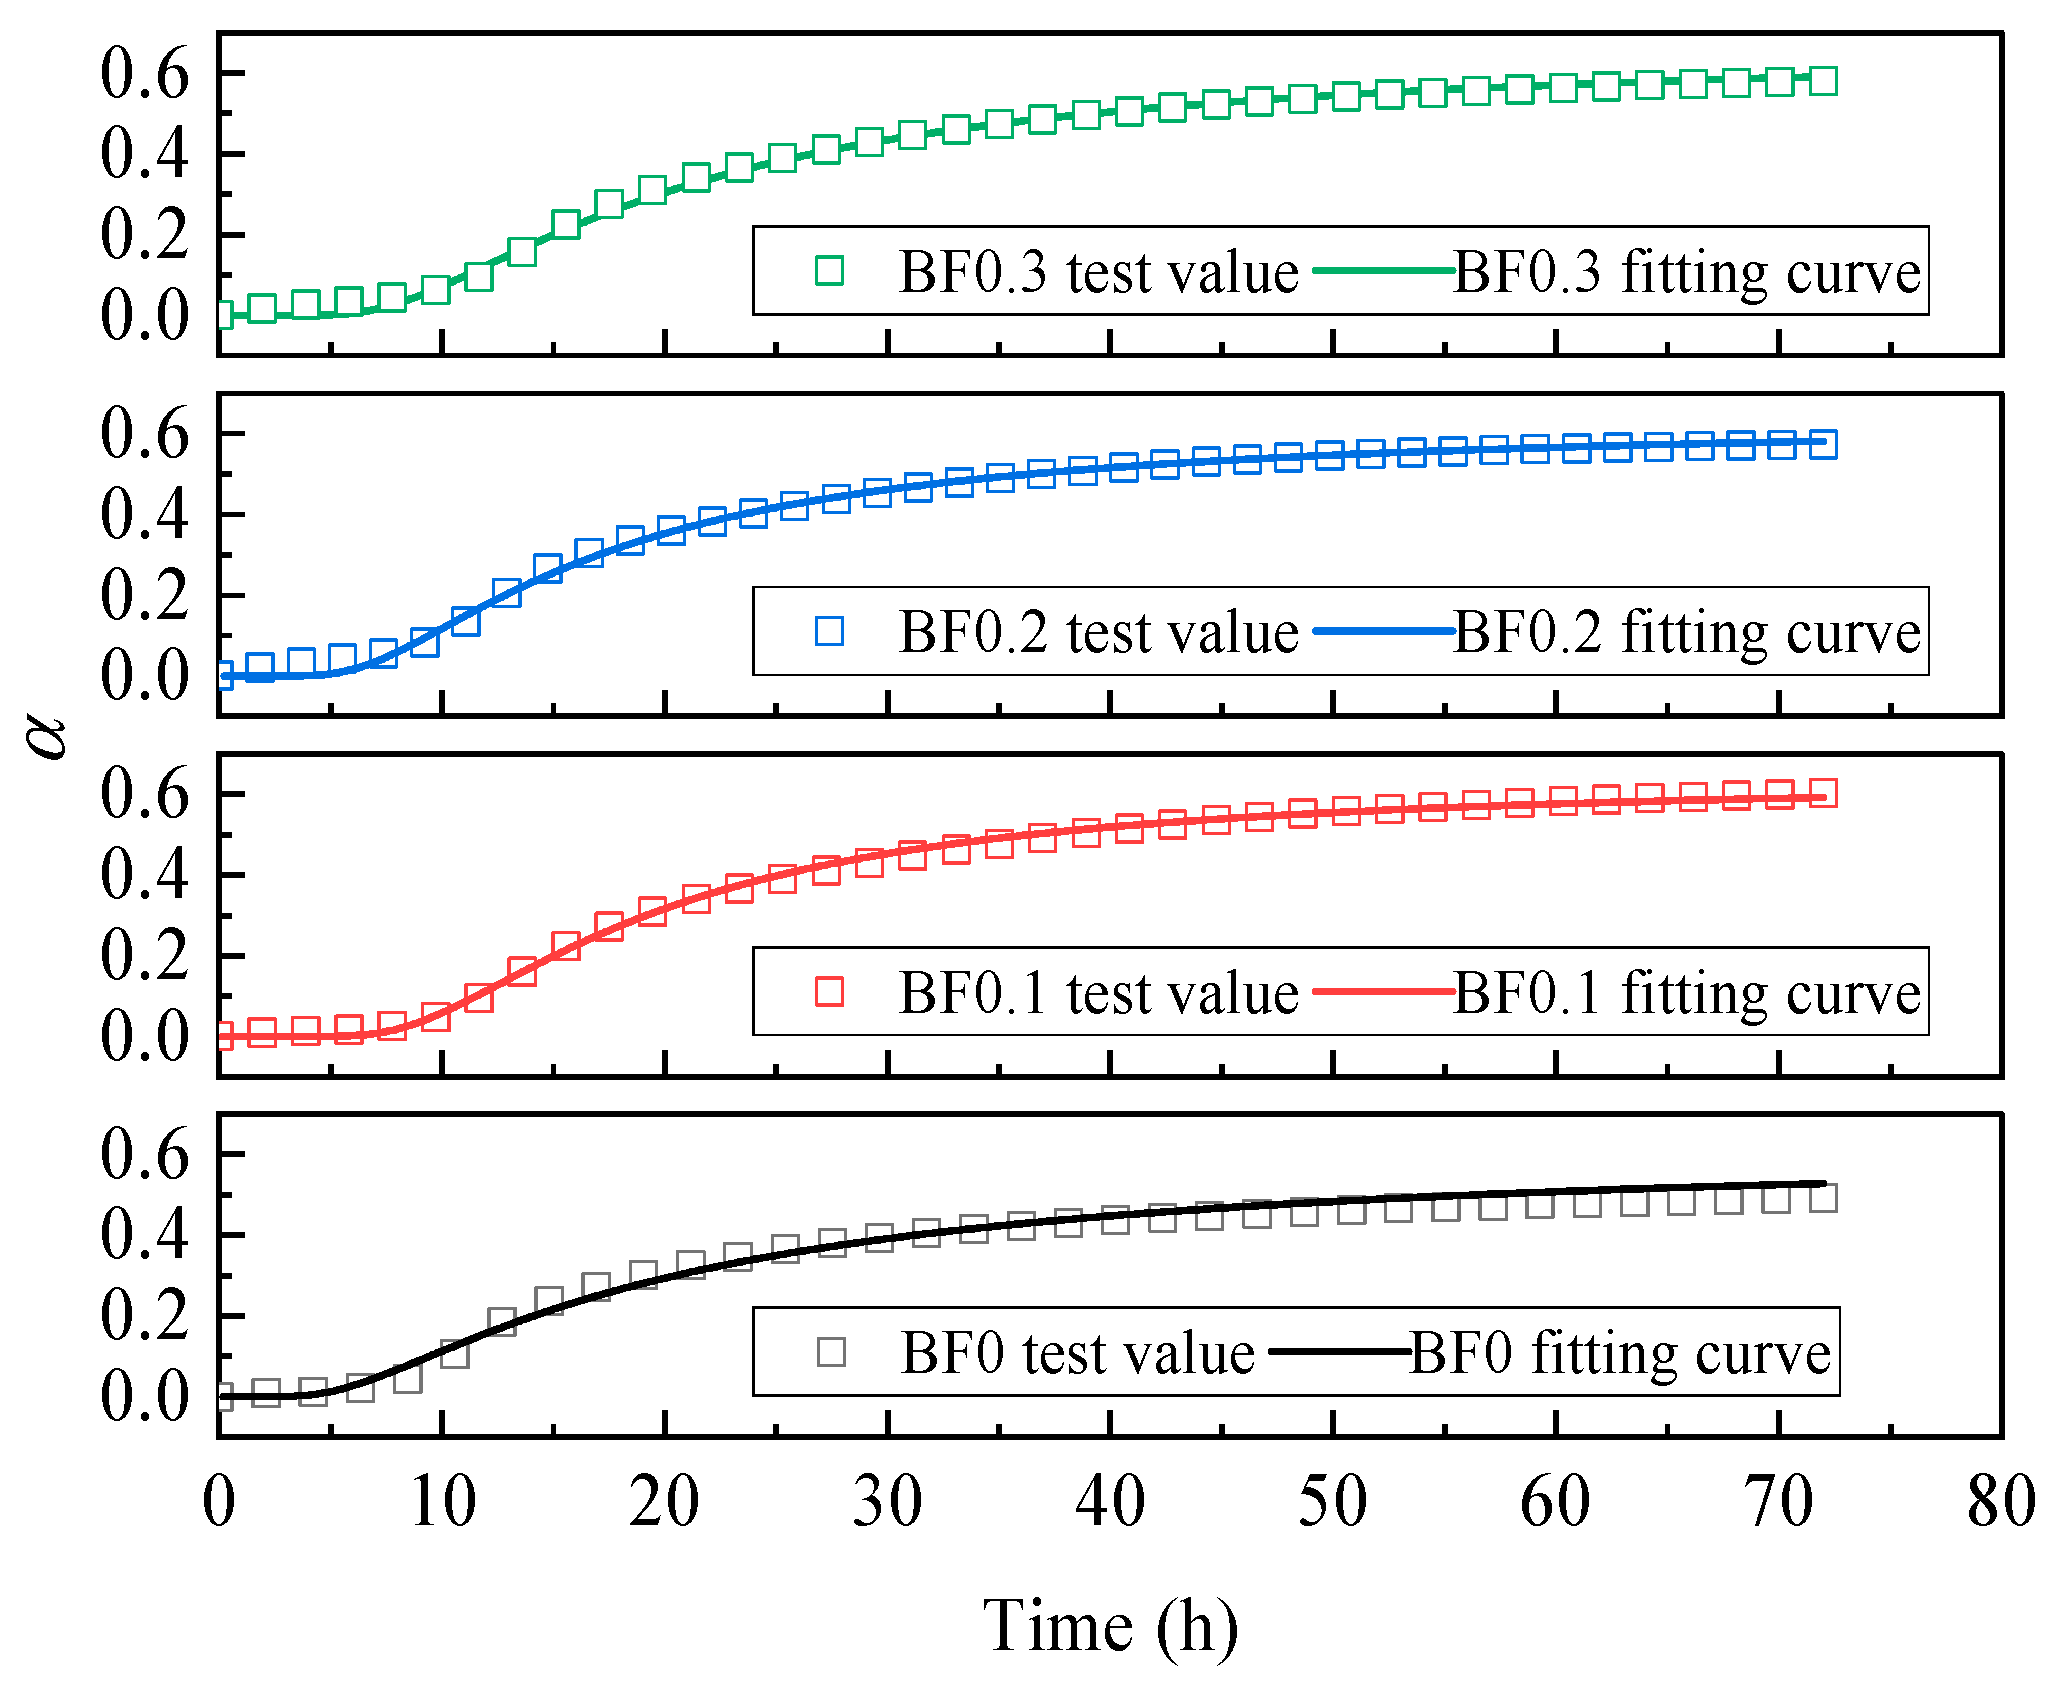
3.2. The Effect of Fibers on Hydration Heat

Figure 8a,b depict the hydration heat release rate and the cumulative heat release over 72 h for cementitious systems with varying BF content, respectively. It can be observed that as the fiber content increased, the heat release peak was delayed, and the rate of peak heat release decreased. Compared to the reference group, the heat release peak for a fiber content of 0.1% was delayed by approximately 0.8 h, with a rate of 3.41 mW/g, and decreased by approximately 5.5%. This may be attributed to the random distribution of BF hindering the contact between cement particles and water, restricting water and ion migration, thereby delaying the initial hydration process. As the fiber content increased, a more intricate network structure was formed, thereby enhancing the mechanical obstruction to pore connectivity. For a fiber content of 0.3%, the heat release peak was delayed by approximately 3.2 h, and the rate of peak heat release was significantly reduced by about 26.8% compared to the reference group.
Additionally, after reaching the heat release peak, it can be observed that as the fiber content increased, the decline in heat release rate slowed down. From the cumulative heat release curves, it was evident that the cumulative heat release at 72 h for all fiber groups exceeded that of the reference group. This can be attributed to the ability of BF to promote hydration during this particular stage. Although basalt fiber exhibits stable chemical properties and typically does not directly participate in the hydration reaction [33,34], the studies by Wang [35] and Zhang [36] indicate that the presence of basalt fiber facilitates the precipitation and formation of hydration products, thereby accelerating the hydration process. This provides evidence supporting the conclusion drawn from the present experiment.

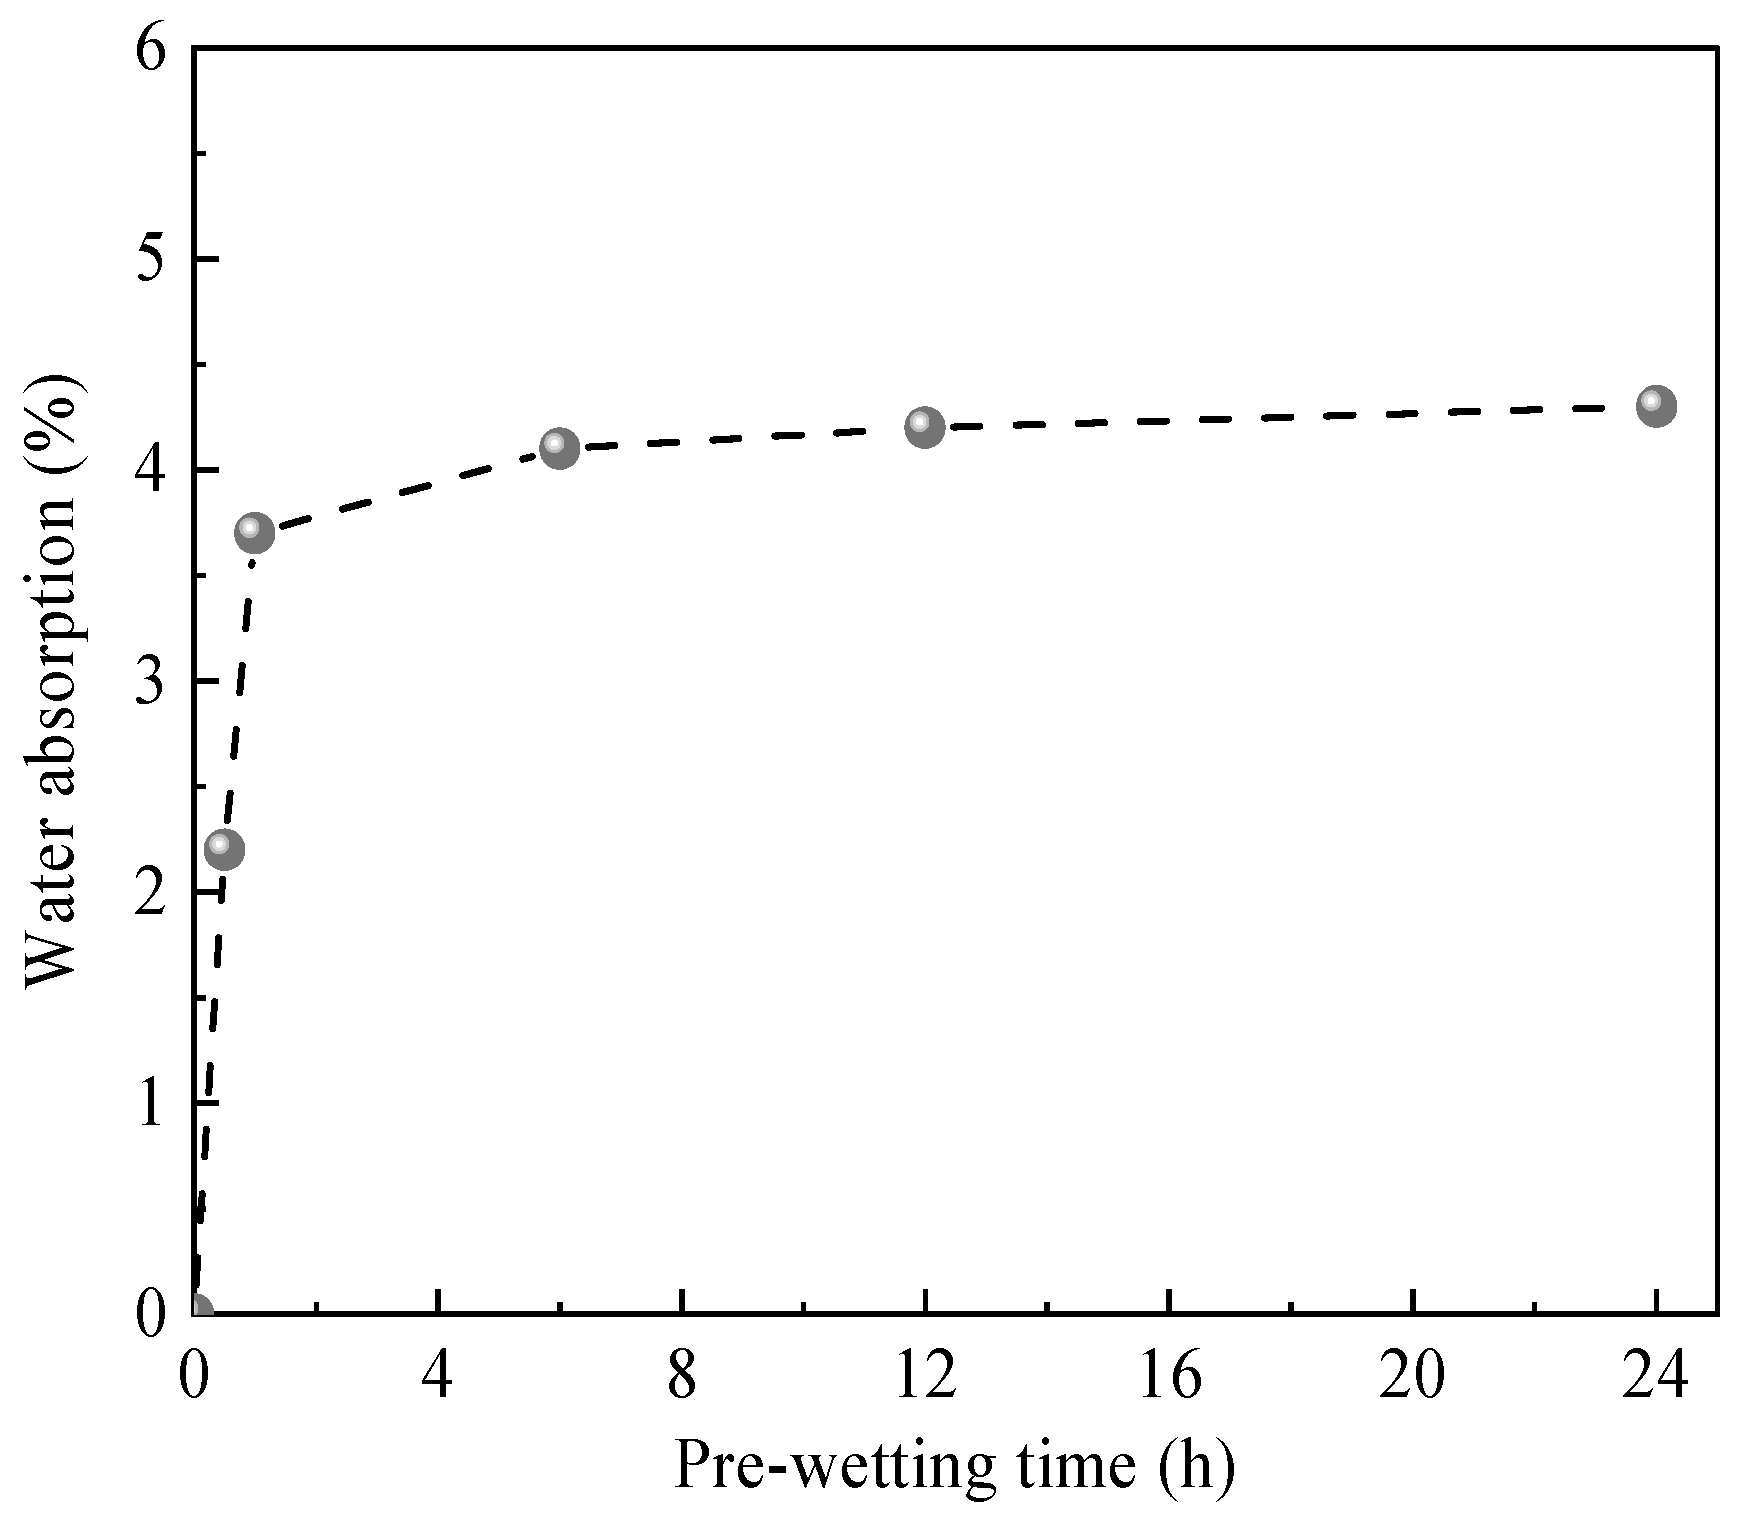
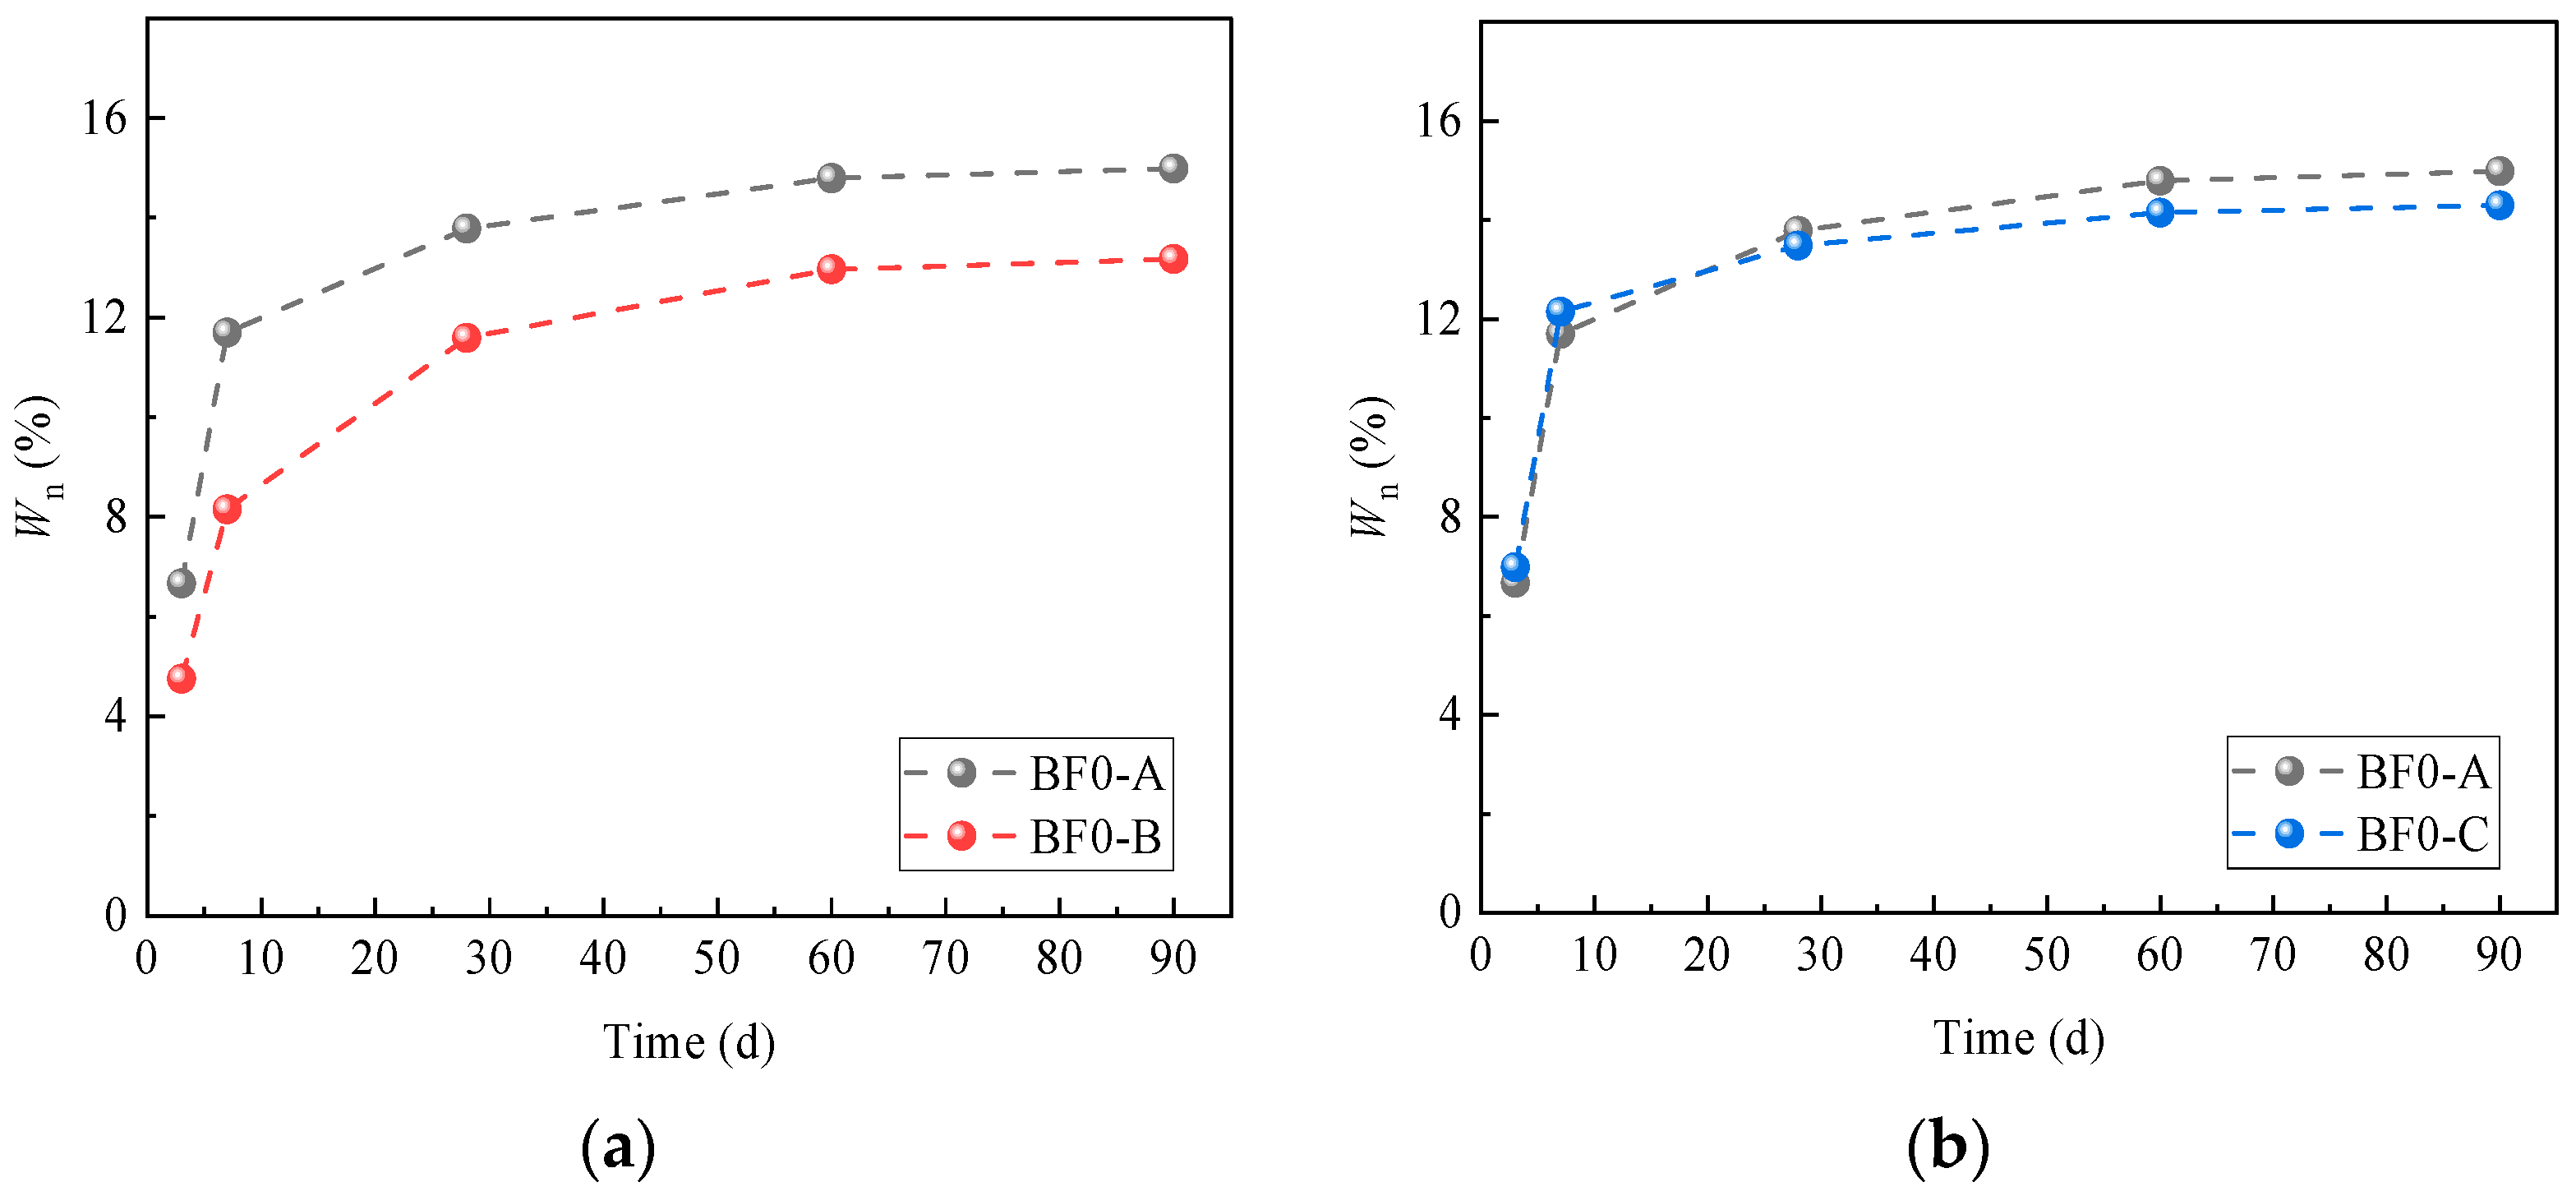
3.3. The Effect of Pre-Wetted LWA on Chemically Bound Water Content

Figure 9 shows the chemically bound water content of specimens at different ages. In Figure 9a, the net water content (excluding the water absorbed by LWA) is identical for BF0-A and BF0-B. As expected, throughout the entire testing period, the chemically bound water content in BF0-B remained significantly lower than that of BF0-A. Specifically, for BF0-B with non-pre-wetted LWAs, the chemically bound water content at 3 d was approximately 28.8% lower than that in BF0-A, while this difference narrowed to 12.1% at 90 d. This indicates that pre-wetting ensures that LWAs are saturated with water prior to mixing, whereas non-pre-wetted LWAs absorb water rapidly during mixing, reducing the effective water content in the early stages and thus inhibiting the early hydration process.
In Figure 9b, the BF0-C used non-pre-wetted LWAs but had an increased additional water content in concrete, ensuring that the total water dosage (the sum of net water content and water absorbed by the LWAs) was identical to that of the BF0-A. The chemically bound water content of both groups was comparable at 3 d and 7 d, indicating that the additional water could effectively compensate for the water absorbed by the LWAs. However, at 90 d, the chemically bound water content in BF0-C was approximately 95% of that in BF0-A, revealing a difference in long-term hydration behavior. As the water absorption rate of LWA in cement paste differs from that in water, the research conducted by Bello et al. [37] indicates that the water absorption rate of LWAs in cement paste is approximately 25% lower than that in water within the initial 2 h. This may result in different effective w/b for BF-A and BF-C, and also restrict the promoting effect of the internal curing of LWAs in BF-C on the long-term hydration performance. Regarding the 28-day compressive strength, BF-C was approximately 16% lower compared to BF-A. This further underscores the necessity of pre-wetting treatment for low water absorption LWAs. Overall, pre-wetted LWAs help maintain an effective w/b, with its primary advantage being the sustained progression of long-term hydration rather than reliance on significant internal curing effects.

4. Calculation Model for the Degree of Hydration

4.1. The Final Degree of Hydration

The degree of hydration in cementitious material at a specific time can be determined by Equation (6):
α c = Q t Q u
where Q(t) represents the cumulative heat release of the cementitious material at time t, determined by isothermal calorimetry tests, in J/g; Qu represents the theoretical heat release on complete hydration of the cementitious material, in J/g.
The theoretical heat release per unit mass of cement can be calculated using Equation (7), which was proposed by Schindler [38].
Q c , u = 500 f C 3 S + 260 f C 2 S + 866 f C 3 A + 420 f C 4 A F + 624 f S O 3 + 1186 f F r e e C a o + 850 f M g O
where fi denotes the mass fractions of component i in cement. Based on Table 1, calculations reveal that the theoretical heat release for cement is 462.23 J/g.
For mixtures containing FA and SF, the theoretical heat release per unit mass of cementitious materials is calculated as follows [39]:
Q b , u = Q c , u + 209 f F A + 565 f S F
where fi denotes the mass fractions of component i in the cementitious system. Based on the mix proportion calculation, the theoretical heat release of the mixture composed of 70% cement, 20% FA and 10% SF during complete hydration is 421.86 J/g.
Research indicated [19] that the w/b significantly influences the later-stage hydration of cementitious materials. Especially in systems incorporating mineral admixtures, the late-stage hydration reaction of cementitious materials is constrained by limited available space. Consequently, the final degree of hydration (αu) needs to be introduced to describe the actual final state of hydration, and it can be expressed as:
α u = Q max Q u
where Qmax denotes the maximum heat release of the cementitious material, in J/g.
The cumulative heat release curves obtained in this experiment indicated a continuing upward trend at 72 h of hydration. Moreover, the higher the water-binder ratio, the more obvious the increasing trend of the cumulative heat release curve. To determine the maximum heat release for different cementitious systems, this study performed linear fitting of the cumulative heat release data within 72 h using the hydration kinetics model proposed by Knudsen [40], the model formula is as follows:
1 Q t = 1 Q max + t 50 Q max t t 0
where t0 denotes the time at the end of the induction period, in h; t50 indicates the hydration half-life, defined as the time required for the heat release of the cementitious system to reach 50% of the maximum heat release after contact with water, in h.
The Knudsen equation and the maximum cumulative heat release of cementitious system are shown in Table 8. The fitting results indicated that the coefficient of determination (R2) for the Knudsen equation is consistently greater than 0.95, demonstrating a high degree of correlation in the fitted model. Furthermore, the comparison of the maximum heat release for different cementitious system are shown in Figure 10. The results indicated that within the BF content range of 0 to 0.3%, the difference in the maximum heat release of the cementitious system does not exceed 3%. This suggests that the impact of BF on the maximum heat release remains minimal.
It can also be observed from Figure 10b that the w/b emerges as a critical factor influencing the maximum heat release of the cementitious system. Based on the pure cement system, Mills [41] established a relationship between the ultimate degree of hydration (αu) and the water-cement ratio (w/c):
α u = 1.031 w / c 0.194 + w / c
Schindler et al. [38] took into account the influence of fly ash (FA), improved the above model, and established a calculation model for the ultimate hydration degree of the cement-fly ash system:
α u = 1.031 w / b 0.194 + w / b + 0.50 f F A
where fFA represents the mass fractions of fly ash in the cementitious materials.
Luzio et al. [42] demonstrated that the incorporation of silica fume (SF) decreased the final degree of hydration and proposed a calculation model for the cement-silica fume system:
α u = 1.031 w / b 0.279 s / b α s 0.194 + w / b
α s = β S F min 1 , min 0.16 , 0.4 w / b s / b
where s/b represents the mass ratio of SF to cementitious materials; αs represents the ultimate reaction extent of SF; βSF represents the mass fractions of SiO2 in SF.
As illustrated in Figure 11, the final degree of hydration for various w/b cementitious systems, as derived from the Knudsen equation, was compared with the calculated values obtained from Equations (11)–(13). It was evident that the final degree of hydration for the ternary cementitious system used in this study differs significantly from the calculation models for pure cement and binary cementitious systems. Consequently, based on existing calculation models, the calculation model for final degree of hydration on cement-fly ash-silica fume ternary cementitious system was revised, as shown in Equation (15). Here, M and N represent the influence coefficients of SF and FA, respectively. Through fitting, M and N were determined to be 0.312 and 0.407, respectively.
α u = 1.031 w / b M s / b α s 0.194 + w / b + N f / b
Under the selected fiber content in this work, the influence of BF on the final degree of hydration was neglected, while only their effect on the hydration rate was taken into account. The degree of hydration for cementitious systems with varying BF content was simulated using Equation (16), and the results are presented in Figure 12. The relevant parameters are summarized in Table 9.
α = α u exp a t b
where a and b are fitting parameters.

4.2. The Influence Coefficient of Pre-Wetted LWA

Based on the test results for the chemically bound water content at different ages and the total chemically bound water content after complete hydration of the cementitious system, the degree of hydration for the specimens can be further quantified using Equation (17).
α w = W n t W u
The chemically bound water content resulting from the complete hydration of cement can be determined using the formula below:
W c , u = 0.209 f C 2 S + 0.236 f C 3 S + 0.666 f C 3 A + 0.37 f C 4 A F
where fi represents the mass fractions of component i in cement.
In this work, the chemically bound water primarily stemmed from two sources: the hydration reaction of the Portland cement clinker components and the secondary hydration reactions involving active SiO2 and Al2O3 in FA and SF with the hydration products of the cement clinker. Since the pozzolanic reaction of SF only recombines the chemically bound water initially present in CH into C-S-H, the theoretical chemically bound water content in the ternary cementitious system is generated by the hydration of cement and FA [43,44].
The reaction degree of FA is generally below 50% if cured under normal conditions, depending on the replacement level [19,45]. The chemically bound water content after the complete hydration of FA could be calculated by the following formula:
W F A , u = 1.236 f A γ A
where fA represents the mass fraction of Al2O3 in FA, %; γA is the reaction coefficient of Al2O3, which is taken as 0.5 in this paper.
Based on the chemical composition, the chemically bound water content upon complete hydration for the cement and FA used in this study was determined to be 0.262 and 0.156, respectively. Consequently, for the ternary cementitious system comprising cement, FA, and SF utilized in this study, the chemically bound water content upon complete hydration was calculated to be 0.215.
According to the water release mechanism of LWAs [24], the water release effect of low water absorption LWAs can be attributed to maintaining an effective water-to-binder ratio during the humidity saturation period of concrete, releasing curing water during the humidity decline phase to promote hydration progression, and thereby enhancing the final degree of hydration. Moreover, in contrast to the “rapid and concentrated” hydration behavior of the paste, the incorporation of aggregates, particularly coarse aggregates, significantly modifies the hydration thermodynamics, transport properties, and microstructural development, leading to a “delayed yet sustained” hydration characteristic in concrete [13]. In this context, this study proposed two influence coefficients associated with LWAs: β1, which corresponds to the final degree of hydration, and β2, which pertains to the hydration rate. These coefficients were used to adjust the calculation model for the degree of hydration of LWAC, as presented in Equation (20). The fitting results are presented in Figure 13, and the relevant parameters are summarized in Table 10.
α = β 1 α u exp β 2 a t b
This study does not consider the impact of fibers on the water release behavior of LWAs. Therefore, the degree of hydration for fiber-reinforced LWAC could be simulated, as illustrated in Figure 14.

4.3. Prediction of Compressive Strength

For a given concrete, all internal and external influencing factors ultimately affect its degree of hydration [46]. Consequently, a relationship can be established between the degree of hydration in concrete and its mechanical properties [47], as shown in Equation (21).
f c u = η f c u , 28 α α 0 α u α 0 μ
where α0 is the degree of hydration for concrete at the time of setting; η represents the growth coefficient of the compressive strength after 28 days; μ is the fitting parameter.
In another study conducted by the author on self-shrinkage, the early shrinkage and expansion deformation of the fiber-reinforced LWAC used in this paper were measured using a non-contact concrete shrinkage and expansion deformation tester. The time corresponding to the end of expansion was defined as the setting time. For specimens with BF content ranging from 0 to 0.3%, the setting times were determined to be 12 h, 10 h, 13 h, and 14 h, respectively, with the corresponding degrees of hydration at setting being 0.172, 0.089, 0.146, and 0.115.
The compressive strength of fiber-reinforced LWAC was simulated based on Equation (21), and the results are presented in Figure 15. The relevant parameters are summarized in Table 11. The fitting results were satisfactory, with all determination coefficients exceeding 0.85, thereby validating the rationality of the compressive strength prediction model based on the degree of hydration. Therefore, it can be further inferred that by employing this method, not only can the compressive strength of LWAC at any age be predicted, but also other mechanical properties related to the degree of hydration can be estimated.

5. Conclusions

This paper focused on investigating the hydration-related properties of fiber-reinforced LWAC, which incorporates a ternary cementitious system, and developed a calculation model for the degree of hydration of the resulting concrete. The following conclusions can be drawn:
(1)
The results of isothermal calorimetry tests indicated that specimens containing BF exhibited a delayed heat release peak and a lower rate of heat release peak compared to the reference group. This suggests that during the early hydration stage, the mechanical obstruction of fibers to pore connectivity significantly affects the rate of heat release in the cementitious system. However, the fitting results of the Knudsen hydration kinetics model revealed that the effect of fibers on the maximum heat release was minimal, as the maximum heat release values of the BF0–BF0.3 cementitious systems varied by no more than 3%.
(2)
The results of chemically bound water content tests indicated that, under identical net water content conditions, the specimens with pre-wetted LWAs were consistently higher than those of non-pre-wetted LWAs at all ages. Under identical total water content conditions, the long-term hydration performance of non-pre-wetted specimens was inferior to that of pre-wetted specimens. This suggests that pre-wetting treatment of low-water-absorption LWAs can contribute to maintaining an effective water-to-binder ratio and sustaining the progression of long-term hydration.
(3)
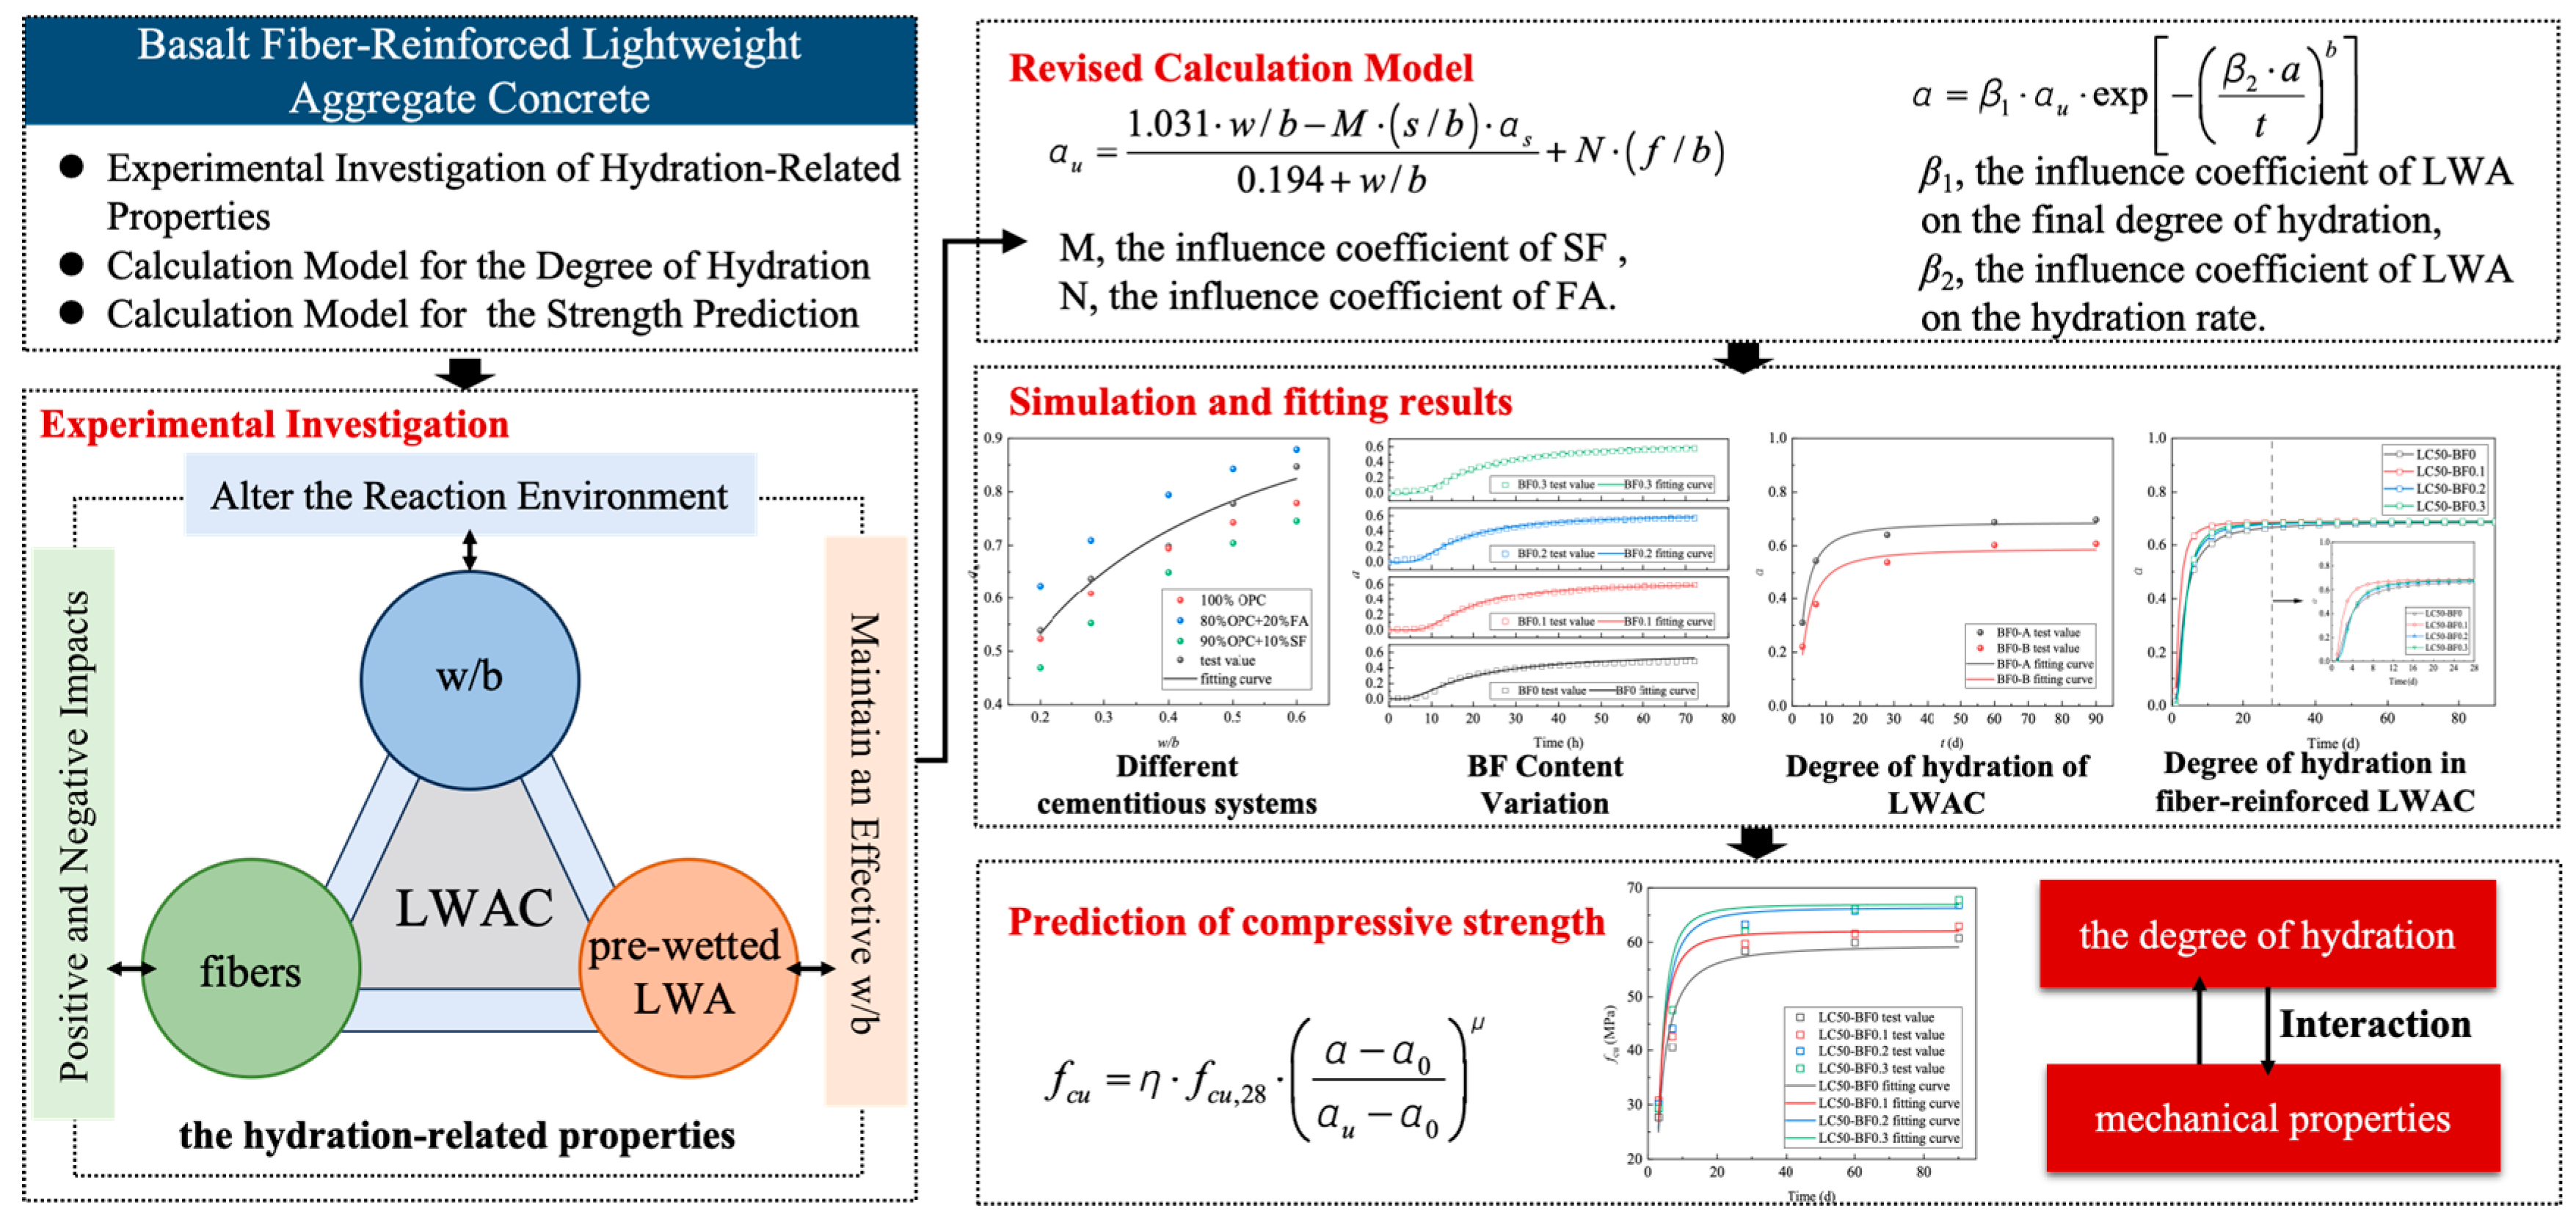
Based on the cumulative heat release data of the ternary cementitious system comprising cement, FA, and SF under different w/b, the final degree of hydration was deduced in conjunction with the Knudsen hydration kinetics model. This enabled the adjustment of the calculation model for the final degree of hydration in the ternary cementitious system. Through fitting, the influence coefficients M and N of SF and FA on the final degree of hydration were determined to be 0.312 and 0.407, respectively.
(4)
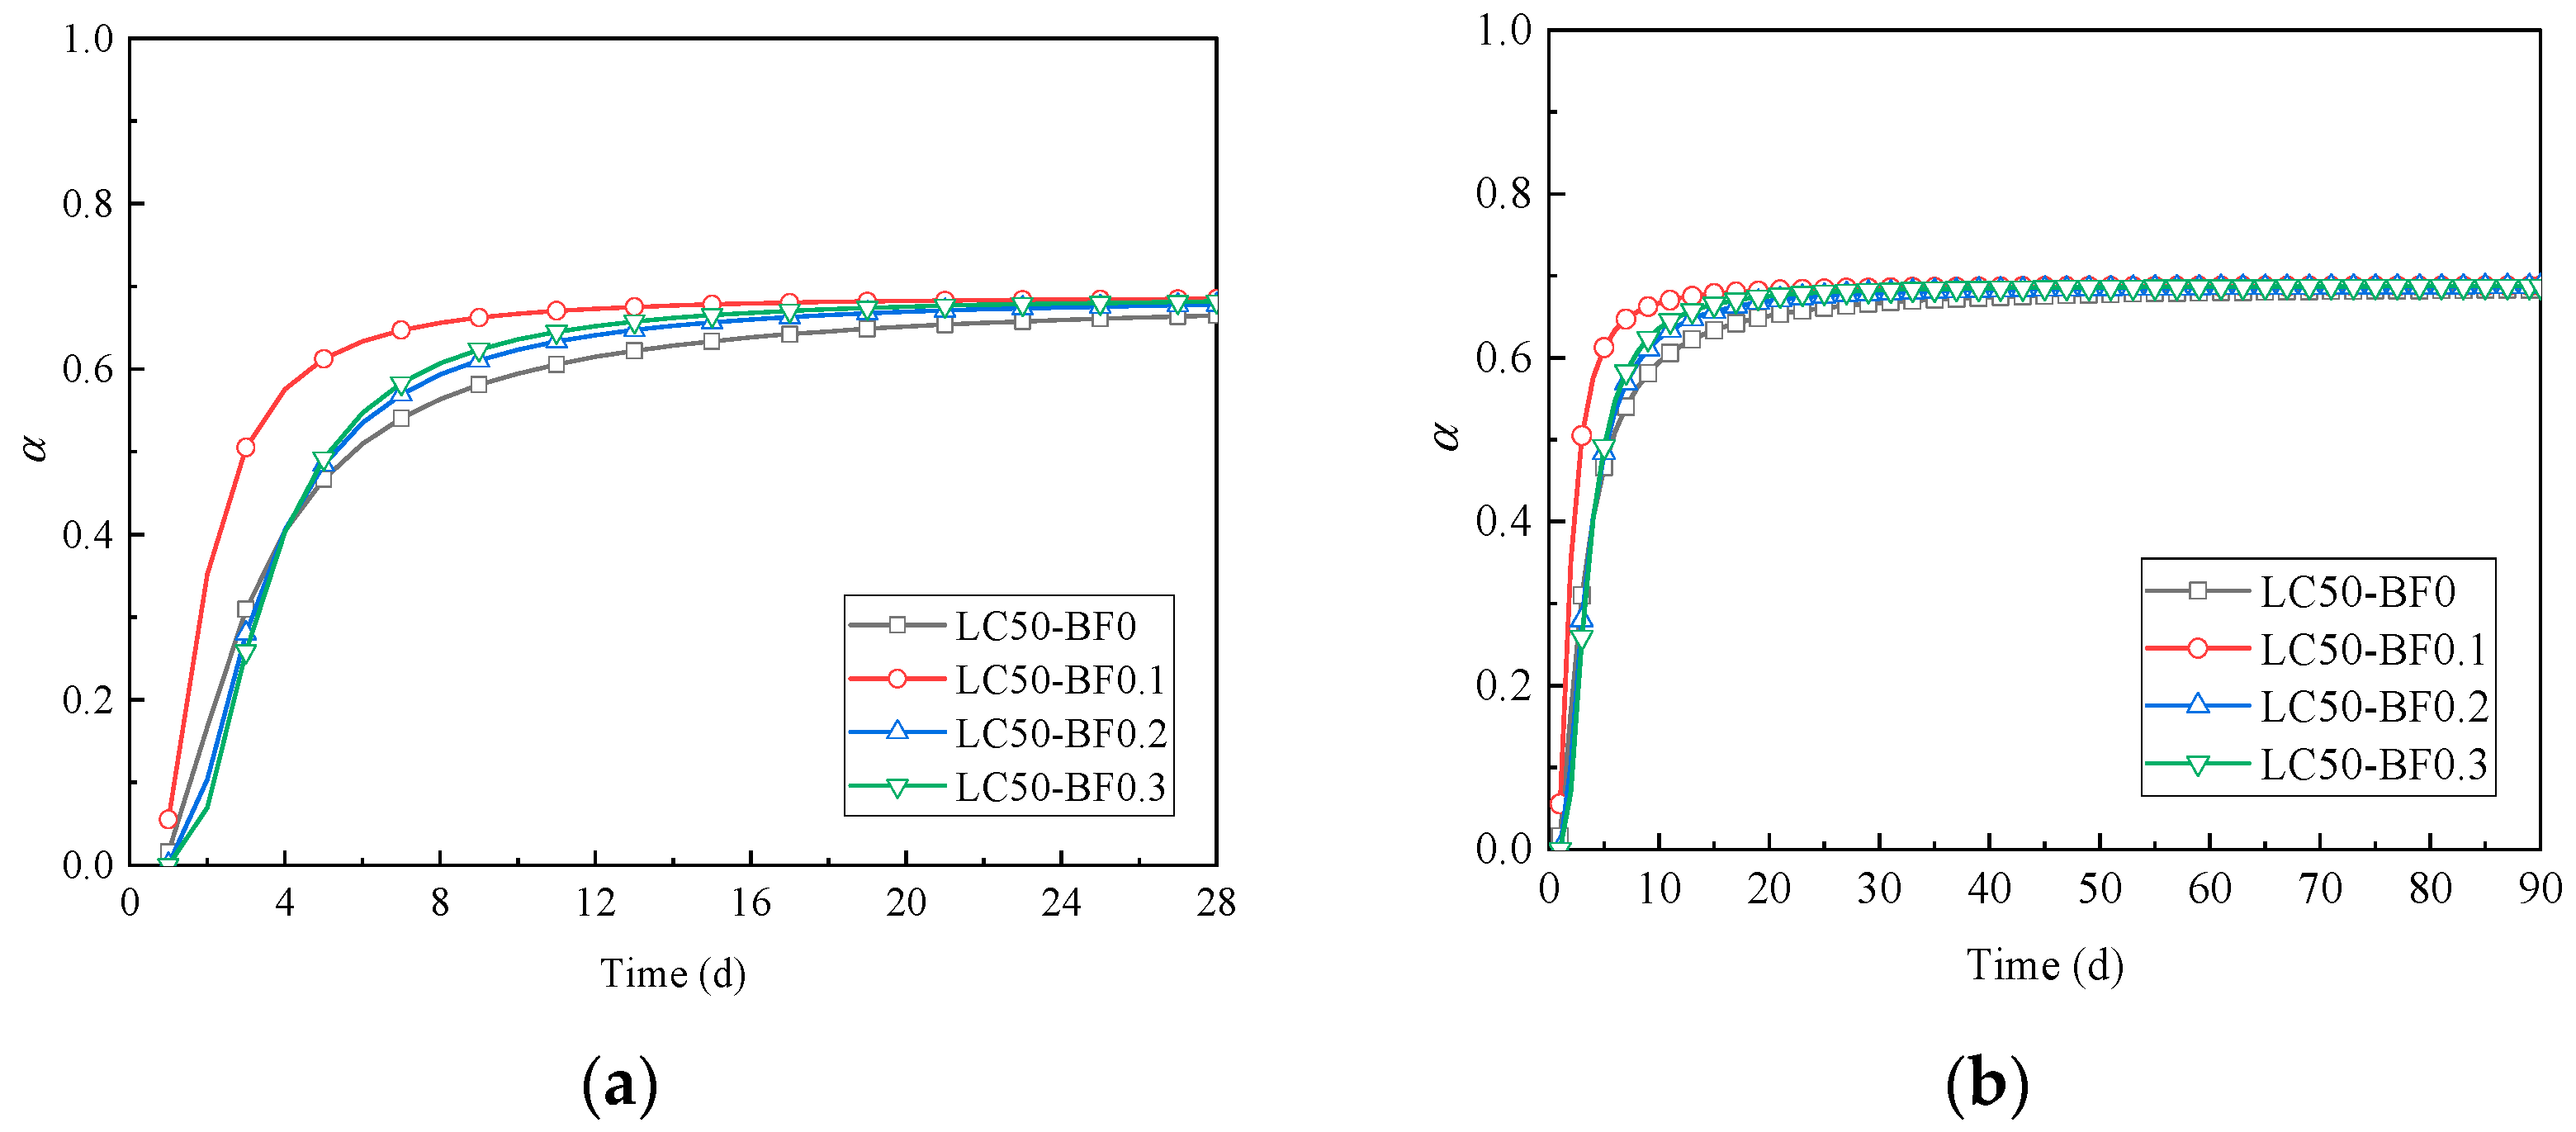
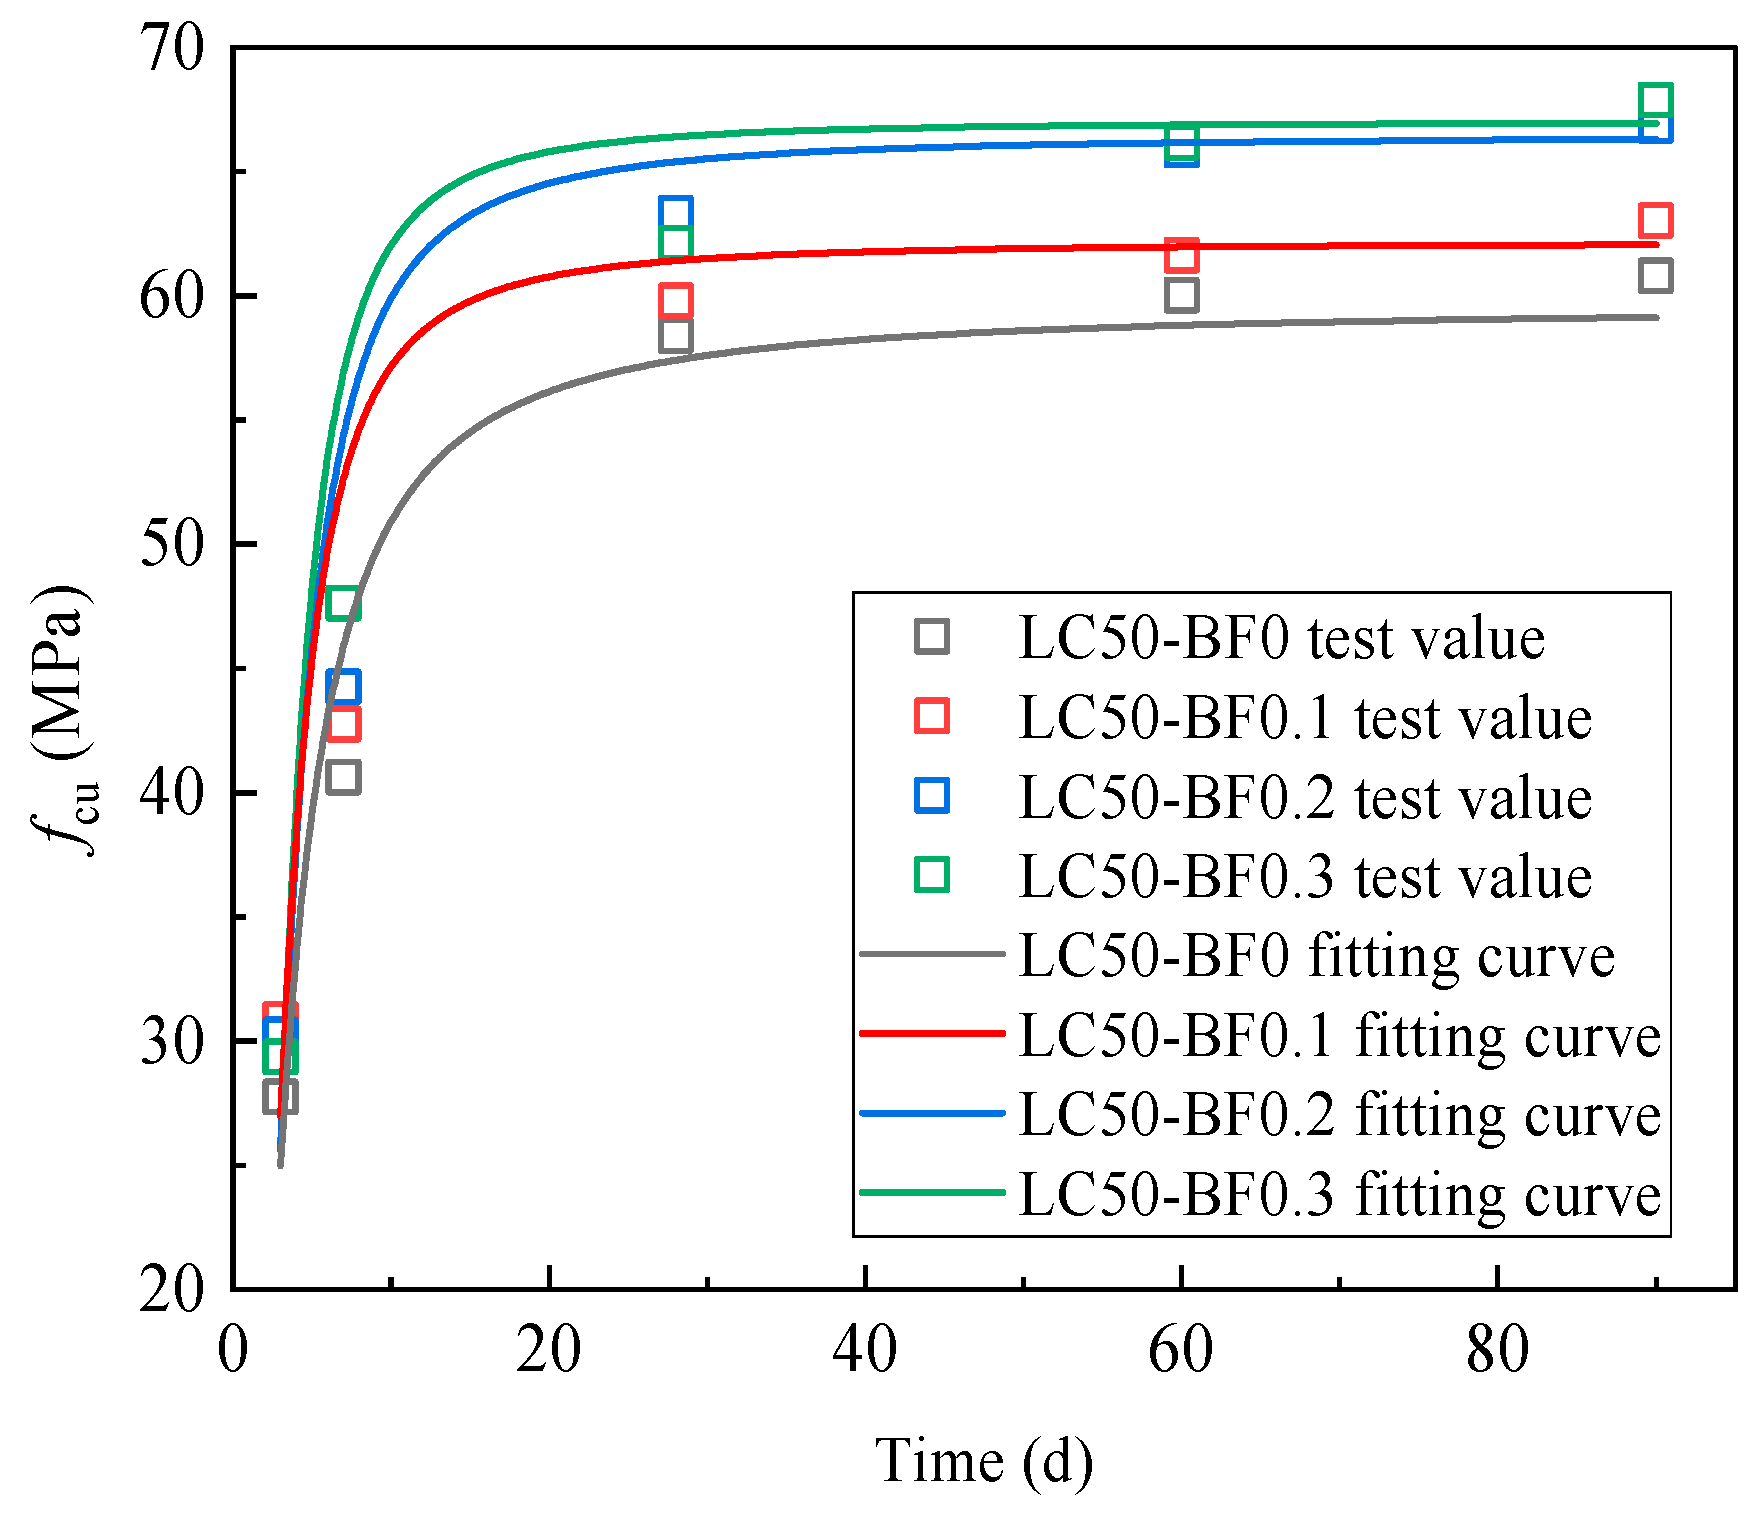
Two influence coefficients related to LWAs, namely the final degree of hydration influence coefficient β1 and the hydration rate influence coefficient β2, were introduced to establish the calculation model for the degree of hydration in fiber-reinforced LWAC. Based on this calculation model, a compressive strength prediction model was developed, and the fitting results showed good agreement with the experimental values, with all determination coefficients exceeding 0.85.
The research findings facilitate a reliable prediction of the strength of fiber-reinforced LWAC at any given age and provide a foundation for optimizing mix proportion design and performance evaluation, thereby offering substantial support for advancing the engineering application of such materials. Nevertheless, it should be noted that, due to the diversity in raw material sources, the generalizability of the model remains substantially limited. Therefore, future work should focus on conducting in-depth investigations into the underlying mechanisms to further enhance the model’s applicability across diverse material sources. Furthermore, future research should also address cost–benefit analysis and life cycle assessment.

Author Contributions

Conceptualization, Y.S.; methodology, H.J., J.W., Y.D. and Y.G.; validation, J.W. and Y.D.; formal analysis, Y.D., Y.G. and Y.L.; investigation, Y.S.; data curation, H.J., Y.D. and Y.G.; writing—original draft preparation, Y.S.; writing—review and editing, H.J., J.W. and D.L.; supervision, J.W., D.L. and Y.L.; project administration, Y.L.; funding acquisition, D.L. All authors have read and agreed to the published version of the manuscript.

Funding

This research was funded by National Natural Science Foundation of China (U23A20673, 52478261, U22A20244); Jiujiang City Major Key Technology Project “Unveiling the List and Appointing the Leader” (2025-001553); Ji’ an City 2024 “Hundred Doctors and Hundred Enterprises” Special Project (2024H-100240); China Postdoctoral Science Foundation (2024M750580), Qingdao West Coast New Area 2022 Science and Technology Plan Special Project (2022-41); Demonstration Project of Benefiting People with Science and Technology of Qingdao, China (24-1-8-cspz-9-nsh).

Data Availability Statement

The raw data supporting the conclusions of this article will be made available by the authors on request.

Acknowledgments

The authors acknowledge Qingdao University of Technology, Guangdong Huayi Sanitary Ware Industry, Shandong Luqiao Group for their support of this research.

Conflicts of Interest

Author Yanfei Ding is employed by the company Guangdong Huayi Sanitary Ware Industry Co., Ltd. Author Yanfeng Guan is employed by the company Shandong Luqiao Group Co., Ltd. The remaining authors declare that the research was conducted in the absence of any commercial or financial relationships that could be construed as a potential conflict of interest.

References

  1. Liao, Q.; Lu, S.Y.; Zhang, C.P.; Lu, J.X.; Li, B.X.; Duan, Z.H.; Pang, C.M.; Poon, C.S. Improving expansion and mechanical properties of sustainable high-strength lightweight concrete incorporating cold-bonded lightweight core-shell aggregates. Constr. Build. Mater. 2025, 474, 141095. [Google Scholar] [CrossRef]
  2. Meng, L.Q.; Zhang, C.X.; Wei, J.Q.; Li, L.; Liu, J.B.; Wang, S.H.; Ding, Y.H. Mechanical properties and microstructure of ultra-high strength concrete with lightweight aggregate. Case Stud. Constr. Mater. 2023, 18, e01745. [Google Scholar] [CrossRef]
  3. Sifan, M.; Nagaratnam, B.; Thamboo, J.; Poologanathan, K.; Corradi, M. Development and prospectives of lightweight high strength concrete using lightweight aggregates. Constr. Build. Mater. 2023, 362, 129628. [Google Scholar] [CrossRef]
  4. Gao, Y.; Han, X.; Su, X.C. Analysis of applicability and influencing factors of elastic modulus prediction model of lightweight aggregate concrete. Constr. Build. Mater. 2025, 462, 140022. [Google Scholar] [CrossRef]
  5. Wu, T.; Yang, X.; Wei, H.; Liu, X. Mechanical properties and microstructure of lightweight aggregate concrete with and without fibers. Constr. Build. Mater. 2019, 199, 526–539. [Google Scholar] [CrossRef]
  6. Zhao, C.G.; Wang, Z.Y.; Zhu, Z.Y.; Guo, Q.Y.; Wu, X.R.; Zhao, R.D. Research on different types of fiber reinforced concrete in recent years: An overview. Constr. Build. Mater. 2023, 365, 130075. [Google Scholar] [CrossRef]
  7. Wu, R.D.; Gu, Q.; Gao, X.; Luo, Y.; Zhang, H.L.; Tian, S.; Ruan, Z.X.; Huang, J. Effect of basalt fibers and silica fume on the mechanical properties, stress-strain behavior, and durability of alkali-activated slag-fly ash concrete. Constr. Build. Mater. 2024, 418, 135440. [Google Scholar] [CrossRef]
  8. Yu, W.X.; Jin, L.; Du, X.L. Experimental investigation on splitting-tension failures of basalt fiber-reinforced lightweight aggregate concrete: Effects of strain rate and structure size. J. Build. Eng. 2023, 68, 105853. [Google Scholar] [CrossRef]
  9. Saradar, A.; Nemati, P.; Paskiabi, A.S.; Moein, M.M.; Moez, H.; Vishki, E.H. Prediction of mechanical properties of lightweight basalt fiber reinforced concrete containing silica fume and fly ash: Experimental and numerical assessment. J. Build. Eng. 2020, 32, 101732. [Google Scholar] [CrossRef]
  10. Li, S.P.; Sun, Y.; Qian, Y.; Chen, W.J.; Hu, J.H. Flexural behaviour of post-tensioned precast beams manufactured with basalt-fibre-reinforced recycled concrete-conventional concrete. J. Build. Eng. 2024, 89, 109154. [Google Scholar] [CrossRef]
  11. Yu, W.X.; Jin, L.; Du, X.L. Experimental study on compression failure characteristics of basalt fiber-reinforced lightweight aggregate concrete: Influences of strain rate and structural size. Cem. Concr. Compos. 2023, 138, 104985. [Google Scholar] [CrossRef]
  12. Zhang, B.; Zhang, X.; Wang, M.; Zhang, D.; Wang, D.; Ma, X. Improvement in the Recycled Aggregate Replacement Ratio in Concrete Pavement Bricks by Incorporating Nano-Calcium Carbonate and Basalt Fibre: Model Experiment Investigation. Buildings 2025, 15, 2070. [Google Scholar] [CrossRef]
  13. Chidiac, S.E.; Shafikhani, M. Cement degree of hydration in mortar and concrete. J. Therm. Anal. Calorim. 2019, 138, 2305–2313. [Google Scholar] [CrossRef]
  14. Kim, H.K.; Lee, H.K. Hydration kinetics of high-strength concrete with untreated coal bottom ash for internal curing. Cem. Concr. Compos. 2018, 91, 67–75. [Google Scholar] [CrossRef]
  15. Thongsanitgarn, P.; Wongkeo, W.; Chaipanich, A. Hydration and Compressive Strength of Blended Cement Containing Fly Ash and Limestone as Cement Replacement. J. Mater. Civ. Eng. 2014, 26, 04014088. [Google Scholar] [CrossRef]
  16. Abouelnour, M.A.; Fathy, I.N.; Mahmoud, A.A.; Alturki, M.; Abdelaziz, M.M.; Mostafa, S.A.; Mahmoud, K.A.; Dahish, H.A.; Nabil, I.M.; Fattouh, M.S. Valorization of nano additives effects on the physical, mechanical and radiation shielding properties of high strength concrete. Sci. Rep. 2025, 15, 14440. [Google Scholar] [CrossRef]
  17. Chen, X.D.; Wu, S.X. Influence of water-to-cement ratio and curing period on pore structure of cement mortar. Constr. Build. Mater. 2013, 38, 804–812. [Google Scholar] [CrossRef]
  18. Abriak, Y.; Chu, D.C.; Maherzi, W.; Benzerzour, M.; Rivard, P. Influence of fine recycled concrete aggregates use on the hydration kinetics and mechanical-microstructural properties of hydrated cement: Experimental and numerical approaches. Constr. Build. Mater. 2023, 408, 133769. [Google Scholar] [CrossRef]
  19. Phung, Q.T.; Ferreira, E.; Seetharam, S.; Nguyen, V.T.; Govaerts, J.; Valcke, E. Understanding hydration heat of mortars containing supplementary cementitious materials with potential to immobilize heavy metal containing waste. Cem. Concr. Compos. 2021, 115, 103859. [Google Scholar] [CrossRef]
  20. Lei, D.Y.; Yu, L.; Wang, S.J.; Li, Y.; Jia, H.X.; Wu, Z.Y.; Bao, J.W.; Liu, J.P.; Xi, X.; Su, L. A state-of-the-art on electromagnetic and mechanical properties of electromagnetic waves absorbing cementitious composites. Cem. Concr. Compos. 2025, 157, 105889. [Google Scholar] [CrossRef]
  21. Lothenbach, B.; Scrivener, K.; Hooton, R.D. Supplementary cementitious materials. Cem. Concr. Res. 2011, 41, 1244–1256. [Google Scholar] [CrossRef]
  22. Jones, C.; Goad, D.; Hale, W.M. Examining soaking duration of coarse clay and shale lightweight aggregates for internal curing in conventional concrete. Constr. Build. Mater. 2020, 249, 118754. [Google Scholar] [CrossRef]
  23. Feng, Z.Z.; Shen, D.J.; Wen, C.Y.; Tang, X.J.; Jiang, G.Q. Effect of Water-to-Cement Ratios on Performance of Concrete with Prewetted Lightweight Aggregates. J. Mater. Civ. Eng. 2023, 35, 14923. [Google Scholar] [CrossRef]
  24. Wang, X.X.; Wang, W.J.; Li, Y.X.; Wang, L.; Duan, P.F.; Liu, Y.Z. Water absorption and desorption behavior of lightweight aggregate for internal curing in cement-based materials: A critical review. J. Build. Eng. 2025, 106, 112624. [Google Scholar] [CrossRef]
  25. Paul, A.; Murgadas, S.; Delpiano, J.; Moreno-Casas, P.A.; Walczak, M.; Lopez, M. The role of moisture transport mechanisms on the performance of lightweight aggregates in internal curing. Constr. Build. Mater. 2021, 268, 121191. [Google Scholar] [CrossRef]
  26. Lyu, Z.H.; Shen, A.Q.; Meng, W.N. Properties, mechanism, and optimization of superabsorbent polymers and basalt fibers modified cementitious composite. Constr. Build. Mater. 2021, 276, 122212. [Google Scholar] [CrossRef]
  27. Ja’e, I.A.; Sazrin, R.A.N.B.; Syamsir, A.; Bheel, N.; Amaechi, C.V.; Min, T.H.; Anggraini, V. Optimisation of mechanical properties and impact resistance of basalt fibre reinforced concrete containing silica fume: Experimental and response surface assessment. Dev. Built Environ. 2024, 17, 100368. [Google Scholar] [CrossRef]
  28. GB/T 17431.1; Lightweight Aggregates and Its Test Methods-Part 1: Lightweight Aggregates. Standardization Administration of the People’s Republic of China: Beijing, China, 2010.
  29. JGJ/T 12-2019; Technical Standard for Application of Lightweight Aggregate Concrete. Ministry of Housing and Urban-Rural Development of the People’s Republic of China: Beijing, China, 2019.
  30. GB/T 50080-2016; Standard for Test Method of Performanceon Ordinary Fresh Concrete. Ministry of Housing and Urban-Rural Development of China: Beijing, China, 2016.
  31. GB/T 50081-2019; Standard for Test Methods of Concrete Physical and Mechanical Properties. Ministry of Housing and Urban-Rural Development of the People’s Republic of China: Beijing, China, 2019.
  32. Snellings, R.; Machner, A.; Bolte, G.; Kamyab, H.; Durdzinski, P.; Teck, P.; Zajac, M.; Muller, A.; de Weerdt, K.; Ben Haha, M. Hydration kinetics of ternary slag-limestone cements: Impact of water to binder ratio and curing temperature. Cem. Concr. Res. 2022, 151, 106647. [Google Scholar] [CrossRef]
  33. Li, D.Z.; Du, C.B.; Yi, F.; Li, F.; Li, S. Performance and microstructural characterization of fiber-reinforced cement-based grout incorporating waste tailing sand and fly ash. Mater. Today Commun. 2024, 41, 110289. [Google Scholar] [CrossRef]
  34. Hruby, P.; Kalina, L.; Másilko, J.; Porizka, J.; Soukal, F.; Nevrly, V.; Kimm, M.; Gries, T. Stability of Basalt-Fibres Reinforcement in Alkali-Activated Systems. Mater. Technol. 2020, 54, 203–210. [Google Scholar] [CrossRef]
  35. Wang, D.X.; Wang, H.W.; Larsson, S.; Benzerzour, M.; Maherzi, W.; Amar, M. Effect of basalt fiber inclusion on the mechanical properties and microstructure of cement-solidified kaolinite. Constr. Build. Mater. 2020, 241, 118085. [Google Scholar] [CrossRef]
  36. Zhang, J.L.; Zhang, N.; Wang, Y.D.; Lu, P.; Wu, N.J.; Li, C.; Zhang, Y.H. Superior reinforcement efficiency of basalt fibers in geopolymers: Hydration interaction and embodied carbon advantage over carbon fibers. Sustain. Mater. Technol. 2025, 43, e01203. [Google Scholar] [CrossRef]
  37. Bello, L.; Garcia-Diaz, E.; Rougeau, P. An original test method to assess water absorption/desorption of lightweight aggregates in presence of cement paste. Constr. Build. Mater. 2017, 154, 752–762. [Google Scholar] [CrossRef]
  38. Schindler, A.K.; Folliard, K.J. Heat of hydration models for cementitious materials. ACI Mater. J. 2005, 102, 24–33. [Google Scholar] [CrossRef] [PubMed]
  39. Langan, B.W.; Weng, K.; Ward, M.A. Effect of silica fume and fly ash on heat of hydration of Portland cement. Cem. Concr. Res. 2002, 32, 1045–1051. [Google Scholar] [CrossRef]
  40. Knudsen, T. On particle size distribution in cement hydration. In Proceedings of the 7th International Congress on the Chemistry of Cements, Paris, France, 30 June–4 July 1980; pp. 170–175. [Google Scholar]
  41. Mills R, H. Factors influencing cessation of hydration in water-cured cement pastes. In Proceedings of the Symposium on the Structure of Portland Cement Paste and Concrete, Washington, DC, USA, 13–14 June 1966; pp. 406–424. [Google Scholar]
  42. Luzio, G.D.; Cusatis, G. Hygro-thermo-chemical modeling of high performance concrete. I: Theory. Cem. Concr. Compos. 2009, 31, 301–308. [Google Scholar] [CrossRef]
  43. Marsh, B.K.; Day, R.L. Pozzolanic and cementitious reactions of fly ash blended cement pastes. Cem. Concr. Res. 1998, 18, 301–310. [Google Scholar] [CrossRef]
  44. Bonen, D.; Khayat, K.H. Characterization and pozzolanic properties of silica fume stored in an open pond. Cem. Concr. Res. 1995, 25, 395–407. [Google Scholar] [CrossRef]
  45. Fei, X.P.; Guo, L.P.; Lu, J.T.; Shen, H.R.; Chen, H.T.; Rui, Z.Q. Modeling and analysis of hydration in cementitious composites with ultra-high dosage of fly ash: Hydrates and microstructure evolutions. Constr. Build. Mater. 2025, 470, 140557. [Google Scholar] [CrossRef]
  46. Kurylowicz-Cudowska, A. Correlation between Compressive Strength and Heat of Hydration of Cement Mortars with Siliceous Fly Ash. Minerals 2022, 12, 1471. [Google Scholar] [CrossRef]
  47. De Schutter, G.; Taerwe, L. Degree of hydration-based description of mechanical propertiesof early age concrete. Mater. Struct. 1996, 29, 335–344. [Google Scholar] [CrossRef]
Figure 1. The Research hotspots and trends of LWAC: (a) The keyword co-occurrence network of LWAs; (b) The number and cumulative percentage of papers published.
Buildings 15 02699 g001
Figure 2. The hydration-related properties of LWAC.
Buildings 15 02699 g002
Figure 3. The appearance of LWAs.
Buildings 15 02699 g003
Figure 4. The water absorption of LWAs.
Buildings 15 02699 g004
Figure 5. The T2 distribution of LWAs.
Buildings 15 02699 g005
Figure 6. The appearance of BF.
Buildings 15 02699 g006
Figure 7. Isothermal calorimetry test results of cementitious systems with different w/b: (a) The rate of hydration heat release; (b) Cumulative heat release.
Buildings 15 02699 g007
Figure 8. Isothermal calorimetry test results of cementitious systems with different BF content: (a) The rate of hydration heat release; (b) Cumulative heat release.
Buildings 15 02699 g008
Figure 9. The chemically bound water content at different ages: (a) Under the same net water content condition; (b) Under the same total water content condition.
Buildings 15 02699 g009
Figure 10. The comparison of the maximum heat release: (a) Under the different BF content; (b) Under the different w/b.
Buildings 15 02699 g010
Figure 11. Comparison of the calculated model values and experimental values for the final degree of hydration with different cementitious systems.
Buildings 15 02699 g011
Figure 12. Simulation for the degree of hydration on cementitious systems with varying BF content.
Buildings 15 02699 g012
Figure 13. Fitting results for degree of hydration of LWAC.
Buildings 15 02699 g013
Figure 14. Simulation for degree of hydration in fiber-reinforced LWAC: (a) Within 28 d; (b) Within 90 d.
Buildings 15 02699 g014
Figure 15. Simulation for compressive strength of fiber-reinforced LWAC.
Buildings 15 02699 g015
Table 1. The chemical composition and physical properties of binding materials.
TypeChemical Composition/%Specific Gravity/kg/m3Specific Surface/m2/kg
CaOSiO2Al2O3Fe2O3SO3MgOOtherLOI
OPC63.3820.875.432.762.561.531.312.163100350
FA3.6752.0825.177.261.362.735.492.242200540
SF0.4195.110.820.480.180.720.411.87211020,000
Table 2. The properties of LWAs.
Grain Size/mmBulk
Density/kg/m3
Apparent
Density/kg/m3
Moisture
Content/%
Water Absorption/%Cylinder Compressive Strength/MPa
1 h24 h
5–1686914600.33.74.26.9
Table 3. The properties of fine aggregates.
Grain Size/mmBulk Density/kg/m3Apparent Density/kg/m3Fineness Modulus
0–4.75152026402.6
Table 4. The properties of BF.
Density/kg/m3Length/mmDiameter/mmTensile Strength/MPaElastic Modulus/GPaUltimate Elongation/%
2650180.0133000–480091–1103.0–3.2
Table 5. Mix proportions of fiber-reinforced LWAC.
No.Materials (kg/m3)BF
(%)
fcu,28
(MPa)
OPCFASFLWAsFine AggregateWater *SP
LC50-BF0385110555686841542.2058.4
LC50-BF0.1385110555686841544.30.159.8
LC50-BF0.2385110555686841544.60.263.3
LC50-BF0.3385110555686841544.90.362.1
* Net water content.
Table 6. Mix proportions of Cementitious materials.
No.w/bOPC
(%)
FA
(%)
SF
(%)
BF
(%)
BF0 (w/b-0.28)0.287020100
BF0.10.287020100.1
BF0.20.287020100.2
BF0.30.287020100.3
w/b-0.20.27020100
w/b-0.40.47020100
w/b-0.50.57020100
w/b-0.60.67020100
Table 7. Mix proportions of LWAC.
No.Materials (kg/m3)BF
(%)
fcu,28
(MPa)
OPCFASFLWAsFine AggregateWater *SP
BF0-A385110555686841542.2058.4
BF0-B385110555686841542.8055.1
BF0-C385110555686841752.0053.6
* Net water content.
Table 8. The Knudsen equation and the maximum cumulative heat release of cementitious system.
No.Knudsen EquationQmaxR2
BF0 (w/c-0.28)1/Q = 0.03123/(tt0) + 0.00379263.240.994
BF0.11/Q = 0.03391/(tt0) + 0.00369270.830.986
BF0.21/Q = 0.03306/(tt0) + 0.00372269.150.989
BF0.31/Q = 0.04162/(tt0) + 0.00376266.190.992
w/c-0.21/Q = 0.03111/(tt0) + 0.00439227.380.992
w/c-0.41/Q = 0.03837/(tt0) + 0.00341293.610.995
w/c-0.51/Q = 0.04296/(tt0) + 0.00306326.520.993
w/c-0.61/Q = 0.04561/(tt0) + 0.00280356.890.997
Table 9. Fitting parameters for the degree of hydration on cementitious systems with varying BF content.
No.abR2
BF014.451.410.995
BF0.114.221.910.996
BF0.215.991.840.998
BF0.316.782.090.996
Table 10. Fitting parameters for degree of hydration of LWAC.
No.αuβ1β2R2
BF0-A0.6301.0924.250.989
BF0-B0.6300.9385.420.951
Table 11. Fitting parameters for compressive strength of fiber-reinforced LWAC.
No.ημR2
LC50-BF01.026.150.95
LC50-BF0.11.0416.040.85
LC50-BF0.21.0511.850.87
LC50-BF0.31.0816.640.88
Disclaimer/Publisher’s Note: The statements, opinions and data contained in all publications are solely those of the individual author(s) and contributor(s) and not of MDPI and/or the editor(s). MDPI and/or the editor(s) disclaim responsibility for any injury to people or property resulting from any ideas, methods, instructions or products referred to in the content.

