Article

Exploration of Carbon Emission Reduction Pathways for Urban Residential Buildings at the Provincial Level: A Case Study of Jiangsu Province

1
Urban Construction and Digital City Teaching Experiment Center, School of Architecture and Planning, Yunnan University, Kunming 650500, China
2
State Key Laboratory of Urban and Regional Ecology, Research Center for Eco-Environmental Sciences, Chinese Academy of Sciences, Beijing 100085, China
*
Author to whom correspondence should be addressed.
Buildings 2025, 15(15), 2687; https://doi.org/10.3390/buildings15152687
Submission received: 29 June 2025 / Revised: 18 July 2025 / Accepted: 28 July 2025 / Published: 30 July 2025
(This article belongs to the Section Building Energy, Physics, Environment, and Systems)

Abstract

Achieving carbon emission reductions in the residential building sector while maintaining economic growth represents a global challenge, particularly in rapidly developing regions with internal disparities. This study examines Jiangsu Province in eastern China—a economic hub with north-south development gradients—to develop an integrated framework for differentiated carbon reduction pathways. The methodology combines spatial autocorrelation analysis, logarithmic mean Divisia index (LMDI) decomposition, system dynamics modeling, and Tapio decoupling analysis to examine urban residential building emissions across three regions from 2016–2022. Results reveal significant spatial clustering of emissions (Moran’s I peaking at 0.735), with energy consumption per unit area as the dominant driver across all regions (contributing 147.61%, 131.82%, and 147.57% respectively). Scenario analysis demonstrates that energy efficiency policies can reduce emissions by 10.1% while maintaining 99.2% of economic performance, enabling carbon peak achievement by 2030. However, less developed northern regions emerge as binding constraints, requiring technology investments. Decoupling analysis identifies region-specific optimal pathways: conventional development for advanced regions, balanced approaches for transitional areas, and subsidies for lagging regions. These findings challenge assumptions about environment-economy trade-offs and provide a replicable framework for designing differentiated climate policies in heterogeneous territories, offering insights for similar regions worldwide navigating the transition to sustainable development.

1. Introduction

The intensification of the greenhouse effect due to global economic development has made carbon emissions an increasingly urgent challenge. Unrestrained use of fossil fuels has exacerbated climate-related problems, prompting 195 countries to sign a global climate agreement at the Paris Climate Conference, committing to limit global temperature increases to within 1.5 °C [1]. Achieving this target requires reducing global carbon dioxide emissions by 45% by 2030 and reaching net-zero emissions around 2050 [2]. In response to this global imperative, China proposed its carbon peaking and carbon neutrality goals in September 2020, establishing targets to reach peak carbon emissions before 2030 and achieve carbon neutrality by 2060, aligning these ambitious goals with national conditions [3].
Building emission reduction stands as a crucial component for China to achieve its “dual carbon” goals. According to the “China Building Energy Consumption and Carbon Emissions Research Report” published in 2022, China’s building industry consumed 2.272 billion tons of standard carbon in 2020, accounting for 45.5% of total energy consumption [4]. As industrial production efficiency continues to improve, the potential for energy conservation and emission reduction in the industrial sector is gradually declining, necessitating the building sector to assume greater responsibility [5]. With China’s advancing urbanization, residential building floor area continues to expand, accompanied by rapid growth in household energy demand that further intensifies carbon dioxide emissions from residential buildings. Research analyzing carbon emissions from China’s urban and rural residential buildings reveals that urban residential carbon emissions substantially exceed rural emissions, with urban peak values projected to occur later [6]. These findings underscore the necessity of focused research on urban residential building carbon emissions.
Residential buildings provide living spaces for residents, making the composition and influencing factors of their carbon emissions complex and variable, involving social, environmental, economic, and policy dimensions. Scholars have employed various approaches to analyze these factors, with decomposition methods including the IPAT model [7] and Index Decomposition Analysis (IDA) [8] gaining prominence. While the IPAT model effectively reflects relationships between population, economy, technology, and environment, it cannot quantify relationships between influencing factors and carbon emissions [9]. Index decomposition methods address this limitation, offering significant advantages in factor quantification. Building on these approaches, researchers have combined the Kaya identity with index decomposition methods, identifying per capita gross domestic product (GDP) and energy intensity as key factors affecting residential building carbon emissions [10]. Additional studies using logarithmic mean Divisia index (LMDI) methods have highlighted resident income as another primary influencing factor [11].
Regional variations in influencing factors have been observed across different geographic locations. Analyses of residential building carbon emissions in China’s central Henan Province, southeastern coastal Fujian Province, and southwestern Yunnan Province found that per capita building area significantly affects residential carbon emissions in Henan and Yunnan, while energy intensity emerges as the key factor in Fujian [12,13,14]. Moreover, a spatiotemporal analysis of carbon emissions from residential buildings in Wuhan, Hubei Province, revealed that population density has a more significant impact on urban residential carbon emissions than energy intensity [15]. These findings highlight the importance of accounting for regional differences when analyzing carbon emissions. However, the influencing factors of residential building carbon emissions do not exhibit complete dissimilarity with changes in geographical location. A study of 30 provinces in China found that urbanization promotes carbon emissions, and this effect is enhanced by increases in residents’ income and changes in the energy structure [16]. Similarly, research on 34 representative cities in China also indicated that population is an important factor affecting residential building carbon emissions [17].
These findings highlight the importance of accounting for regional differences when analyzing carbon emissions. Similarly, numerous predictive approaches have been developed, including STIRPAT models [18], gray relational analysis [19], system dynamics (SD) [20], LEAP models [21], neural networks [22], and scenario analysis [23]. Among these, SD has gained favor for its ability to handle non-linear, high-order, and complex system problems, finding applications in logistics [24], transportation [25], energy [26], and construction sectors [27].
Despite the substantial body of research on residential building carbon emissions, significant gaps remain. First, provincial-level studies that address internal regional disparities are limited, despite the critical importance of these variations for policy implementation. Second, research examining carbon emissions prediction from individual regions to holistic provincial perspectives is insufficient. Third, region-specific reduction pathways based on distinctive economic, social, and energy characteristics remain underexplored. These gaps are particularly problematic in provinces like Jiangsu, where development levels vary significantly across regions.
Addressing these research gaps, this study proposes a novel “Moran’s-Kaya-LMDI-SD-Tapio” integrated research framework that enables comprehensive analysis of carbon emissions at the provincial level while accounting for internal regional differences. Jiangsu Province serves as an ideal case study, representing a critical node in China’s economic development as a key support point for the Maritime Silk Road and the Yangtze River Economic Belt, while simultaneously functioning as a frontline area for carbon reduction initiatives [28,29]. This research focuses on three key questions:
(1) What are the spatial-temporal distribution characteristics and key driving factors of carbon emissions from urban residential buildings across different regions of Jiangsu Province?
(2) Under various scenarios, when will each region of Jiangsu Province reach its carbon emission peak, and which scenario is most conducive to achieving the 2030 carbon peak target?
(3) What is the decoupling relationship between economic growth and carbon emissions in different regions, and what are the optimal reduction pathways for each region based on their distinctive characteristics?
This study addresses a critical research need by developing differentiated carbon reduction strategies for heterogeneous provincial regions, where existing one-size-fits-all approaches fail to capture internal disparities that significantly influence policy effectiveness. The novelty of this research lies in integrating five complementary analytical methods to create a comprehensive provincial-level framework that simultaneously examines spatial clustering, factor decomposition, scenario prediction, and decoupling pathways. The key innovation is the development of region-specific carbon reduction pathways based on empirical analysis of spatial-temporal emission patterns and economic-environmental relationships, providing a replicable methodological framework for provinces with significant internal development disparities. This approach contributes to both theoretical understanding of multi-regional carbon emission dynamics and practical policy design for achieving China’s 2030 carbon peak targets while maintaining balanced regional development.

2. Method

2.1. Methodology Overview

This research proposes a comprehensive “distribution-decomposition-prediction-decoupling” analytical framework to systematically investigate carbon emissions from urban residential buildings in Jiangsu Province (Figure 1).
We first applied Moran’s Index to examine spatial-temporal distribution patterns and divided Jiangsu into three regions (southern, central, and northern) based on spatial autocorrelation, administrative boundaries, and economic development levels. The extended Kaya identity combined with LMDI decomposition was used to quantify seven driving factors: population, urbanization rate, per capita energy consumption, energy intensity, economic density, energy consumption per unit building area, and carbon emission coefficient. Region-specific SD models were then constructed to simulate four scenarios: baseline scenario (BS), low-carbon scenario (LCS), eco-nomic growth scenario (EGS), and comprehensive scenario (CS). Finally, Tapio decoupling analysis quantified the relationship between economic growth and carbon emissions to identify optimal reduction pathways for each region.
This integrated methodological framework enables a holistic understanding of urban residential building carbon emissions from individual regions to the provincial level. By acknowledging regional heterogeneity and providing tailored reduction pathways, this approach offers more practical and effective strategies for achieving carbon emission reduction goals in Jiangsu Province.

2.2. Study Area and Data Sources

2.2.1. Study Area

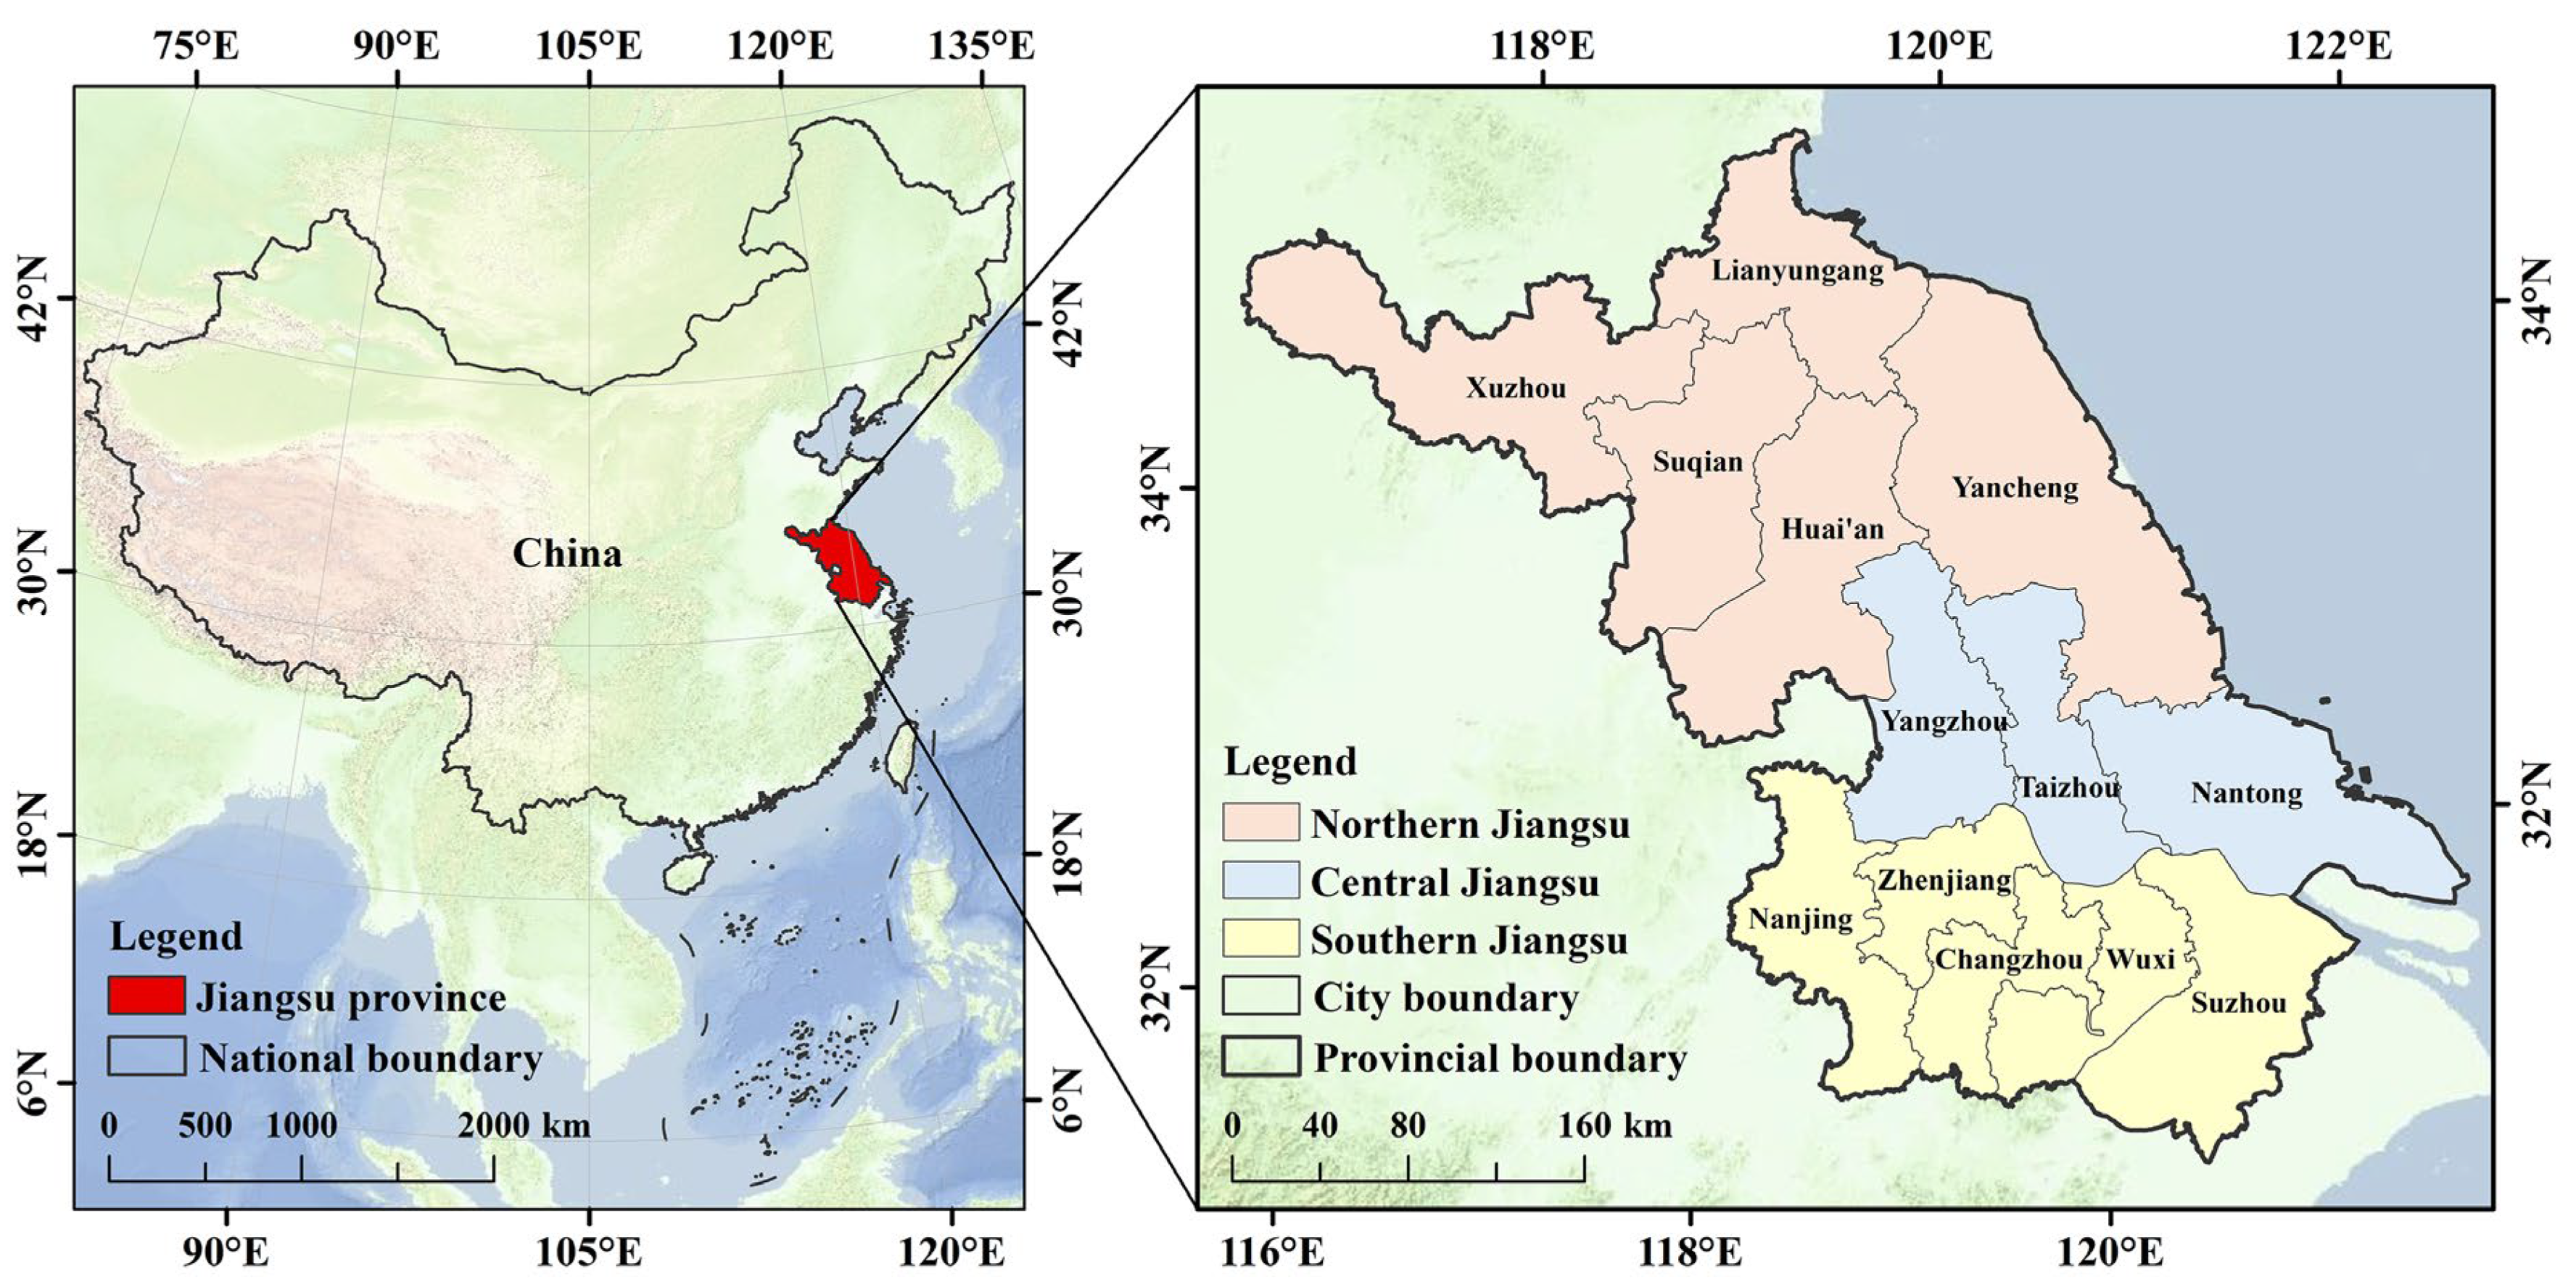
Jiangsu Province is situated on the eastern coast of China, spanning an area of approximately 107,200 square kilometers with a population of 85.26 million as of 2024 [30]. As a pivotal economic hub within the Yangtze River Delta Economic Zone, Jiangsu has demonstrated remarkable economic performance, with its GDP reaching 13.70 trillion yuan in 2023, ranking second nationwide and contributing about 10.2% to China’s total GDP [31,32]. This economic prosperity has been accompanied by substantial energy consumption and carbon emissions, positioning Jiangsu as both a significant contributor to national carbon emissions and a critical testing ground for carbon reduction policies.
The province exhibits pronounced regional development disparities, with discernible socioeconomic and climatic gradients from south to north (Figure 2). Southern Jiangsu, comprising Nanjing, Suzhou, Wuxi, Changzhou, and Zhenjiang, represents the most economically advanced region with robust industrial bases, high urbanization levels, and substantial energy consumption. These five cities collectively generated 56.5% of the province’s GDP while housing only 45.3% of its population in 2023 [33]. Central Jiangsu, encompassing Nantong, Yangzhou, and Taizhou, occupies an intermediate development position with moderate industrial capacity and urbanization rates. Northern Jiangsu, including Xuzhou, Lianyungang, Yancheng, Suqian, and Huai’an, remain relatively less developed, characterized by agricultural dominance, lower urbanization levels, and less intensive energy use patterns [34].
Jiangsu Province offers an exemplary case study for three primary reasons. First, as one of China’s most economically vibrant provinces with high energy consumption and carbon emission levels, achieving carbon reduction in Jiangsu carries significant implications for national carbon goals. Second, the pronounced internal development disparities mirror broader national patterns, making region-specific findings potentially applicable to similar developmental contexts across China. Third, the province has implemented various energy efficiency and low-carbon initiatives in recent years [35,36,37], providing valuable policy experience and data resources for comprehensive analysis. These characteristics make Jiangsu an ideal microcosm for examining differentiated carbon reduction pathways that balance regional development needs with environmental objectives.

2.2.2. Data Sources

The primary data for this study encompass population size, urban residential building floor area, urbanization rate, GDP, and energy consumption. All data were sourced from the Jiangsu Statistical Yearbook [33] and the China City Statistical Yearbook [38], covering the period from 2016 to 2022. To ensure comparability across time periods, GDP and energy intensity values were adjusted to constant prices to eliminate the effects of inflation.
The selection of 2016 as the baseline year is grounded in Jiangsu Province’s release of the “13th Five-Year” Energy Conservation Plan in 2016, which marked the comprehensive implementation of building energy efficiency and green building initiatives [39]. This policy milestone represents a significant turning point in the province’s approach to building energy management and carbon emission reduction, making it an appropriate baseline for analyzing subsequent trends and policy impacts.
The data collection strategy ensures temporal consistency and spatial completeness across all 13 prefecture-level cities in Jiangsu Province. Energy consumption data were standardized to coal equivalent units to facilitate cross-regional comparisons, while building area statistics were verified against multiple sources to ensure accuracy. Population data include both registered and resident populations to capture the actual energy consumption patterns of urban residential buildings.

2.3. Spatial Autocorrelation Analysis

To examine the spatial distribution patterns and clustering characteristics of carbon emissions from urban residential buildings across Jiangsu Province, this study employed Moran’s Index for global spatial autocorrelation analysis. Global Moran’s Index quantifies the degree of spatial similarity between neighboring or proximate regional units based on their attribute values, providing insights into the spatial dependence of carbon emissions across the province.
The Moran’s Index (I) ranges from −1 to 1, with values calculated according to Equation (1) [40]:
I = n i = 1 n j = 1 n W i j ( x i x ¯ ) ( x j x ¯ ) i = 1 n j = 1 n W i j i = 1 n x i x ¯ 2 ,
where xi and xj represent the attribute values for regions i and j respectively; x ¯   = ( 1 / n ) x i denotes the mean value; and Wij represents the spatial weight matrix. Given the study’s scope and regional characteristics, an economic distance weight matrix was adopted as the spatial weight matrix to better capture the economic relationships between regions.
A positive Moran’s Index indicates positive spatial autocorrelation, suggesting that regions with similar carbon emission levels tend to cluster spatially. Conversely, a negative value indicates negative spatial autocorrelation, where regions with dissimilar emission levels are spatially adjacent. Values approaching zero suggest random spatial distribution with no significant spatial dependence.
Statistical significance of the Moran’s Index was assessed using standardized Z-scores and p-values. The null hypothesis assumes no spatial autocorrelation (random distribution), while the alternative hypothesis suggests the presence of spatial clustering or dispersion. Significance is established when Z > 0 and p < 0.05, with higher Z-values and p-values closer to zero indicating stronger significance and more pronounced spatial autocorrelation patterns [41].

2.4. Factor Decomposition Analysis

2.4.1. Kaya Identity Framework

The Kaya identity, originally formulated by Yochi Kaya in 1989, serves as a fundamental mathematical framework for decomposing carbon emissions into constituent driving factors [42]. This identity has become a widely adopted analytical tool for CO2 emission analysis due to its ability to clearly represent research subjects through multiple contributing factors. The basic form of the Kaya identity decomposes total carbon emissions into four primary components, as expressed in Equation (2):
C = P × G P × E G × C E ,
where C represents total carbon emissions; P denotes population size; G represents GDP; E indicates total energy consumption; G/P represents per capita GDP; E/G denotes energy consumption per unit GDP (energy intensity); and C/E represents carbon emissions per unit of energy consumption (carbon emission factor).
To better capture the specific characteristics of residential building carbon emissions, this study extends the traditional Kaya identity by incorporating factors directly relevant to the residential building sector. Based on comprehensive analysis of existing literature on residential building carbon emissions [43,44,45,46,47,48], we decomposed carbon emissions from urban residential buildings in Jiangsu Province into seven driving factors: population, urbanization rate, per capita energy consumption, energy intensity, economic density, energy consumption per unit building area, and building energy carbon emission coefficient. The extended model is described in Equation (3):
C = P × U P × E U × G E × S G × E S × C E ,
where P represents total municipal population; U/P denotes the urbanization rate, indicating the proportion of urban population to total population; E/U represents per capita urban energy consumption, reflecting the average energy consumption per urban resident; G/E indicates energy intensity, representing the energy consumption required per unit GDP; S/G denotes economic density, indicating the building area that can be constructed per unit GDP; E/S represents energy consumption per unit area, indicating the energy consumption required per unit building area; and C/E represents the building energy carbon emission coefficient, indicating the carbon emissions generated per unit of energy consumption.
This extended Kaya identity framework enables comprehensive analysis of the complex relationships between socioeconomic factors and carbon emissions in the residential building sector, providing a solid foundation for subsequent decomposition analysis and policy formulation.

2.4.2. LMDI Decomposition Method

The logarithmic mean Divisia index (LMDI) method, based on the principle of additive decomposition, enables quantitative analysis of how various driving factors influence carbon emissions from the base year (year 0) to the target year (year t). The LMDI approach offers several advantages, including perfect decomposition (no residual term), ease of interpretation, and theoretical foundation consistency, making it the preferred method for factor decomposition analysis in energy and environmental studies [49].
The impact of each driving factor on carbon emissions from the baseline year to the target year can be expressed through Equation (4). The carbon emission contribution rate represents the ratio of each driving factor’s carbon emission impact to the total carbon emission increment (ΔC).
C = C T C 0 = C T C 0 l n C T l n C 0 × l n C T l n C 0 = C T C 0 l n C T l n C 0 × ( l n P T P 0 + l n U P T U P 0 + l n E U T E U 0 + l n G E T G E 0 +   l n S G T S G 0 + l n E S T E S 0 + l n C E T C E 0 ) = C P + C U P + C E U + C G E + C S G + C E S + C C E ,
where ΔC represents the change in residential building carbon emissions during period T, which equals the sum of all effects; CT and C0 represent residential building carbon emissions in period T and the initial period, respectively; ΔCP represents the population driving effect; ΔCUP represents the urbanization rate driving effect; ΔCEU represents the per capita energy consumption driving effect; ΔCGE represents the energy intensity driving effect; ΔCSG represents the economic density driving effect; ΔCES represents the energy consumption per unit building area driving effect; and ΔCCE represents the building energy carbon emission coefficient driving effect. The detailed formulas for calculating each of these individual contributions are provided in Appendix A.
The positive or negative values of these contributions indicate the promoting or inhibiting effects of these factors on residential building carbon emissions, respectively. A positive contribution suggests that the factor promotes carbon emission growth, while a negative contribution indicates that the factor helps reduce carbon emissions. This decomposition approach enables policymakers to identify the most significant drivers of carbon emissions and develop targeted intervention strategies accordingly.

2.5. System Dynamics Model

2.5.1. Overview of System Dynamics Methodology

SD, conceptualized by Forrester in 1958, represents a rigorous methodology for analyzing the complexity of socioeconomic systems. It prioritizes understanding system structure over the precision of individual data elements, making it particularly suitable for addressing complex, non-linear problems with multiple interdependent variables. Despite certain uncertainties in variable parameters, SD has demonstrated considerable efficacy in predicting building carbon emission trajectories and formulating carbon reduction strategies [20]. Furthermore, SD has matured significantly in facilitating strategic policy formulation and decision-making processes, enabling simulation of how various determinants influence expected outcomes.
To provide detailed analysis of dynamic interactions among different driving effects and examine the evolutionary mechanisms among multiple system factors, this study employs SD modeling to predict future building carbon emissions. The SD model integrates Kaya extension factors with other determinants related to Jiangsu Province’s residential building emissions, organizing them into four interconnected subsystems: economic, social, energy, and policy subsystems (see Appendix B for detailed definitions).

2.5.2. Causal Loop Diagram

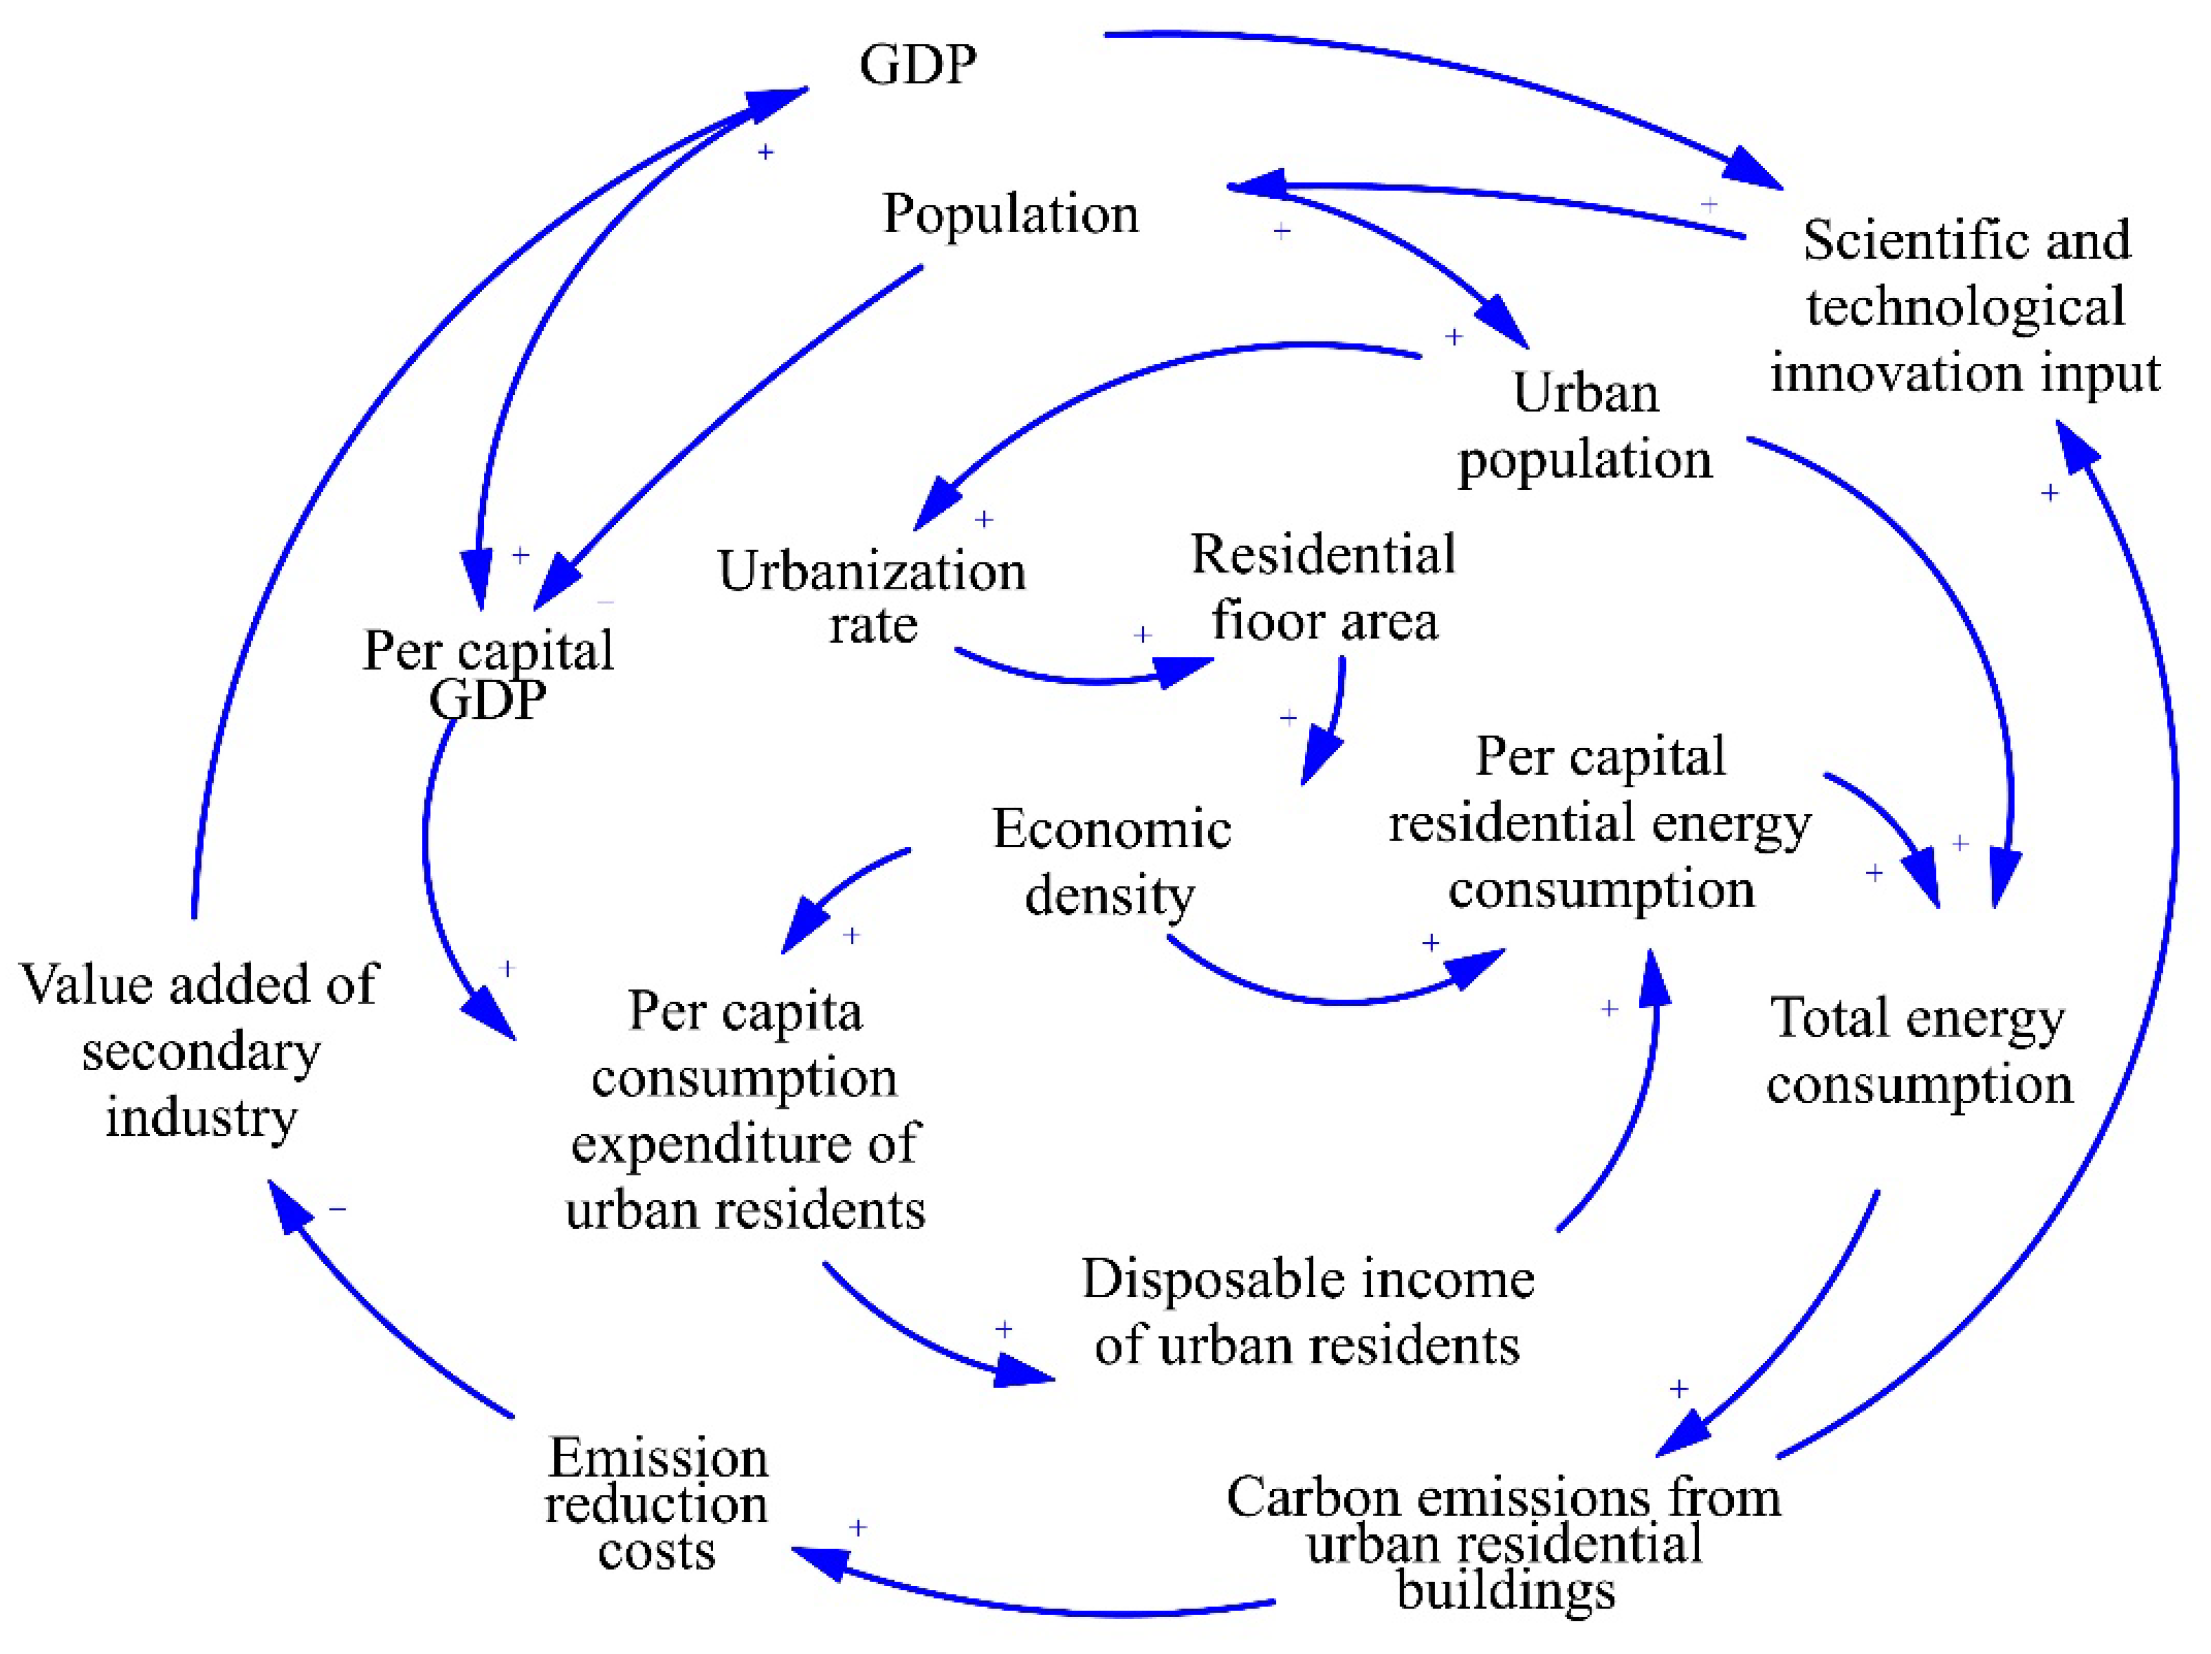
The SD causal loop diagram elucidates the interdependencies and influences among system elements, clearly illustrating how positive feedback loops amplify system responses while negative feedback loops provide stability. The causal loop diagram for the carbon emission system of urban residential buildings in Jiangsu Province is presented in Figure 3, revealing several key feedback mechanisms that drive system behavior.
The causal loop diagram reveals several critical feedback loops that characterize the system dynamics:
(1) Economic growth and emission reduction feedback loop
GDP → +Scientific and technological innovation input → +Population → +Urban population → +Total energy consumption → +Carbon emissions from residential buildings → +Emission reduction costs → −Value added of secondary industry → +GDP
(2) Income-driven energy consumption loop
Per capita GDP → +Per capita consumption expenditure of urban residents → +Disposable income of urban residents → +Per capita residential energy consumption → +Total energy consumption → +Carbon emissions from residential buildings → +Scientific and technological innovation input → +Population → −Per capita GDP
(3) Urbanization and energy demand loop
Population → +Urban population → +Urbanization rate → +Residential floor area → −Economic density → +Per capita residential energy consumption → +Total energy consumption → +Carbon emissions from residential buildings → +Scientific and technological innovation input → +Population
(4) Industrial development and emission feedback loop
Value added of secondary industry → +GDP → +Per capita GDP → +Per capita consumption expenditure of urban residents → +Disposable income of urban residents → +Per capita residential energy consumption → +Total energy consumption → +Carbon emissions from residential buildings → +Emission reduction costs → −Value added of secondary industry
These feedback loops demonstrate the complex interactions between economic development, population dynamics, urbanization processes, and carbon emissions, highlighting the need for integrated policy approaches that consider these systemic relationships. The parameter flows and cross-linking factors in the causal loop diagram are defined based on established economic theory, empirical research findings, and logical relationships derived from the Kaya identity decomposition. Positive linkages (+) indicate that an increase in the driving variable leads to an increase in the driven variable, while negative linkages (−) represent inverse relationships. For example, the positive relationship between GDP and scientific and technological innovation input reflects the established economic principle that higher economic output enables greater R&D investment, supported by endogenous growth theory and empirical studies on innovation spending patterns. Similarly, the negative relationship between carbon emissions and value-added of secondary industry reflects the constraint effect of emission reduction costs on industrial output, consistent with environmental economics literature. The cross-linking factors are assigned through a combination of correlation analysis of historical data (2005–2020), expert judgment based on domain knowledge, and validation against established relationships in energy-economy models. Each relationship underwent sensitivity testing to ensure the model’s robustness and alignment with observed provincial trends.

2.5.3. Stock and Flow Diagram

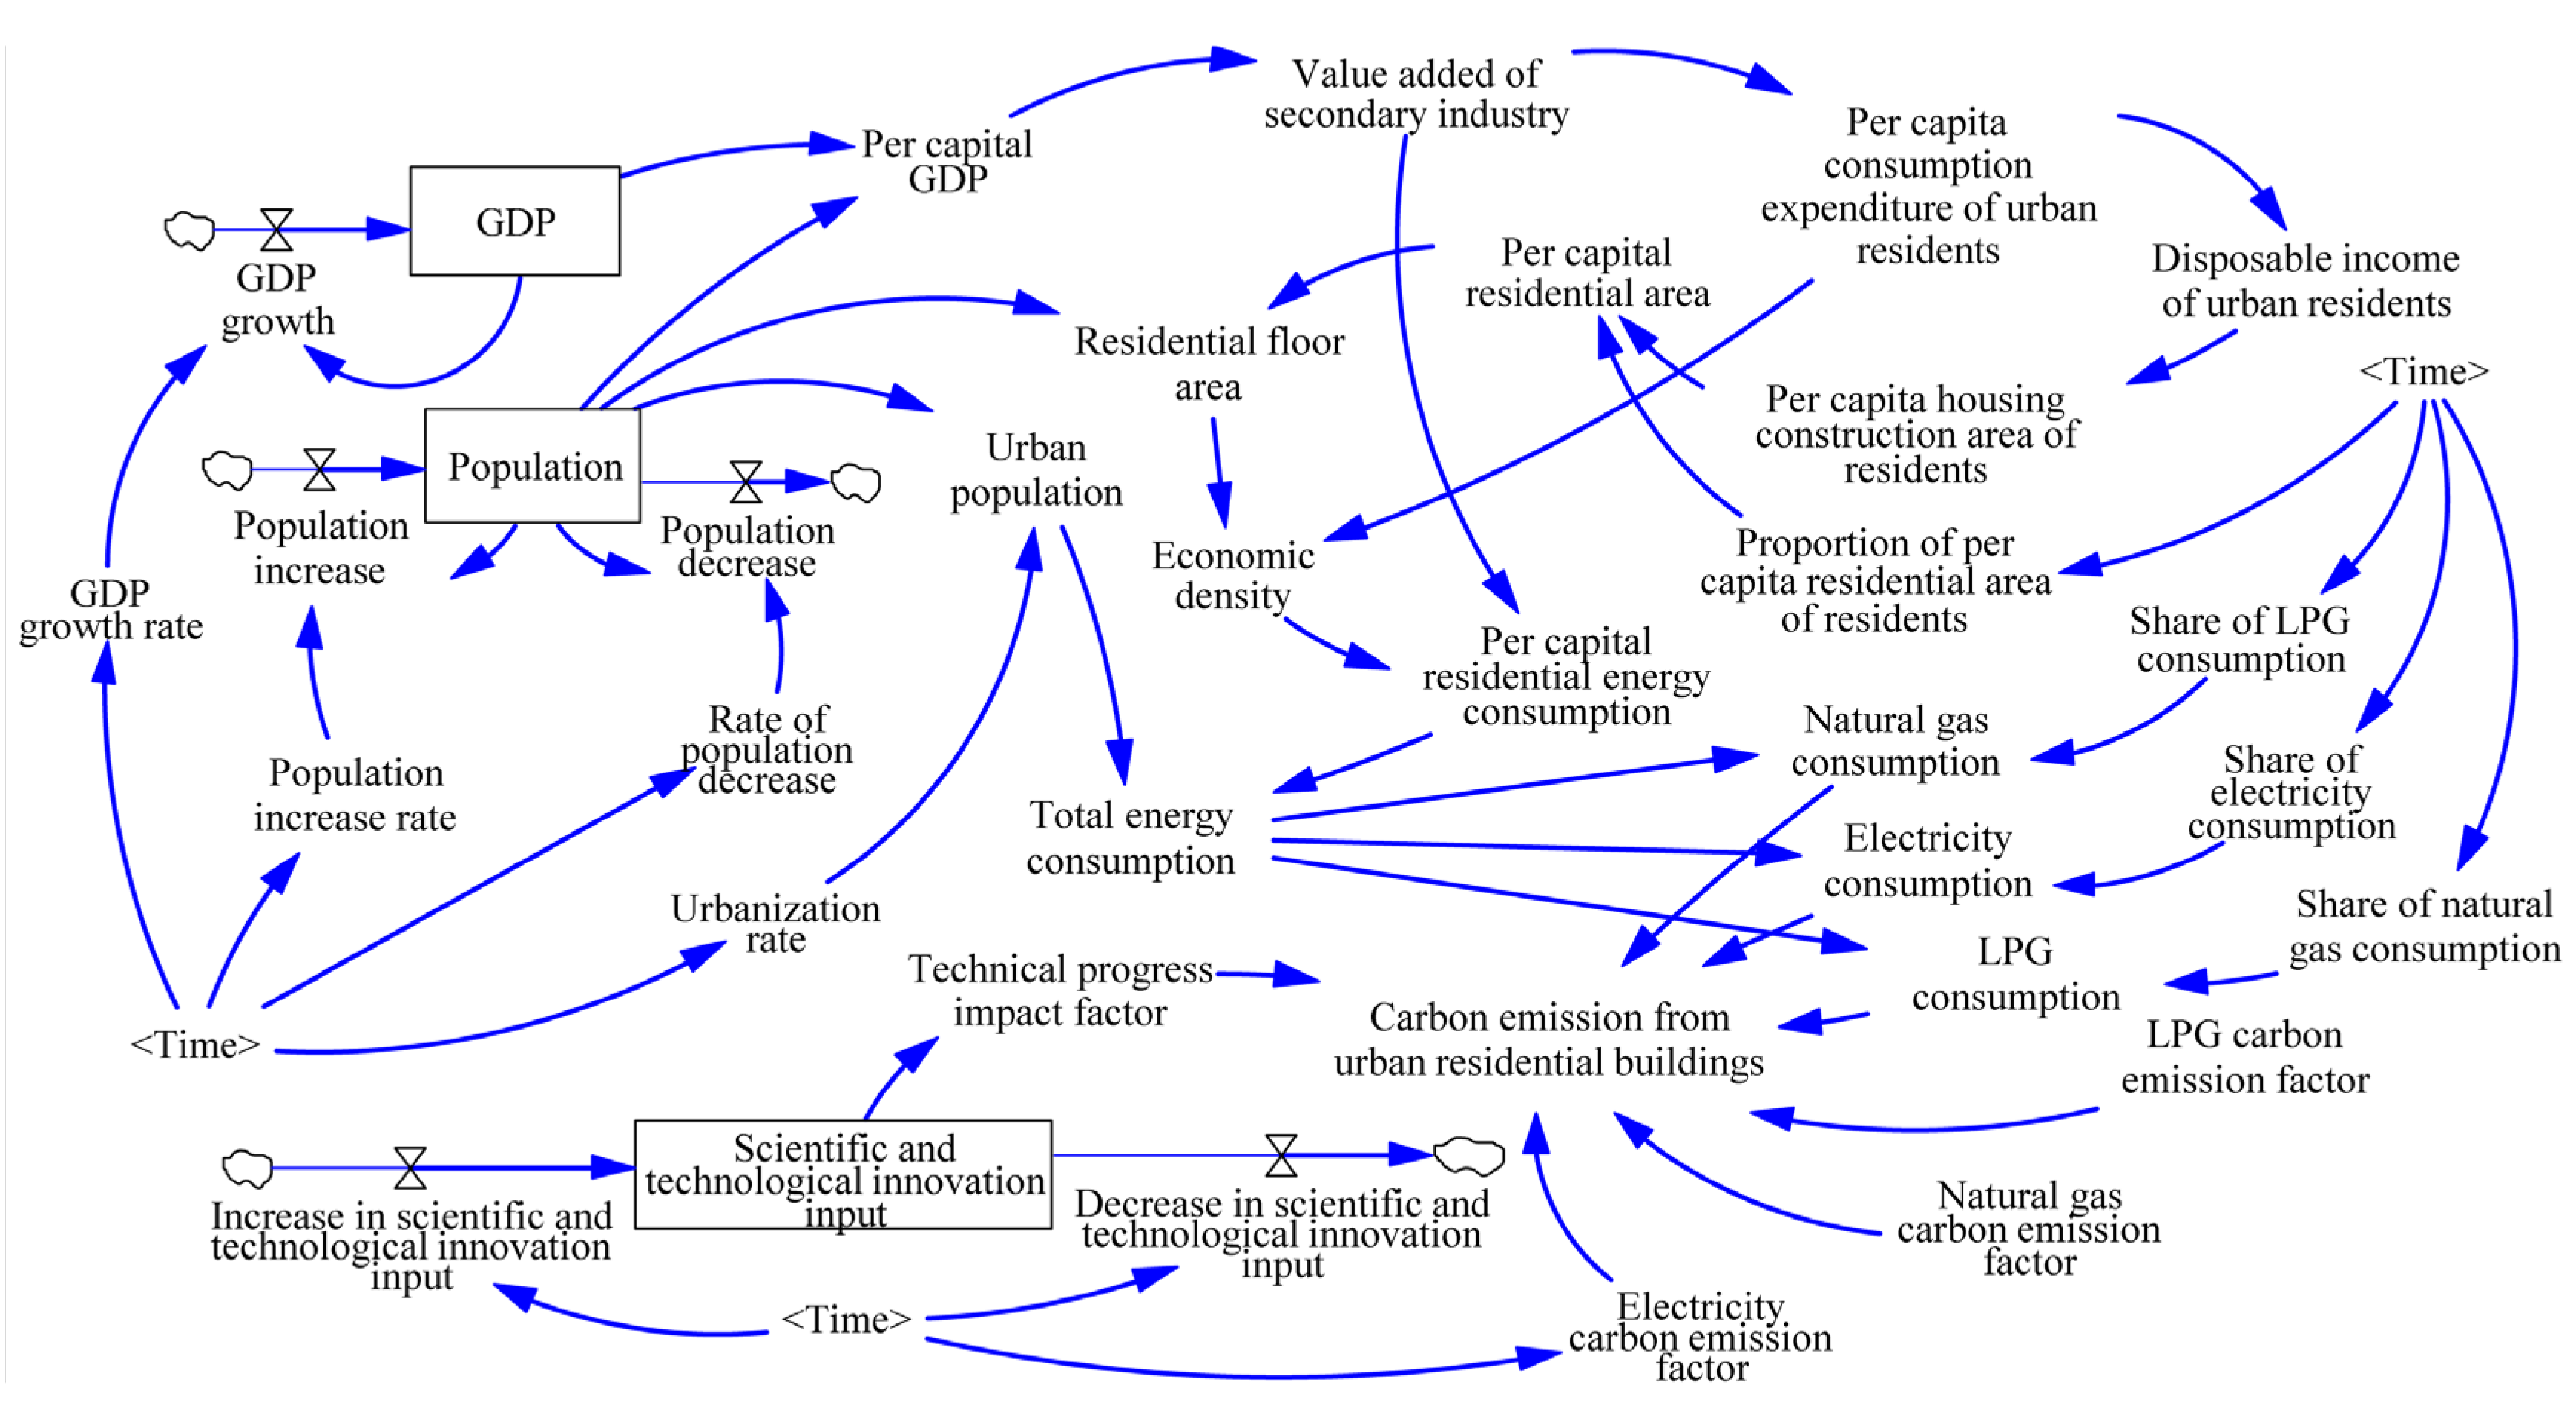
To conduct quantitative and accurate analysis of carbon emissions from residential buildings in Jiangsu Province, the province was divided into three regions (Southern Jiangsu, Central Jiangsu, and Northern Jiangsu) based on carbon emission distribution patterns, economic development levels, and administrative divisions. Each region developed its own stock and flow diagram based on the causal loop framework for their respective residential building carbon emission systems, as illustrated in Figure 4.
The SD models for Southern Jiangsu, Central Jiangsu, and Northern Jiangsu comprise 35 variables each. The model structure includes 3 stock variables representing GDP, population, and scientific and technological innovation input, which serve as the primary accumulation elements in the system. Additionally, 4 flow variables capture the rates of change, including GDP growth rate, population growth rate, population decline rate, and urbanization rate. The models also incorporate 2 constants representing carbon emission factors for natural gas and liquefied petroleum gas, ensuring consistency in emission calculations across scenarios. Furthermore, 26 auxiliary variables facilitate various intermediate calculations and capture derived parameters essential for system dynamics.
The stock and flow diagram provides a comprehensive representation of the dynamic relationships between different subsystems. Stock variables represent accumulations in the system, such as total GDP or population, while flow variables represent rates of change that affect these accumulations over time. The auxiliary variables facilitate calculations and capture intermediate relationships between the primary variables, enabling detailed analysis of system behavior under different conditions.
This study employed three methodological approaches for constructing system parameters and equations. Constant input was used for stable factors that remain relatively unchanged over the study period. Mathematical derivation was applied for relationships with established theoretical foundations, ensuring consistency with existing economic and environmental theories. Regression analysis was utilized for empirically determined relationships where historical data patterns provide the most reliable basis for parameter estimation. This multi-method approach ensures both theoretical rigor and empirical validity in model construction.
The model structure enables comprehensive simulation of changes in policy variables, such as technological innovation investment, economic factors including GDP growth rates, social dynamics encompassing population and urbanization trends, and energy policies such as carbon emission factors interact to influence overall carbon emissions from residential buildings in each region of Jiangsu Province.
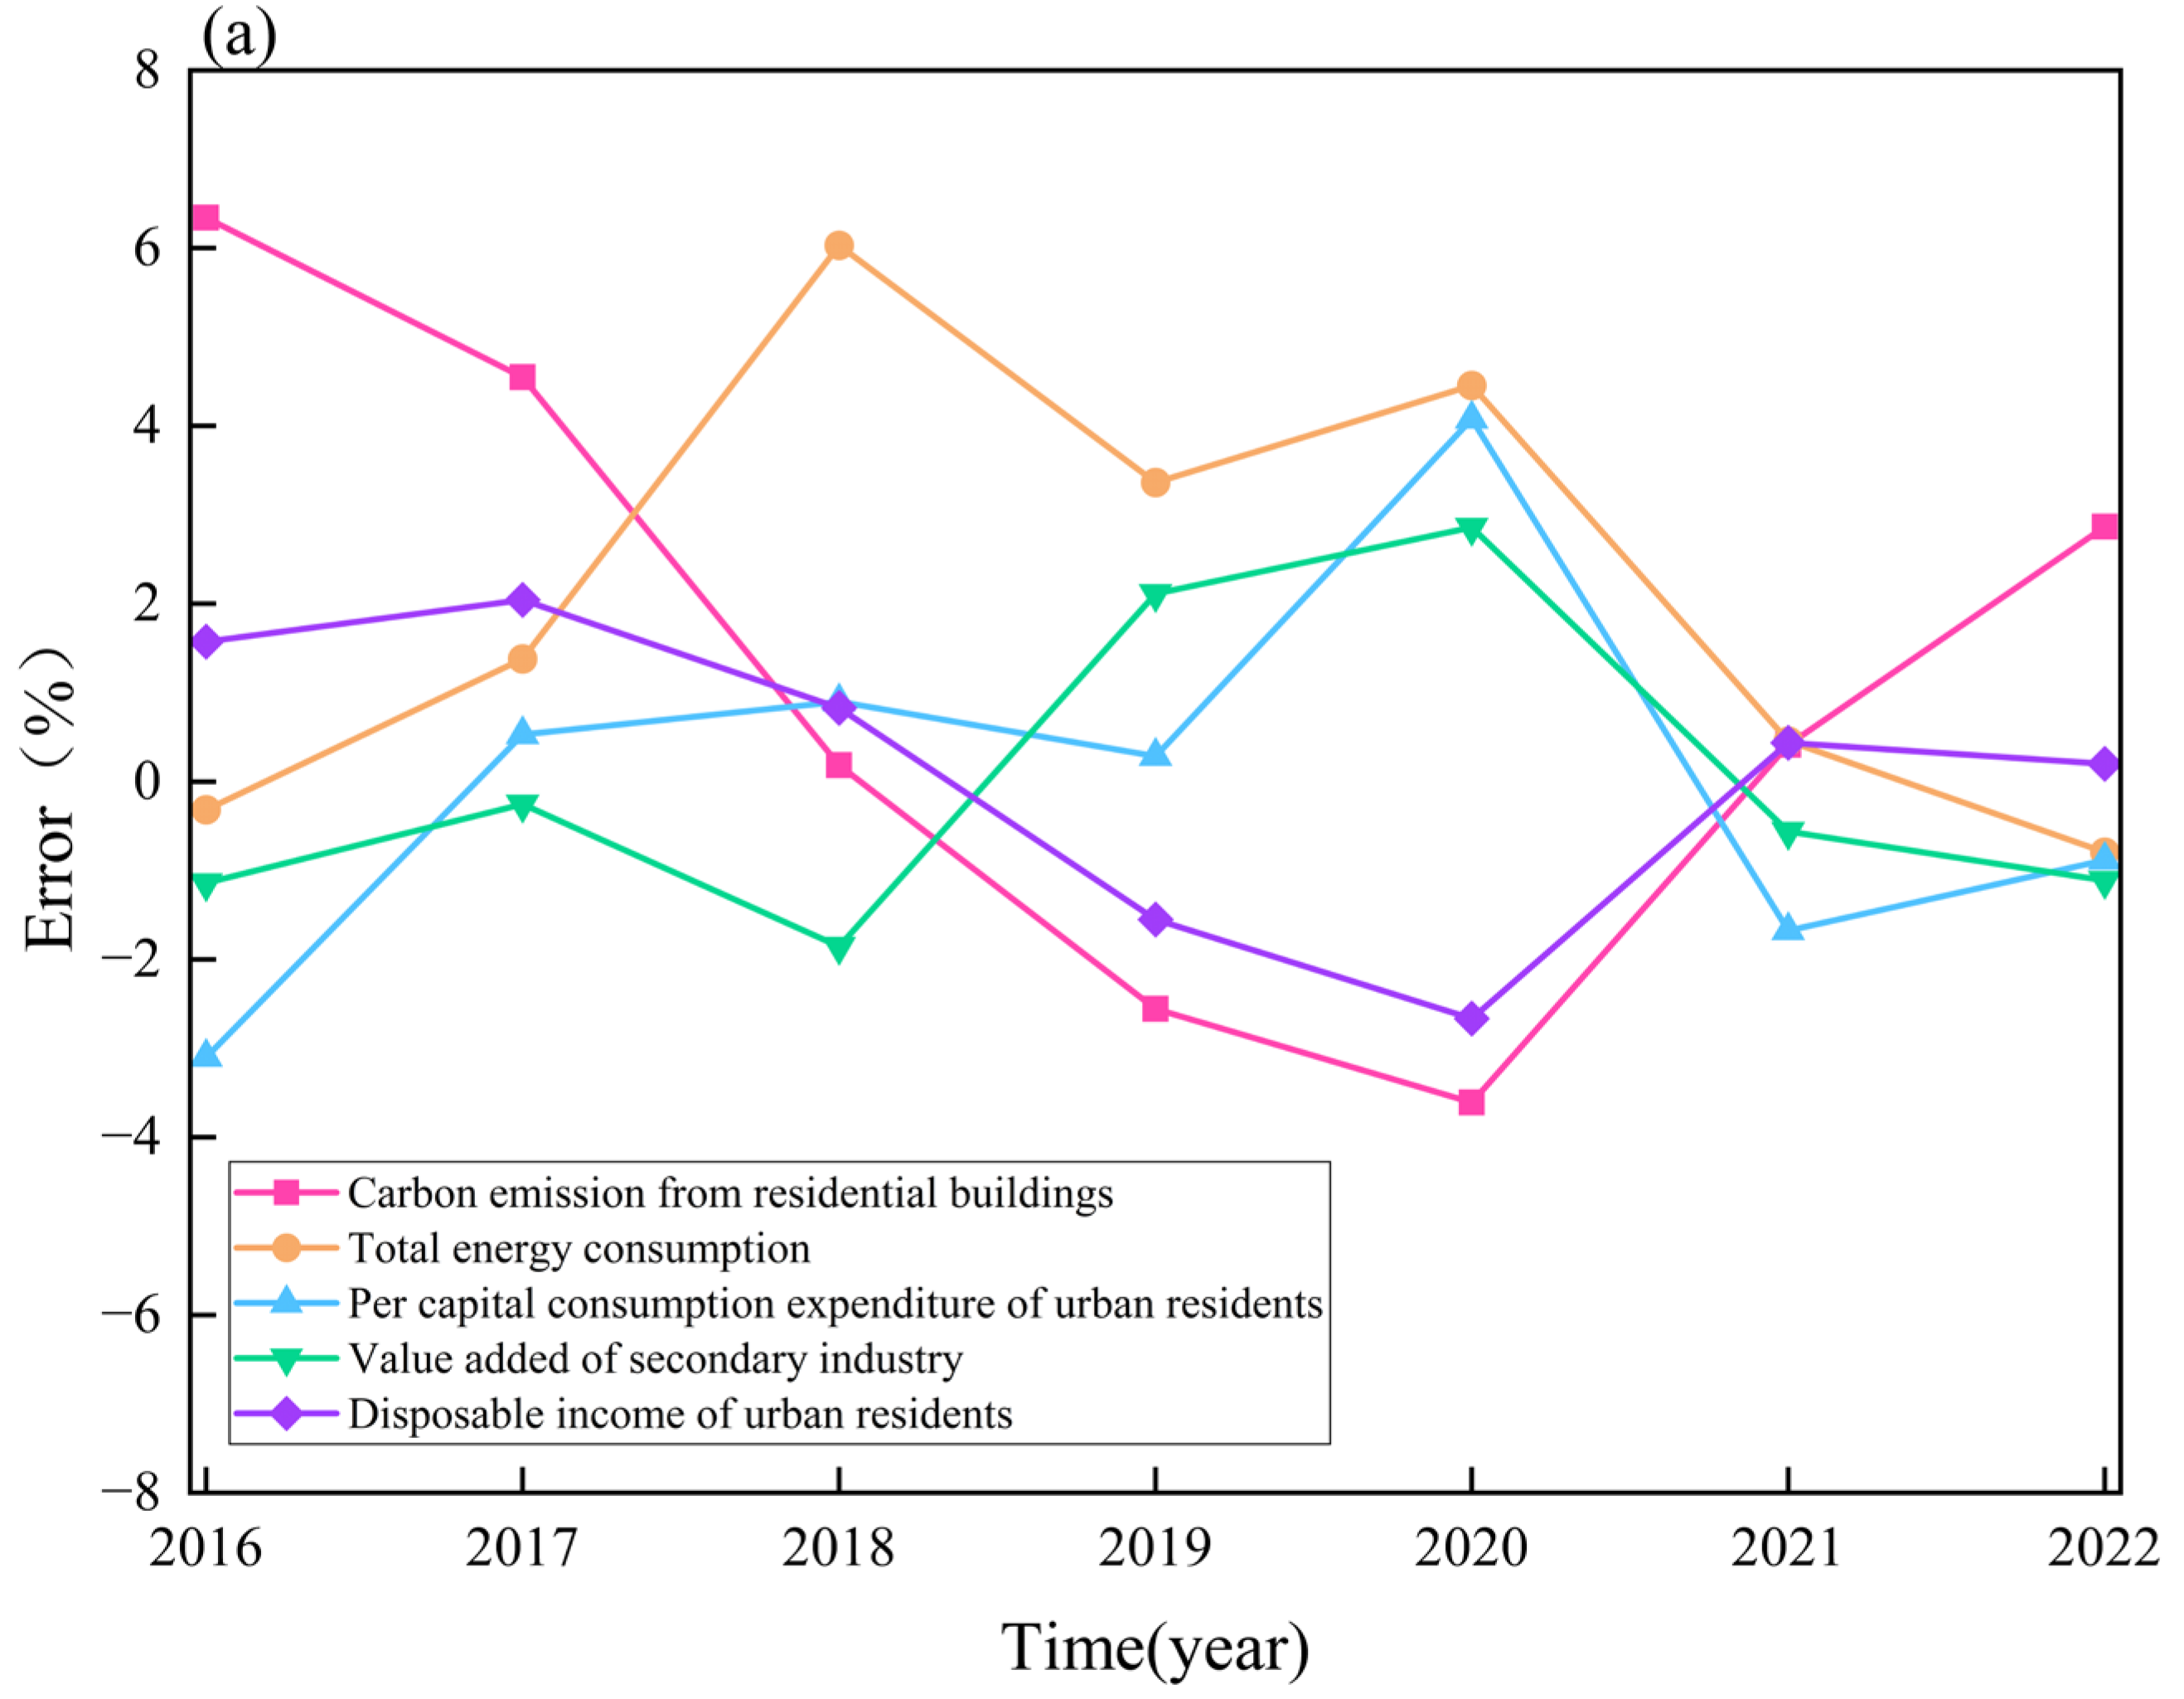
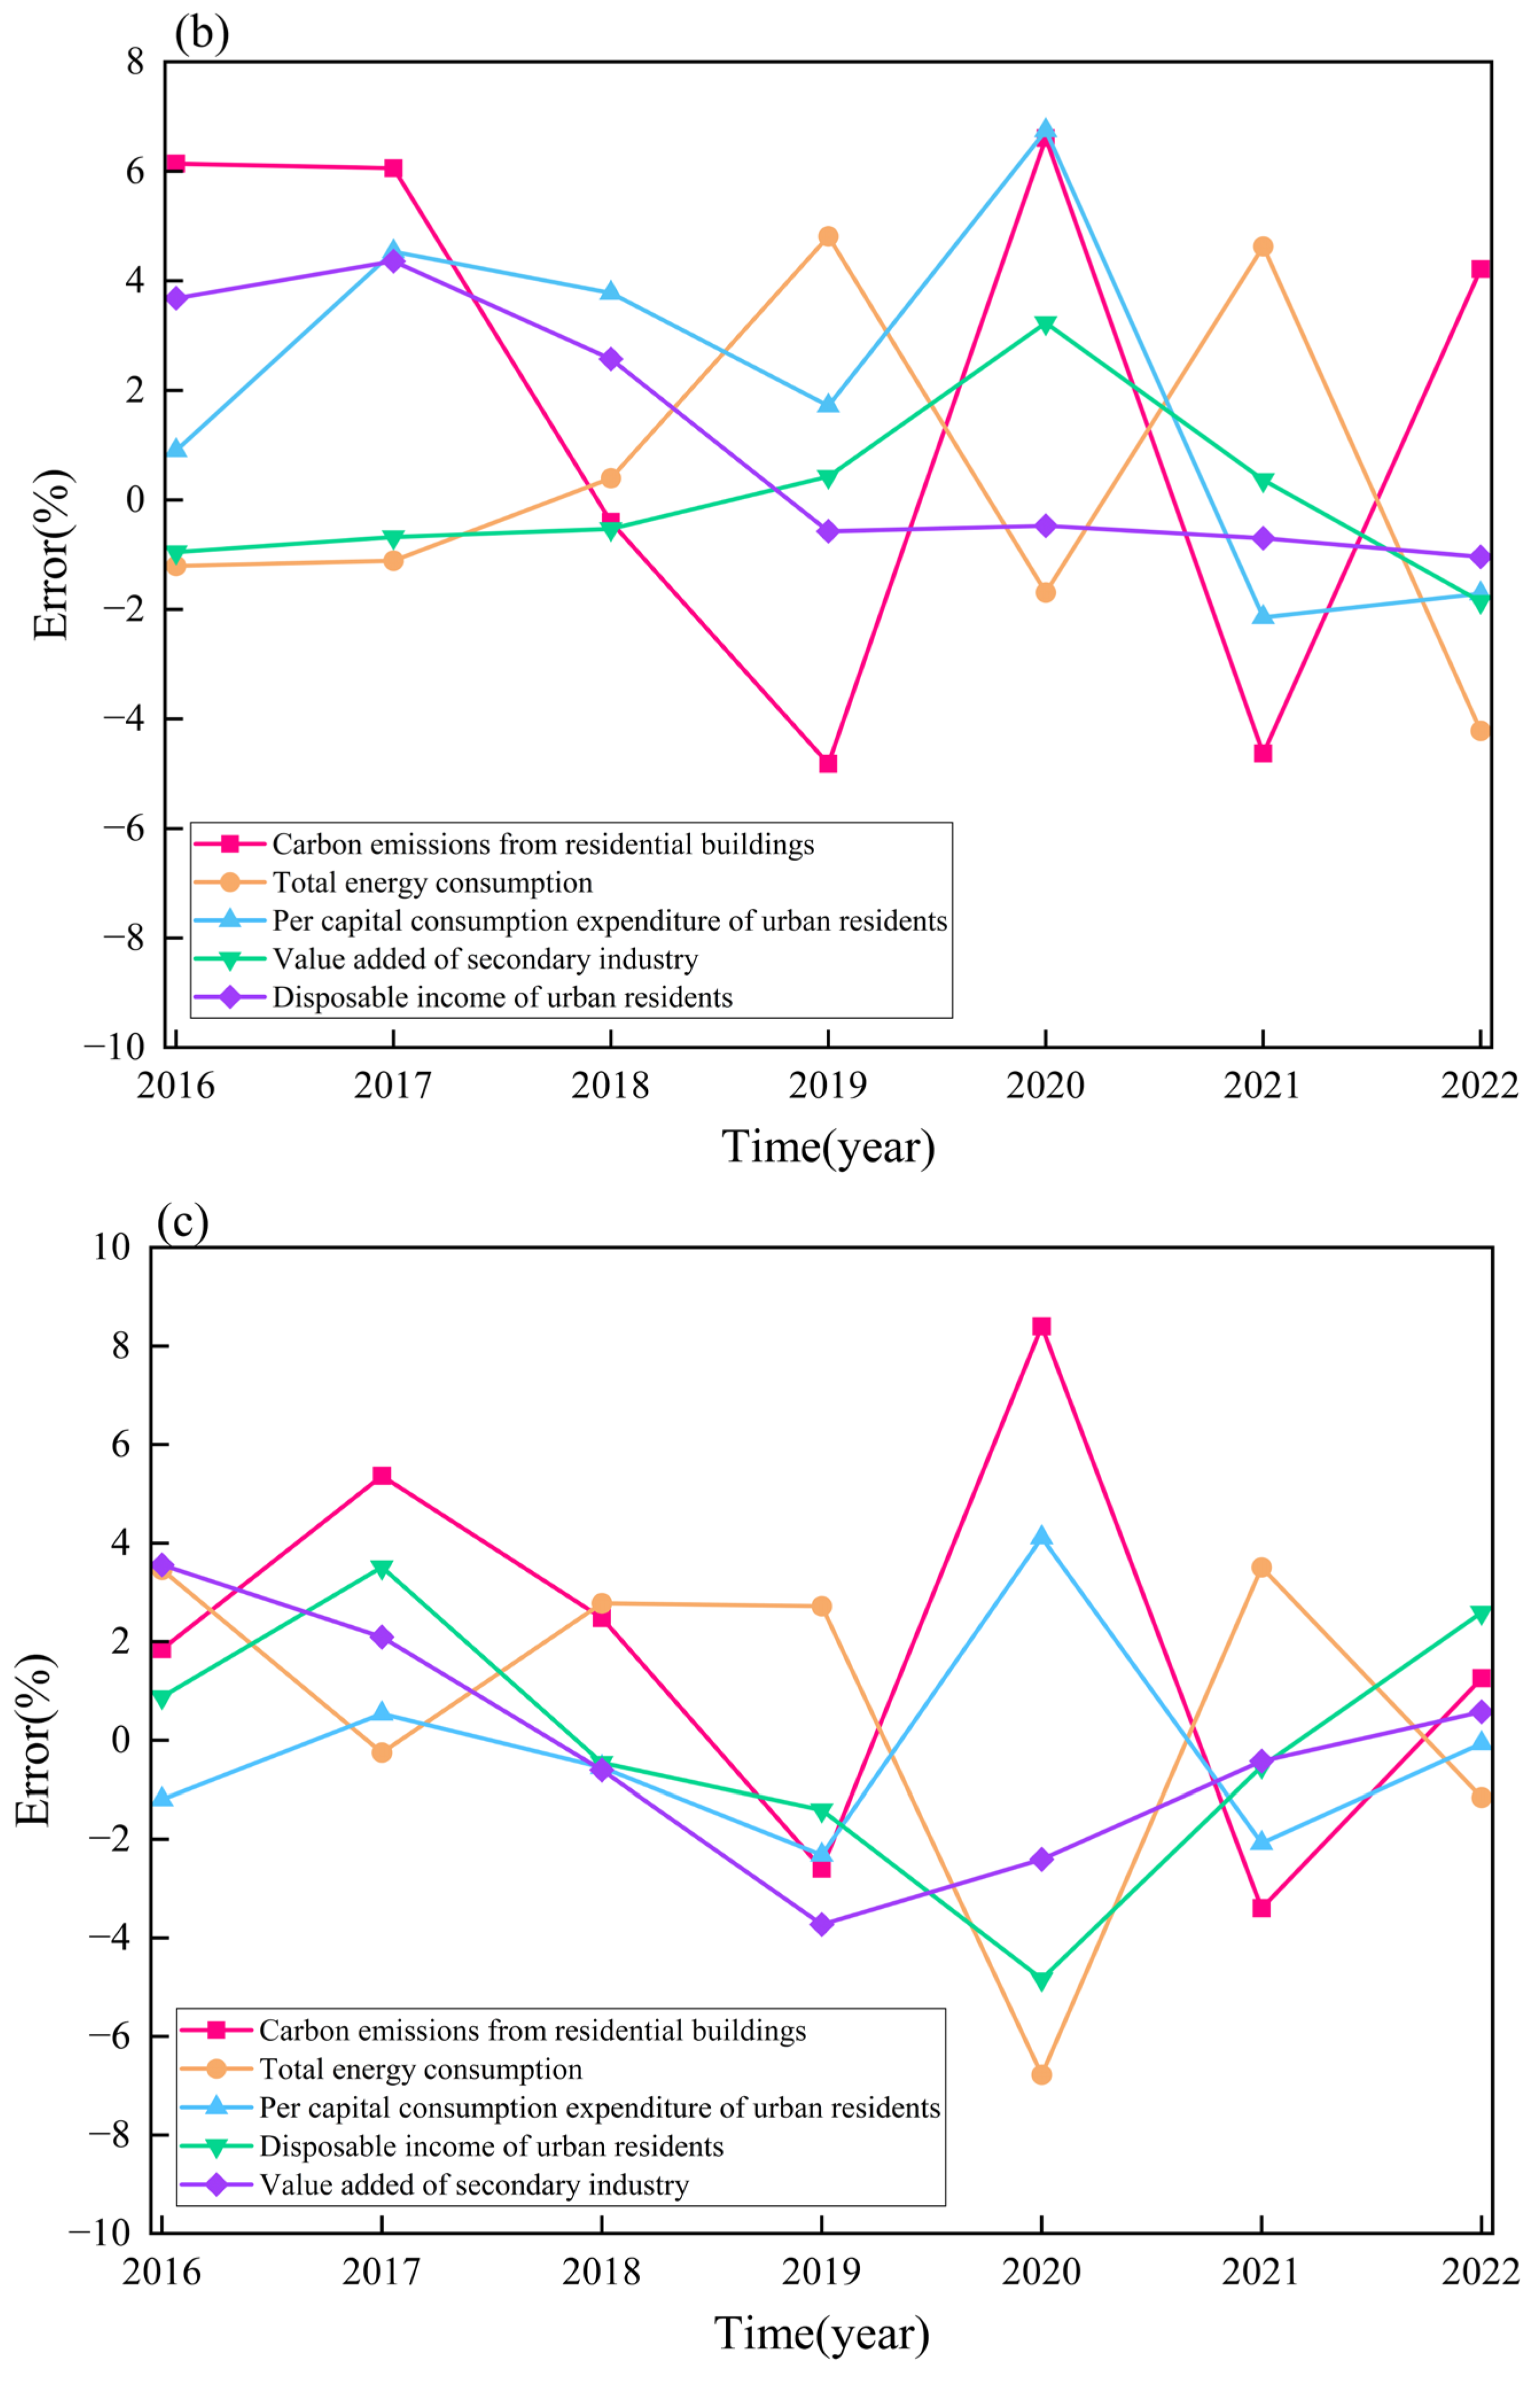
To ensure model reliability and validity, comprehensive validation tests were conducted, including historical validation against 2016–2022 data and stability testing with different time steps. Detailed validation procedures and results are provided in Appendix C, demonstrating satisfactory model performance with all indicators showing absolute errors within 10%.

2.5.4. Scenario Design and Policy Simulation

The key factors influencing carbon emissions from residential buildings in Jiangsu Province are categorized into economic, social, energy, and policy dimensions. Therefore, this study is guided by policies from both Jiangsu Province and the national level, focusing on these dimensions to conduct comprehensive scenario analysis. The following key variables were identified: GDP growth rate, population growth rate, urbanization rate, natural gas consumption share, electricity consumption share, carbon emission factor, and scientific and technological innovation input. Given the uncertainties brought by future environmental, technological, and policy changes, multiple scenarios were simulated to encompass a range of outcomes, thereby strengthening the assessment of carbon reduction strategies. Consequently, four scenarios were developed by adjusting these variables: BS, LCS, EGS, and CS.
The BS predicts future trends based on historical patterns and strategic targets issued by the government, excluding emergency situations such as economic crises, climate disasters, and major policy changes. The LCS gradually relies on clean energy, with increased government investment in scientific innovation and gradual improvement in urbanization levels, but with relatively slower GDP and population growth compared to the BS. The EGS prioritizes rapid GDP development, with faster urbanization and population growth compared to the low carbon scenario, leading to increased energy consumption, while investment in scientific innovation is lower than in the low carbon scenario. The CS supplements both the low carbon and economic development scenarios, featuring moderate economic and population development, improved urbanization levels, and increased investment in scientific innovation. This scenario can effectively mitigate carbon emissions while maintaining moderate economic growth.
The electricity consumption share, natural gas consumption share, and electricity carbon emission factor for 2031–2035 represent the annual average growth rates (values) of these factors. The specific parameters for the four scenarios across the three regions are detailed in Appendix D.

2.6. Tapio Decoupling Model

This study employs the Tapio decoupling model, introducing decoupling indicators to analyze the decoupling status between economic growth and carbon emissions in the study regions over the years. The decoupling status is determined by analyzing the decoupling coefficient and the magnitude of changes in gross domestic products and carbon emissions. The decoupling status indicators are shown in Table 1. The Tapio decoupling model is expressed as follows in Equation (5) [50]:
T = Δ C / C t 1 Δ G / G t 1 ,
where T represents the decoupling index; ΔC and ΔG represent the changes in carbon emissions and GDP, respectively; Ct−1 and Gt−1 represent carbon emissions and GDP in the previous year, respectively.
The Tapio decoupling model enables comprehensive assessment of the relationship between economic development and environmental impact by categorizing the decoupling status into eight distinct types. Strong decoupling represents the ideal scenario where economic growth continues while carbon emissions decrease, indicating successful absolute decoupling of economic activity from environmental pressure. Weak decoupling occurs when both economic growth and carbon emissions increase, but the rate of emission growth is slower than economic growth, representing relative decoupling. The model also identifies various negative decoupling and connection states that indicate less favorable relationships between economic and environmental performance.
This analytical framework provides valuable insights for evaluating the effectiveness of carbon reduction policies and identifying periods when economic growth has been successfully separated from carbon emission increases. The decoupling analysis complements the system dynamics modeling results by offering a historical perspective on economic-environmental relationships and establishing benchmarks for assessing future scenario outcomes.

3. Results

3.1. Spatial-Temporal Distribution of Residential Building Carbon Emissions

3.1.1. Temporal Evolution and Spatial Patterns

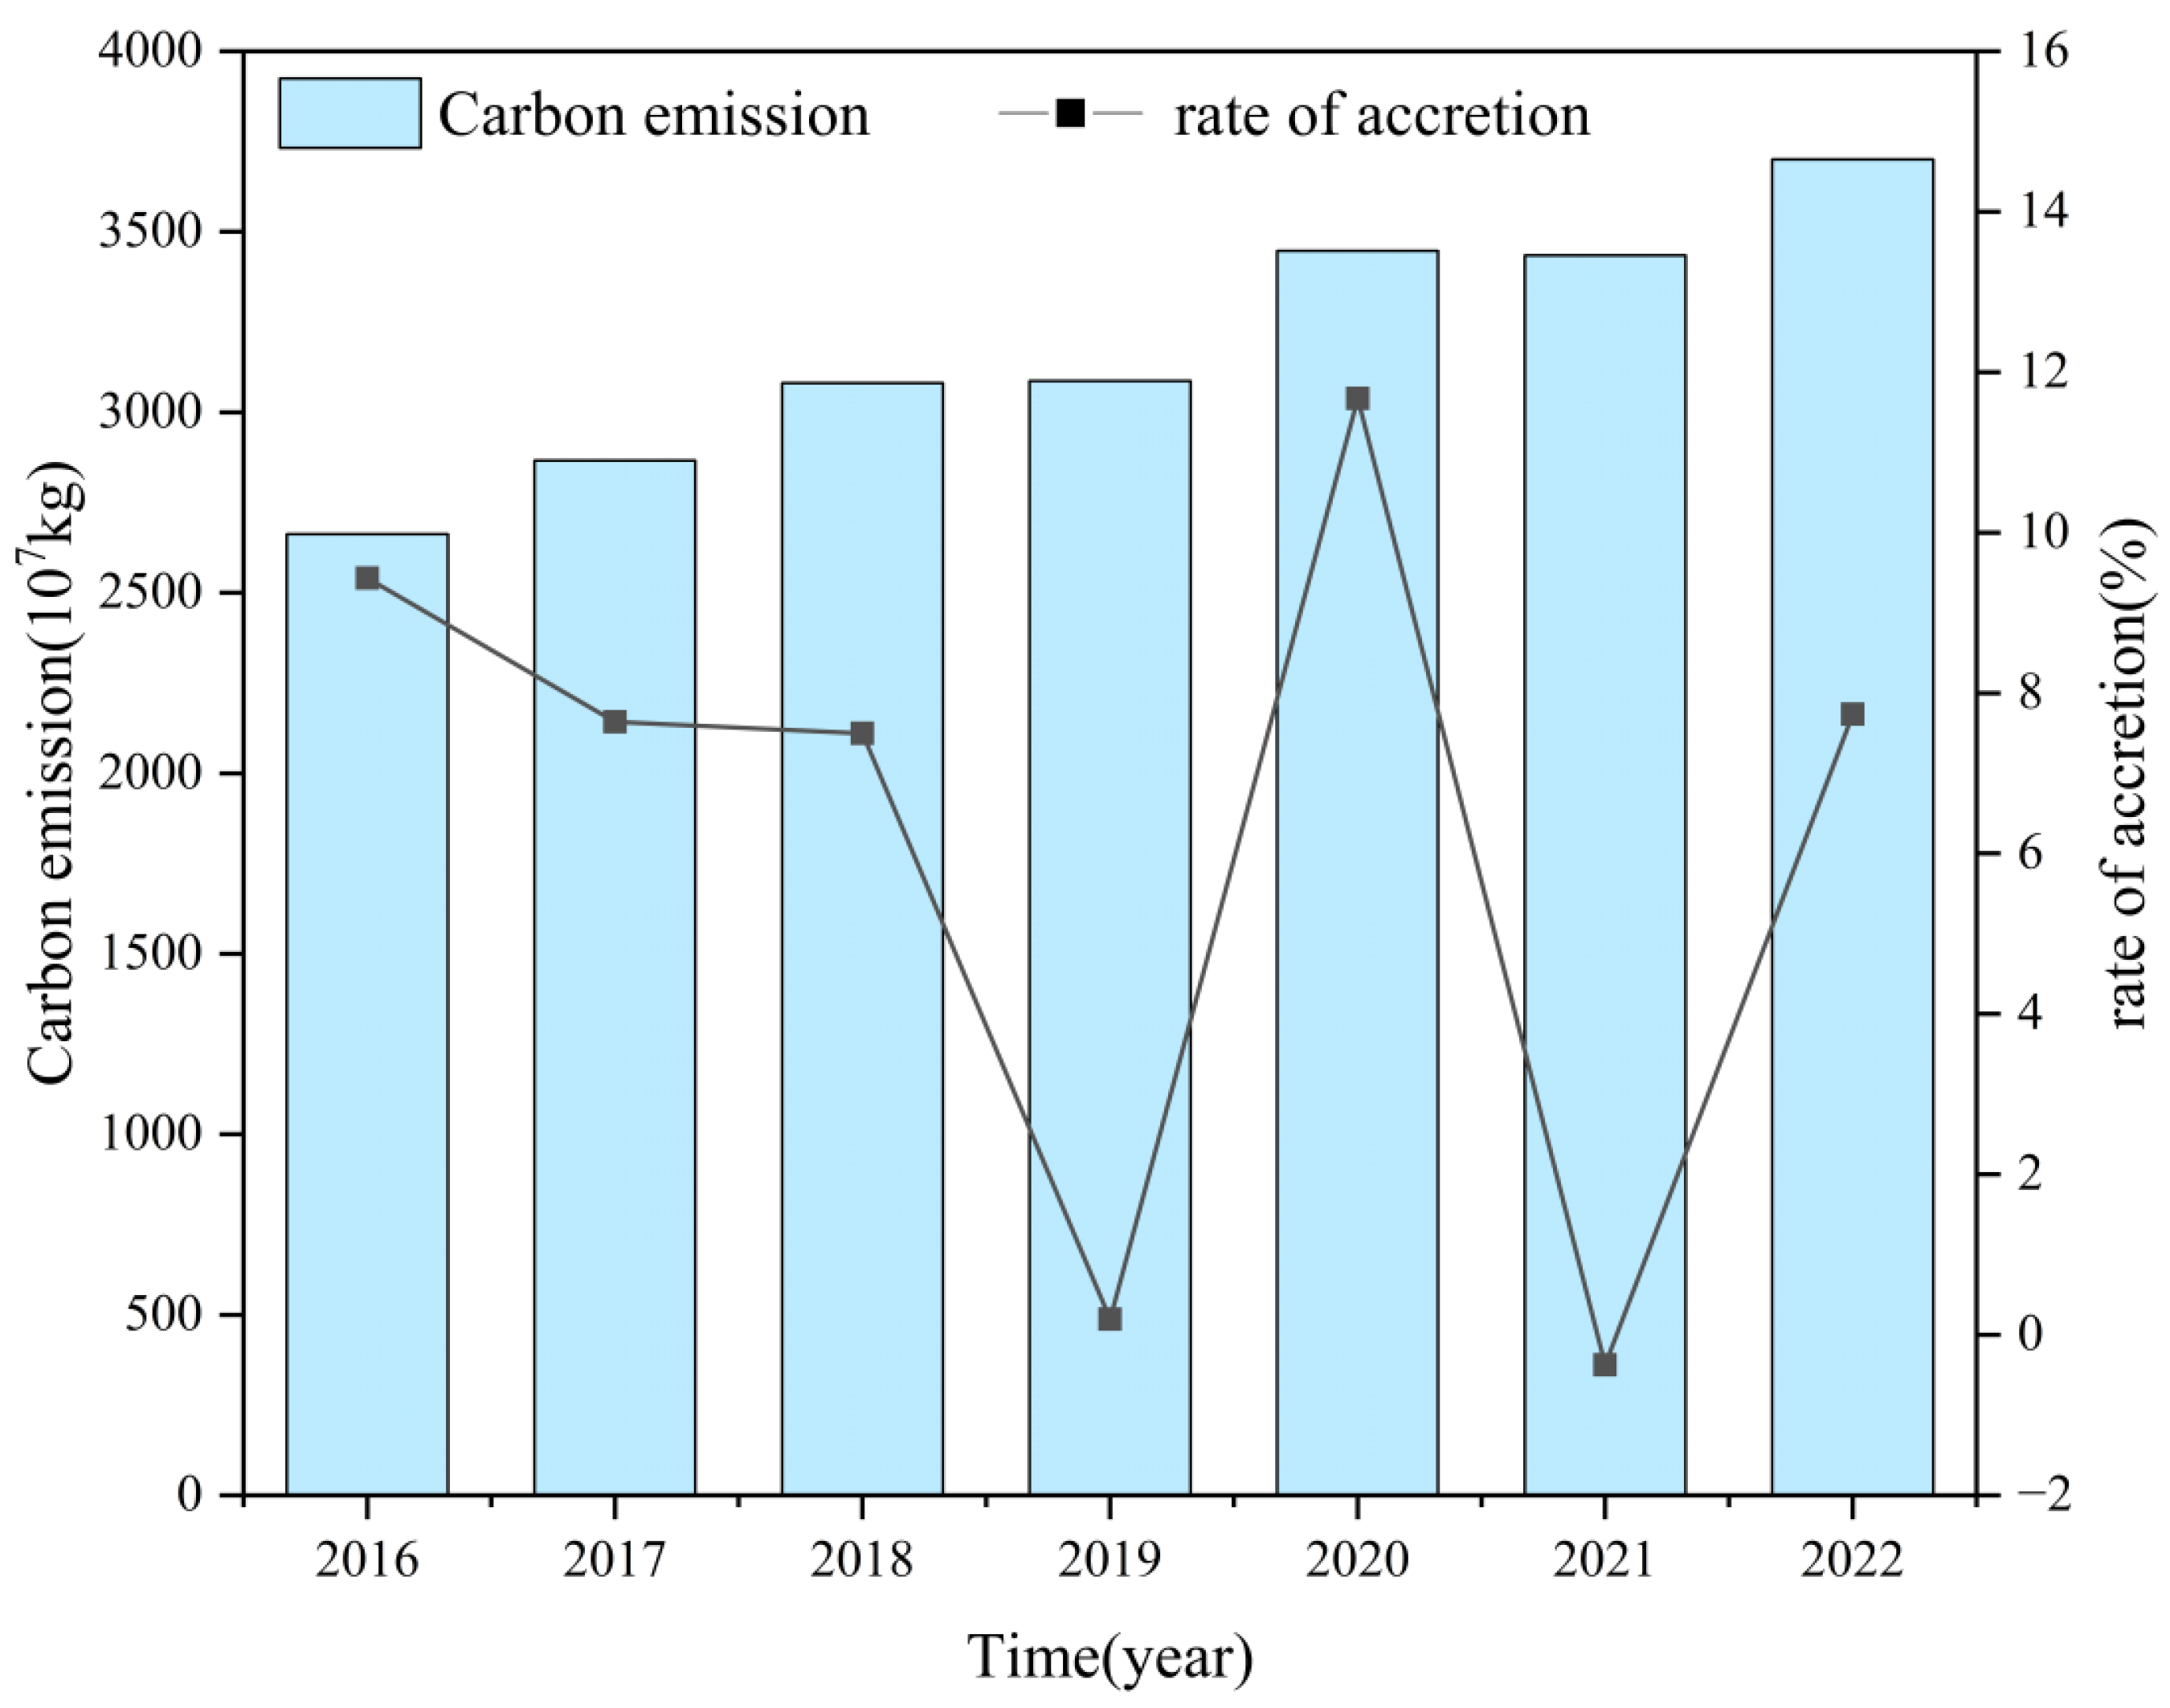
As shown in Figure 5, Carbon emissions from urban residential buildings in Jiangsu Province reached 37.00 million tons in 2022, representing a substantial 38.96% increase from 2016 levels. During 2016–2018, national policies promoting green sustainable development and ecological civilization construction contributed to a deceleration in emission growth rates. The period from 2018–2022 exhibited a distinctive “W-shaped” growth pattern, with near-zero growth rates observed in 2018–2019 and 2020–2021. This was primarily attributed to the COVID-19 pandemic outbreak in 2019, which reduced urban residents’ energy consumption. Additionally, policy interventions such as the 2021 “Jiangsu’s 14th Five-Year Plan on Green Building High-Quality Development” [36] effectively suppressed residential building carbon emissions. Conversely, the 2019–2020 period witnessed an 11.67% growth surge due to stringent pandemic prevention measures that dramatically increased household energy consumption [51]. Following pandemic recovery in 2021–2022, emissions continued their upward trajectory.
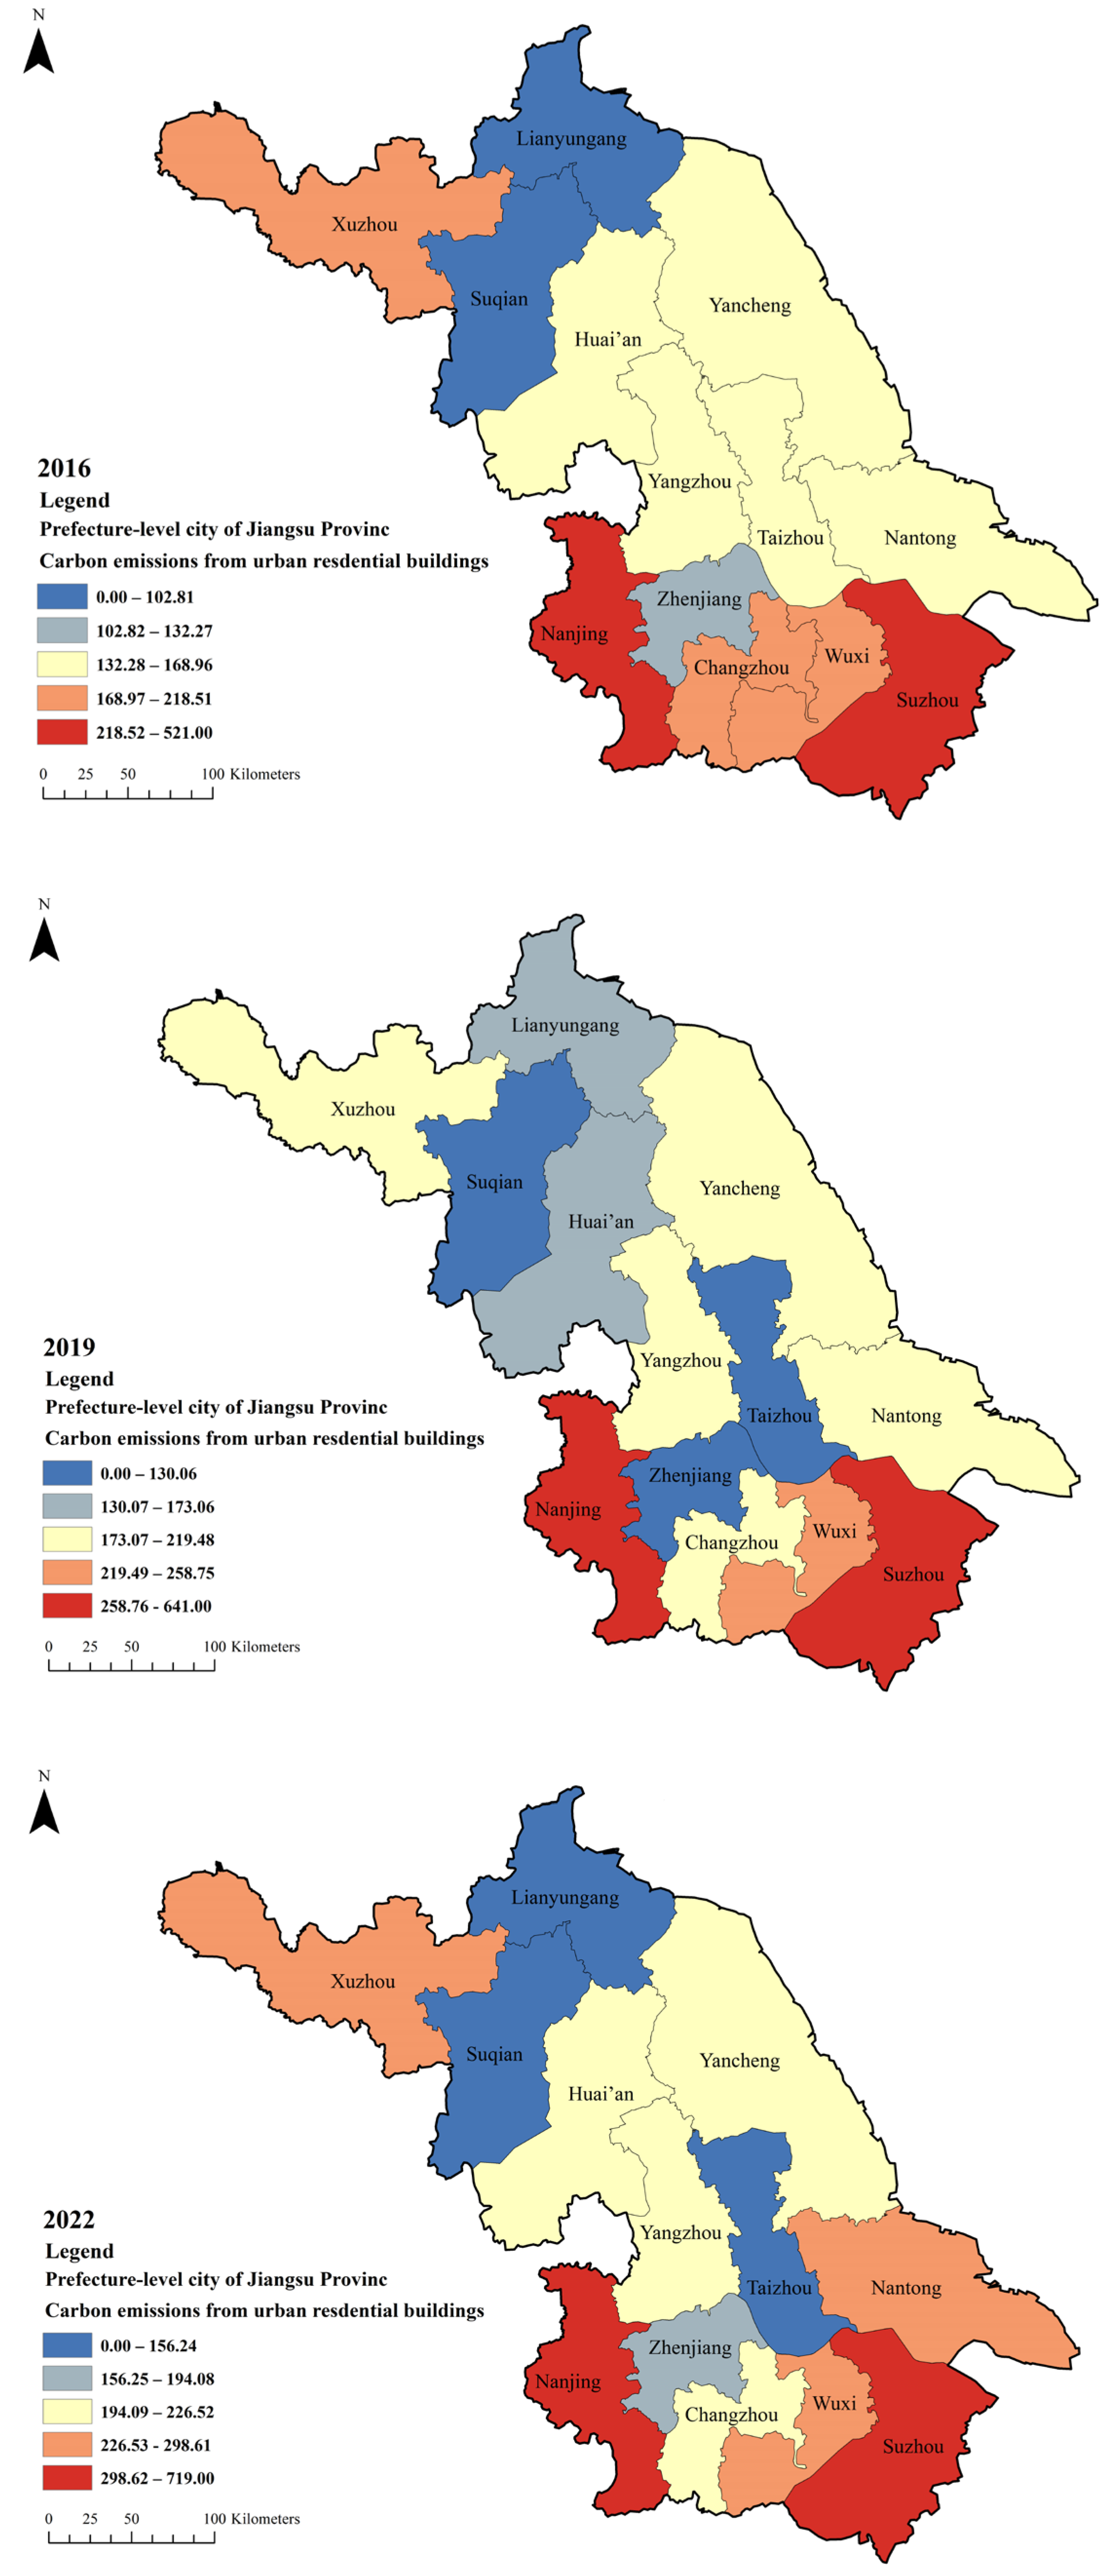
Based on the natural breakpoint method, this study classified carbon emissions from residential buildings in Jiangsu Province into five categories from low to high: low emission areas, medium-low emission areas, medium emission areas, medium-high emission areas, and high emission areas. The spatial characteristics of residential building carbon emissions in 2016, 2019, and 2022 were analyzed, as shown in Figure 6. The spatial characteristics of residential building carbon emissions in Jiangsu Province exhibit a pattern of “high in the south and low in the north, high in the west and low in the east.” This pattern formation is attributed to the faster development of clean energy such as wind power in the eastern and northern coastal areas of Jiangsu Province, while these regions lag economically behind the western and southern areas, experiencing serious population outflow.
From 2016 to 2022, only Nantong City changed from a medium emission area to a medium-high emission area. Since 2016, Nantong City has vigorously developed new energy sources such as hydrogen and nuclear power, faced significant financial pressure and slowed down the renovation of old residential areas. At the same time, to promote the electrification of urban logistics delivery vehicles, many charging infrastructure facilities were constructed [52]. The increased electricity consumption ultimately led to an increase in carbon emissions from urban residential buildings.
In contrast, Changzhou and Taizhou both achieved emission reductions, transitioning from medium-high and medium emission categories to medium and medium-low categories, respectively. These improvements primarily resulted from reduced fossil fuel dependency as both cities embraced green building practices and low-carbon development strategies. The cities’ focus on optimizing energy structure and implementing energy efficiency measures contributed to significant carbon emission reductions in their residential building sectors.

3.1.2. Spatial Autocorrelation Findings

Global Moran’s Index analysis was conducted to assess spatial autocorrelation patterns of residential building carbon emissions across Jiangsu’s prefecture-level cities from 2016–2022 (Table 2).
Results demonstrate consistently positive Moran’s Index values throughout the study period, with significant spatial correlation (p < 0.05) observed in all years except 2022. The strength of spatial clustering intensified from 2016–2020, with Moran’s Index increasing from 0.143 to 0.735, indicating increasingly concentrated carbon emission patterns among neighboring cities. However, the index declined sharply during 2021–2022, attributed to pandemic-induced economic disruption and varying regional recovery rates. The peak values in 2019–2020 suggest that carbon emissions exhibit strong positive spatial dependence, with high-emission cities clustering together and influencing neighboring areas through economic linkages and spillover effects.
Moran’s Index analysis reveals a pronounced stepwise decline in inter-regional carbon emission correlations during 2020–2022. Specifically, the Moran’s Index experienced a precipitous decline from 0.735 in 2020 to 0.07 in 2022, representing a dramatic 90.5% reduction that indicates the pandemic substantially weakened spatial dependencies among regional carbon emissions. This steep deterioration in correlation coefficients reflects the fundamental alterations in inter-regional mobility patterns, economic activities, and residential energy consumption behaviors induced by pandemic containment measures.

3.2. LMDI Decomposition Results Analysis

3.2.1. Cross-Regional Comparative Analysis

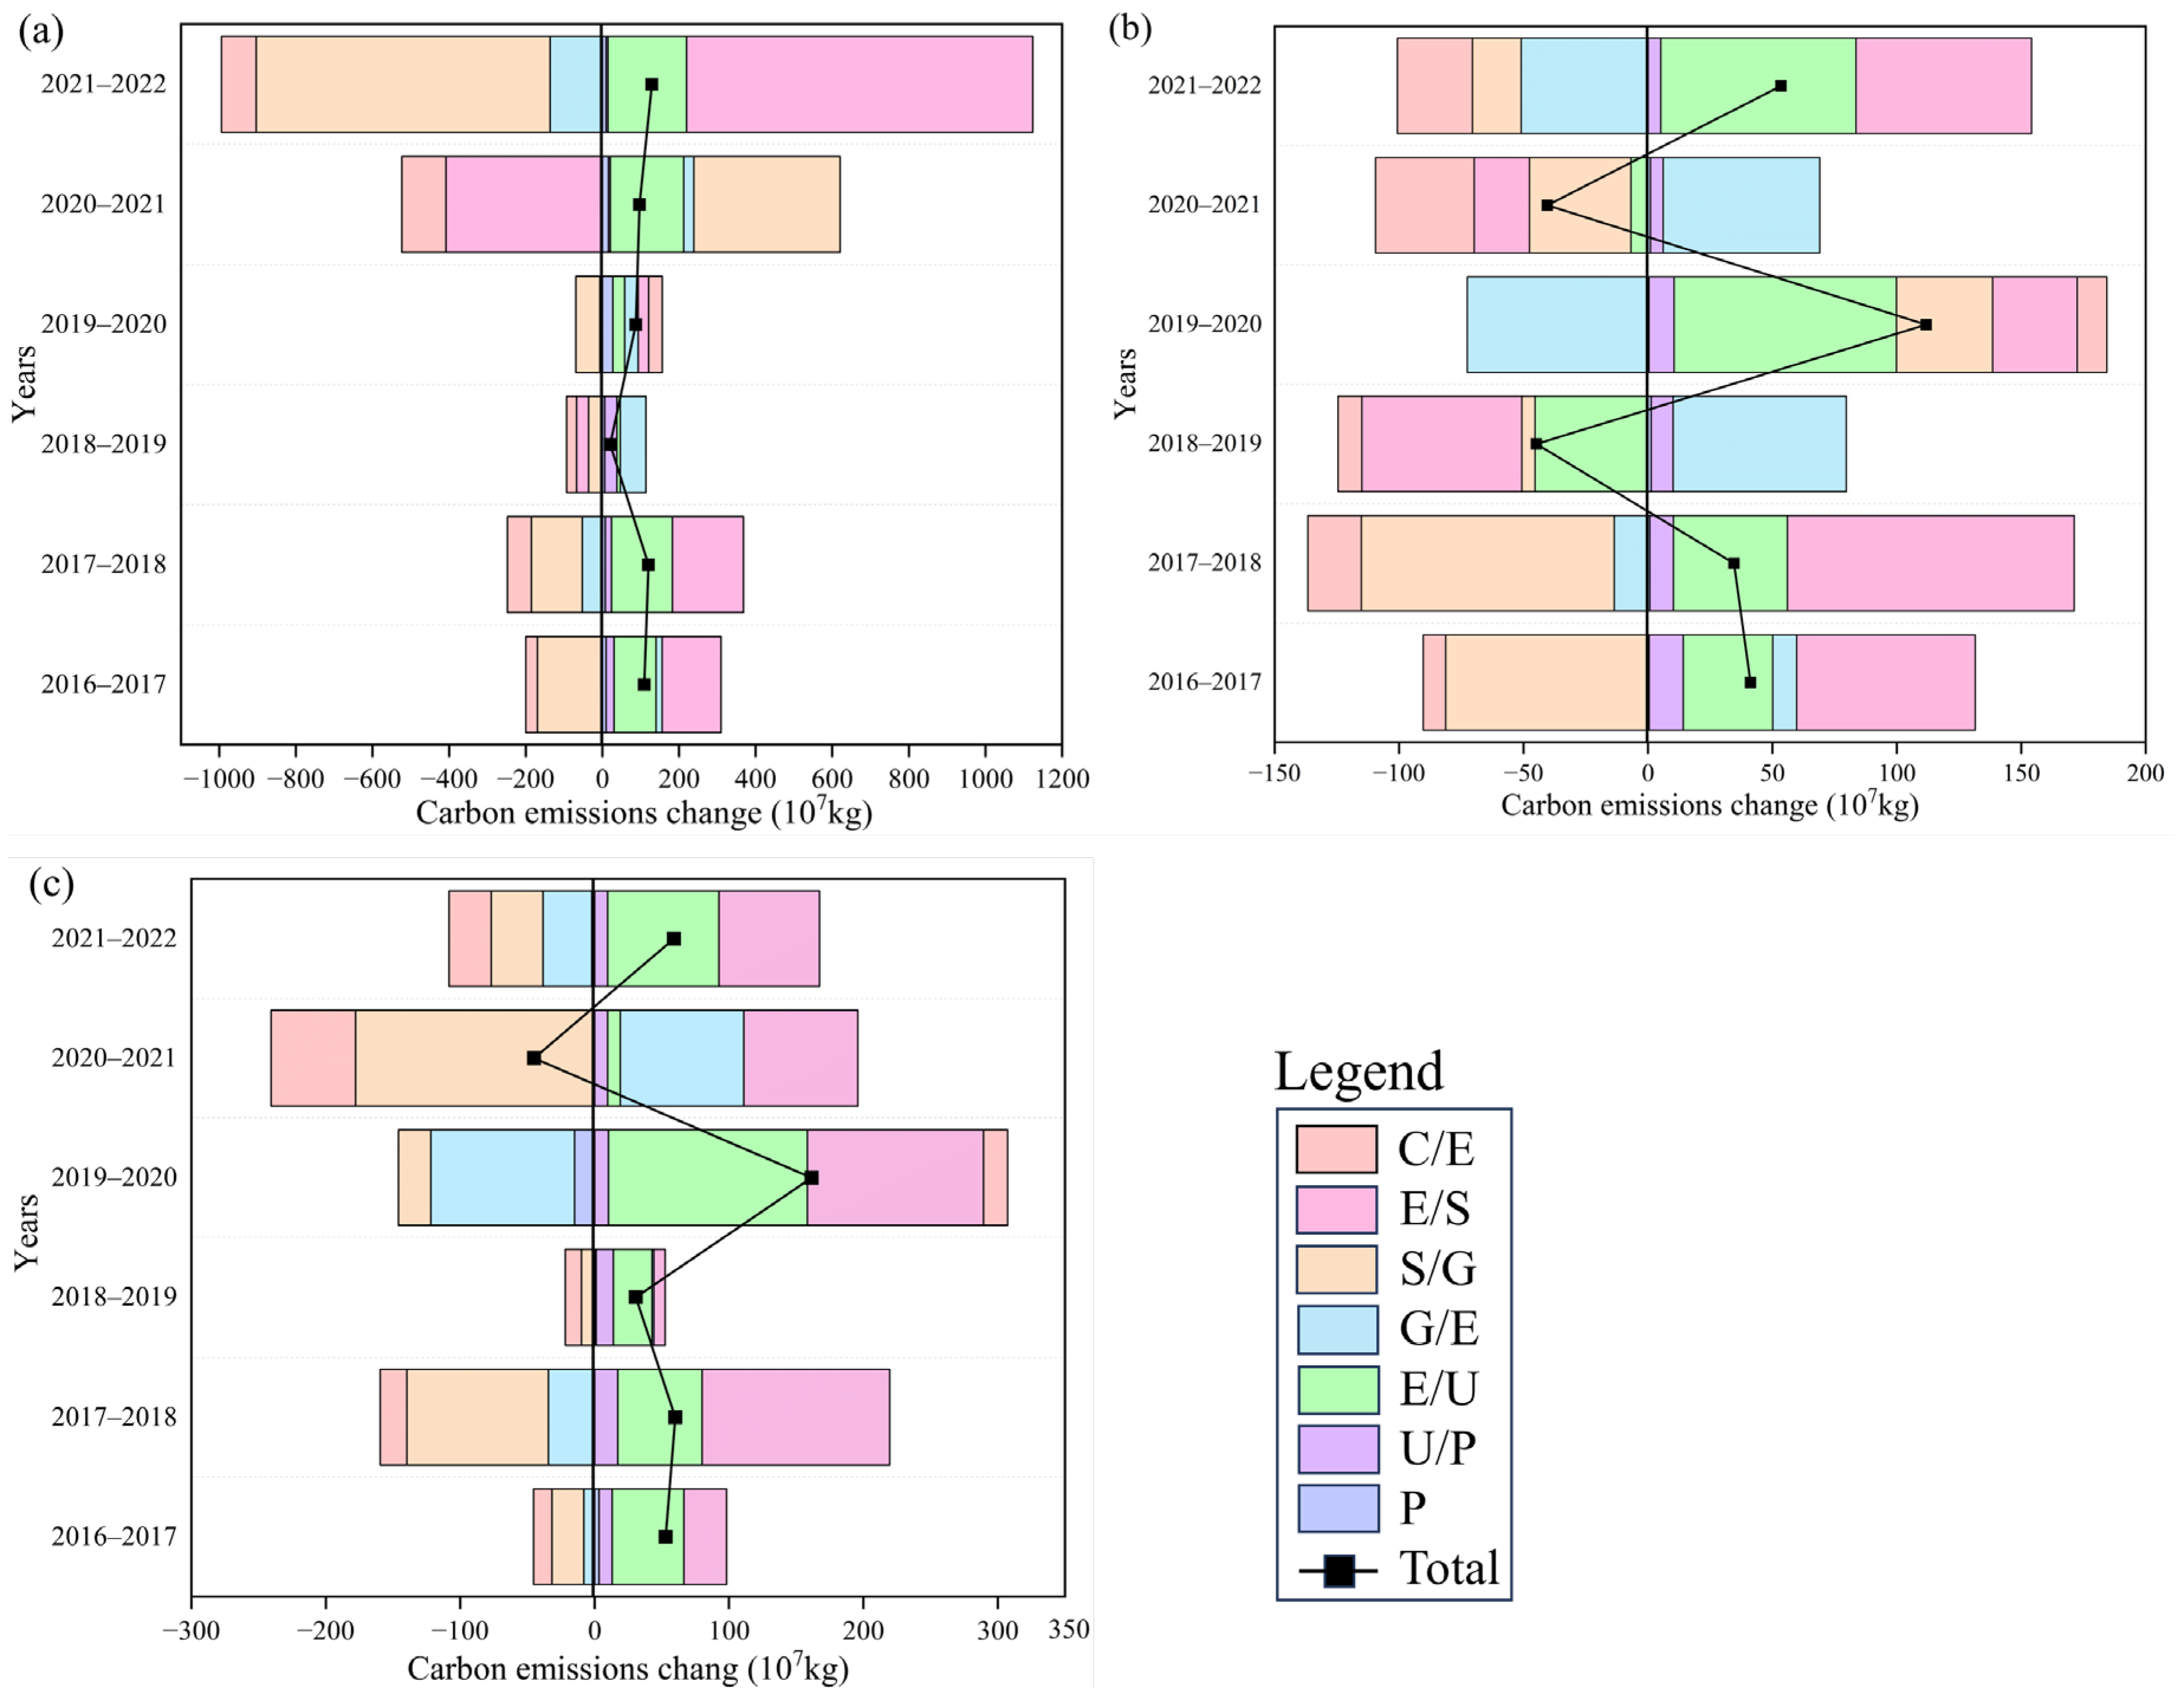
Based on Equation (4), carbon emissions from urban residential buildings in Jiangsu Province were decomposed across three regions: Southern Jiangsu, Central Jiangsu, and Northern Jiangsu for the period 2016–2022. The comprehensive analysis reveals distinct regional patterns in driving factors, as presented in Table 3 and Figure 7.
The decomposition results reveal significant regional heterogeneity in driving factors across Jiangsu Province. Energy consumption per unit area (E/S) emerges as the dominant positive driver across all regions, contributing 8.307, 2.050, and 4.704 million tons in Southern, Central, and Northern Jiangsu, respectively, accounting for 147.61%, 131.82%, and 147.57% of total emissions growth. Conversely, economic density (S/G) consistently serves as the primary negative factor, offsetting 7.869, 2.100, and 3.782 million tons across the three regions, representing −139.82%, −135.06%, and −118.62% of total changes.
The population dynamics show striking regional divergence, with Southern Jiangsu experiencing the strongest positive contribution (13.52%), Central Jiangsu showing modest growth (2.54%), and Northern Jiangsu being the only region with negative population effects (−4.36%). This pattern reflects the province’s internal development imbalances and migration flows toward economically advanced areas. Urbanization rate effects demonstrate varying intensities across regions, with Central Jiangsu showing the highest proportional contribution (33.55%), followed by Northern Jiangsu (21.77%) and Southern Jiangsu (12.76%), indicating saturation effects in already highly urbanized areas.
Per capita energy consumption maintains remarkable consistency across regions (120–126% contribution), suggesting similar lifestyle-driven energy demands regardless of regional development levels. However, the underlying energy structures and efficiency levels differ significantly among regions, as evidenced by the varying contributions from energy intensity and carbon emission coefficients.

3.2.2. Southern Jiangsu: Advanced Development with Energy Transition

Southern Jiangsu demonstrates the most sophisticated decomposition pattern, characterized by strong economic growth coupled with advanced energy structure optimization. As shown in Figure 7a, the region experienced significant year-to-year fluctuations, particularly during 2020–2021 when economic density contributed 3.817 million tons positively, while energy consumption per unit area provided a substantial negative offset of −4.084 million tons, indicating rapid efficiency improvements during the post-pandemic recovery period.
The population effect (0.761 million tons, 13.52%) reflects Southern Jiangsu’s continued demographic attractiveness as the province’s economic powerhouse, with population growing from 0.347 million in 2016 to 0.362 million in 2022. The urbanization rate contribution (0.718 million tons, 12.76%) remains relatively moderate due to already high urbanization levels exceeding 85% by 2022, demonstrating saturation effects in mature urban areas.
Per capita energy consumption emerges as the most significant positive driver (7.046 million tons, 125.20%), reflecting energy-intensive lifestyle patterns associated with high economic development and rising living standards. This trend accelerated notably during the pandemic period, as shown in Figure 7a, when residential energy consumption surged due to work-from-home policies and lifestyle changes.
The substantial negative contribution from carbon emission coefficient (−2.898 million tons, −51.48%) underscores the region’s leadership in adoption of clean technology. This improvement accelerated notably during 2021–2022, coinciding with increased scientific and technological investment reaching 45.96 billion yuan. The energy intensity factor provides a modest negative contribution (−0.439 million tons, −7.79%), indicating successful but gradual energy structure transitions toward renewable sources.

3.2.3. Central Jiangsu: Transitional Development with Structural Challenges

Central Jiangsu exhibits a transitional development pattern with moderate economic growth but persistent energy structure challenges. Figure 7b reveals considerable volatility in factor contributions, particularly the dramatic shift in per capita energy consumption from −0.454 million tons in 2018–2019 to 0.894 million tons in 2019–2020, reflecting the region’s sensitivity to external economic shocks and policy changes.
The population effect (0.040 million tons, 2.54%) reflects Central Jiangsu’s intermediate position in the province’s development hierarchy, with modest population growth from 23.39 million in 2016 to 23.54 million in 2022. The urbanization rate effect (0.523 million tons, 33.55%) represents the highest proportion among all regions, reflecting Central Jiangsu’s ongoing urban transition from intermediate development levels as urbanization increased from 71.2% to 75.8%.
Unlike other regions, energy intensity contributes positively (0.050 million tons, 3.23%) to emissions, indicating less advanced energy structure optimization. This challenge is evident in the 2020–2021 period when energy intensity contributed 0.630 million tons, highlighting the region’s continued reliance on carbon-intensive energy sources and slower adoption of renewable technologies compared to coastal areas.
The economic density factor provides substantial negative contribution (−2.100 million tons, −135.06%), though less pronounced than Southern Jiangsu, reflecting the region’s growing economic efficiency but lower absolute development levels. Central Jiangsu’s GDP reached 2.489 trillion yuan by 2022, demonstrating economic dynamism while highlighting the challenge of decoupling growth from emissions.

3.2.4. Northern Jiangsu: Resource Constraints with Renewable Energy Potential

Northern Jiangsu presents a unique demographic and economic profile, characterized by population decline but significant renewable energy development potential. Figure 7c shows the region being the only area experiencing negative population effects (−0.139 million tons, −4.36%), with this trend intensifying during 2019–2020 when population decline contributed −0.149 million tons, reflecting economic constraints and sustained outmigration to more developed areas within the province.
The urbanization rate effect (0.694 million tons, 21.77%) remains substantial despite population decline, as rural-to-urban migration continues within the region while overall population decreases. This pattern reflects concentrated urbanization around prefecture-level cities like Xuzhou, Yancheng, and Suqian, even as total regional population declined from 30.25 million in 2016 to 29.84 million in 2022.
Despite demographic challenges, the region demonstrates significant potential for emission reduction through renewable energy development. The energy intensity factor provides the strongest negative contribution among all regions (−0.922 million tons, −28.91%), with particularly notable improvements during 2019–2020 (−1.069 million tons). This reflects Northern Jiangsu’s coastal advantages for wind power development, which helped offset carbon emissions despite economic development constraints.
The energy consumption per unit area remains the primary positive driver (4.704 million tons, 147.57%), showing consistency with provincial patterns but exhibiting more moderate annual fluctuations compared to Southern Jiangsu. The carbon emission coefficient’s negative contribution (−1.220 million tons, −38.25%) is less pronounced than in Southern Jiangsu, primarily due to lower research and development investment levels, with R&D expenditure representing only 0.32% of GDP.

3.3. Scenario Analysis and Future Projections

3.3.1. Projection Results and Regional Analysis

(1) BS
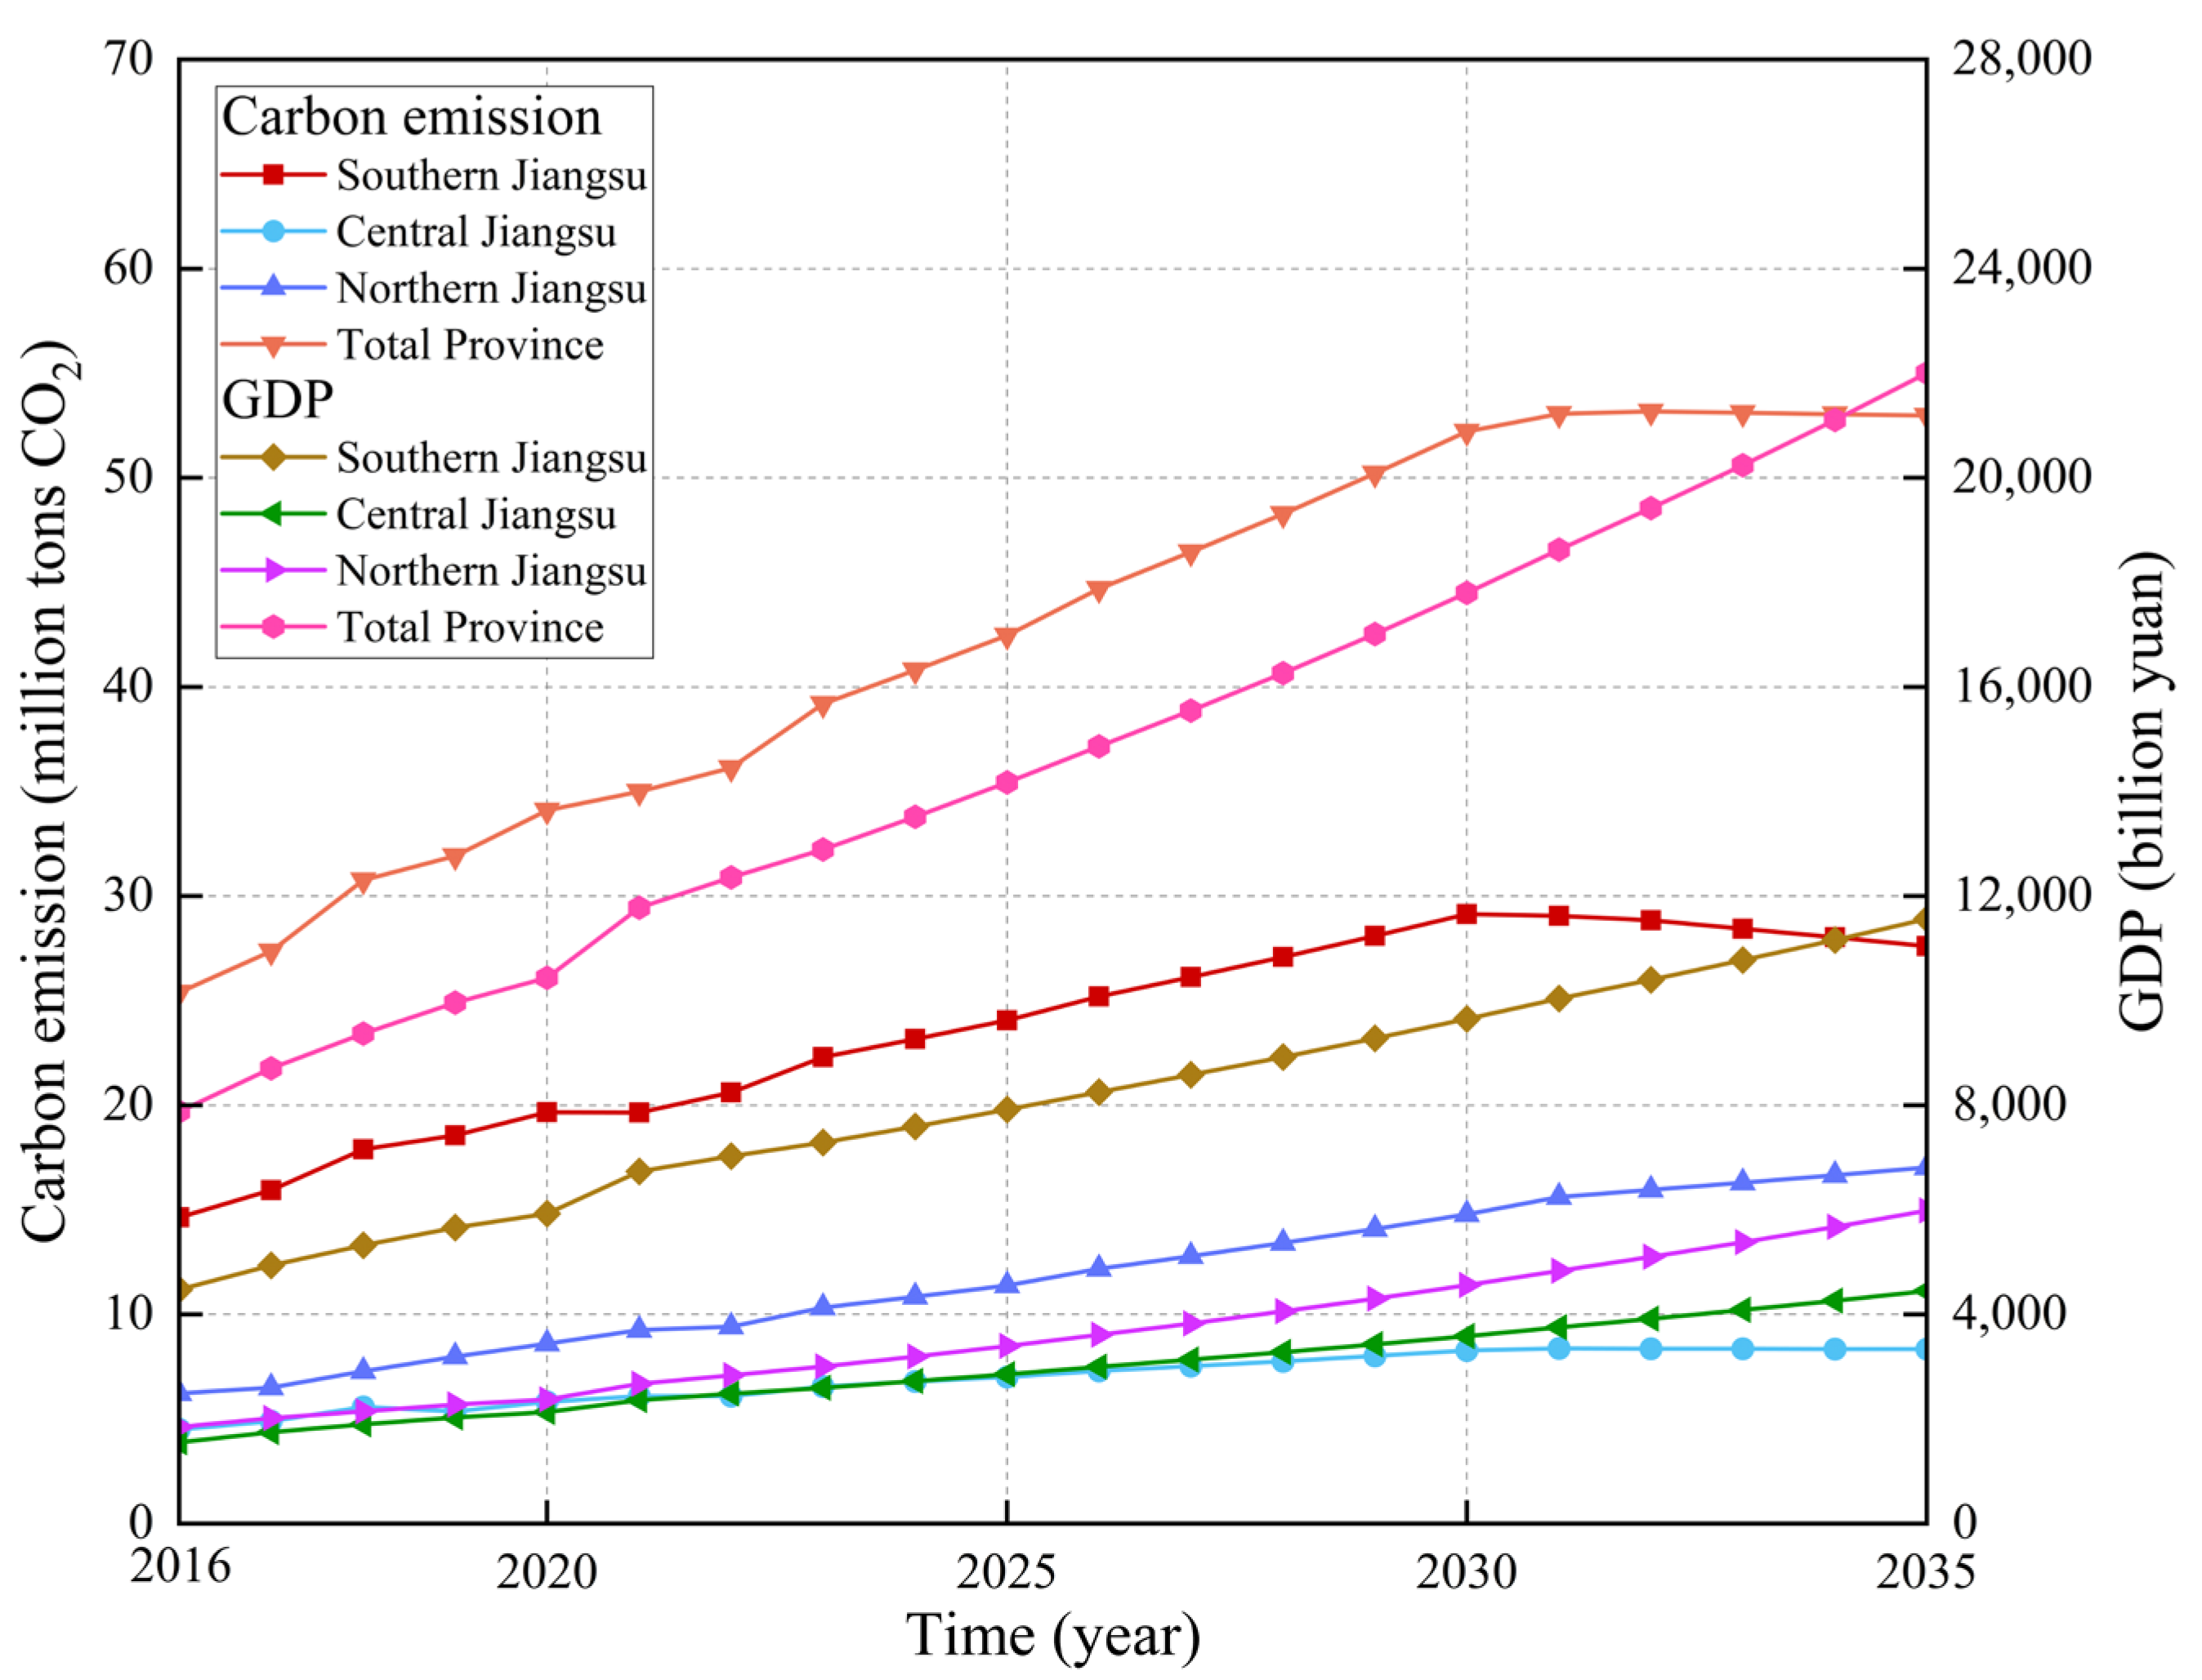
Under the BS (Figure 8), provincial residential building carbon emissions increase from 36.135 million tons CO2 in 2022 to 52.223 million tons CO2 by 2030, representing a 44.5% increase. The province achieves carbon peak around 2032 at 53.173 million tons CO2, followed by gradual decline to 52.980 million tons CO2 by 2035. Southern Jiangsu reaches carbon peak in 2030 at 29.149 million tons CO2, followed by decline to 27.607 million tons CO2 by 2035. Central Jiangsu achieves carbon peak around 2031 at 8.383 million tons CO2, maintaining stable levels around 8.339 million tons CO2 by 2035. Northern Jiangsu shows no carbon peak through 2035, with emissions continuing to rise from 14.798 million tons CO2 in 2030 to 17.034 million tons CO2 by 2035. Under this scenario, the province fails to achieve carbon peak by 2030, with peak timing delayed until 2032, primarily due to Northern Jiangsu’s continued growth trajectory.
(2) LCS
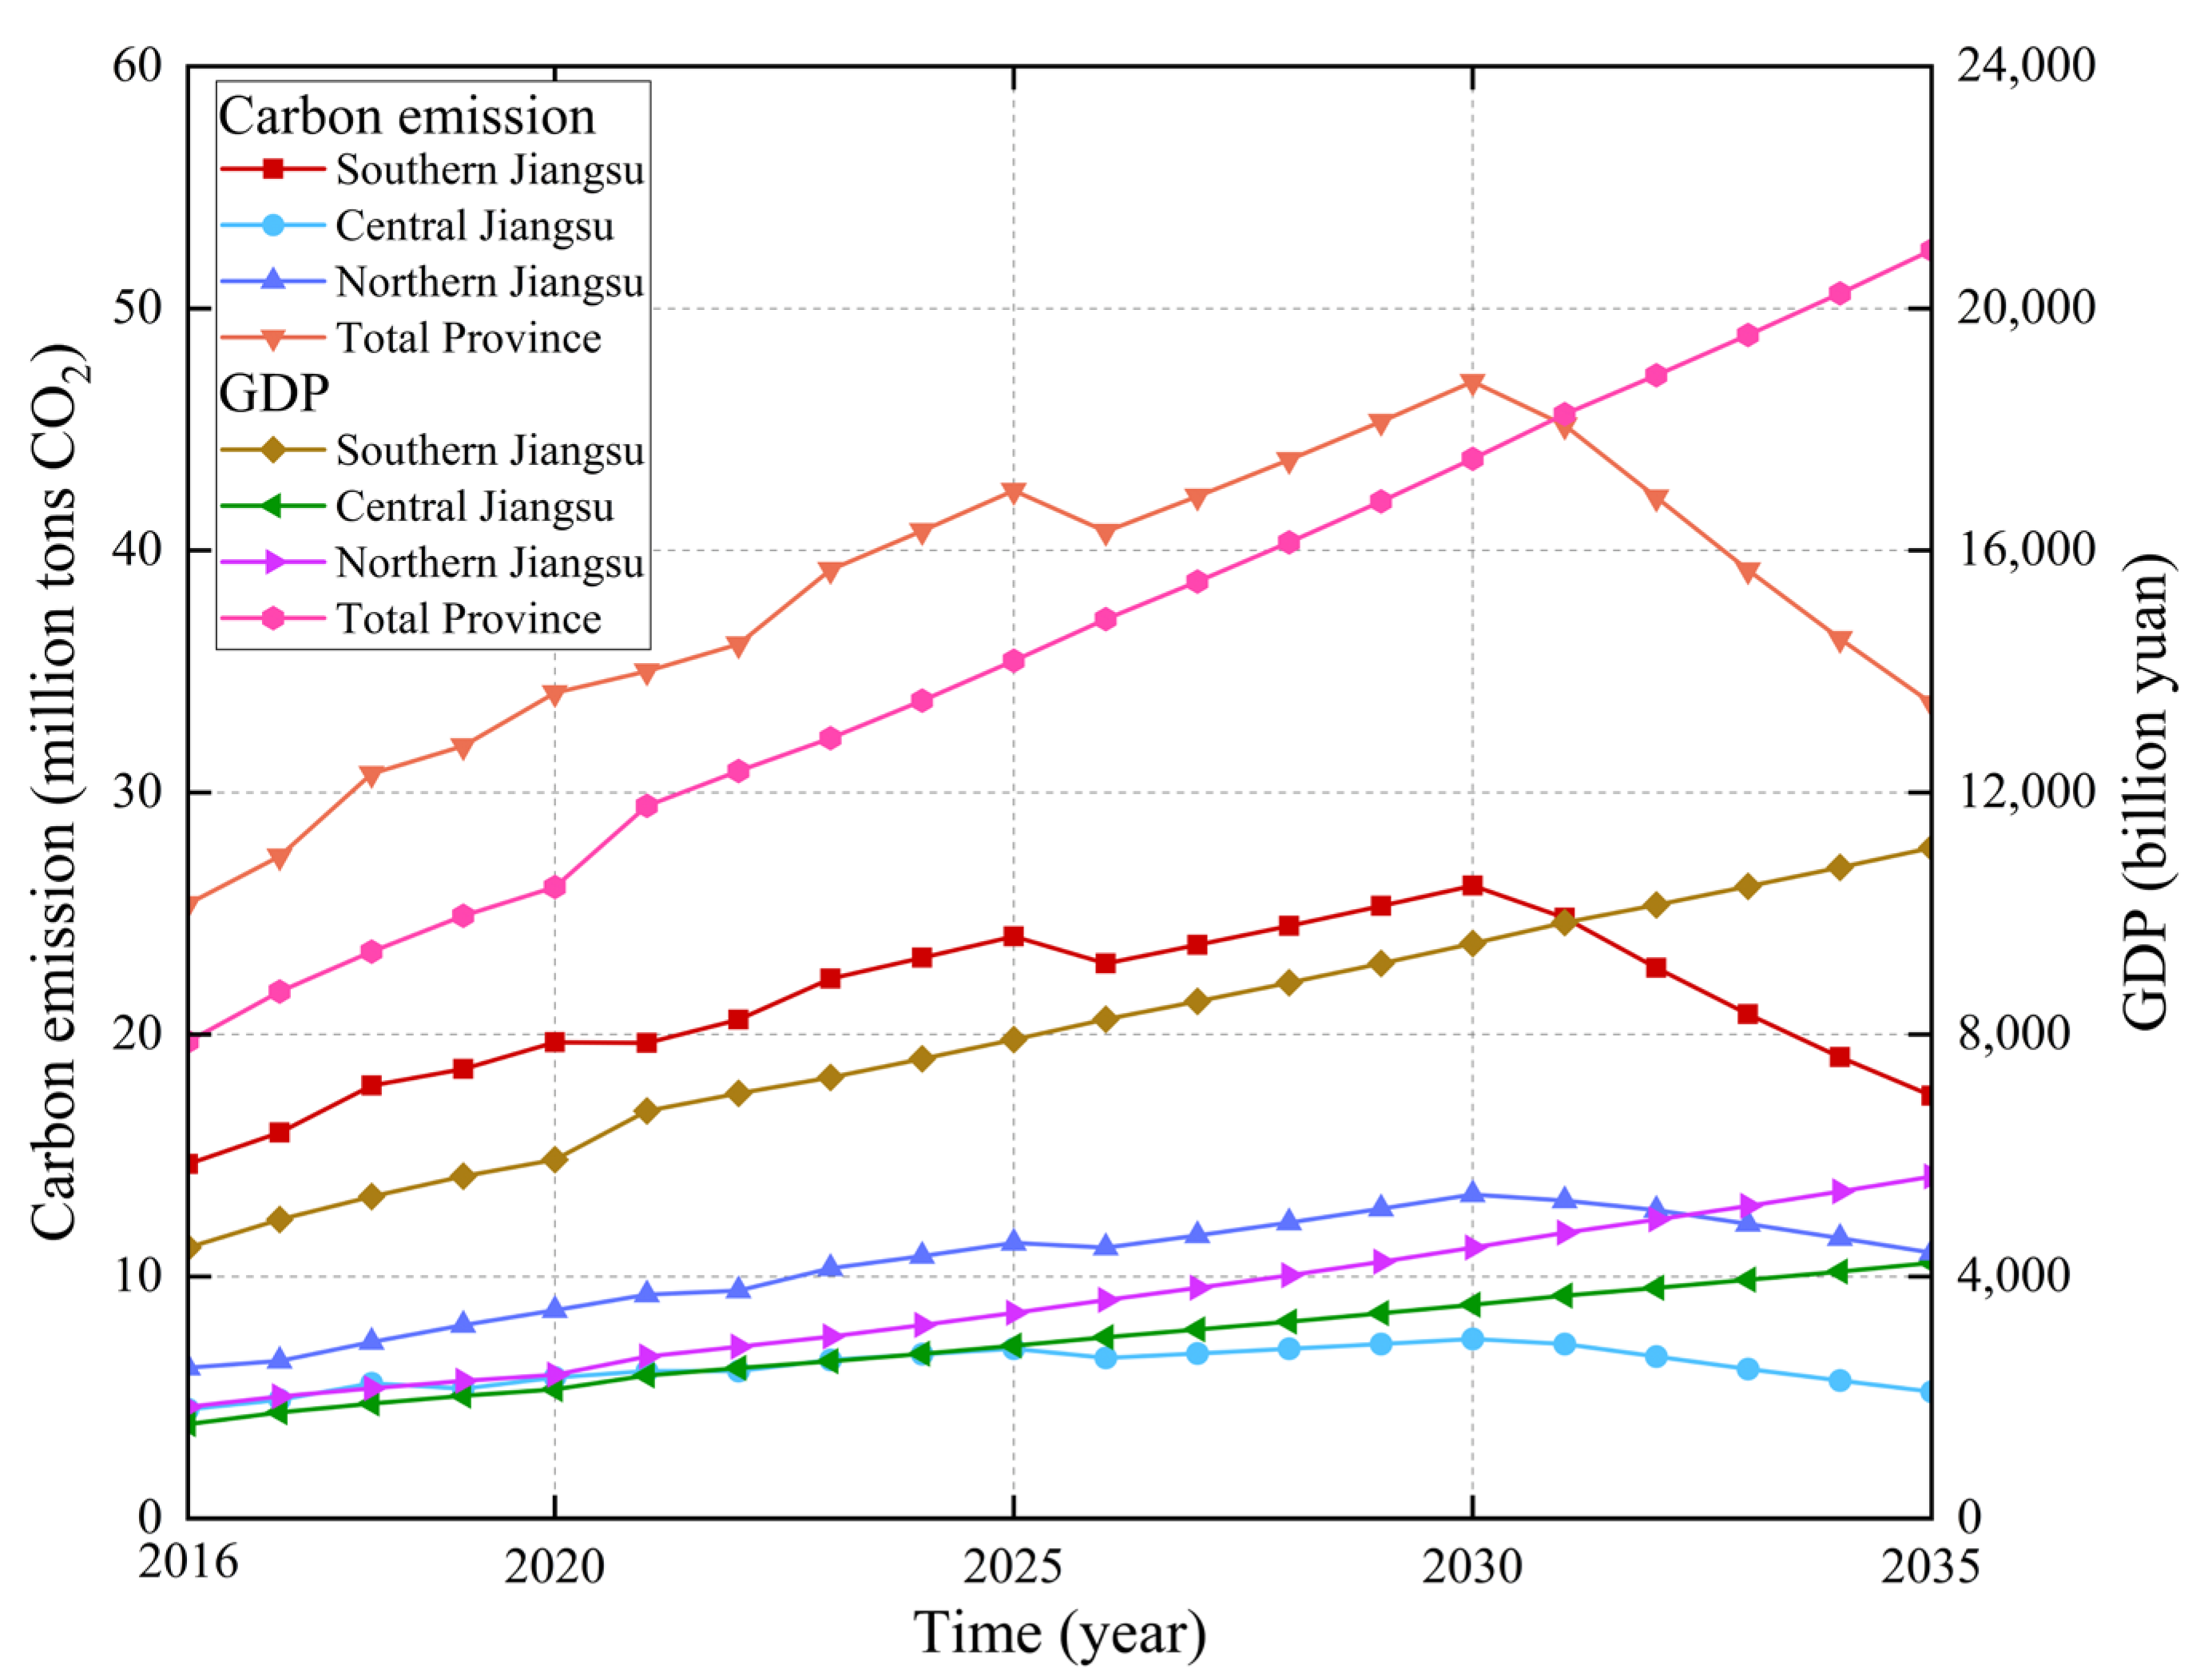
The LCS demonstrates the most aggressive emission reduction performance (Figure 9), with provincial emissions reaching 46.970 million tons CO2 by 2030—a 10.1% reduction compared to the BS. All regions achieve carbon peak by 2030, enabling comprehensive provincial carbon peak achievement. Southern Jiangsu reaches carbon peak in 2030 at 26.156 million tons CO2 and shows a dramatic decline to 17.464 million tons CO2 by 2035—the lowest regional level across all scenarios. Central Jiangsu achieves carbon peak in 2030 at 7.426 million tons CO2, followed by sustained reduction to 5.241 million tons CO2 by 2035. Northern Jiangsu reaches carbon peak in 2030 at 13.388 million tons CO2, declining to 10.984 million tons CO2 by 2035. This scenario represents successful provincial carbon peak achievement by 2030 with continued post-peak emission reductions, demonstrating that coordinated low-carbon policies can achieve early peak timing while maintaining economic competitiveness.
(3) EGS
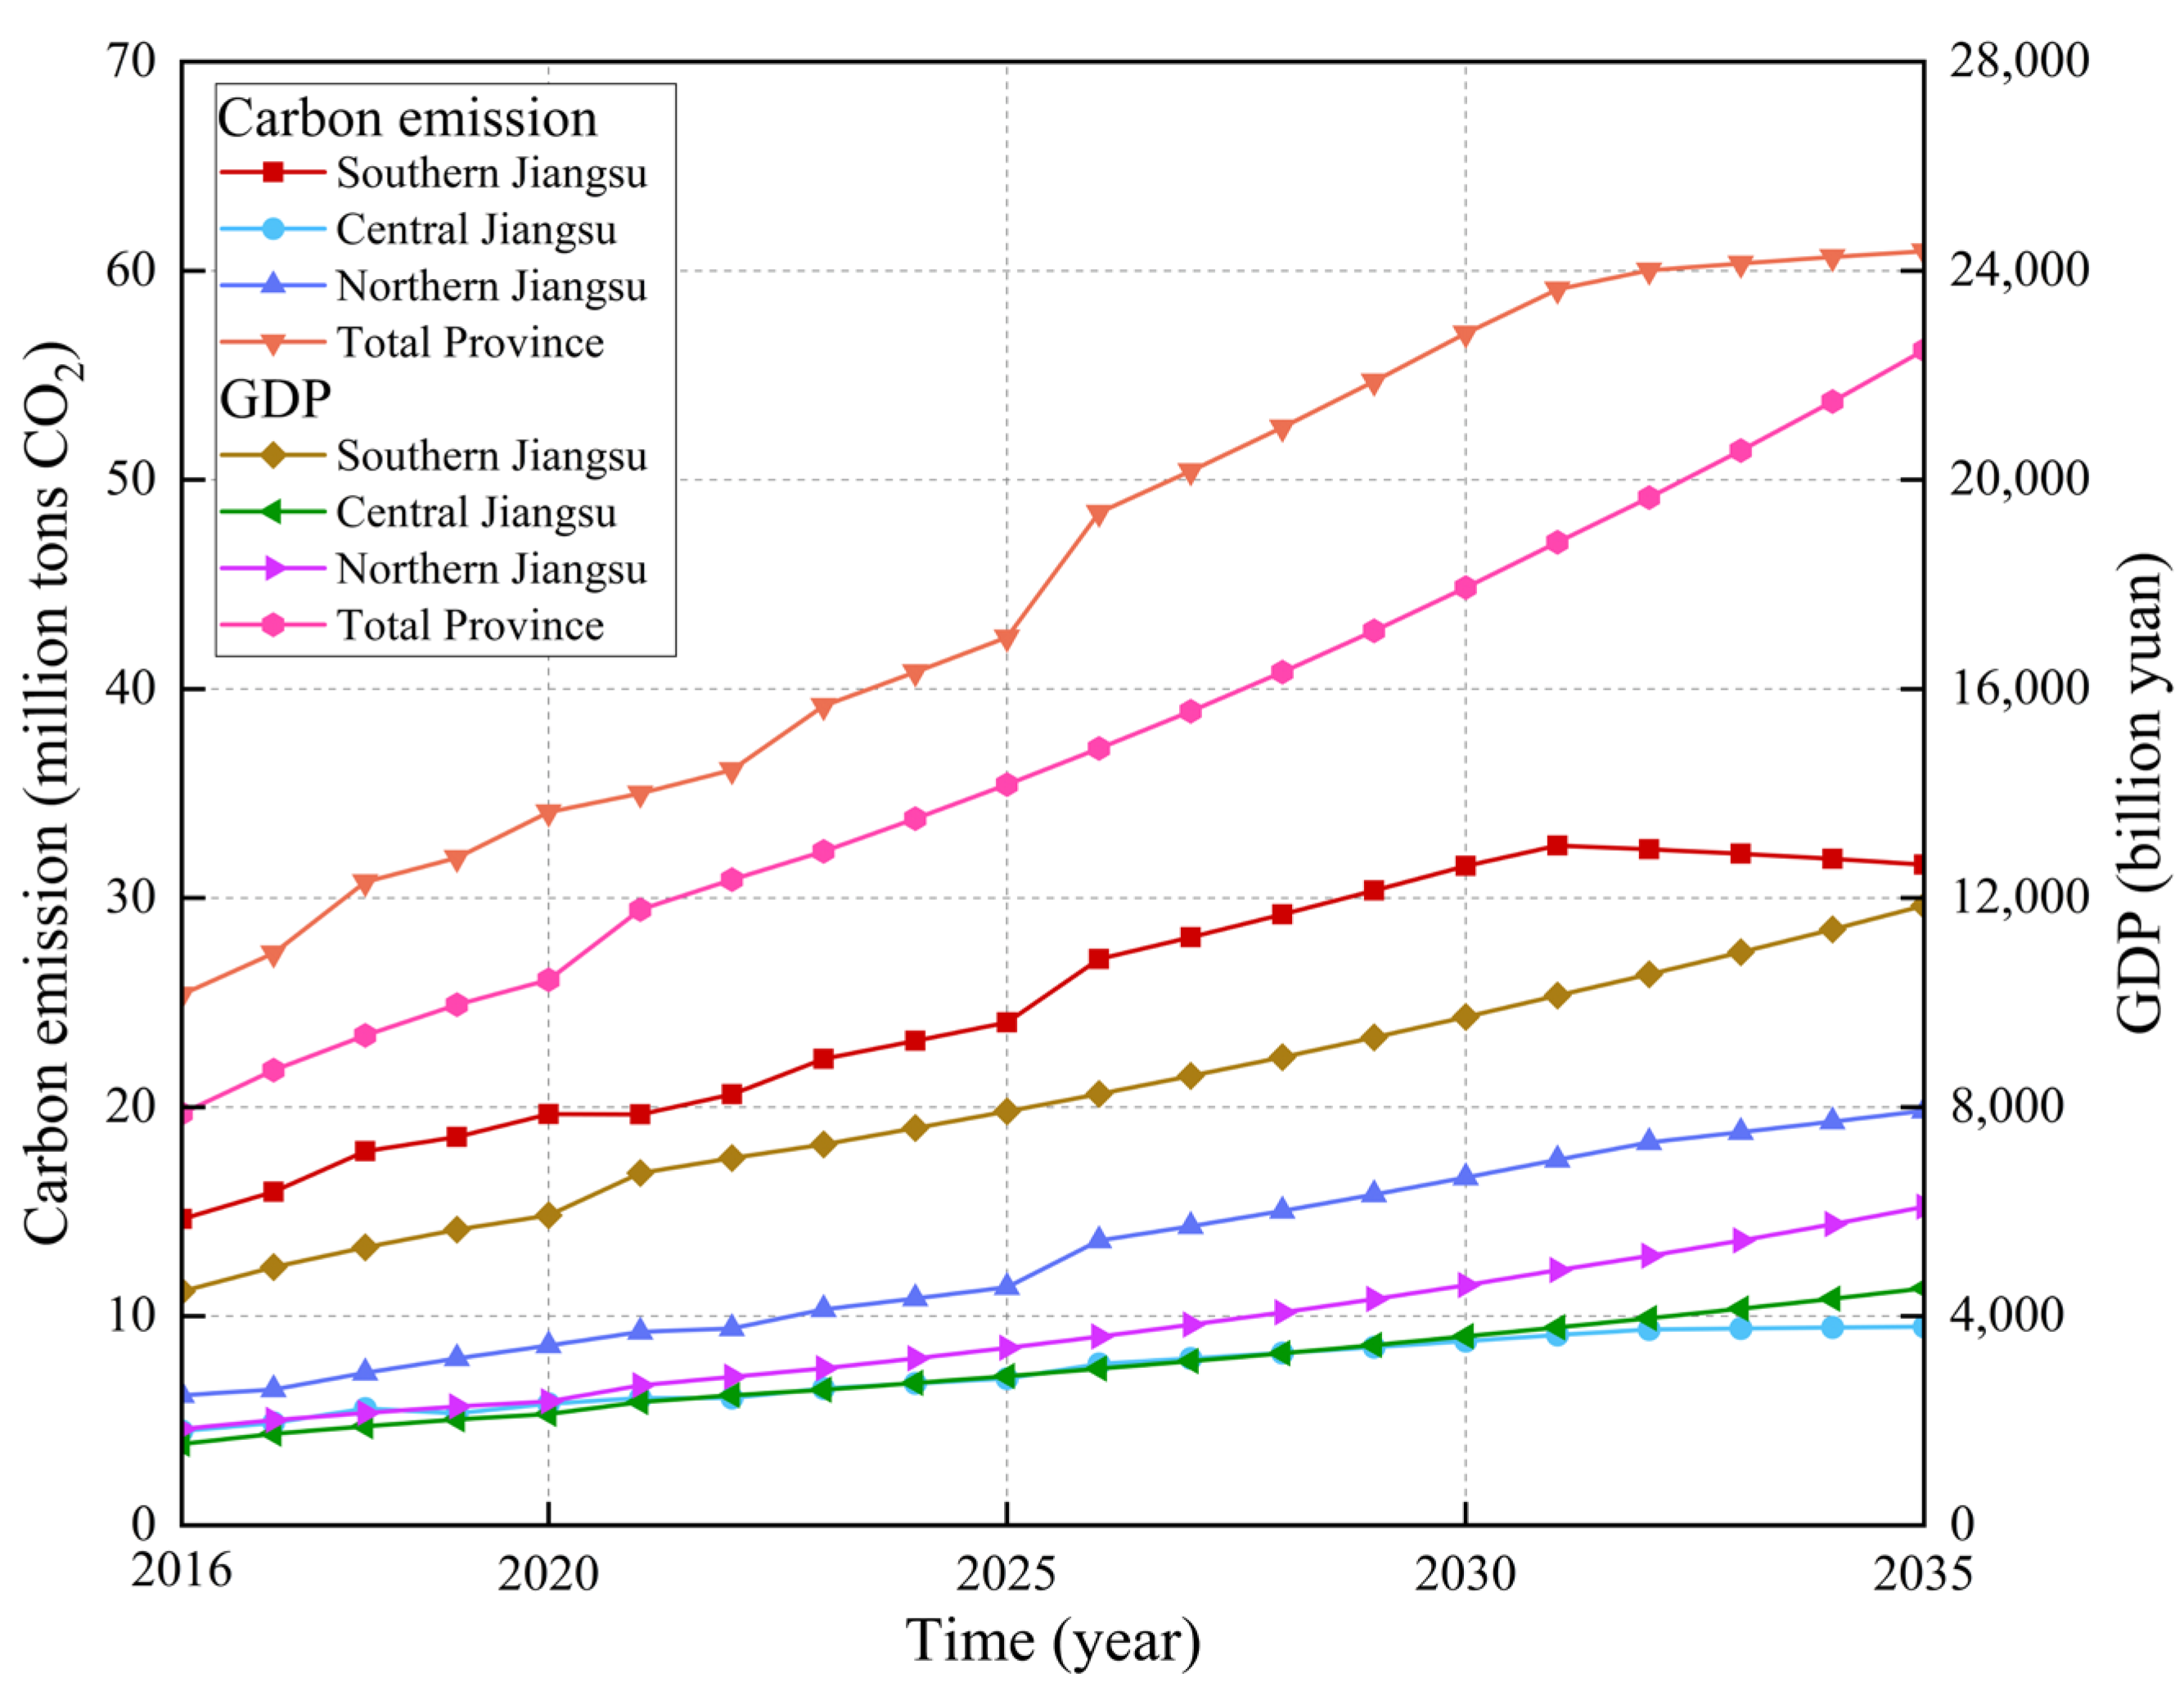
The EGS prioritizes rapid economic development with limited carbon reduction measures (Figure 10), resulting in the highest provincial emissions reaching 57.005 million tons CO2 by 2030—a 9.2% increase over the BS. The province achieves carbon peak around 2033–2034 at approximately 60.656 million tons CO2, representing the latest peak timing across all scenarios. Southern Jiangsu reaches carbon peak around 2031 at 32.515 million tons CO2, followed by gradual decline to 31.603 million tons CO2 by 2035. Central Jiangsu achieves carbon peak around 2033–2034 at 9.462 million tons CO2, stabilizing at 9.505 million tons CO2 by 2035. Northern Jiangsu shows no carbon peak through 2035, with emissions continuing to rise from 16.643 million tons CO2 in 2030 to 19.836 million tons CO2 by 2035. Economic performance is strongest under this pathway, with provincial GDP reaching 17,939.75 billion yuan by 2030, but the emission trajectory conflicts directly with carbon reduction goals.
(4) CS
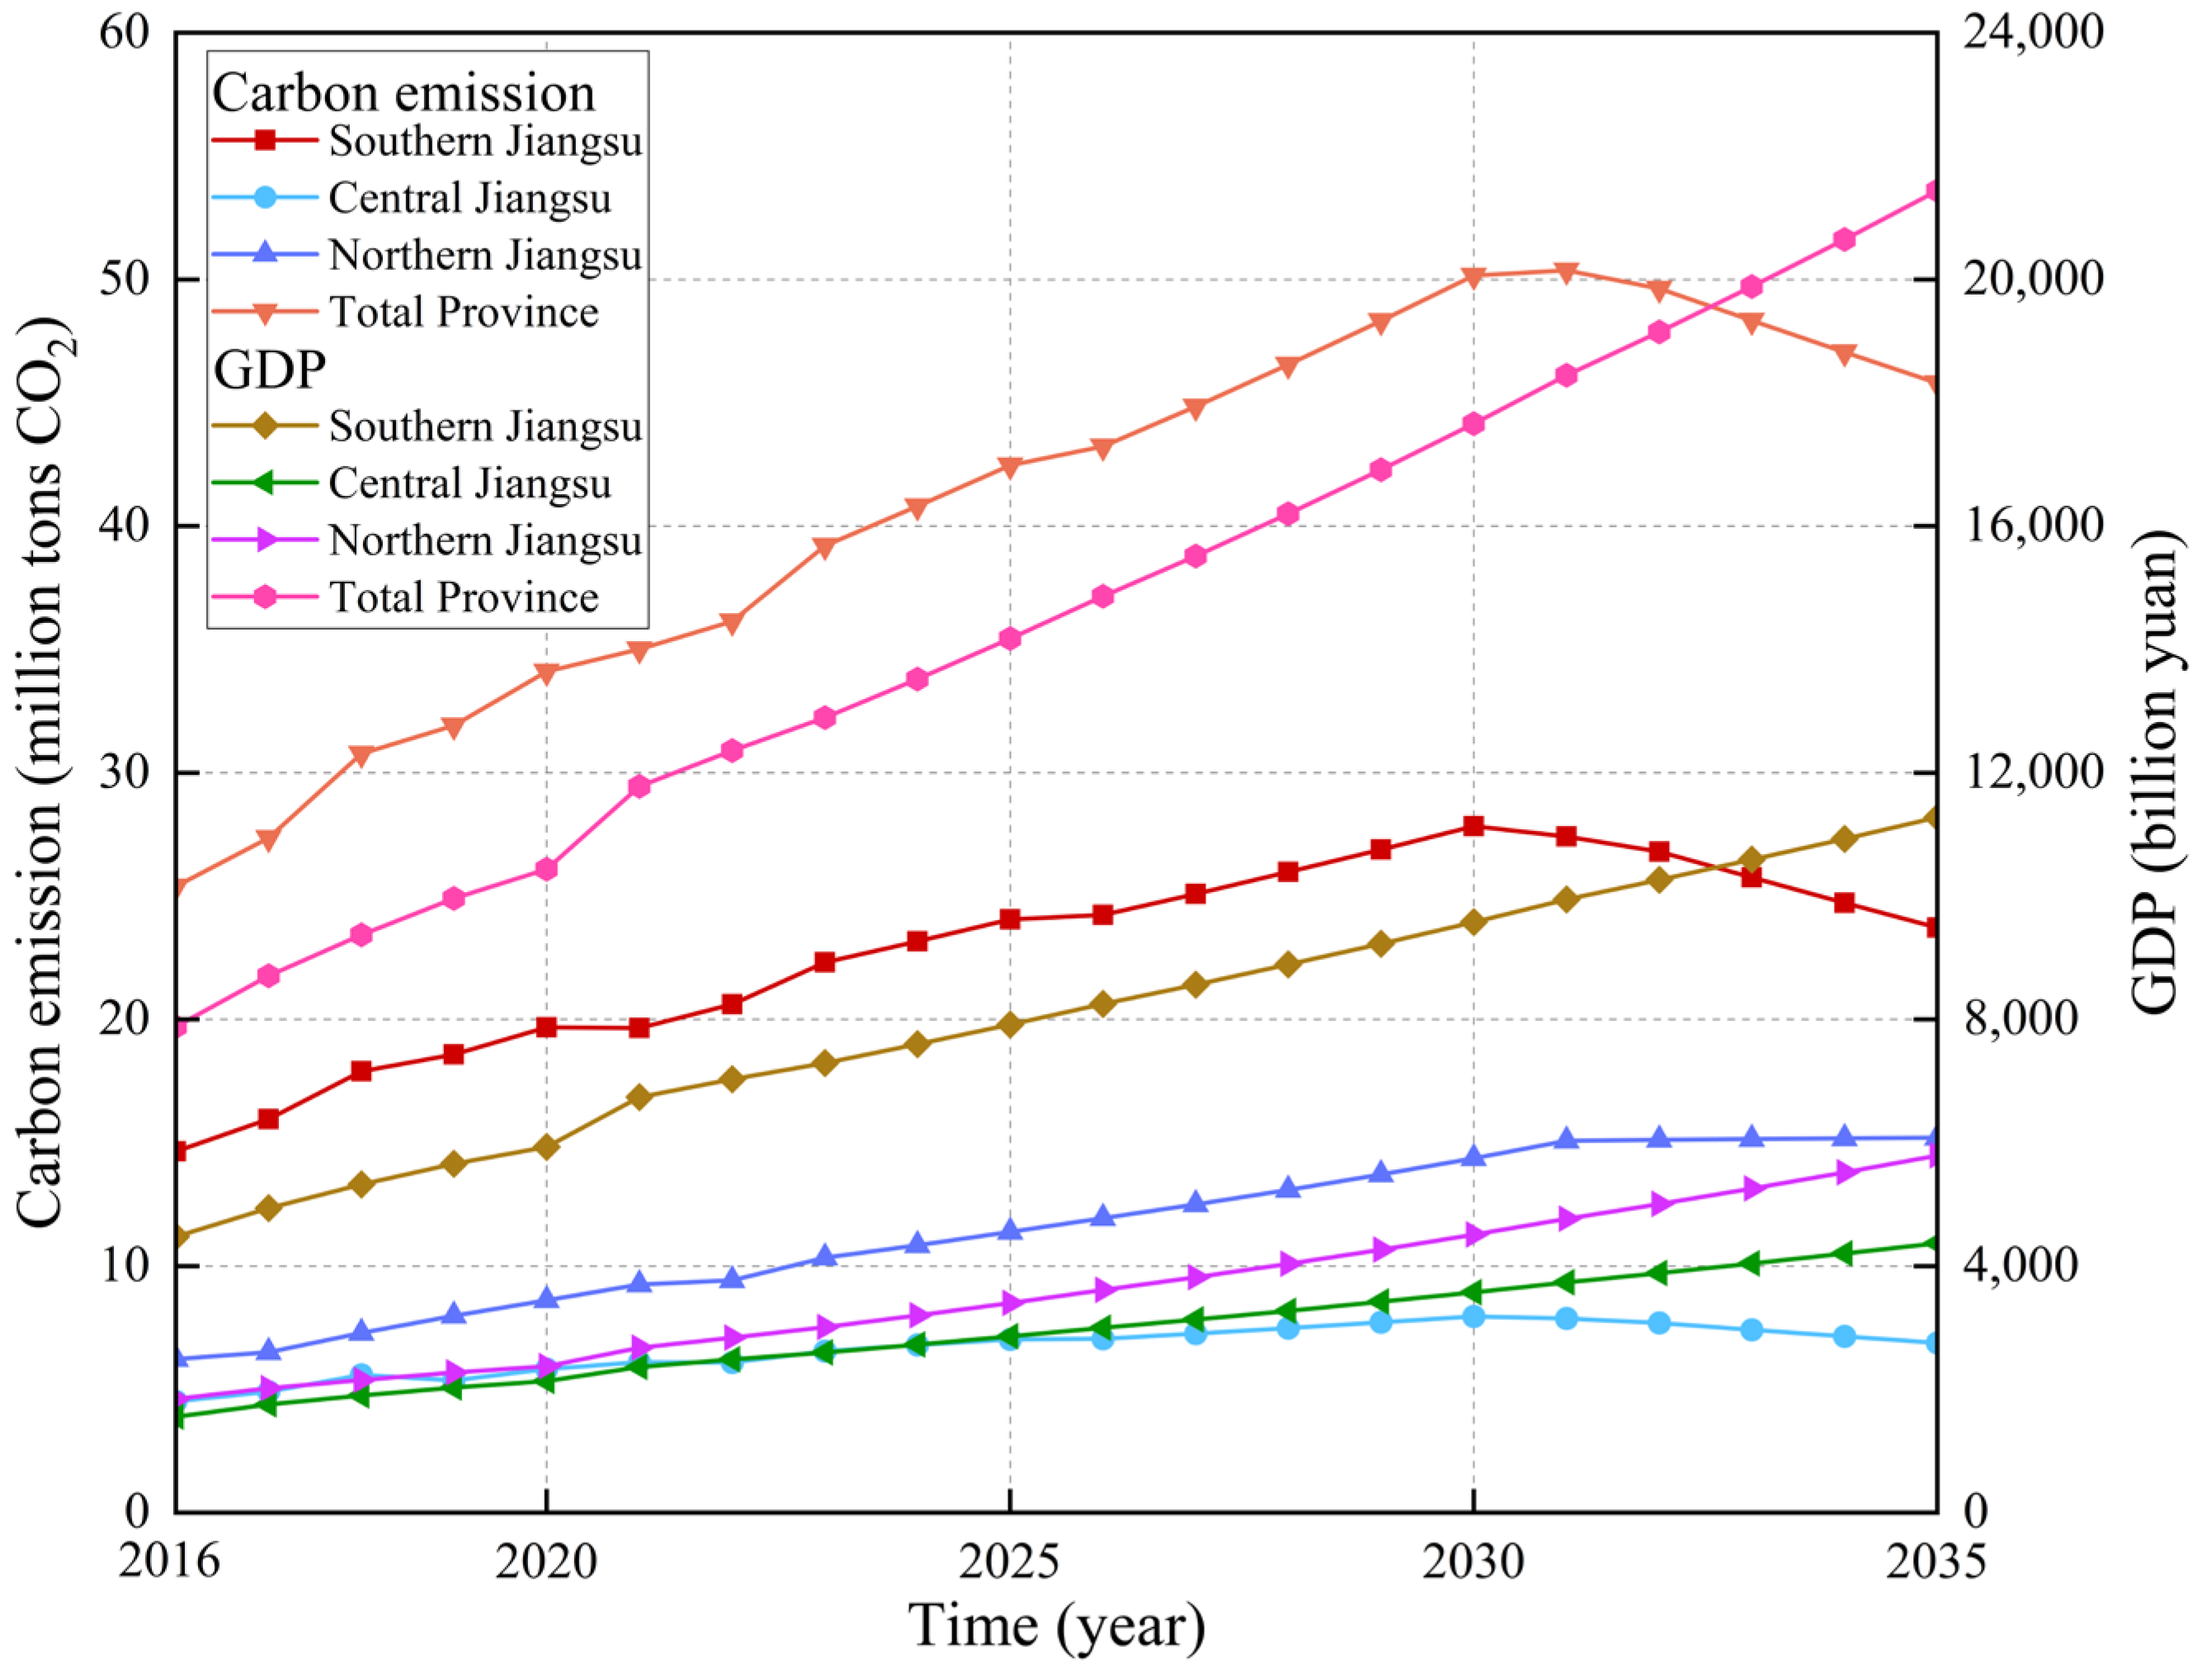
The CS attempts to balance economic development with carbon reduction through moderate policy interventions (Figure 11), achieving provincial emissions of 50.166 million tons CO2 by 2030—a 3.9% reduction compared to the baseline. The province reaches carbon peak in 2031 at 50.367 million tons CO2, followed by a sustained decline to 45.804 million tons CO2 by 2035. Southern Jiangsu achieves carbon peak in 2030 at 27.837 million tons CO2, declining to 23.721 million tons CO2 by 2035. Central Jiangsu reaches carbon peak in 2030 at 7.960 million tons CO2, followed by continued reduction to 6.884 million tons CO2 by 2035. Northern Jiangsu achieves carbon peak around 2032 at 15.122 million tons CO2, stabilizing at 15.199 million tons CO2 by 2035. Provincial GDP reaches 17,664.07 billion yuan, representing a middle path between aggressive carbon reduction and economic growth priorities.
(5) Carbon peak achievement implications
The analysis reveals significant variation in carbon peak achievement across scenarios, with critical implications for policy selection. Only the low carbon scenario enables comprehensive provincial and regional carbon peak achievement by 2030, meeting national carbon peak targets. The comprehensive scenario achieves provincial peak by 2031, representing a viable alternative pathway with moderate policy intervention requirements.
Northern Jiangsu emerges as the critical region for provincial carbon peak achievement, achieving peak by 2030 only under the low carbon scenario. The region’s failure to achieve carbon peak under baseline and economic growth scenarios through 2035 highlights the importance of intensive policy intervention and coordinated development support.
Southern Jiangsu demonstrates leadership potential across scenarios, achieving carbon peak by 2030–2031 under most scenarios. The region’s consistent performance positions it as a driver for provincial carbon reduction while providing technology demonstration and policy innovation for other regions.

3.3.2. Policy Pathway Analysis and Strategic Implications

(1) Critical success factors for scenario achievement
The scenario analysis reveals that integrated policy design and implementation emerges as the most critical factor determining emission reduction success. The LCS achieves 10.1% provincial emission reductions compared to baseline while maintaining 98.4% of baseline economic performance (17.516 vs. 17.803 trillion yuan) in 2030, demonstrating the economic viability of aggressive carbon reduction policies. Technology innovation and rapid deployment prove essential across all successful scenarios, with the low carbon scenario enabling all regions to achieve carbon peak by 2030 compared to delayed or absent peak achievement under other scenarios. Regional coordination and differentiated strategies provide the foundation for successful emission reduction, as demonstrated by the comprehensive scenario’s balanced approach achieving 3.9% provincial emission reductions with minimal economic cost.
(2) Regional implementation priorities
Southern Jiangsu demonstrates exceptional performance potential across all scenarios, achieving carbon peak by 2030 under both LCS and CS at 26.156 and 27.837 million tons CO2 respectively. The region should prioritize advanced technology development and commercialization, serving as the provincial leader in breakthrough building technologies. Central Jiangsu shows consistent responsiveness to policy interventions, with emission levels ranging from 7.426 to 8.821 million tons CO2 by 2030 across scenarios. The region requires focused renewable energy deployment and building efficiency improvements to achieve optimal performance. Northern Jiangsu faces the greatest challenges, achieving carbon peak by 2030 only under the low carbon scenario (13.388 million tons CO2) while showing continued growth through 2035 under baseline and economic growth scenarios. The region requires intensive technology transfer support and coordinated development policies that leverage breakthrough technologies demonstrated in Southern Jiangsu.
(3) Investment requirements and economic implications
The scenario analysis demonstrates remarkable potential for achieving emission reductions with minimal economic penalty. The LCS achieves 10.1% emission reductions with 99.2% of baseline economic performance, while the comprehensive scenario achieves 3.9% emission reductions with identical economic performance (99.2%), demonstrating exceptional value for carbon reduction investments. Regional economic resilience remains strong throughout, with Southern Jiangsu maintaining GDP levels ranging from 9505.8 to 9727.9 billion yuan across scenarios, Central Jiangsu ranging from 353.37 to 361.58 billion yuan, and Northern Jiangsu from 447.60 to 459.60 billion yuan. The analysis clearly identifies the low carbon scenario as the optimal pathway for achieving provincial carbon peak by 2030 while maintaining competitive economic outcomes across all regions.

3.4. Decoupling Analysis

Analysis of the decoupling relationship between GDP and carbon emissions in Jiangsu Province from 2016–2025 reveals distinct regional evolutionary patterns. Southern Jiangsu maintains generalized coupling throughout the period, Central Jiangsu demonstrates a transition from generalized coupling toward weak decoupling, while Northern Jiangsu exhibits the most complex trajectory, progressing from generalized negative decoupling through generalized coupling to weak decoupling, reflecting varying development stages and structural transformation challenges across regions.
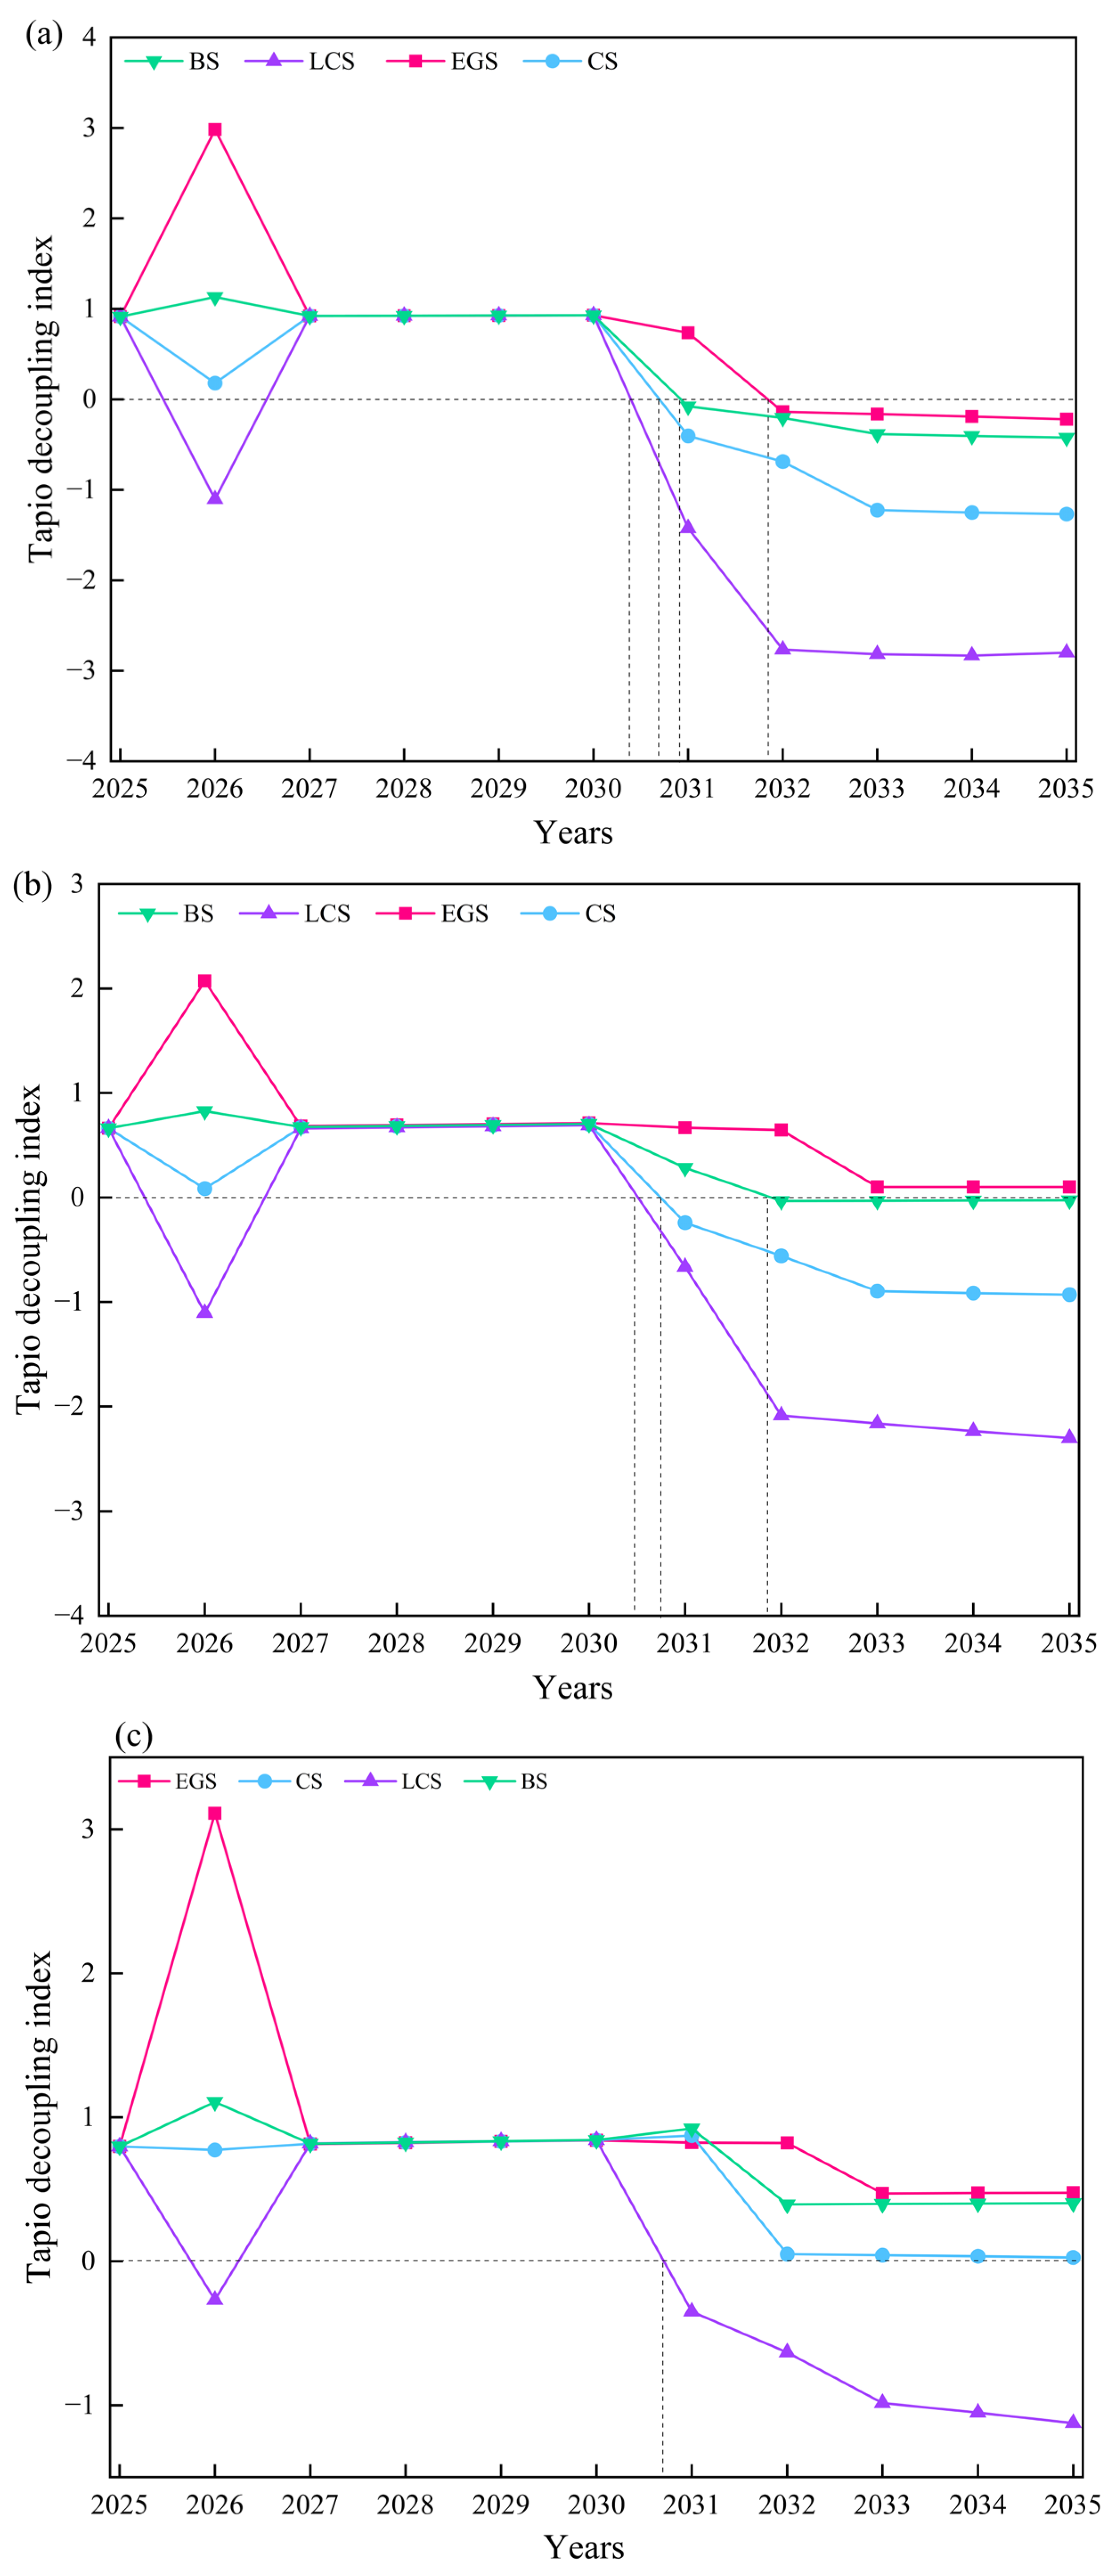
Figure 12 presents Tapio decoupling index projections for 2025–2035 across different scenarios, revealing significant variation in decoupling achievement potential. Southern Jiangsu demonstrates exceptional performance with all four scenario pathways achieving strong decoupling within 2030–2035, reflecting advanced economic structure and technological capabilities. Central Jiangsu shows substantial improvement with three pathways successfully transitioning to strong decoupling, while Northern Jiangsu faces greater challenges with only the low carbon pathway completing the weak-to-strong decoupling transition within the target timeframe.
The notable discontinuities observed in EGS and LCS scenarios reflect deliberate policy intervention timing rather than modeling artifacts. The EGS scenario exhibits a sharp peak in 2026 followed by rapid decline, representing the trajectory where economic growth initially drives increased emissions until carbon peak policies are implemented around 2030, creating a correction mechanism that balances development goals with emission constraints. The LCS scenario demonstrates an even more pronounced transition after 2030, reflecting the intensive deployment of low-carbon technologies and energy efficiency measures designed to achieve a strong decoupling post-carbon peak. These step-change patterns align with China’s policy implementation approach, where major environmental regulations typically create immediate and substantial system responses rather than gradual transitions, particularly around critical policy milestones such as the 2030 carbon peak target.
Regional pathway optimization based on decoupling performance and policy requirements yields differentiated recommendations. For Southern Jiangsu, despite three pathways achieving decoupling index transitions by 2030–2031 compared to the economic growth pathway’s one-year delay, the baseline pathway’s superior GDP growth rate (5.25% versus 5.14% for low carbon and 5.2% for comprehensive) aligns with the region’s 14th Five-Year Plan leadership role in green development and international competitiveness enhancement. For Central Jiangsu, while all applicable pathways achieve strong decoupling within 2035, the comprehensive pathway optimally balances emission reduction with the region’s designation as provincial “backbone force” requiring integration into Yangtze River Delta development. For Northern Jiangsu, only the low carbon pathway achieves strong decoupling by 2035, but its 6.08% annual growth rate satisfies development thresholds while enabling 2030 carbon peak achievement, making it most suitable for the region’s infrastructure building requirements.
This differentiated approach creates a synergistic framework where Southern Jiangsu provides leadership demonstration through baseline pathway implementation, Central Jiangsu offers balanced development models via comprehensive strategies, and Northern Jiangsu showcases intensive low-carbon intervention effectiveness. The pathway diversity enables cross-regional learning opportunities, technology transfer mechanisms, and competitive cooperation that accelerates provincial green development while respecting regional development stages and maintaining coordination toward common carbon reduction objectives.

4. Discussion

4.1. Methodological Innovation and Regional Heterogeneity Insights

The integrated “Moran’s-Kaya-LMDI-SD-Tapio” framework developed in this study advances previous methodologies by enabling simultaneous analysis of spatial, temporal, and structural dimensions of carbon emissions. While this framework was developed specifically for Jiangsu Province, its modular design demonstrates significant transferability potential to regions with comparable characteristics, including rapid urbanization, mixed energy structures, and active climate policies. This approach extends the provincial-level analysis by incorporating sub-provincial heterogeneity [53], addressing a critical gap identified by Ding et al. [54] regarding the importance of intra-provincial variations in China’s carbon emission patterns. Compared to single-method approaches, our integrated framework provides more comprehensive insights, though successful adaptation to other regions requires careful consideration of local socio-economic structures and energy profiles.
The spatial autocorrelation results revealing strengthening clustering effects (Moran’s I increase from 0.143 to 0.735 during 2016–2020) align with the findings on carbon emission spatial spillovers in the Yangtze River Delta [55]. However, our identification of the sharp decline during 2021–2022 provides new evidence that external shocks can disrupt established spatial patterns, suggesting that carbon emission convergence is more fragile than previously assumed [56]. This finding extends beyond regional boundaries, offering valuable insights for other economically integrated regions worldwide experiencing similar development pressures.
Our LMDI decomposition reveals that energy consumption per unit area (E/S) consistently dominates as the primary positive driver across all regions (147.61%, 131.82%, and 147.57%), contrasting the emphasis on energy intensity as the key factor [57]. Combined with the negative contribution of economic density (S/G), this pattern indicates that increasing per capita building area is a critical driver of residential carbon emissions. This finding supports emerging evidence that expanding living space per person, rather than general energy efficiency, has become the primary challenge for residential carbon emissions in rapidly developing regions [58]. This finding suggests that rapidly developing regions face fundamentally different emission drivers, making our methodology particularly relevant for emerging economies with expanding living standards. The negative population effect in Northern Jiangsu (−4.36%) coupled with positive urbanization impact (21.77%) extends the work on demographic transitions, demonstrating that population decline does not automatically reduce emissions when urbanization intensifies.

4.2. Policy Effectiveness and Decoupling Pathways

The scenario analysis demonstrates that the low carbon pathway achieves 10.1% emission reductions while maintaining 99.2% of baseline economic performance, providing empirical support for the “Porter Hypothesis” in the building sector context [59]. This success stems not from economic sacrifice, but from a synergistic policy mix emphasizing technological innovation and energy structure optimization, which effectively decouples growth from emissions. The differentiated carbon peak timing across regions corroborates the argument that uniform national policies may fail due to regional heterogeneity. Our finding that only the low carbon scenario enables comprehensive carbon peak by 2030 quantifies the policy intensity required. The identification of Northern Jiangsu as the binding constraint for provincial carbon peak achievement provides crucial insights for policy prioritization, supporting differential treatment approaches advocated [60].
The successful decoupling transitions identified across multiple pathways challenge the Environmental Kuznets Curve’s deterministic view. While Wu et al. [61] found weak decoupling in most Chinese provinces, our results demonstrate that strong decoupling is achievable even in less developed regions through appropriate interventions. The sensitivity analysis revealing high dependence on electricity sector parameters (11.52% for carbon emission factor) reinforces emphasis on power sector transformation as prerequisite for building decarbonization [62]. This cross-sectoral dependency finding provides crucial guidance for regions prioritizing policy sequencing, particularly relevant for developing economies where coordinated sectoral policies may be more feasible than in fragmented governance systems.
The substantial inter-regional variations identified in this study align with growing literature advocating for differentiated policy approaches in large developing economies [63,64], confirming that effective carbon reduction requires region-specific strategies. Based on the identified heterogeneity, differentiated strategies are essential to avoid uniform approaches. Southern Jiangsu should prioritize high-carbon energy substitution and carbon innovation zones; Central Jiangsu should integrate population accommodation with green infrastructure; and Northern Jiangsu should develop renewable energy bases with ecological carbon sink programs. Provincial coordination through carbon asset networks and inter-regional clean energy transfer mechanisms would optimize system-wide carbon reduction while maintaining regional economic development trajectories.

4.3. Limitations and Future Research Directions

This study faces several limitations that warrant acknowledgment. The analysis period (2016–2022) may not capture long-term structural changes, and COVID-19’s exceptional impact could affect trend reliability [65]. It is imperative to acknowledge that the long-term implications of the pandemic as an exogenous shock remain highly uncertain, and the permanence of pandemic-induced behavioral modifications require extended longitudinal validation. The evolving nature of post-pandemic socioeconomic patterns necessitates continuous model recalibration to capture emerging trends in residential energy consumption and inter-regional emission dynamics.
The system dynamics model necessarily simplifies complex relationships and assumes parameter stability, which may not hold under rapid technological change. The focus on urban residential buildings, while enabling detailed analysis, excludes rural and commercial buildings, limiting comprehensive insights into total building emissions. Future research should extend the scope to include all building types and incorporate life-cycle perspectives to capture embodied carbon [66]. The integration of behavioral factors and household-level dynamics remains underexplored, despite growing evidence of their importance [67]. Developing adaptive policy frameworks that respond to changing conditions and cross-sectoral coordination mechanisms deserves priority attention [68].

5. Conclusions

This study developed an integrated “Moran’s-Kaya-LMDI-SD-Tapio” framework to analyze carbon emission reduction pathways for urban residential buildings in Jiangsu Province, addressing regional heterogeneity in achieving carbon peak targets. The analysis reveals four key findings.
First, the spatial clustering effect of carbon emissions fluctuated significantly during the study period, with the Moran’s I index reaching a peak of 0.735 in 2020 before declining under the impact of the pandemic; this dynamic indicates strong underlying spatial dependencies that require coordinated regional policies. Second, LMDI decomposition identifies energy consumption per unit area as the dominant emission driver across all regions, contributing 147.61%, 131.82%, and 147.57% to emission growth in Southern, Central, and Northern Jiangsu, respectively. Third, scenario analysis demonstrates that only the low carbon scenario enables provincial carbon peak by 2030 with minimal economic cost (10.1% emission reduction, 99.2% economic performance). Fourth, differentiated optimal pathways emerge through decoupling analysis: baseline for Southern Jiangsu, comprehensive for Central Jiangsu, and low carbon for Northern Jiangsu.
The research contributes a replicable methodological framework for sub-provincial carbon analysis and quantifies the economic viability of aggressive carbon policies. The findings challenge assumptions about inevitable trade-offs between development and decarbonization, demonstrating that all regions can achieve strong decoupling through appropriate interventions. The findings suggest key policy priorities: differentiated regional targets, building area regulations alongside energy efficiency standards, and coordinated spatial planning to leverage clustering effects for cost-effective provincial decarbonization.

Author Contributions

Conceptualization, J.X. and G.X.; methodology, T.L.; software, T.L.; validation, J.X., T.L. and G.X.; formal analysis, G.X.; investigation, T.L., M.Y., H.X. and W.D.; resources, J.X. and G.X.; data curation, T.L., R.M. (Ronge Miao), H.Z., and R.M. (Ruiqu Ma); writing—original draft preparation, T.L. and G.X.; writing—review and editing, J.X. and G.X.; visualization, T.L., M.Y. and G.X.; supervision, J.X. and G.X.; project administration, J.X. and G.X.; funding acquisition, J.X. and G.X. All authors have read and agreed to the published version of the manuscript.

Funding

This work was supported by Yunnan Fundamental Research Projects (grant NO. 202501CF070061), the National Natural Science Foundation of China (grant NO. 51878591), and Social Development Special Project of Yunnan Provincial Science and Technology Department (grant NO. 202403AC100042).

Data Availability Statement

The original contributions presented in the study are included in the article, further inquiries can be directed to the corresponding author.

Conflicts of Interest

The authors declare no conflicts of interest. The funders had no role in the design of the study; in the collection, analyses, or interpretation of data; in the writing of the manuscript; or in the decision to publish the results.

Appendix A. Detailed LMDI Decomposition Formulas

The individual factor contributions from Equation (4) are calculated as:
C P = C T C 0 l n C T l n C 0 × l n P T P 0 ,
C U P = C T C 0 l n C T l n C 0 × l n U P T U P 0 ,
C E U = C T C 0 l n C T l n C 0 × l n E U T E U 0 ,
C G E = C T C 0 l n C T l n C 0 × l n G E T G E 0 ,
C S G = C T C 0 l n C T l n C 0 × l n S G T S G 0 ,
C E S = C T C 0 l n C T l n C 0 × l n E S T E S 0 ,
C C E = C T C 0 l n C T l n C 0 × l n C E T C E 0 ,

Appendix B. Statistical Table of Related Factors in the SD Model

SubsystemInfluencing FactorDefinition
EconomicGDPGross Domestic Product
Per capita GDPPer capita Gross Domestic Product
Value added of secondary industryValue added by secondary industry in production of final products and services during a specific period
Per capita consumption expenditure of urban residentsTotal expenditure of urban resident households for daily life per capita
Per capita disposable income of urban residentsCash income available for household daily life arrangements after deducting necessary expenses
SocialPopulationPopulation residing in a region for more than six months
Urban populationPopulation residing in cities and towns
Urbanization rateProportion of urban population to total population
Urban residential areaGeneral household residential area
EnergyTotal energy consumptionTotal consumption of various energy sources in the region during a specific period
Per capita energy consumptionAverage energy consumption per person
PolicyScience and technology service investmentInvestment supporting technological activities, also productive investment
Economic densityRatio of regional GDP to regional area

Appendix C. SD Model Validation

To ensure the validity and reliability of the SD model, this study implemented a series of rigorous tests, including historical validation and stability testing. Simulation models are considered to have good reliability and validity if simulation data fall within a 15% error range. The specific testing formula is expressed as Equation (A8):
P t = S t H t H t ,
where Pt represents the relative error for year t, St represents the simulated value for year t, and Ht represents the actual value for year t.
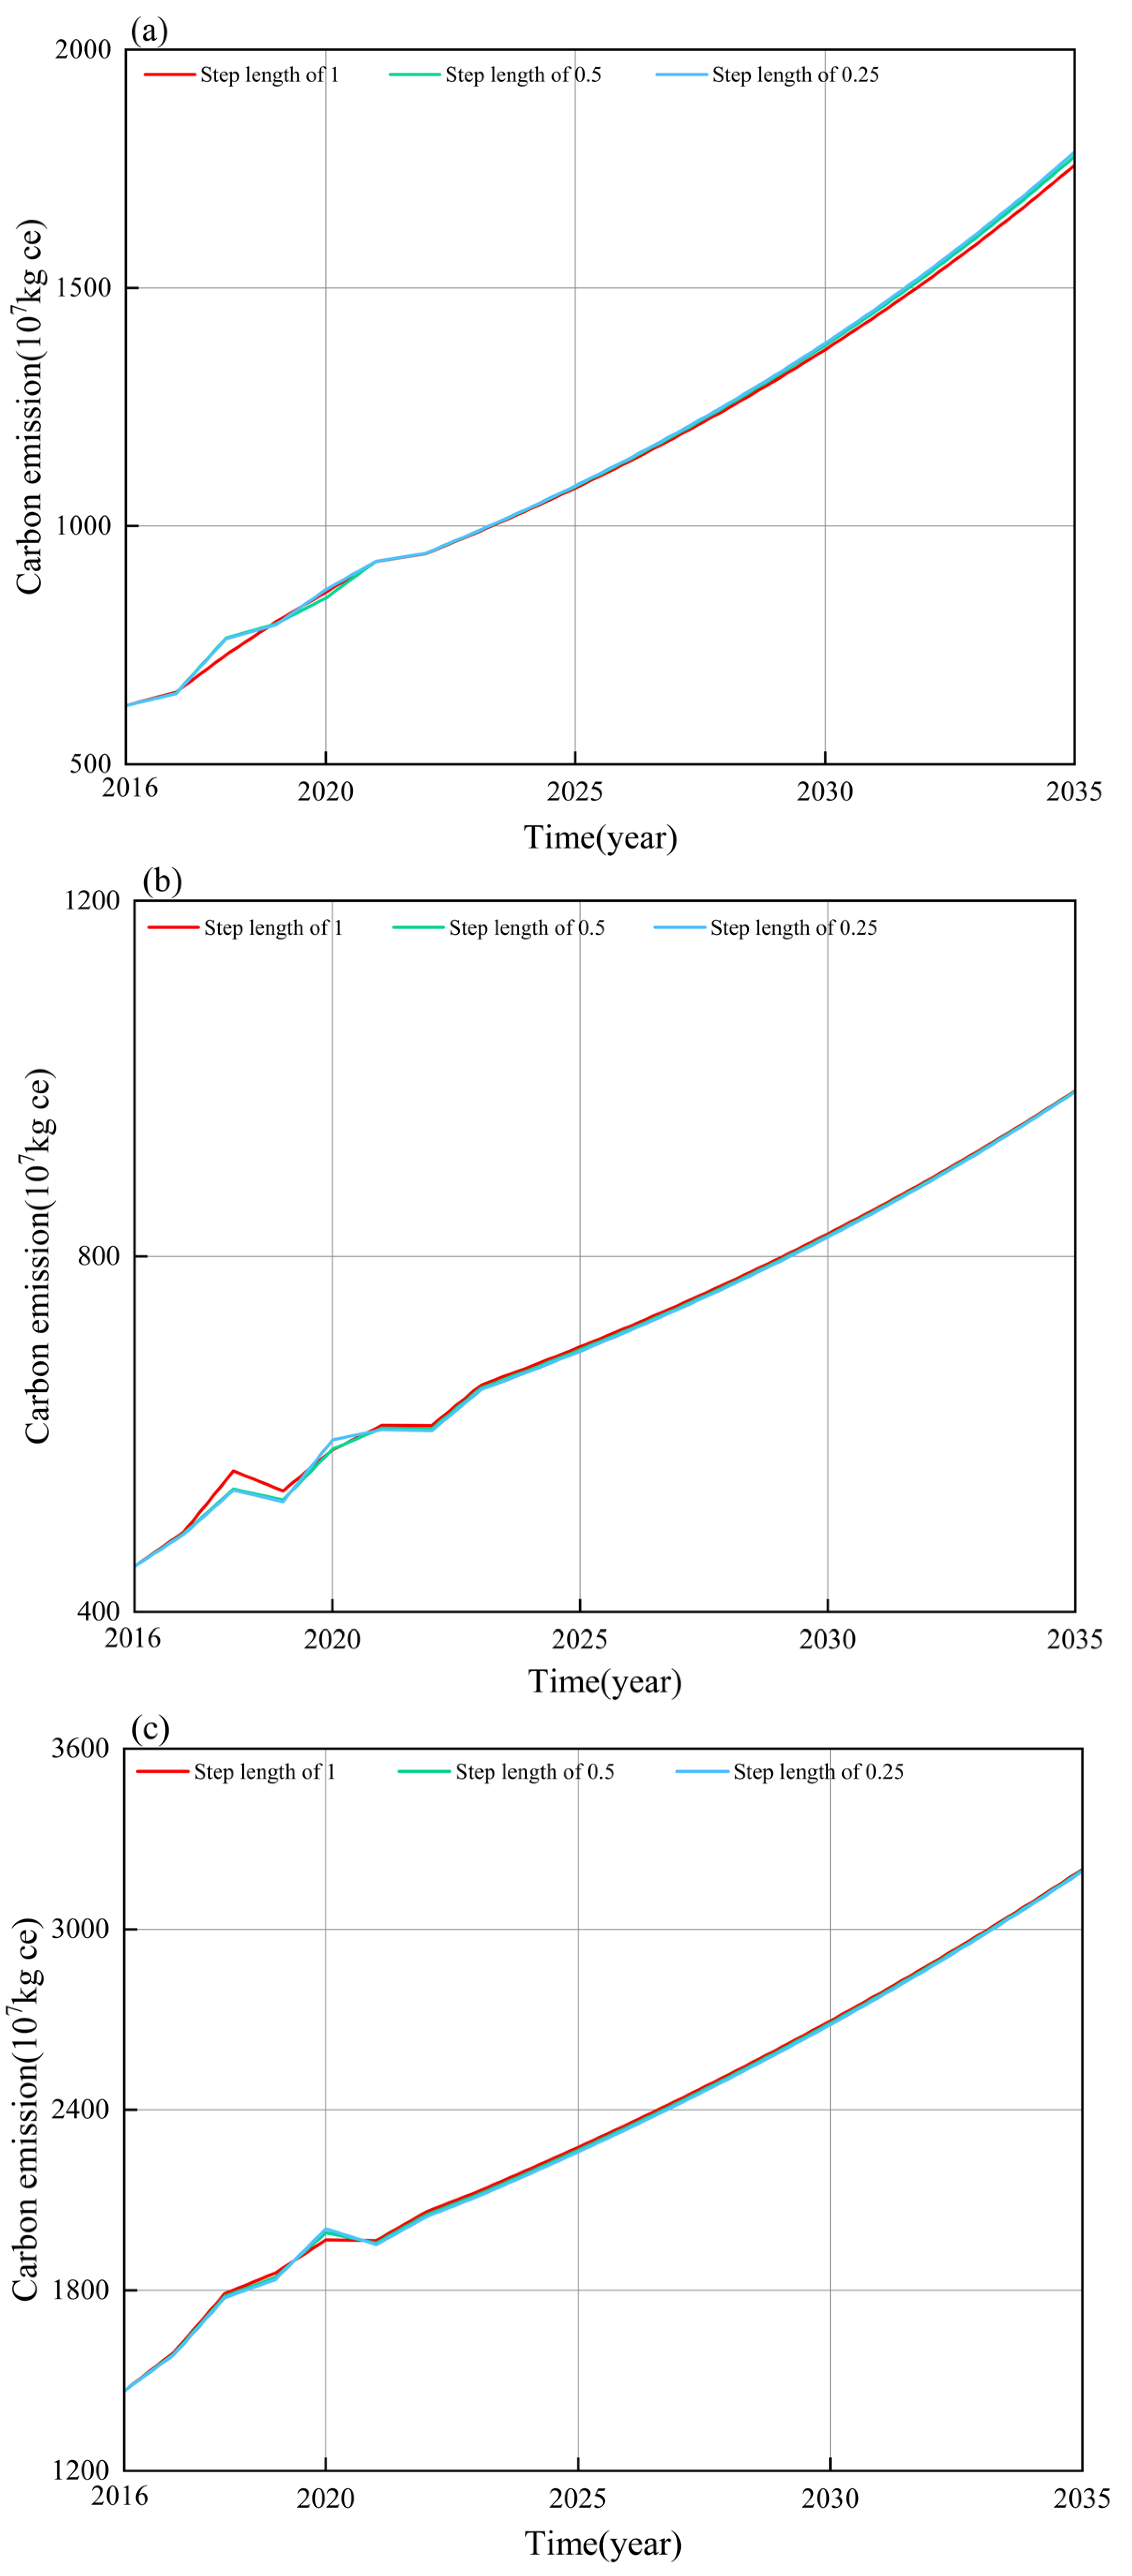
Additionally, this study employed Vensim 10.3.0 software, a specialized SD modeling tool, to conduct stability testing through time step configuration, with step sizes set at 0.25, 0.5, and 1. If different step sizes have minimal impact on total residential building carbon emissions, the model demonstrates stability.
The results indicate that through comparison with historical data from 2016–2022, the absolute errors of all selected indicator simulation values remain within 10%, as shown in Figure A1. Stability testing through varied time step configurations revealed that changes in time steps have negligible impact on residential building carbon emissions, as illustrated in Figure A2. These findings demonstrate that the model has satisfactorily passed operational testing and exhibits robust stability.
Figure A1. Historical test error chart of main factors of residential buildings in Jiangsu Province. (a) Southern Jiangsu; (b) Central Jiangsu; (c) Northern Jiangsu.
Buildings 15 02687 g0a1aBuildings 15 02687 g0a1b
Figure A2. Carbon emission stability test chart of residential buildings in Jiangsu Province. (a) Southern Jiangsu; (b) Central Jiangsu; (c) Northern Jiangsu.
Buildings 15 02687 g0a2
The above stability testing confirms that the SD model for Jiangsu Province meets stability requirements.

Appendix D. Parameter Settings of Key Variables for Four Scenarios Across Three Regions

RegionFactorPeriodBSLCSEGSCS
Southern JiangsuGDP growth rate (%)2026–203043.64.23.8
2031–20353.6343.2
Population increase rate (%)2026–20300.12−0.030.20.01
2031–2035−0.09−0.170.13−0.02
Urbanization rate (%)2026–20308686.78987
2031–203587899290
Scientific innovation input (×108 CNY)2026–2030546591558574
2031–2035571656590615
Central JiangsuGDP growth rate (%)2026–20304.64.24.84.4
2031–20354.353.54.64
Population increase rate (%)2026–2030−0.04−0.110.01−0.06
2031–2035−0.09−0.19−0.03−0.13
Urbanization rate (%)2026–203074757876
2031–203575788281
Scientific innovation input (×108 CNY)2026–2030112125116122
2031–2035126145132140
Northern JiangsuGDP growth rate (%)2026–203065.56.25.7
2031–20355.54.65.75
Population increase rate (%)2026–2030−0.12−0.20.03−0.11
2031–2035−0.17−0.3−0.13−0.19
Urbanization rate (%)2026–203069717573
2031–203571737876
Scientific innovation input (×108 CNY)2026–2030116127119123
2031–2035131151138141
All RegionsElectricity carbon emission factor2026–20300.60.550.610.57
2031–2035−0.01−0.04−0.005−0.02

References

  1. Rogelj, J.; den Elzen, M.; Höhne, N.; Fransen, T.; Fekete, H.; Winkler, H.; Schaeffer, R.; Sha, F.; Riahi, K.; Meinshausen, M. Paris Agreement climate proposals need a boost to keep warming well below 2 °C. Nature 2016, 534, 631–639. [Google Scholar] [CrossRef]
  2. Masson-Delmotte, V.; Zhai, P.; Pörtner, H.O.; Roberts, D.; Skea, J.; Shukla, P.R. Global Warming of 1.5 C: IPCC Special Report on Impacts of Global Warming of 1.5 C Above Pre-Industrial Levels in Context of Strengthening Response to Climate Change, Sustainable Development, and Efforts to Eradicate Poverty; Cambridge University Press: Cambridge, UK, 2022. [Google Scholar]
  3. Xu, D.; Li, J.; Sheng, C. Carbon Peaking and Carbon Neutrality in China: Theory and Practice; Springer Nature: Dordrecht, GX, The Netherlands, 2024. [Google Scholar]
  4. China association of building energy efficiency. Research Report on Carbon Emissions in China’s Urban and Rural Construction Sector (2024 Edition). 2024. Available online: http://www.xjaepi.org.cn/upload/portal/20250124/5af26b9d581063ad6c58594680ca30ae.pdf (accessed on 10 January 2025).
  5. Wang, X.; Duan, Z.; Wu, L.; Yang, D. Estimation of carbon dioxide emission in highway construction: A case study in southwest region of China. J. Clean. Prod. 2015, 103, 705–714. [Google Scholar] [CrossRef]
  6. Wang, J.; You, K.; Qi, L.; Ren, H. Gravity center change of carbon emissions in Chinese residential building sector: Differences between urban and rural area. Energy Rep. 2022, 8, 10644–10656. [Google Scholar] [CrossRef]
  7. Zhang, Z.; Mu, X.; Hu, G. Analysis of influencing factors of energy consumption in Beijing: Based on the IPAT model. Environ. Dev. Sustain. 2024, 26, 12569–12588. [Google Scholar] [CrossRef]
  8. Wang, Q.; Han, X.; Li, R. Does technical progress curb India’s carbon emissions? A novel approach of combining extended index decomposition analysis and production-theoretical decomposition analysis. J. Environ. Manag. 2022, 310, 114720. [Google Scholar] [CrossRef]
  9. Zhu, C.; Chang, Y.; Li, X.; Shan, M. Factors influencing embodied carbon emissions of China’s building sector: An analysis based on extended STIRPAT modeling. Energy Build. 2022, 255, 111607. [Google Scholar] [CrossRef]
  10. Lin, C.; Li, X. Carbon peak prediction and emission reduction pathways exploration for provincial residential buildings: Evidence from Fujian Province. Sustain. Cities Soc. 2024, 102, 105239. [Google Scholar] [CrossRef]
  11. Huo, T.; Ma, Y.; Yu, T.; Cai, W.; Liu, B.; Ren, H. Decoupling and decomposition analysis of residential building carbon emissions from residential income: Evidence from the provincial level in China. Environ. Impact Assess. Rev. 2021, 86, 106487. [Google Scholar] [CrossRef]
  12. Yang, X.; Sima, Y.; Lv, Y.; Li, M. Research on influencing factors of residential building carbon emissions and Carbon Peak: A case of Henan Province in China. Sustainability 2023, 15, 10243. [Google Scholar] [CrossRef]
  13. Ke, Y.; Zhou, L.; Zhu, M.; Yang, Y.; Fan, R.; Ma, X. Scenario prediction of carbon emission peak of urban residential buildings in China’s coastal region: A case of Fujian province. Sustainability 2023, 15, 2456. [Google Scholar] [CrossRef]
  14. Li, W.; Li, Q.; Zhang, C.; Jin, S.; Wang, Z.; Huang, S.; Deng, S. The Quantification of Carbon Emission Factors for Residential buildings in Yunnan Province. Buildings 2024, 14, 880. [Google Scholar] [CrossRef]
  15. Jia, T.; Yang, S.; Li, X.; Yan, P.; Yu, X.; Luo, X.; Chen, K. Computation of carbon emissions of residential buildings in Wuhan and its spatiotemporal analysis. J. Geo-Inf. Sci. 2020, 22, 1063–1072. [Google Scholar]
  16. Huo, T.; Cao, R.; Du, H.; Zhang, J.; Cai, W.; Liu, B. Nonlinear influence of urbanization on China’s urban residential building carbon emissions: New evidence from panel threshold model. Sci. Total Environ. 2021, 772, 145058. [Google Scholar] [CrossRef] [PubMed]
  17. Huang, R.; Zhang, X.; Liu, K. Assessment of operational carbon emissions for residential buildings comparing different machine learning approaches: A study of 34 cities in China. Build. Environ. 2024, 250, 111176. [Google Scholar] [CrossRef]
  18. Ojaghlou, M.; Ugurlu, E.; Kadłubek, M.; Thalassinos, E. Economic activities and management issues for the environment: An environmental Kuznets curve (EKC) and STIRPAT analysis in Turkey. Resources 2023, 12, 57. [Google Scholar] [CrossRef]
  19. Rehman, E.; Rehman, S. Modeling the nexus between carbon emissions, urbanization, population growth, energy consumption, and economic development in Asia: Evidence from grey relational analysis. Energy Rep. 2022, 8, 5430–5442. [Google Scholar] [CrossRef]
  20. Xu, J.; Qian, Y.; He, B.; Xiang, H.; Ling, R.; Xu, G. Strategies for Mitigating Urban Residential Carbon Emissions: A System Dynamics Analysis of Kunming, China. Buildings 2024, 14, 982. [Google Scholar] [CrossRef]
  21. Song, T.; Zou, X.; Wang, N.; Zhang, D.; Zhao, Y.; Wang, E. Prediction of China’s Carbon Peak Attainment Pathway from Both Production-Side and Consumption-Side Perspectives. Sustainability 2023, 15, 4844. [Google Scholar] [CrossRef]
  22. Han, Y.; Cao, L.; Geng, Z.; Ping, W.; Zuo, X.; Fan, J.; Wan, J.; Lu, G. Novel economy and carbon emissions prediction model of different countries or regions in the world for energy optimization using improved residual neural network. Sci. Total Environ. 2023, 860, 160410. [Google Scholar] [CrossRef]
  23. Liu, X.; Wang, X.; Meng, X. Carbon emission scenario prediction and peak path selection in China. Energies 2023, 16, 2276. [Google Scholar] [CrossRef]
  24. Kazancoglu, Y.; Ekinci, E.; Mangla, S.K.; Sezer, M.D.; Kayikci, Y. Performance evaluation of reverse logistics in food supply chains in a circular economy using system dynamics. Bus. Strat. Environ. 2021, 30, 71–91. [Google Scholar] [CrossRef]
  25. Shepherd, S.P. A review of system dynamics models applied in transportation. Transp. B Transp. Dyn. 2014, 2, 83–105. [Google Scholar] [CrossRef]
  26. Fontes, C.H.D.O.; Freires, F.G.M. Sustainable and renewable energy supply chain: A system dynamics overview. Renew. Sustain. Energy Rev. 2018, 82, 247–259. [Google Scholar] [CrossRef]
  27. Riaz, H.; Khan, K.I.A.; Ullah, F.; Tahir, M.B.; Alqurashi, M.; Alsulami, B.T. Key factors for implementation of total quality management in construction Sector: A system dynamics approach. Ain Shams Eng. J. 2023, 14, 101903. [Google Scholar] [CrossRef]
  28. Miao, A.; Yuan, Y.; Wu, H.; Ma, X.; Shao, C.; Xiang, S. Pathway for China’s provincial carbon emission peak: A case study of the Jiangsu Province. Energy 2024, 298, 131417. [Google Scholar] [CrossRef]
  29. Deng, J.; Liu, C.; Mao, C. Carbon Emissions Drivers and Reduction Strategies in Jiangsu Province. Sustainability 2024, 16, 5276. [Google Scholar] [CrossRef]
  30. Jiangsu Provincial Government. Population and Administrative Divisions. 2025. Available online: https://www.jiangsu.gov.cn/col/col88749/index.html (accessed on 28 April 2025).
  31. Bureau of Statistics of Jiangsu Province. Interpretation of the Main Statistical Data on Jiangsu’s Economic and Social Development in 2024. 2025. Available online: https://www.js.gov.cn/art/2025/1/23/art_88350_11478583.html (accessed on 28 April 2025).
  32. National Bureau of Statistics of China. Statistical Communiqué of the People’s Republic of China on the 2024 National Economic and Social Development. 2025. Available online: https://www.gov.cn/lianbo/bumen/202502/content_7008605.htm (accessed on 28 April 2025).
  33. Province Bureau of Statistics of Jiangsu. Jiangsu Statistical Yearbook. 2025. Available online: https://www.jiangsu.gov.cn/col/col84736/ (accessed on 10 January 2025).
  34. Xiong, G.; Cao, X.; Hamm, N.A.S.; Lin, T.; Zhang, G.; Chen, B. Unbalanced development characteristics and driving mechanisms of regional urban spatial form: A case study of Jiangsu Province, China. Sustainability 2021, 13, 3121. [Google Scholar] [CrossRef]
  35. Jiangsu Provincial Department of Housing and Urban-Rural Development, Jiangsu Provincial Development and Reform Commission. Carbon Peak Implementation Plan for Urban and Rural Construction in Jiangsu Province. 2023. Available online: https://jsszfhcxjst.jiangsu.gov.cn/art/2023/1/18/art_8639_10729756.html (accessed on 10 January 2025).
  36. Jiangsu Provincial Department of Housing and Urban-Rural Development. Jiangsu’s 14th Five-Year Plan on Green Building High-Quality Development. 2021. Available online: https://jsszfhcxjst.jiangsu.gov.cn/art/2021/9/14/art_8639_10013660.html (accessed on 10 January 2025).
  37. Jiangsu Provincial Department of Housing and Urban-Rural Development. Jiangsu’s 14th Five-Year Plan for the Construction Industry. 2021. Available online: https://jsszfhcxjst.jiangsu.gov.cn/art/2021/7/23/art_8639_9897063.html (accessed on 10 January 2025).
  38. National Bureau of Statistics of China. China City Statistical Yearbook. 2023. Available online: https://www.stats.gov.cn/english/Statisticaldata/yearbook/ (accessed on 12 January 2025).
  39. Jiangsu Provincial Department of Industry and Information Technology. Jiangsu Province’s 13th Five-Year Energy Conservation Plan. 2016. Available online: https://gxt.jiangsu.gov.cn/art/2016/10/14/art_6299_3030340.html (accessed on 10 January 2025).
  40. Moran, P.A.P. Notes on continuous stochastic phenomena. Biometrika 1950, 37, 17–23. [Google Scholar] [CrossRef]
  41. Moraga, P. Spatial Statistics for Data Science: Theory and Practice with R; CRC Press: Boca Raton, FL, USA, 2023. [Google Scholar]
  42. Kaya, Y. Impact of Carbon Dioxide Emission Control on GNP Growth: Interpretation of Proposed Scenarios; Intergovernmental Panel on Climate Change/Response Strategies Working Group: Geneva, Switzerland, 1989. [Google Scholar]
  43. Li, R.; You, K.; Cai, W.; Wang, J.; Liu, Y.; Yu, Y. Will the southward center of gravity migration of population, floor area, and building energy consumption facilitate building carbon emission reduction in China? Build. Environ. 2023, 242, 110576. [Google Scholar] [CrossRef]
  44. Huo, T.; Li, X.; Cai, W.; Zuo, J.; Jia, F.; Wei, H. Exploring the impact of urbanization on urban building carbon emissions in China: Evidence from a provincial panel data model. Sustain. Cities Soc. 2020, 56, 102068. [Google Scholar] [CrossRef]
  45. Chen, Y.; Lin, S. Study on factors affecting energy-related per capita carbon dioxide emission by multi-sectoral of cities: A case study of Tianjin. Nat. Hazards 2015, 77, 833–846. [Google Scholar] [CrossRef]
  46. Meng, Z.; Wang, H.; Wang, B. Empirical analysis of carbon emission accounting and influencing factors of energy consumption in China. Int. J. Environ. Res. Public Health 2018, 15, 2467. [Google Scholar] [CrossRef]
  47. Wang, L.; Dai, S. Carbon Footprint Accounting and Verification of Seven Major Urban Agglomerations in China Based on Dynamic Emission Factor Model. Sustainability 2024, 16, 9817. [Google Scholar] [CrossRef]
  48. Zhang, Z.; Liu, Y.; Ma, T. Assessing spatiotemporal characteristics and driving factors of urban public buildings carbon emissions in China: An approach based on LMDI analysis. Atmosphere 2023, 14, 1280. [Google Scholar] [CrossRef]
  49. Ang, B.W. LMDI decomposition approach: A guide for implementation. Energy Policy 2015, 86, 233–238. [Google Scholar] [CrossRef]
  50. Jing, L.; Zhou, B.; Liao, Z. Decoupling Analysis of Economic Growth and Carbon Emissions in Xinjiang Based on Tapio and Logarithmic Mean Divisia Index Models. Sustainability 2024, 16, 8010. [Google Scholar] [CrossRef]
  51. Yin, Z.; Jiang, X.; Lin, S.; Liu, J. The impact of online education on carbon emissions in the context of the COVID-19 pandemic—Taking Chinese universities as examples. Appl. Energy 2022, 314, 118875. [Google Scholar] [CrossRef]
  52. Li, Z.; Qin, Y.; Zhang, L.; Li, T.; Wang, Q. Research on the development for emerging industries in Nan-tong under the national strategy. IOP Conf. Ser. Earth Environ. Sci. 2017, 81, 012108. [Google Scholar] [CrossRef]
  53. Li, D.; Huang, G.; Zhu, S.; Chen, L.; Wang, J. How to peak carbon emissions of provincial construction industry? Scenario analysis of Jiangsu Province. Renew. Sustain. Energy Rev. 2021, 144, 110953. [Google Scholar] [CrossRef]
  54. Ding, Y.; Xu, L.; Sun, Y.; Wu, Y.; Liu, X.; Geng, X. Large but overlooked carbon differentiations inside China’s provinces matters to mitigation strategies design: Evidence from county-level analysis. Sci. Total Environ. 2023, 898, 165551. [Google Scholar] [CrossRef]
  55. Lv, T.; Hu, H.; Zhang, X.; Xie, H.; Wang, L.; Fu, S. Spatial spillover effects of urbanization on carbon emissions in the Yangtze River Delta urban agglomeration, China. Environ. Sci. Pollut. Res. 2022, 29, 33920–33934. [Google Scholar] [CrossRef] [PubMed]
  56. Yang, T.; Pan, Y.; Yang, Y.; Lin, M.; Qin, B.; Xu, P.; Huang, Z. CO2 emissions in China’s building sector through 2050: A scenario analysis based on a bottom-up model. Energy 2017, 128, 208–223. [Google Scholar] [CrossRef]
  57. Duan, C.; Zhu, W.; Wang, S.; Chen, B. Drivers of global carbon emissions 1990–2014. J. Clean. Prod. 2022, 371, 133371. [Google Scholar] [CrossRef]
  58. Chen, H.; Du, Q.; Huo, T.; Liu, P.; Cai, W.; Liu, B. Spatiotemporal patterns and driving mechanism of carbon emissions in China’s urban residential building sector. Energy 2023, 263, 126102. [Google Scholar] [CrossRef]
  59. Porter, M.E.; Linde, C.V.D. Toward a new conception of the environment-competitiveness relationship. J. Econ. Perspect. 1995, 9, 97–118. [Google Scholar] [CrossRef]
  60. Liu, R.; Fang, Y.R.; Peng, S.; Benani, N.; Wu, X.; Chen, Y.; Wang, T.; Chai, Q.; Yang, P. Study on factors influencing carbon dioxide emissions and carbon peak heterogenous pathways in Chinese provinces. J. Environ. Manag. 2024, 365, 121667. [Google Scholar] [CrossRef]
  61. Wu, Y.; Tam, V.W.Y.; Shuai, C.; Shen, L.; Zhang, Y.; Liao, S. Decoupling China’s economic growth from carbon emissions: Empirical studies from 30 Chinese provinces (2001–2015). Sci. Total Environ. 2019, 656, 576–588. [Google Scholar] [CrossRef]
  62. Hermwille, L. Hardwired towards transformation? Assessing global climate governance for power sector decarbonization. Earth Syst. Gov. 2021, 8, 100054. [Google Scholar] [CrossRef]
  63. Yang, T.; Zhou, C.; Xiao, T.; Xu, Q. Coordinated Development of the Digital Economy and Urban–Rural Integration in the Yangtze River Delta and Its Spatial Correlation Structure. Sustainability 2025, 17, 4144. [Google Scholar] [CrossRef]
  64. Chen, H.; Wang, E.; Wang, N.; Song, T. Research on embodied carbon transfer measurement and carbon compensation among regions in China. Int. J. Environ. Res. Public Health 2023, 20, 2761. [Google Scholar] [CrossRef]
  65. Han, P.; Cai, Q.; Oda, T.; Zeng, N.; Shan, Y.; Lin, X.; Liu, D. Assessing the recent impact of COVID-19 on carbon emissions from China using domestic economic data. Sci. Total Environ. 2021, 750, 141688. [Google Scholar] [CrossRef]
  66. Khan, S.A.; Alam, T.; Khan, M.S.; Blecich, P.; Kamal, M.A.; Gupta, N.K.; Yadav, A.S. Life cycle assessment of embodied carbon in buildings: Background, approaches and advancements. Buildings 2022, 12, 1944. [Google Scholar] [CrossRef]
  67. Su, S.; Ding, Y.; Li, G.; Li, X.; Li, H.; Skitmore, M.; Menadue, V. Temporal dynamic assessment of household energy consumption and carbon emissions in China: From the perspective of occupants. Sustain. Prod. Consum. 2023, 37, 142–155. [Google Scholar] [CrossRef]
  68. Yang, X.; Heidug, W.; Cooke, D. An adaptive policy-based framework for China’s Carbon Capture and Storage development. Front. Eng. Manag. 2019, 6, 78–86. [Google Scholar] [CrossRef]
Figure 1. Integrated analytical framework for carbon emission reduction pathways of urban residential buildings in Jiangsu Province.
Buildings 15 02687 g001
Figure 2. Geographical location and regional division of Jiangsu Province.
Buildings 15 02687 g002
Figure 3. Causal loop diagram of carbon emission system of residential buildings in Jiangsu Province.
Buildings 15 02687 g003
Figure 4. Stock and flow diagram of carbon emission system of residential buildings in Jiangsu Province.
Buildings 15 02687 g004
Figure 5. Carbon emissions and growth rate of residential buildings in 2016–2022.
Buildings 15 02687 g005
Figure 6. Carbon emission distribution maps of residential buildings in Jiangsu Province in 2016, 2019 and 2022.
Buildings 15 02687 g006
Figure 7. Annual decomposition results of carbon emission factors in Jiangsu Province from 2016 to 2022: (a) is Southern Jiangsu; (b) is Central Jiangsu; (c) is Northern Jiangsu.
Buildings 15 02687 g007
Figure 8. Baseline scenario (BS) simulation prediction results in Jiangsu Province.
Buildings 15 02687 g008
Figure 9. Low carbon scenario (LCS) simulation prediction results in Jiangsu Province.
Buildings 15 02687 g009
Figure 10. Economic growth scenario (EGS) simulation prediction results in Jiangsu Province.
Buildings 15 02687 g010
Figure 11. Comprehensive scenario (CS) simulation prediction results in Jiangsu Province.
Buildings 15 02687 g011
Figure 12. Tapio decoupling index during 2025–2035 in different scenarios. (a) is Southern Jiangsu; (b) is Central Jiangsu; (c) is Northern Jiangsu. The horizontal dash line at 0 serves as a reference line to identify the transition points of decoupling states across scenarios.
Buildings 15 02687 g012
Table 1. Decoupling state classification.
Decoupling StateΔCΔGTDecoupling Type
DecouplingΔC > 0ΔG > 00 < T < 0.8Weak decoupling
ΔC < 0ΔG > 0T < 0Strong decoupling
ΔC < 0ΔG < 0T > 1.2Recession decoupling
Negative
Decoupling
ΔC < 0ΔG < 00 < T < 0.8Weak negative decoupling
ΔC > 0ΔG < 0T < 0Strong negative decoupling
ΔC > 0ΔG > 0T > 1.2Negative decoupling of expansion
ConnectionΔC > 0ΔG > 00.8 < T < 1.2Expansion connection
ΔC < 0ΔG < 00.8 < T < 1.2Recession connection
Table 2. Global Moran’s index results for residential building carbon emissions (2016–2022).
YearsMoran’s IndexZP
20160.1431.6870.046
20170.1481.7950.036
20180.2501.9510.026
20190.7564.0680.000
20200.7354.1900.000
20210.1761.6540.049
20220.0701.1510.125
Table 3. LMDI decomposition results of carbon emission factors across three regions in Jiangsu Province from 2016 to 2022 (Unit: 10,000 tons).
FactorSouthern JiangsuCentral JiangsuNorthern Jiangsu
2016–2022Contribution
(%)
2016–2022Contribution
(%)
2016–2022Contribution
(%)
P76.1113.523.962.54−13.89−4.36
U/P71.8312.7652.2733.5569.3921.77
E/U704.58125.2197.39126.73385.36120.9
G/E−43.85−7.795.023.23−92.19−28.91
S/G−786.85−139.82−210−135.06−378.18−118.62
E/S830.7147.61204.97131.82470.38147.57
C/E−289.75−51.48−97.86−62.81−121.98−38.25
Total562.77100155.75100318.89100
Disclaimer/Publisher’s Note: The statements, opinions and data contained in all publications are solely those of the individual author(s) and contributor(s) and not of MDPI and/or the editor(s). MDPI and/or the editor(s) disclaim responsibility for any injury to people or property resulting from any ideas, methods, instructions or products referred to in the content.