A Review of the Impact of Urban Form on Building Carbon Emissions


Abstract
1. Introduction
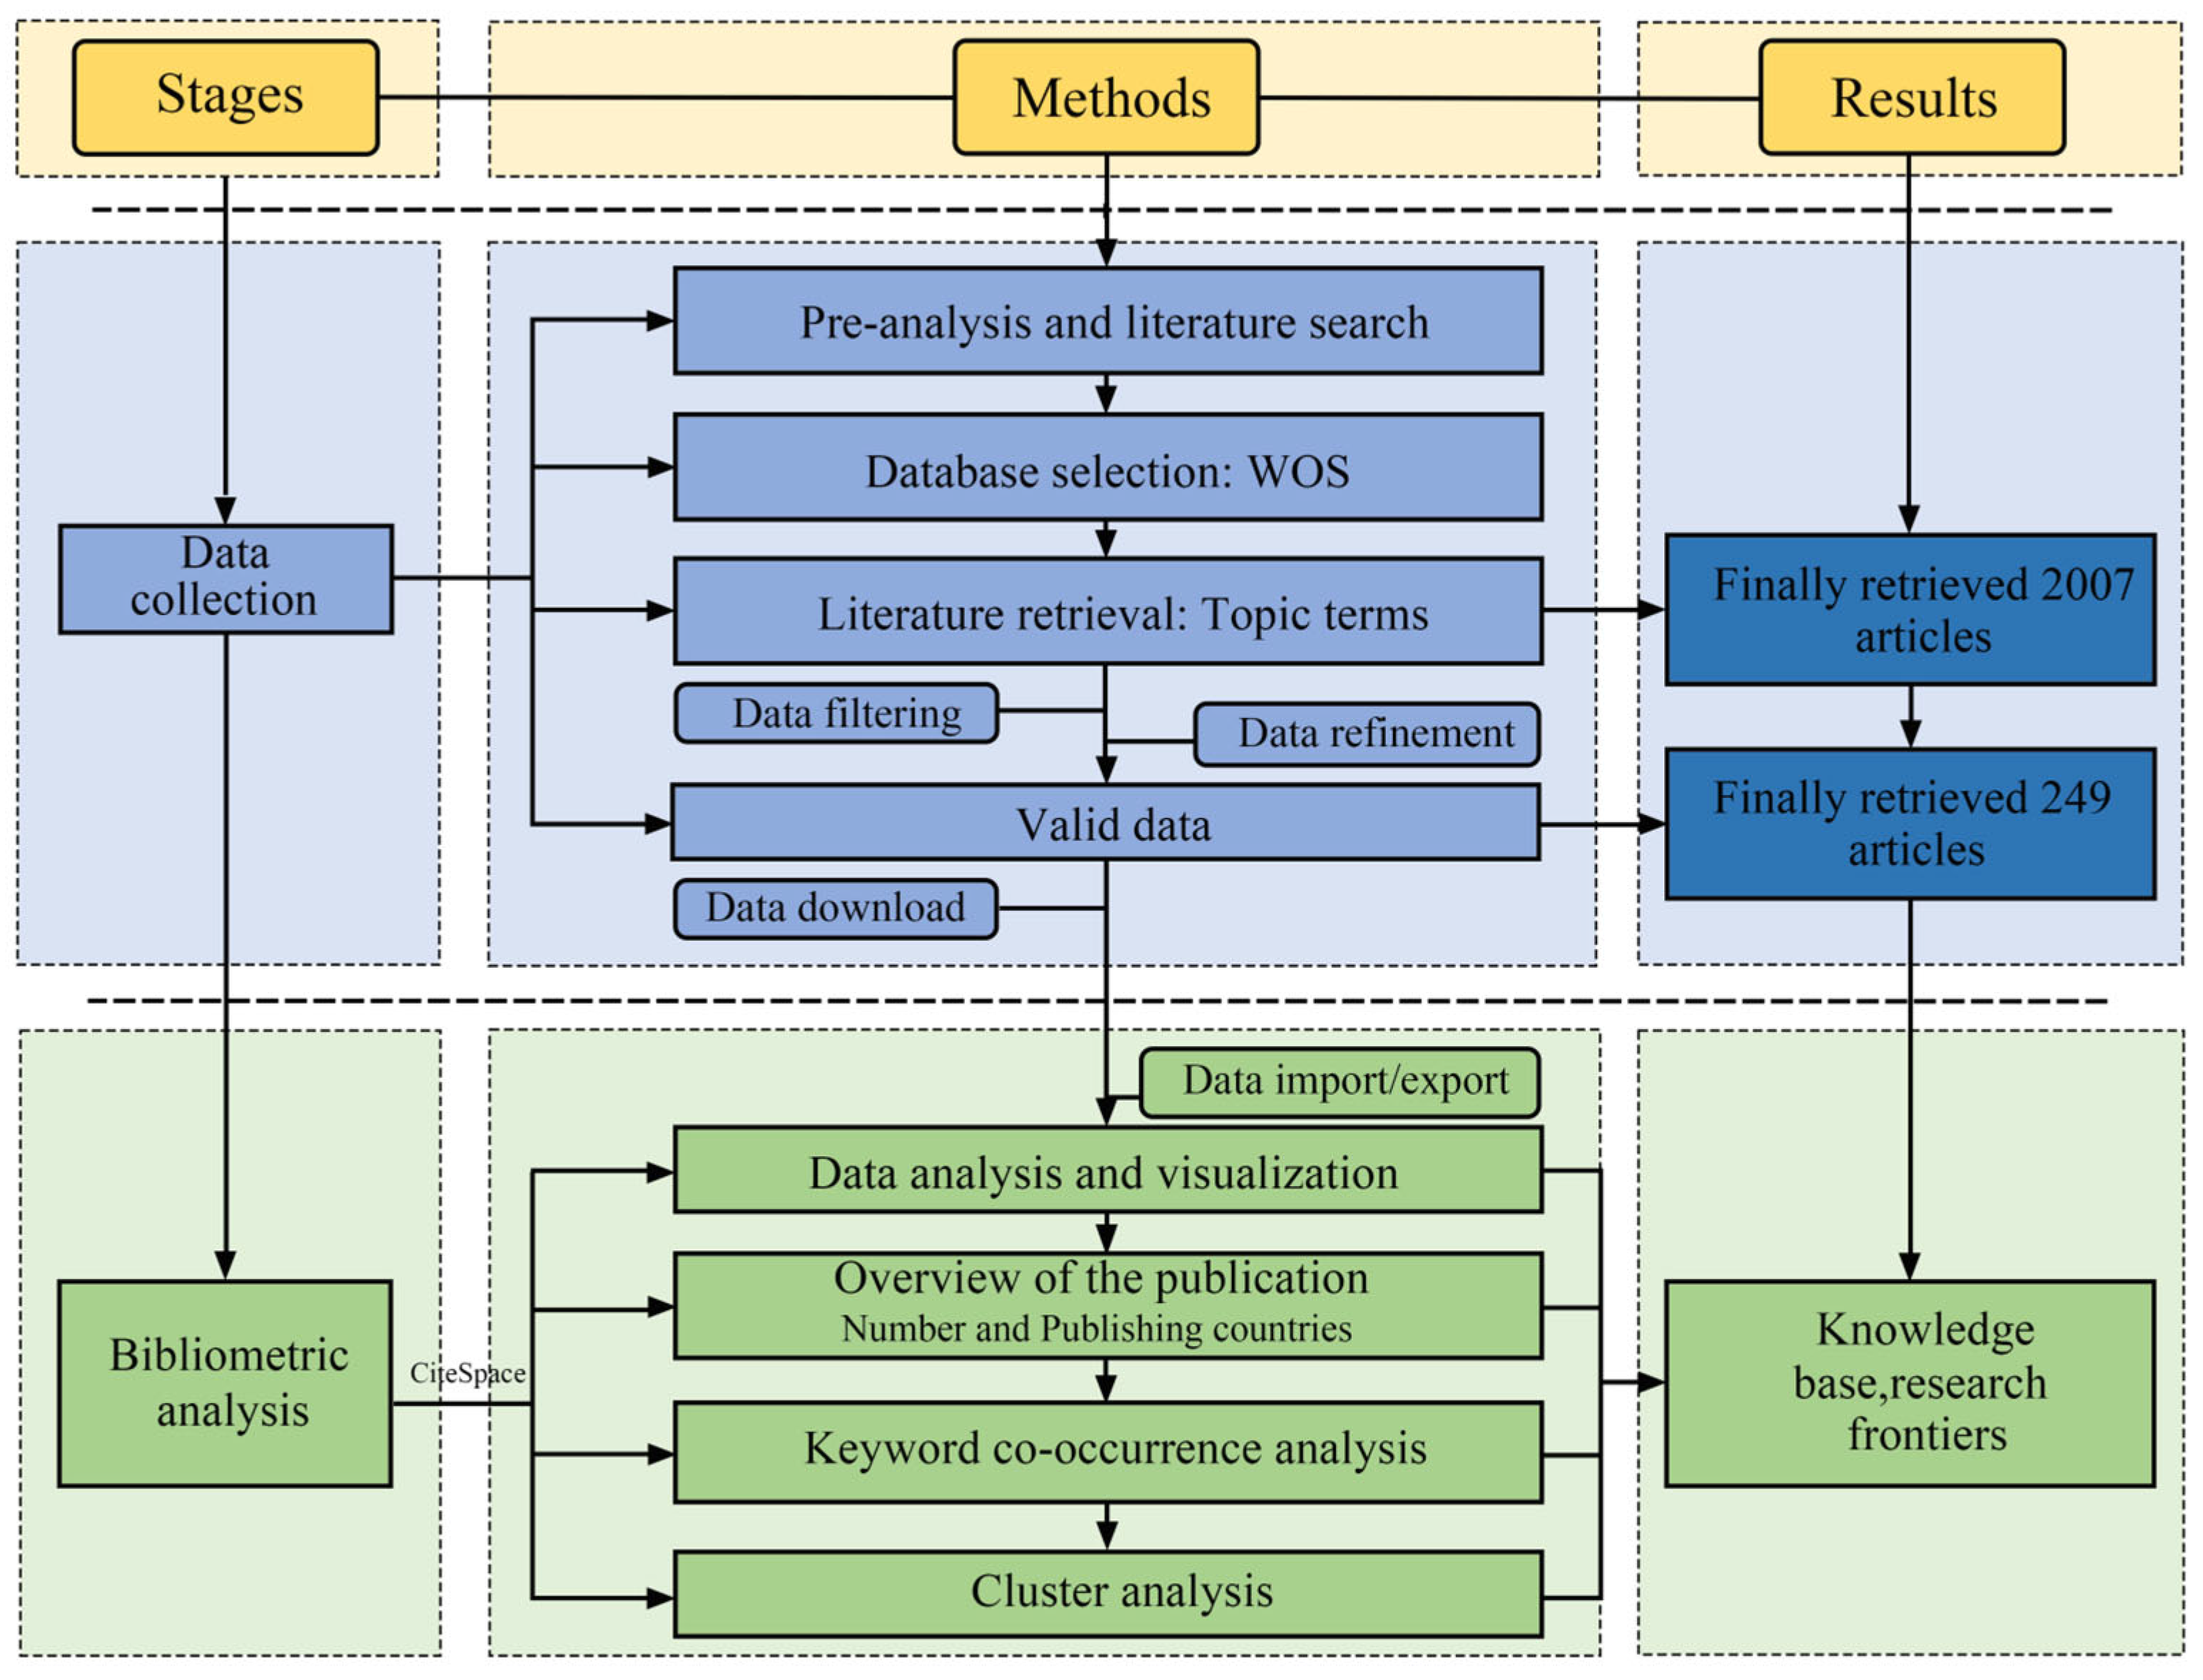
2. Bibliometric Methods and Results
2.1. Materials and Methods
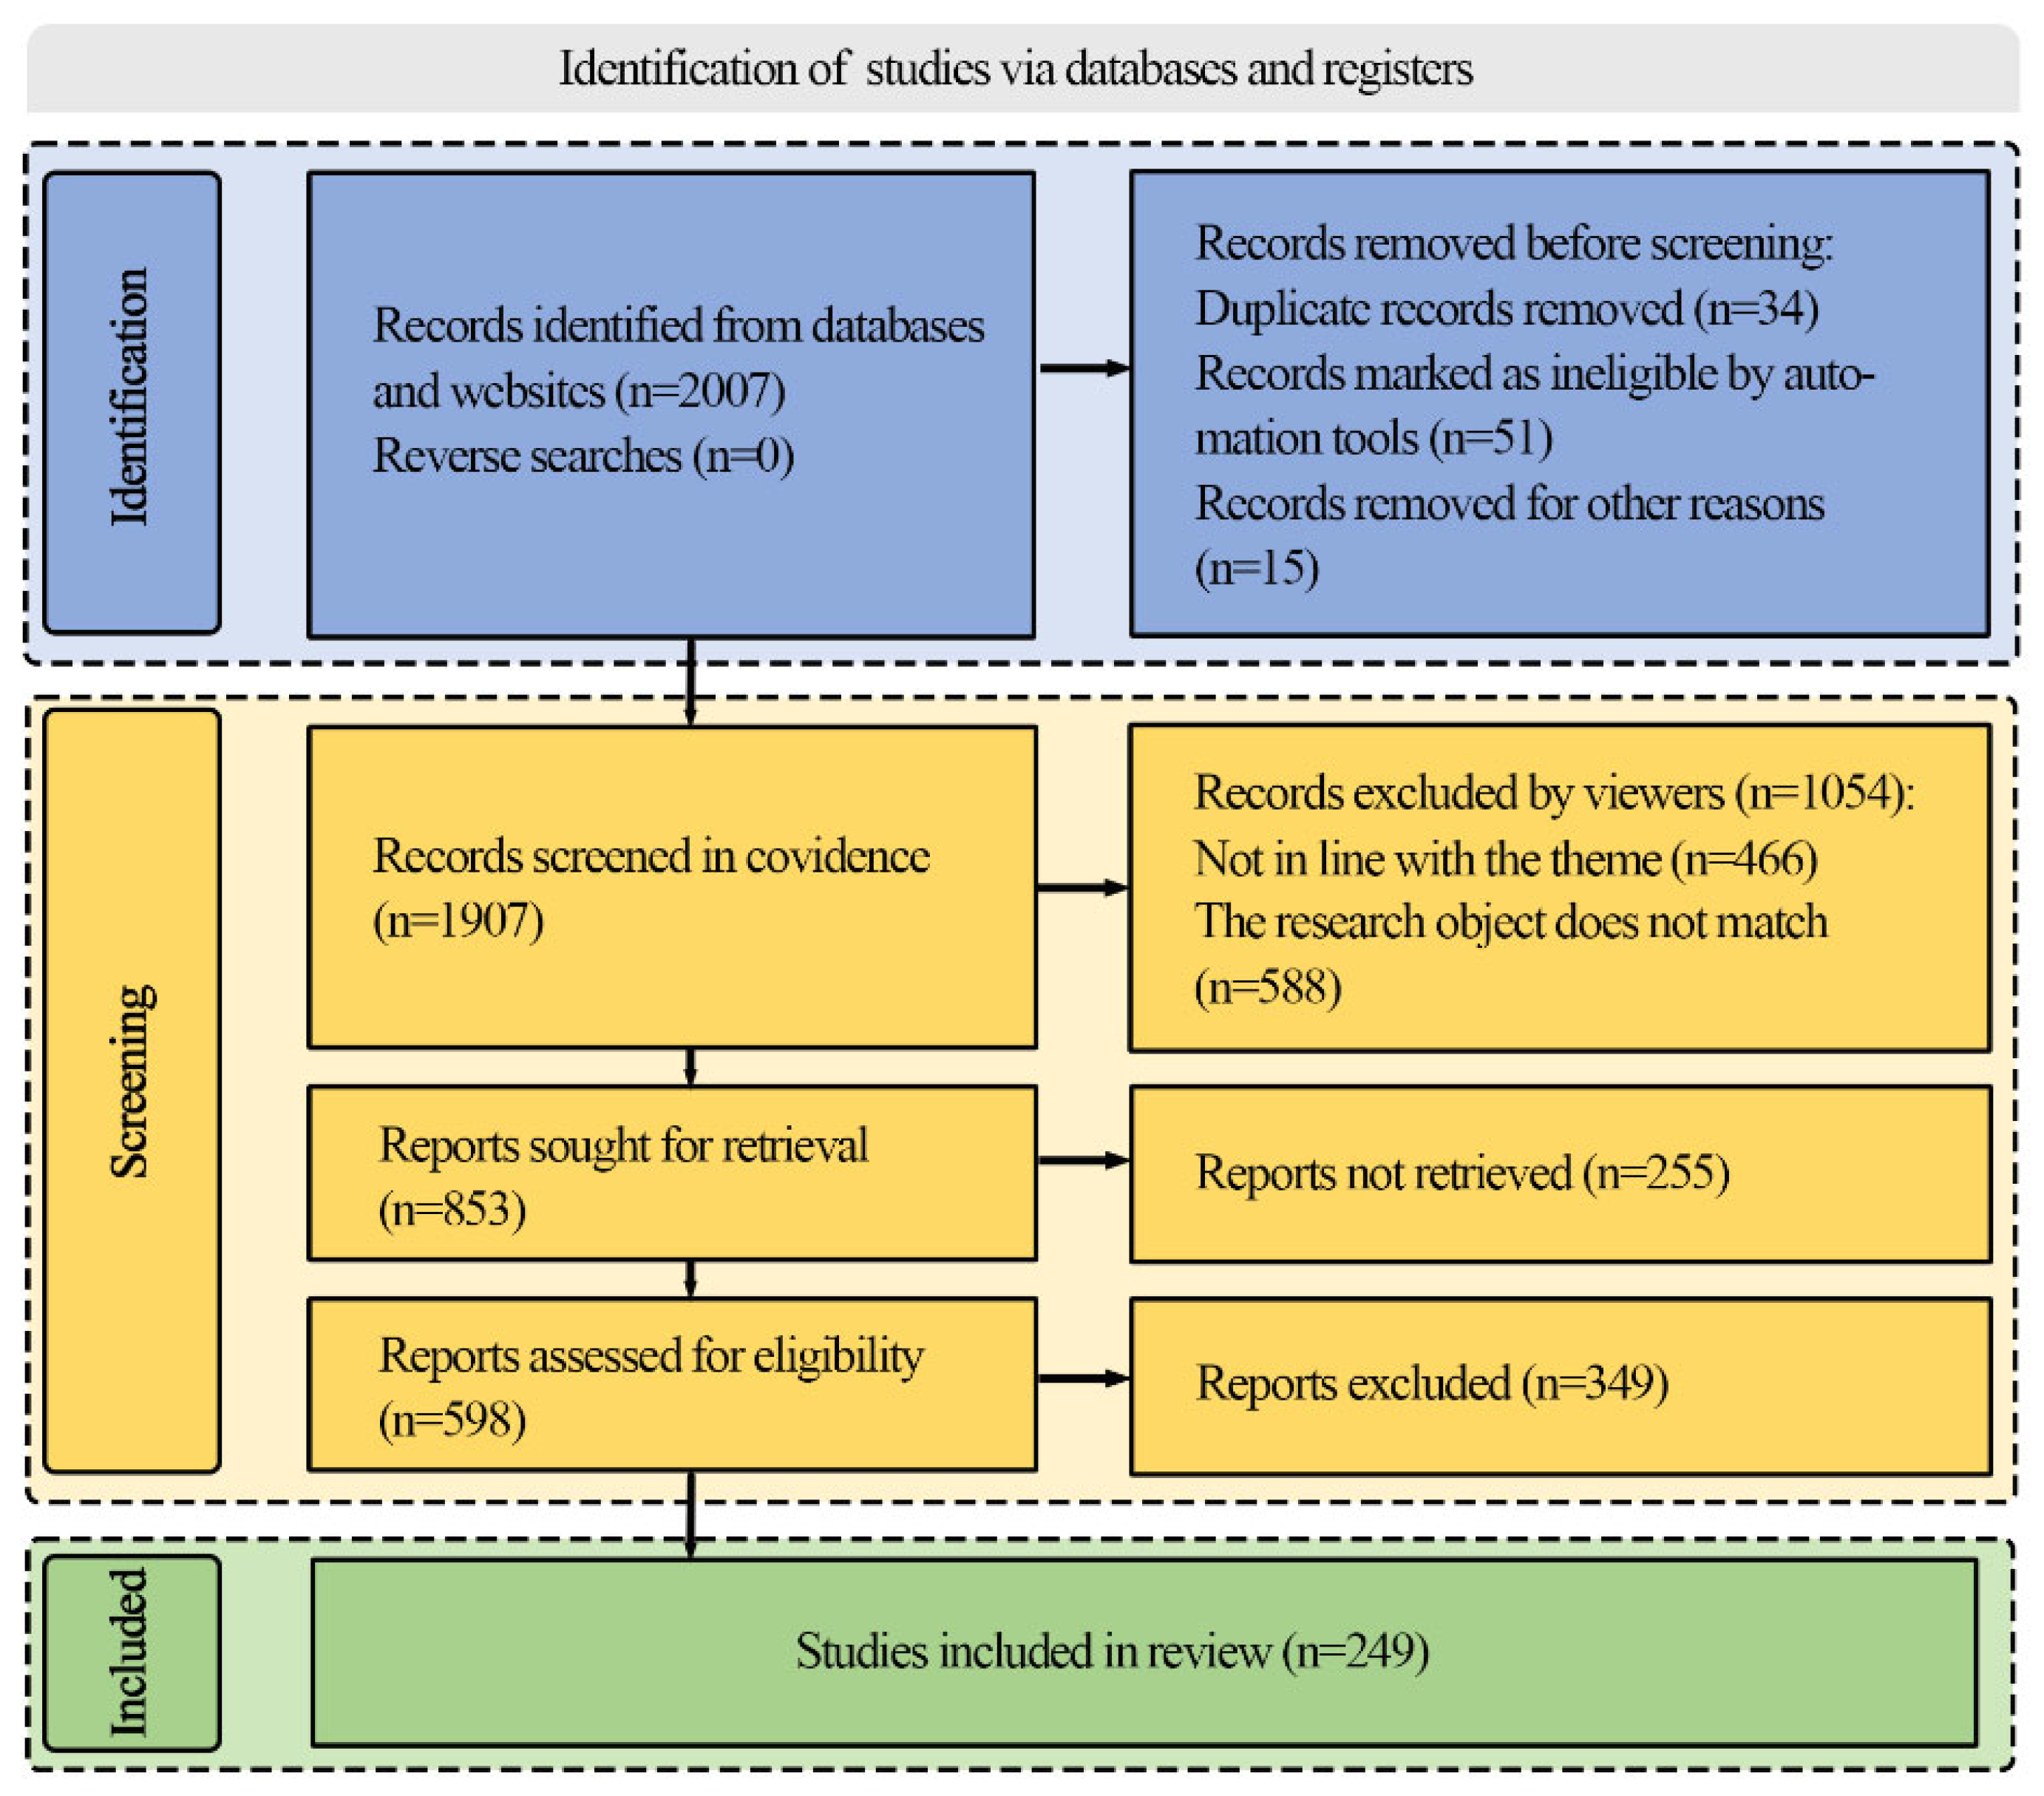
2.1.1. Data Collection
2.1.2. Bibliometric Approach
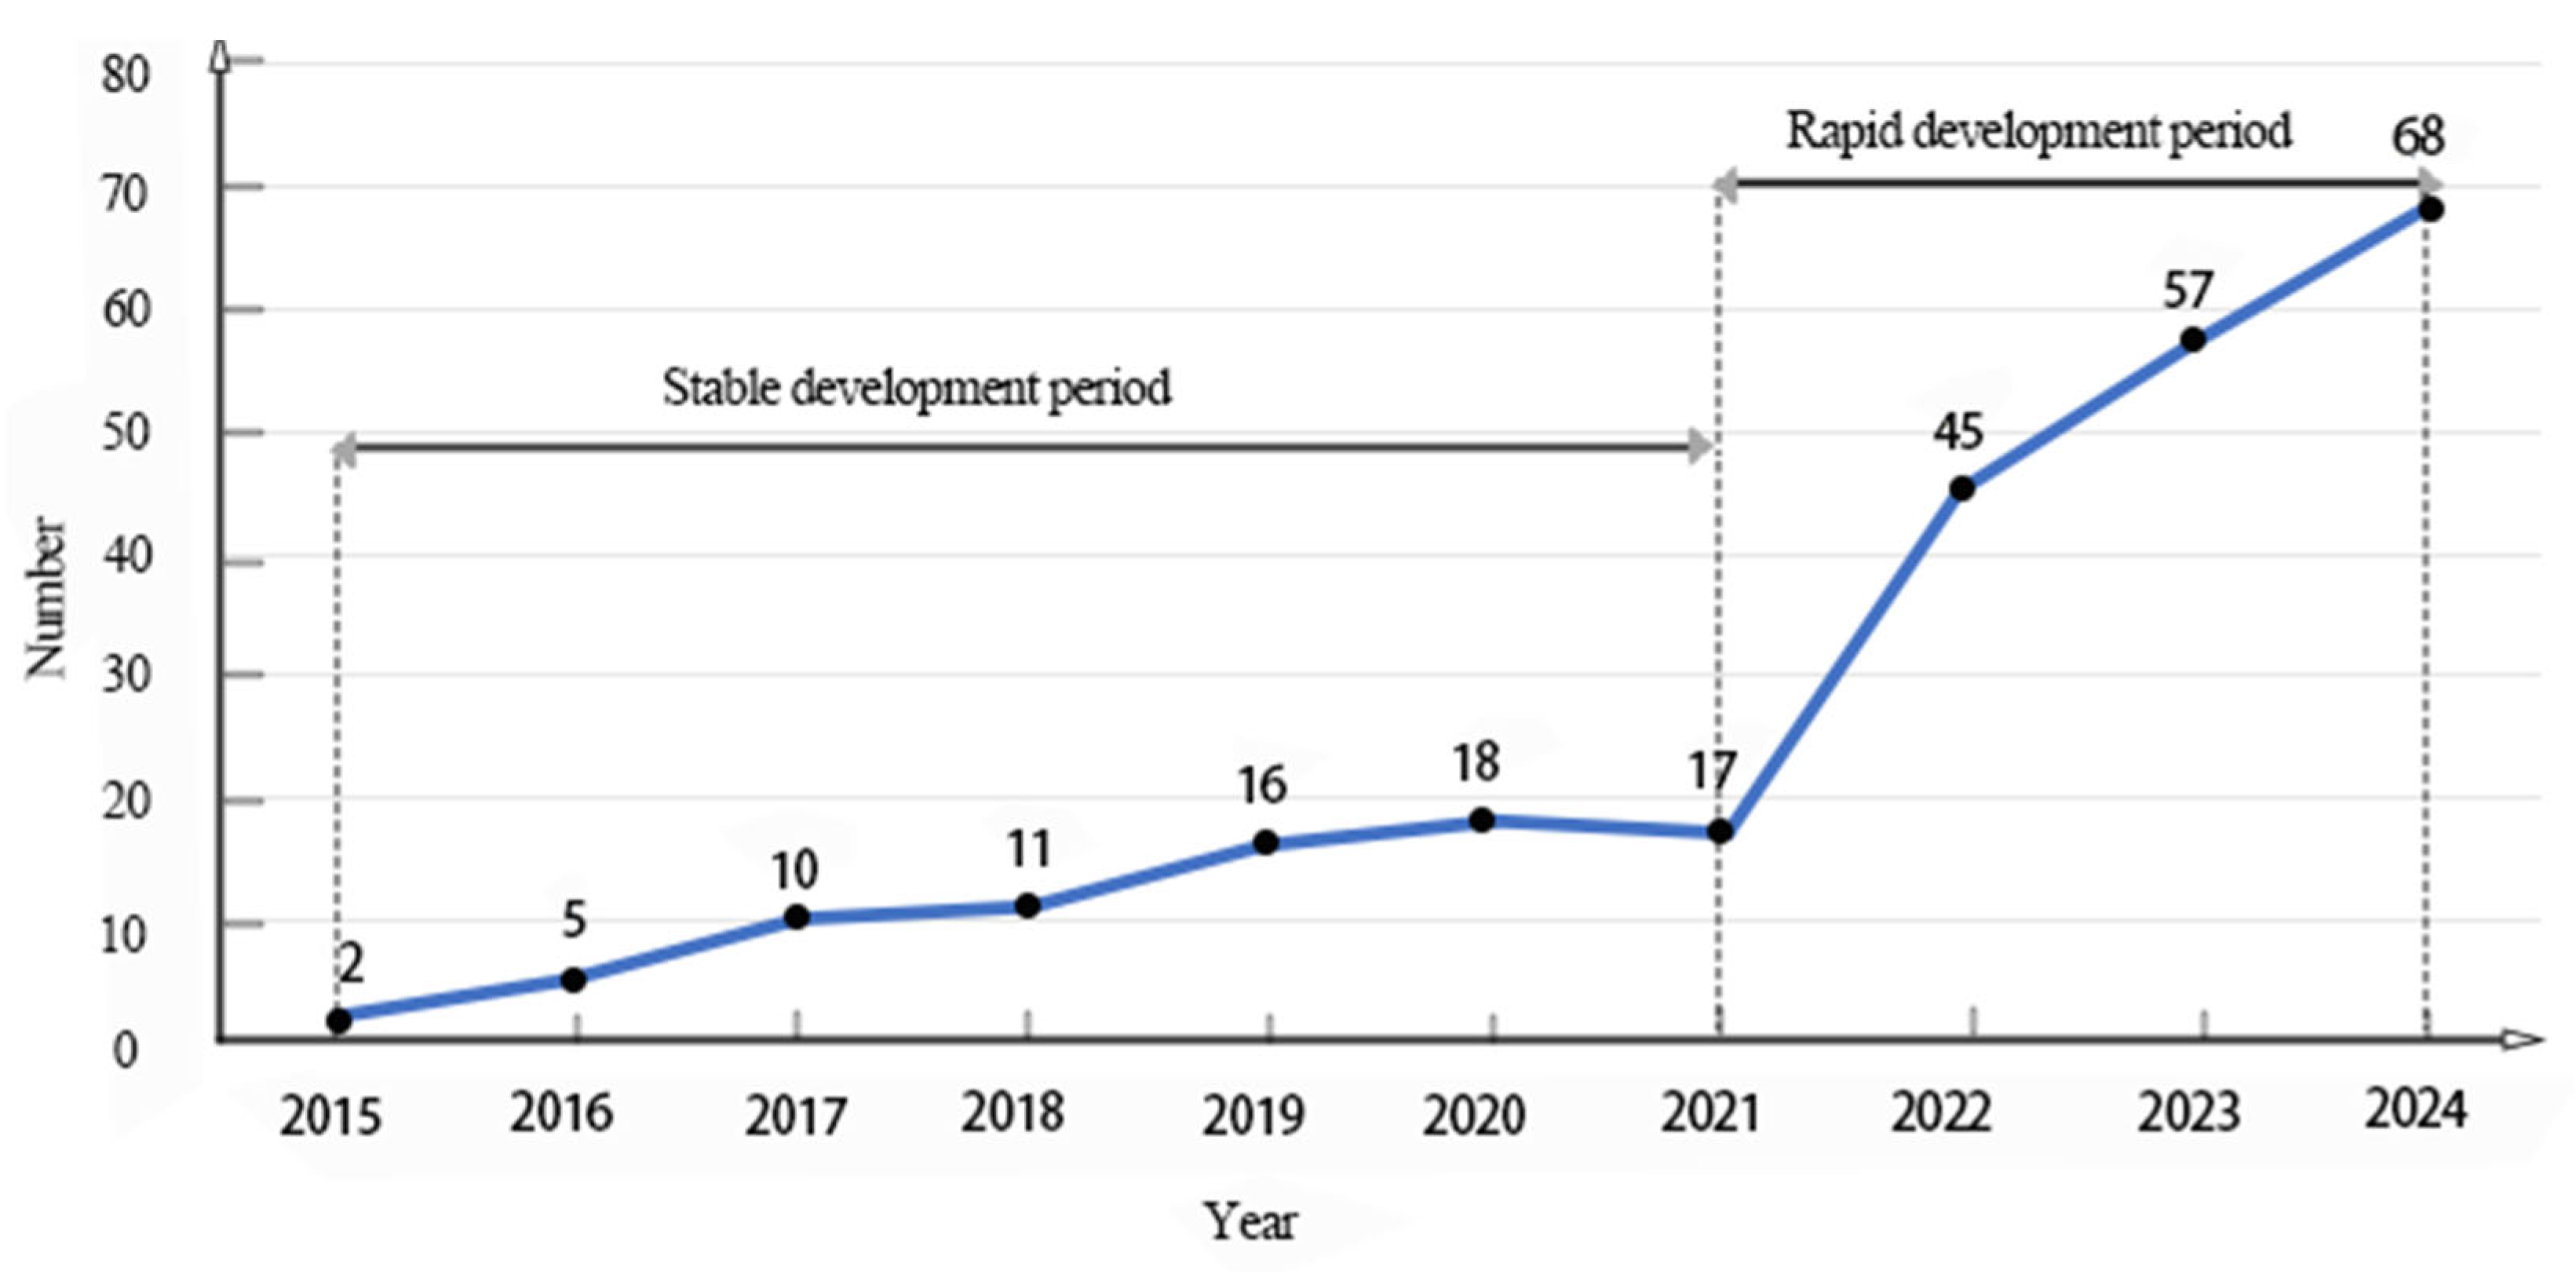
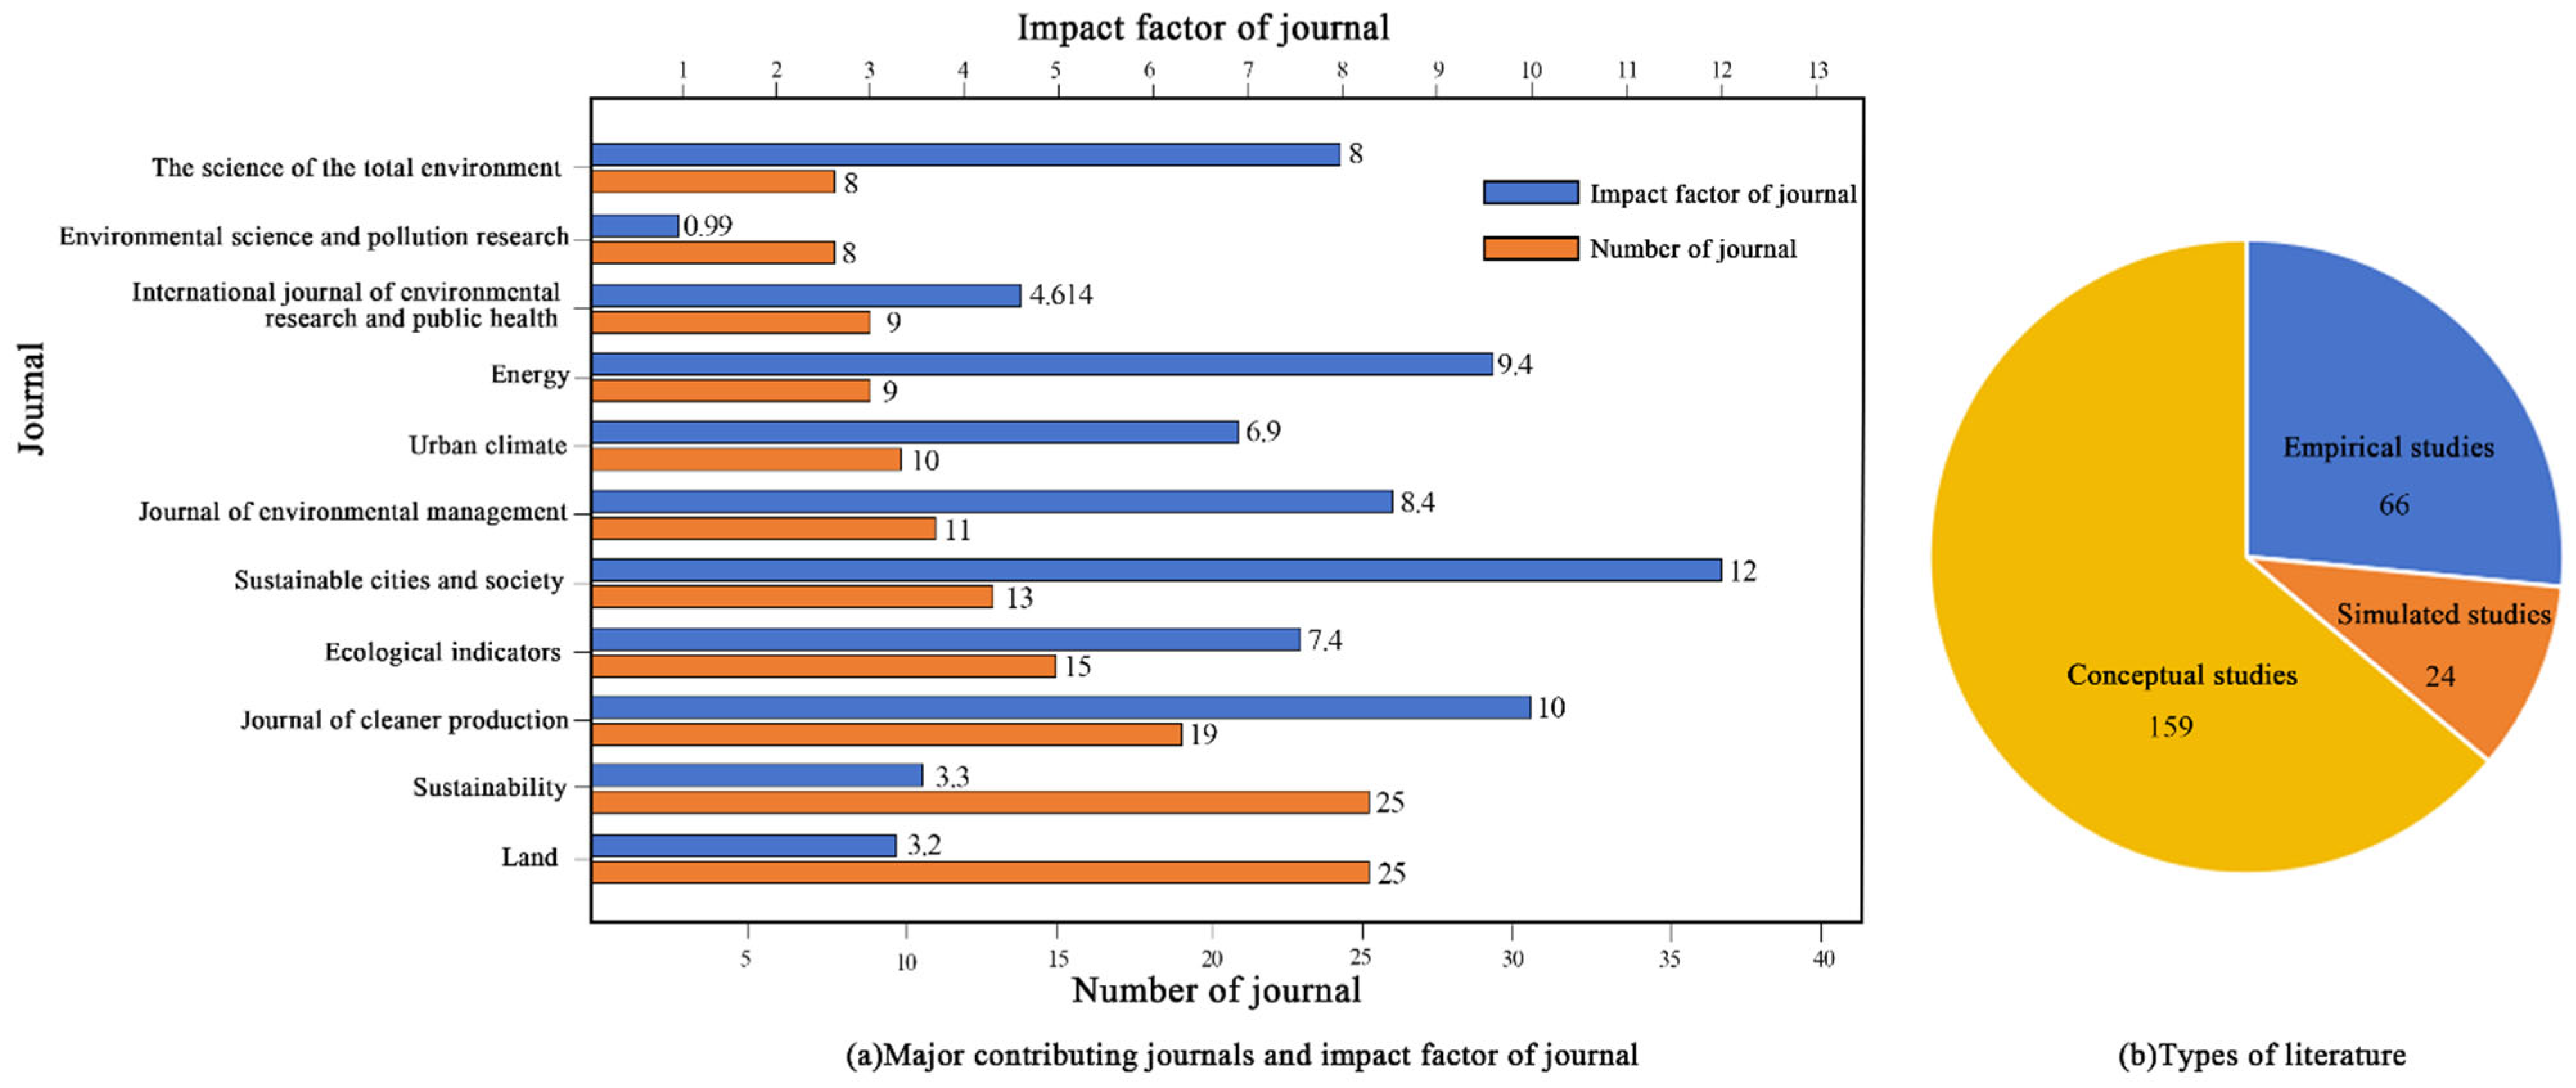
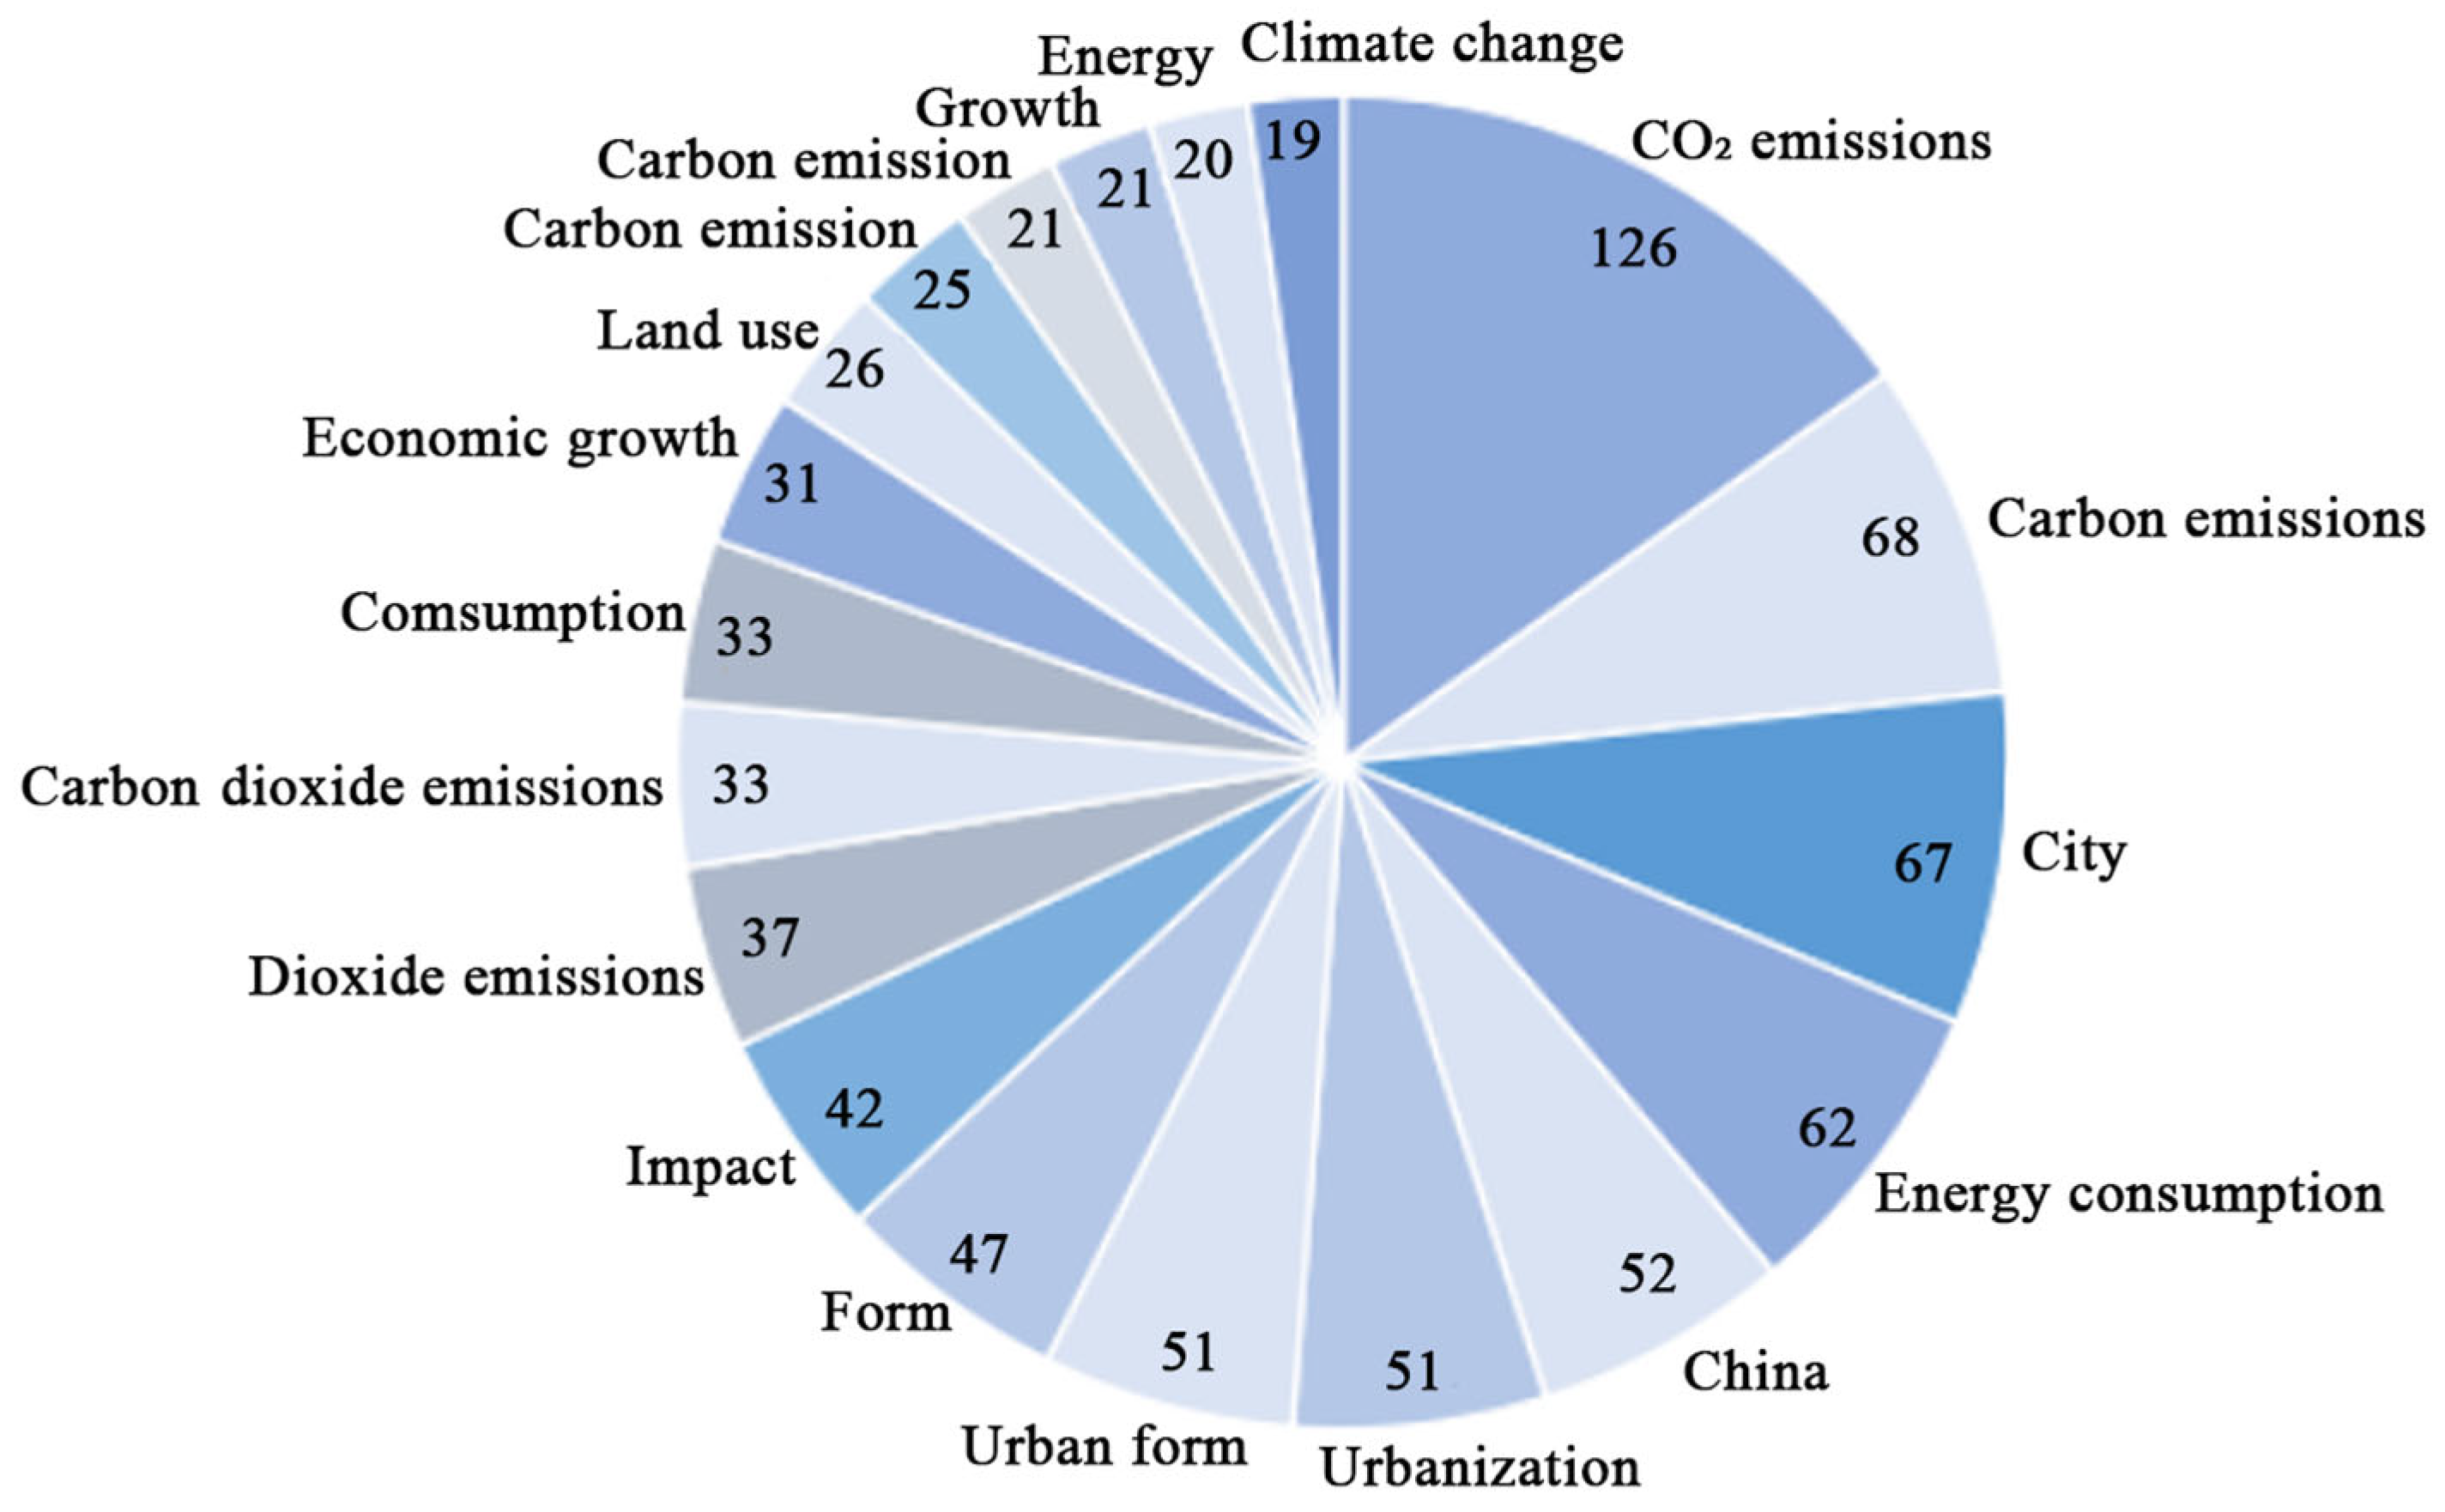
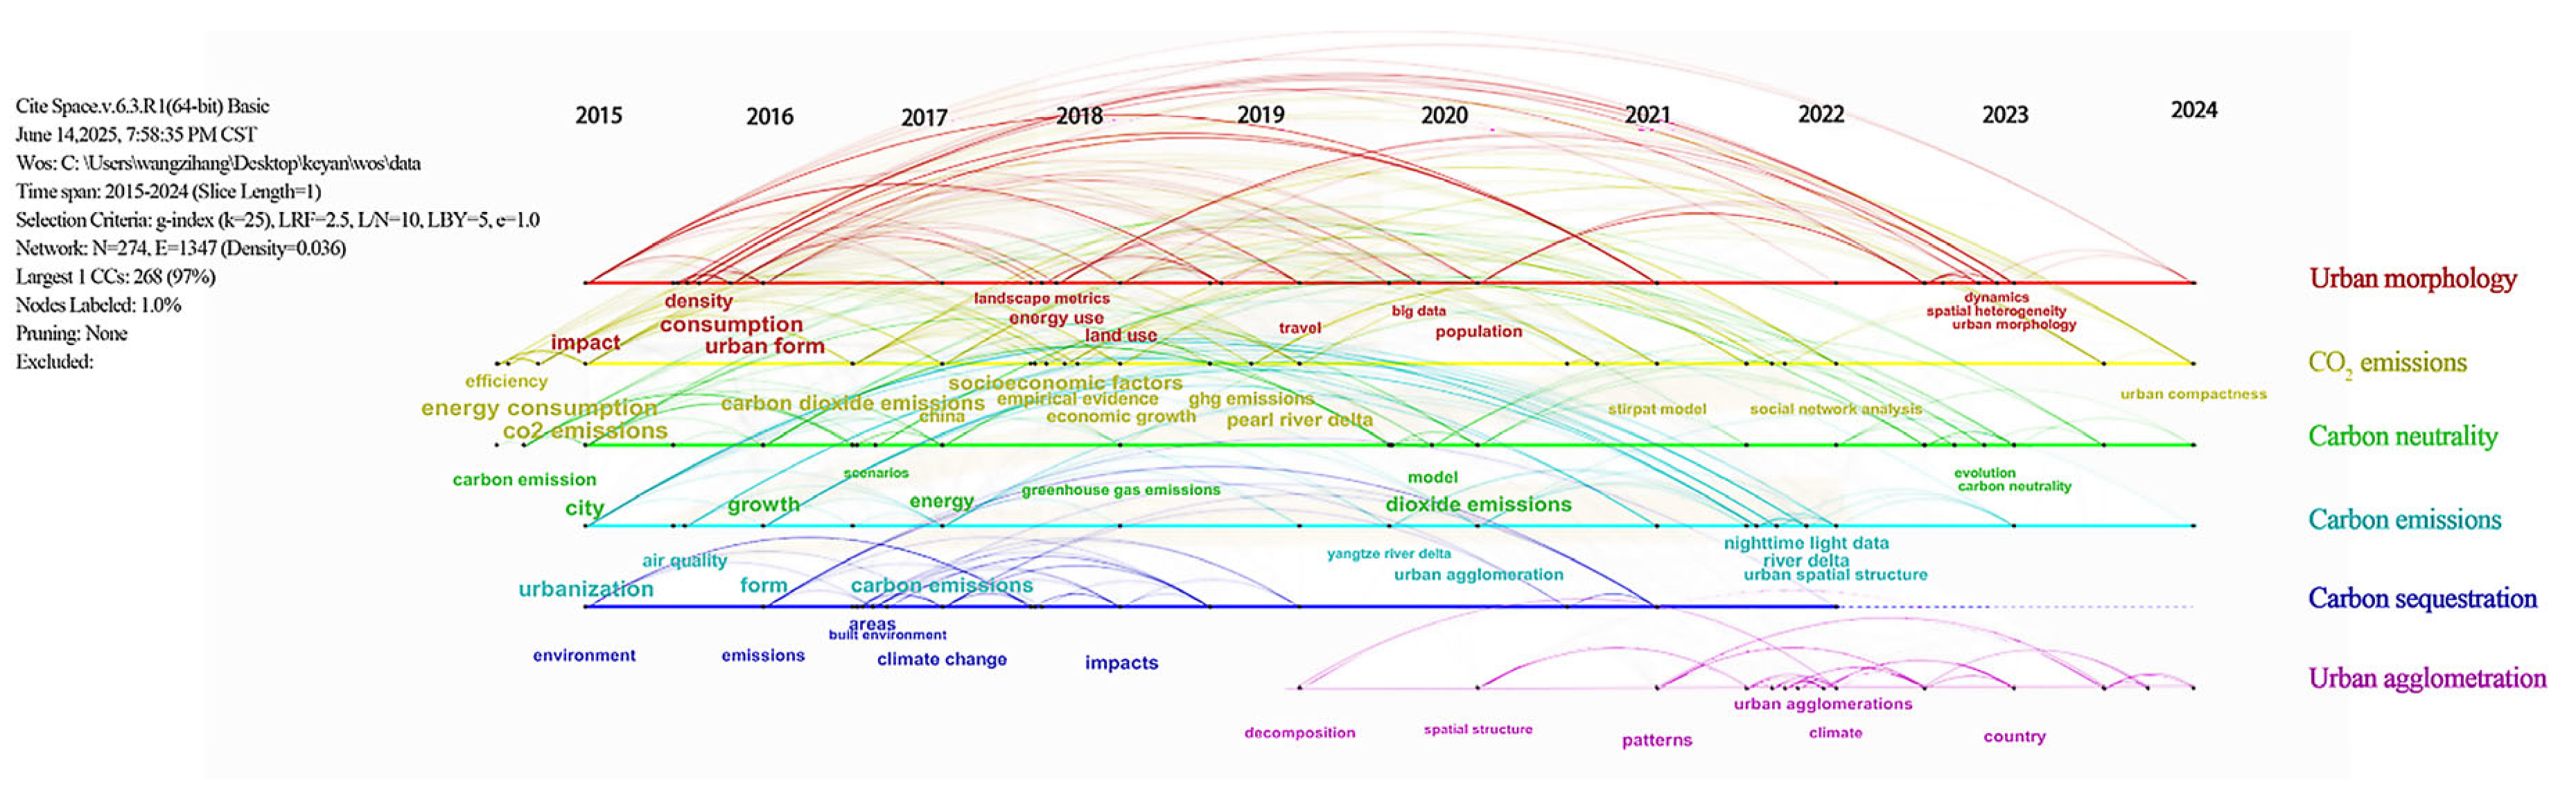
2.2. Bibliometric Results
3. Critical Research Parts of Building Operational Carbon Emissions
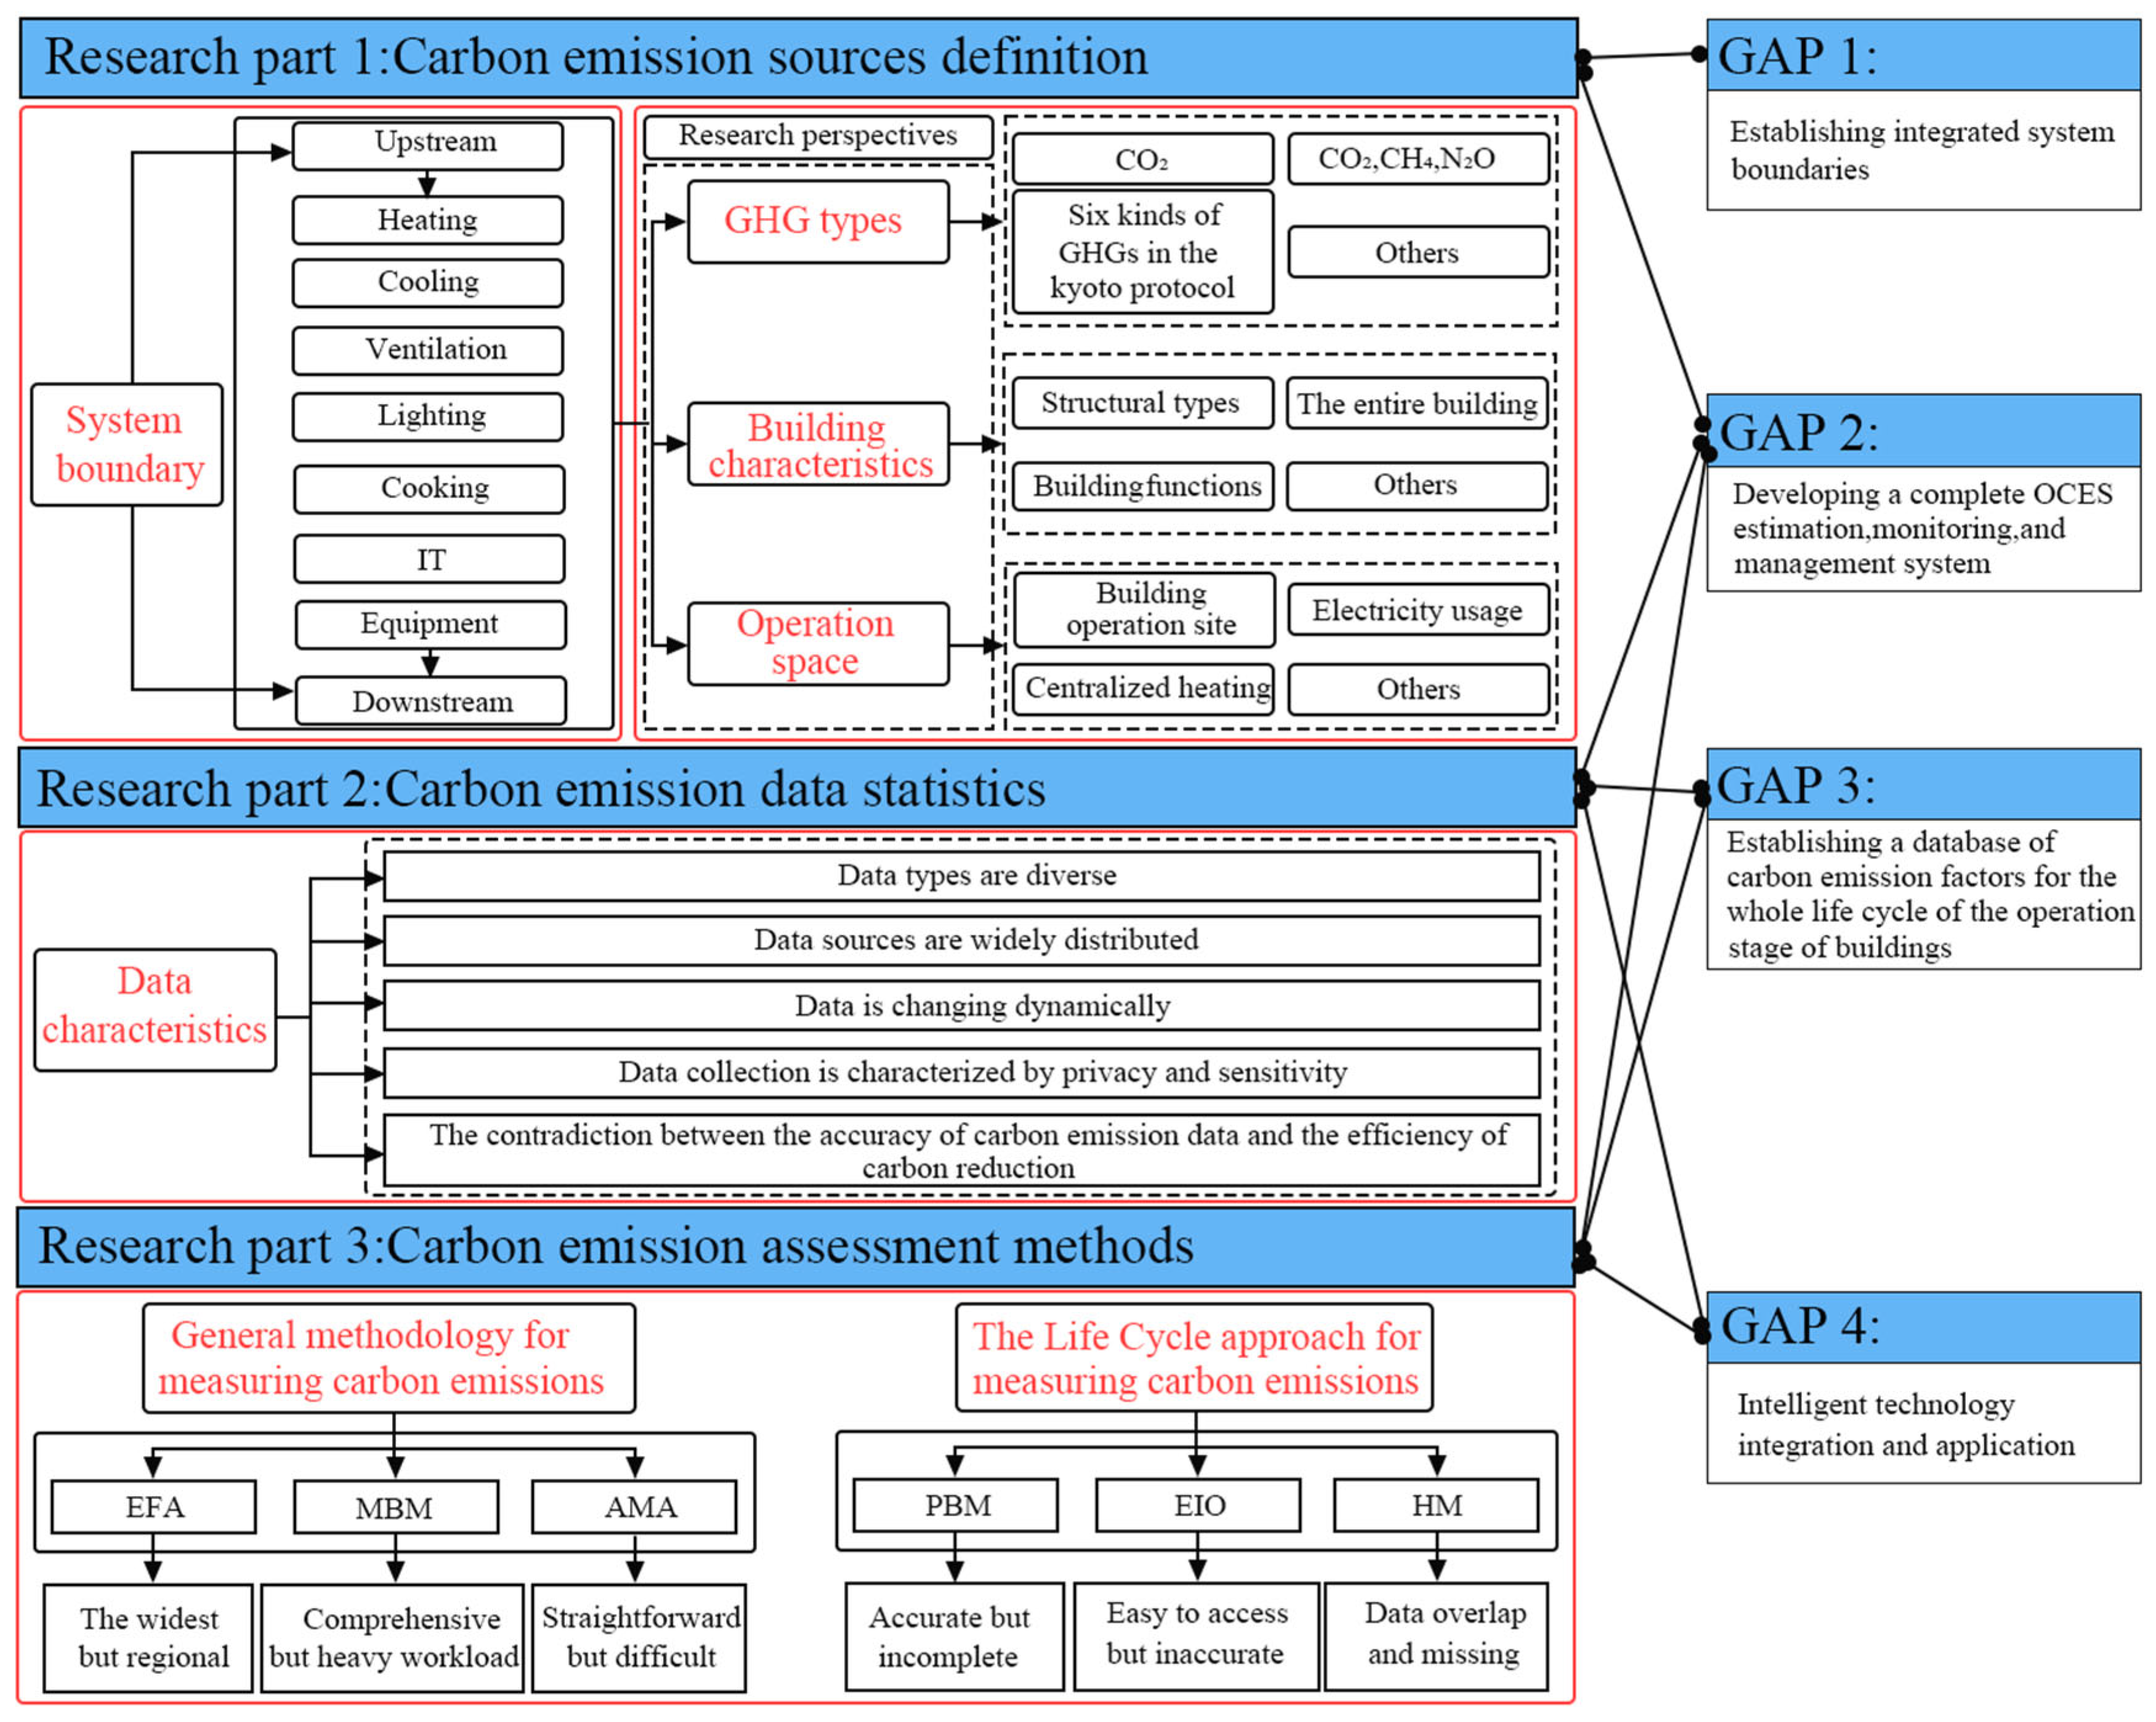
3.1. The Definition of Carbon Sources
3.2. Data Characteristics
3.3. Assessment Methods
3.3.1. General Methodology for Measuring Carbon Emissions
3.3.2. The Life Cycle Approach for Measuring Carbon Emissions
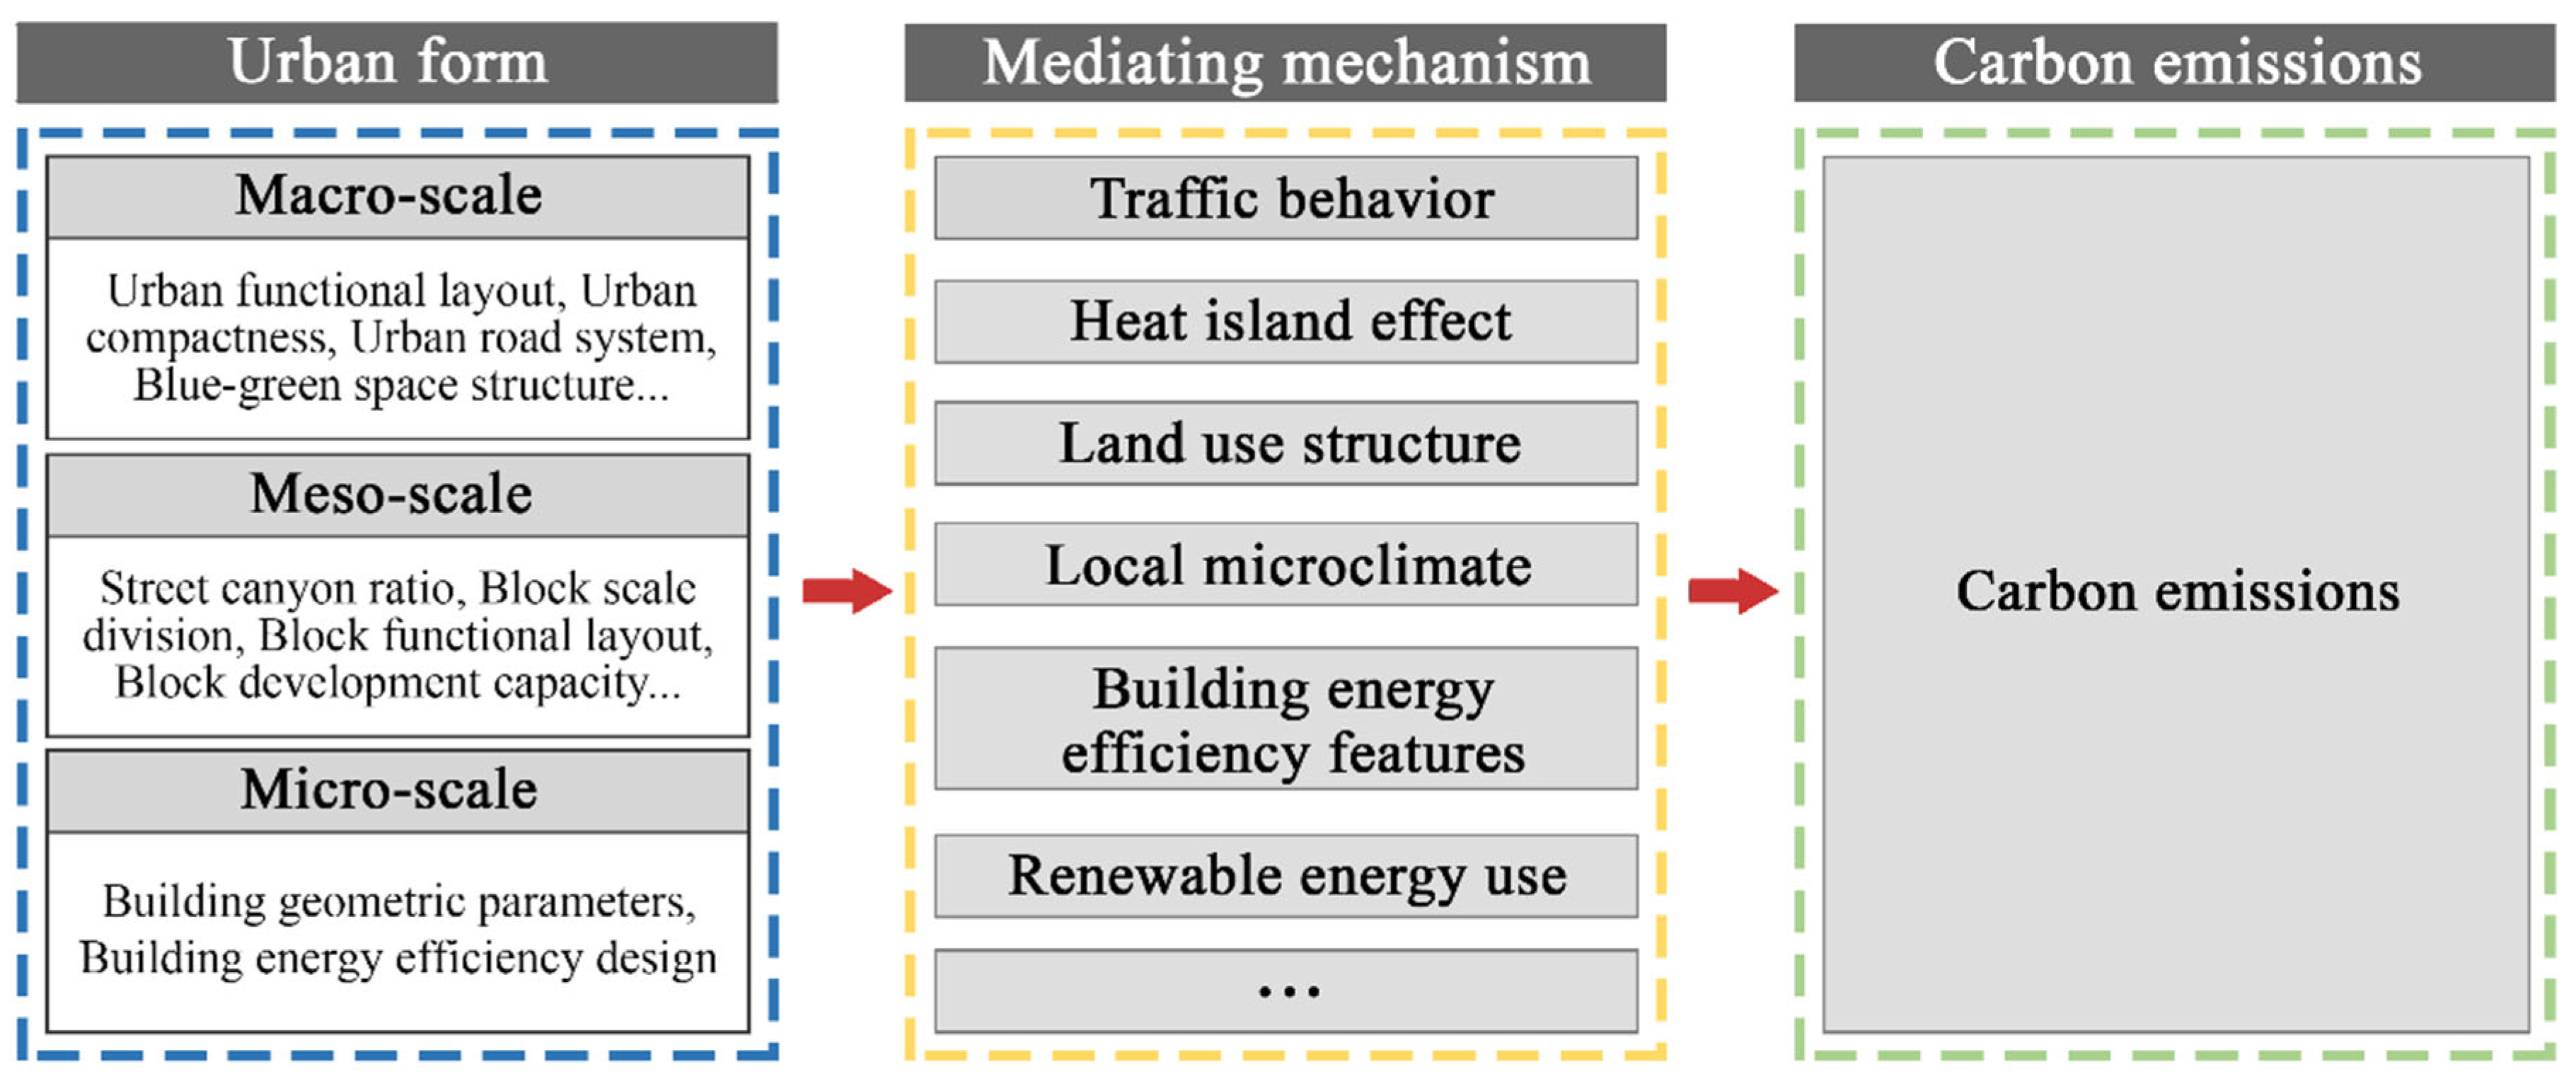
4. The Relationship Between Urban Form and Building Carbon Emissions
4.1. Research Methods
4.2. The Impact of Urban Form on Building Carbon Emissions and Design Implications
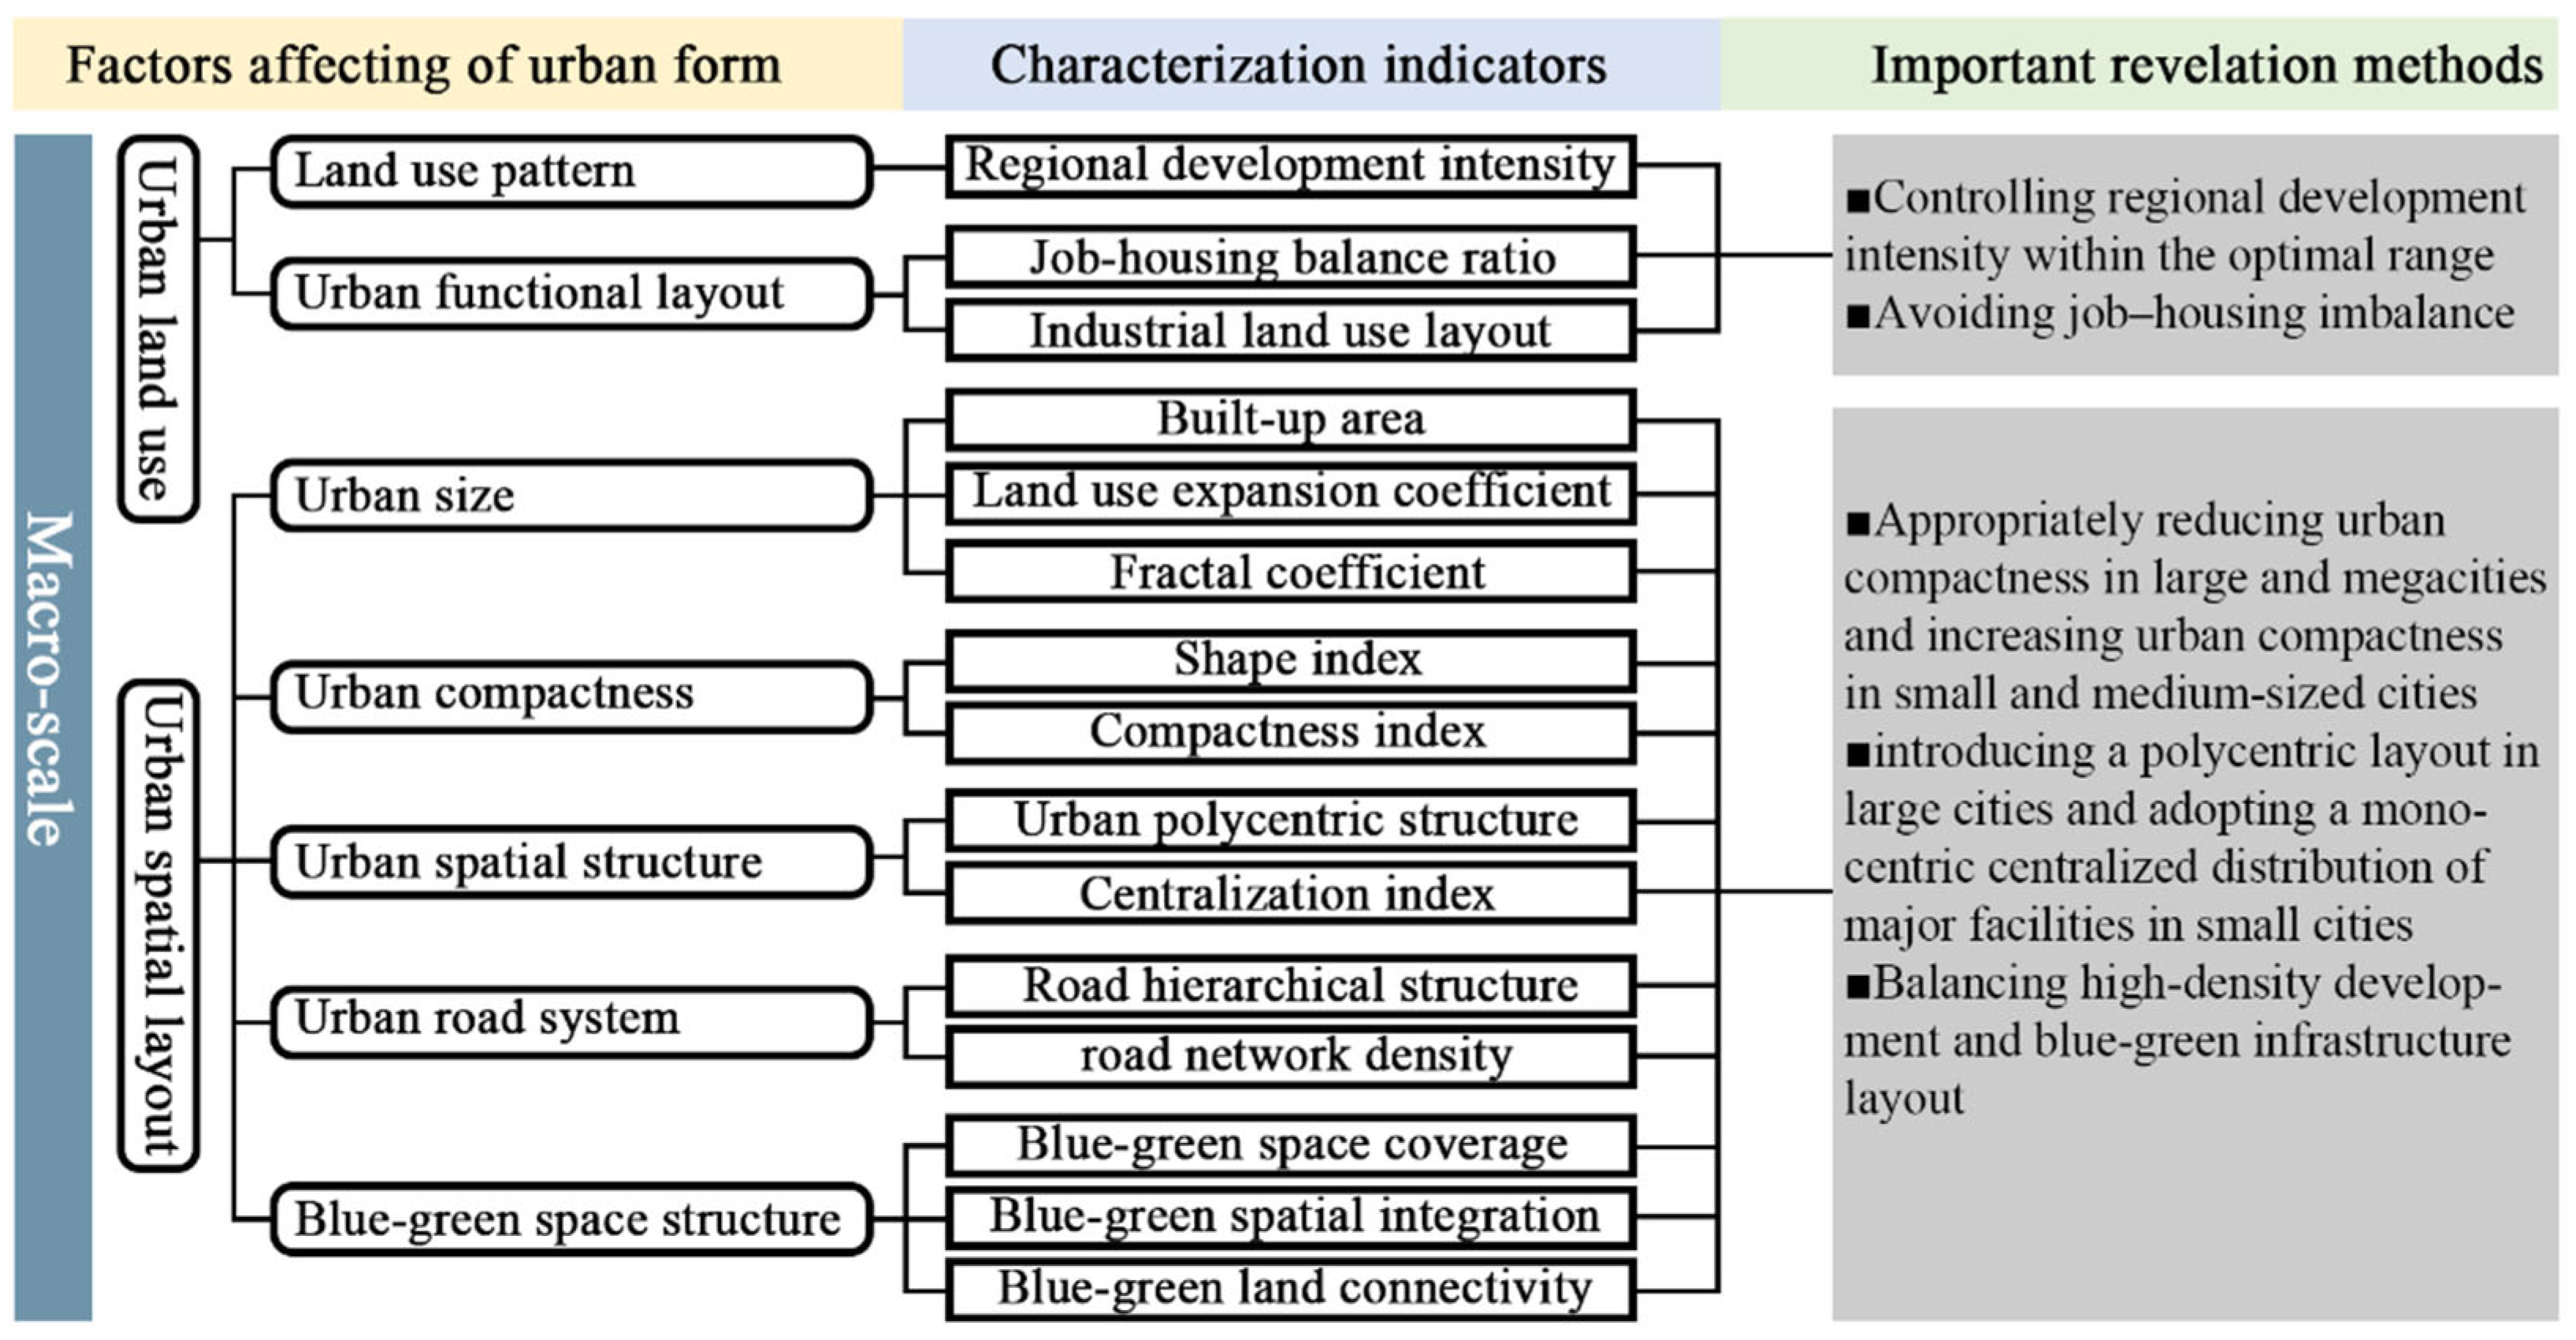
4.2.1. Macro Scale
4.2.2. Meso Scale
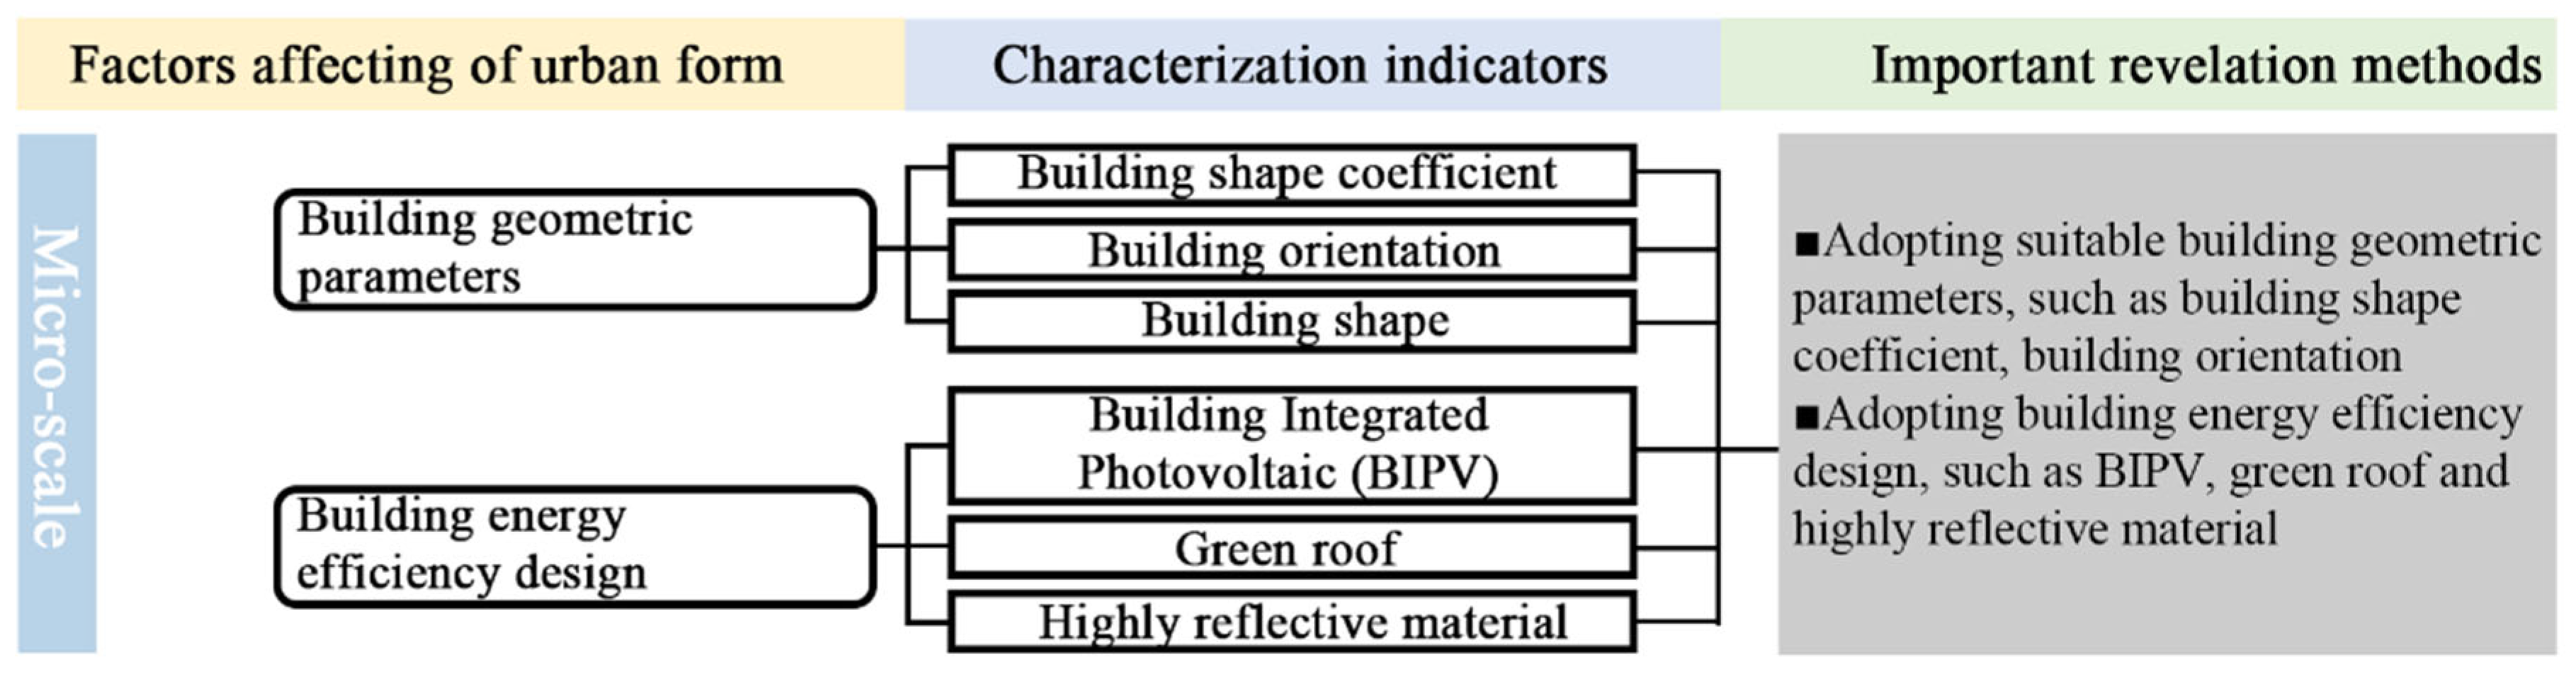
4.2.3. Micro Scale
5. Discussion
5.1. Theoretical Framework for Studying Urban Form and Building Carbon Emissions
5.2. The Impact Mechanism of Urban Form on Building Carbon Emissions
5.3. Policy Impact
5.4. Future Studies
6. Conclusions
- (1)
- The emission factor method is currently the most widely used carbon emission accounting method. It simplifies the calculation of direct carbon emissions from urban energy use and has a relatively mature carbon emission database.
- (2)
- At the meso scale, the block development capacity index is an important factor affecting the carbon emissions of the mesoscale blocks and is also affected by the urban climate background. In hot summer and cold winter areas, the floor area ratio and building density jointly play a nonlinear role in enhancing carbon emissions, while in cold areas, a larger floor area ratio and building density can reduce residents’ demand for heating.
- (3)
- At the meso scale, the block development capacity index, as an important factor affecting meso-block carbon emissions, is affected by both the climate background and building functions. In hot summer and cold winter regions, carbon emissions from office blocks are positively correlated with the floor area ratio, while in extremely cold regions, the relationship between carbon emissions from commercial buildings and the floor area ratio is U-shaped. For hot regions, a high building density will increase building cooling carbon emissions, while for cold regions, a high building density will reduce building heating carbon emissions.
- (4)
- At the micro scale, the characteristics of the building unit directly determine the heat exchange between the building and the external environment, as well as the indoor light and heat conditions, which have significant impacts on the building’s own carbon emission levels. Building orientation and window-to-wall ratio affect solar heat gain and ventilation and thus affect carbon emissions. Buildings integrating renewable energy, rooftop greening, and highly reflective materials are important ways to reduce building carbon emissions.
- (5)
- Urban form can indirectly affect carbon emission levels through intermediary factors. At the macro scale, policies and management affect residents’ behavior, thereby affecting carbon emissions. At the meso scale, urban form indicators often affect urban carbon emissions by changing the microclimate of the block.
Supplementary Materials
Author Contributions
Funding
Data Availability Statement
Conflicts of Interest
References
- Ye, H.; Yan, H.; Zhang, R. Mechanisms Underlying Operational Energy Consumption of Buildings for Low Carbon City Construction—A Review. Chin. J. Appl. Ecol. 2021, 32, 2644–2652. [Google Scholar] [CrossRef]
- O’Neill, B.C.; Oppenheimer, M. Dangerous Climate Impacts and the Kyoto Protocol. Science 2002, 296, 1971–1972. [Google Scholar] [CrossRef] [PubMed]
- Qin, H.; Huang, Q.; Zhang, Z.; Lu, Y.; Li, M.; Xu, L.; Chen, Z. Carbon Dioxide Emission Driving Factors Analysis and Policy Implications of Chinese Cities: Combining Geographically Weighted Regression with Two-Step Cluster. Sci. Total Environ. 2019, 684, 413–424. [Google Scholar] [CrossRef] [PubMed]
- Wu, P.; Wang, J. A Review of the Research on the Relationship between Urban Form and Climate Change Response. In Proceedings of the China Urban Planning Annual Conference 2024, Hefei, China, 7–9 September 2024. [Google Scholar]
- Ritchie, H.; Samborska, V.; Roser, M. Urbanization. Available online: https://ourworldindata.org/urbanization (accessed on 5 June 2025).
- Madlener, R.; Sunak, Y. Impacts of Urbanization on Urban Structures and Energy Demand: What Can We Learn for Urban Energy Planning and Urbanization Management? Sustain. Cities Soc. 2011, 1, 45–53. [Google Scholar] [CrossRef]
- Liu, Y.; Li, J.; Ma, Y.; You, Z. A Review of Research on Life Cycle Carbon Emissions and Costs of Buildings. Energy Conserv. 2024, 43, 122–125. [Google Scholar] [CrossRef]
- Shi, F. Research on the Impact of Urban Form on Carbon Emissions from the Perspective of Sustainable Development—Empirical Analysis Based on 256 Cities in China. Master’s Thesis, Chongqing University, Chongqing, China, 2022. [Google Scholar]
- Yang, L.; Li, G.; Lin, Y.; Ye, L. Progress and Prospect on Relationship Research between Urban Form and Carbon Emission. Urban Stud. 2011, 18, 12–17. [Google Scholar]
- Pacala, S.; Socolow, R. Stabilization Wedges: Solving the Climate Problem for the Next 50 Years with Current Technologies. Science 2004, 305, 968–972. [Google Scholar] [CrossRef] [PubMed]
- Zheng, X.; Lin, L. A review of studies on the urban morphology since 1990s. City Plan. Rev. 2002, 7, 59–64. [Google Scholar]
- Liu, K. A Review of the Research on the Relationship between Urban Form and Building Energy Consumption in the Past 30 Years. Archit. J. 2023, S1, 120–127. [Google Scholar]
- Lynch, K. Image of the City; MIT Press: Cambridge, MA, USA, 1960. [Google Scholar]
- Hillier, B.; Hanson, J. The Social Logic of Space; Cambridge University Press: Cambridge, UK, 1984. [Google Scholar]
- Batty, M. Cities and Complexity: Understanding Cities with Cellular Automata, Agent-Based Models, and Fractals; The MIT Press: Boston, MA, USA, 2007. [Google Scholar]
- O’Toole, R. The Myth of the Compact City: Why Compact Development Is Not the Way to Reduce Carbon Dioxide Emissions. SSRN J. 2009, 653. [Google Scholar] [CrossRef]
- Silva, M.; Oliveira, V.; Leal, V. Urban Form and Energy Demand: A Review of Energy-Relevant Urban Attributes. J. Plan. Lit. 2017, 32, 346–365. [Google Scholar] [CrossRef]
- Caniggia, G.; Maffei, G.L. Architectural Composition and Building Typology: Interpreting Basic Building; Alinea: Firenze, Italy, 2001. [Google Scholar]
- Leng, H.; Zhao, Y.; Yuan, Q. The Path toward Carbon Reduction through Urban Form Control. J. Urban Plan. 2023, 1, 54–61. [Google Scholar] [CrossRef]
- Ding, G.; Guo, J.; Pueppke, S.G.; Yi, J.; Ou, M.; Ou, W.; Tao, Y. The Influence of Urban Form Compactness on CO2 Emissions and Its Threshold Effect: Evidence from Cities in China. J. Environ. Manag. 2022, 322, 116032. [Google Scholar] [CrossRef] [PubMed]
- Nice, K.A.; Nazarian, N.; Lipson, M.J.; Hart, M.A.; Seneviratne, S.; Thompson, J.; Naserikia, M.; Godic, B.; Stevenson, M. Isolating the Impacts of Urban Form and Fabric from Geography on Urban Heat and Human Thermal Comfort. Build. Environ. 2022, 224, 109502. [Google Scholar] [CrossRef]
- Taleghani, M.; Kleerekoper, L.; Tenpierik, M.; Van Den Dobbelsteen, A. Outdoor Thermal Comfort within Five Different Urban Forms in the Netherlands. Build. Environ. 2015, 83, 65–78. [Google Scholar] [CrossRef]
- Bansal, P.; Quan, S.J. Relationships between Building Characteristics, Urban Form and Building Energy Use in Different Local Climate Zone Contexts: An Empirical Study in Seoul. Energy Build. 2022, 272, 112335. [Google Scholar] [CrossRef]
- Ampatzidis, P.; Kershaw, T. A Review of the Impact of Blue Space on the Urban Microclimate. Sci. Total Environ. 2020, 730, 139068. [Google Scholar] [CrossRef] [PubMed]
- Skelhorn, C.P.; Levermore, G.; Lindley, S.J. Impacts on Cooling Energy Consumption Due to the UHI and Vegetation Changes in Manchester, UK. Energy Build. 2016, 122, 150–159. [Google Scholar] [CrossRef]
- Aboelata, A. Assessment of Green Roof Benefits on Buildings’ Energy-Saving by Cooling Outdoor Spaces in Different Urban Densities in Arid Cities. Energy 2021, 219, 119514. [Google Scholar] [CrossRef]
- Jacobs, C.; Klok, L.; Bruse, M.; Cortesão, J.; Lenzholzer, S.; Kluck, J. Are Urban Water Bodies Really Cooling? Urban Clim. 2020, 32, 100607. [Google Scholar] [CrossRef]
- Parker, J.H. Landscaping to Reduce the Energy Used in Cooling Buildings. J. For. 1983, 81, 82–105. [Google Scholar] [CrossRef]
- Bevilacqua, P. The Effectiveness of Green Roofs in Reducing Building Energy Consumptions across Different Climates. A Summary of Literature Results. Renew. Sustain. Energy Rev. 2021, 151, 111523. [Google Scholar] [CrossRef]
- Mayr, P.; Scharnhorst, A. Scientometrics and Information Retrieval: Weak-Links Revitalized. Scientometrics 2015, 102, 2193–2199. [Google Scholar] [CrossRef]
- Zhang, Y.; Yan, D.; Hu, S.; Guo, S. Modelling of Energy Consumption and Carbon Emission from the Building Construction Sector in China, a Process-Based LCA Approach. Energy Policy 2019, 134, 110949. [Google Scholar] [CrossRef]
- Heinonen, J.; Säynäjoki, A.; Junnonen, J.-M.; Pöyry, A.; Junnila, S. Pre-Use Phase LCA of a Multi-Story Residential Building: Can Greenhouse Gas Emissions Be Used as a More General Environmental Performance Indicator? Build. Environ. 2016, 95, 116–125. [Google Scholar] [CrossRef]
- Wang, Y.; Jiang, Z.; Li, L.; Qi, Y.; Sun, J.; Jiang, Z. A Bibliometric and Content Review of Carbon Emission Analysis for Building Construction. Buildings 2023, 13, 205. [Google Scholar] [CrossRef]
- Abd Rashid, A.F.; Yusoff, S. A Review of Life Cycle Assessment Method for Building Industry. Renew. Sustain. Energy Rev. 2015, 45, 244–248. [Google Scholar] [CrossRef]
- Liang, Y.; Li, C.; Liu, Z.; Wang, X.; Zeng, F.; Yuan, X.; Pan, Y. Decarbonization Potentials of the Embodied Energy Use and Operational Process in Buildings: A Review from the Life-Cycle Perspective. Heliyon 2023, 9, e20190. [Google Scholar] [CrossRef] [PubMed]
- Landry, E. GHG Emissions Real Estate Guidance 1.0; GRESB: Amsterdam, The Netherland, 2023; p. 18. [Google Scholar]
- Dixit, M.K.; Culp, C.H.; Fernández-Solís, J.L. System Boundary for Embodied Energy in Buildings: A Conceptual Model for Definition. Renew. Sustain. Energy Rev. 2013, 21, 153–164. [Google Scholar] [CrossRef]
- Zhao, Y.; Liu, L.; Yu, M. Comparison and Analysis of Carbon Emissions of Traditional, Prefabricated, and Green Material Buildings in Materialization Stage. J. Clean. Prod. 2023, 406, 137152. [Google Scholar] [CrossRef]
- 2024 U.S. Energy & Employment Jobs Report (USEER). Available online: https://www.energy.gov/policy/us-energy-employment-jobs-report-useer (accessed on 19 May 2025).
- Macknick, J. Energy and CO2 Emission Data Uncertainties. Carbon Manag. 2011, 2, 189–205. [Google Scholar] [CrossRef]
- Yu, Y.; You, K.; Cai, W.; Feng, W.; Li, R.; Liu, Q.; Chen, L.; Liu, Y. City-Level Building Operation and End-Use Carbon Emissions Dataset from China for 2015–2020. Sci. Data 2024, 11, 138. [Google Scholar] [CrossRef] [PubMed]
- Homes Show Greatest Seasonal Variation in Electricity Use—U.S. Energy Information Administration (EIA). Available online: https://www.eia.gov/todayinenergy/detail.php?id=10211 (accessed on 13 April 2025).
- Greer, F.; Raftery, P.; Horvath, A. Considerations for Estimating Operational Greenhouse Gas Emissions in Whole Building Life-Cycle Assessments. Build. Environ. 2024, 254, 111383. [Google Scholar] [CrossRef]
- Koehrsen, W. Building Energy Data Analysis Part Two. 2018. Available online: https://williamkoehrsen.medium.com/building-energy-data-analysis-part-two-7861b0c6a2d6 (accessed on 14 April 2025).
- Bakar, A.A.; Yussof, S.; Ghapar, A.A.; Sameon, S.S.; Jørgensen, B.N. A Review of Privacy Concerns in Energy-Efficient Smart Buildings: Risks, Rights, and Regulations. Energies 2024, 17, 977. [Google Scholar] [CrossRef]
- Chen, Q.; Cai, B.; Dhakal, S.; Pei, S.; Liu, C.; Shi, X.; Hu, F. CO2 Emission Data for Chinese Cities. Resour. Conserv. Recycl. 2017, 126, 198–208. [Google Scholar] [CrossRef]
- Yona, L.; Cashore, B.; Jackson, R.B.; Ometto, J.; Bradford, M.A. Refining National Greenhouse Gas Inventories. Ambio 2020, 49, 1581–1586. [Google Scholar] [CrossRef] [PubMed]
- Zhang, Y.; Peng, T.; Yuan, C.; Ping, Y. Assessment of Carbon Emissions at the Logistics and Transportation Stage of Prefabricated Buildings. Appl. Sci. 2022, 13, 552. [Google Scholar] [CrossRef]
- Yu, L.; Wang, Y.; Li, D. Calculating and Analyzing Carbon Emission Factors of Prefabricated Components. Sustainability 2023, 15, 8706. [Google Scholar] [CrossRef]
- Wang, Q.; Jia, X.; Zhao, Y.; Zhou, H.; Zhang, X.; Lin, B.; Zhang, C. A Building Operational Carbon Emissions Database of 362 Chinese Cities: Construction Process and Spatiotemporal Characteristic Analysis. Dev. Built Environ. 2024, 20, 100546. [Google Scholar] [CrossRef]
- Xiong, L.; Wang, M.; Mao, J.; Huang, B. A Review of Building Carbon Emission Accounting Methods under Low-Carbon Building Background. Buildings 2024, 14, 777. [Google Scholar] [CrossRef]
- Li, Y.; Li, S.; Xia, S.; Li, B.; Zhang, X.; Wang, B.; Ye, T.; Zheng, W. A Review on the Policy, Technology and Evaluation Method of Low-Carbon Buildings and Communities. Energies 2023, 16, 1773. [Google Scholar] [CrossRef]
- Peng, C. Calculation of a Building’s Life Cycle Carbon Emissions Based on Ecotect and Building Information Modeling. J. Clean. Prod. 2016, 112, 453–465. [Google Scholar] [CrossRef]
- Huang, H.; Cheng, F.; Su, Y.; Yao, L.; Hu, J. Energy-Saving Potential Analysis and Countermeasures for Carbon Peaking in China. Chin. J. Eng. Sci. 2021, 23, 81. [Google Scholar] [CrossRef]
- Xu, Z.; Cheng, G.; Qiu, G. ImPACTS Equation for Sustainability Evaluation. J. Geogr. 2005, 2, 198–208. [Google Scholar]
- Zhang, X.; Wang, F. Stochastic Analysis of Embodied Emissions of Building Construction: A Comparative Case Study in China. Energy Build. 2017, 151, 574–584. [Google Scholar] [CrossRef]
- Onat, N.C.; Kucukvar, M.; Tatari, O. Scope-Based Carbon Footprint Analysis of U.S. Residential and Commercial Buildings: An Input–Output Hybrid Life Cycle Assessment Approach. Build. Environ. 2014, 72, 53–62. [Google Scholar] [CrossRef]
- Liu, Z.; Xu, Z.; Zhu, X.; Yin, L.; Yin, Z.; Li, X.; Zheng, W. Calculation of Carbon Emissions in Wastewater Treatment and Its Neutralization Measures: A Review. Sci. Total Environ. 2024, 912, 169356. [Google Scholar] [CrossRef] [PubMed]
- Zhu, Y.; Hu, Y. The Correlation between Urban Form and Carbon Emissions: A Bibliometric and Literature Review. Sustainability 2023, 15, 13439. [Google Scholar] [CrossRef]
- Rostas, L.; Leontief, W. The Structure of American Economy. 1919–1939; An Empirical Application of Equilibrium Analysis. Econ. J. 1952, 62, 908–910. [Google Scholar] [CrossRef]
- Gao, H.; Wang, X.; Wu, K.; Zheng, Y.; Wang, Q.; Shi, W.; He, M. A Review of Building Carbon Emission Accounting and Prediction Models. Buildings 2023, 13, 1617. [Google Scholar] [CrossRef]
- Rodrigo, M.N.N.; Perera, S.; Senaratne, S.; Jin, X. Review of Supply Chain Based Embodied Carbon Estimating Method: A Case Study Based Analysis. Sustainability 2021, 13, 9171. [Google Scholar] [CrossRef]
- Long, Y.; Yoshida, Y.; Fang, K.; Zhang, H.; Dhondt, M. City-Level Household Carbon Footprint from Purchaser Point of View by a Modified Input-Output Model. Appl. Energy 2019, 236, 379–387. [Google Scholar] [CrossRef]
- Zhang, L.X.; Wang, C.B.; Song, B. Carbon Emission Reduction Potential of a Typical Household Biogas System in Rural China. J. Clean. Prod. 2013, 47, 415–421. [Google Scholar] [CrossRef]
- Wan Omar, W.M.S. A Hybrid Life Cycle Assessment of Embodied Energy and Carbon Emissions from Conventional and Industrialised Building Systems in Malaysia. Energy Build. 2018, 167, 253–268. [Google Scholar] [CrossRef]
- Omar, W.M.S.W.; Doh, J.-H.; Panuwatwanich, K.; Miller, D. Assessment of the Embodied Carbon in Precast Concrete Wall Panels Using a Hybrid Life Cycle Assessment Approach in Malaysia. Sustain. Cities Soc. 2014, 10, 101–111. [Google Scholar] [CrossRef]
- Wolday, F. The Effect of Neighbourhood and Urban Center Structures on Active Travel in Small Cities. Cities 2023, 132, 104050. [Google Scholar] [CrossRef]
- Ye, H.; He, X.; Song, Y.; Li, X.; Zhang, G.; Lin, T.; Xiao, L. A Sustainable Urban Form: The Challenges of Compactness from the Viewpoint of Energy Consumption and Carbon Emission. Energy Build. 2015, 93, 90–98. [Google Scholar] [CrossRef]
- Sun, C.; Zhang, Y.; Ma, W.; Wu, R.; Wang, S. The Impacts of Urban Form on Carbon Emissions: A Comprehensive Review. Land 2022, 11, 1430. [Google Scholar] [CrossRef]
- Zhang, Y.; Han, X.; Wei, T.; Zhao, X.; Zhang, Y. Techno-Environmental-Economical Performance of Allocating Multiple Energy Storage Resources for Multi-Scale and Multi-Type Urban Forms towards Low Carbon District. Sustain. Cities Soc. 2023, 99, 104974. [Google Scholar] [CrossRef]
- Tian, P.; Cai, M.; Sun, Z.; Liu, S.; Wu, H.; Liu, L.; Peng, Z. Effects of 3D Urban Morphology on CO2 Emissions Using Machine Learning: Towards Spatially Tailored Low-Carbon Strategies in Central Wuhan, China. Urban Clim. 2024, 57, 102122. [Google Scholar] [CrossRef]
- Tan, G.; Zhang, X.; Xiong, S.; Sun, Z.; Lei, Y.; Wang, H.; Du, S. Assessing the Impacts of Urban Functional Form on Anthropogenic Carbon Emissions: A Case Study of 31 Major Cities in China. Ecol. Indic. 2024, 167, 112700. [Google Scholar] [CrossRef]
- Feng, T.; Zhou, B. Impact of Urban Spatial Structure Elements on Carbon Emissions Efficiency in Growing Megacities: The Case of Chengdu. Sci. Rep. 2023, 13, 9939. [Google Scholar] [CrossRef] [PubMed]
- Lian, H.; Zhang, J.; Li, G.; Ren, R. The Relationship between Residential Block Forms and Building Carbon Emissions to Achieve Carbon Neutrality Goals: A Case Study of Wuhan, China. Sustainability 2023, 15, 15751. [Google Scholar] [CrossRef]
- Wang, Y.; Liu, J.; Wang, J.; Liu, Z. Exploring the Effect of City Size on Carbon Emissions: Evidence from 259 Prefecture-Level Cities in China. Environ. Sci. Pollut. Res. 2023, 30, 86165–86177. [Google Scholar] [CrossRef] [PubMed]
- Zhou, C.; Wang, S.; Wang, J. Examining the Influences of Urbanization on Carbon Dioxide Emissions in the Yangtze River Delta, China: Kuznets Curve Relationship. Sci. Total Environ. 2019, 675, 472–482. [Google Scholar] [CrossRef] [PubMed]
- He, H.; Zhao, Z.; Yan, H.; Zhang, G.; Jing, R.; Zhou, M.; Wu, X.; Lin, T.; Ye, H. Urban Functional Area Building Carbon Emission Reduction Driven by Three-Dimensional Compact Urban Forms’ Optimization. Ecol. Indic. 2024, 167, 112614. [Google Scholar] [CrossRef]
- Huang, J.; Lu, H.; Du, M. Regional Differences in Agricultural Carbon Emissions in China: Measurement, Decomposition, and Influencing Factors. Land 2025, 14, 682. [Google Scholar] [CrossRef]
- Martin, L.A.; Simonucci, C.; Rad, S.; Benedetti, M.F. Effect of Natural Organic Matter on Thallium and Silver Speciation. J. Environ. Sci. 2020, 93, 185–192. [Google Scholar] [CrossRef] [PubMed]
- Sharma, S.; Mathew, T.V. Multiobjective Network Design for Emission and Travel-Time Trade-off for a Sustainable Large Urban Transportation Network. Environ. Plann. B Plann. Des. 2011, 38, 520–538. [Google Scholar] [CrossRef]
- Su, Y.; Wang, Y.; Wang, C.; Zhao, Q.; He, Y.; Zhou, D.; Zhou, N. The Influence of Spatiotemporal Radial Road on the Outdoor Thermal Environment. Urban Clim. 2022, 45, 101280. [Google Scholar] [CrossRef]
- Hong, T.; Huang, X.; Lv, Q.; Zhao, S.; Wang, Z.; Yang, Y. Thermal Mitigation in Coastal Cities: Marine and Urban Morphology Effects on Land Surface Temperature in Xiamen. Buildings 2025, 15, 1170. [Google Scholar] [CrossRef]
- Shen, X.; Liu, H.; Yang, X.; Zhou, X.; An, J.; Yan, D. A Data-Mining-Based Novel Approach to Analyze the Impact of the Characteristics of Urban Ventilation Corridors on Cooling Effect. Buildings 2024, 14, 348. [Google Scholar] [CrossRef]
- Koch, F.; Bilke, L.; Helbig, C.; Schlink, U. Compact or Cool? The Impact of Brownfield Redevelopment on Inner-City Micro Climate. Sustain. Cities Soc. 2018, 38, 31–41. [Google Scholar] [CrossRef]
- Strømann-Andersen, J.; Sattrup, P.A. The Urban Canyon and Building Energy Use: Urban Density versus Daylight and Passive Solar Gains. Energy Build. 2011, 43, 2011–2020. [Google Scholar] [CrossRef]
- Song, Y.; Knaap, G.-J. Measuring the Effects of Mixed Land Uses on Housing Values. Reg. Sci. Urban Econ. 2004, 34, 663–680. [Google Scholar] [CrossRef]
- Chen, H.; Jia, B.; Lau, S.S.Y. Sustainable Urban Form for Chinese Compact Cities: Challenges of a Rapid Urbanized Economy. Habitat Int. 2008, 32, 28–40. [Google Scholar] [CrossRef]
- Wang, W.; Cheng, X.; Dai, M. Strategies for Sustainable Urban Development and Morphological Optimization of Street Canyons: Measurement and Simulation of PM2.5 at Different Points and Heights. Sustain. Cities Soc. 2022, 87, 104191. [Google Scholar] [CrossRef]
- Ramyar, R.; Ackerman, A.; Johnston, D.M. Adapting Cities for Climate Change through Urban Green Infrastructure Planning. Cities 2021, 117, 103316. [Google Scholar] [CrossRef]
- Li, L.; Yan, F. How Does Density Impact Carbon Emission Intensity: Insights from the Block Scale and an Optimal Parameters-Based Geographical Detector. Land 2024, 13, 1036. [Google Scholar] [CrossRef]
- Xu, S.; Sang, M.; Xie, M.; Xiong, F.; Mendis, T.; Xiang, X. Influence of Urban Morphological Factors on Building Energy Consumption Combined with Photovoltaic Potential: A Case Study of Residential Blocks in Central China. Build. Simul. 2023, 16, 1777–1792. [Google Scholar] [CrossRef]
- Leng, H.; Chen, X.; Ma, Y.; Wong, N.H.; Ming, T. Urban Morphology and Building Heating Energy Consumption: Evidence from Harbin, a Severe Cold Region City. Energy Build. 2020, 224, 110143. [Google Scholar] [CrossRef]
- Kamal, A.; Abidi, S.M.H.; Mahfouz, A.; Kadam, S.; Rahman, A.; Hassan, I.G.; Wang, L.L. Impact of Urban Morphology on Urban Microclimate and Building Energy Loads. Energy Build. 2021, 253, 111499. [Google Scholar] [CrossRef]
- Bai, B.; Li, T.; Wang, S.; Yan, H.; Dong, J. Optimizing Urban Block Morphology for Photovoltaic Power and Thermal Comfort in Hot and Humid Regions. Eng. Appl. Artif. Intell. 2025, 158, 111377. [Google Scholar] [CrossRef]
- Shareef, S. The Impact of Urban Morphology and Building’s Height Diversity on Energy Consumption at Urban Scale. The Case Study of Dubai. Build. Environ. 2021, 194, 107675. [Google Scholar] [CrossRef]
- Muhaisen, A.S. Shading Simulation of the Courtyard Form in Different Climatic Regions. Build. Environ. 2006, 41, 1731–1741. [Google Scholar] [CrossRef]
- Mahmoud, A. The Influence of Buildings Proportions and Orientations on Energy Demand for Cooling in Hot Arid Climate. SVU-Int. J. Eng. Sci. Appl. 2022, 3, 8–20. [Google Scholar] [CrossRef]
- Susorova, I.; Tabibzadeh, M.; Rahman, A.; Clack, H.L.; Elnimeiri, M. The Effect of Geometry Factors on Fenestration Energy Performance and Energy Savings in Office Buildings. Energy Build. 2013, 57, 6–13. [Google Scholar] [CrossRef]
- Gibbs, D.; O’Neill, K. Building a Green Economy? Sustainability Transitions in the UK Building Sector. Geoforum 2015, 59, 133–141. [Google Scholar] [CrossRef]
- Taminiau, J.; Byrne, J.; Kim, J.; Kim, M.; Seo, J. Infrastructure-scale Sustainable Energy Planning in the Cityscape: Transforming Urban Energy Metabolism in East Asia. WIREs Energy Environ. 2021, 10, e397. [Google Scholar] [CrossRef]
- Berardi, U.; GhaffarianHoseini, A.; GhaffarianHoseini, A. State-of-the-Art Analysis of the Environmental Benefits of Green Roofs. Appl. Energy 2014, 115, 411–428. [Google Scholar] [CrossRef]
- Xia, C.; Dong, Z.; Wu, P.; Dong, F.; Fang, K.; Li, Q.; Li, X.; Shao, Z.; Yu, Z. How Urban Land-Use Intensity Affected CO2 Emissions at the County Level: Influence and Prediction. Ecol. Indic. 2022, 145, 109601. [Google Scholar] [CrossRef]
- Naserikia, M.; Hart, M.A.; Nazarian, N.; Bechtel, B. Background Climate Modulates the Impact of Land Cover on Urban Surface Temperature. Sci. Rep. 2022, 12, 15433. [Google Scholar] [CrossRef] [PubMed]
- Xiaoxu, X.; Qiangmin, X.; Weihao, S. Impact of Urban Compactness on Carbon Emission in Chinese Cities: From Moderating Effects of Industrial Diversity and Job-Housing Imbalances. Land Use Policy 2024, 143, 107213. [Google Scholar] [CrossRef]
- Yu, X.; Wu, Z.; Zheng, H.; Li, M.; Tan, T. How Urban Agglomeration Improve the Emission efficiency? A Spatial Econometric Analysis of the Yangtze River Delta Urban Agglomeration in China. J. Environ. Manag. 2020, 260, 110061. [Google Scholar] [CrossRef] [PubMed]
- Li, Q.; Chen, X.; Jiao, S.; Song, W.; Zong, W.; Niu, Y. Can Mixed Land Use Reduce CO2 Emissions? A Case Study of 268 Chinese Cities. Sustainability 2022, 14, 15117. [Google Scholar] [CrossRef]
- Wang, W.; Luo, Y.; Liang, J.; Chen, S. Exploring Urban Compactness Impact on Carbon Emissions from Energy Consumption: A Township-Level Case Study of Hangzhou, China. Heliyon 2024, 10, e33236. [Google Scholar] [CrossRef] [PubMed]
- Angel, S.; Parent, J.; Civco, D.L. Ten Compactness Properties of Circles: Measuring Shape in Geography. Can. Geogr./Géograph. Can. 2010, 54, 441–461. [Google Scholar] [CrossRef]
- Guo, R.; Leng, H.; Yuan, Q.; Song, S. Impact of Urban Form on CO2 Emissions under Different Socioeconomic Factors: Evidence from 132 Small and Medium-Sized Cities in China. Land 2022, 11, 713. [Google Scholar] [CrossRef]
- Fang, C.; Wang, S.; Li, G. Changing Urban Forms and Carbon Dioxide Emissions in China: A Case Study of 30 Provincial Capital Cities. Appl. Energy 2015, 158, 519–531. [Google Scholar] [CrossRef]
- Wei, M.; Xiong, Y.; Sun, B. Spatial Effects of Urban Economic Activities on Airports’ Passenger Throughputs: A Case Study of Thirteen Cities and Nine Airports in the Beijing-Tianjin-Hebei Region, China. J. Air Transp. Manag. 2025, 125, 102765. [Google Scholar] [CrossRef]
- Wang, S.; Wang, J.; Fang, C.; Li, S. Estimating the Impacts of Urban Form on CO2 Emission Efficiency in the Pearl River Delta, China. Cities 2019, 85, 117–129. [Google Scholar] [CrossRef]
- Yin, K.; Yao, X. The Impact of Urban Compactness on Urban Carbon Emissions: A Study of 281 Chinese Cities. Urban Clim. 2024, 56, 102052. [Google Scholar] [CrossRef]
- Zheng, S.; Huang, Y.; Sun, Y. Effects of Urban Form on Carbon Emissions in China: Implications for Low-Carbon Urban Planning. Land 2022, 11, 1343. [Google Scholar] [CrossRef]
- Zhang, B.; Xin, Q.; Chen, S.; Yang, Z.; Wang, Z. Urban Spatial Structure and Commuting-Related Carbon Emissions in China: Do Monocentric Cities Emit More? Energy Policy 2024, 186, 113990. [Google Scholar] [CrossRef]
- Schwaab, J.; Meier, R.; Mussetti, G.; Seneviratne, S.; Bürgi, C.; Davin, E.L. The Role of Urban Trees in Reducing Land Surface Temperatures in European Cities. Nat. Commun. 2021, 12, 6763. [Google Scholar] [CrossRef] [PubMed]
- Meng, Q.; Gao, J.; Zhang, L.; Hu, X.; Qian, J.; Jancsó, T. Coupled Cooling Effects between Urban Parks and Surrounding Building Morphologies Based on the Microclimate Evaluation Framework Integrating Remote Sensing Data. Sustain. Cities Soc. 2024, 102, 105235. [Google Scholar] [CrossRef]
- Santamouris, M. Analyzing the Heat Island Magnitude and Characteristics in One Hundred Asian and Australian Cities and Regions. Sci. Total Environ. 2015, 512–513, 582–598. [Google Scholar] [CrossRef] [PubMed]
- Sharifi, A. Resilient Urban Forms: A Review of Literature on Streets and Street Networks. Build. Environ. 2019, 147, 171–187. [Google Scholar] [CrossRef]
- Battista, G.; De Lieto Vollaro, E.; Ocłoń, P.; Vallati, A. Effect of Mutual Radiative Exchange between the Surfaces of a Street Canyon on the Building Thermal Energy Demand. Energy 2021, 226, 120346. [Google Scholar] [CrossRef]
- Krüger, E.; Pearlmutter, D.; Rasia, F. Evaluating the Impact of Canyon Geometry and Orientation on Cooling Loads in a High-Mass Building in a Hot Dry Environment. Appl. Energy 2010, 87, 2068–2078. [Google Scholar] [CrossRef]
- Javadpoor, M.; Sharifi, A.; Gurney, K.R. Mapping the Relationship between Urban Form and CO2 Emissions in Three US Cities Using the Local Climate Zones (LCZ) Framework. J. Environ. Manag. 2024, 370, 122723. [Google Scholar] [CrossRef] [PubMed]
- Qin, Y.; Kang, J.; Zhou, H.; Xu, S.; Li, G.; Li, C.; Tan, W. Assessment of the Impact of Urban Block Morphological Factors on Carbon Emissions Introducing the Different Context of Local Climate Zones. Sustain. Cities Soc. 2025, 119, 106073. [Google Scholar] [CrossRef]
- Yang, X.; Peng, L.L.H.; Jiang, Z.; Chen, Y.; Yao, L.; He, Y.; Xu, T. Impact of Urban Heat Island on Energy Demand in Buildings: Local Climate Zones in Nanjing. Appl. Energy 2020, 260, 114279. [Google Scholar] [CrossRef]
- Wang, Y.; Pan, W.; Liao, Z. Impact of Urban Morphology on High-Density Commercial Block Energy Consumption in Severe Cold Regions. Sustainability 2024, 16, 5795. [Google Scholar] [CrossRef]
- Ahn, Y.; Sohn, D.-W. The Effect of Neighbourhood-Level Urban Form on Residential Building Energy Use: A GIS-Based Model Using Building Energy Benchmarking Data in Seattle. Energy Build. 2019, 196, 124–133. [Google Scholar] [CrossRef]
- Mouzourides, P.; Kyprianou, A.; Neophytou, M.K.-A.; Ching, J.; Choudhary, R. Linking the Urban-Scale Building Energy Demands with City Breathability and Urban Form Characteristics. Sustain. Cities Soc. 2019, 49, 101460. [Google Scholar] [CrossRef]
- Ibrahim, Y.; Kershaw, T.; Shepherd, P.; Elkady, H. Multi-Objective Optimisation of Urban Courtyard Blocks in Hot Arid Zones. Sol. Energy 2022, 240, 104–120. [Google Scholar] [CrossRef]
- Su, S.; Feng, J.; Wang, W.; Jin, Y.; Chong, D. Dynamic Prediction of Lifecycle Carbon Emissions in Residential Communities: Insights into the Role of Residential Form. Environ. Impact Assess. Rev. 2025, 112, 107845. [Google Scholar] [CrossRef]
- Wang, J.; Liu, W.; Sha, C.; Zhang, W.; Liu, Z.; Wang, Z.; Wang, R.; Du, X. Evaluation of the Impact of Urban Morphology on Commercial Building Carbon Emissions at the Block Scale—A Study of Commercial Buildings in Beijing. J. Clean. Prod. 2023, 408, 137191. [Google Scholar] [CrossRef]
- Ye, H.; Ren, Q.; Shi, L.; Song, J.; Hu, X.; Li, X.; Zhang, G.; Lin, T.; Xue, X. The Role of Climate, Construction Quality, Microclimate, and Socio-Economic Conditions on Carbon Emissions from Office Buildings in China. J. Clean. Prod. 2018, 171, 911–916. [Google Scholar] [CrossRef]
- Zheng, F.; Wang, Y.; Shen, Z.; Wang, Y. Research on the Correlations between Spatial Morphological Indices and Carbon Emission during the Operational Stage of Built Environments for Old Communities in Cold Regions. Buildings 2023, 13, 2222. [Google Scholar] [CrossRef]
- Mousavi Sarvine Baghi, E.S.; Ranjbar, E. Seeking Low Carbon Urban Design through Modelling of Carbon Emission from Different Sources in Urban Neighbourhoods, Case Study: Semnan. Int. J. Urban Sustain. Dev. 2021, 13, 546–568. [Google Scholar] [CrossRef]
- Ko, Y. Urban Form and Residential Energy Use: A Review of Design Principles and Research Findings. J. Plan. Lit. 2013, 28, 327–351. [Google Scholar] [CrossRef]
- Lin, Y.; Yang, W. Application of Multi-Objective Genetic Algorithm Based Simulation for Cost-Effective Building Energy Efficiency Design and Thermal Comfort Improvement. Front. Energy Res. 2018, 6, 25. [Google Scholar] [CrossRef]
- Zhang, Y.; Qi, H.; Zhou, Y.; Zhang, Z.; Wang, X. Exploring the Impact of a District Sharing Strategy on Application Capacity and Carbon Emissions for Heating and Cooling with GSHP Systems. Appl. Sci. 2020, 10, 5543. [Google Scholar] [CrossRef]
- Qi, H.; Zhou, Y.; Zhang, Z.; Wang, B.; Zhang, Y.; Cui, H.; Wang, X. Heat Transfer Performance in Energy Piles in Urban Areas: Case Studies for Lambeth College and Shell Centre UK. Appl. Sci. 2020, 10, 5974. [Google Scholar] [CrossRef]
- Liu, Y.; Chen, D.; Wang, J.; Dai, M. Energy-Saving and Ecological Renovation of Existing Urban Buildings in Severe Cold Areas: A Case Study. Sustainability 2023, 15, 12985. [Google Scholar] [CrossRef]
- Ding, X.; Cui, Y.; Chen, Z.; Zhang, H. Energy Efficiency in Biophilic Architecture: A Systematic Literature Review and Visual Analysis Using CiteSpace and VOSviewer. Buildings 2024, 14, 3800. [Google Scholar] [CrossRef]
- Li, Y.; Li, H.; Miao, R.; Qi, H.; Zhang, Y. Energy–Environment–Economy (3E) Analysis of the Performance of Introducing Photovoltaic and Energy Storage Systems into Residential Buildings: A Case Study in Shenzhen, China. Sustainability 2023, 15, 9007. [Google Scholar] [CrossRef]
- Lei, Z.; Qi, W.; Zhang, L.; Yang, J.; Zhuorui, Z. Preparation and Comprehensive Performance Optimization of Green Insulation Building Materials Based on Blast Furnace Slag. J. Build. Eng. 2025, 106, 112591. [Google Scholar] [CrossRef]
- Ewing, R.; Rong, F. The Impact of Urban Form on U.S. Residential Energy Use. Hous. Policy Debate 2008, 19, 1–30. [Google Scholar] [CrossRef]
- Guo, R.; Leng, H.; Yuan, Q.; Song, S. Impact of Urban Form on Carbon Emissions of Residents in Counties: Evidence from Yangtze River Delta, China. Environ. Sci. Pollut. Res. 2024, 31, 56332–56349. [Google Scholar] [CrossRef] [PubMed]
- Chen, L.; Huang, L.; Hua, J.; Chen, Z.; Wei, L.; Osman, A.I.; Fawzy, S.; Rooney, D.W.; Dong, L.; Yap, P.-S. Green Construction for Low-Carbon Cities: A Review. Environ. Chem. Lett. 2023, 21, 1627–1657. [Google Scholar] [CrossRef]
- Tan, X.; Lai, H.; Gu, B.; Zeng, Y.; Li, H. Carbon Emission and Abatement Potential Outlook in China’s Building Sector through 2050. Energy Policy 2018, 118, 429–439. [Google Scholar] [CrossRef]
- Fan, T.; Chapman, A. Policy Driven Compact Cities: Toward Clarifying the Effect of Compact Cities on Carbon Emissions. Sustainability 2022, 14, 12634. [Google Scholar] [CrossRef]
- Monkkonen, P.; Guerra, E.; Montejano Escamilla, J.; Caudillo Cos, C.; Tapia-McClung, R. A Global Analysis of Land Use Regulation, Urban Form, and Greenhouse Gas Emissions. Cities 2024, 147, 104801. [Google Scholar] [CrossRef]
- Glaeser, E.L.; Kahn, M.E. The Greenness of Cities: Carbon Dioxide Emissions and Urban Development. J. Urban Econ. 2010, 67, 404–418. [Google Scholar] [CrossRef]
- Yu, F.; Feng, W.; Leng, J.; Wang, Y.; Bai, Y. Review of the U.S. Policies, Codes, and Standards of Zero-Carbon Buildings. Buildings 2022, 12, 2060. [Google Scholar] [CrossRef]
- Nejat, P.; Jomehzadeh, F.; Taheri, M.M.; Gohari, M.; Majid, M.Z.A. A Global Review of Energy Consumption, CO2 Emissions and Policy in the Residential Sector (with an Overview of the Top Ten CO2 Emitting Countries). Renew. Sustain. Energy Rev. 2015, 43, 843–862. [Google Scholar] [CrossRef]
- Brown, M.; Cox, M.; Sun, X. Modeling the Impact of a Carbon Tax on the Commercial Buildings Sector. In Proceedings of the ACEEE Summer Study on Energy Efficiency in Buildings, Pacific Grove, CA, USA, 12–17 August 2012. [Google Scholar]
- Du, Q.; Yan, Y.; Huang, Y.; Hao, C.; Wu, J. Evolutionary Games of Low-Carbon Behaviors of Construction Stakeholders under Carbon Taxes. Int. J. Environ. Res. Public Health 2021, 18, 508. [Google Scholar] [CrossRef] [PubMed]
- Brink, C.; Vollebergh, H.R.J.; Van Der Werf, E. Carbon Pricing in the EU: Evaluation of Different EU ETS Reform Options. Energy Policy 2016, 97, 603–617. [Google Scholar] [CrossRef]
- Sun, B.; Xu, Z.; Wei, M.; Wang, X. A Study on the Strategic Behavior of Players Participating in Air-Rail Intermodal Transportation Based on Evolutionary Games. J. Air Transp. Manag. 2025, 126, 102793. [Google Scholar] [CrossRef]
- Gong, Q.; Wu, J.; Jiang, Z.; Hu, M.; Chen, J.; Cao, Z. An Integrated Design Method for Remanufacturing Scheme Considering Carbon Emission and Customer Demands. J. Clean. Prod. 2024, 476, 143681. [Google Scholar] [CrossRef]
- Hu, S.; Yan, D.; Azar, E.; Guo, F. A Systematic Review of Occupant Behavior in Building Energy Policy. Build. Environ. 2020, 175, 106807. [Google Scholar] [CrossRef]
- Lei, Q.; Lau, S.S.Y.; Fan, Y.; Fu, I.C.S.; Chan, J.T.Y.; Tao, Y.; Zhang, L.; Lai, H.; Miao, Y.; Qi, Y. From Policy to Implementation—An Analytic Network Process (ANP)-Based Assessment Tool for Low Carbon Urban and Neighborhood Planning. Buildings 2023, 13, 484. [Google Scholar] [CrossRef]
- Wang, S.; Li, Q.; Fang, C.; Zhou, C. The Relationship between Economic Growth, Energy Consumption, and CO2 Emissions: Empirical Evidence from China. Sci. Total Environ. 2016, 542, 360–371. [Google Scholar] [CrossRef] [PubMed]
- Davoudi, S.; Sturzaker, J. Urban Form, Policy Packaging and Sustainable Urban Metabolism. Resour. Conserv. Recycl. 2017, 120, 55–64. [Google Scholar] [CrossRef]
- Angel, S. Planet of Cities; Lincoln Institute of Land Policy: Cambridge, MA, USA, 2012; Volume 54, ISBN 978-1-55844-245-0. [Google Scholar]
- Qiang, W.W.; Wen, T.; Luo, H.; Huang, B.; Lee, H.F. Does a More Compact Urban Center Layout Matter in Reducing Household Carbon Emissions? Evidence from Chinese Cities. Land Use Policy 2024, 146, 107320. [Google Scholar] [CrossRef]
- Li, B.; Zheng, Q.; Jiang, X.; He, C. Multi-Scale Spatial Structure Impacts on Carbon Emission in Cold Region: Case Study in Changchun, China. Sustainability 2024, 17, 228. [Google Scholar] [CrossRef]
- Xia, L.; Zhang, Y.; Sun, X.; Li, J. Analyzing the Spatial Pattern of Carbon Metabolism and Its Response to Change of Urban Form. Ecol. Model. 2017, 355, 105–115. [Google Scholar] [CrossRef]
- Li, T. Artificial Intelligence for Reducing the Carbon Emissions of 5G Networks in China. Nat. Sustain. 2023, 6, 1522–1523. [Google Scholar] [CrossRef]
- Wang, W.; Liu, K.; Zhang, M.; Shen, Y.; Jing, R.; Xu, X. From Simulation to Data-Driven Approach: A Framework of Integrating Urban Morphology to Low-Energy Urban Design. Renew. Energy 2021, 179, 2016–2035. [Google Scholar] [CrossRef]
- Wu, C.; Wang, R.; Lu, S.; Tian, J.; Yin, L.; Wang, L.; Zheng, W. Time-Series Data-Driven PM2.5 Forecasting: From Theoretical Framework to Empirical Analysis. Atmosphere 2025, 16, 292. [Google Scholar] [CrossRef]
- Xia, C.; Li, Y.; Xu, T.; Ye, Y.; Shi, Z.; Peng, Y.; Liu, J. Quantifying the Spatial Patterns of Urban Carbon Metabolism: A Case Study of Hangzhou, China. Ecol. Indic. 2018, 95, 474–484. [Google Scholar] [CrossRef]


| Spatial Scale | Factors Affecting | Characterization Indicators | Impact Direction | Main Mediating Factors | Main References |
|---|---|---|---|---|---|
| Macro-scale | Urban size | Built-up area | Nonlinear | Population density, Traffic behavior, Energy demand | Wang et al. [75], Zhou et al. [76] |
| Urban compactness | Compactness index | Bidirectional | Infrastructure utilization, Traffic behavior, Heat island effect | He et al. [77], Huang et al. [78] | |
| Urban spatial structure | Urban polycentric structure | Negative | Traffic behavior | Wolday [67], Martin et al. [79] | |
| Urban road system | Road network density | Bidirectional | Traffic behavior, Local microclimate | Sharma and Mathew [80], Su et al. [81] | |
| Blue-green space structure | Blue-green space coverage | Negative | Carbon sink, Heat island effect, Local microclimate | Hong et al. [82], Shen et al. [83], Koch et al. [84] | |
| Meso-scale | Street canyon ratio | Street height-to-width ratio | Negative | Local microclimate | Strømann-Andersen and Sattrup [85] |
| Block functional layout | Land use mix | Negative | Traffic behavior, Space efficiency | Song and Knaap [86], Chen et al. [87] | |
| Block green space layout | Accessibility to green space, Green area ratio | Negative | Local microclimate, Traffic behavior | Wang et al. [88], Ramyar et al. [89] | |
| Block development capacity | Floor area ratio, Site coverage | Nonlinear | Heating/cooling needs | Li and Yan [90], Xu et al. [91], Leng et al. [92] | |
| Block complex layout | Block orientation, Building spacing, Building average height, Building height standard deviations, Building group layout | Bidirectional | Local microclimate | Kamal et al. [93], Bai et al. [94], Shareef et al. [95] | |
| Micro-scale | Building geometric parameters | Building shape coefficient | Positive | Heat transfer area | Muhaisen et al. [96] |
| Building geometric parameters | Building orientation | Negative | Solar heat gain, Natural ventilation | Strømann-Andersen and Sattrup [85], Mahmoud [97] | |
| Building geometric parameters | Window-wall ratio | Bidirectional | Lighting, heat transfer, air conditioning loads | Susorova et al. [98] | |
| Building energy efficiency design | BIPV, Green roof, Highly reflective material | Negative | Heat island effect, Renewable energy use | Gibbs and O’Neill [99], Taminiau et al. [100], Berardi et al. [101] |
Disclaimer/Publisher’s Note: The statements, opinions and data contained in all publications are solely those of the individual author(s) and contributor(s) and not of MDPI and/or the editor(s). MDPI and/or the editor(s) disclaim responsibility for any injury to people or property resulting from any ideas, methods, instructions or products referred to in the content. |
© 2025 by the authors. Licensee MDPI, Basel, Switzerland. This article is an open access article distributed under the terms and conditions of the Creative Commons Attribution (CC BY) license (https://creativecommons.org/licenses/by/4.0/).
Share and Cite
Liu, Z.; Xu, Q.; Lyu, S.; Yang, R.; Wan, Z. A Review of the Impact of Urban Form on Building Carbon Emissions. Buildings 2025, 15, 2604. https://doi.org/10.3390/buildings15152604
Liu Z, Xu Q, Lyu S, Yang R, Wan Z. A Review of the Impact of Urban Form on Building Carbon Emissions. Buildings. 2025; 15(15):2604. https://doi.org/10.3390/buildings15152604
Chicago/Turabian StyleLiu, Zheming, Qianhui Xu, Silin Lyu, Ruibing Yang, and Zihang Wan. 2025. "A Review of the Impact of Urban Form on Building Carbon Emissions" Buildings 15, no. 15: 2604. https://doi.org/10.3390/buildings15152604
APA StyleLiu, Z., Xu, Q., Lyu, S., Yang, R., & Wan, Z. (2025). A Review of the Impact of Urban Form on Building Carbon Emissions. Buildings, 15(15), 2604. https://doi.org/10.3390/buildings15152604