Article

Spatial Layout Optimization in Urban Renewal Based on Improved NSGAII Algorithm

School of Architecture and Planning, Shenyang Jianzhu University, Shenyang 110168, China
*
Author to whom correspondence should be addressed.
Buildings 2025, 15(1), 94; https://doi.org/10.3390/buildings15010094
Submission received: 22 October 2024 / Revised: 14 November 2024 / Accepted: 21 November 2024 / Published: 30 December 2024
(This article belongs to the Section Building Energy, Physics, Environment, and Systems)

Abstract

:
A multi-objective optimization method based on the improved non-dominated sorting genetic algorithm II was proposed to address the problem of spatial layout optimization in urban renewal. The study first constructed an urban spatial layout model with net zero carbon as the core concept, setting three optimization objectives: minimizing net carbon emissions, maximizing regional GDP, and compact utilization of land functions. By introducing the Non-dominated Sorting Genetic Algorithm II for multi-objective optimization of the solution, this algorithm uses fitness non-dominated sorting and crowding distance calculation to maintain population diversity and combined the approximate ideal solution sorting method to improve convergence. The experiment outcomes indicate that the raised algorithm achieves an optimization result of 5.79 × 10⁻²⁰ in the Rastrigin function and exhibits better uniformity in the distribution of solution values in the ZDT1 function. In terms of urban spatial layout, the optimized scheme has a net carbon emission of 19,821.80 tons, a regional GDP of 2.342367 billion USD, and a compact land function of 5791.93, indicating that the scheme not only effectively controls carbon emissions but also demonstrates the rationality and sustainability of land resource use.

1. Introduction

In the process of achieving sustainable development, the balance between economic growth and environmental protection is an important concept for current development. However, urban scheming is often limited to optimizing a single objective, neglecting the efficient utilization of land resources and the diversity of social needs [1,2]. In addition, traditional urban spatial scheming methods often prioritize one objective over others when dealing with multi-objective optimization, which can easily lead to resource waste and deviation from sustainable development [3,4]. Especially under the dual pressure of addressing climate change and improving residents’ quality of life, it is particularly urgent to find a spatial layout optimization method that can balance economic, environmental, and social interests. The research motivation stems from the construction of a systematic urban spatial layout model to explore the multi-objective optimization balance between net zero carbon, regional GDP maximization, and compact use of land functions. The main purpose of the research is to construct an urban spatial layout optimization model based on the concept of net zero carbon, in order to maximize the reduction of net carbon emissions, the improvement of regional GDP, and the optimization of land use compactness. The research aims to find a new urban scheming approach through multi-objective optimization methods to promote the coordinated development of cities while striking a balance between sustainable growth and ecological preservation. To achieve this goal, a spatial optimization method combining the approximate ideal solution ranking method and NSGA-II is studied. This paper innovatively introduces the approximate ideal solution sorting method into NSGA-II to overcome the limitations of traditional algorithms in multi-objective optimization. This combination helps to improve the distribution uniformity of the population in the solution space. Grounded on this, the algorithm can better capture the characteristics of the Pareto frontier and then improve the scientific and effective decisions. For the first time in the field of urban renewal, a multi-objective optimization framework with “net zero carbon” as the core is proposed. It fully considers the comprehensive effects of carbon emissions, regional GDP and land use compactness, filling the gap in existing research.

2. Related Work

Currently, scholars around the world have developed in-depth analysis on the optimization of an urban spatial layout. Wang Z et al. proposed a spatial optimization method that combined land use and transportation to address the issue of scarce urban land resources. They used an improved Non-dominated Sorting Genetic Algorithm II (NSGA-II) to address the matter and obtained more effective results. In the experimental results, the model achieved good results, and the Pareto optimal alternative generated by the model met the ideal solution for urban development needs [5]. Fu J et al. proposed a joint optimization method to improve decision support for urban layout optimization, focusing on the relationship between transportation systems and geographic distribution activities in urban scheming. Compared with the standard model, this framework considered the possible flow distribution between different urban facilities and was subject to the overall constraint of regional demand control for specific activity types. This model validated the availability of the raised method through various examples and discussions [6]. Zhu W et al. raised a general structure for enhancing regional land use spatial patterns caused by high-intensity land use and resource overload, combining resource and environmental carrying capacity with land use changes to explore approaches for enhancing the land spatial patterns required for high-quality development. The research results indicate that the optimization of a land spatial pattern based on the dual dimensions of resource and environmental carrying capacity and land use change is more practical than a single-dimension solution, effectively demonstrating the availability and applicability of LUSP optimization [7]. Enomoto et al. proposed a model for simultaneously optimizing city centers and transportation routes to minimize social costs. This model clarifies the differences between center and route layout, subsidies and population size/distribution, and operating costs. In the research results, the proposed model achieves good performance in reducing social costs [8]. Luo H et al. proposed a spatial simulation and prediction model of carbon emissions that incorporated a multi-seed model. Through this model, the relationship between urban construction area, land use, and carbon emissions was studied. A multi-objective scenario scheming, principal component analysis BP neural network was applied to preset development scenarios. The spatial distribution of carbon emissions was finally accurately simulated [9]. Zhao Q proposed an evaluation method based on morphological spatial model analysis and a minimum cumulative resistance model to obtain the spatio-temporal evolution of an urban heat island in Fuzhou city center between 2010 and 2019. After land use optimization, climate resilience was improved, and the structure and function of a spatial network of a thermal environment were effectively reduced, thus alleviating the urban heat island effect [10]. Kwon S H et al. proposed a multi-cycle optimization framework based on scenario scheming. The framework was designed to identify various system components and minimize social costs and total investment, subject to a set of constraints. The research results show that compared with traditional design methods, this framework performs better in realizing long-term scheming under climate conditions of four different scenarios. It effectively solves the problems of urban drainage system design under deep uncertainty and extreme climate conditions [11].
Although the above research has achieved certain results in urban spatial layout, most studies still tend to optimize a single objective, such as economic growth or resource utilization, which leads to neglecting the potential impact of other objectives. Although many studies have proposed spatial optimization models, they are usually limited to a specific region or land use type and have not formed a comprehensive optimization of the entire urban spatial structure. In view of the above shortcomings, this study will introduce an urban spatial layout optimization method that comprehensively considers multiple objectives. This method is not only applicable to a specific region, but also aims to improve the coordination and sustainability of the entire urban spatial structure on a global basis. This method fills the gap in the existing research that fails to take into account both the complex objectives and the overall urban and rural layout improvement.

3. Methods and Materials

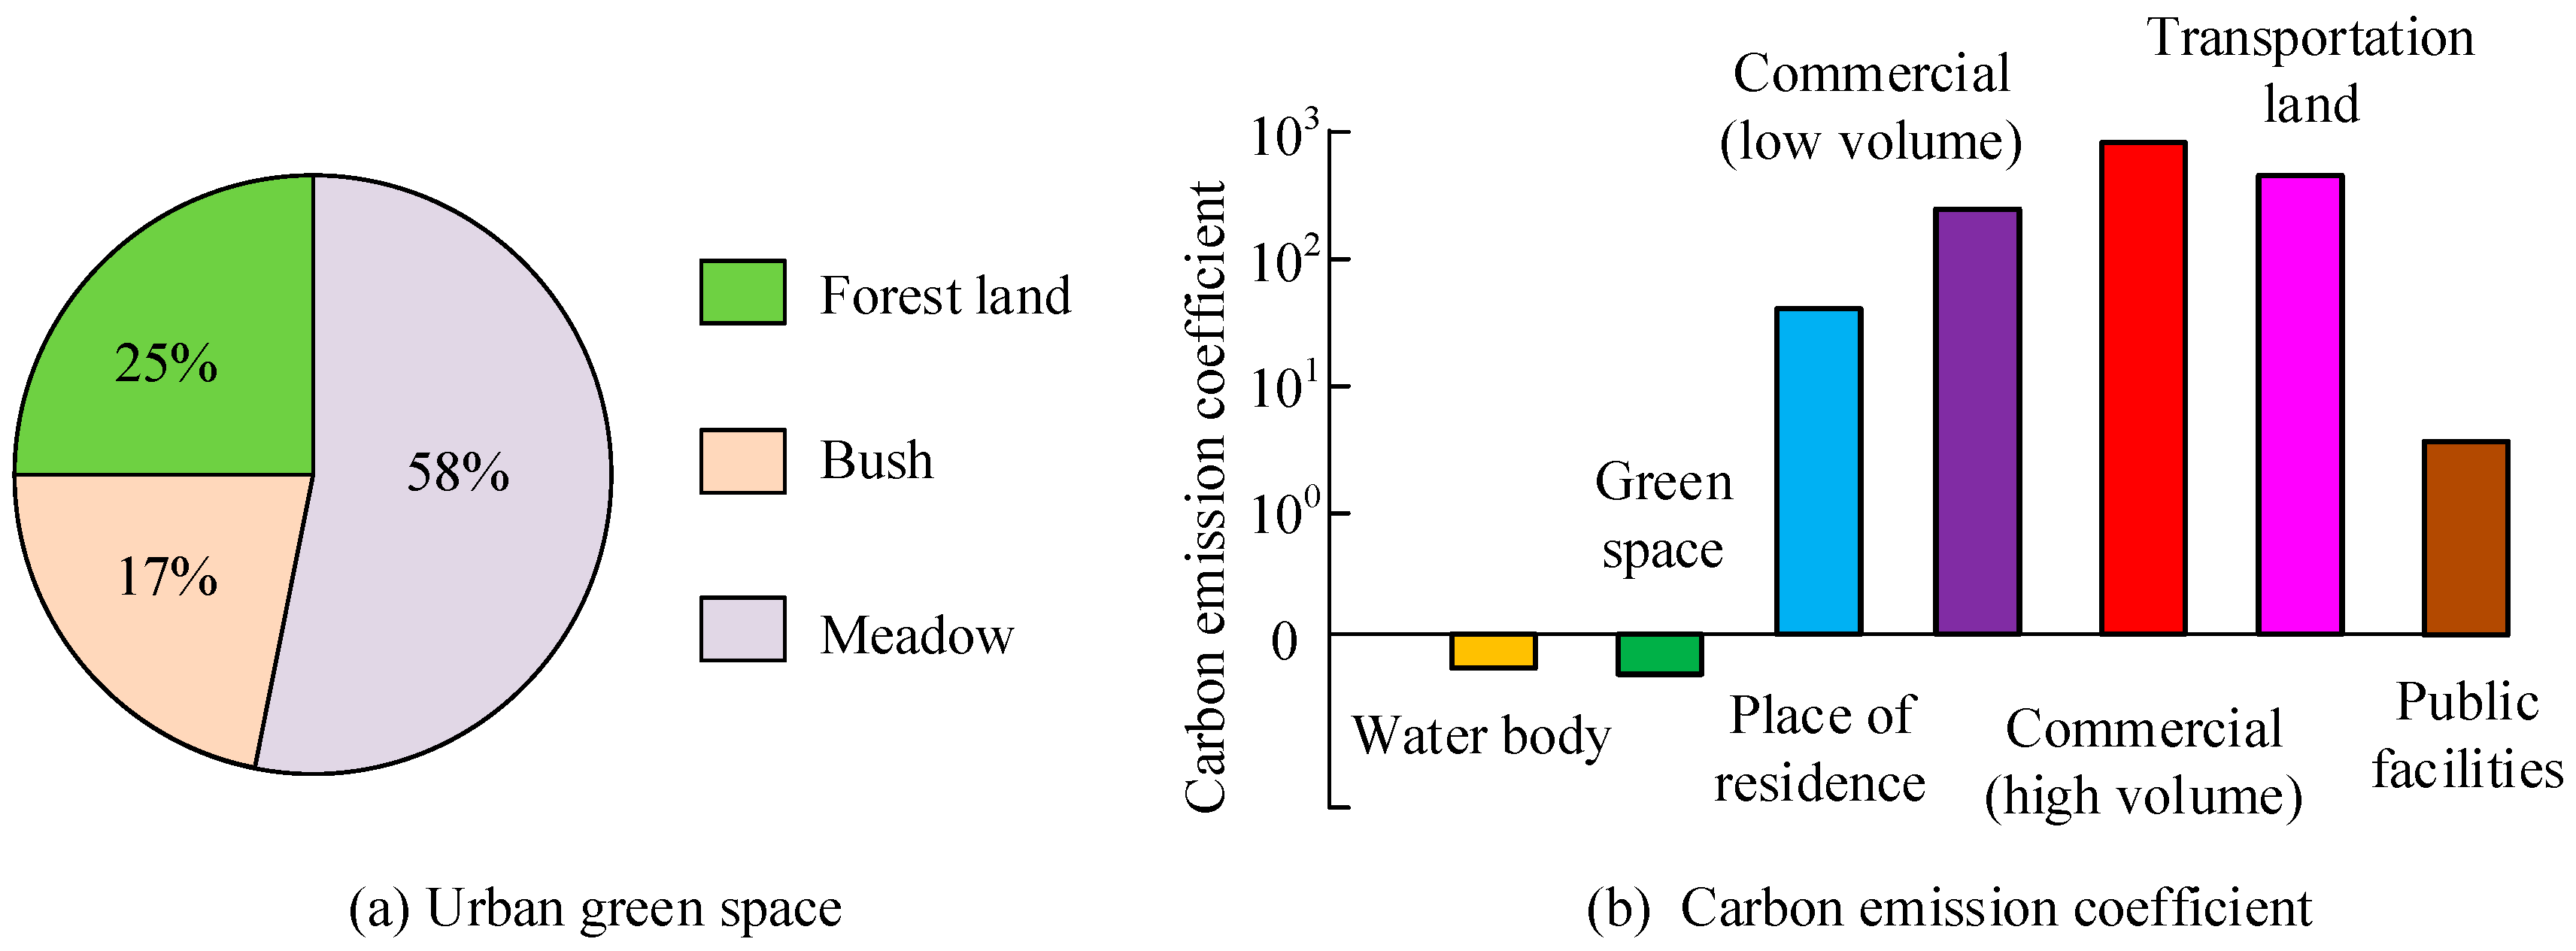
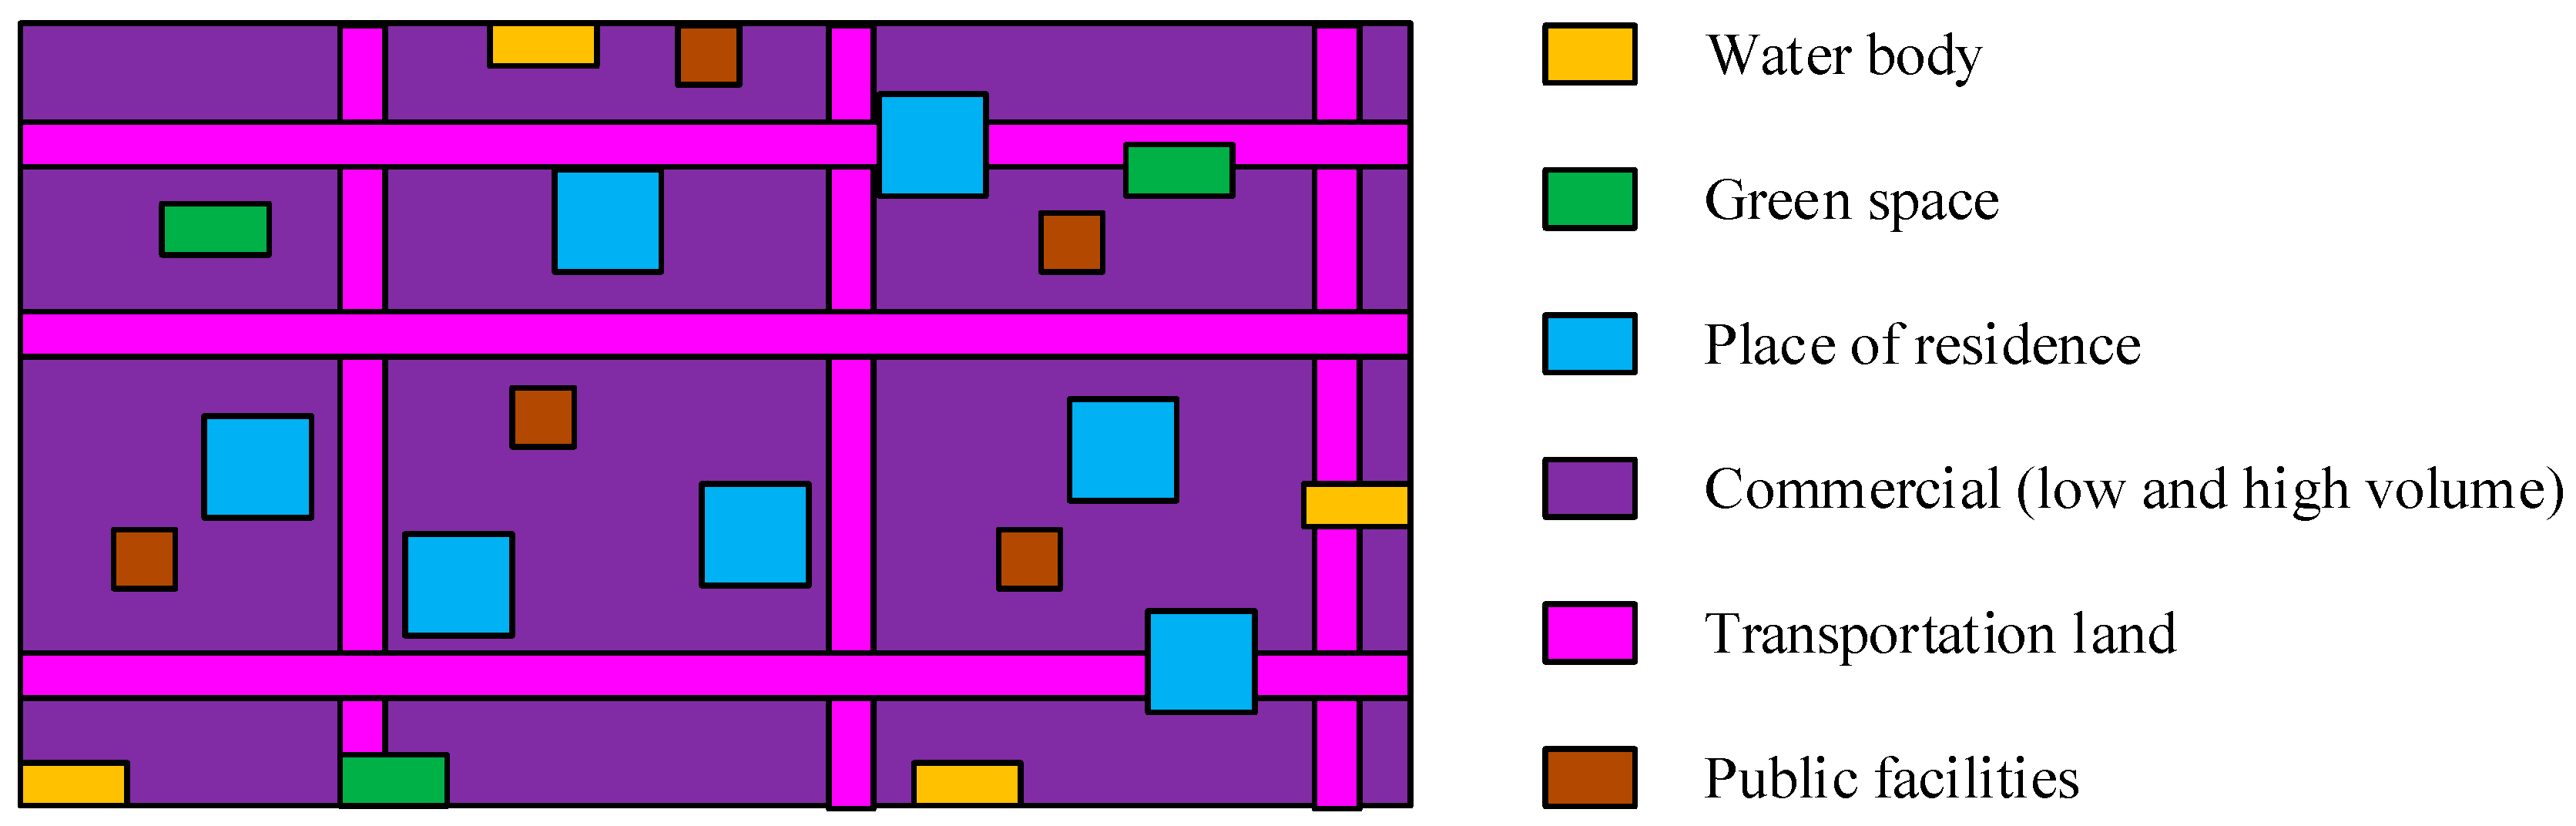
3.1. Construction of Spatial Layout Model in Urban Renewal

With the continuous development of cities, the problem of urban spatial layout has gradually received attention. In the process of urban scheming and development, coordination and optimization are involved in multiple aspects, including economic, environmental, social, and cultural factors. In this complex process, net zero carbon-oriented urban spatial scheming is particularly important. It not only responds to the challenges of global climate change, but also points out the direction for the sustainable development of cities. The concept of net zero carbon is highly compatible with sustainable development, emphasizing that, while it meets the needs of contemporary people, it does not hinder future generations from meeting their own needs. By optimizing urban layout, promoting green buildings and renewable energy, the sustainability of cities can be enhanced. Implementing net zero carbon-oriented spatial scheming can improve the living environment, for example, by increasing green spaces, improving air quality, and reducing noise pollution, thereby enhancing the living standard and bodily and emotional wellbeing of citizens. In urban spatial scheming guided by a net zero carbon approach, three optimization objectives need to be considered: minimum carbon emissions, maximum economic output, and maximization of land resource utilization. The reasons for selecting the above objective functions are as follows: Cities are the main sources of carbon emissions, so optimizing an urban spatial layout to minimize carbon emissions can significantly improve urban environmental quality and reduce the impact of climate change. Economic development is one of the core objectives of urban scheming. By maximizing regional GDP, cities can ensure efficient use of land resources while supporting economic growth. Improving the compactness of land use can effectively reduce the waste of resources brought by urban expansion and promote the sustainable development of cities. Although other objectives such as social equity, accessibility, and infrastructure resilience are also important, since the research focuses on urban spatial layout optimization, carbon emissions, GDP, and land compactness can directly reflect the balance between urban development and environmental protection, without considering further influencing factors. Among the latter, the minimum carbon emission can cope with climate change and improve air quality; the carbon emission coefficient of land use in built-up areas is variable. To simplify the calculation, different types of land correspond to different carbon emission coefficients. The calculation function is specifically shown in Formula (1) [12].
f 1 : min C a r b o n = i j C i × A r e a i j
In Formula (1), f 1 represents the function of minimizing net carbon emissions, which is used to measure the total carbon emissions of a city under a certain scheming, corresponding to the carbon emissions of different regions of the city. A r e a i j represents the size of the land area, which is directly related to urban management and development, affecting resource consumption in different regions and the impact on the environment. C i represents the size of the carbon emission coefficient for land use types. Different functional land use types have different carbon emission characteristics, so different carbon emission coefficients need to be set according to the actual situation. i represents the type of land use, and different land uses in urban scheming can affect overall energy demand, transportation patterns, and emissions. j represents the land use number. The optimal land use configuration can be obtained through Formula (1), and the types of land that need to be changed or transformed can also be identified to reduce overall carbon emissions and improve urban sustainability. The research assumes that the green area of urban green spaces is as follows: forest area accounts for 58%; the proportion of shrub land area is 17%; and the grassland area accounts for 25%. The minimum carbon emission impact coefficient results corresponding to different types of land in the city are shown in Figure 1.
In Figure 1, water bodies and urban green spaces have negative carbon emission coefficients, which means that these areas can absorb carbon dioxide under certain conditions and exert a beneficial influence on mitigating urban carbon emissions. This indicates that urban scheming should prioritize preserving and increasing water bodies and green spaces to effectively absorb carbon dioxide and reduce the overall carbon emissions of the city. Urban green spaces can not only serve as ecological buffer zones, but also enhance residents’ quality of life and mental health. In the design of commercial and public facility land, the plot ratio should be reasonably controlled to promote moderate high-density development and reduce carbon emissions caused by high plot ratios [13]. The optimization goal of maximizing regional gross domestic product helps to fund other goals of sustainable urban development, such as infrastructure construction, public transportation, and the application of green technologies, as expressed in Formula (2) [14].
f 2 : max G D P = i j G i × A r e a i j
f 2 represents the optimization objective function for maximizing regional GDP, and G represents the land GDP coefficient. The GDP generated by each land use type in economic activities can be calculated based on its area and corresponding GDP coefficient, reflecting the contribution of different land use types to the overall economy. The GDP coefficient scheming for different types of land in the city is shown in Figure 2.
In Figure 2, commercial facilities mainly account for 0.9955, with a low plot ratio accounting for 0.2808 and a high plot ratio accounting for 0.7150. The GDP coefficient for transportation land is 0.0045, while the GDP coefficients for other land use are all set to 0. The above GDP coefficient emphasizes the need to comprehensively consider the balance between ecological, economic, and social factors in the process of urban scheming [15]. Developing a reasonable spatial layout strategy can not only effectively promote the maximization of regional GDP, but also facilitate the attainment of enduring development objectives. The specific coefficient between carbon emissions per unit area and GDP is selected to enhance the interpretability and applicability of the model, so as to provide clear and direct guidance for urban scheming and environmental protection policies. This approach enables research to focus on more concrete and practice-oriented development strategies between land use and carbon emissions, and endogenous factors drive the modeling concept of urban sustainable development. The goal of maximizing the compactness of land use can improve the efficiency of land use and reduce the social and environmental costs caused by urban expansion. The function expression is shown in Formula (3) [16].
f 3 : max F C I = F R X
In Formula (3), f 3 represents the function that maximizes the compactness of the land use function. The compactness of land use means a reasonable layout and spatial arrangement between various uses, which can effectively raise the efficiency of land use [17]. F R X represents the compactness of residential areas and other land use functions, usually related to residents’ living needs and functional settings. Its calculation is shown in Formula (4).
F R X = ( j k A r e a i j × A r e a i k c d j k 2 ) / M N
In Formula (4), M means the number of residential land and N means the number of other types of land, which helps evaluate the diversity and distribution of different functional land. c is a constant value, mainly converting the compactness of land use functions into a dimensionless index. d represents the Euclidean distance between two places, measuring the spatial relationship between the two types of land. A shorter distance usually means better functional coordination.

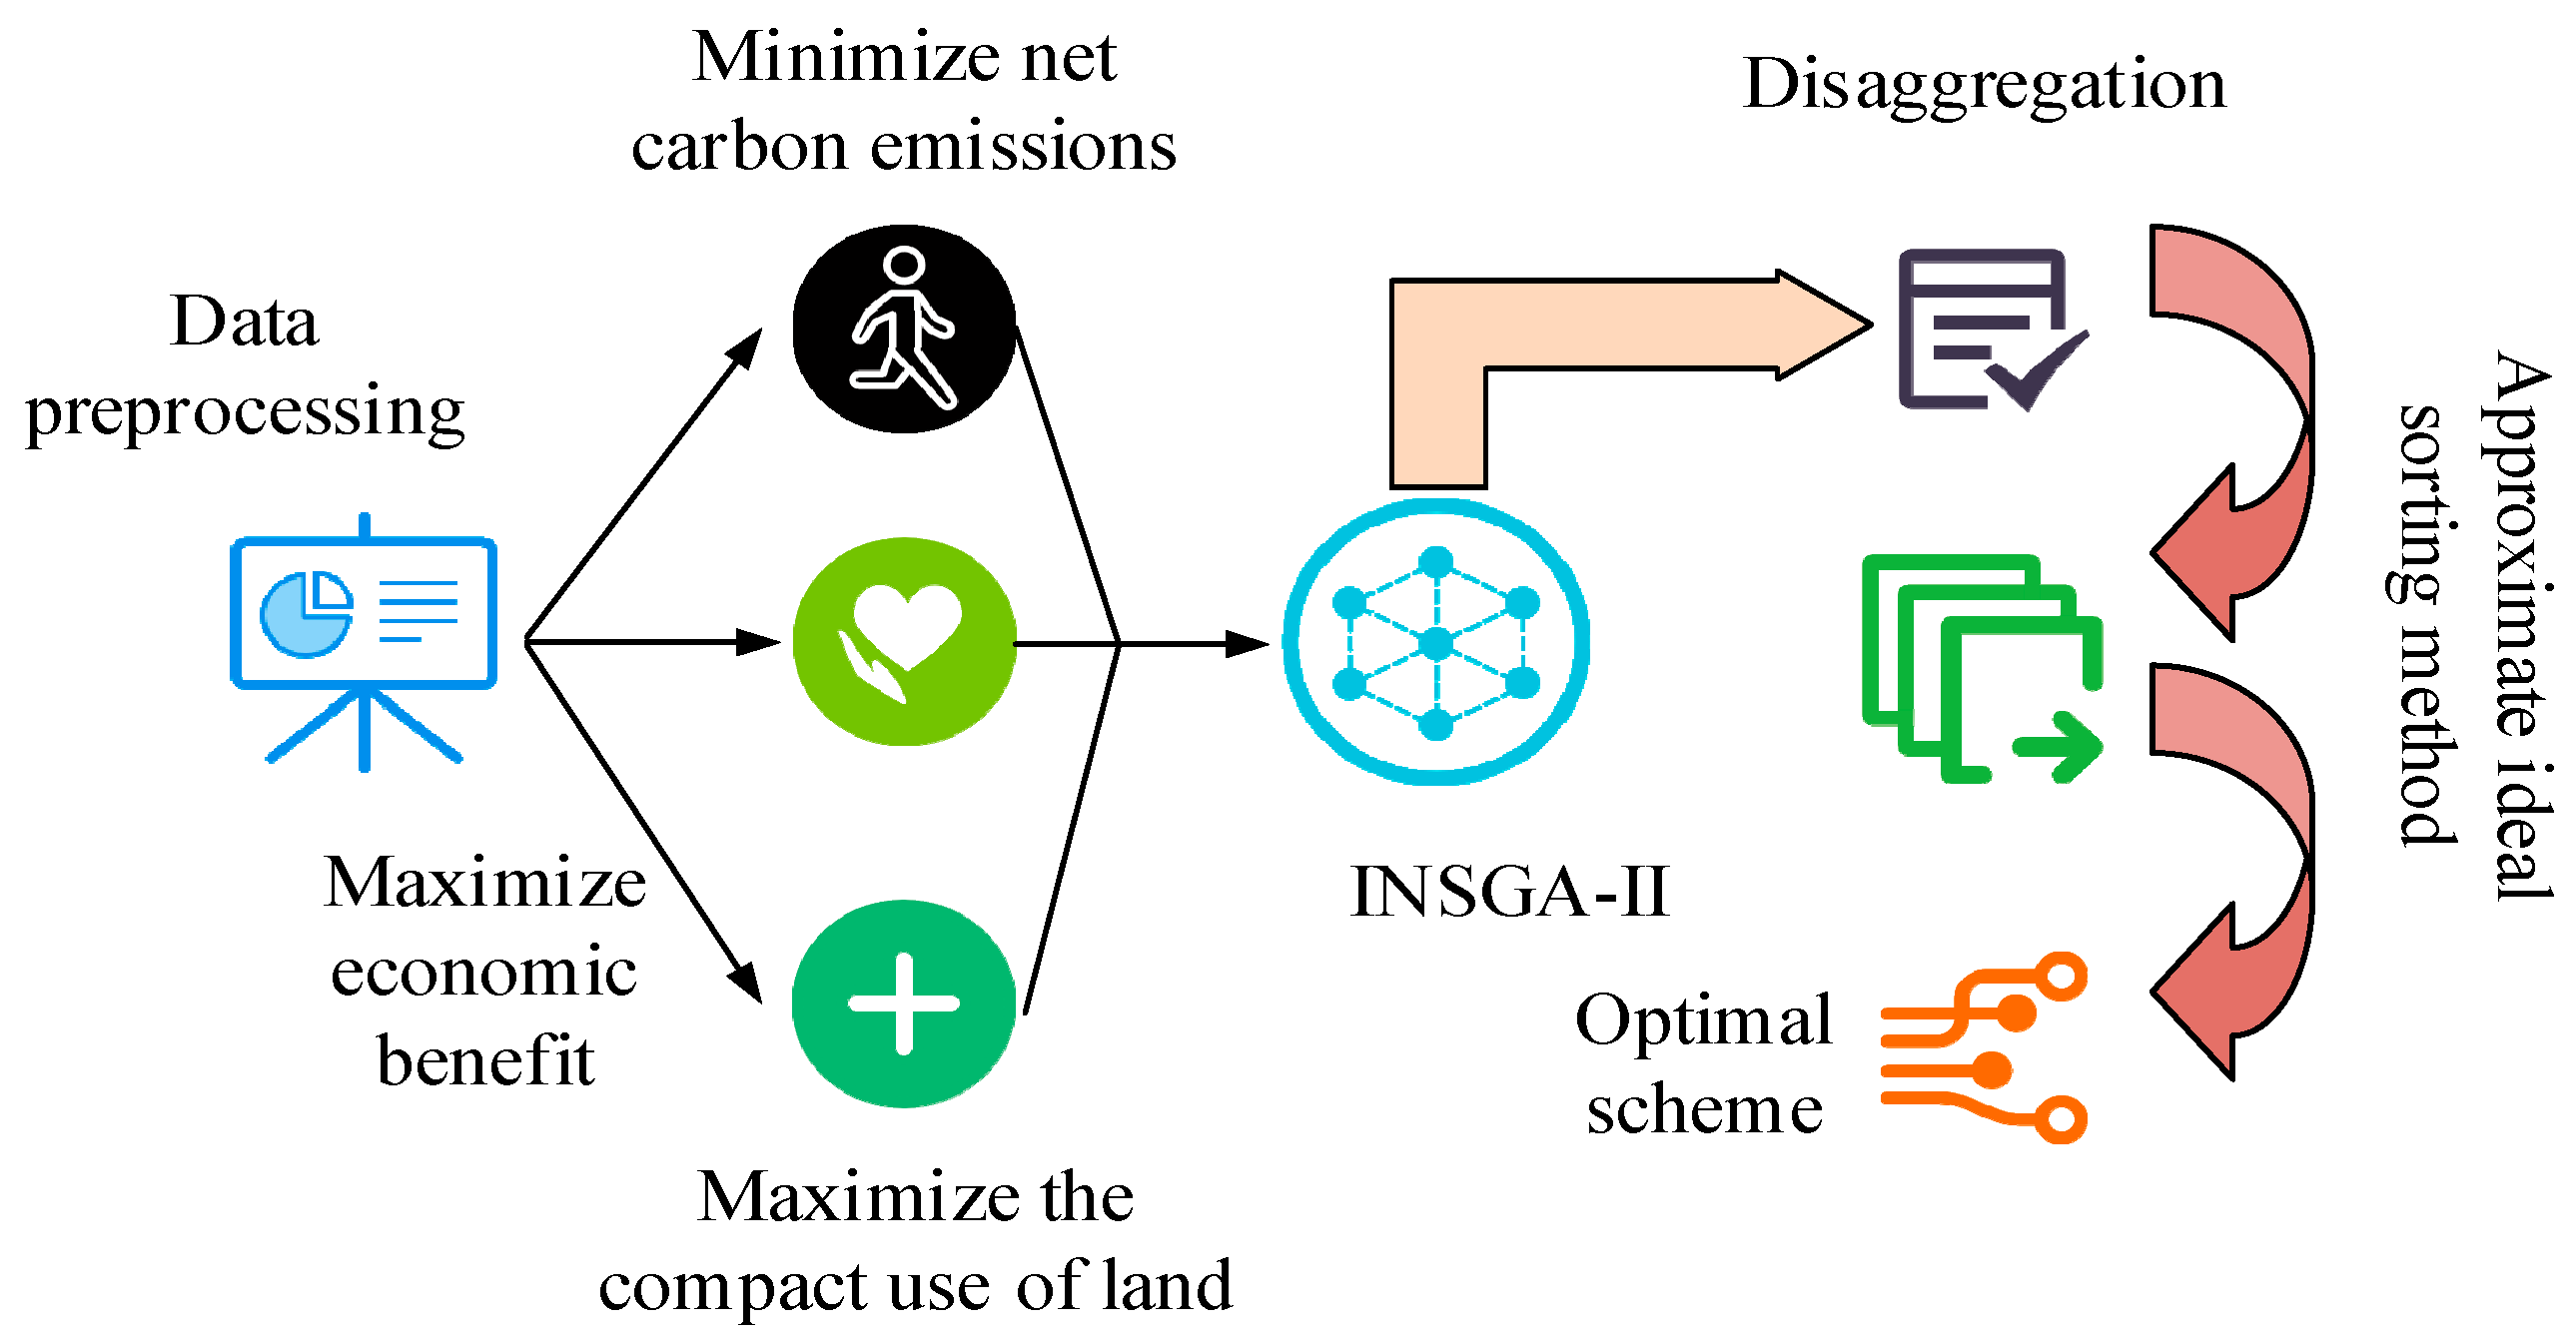
3.2. Multi-Objective Spatial Layout Optimization Based on Improved NSGA-II

The urban spatial layout model constructed in the above research involves multiple conflicting objectives, such as land use efficiency, environmental impact, and economic benefits. To select the optimal-balance value among the above objectives, the NSGA-II algorithm can be used. NSGA-II is an algorithm used to handle multi-objective optimization issues, which can simultaneously handle these objectives and find the Pareto optimal solution set, enabling decision-makers to strike a balance between different objectives [18]. This method maintains population diversity by using fitness, non-dominated sorting and crowding distance. This means that in the optimization process, it not only focuses on the fitness of individuals, but also encourages the exploration of different solutions, thereby increasing the possibility of finding diverse solutions. This is particularly important for spatial utilization decisions in urban design. However, in some cases, NSGA-II may not effectively converge to the Pareto front, especially when dealing with complex problems. This may lead to an unstable quality of the solution and affect the accuracy of the decision. Therefore, to address the above limitations, the study considers combining the approximate ideal solution ranking method with NSGA-II. The study first analyzes the process steps of the NSGA-II algorithm, as represented in Figure 3.
In Figure 3, the NSGA-II algorithm first randomly generates an initial population and calculates the objective function value for each individual in the population. Secondly, non-dominated sorting is performed on the population, dividing individuals into different non-dominated levels. For each non-dominated frontier, the crowding distance of each individual is calculated. Tournament selection combined with non-dominated level and crowding distance are used to select individuals, and new offspring populations are generated through crossover and mutation operations. The parent and child populations are merged to form a new population, and non-dominated sorting and crowding distance calculation are performed on the merged population. Finally, it can be determined whether the termination condition is met, and the final set of non-dominated solutions is output. However, the solution set needs further screening. At this time, the approximate ideal solution sorting method is used to adjust the solution set finally. There are three objectives for optimizing urban space in the study, one of which seeks the minimum solution, while the other two seek the maximum solution. For convenience of calculation, the study normalizes the minimal solution index, as shown in Formula (5).
x ^ i = max ( x i ) x i
In Formula (5), x ^ i represents the minimum value after forward normalization, and x i represents the output value of the objective optimization function. After the normalization process of Formula (5), to eliminate the influence of dimensionality and improve the convergence of the algorithm, it is necessary to standardize the evaluation matrix, as shown in Formula (6).
R = ( r i j ) m n r i j = x i j / ( i n x i j 2 )
In Formula (6), R represents the standardization matrix, x i represents the evaluation index value, r represents the evaluation index value of standardized support, m represents the number of solution schemes for NSGA-II, and n represents the number of evaluation indicators. The weight normalization matrix calculation for the approximate ideal solution ranking method is shown in Formula (7).
Z = ( z i j ) m n z i j = x i j × w j
In Formula (7), Z represents the weight normalization matrix, z represents the solution of each indicator, and w represents the weight coefficient. By using Formula (7), the optimal solution set and the worst solution set can be obtained, as shown in Formula (8).
Z + = ( z j + ) 1 n , z j + = m a x ( z i j ) Z = ( z j ) 1 n , z j = min ( z i j )
In Formula (8), z j + represents the optimal solution set, and z j represents the worst solution set. By calculating the Euclidean distance between solution sets, a metric for evaluating the quality of a solution can be obtained, as shown in Formula (9).
S i = j n ( z i j z j ) 2 j n ( z i j z j ) 2 + j n ( z i j z j + ) 2
In Formula (9), S i represents the optimal indicator, and the larger the value, the closer the researched solution is to the ideal solution. Through the above methods, a city spatial layout optimization model based on improved NSGA-II is constructed. The overall structure of the model is shown in Figure 4.
In Figure 4, the study first takes the current concept of net zero carbon emissions in cities as a guide, obtains vector data and preprocesses them while constraining them with three major optimization objectives. For the problem of solving the objective function, the NSGA-II algorithm is introduced to solve it, and the results obtained are filtered by combining the approximate ideal solution sorting method to ultimately obtain the optimal urban spatial layout optimization. The concrete improvement lies in three aspects, including parameters, performance, and model structure. Among them, the parameter improvement is mainly reflected in the dynamic weight adjustment mechanism. The probability of these operations is dynamically adjusted according to the change of algebra and population diversity in NSGA-II to adapt to the search needs of different stages, thus improving the global searchability and local optimization ability. Performance is reflected in the use of a variety of performance evaluation criteria to evaluate the quality of the final solution, such as HyperVolume, spacing, etc. In terms of model structure, the approximate ideal solution sorting method is introduced into the optimization process as a screening mechanism for the final optimal solution. By post-processing the solution set and combining the approximate ideal solution, an ideal point can be introduced next to the solution set to ensure that the final solution is as close to the ideal state as possible.
The whole operation process of the research framework model is as follows: the initial population is randomly generated, the population size is 100, and each individual represents an urban spatial layout scheme, including the configured land use, density, carbon emission and other information. For each individual, Formulas (1)–(3) are used to calculate three objective functions, namely net carbon emissions, regional GDP, and land use compactness. The individuals are classified into different levels according to the Pareto frontier, and the excellent individuals are assigned higher levels to help screen out the optimal solution set. The crowding distance of each individual is calculated, and the diversity of the population is maintained through crowding distance in the same non-dominant individuals. According to the non-dominant rank and crowding distance, parental individuals are selected for crossover and variation. The crossover rate is set at 0.9 and the variation rate at 0.1 to ensure the gradual evolution of the population. The new population is obtained by merging the parent generation with the newly generated offspring, and then re-calculating the non-dominant ordering and crowding distance.

4. Results

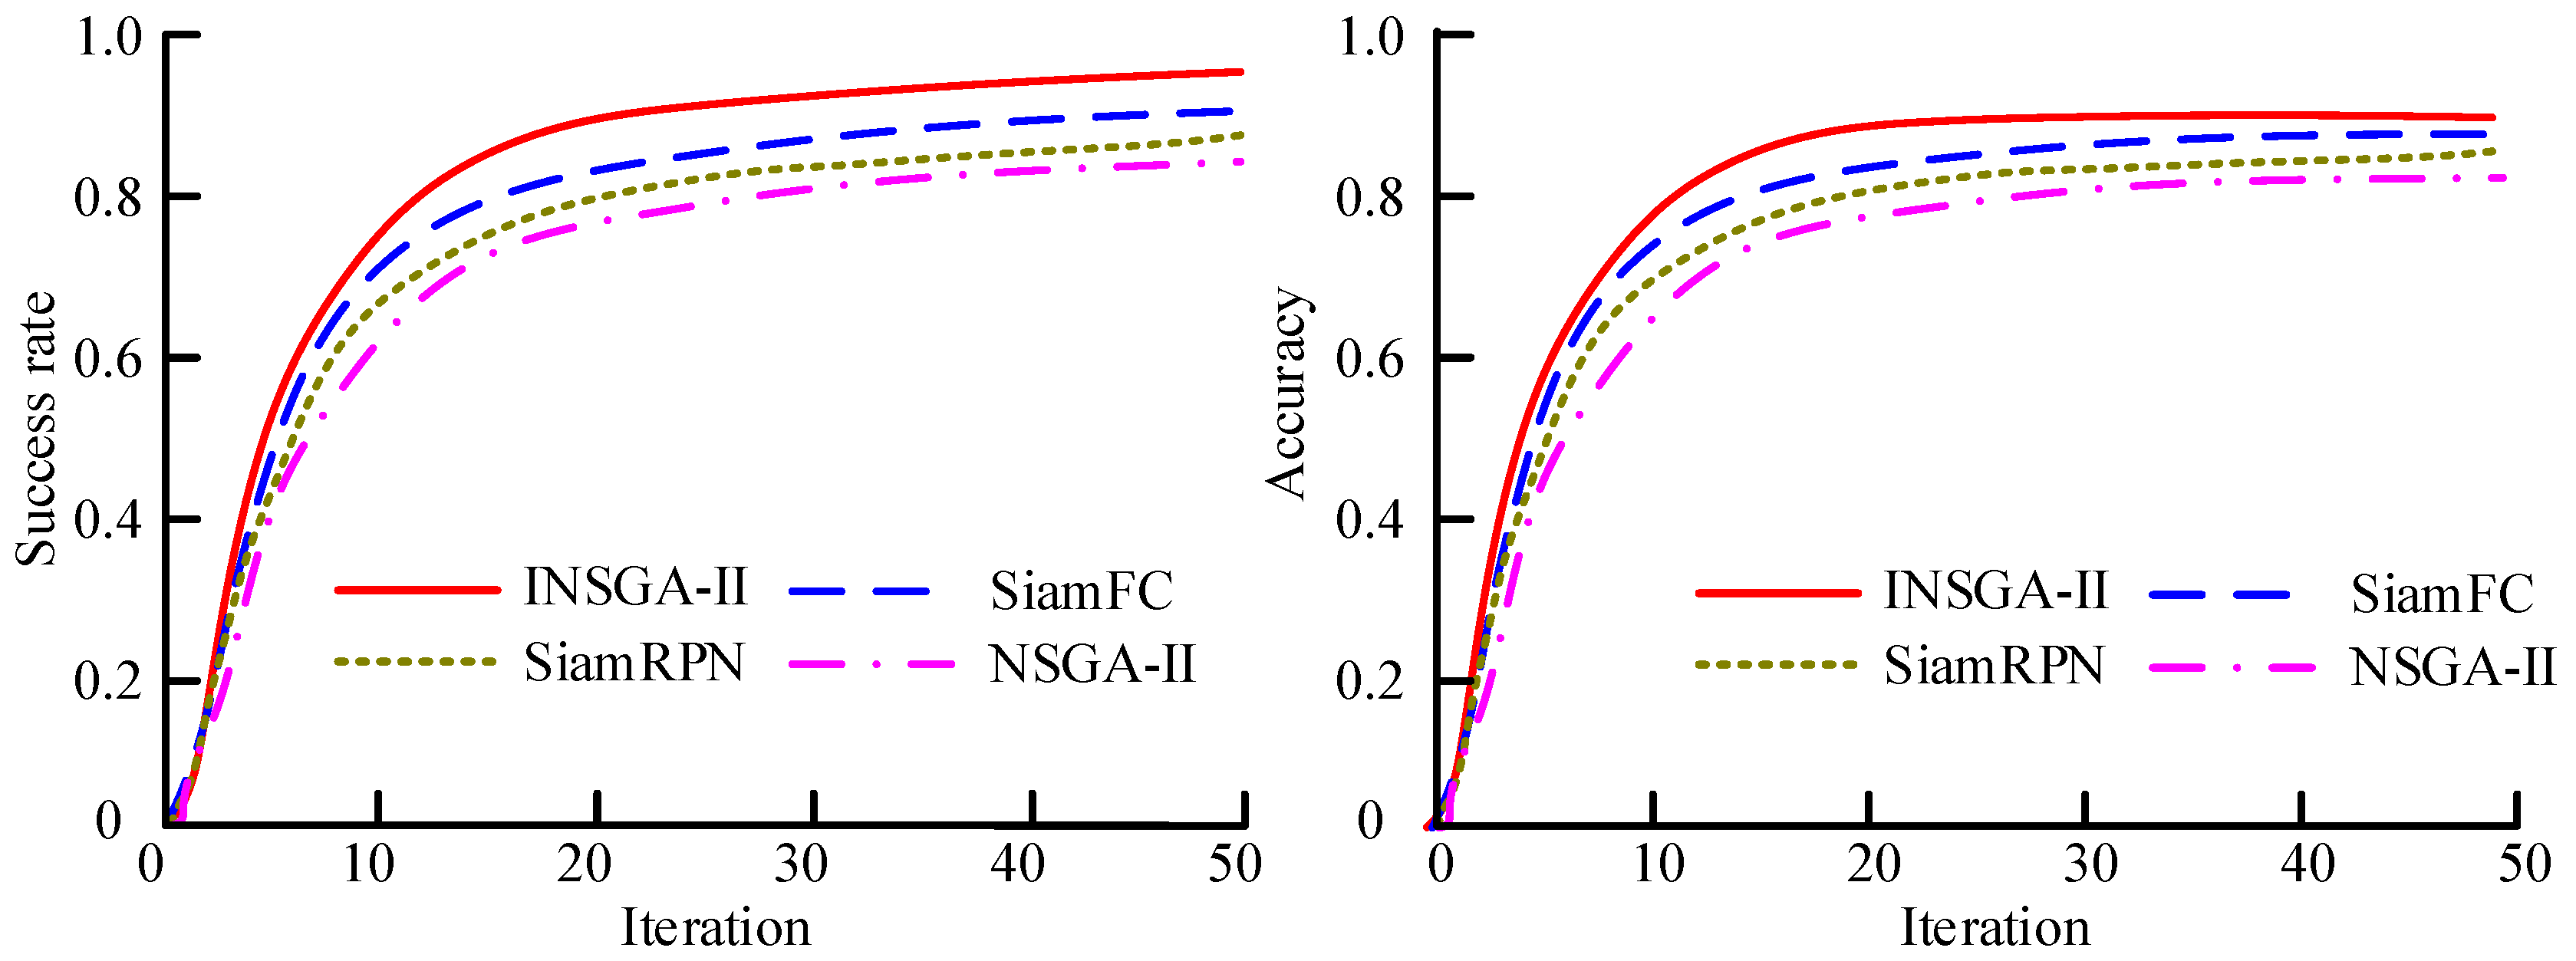
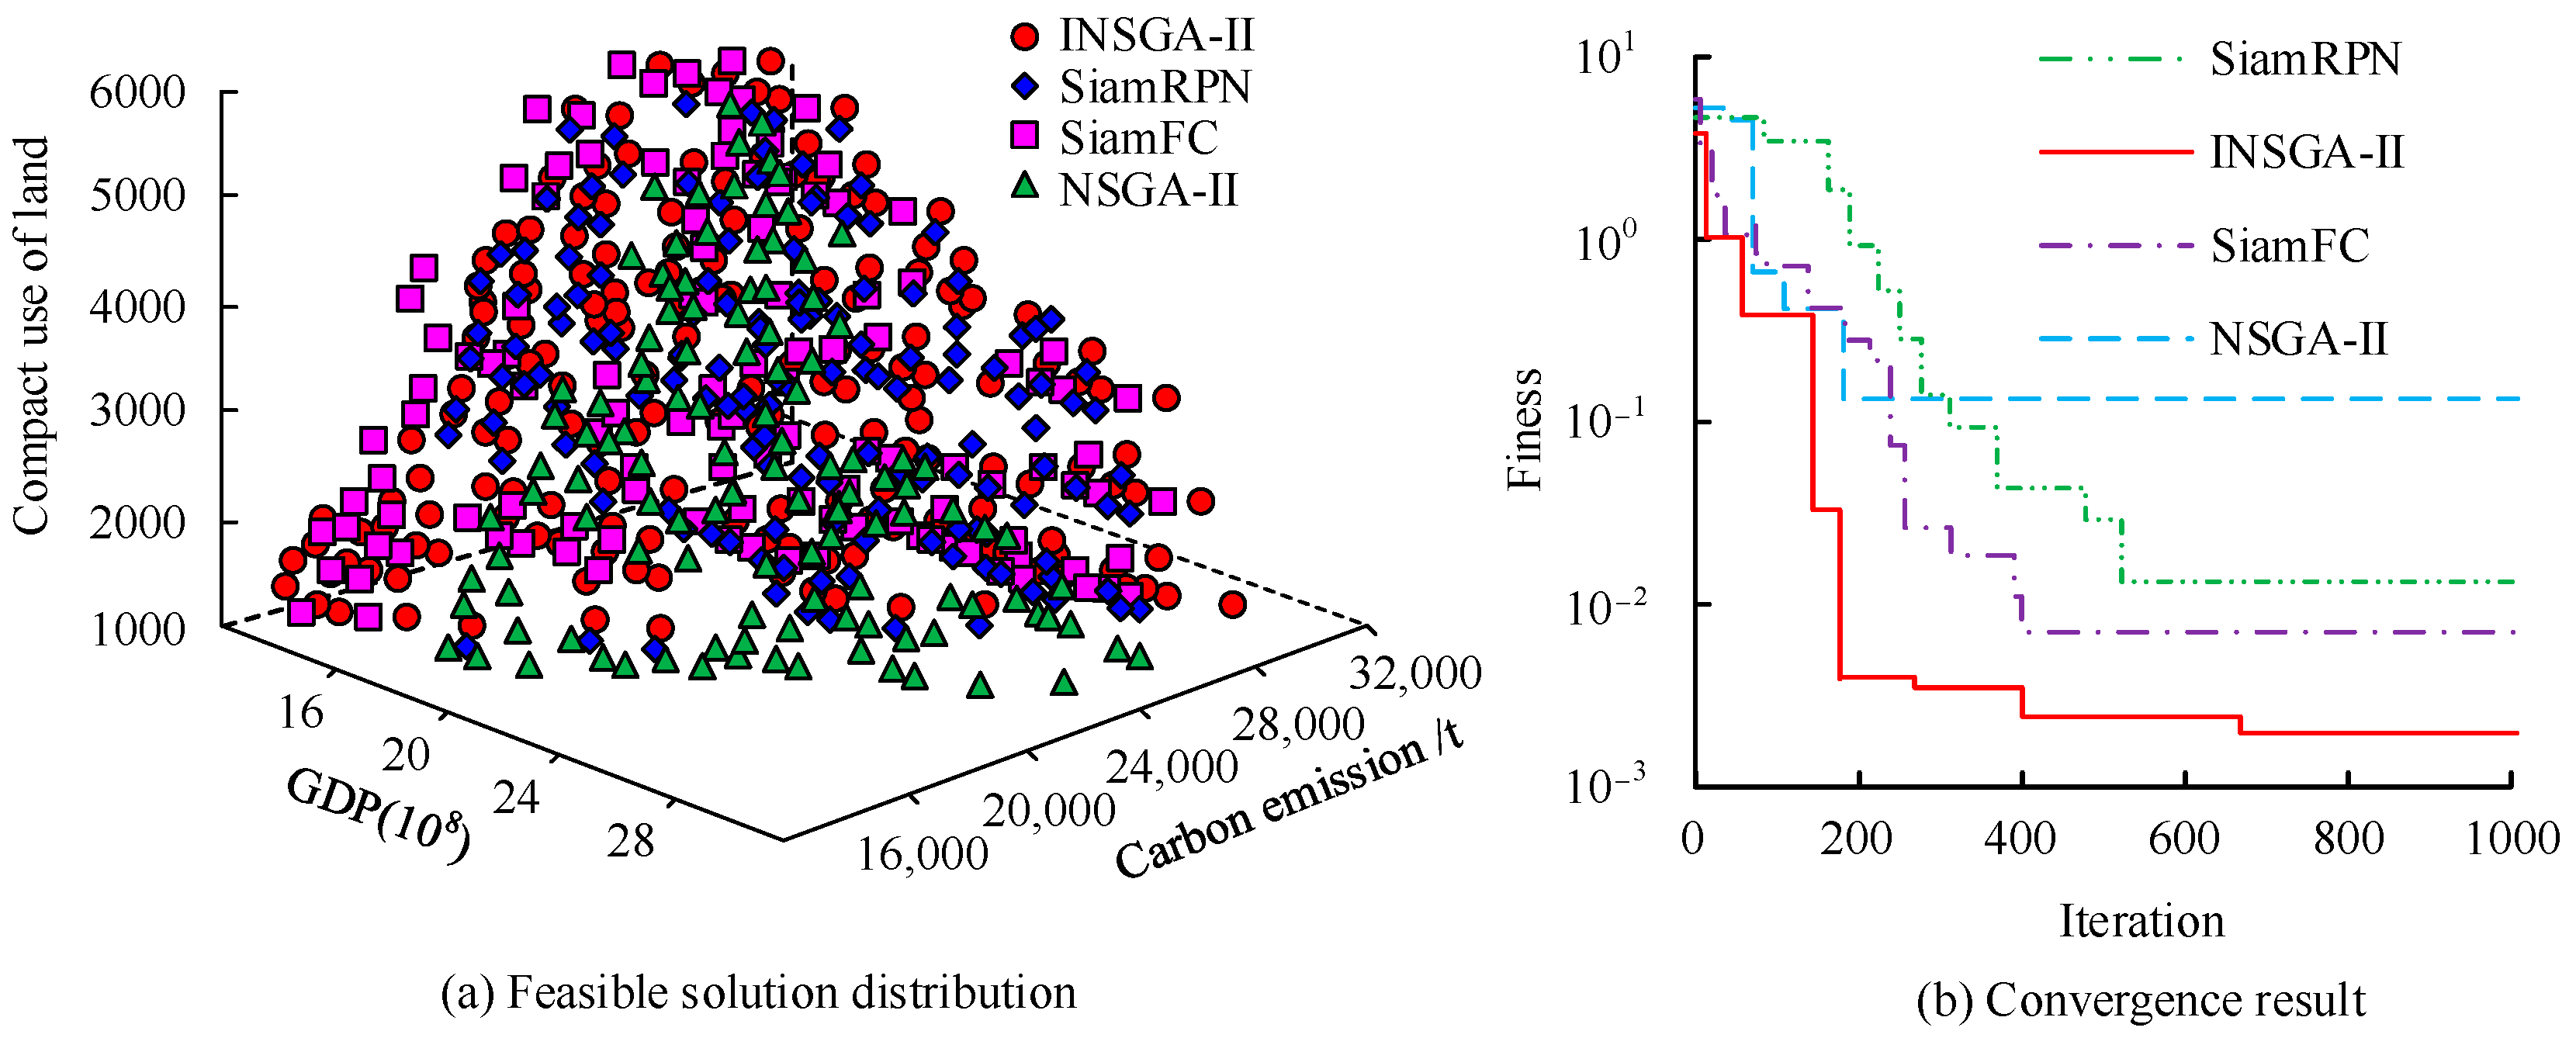
4.1. Performance Verification Based on Improved NSGA-II Algorithm

To test the performance of the proposed algorithm, three testing functions were used to validate it. The testing functions included the Rastrigin function, ZDT1 function, and ZDT2 function, among which the Rastrigin function is a commonly used single-objective optimization testing function, commonly used to test the performance of global optimization algorithms. The ZDT1 function is a bi-objective problem aimed at evaluating the effectiveness of optimization algorithms in balancing constraints and complex objectives, with the optimal solution located at the boundary between the first and second objective functions, forming a curved Pareto front. The ZDT2 function is a three-objective function that is suitable for evaluating the performance of algorithms in complex, multidimensional optimization problems. The Pareto front presents a complex shape, and due to the introduction of complex objective relationships, decision-makers need to weigh their choices among multiple objectives. At the same time, a comparative analysis was conducted using traditional NSGA-II, Siamese Region Proposal Network (SiamRPN), and Siamese Fully Convolutional Network (SiamFC) algorithms [19,20,21]. The solution results of the model in the Rastrigin function and the ZDT1 function are shown in Figure 5.
Figure 5a shows the convergence results of the model in the Rastrigin function, indicating that the proposed INSGA-II algorithm can achieve a solution value of 5.79 × 10⁻²⁰ and has a significant convergence speed at the 100th iteration. The solution value of NSGA-II algorithm is 5.627. The solution value of the SiamRPN algorithm is 4.68 × 10⁻¹; the solution value of the SiamFC algorithm is 7.81 × 10⁻³. Figure 5b shows the solution results of the model in the ZDT1 function. The results show that the coverage rate of the solution values of the research method and the ZDT1 solution values is above 95%, and the distribution is more uniform. The solution distribution of the NSGA-II algorithm is discrete, and the coverage rate is only 87%. The solution of SiamFC is evenly distributed, but the coverage rate is only 90%. The solution coverage of SianmRPN is 92%, but the distribution is obviously discrete. The results show that the INSGA-II algorithm not only improves the convergence speed but also deals better with the conflicts between multiple objectives by integrating the approximate ideal solution sorting method, ensuring the diversity and uniformity of optimal solutions. By dynamically adjusting the weights, INSGA-II is able to optimize the relative importance of targets in real time based on the current state of the population. This makes the algorithm able to effectively cope with dynamic changes in complex urban scheming environments and enhances the applicability of the model, which is better than some static weight methods. NSGA-II shows better convergence speed and uniformity on Rastrigin and ZDT1 functions and has stronger practical application potential. The solution results of the model in the ZDT2 function are shown in Figure 6.
In Figure 6, the study used the HyperVolume (HV) index to evaluate the solution values of the model. Figure 6a shows the solution set distribution of the INSGA-II algorithm, with an average HV value of 5.42 × 10⁻¹, which is about 18.6% higher than the traditional NSGA-II algorithm. Compared to the SiamRPN algorithm and the SiamFC algorithm, it is 9.6% and 9.0% higher, respectively. The results indicate that the proposed method can find solutions closer to the Pareto front and better balance various objectives in the optimization process. To further validate the solving ability of the model, the study conducted validation using the TrackingNet dataset. TrackingNet is a dataset used to assist in solving multi-objective problems, with the main evaluation metrics including success rate and accuracy. The performance results of the proposed model in the TrackingNet dataset are shown in Figure 7.
Figure 7a shows the success rate of the algorithm on the TrackingNet dataset. The results show that the success rate of the INSGA-II algorithm is 0.937, which is 0.041, 0.062, and 0.118 higher than that of SiamRPN, SiamFC, and NSGA-II, respectively. Figure 7b shows the solution accuracy of the algorithm on the TrackingNet dataset. The results show that the solution accuracy of INSGA-II reaches 0.904; the accuracy of SiamRPN is 0.871, the accuracy of SiamFC is 0.858, and the accuracy of NSGA-II is 0.813. The results of solving the repetition rate on the TrackingNet dataset are shown in Figure 8.
The results in Figure 8 indicate that the proposed INSGA-II algorithm had the minimum solution repetition rate, with an average repetition rate of around 0.20. The NSGA-II solution had significant fluctuations in repetition rate, with the highest repetition rate being 0.81. The average repetition rates of SiamRPN and SiamFC were 0.43 and 0.46, respectively. The results show that the improved algorithm can effectively avoid overfitting or bias in handling multi-target tracking and enhance the applicability of the model; its solution results were more consistent in different scenarios.

4.2. Optimization Analysis of Urban Spatial Layout Based on Improved NSGA-II Algorithm

The algorithm was specifically applied to urban spatial layout optimization for validation, and experiments analyzed and compared land optimization schemes under different scenarios. At the same time, taking H city as an example, remote sensing images of the city were obtained from the Google Earth Engine (GEE) platform for the land use classification and calculation of the normalized vegetation index. The data source of building electricity consumption was the H City Urban and Rural Development Committee; the administrative boundary data came from the Bureau of Planning and Natural Resources of H City, including city boundary data, city district (county) boundary data and street boundary data. Land use data also came from the Bureau of Planning and Natural Resources of H City; that is, vector data of land use in H city. The comparison results of the distribution and convergence of feasible solution sets for different models under three objective function constraints are shown in Figure 9.
Figure 9a shows the feasible solution distribution of the urban spatial layout model, and the results show that the INSGA-II algorithm exhibits the best performance in the distribution of feasible solution sets. Firstly, the feasible solution set generated by the INSGA-II algorithm covers a wide range of directions of optimization objectives, demonstrating its ability to effectively balance the relationships between various objectives in multi-objective optimization tasks. This means that it can provide high-quality solutions in terms of net carbon emissions, economic benefits, and land use compactness. Figure 9b shows the convergence of the model, and the results show that the INSGA-II algorithm quickly approaches the target optimal solution, indicating that the algorithm can effectively explore the solution space in the initial stage and find high-quality feasible solutions in a short iteration process. Four layout optimization schemes were selected using INSGA-II, as shown in Table 1.
In Table 1, Scheme A emphasizes the importance of reducing carbon emissions and is suitable for scenarios that pursue environmental benefits. Therefore, the weight coefficient of carbon emissions was set at 0.98. Scheme B focuses on economic growth and is suitable for cities where regional economic development is increasingly becoming a priority, so the GDP coefficient was set at 0.98. Scheme C focuses on improving land use efficiency and is suitable for areas with scarce land resources, so the land use function coefficient was set at 0.98. Scheme D is a practical scheme to find a balance among the three, which is suitable for the occasions of multi-interest balance, and the coefficients of the three were set at 0.33. Scheme E, F and G were all slightly adjusted on the basis of scheme D and were used to verify the sensitivity analysis. In different schemes, the result values of the objective function and the sensitivity analysis results are shown in Table 2.
The results in Table 2 show that Scheme D has a carbon emission of 19,821.80 tons, which is similar to Scheme C and better than Scheme B, although not as good as Scheme A. In terms of economic benefits, the regional GDP of Scheme D is 2.342367 billion, second only to Scheme B’s 2.827248 billion, demonstrating good economic potential. In terms of land resource utilization, although Scheme C has the best land function compactness performance at 6042.75, Scheme D’s 5800.93 still reflects its rationality of land resources in urban spatial use and can promote sustainable land management. The results indicate that Scheme D demonstrates its unique advantages in multi-objective optimization based on balanced target weights, reasonable economic benefits, good carbon emission control, and efficient land use. In the sensitivity analysis, the carbon emissions of Schemes E, F and G increase slightly (18,524.87 T to 21,173.14 T), indicating that the carbon emissions increase with the weight adjustment, especially the increase in land ownership, but remain lower than those of Scheme B. The economic benefits of Schemes E and F increase somewhat (2.214167 billion and 2.447632 billion), indicating that the slight adjustment of economic development weight can promote a degree of economic growth, but it is still lower than that of Scheme B, suggesting that the rationality of other goals should be maintained while pursuing economic growth. The compactedness of Schemes F and G remains at a high level (6016.78 and 5875.21), showing that intensive land use is still an achievable goal under different weight configurations, which provides flexible options for land management. The results show that the weight setting is highly sensitive to the objective function, indicating that the objective function plays an important role in urban layout optimization. The comparison of land use structure under different schemes is shown in Figure 10.
The results in Figure 10 show that Scheme D has the highest proportion of low plot ratios for commercial and public facility land, at 20.62%. This indicates that the scheme fully considers the needs of urban residents, provided a good environment for commercial activities, and enhances the community’s service capacity, thereby improving the quality of life of residents. The urban green space ratio of Scheme A is 0.2312, which is higher than that of other schemes. The proportion of urban green spaces in Schemes B, C, and D is relatively low, at 0.1501, 0.1904, and 0.1477, respectively. Although Scheme D has a slightly lower proportion of urban green space compared to Scheme A, the overall resource allocation is more reasonable and can effectively support the city’s multi-functionality and sustainable development. By balancing carbon emissions, economic development, and land use, Scheme D demonstrates its potential and effectiveness in sustainable urban development, providing a reliable strategic basis for future urban layout optimization.

5. Discussion

The research mainly focused on optimizing the urban spatial layout of INSGA-II to achieve multiple goals such as net zero carbon emissions, maximizing regional GDP, and maximizing land use compactness. In the results of convergence speed and solution set quality, the INSGA-II algorithm reached the solution value of 5.79 × 10⁻²⁰ after 100 iterations. In comparison, the traditional NSGA-II reached the solution value of 5.627, and the other two algorithms, SiamRPN and SiamFC, reached the solution values of 4.68 × 10⁻¹ and 7.81 × 10⁻³, respectively. By quantitative analysis, INSGA-II had a HyperVolume (HV) value of 0.54, compared to the standard NSGA-II’s HV value of 0.45, SiamRPN’s HV value of 0.38, and SiamFC’s value of 0.35. These data show a significant improvement in the convergence speed of INSGA-II, which was able to find a near-global optimal solution faster, proving the optimization ability of the method. At the same time, it had obvious advantages in the quality and diversity of multi-objective optimization solutions. Grounded on that, it could cover the solution space more comprehensively and provide more information for decision-making. In the optimization results, Scheme D achieved a net carbon emission of 19,821.80 tons, demonstrating good control effectiveness compared to other schemes. The advantage of this result not only came from the optimization ability of the INSGA-II algorithm, but also from the rationality of the model structure, which set a clear relationship between carbon emissions, GDP, and land use compactness, allowing decision-makers to effectively weigh different goals. Compared to this, the urban energy consumption optimization method based on the improved genetic algorithm proposed by Torkan R et al., although extensively discussed in theory, lacked effective multi-objective balancing mechanisms in practical applications, resulting in poor applicability and feasibility of its final results [22]. The regional gross domestic product of Scheme D was 2.342 billion, demonstrating good economic potential. The index of 5791.93 was achieved in terms of compact land use, demonstrating the efficient utilization of urban space. The achievement of this result lay in the ability of the INSGA-II algorithm to simultaneously handle the nonlinear relationship between constraints and objectives. By reasonably scheming the GDP coefficients of different land use types, the research could reduce carbon emissions while ensuring economic benefits. In contrast, Sahoo S K et al. applied multi-objective models in urban development to improve urban economic output while protecting the ecological environment. However, Sahoo’s research failed to effectively integrate the weights of priorities, resulting in insufficient exploration of the solution space and thus failing to achieve an optimal economic and environmental balance [23].
The study compared four schemes. Scheme A emphasized the reduction of carbon emissions and gave priority to the control of carbon emissions in pursuit of environmental benefits. Its advantages are that it can significantly reduce the overall carbon footprint of a city, improve air quality and promote ecological restoration. However, it may lead to a slowdown in regional GDP growth, affecting urban economic development and residents’ living standards. Scheme B took the maximization of regional GDP as the primary goal, was suitable for concentrated development areas, and was committed to promoting economic growth and improving residents’ living standards. Its advantages lie in promoting urban economic development and attracting investment and labor. However, it may lead to environmental deterioration and resource depletion, and ecological sustainability is greatly reduced. Scheme C emphasized the improvement of compact land use, which was especially suitable for large cities with scarce land resources and aimed to improve land use efficiency and build green cities. Its advantages lie in improving land resource utilization and ecological benefits, but too-intensive land use may lead to cramped living space, reduce residents’ quality of life, increase traffic congestion, and cause a heavy load on public facilities. Scheme D comprehensively considered the three goals of carbon emission, regional GDP and compact land use. Its advantages are that it can control carbon emission and optimize land use while promoting economic development, providing a comprehensive solution for sustainable urban development. As for the disadvantages, the needs of stakeholders may conflict in practice, but in certain circumstances, the optimal improvement may not be achieved. Therefore, the results show that the research method has great advantages in the application of solving efficiency and quality. This highly efficient performance makes it possible to obtain high-quality solutions more quickly in practical applications and adapt to rapidly changing urban environments. INSGA-II maintained the uniformity of knowledge among multiple targets by using the approximate ideal solution sorting method. This enables a wide range of alternative solutions to support decision-making. Through effective optimization, the research method can achieve a good balance among economic development, carbon emission reduction and land use.

6. Conclusions

Optimizing the spatial layout of urban renewal is an important part of achieving sustainable development, especially in addressing global climate change and enhancing the living standard for urban residents, which has profound significance. The study adopted an improved NSGA-II algorithm and conducted in-depth research by constructing a multi-objective spatial layout model. The outcomes denote that the proposed model has good optimization performance in multi-objective optimization, which means that it can find solutions closer to the Pareto front in complex urban scheming to balance the relationship between environmental impact and economic development. Although the research achieved certain results, there are still some shortcomings. The significance of this research is that it can not only optimize carbon emissions, but also take into account economic and land use benefits, providing a new perspective for future urban scheming. It provides city policymakers with new options to control carbon emissions and help them achieve environmental sustainability while driving economic development. The main contribution of the research is to combine the approximate ideal solution sorting method with NSGA-II, which improves the expression ability and efficiency of traditional multi-objective optimization algorithms in solving complex problems. An optimization framework for urban spatial layout guided by net zero carbon has been built, integrating economic, environmental and social needs. There are still shortcomings in verifying the applicability of the model under different urban characteristics and policy backgrounds. The study uses a relatively simplified model, focusing on three targets: carbon emissions, regional GDP, and land use compactness. While this makes research easy to understand and implement, it fails to adequately consider the many interacting and complex factors in urban scheming, such as transportation networks, infrastructure constraints, land use regulations, and the diverse needs of society. The validity of the model largely depends on the accuracy and completeness of the input data. Since the data involved in urban renewal projects may not be comprehensive enough or may have timeliness problems, the uncertainty of or errors in the data may directly affect the final optimization results. Future studies can build a more comprehensive urban spatial layout optimization model, including more variables such as transportation network, infrastructure, social equity and accessibility. This can improve the scientific decision-making by establishing a multi-level and multidimensional optimization framework to more truly reflect the complexity of urban renewal. With advanced data mining and machine learning technologies, future research can achieve deep analysis of big data by monitoring urban dynamics in real time, collecting, analyzing and updating relevant data, improving model parameters and optimizing targets to improve the adaptability and accuracy of the model.

Author Contributions

Methodology, X.H.; Writing—original draft, X.H.; Validation, B.X.; Data analysis, B.X. All authors have read and agreed to the published version of the manuscript.

Funding

This research received no external funding.

Data Availability Statement

All data, models, and code generated or used during the study appear in the submitted article.

Conflicts of Interest

The authors declare no conflict of interest.

References

  1. Wang, Y. Spatial–temporal evolution of “Production-Living-Ecologica” function and layout optimization Strategy in China: A case study of Liaoning Province, China. Environ. Sci. Pollut. Res. 2023, 30, 10683–10696. [Google Scholar] [CrossRef] [PubMed]
  2. Zhang, Y.; Tan, J. A data-driven approach of layout evaluation for electric vehicle charging infrastructure using agent-based simulation and GIS. Simul. J. Soc. Comput. Simul. 2024, 100, 299–319. [Google Scholar] [CrossRef]
  3. Warmuth, J.; D’Acunto, P.; Fivet, C. Computational Conceptual Design-Typological Exploration of Spatial Truss Systems Through Optimization. J. Int. Assoc. Shell Spat. Struct. 2023, 64, 289–297. [Google Scholar] [CrossRef]
  4. Li, X.; Wang, L. Does Administrative Division Adjustment promote low-carbon city development? Empirical evidence from the “Revoke County to Urban District” in China. Environ. Sci. Pollut. Res. 2022, 30, 11542–11561. [Google Scholar] [CrossRef]
  5. Wang, Z.; Han, Q.; De Vries, B. Land use spatial optimization using accessibility maps to integrate land use and transport in urban areas. Appl. Spat. Anal. Policy 2022, 15, 1193–1217. [Google Scholar] [CrossRef]
  6. Fu, J.; Huang, X.; Tong, L. Urban layout optimization in a city network under an extended quadratic assignment problem framework. Transp. A Transp. Sci. 2022, 18, 221–247. [Google Scholar] [CrossRef]
  7. Zhu, W.; Jiang, Z.; Cen, L.; Wu, H. Evaluation, simulation, and optimization of land use spatial patterns for high-quality development: A case study of Zhengzhou city, China. J. Geogr. Sci. 2023, 33, 266–288. [Google Scholar] [CrossRef]
  8. Enomoto, S.; Eom, S.; Suzuki, T. Modeling Optimal Configuration of Urban Centers and Public Transport Routes that Correspond to Population Distribution. J. City Scheming Inst. Jpn. 2022, 57, 337–344. [Google Scholar] [CrossRef]
  9. Luo, H.; Li, Y.; Gao, X.; Meng, X.; Yang, X.; Yan, J. Carbon emission prediction model of prefecture-level administrative region: A land-use-based case study of Xi’an city, China. Appl. Energy 2023, 348, 121488. [Google Scholar] [CrossRef]
  10. Zhao, Q.; Yu, K.; Geng, J.; Lin, J.; Ai, J.; Liu, J. Spatiotemporal Evolution of Urban Heat Islands and Optimization of Spatial Network Construction in the Central Urban Area of Fuzhou City, China. Chin. Geogr. Sci. 2024, 34, 917–930. [Google Scholar] [CrossRef]
  11. Kwon, S.H.; Jung, D. Multiperiod Optimization Framework for Urban Drainage System scheming: A Scenario-Based Approach. J. Water Resour. Scheming Manag. 2024, 150, 04023080. [Google Scholar]
  12. Perdana, S.; Vielle, M. Carbon border adjustment mechanism in the transition to net-zero emissions: Collective implementation and distributional impacts. Environ. Econ. Policy Stud. 2023, 25, 299–329. [Google Scholar] [CrossRef]
  13. Bhopal, A.; Bre, K.; Norheim, O.F. How do we decarbonise fairly? Emissions, inequities and the implications for net zero healthcare. J. R. Soc. Med. 2022, 115, 337–340. [Google Scholar] [CrossRef] [PubMed]
  14. Huang, A.; Wang, Z.; Zhang, Z.; Mingjie, L.I.; Song, Y. Capacity-matching model of landside multiple transport modes for large airports considering the impact of carbon emissions. J. Tsinghua Univ. Sci. Technol. 2023, 63, 1729–1740. [Google Scholar]
  15. Dallmeyer, S.; Breuer, C. The introduction of a minimum wage in Germany and the effects on physical activity participation. Int. J. Health Econ. Manag. 2024, 24, 211–229. [Google Scholar] [CrossRef]
  16. Rawat, S.; Kumar, S. Mechanical performance and thermal behavior assessment of de-oiled microalgae-blended coal composites using statistical and ANN modeling. Biomass Convers. Biorefin. 2024, 14, 19793–19814. [Google Scholar] [CrossRef]
  17. Al-Ghussain, L.; Hassan, M.A.; Hamed, A. Modeling and techno-economic optimization of overhead panels and reflectors in near-wall mounted PV systems. Sol. Energy 2023, 246, 624–641. [Google Scholar] [CrossRef]
  18. Wang, Y.; Chen, J.; Qin, H.; Chen, K.; Li, Z.; Chen, Y.; Li, J.; Hu, T.; Chen, S.; Qiao, Z.; et al. Stress-assisted design of stiffened graphene electrode structure toward compact energy storage. J. Energy Chem. 2022, 71, 478–487. [Google Scholar] [CrossRef]
  19. Ding, C.; Ding, Y.; Li, Y.J. Structural Optimization Design of Electromagnetic Repulsion Mechanism Based on BP Neural Network and NSGA-II. IEEJ Trans. Electr. Electron. Eng. 2023, 18, 1914–1922. [Google Scholar] [CrossRef]
  20. Yuan, Q.; Shi, H.; Xuan, A.T.Y.; Gao, M.; Xu, Q.; Wang, J. Enhanced target tracking algorithm for autonomous driving based on visible and infrared image fusion. J. Intell. Connect. Veh. 2023, 6, 237–249. [Google Scholar] [CrossRef]
  21. Fu, Y.; Fei, C.; Wei, J.; Li, Y. Collaborative Blind Denoising of Similar Patch Group Based on Fully Convolutional Siamese Network. J. Comput.-Aided Des. Comput. Graph. 2022, 34, 1293–1301. [Google Scholar]
  22. Torkan, R.; Ilinca, A.; Ghorbanzadeh, M. A genetic algorithm optimization approach for smart energy management of microgrids. Renew. Energy 2022, 197, 852–863. [Google Scholar] [CrossRef]
  23. Sahoo, S.K.; Goswami, S.S. A comprehensive review of multiple criteria decision-making (MCDM) Methods: Advancements, applications, and future directions. Decis. Mak. Adv. 2023, 1, 25–48. [Google Scholar] [CrossRef]
Figure 1. Minimum carbon emission impact coefficient of land.
Buildings 15 00094 g001
Figure 2. GDP coefficients of different land types in cities.
Buildings 15 00094 g002
Figure 3. Schematic diagram of NSGA-II algorithm flow.
Buildings 15 00094 g003
Figure 4. Structure of urban spatial layout optimization model based on improved NSGA-II.
Buildings 15 00094 g004
Figure 5. The solution values of the model in Rastrigin function and ZDT1 function.
Buildings 15 00094 g005
Figure 6. The solution value of the model in the ZDT2 function.
Buildings 15 00094 g006
Figure 7. Performance results of different models on the TrackingNet dataset.
Buildings 15 00094 g007
Figure 8. Results of solving the repetition rate of the TrackingNet dataset.
Buildings 15 00094 g008
Figure 9. Feasible solution and convergence results of the model in urban spatial layout.
Buildings 15 00094 g009
Figure 10. Comparison of land use structures under different schemes.
Buildings 15 00094 g010
Table 1. Optimization scheme for urban spatial layout with different target weights.
Spatial Layout Optimization SchemeF1 WeightF2 WeightF3 Weight
Carbon constraint priority (A)0.980.010.01
Priority programme for economic development (B)0.010.980.01
Compact priority solution (C)0.010.010.98
Comprehensive optimal scheme (D)0.330.330.33
Sensitivity analysis weight adjustment (E)0.400.350.25
Sensitivity analysis weight adjustment (F)0.330.200.47
Sensitivity analysis weight adjustment (G)0.250.250.50
Table 2. Comparison of results of objective function values and sensitivity analysis.
SchemeNet Carbon Emissions/tGross Local Product/108Compact Use of Land
A13,537.6414.294212343.78
B23,571.2428.272483854.91
C18,475.0020.179536042.75
D19,821.8023.423675791.93
E18,524.8722.141675517.56
F21,173.1424.476326016.78
G19,563.2223.841235875.21
Disclaimer/Publisher’s Note: The statements, opinions and data contained in all publications are solely those of the individual author(s) and contributor(s) and not of MDPI and/or the editor(s). MDPI and/or the editor(s) disclaim responsibility for any injury to people or property resulting from any ideas, methods, instructions or products referred to in the content.

